Metabolic, immune, and gut microbial signals mount a ... · Metabolic, immune, and gut microbial...
56
1 Metabolic, immune, and gut microbial signals mount a systems response to Leishmania major infection Sabrina D. Lamour † , Kirill A. Veselkov † , Joram M. Posma † , Emilie Giraud ‡ , Matthew E. Rogers § , Simon Croft ‡ , Julian R. Marchesi #║ , Elaine Holmes † , Karin Seifert ‡ , and Jasmina Saric † * † Division of Computational and Systems Medicine, Department of Surgery and Cancer, Imperial College London, London, SW7 2AZ, UK ‡ Department of Immunology and Infection, London School of Hygiene & Tropical Medicine, London, WC1E 7HT, UK § Department of Disease Control, London School of Hygiene & Tropical Medicine, London, WC1E 7HT, UK # Cardiff School of Biosciences, Division of Microbiology, Cardiff University, Cardiff, CF10 3AT, UK ║ Centre for Digestive and Gut Health, Imperial College London, London, SW7 2AZ, UK * Correspondence should be addressed to: Dr Jasmina Saric, Division of Computational and Systems Medicine, Department of Surgery and Cancer, Imperial College London, Sir Alexander Fleming Building, South Kensington, London SW7 2AZ, United Kingdom. Tel.: +44 20 7594-3899; E- mail:[email protected]
-
Upload
trinhkhanh -
Category
Documents
-
view
219 -
download
1
Transcript of Metabolic, immune, and gut microbial signals mount a ... · Metabolic, immune, and gut microbial...

1
Metabolic, immune, and gut microbial signals mount a
systems response to Leishmania major infection
Sabrina D. Lamour†, Kirill A. Veselkov†, Joram M. Posma†, Emilie Giraud‡, Matthew E. Rogers§,
Simon Croft‡, Julian R. Marchesi#║, Elaine Holmes†, Karin Seifert‡, and Jasmina Saric†*
† Division of Computational and Systems Medicine, Department of Surgery and Cancer, Imperial
College London, London, SW7 2AZ, UK
‡ Department of Immunology and Infection, London School of Hygiene & Tropical Medicine, London,
WC1E 7HT, UK
§ Department of Disease Control, London School of Hygiene & Tropical Medicine, London, WC1E
7HT, UK
# Cardiff School of Biosciences, Division of Microbiology, Cardiff University, Cardiff, CF10 3AT, UK
║ Centre for Digestive and Gut Health, Imperial College London, London, SW7 2AZ, UK
* Correspondence should be addressed to: Dr Jasmina Saric, Division of Computational and Systems
Medicine, Department of Surgery and Cancer, Imperial College London, Sir Alexander Fleming
Building, South Kensington, London SW7 2AZ, United Kingdom. Tel.: +44 20 7594-3899; E-
mail:[email protected]

2
RUNNING TITLE: Systemic host responses to Leishmania infection
KEYWORDS: host, response, infection, metabolic, profiling, microbiota, cytokine, multivariate,
correlation, Leishmania

3
ABSTRACT
Parasitic infections such as leishmaniasis induce a cascade of host physiological responses, including
metabolic and immunological changes. Infection with Leishmania major parasites causes cutaneous
leishmaniasis in humans, a neglected tropical disease that is difficult to manage. To understand the
determinants of pathology, we studied L. major infection in two mouse models: the self-healing
C57BL/6 strain and the nonhealing BALB/c strain. Metabolic profiling of urine, plasma, and feces via
proton NMR spectroscopy was performed to discover parasite-specific imprints on global host
metabolism. Plasma cytokine status and fecal microbiome were also characterized as additional metrics
of the host response to infection. Results demonstrated differences in glucose and lipid metabolism,
distinctive immunological phenotypes, and shifts in microbial composition between the two models.
We present a novel approach to integrate such metrics using correlation network analyses, whereby
self-healing mice demonstrated an orchestrated interaction between the biological measures shortly
after infection. In contrast, the response observed in nonhealing mice was delayed and fragmented. Our
study suggests that trans-system communication across host metabolism, the innate immune system,
and gut microbiome is key for a successful host response to L. major and provides a new concept,
potentially translatable to other diseases.

4
INTRODUCTION
The leishmaniases describe a spectrum of diseases that are caused by protozoan parasites of the genus
Leishmania. The sum of diseases results in significant health burden globally, estimated at
approximately 2.4 million DALY’s1, 2. There are severe limitations to the current management of these,
including variable clinical manifestations and severity of disease (including the cutaneous and visceral
forms), suboptimal diagnosis, limited treatments and increases in drug resistance.3 A more fundamental
understanding of the pathogenesis is thus key to progressing novel avenues for more effective
identification and treatment.
Experimental research on murine models for cutaneous leishmaniasis (CL) has shown that disease
outcome depends to a large extent on the immune-phenotype of the host. A dominant Th1 response,
prevalent in C57BL/6 mice, with marked increased IFNγ and IL-12 cytokine production, has been
associated with disease resolution.4, 5 In contrast, a dominant Th2 response with elevated IL-4 levels, as
observed in BALB/c mice, has been linked with disease progression.6, 7
Recent evidence has shown that a range of different leukocytes, including different Th subsets, and
signalling molecules significantly contribute to the host response to Leishmania infection.8-10
Furthermore, host defence to Leishmania is not solely built on immune components but also relies on
regulatory metabolic messengers, such as the arginine pathway intermediates.11, 12 This special liaison
between immune and metabolic system has only found attention in the last few years and hence still
represents a largely unexplored source of potential new information on infection mechanisms.13-15
Metabolic profiling has shown great promise in discovering parasite-specific imprints on global host
metabolism but has not yet been investigated with Leishmania infection in vivo. Such studies on other
parasitic infections have conventionally relied on 1H nuclear magnetic resonance (NMR) spectroscopy-
based screening of urine and plasma samples, taken from infected rodent hosts for diagnostic

5
biomarker research.16, 17 NMR-based analyses, combined with advances in multivariate statistical tools,
have shown to yield highly reproducible data, with correlation of variances (CV’s) of major metabolite
markers typically below 10%.18, 19 This approach in infection studies has expanded successively to
include tissues and, more recently, to combine metrics from both the metabolic and immune system.
Such a combined approach enables a more systemic view on host response to a pathogen and
characterises the immune–metabolic interface during infection.20
A recurrent theme across a range of these parasite–rodent models characterised by metabolic profiling
is the association between parasitic infection and an altered host microbiome, as indicated by a set of
microbiota-associated metabolites detected in the urine and plasma.16, 17, 21 Additionally, results from
L. major infection models have demonstrated that germ-free mice failed to heal lesions as compared
with their conventional counterparts, despite generating a strong Th1 immune response22, which
strongly implicates the microbiota in mounting a successful host response to the parasite.
The current study was performed to characterise the infection-specific response in a self-healing
C57BL/6 and a non-healing BALB/c experimental model for CL (Figure 1). We adopted a holistic
approach to investigate the early phase of L. major infection by combining metrics of the immune,
metabolic, and gut microbial response in the host, including metabolic profiles from urine, plasma, and
faeces, selected peripheral cytokines, and faecal bacterial composition. By using this combined set of
phenotypic metrics, we aim to gain a better understanding of the interactions that lead to the complex
pathology of leishmaniasis. Moreover, by taking the successfully resistant mouse phenotype as a
reference system, we intend to define those biological parameters of the host that are associated with
disease resolution.
6
MATERIALS AND METHODS
Ethics Statement
All animal experiments were performed at Imperial College London, adhering to local and national
animal handling guidelines, under project license PPL70/6997. The protocols were approved by the
animal ethics committees at London School of Hygiene & Tropical Medicine, Imperial College London
and the UK Home Office.
Experimental Model and Sample Collection
L. major infection was established in 7-8 week old female C57BL/6J mice and BALB/cJ mice (n=15
per strain, 10 infected and 5 controls), purchased from Charles River Ltd, UK. Mice were fed on
standard rodent diet (Rat and Mouse No. 1 Maintenance diet, Special Diets Service, UK). Following
one week acclimatisation, mice were randomly allocated into infection and control groups. Mice in the
infection group received subcutaneous (s.c.) injections with 2x10⁶ stationary phase L. major
promastigotes (strain MHOM/SA/85/JISH118, passage 2 ─ culture methods detailed in Supporting
Information) in 100 μl Schneider’s Insect Medium (Sigma-Aldrich) into the shaven rump, whereas the
control group received medium only. Plasma, urine, and faecal samples were taken from each mouse 2
days prior to infection and post-infection at days 2, 6, and at the terminal day of the study, defined as
the day the lesion had developed in the tail before ulceration occurred (7-13 days post-infection,
depending on each infected animal), or 12 days post-injection for control animals. Samples were snap
frozen in liquid nitrogen and stored at -40°C for metabolic analysis. Additional faecal pellets for
microbial assessment were taken at all four time-points, as well as extra sections of terminal day lesion
(or skin for controls) for measurement of parasitic burden, which were all fixed in 10% formalin and
subsequently stored at -20°C.
1H NMR Acquisition and Processing
7
Plasma, urine and faecal samples were prepared for 1H NMR analyses based on protocols as described
by Beckonert et al., 200723, where methods for tissue metabolite extraction were adjusted for
preparation of faeces (Supporting Information). 1H NMR data were acquired on a Bruker Avance 600
NMR Spectrometer with TXI probe head (Bruker), using XWIN-NMR software (Bruker BioSpin).
Acquisition settings are outlined in Supporting Information. Spectra were pre-processed using
automatic phasing, baseline correction and reference peak calibration via an in-house algorithm in
MATLAB (version R2012b, Mathworks Inc) and Topspin 3.1 software (Bruker BioSpin). Water (and
urea regions for urine) were removed prior to automatic spectral alignment and probabilistic quotient
normalisation24, using an in-house MATLAB script.
Plasma Cytokine Assessment
Following NMR acquisition, plasma samples were tested in duplicate via the ultra-sensitive plasma
Th1/Th2 Cytokine 9-plex assay kit (Meso Scale Discovery/MSD) for levels of IFNγ, IL-1β, IL-2, IL-4,
IL-5, CXCL1, IL-10, IL-12 and TNFα. Protocols were based on manufacturer’s instructions, with
sample incubation time increased to 3 hours for increased detection. Assay plates were read on Sector
Imager 2400 and concentrations calculated using accompanying Discovery Workbench MSD software.
Faecal Microbiota Diversity Analysis with next-generation sequencing
Faecal DNA was extracted using QIAmp Stool Mini Kit (QIAGEN) based on manufacturer’s
instructions with minor protocol amendments (Supporting Information). Presence of microbial genes
was confirmed via 35 cycles of PCR [30 sec at 95°C, 40 sec at 55°C, 60 sec at 72°C], using primers
against V1-V3 region of bacterial 16S rRNA genes as described by Lewis et al., 2013.25 DNA samples
were sequenced via next-generation pyrosequencing using a 454 FLX Genome Sequencer (Roche) by
Research and Testing Laboratory, LLC (Texas, USA), and data was processed and analysed according
to company guidelines. In order to be able to discriminate between functionally distinctive groups of
8
bacteria, as opposed to purely genotypic differences when assessing changes at lower taxonomic levels,
the presented data was analysed at the class level, comparing relative percentage abundance of bacteria
between samples. Top eight bacterial classes with highest abundance were used for final analyses,
representing 99.1% of all measured classes across the dataset.
Parasitic Burden Assessment via real-time PCR
DNA was extracted from lesion samples using DNeasy® Blood & Tissue Kit (QIAGEN), following
manufacturer’s instructions, with minor modifications (PBS wash steps before extraction and doubling
proteinase K for lesion samples). DNA concentration and purity was measured using Nanodrop®
(Thermo Scientific). Real-time PCR was performed with triplicate samples using SYBR-Green kit
(Applied BioSystems)26 and primers against mouse arginase 1, to quantify genomic DNA, and
Leishmania-specific RV1/RV227 to detect parasites. Parasitic burden for each sample was assigned as
average fluorescent intensity of parasitic DNA as a multiple of the lowest positive reading, normalised
to arginase levels and calculated with Qbase Plus 2.4 software (Biogazelle).
Statistical Analysis and Data Integration
Metabolic spectra of infected and control groups from both strains were initially analysed by Principal
Component Analysis (PCA).28 Graphical representations of the first several components were used to
explore overall similarities/differences in metabolic phenotypes, using SIMCA P+ software (V. 12.0,
Umetrics). Mouse strain differences at the pre-infection time-point, as well as infection-associated
differences between infected and time-matched control mice for each strain were then explored using
Orthogonal Partial Lease Squares Discriminatory Analysis (O-PLS-DA)29 which includes a 7-fold
cross validation for each biological matrix, at each time-point. Final analyses focused on the
comparison between the infection-related responses of the two mouse models, whereby to account for
the strain differences, metabolic spectra, cytokine, and microbiome datasets from infected mice were

9
adjusted to their respective control strain by subtracting the uninfected control group median spectra
level from infected data. The strain-adjusted metabolic data was further analysed via O-PLS-DA.
Assigned discriminatory metabolites from O-PLS-DA models were selected when the associated
Pearson-product moment correlation coefficient (r) of a given metabolite peak surpassed the critical
values for p<0.05 and its ROC sensitivity/specificity score was at least 0.8. Spectral assignments of
metabolite peaks were performed based on Chenomx NMR suite profiler 7.0 software and using known
assignments from in-house NMR databases and literature.21
The differences in individual cytokines and class microbiota levels were analysed using non-
parametric univariate tests: Kruskal-Wallis ANOVA and pair-wise Mann-Whitney U-test for time-
matched strain comparisons, and Friedman tests and Wilcoxon matched-pair tests, for comparative
analyses between time-points for each mouse model. Bonferroni correction was applied to account for
multiple testing. Baseline plasma samples from the control groups were lacking thus no control-strain
adjustment could be performed for plasma metabolic and cytokine data at this time-point, required for
spectral O-PLS-DA and cytokine univariate analyses, respectively.
Two-dimensional-matrix, Pearson-based, correlation analyses were performed between time-matched
spectral data and cytokine levels, spectral data and microbiota class percentages, and cytokine levels
and microbiota, using in-house MATLAB code (Dr Judith Fonville). The script included a 10,000-fold
random permutation of sample order. A p-value was calculated as the number of times the absolute
value of correlation coefficient of the re-sampled data exceeded the original correlation coefficient
value. Only correlative pairs with p<0.05 were displayed. Twelve metabolites were selected each from
urine, plasma, and faeces, based on their display of correlations with host cytokines and/or microbiome,
and on their discriminatory role in differentiating between the two CL mouse models. The integrals
were calculated and co-analysed alongside time-matched microbiota class percentage abundance and

10
cytokine levels via PCA and PLS-DA, to determine how the different datasets (48 variables in total)
drive the separation between the two infection models.
These same variables were correlated via Pearson correlation with relative levels of parasitic burden for
each mouse model, to determine direct associations between infection and host measures. Furthermore,
Pearson correlation network graphs were drawn for each time-point in both strains individually, to
determine specific host interactions between variables, in response to infection, using in-house
MATLAB code based on MetaboNetworks software.30 A generous cut-off for the q-values of 0.3 using
the Storey-Tibshirani False Discovery Rate31 was applied for multiple testing correction in the
parasite–host correlation as well as correlation network analyses, for maximal exploration of potential
biologically relevant host interactions in this study. The sample size of this study was small and future
studies are needed to perform targeted analyses to test these associations. The majority of associations
are still expected to be true discoveries.

11
RESULTS
BALB/c and C57BL/6 mice have different metabolic, immune, and gut microbial phenotypes in
response to L. major infection
Among the physiological and pathological measures that were monitored between the two strains
within the first two weeks of infection, only the haematocrit differed significantly (Table S1). No
significant changes were observed in weight, day of lesion onset, or lesion size (though trends showed
that the BALB/c had larger overall lesions). Infection with L. major was confirmed via real-time PCR
of L. major DNA in lesions taken at the terminal time-point (days 7-13 post infection, the most acute
phase of the infection in our study), with no significant differences observed between strains.
In contrast to the minor pathological changes, the strains displayed clear strain and infection-related
differences in their metabolism across the three assessed biofluids: urine, plasma, and faecal extracts.
Preliminary multivariate analyses using PCA and O-PLS-DA revealed that strain differences prior to
infection included significantly higher levels of glucose and lactate with lower lipid moieties, in plasma
of C57BL/6 mice compared with BALB/c. The latter strain also displayed relatively higher lipid levels
in their faeces, along with lower amounts of urinary citrate, succinate and 2-oxoadipate. Infection
resulted in significant decreases in plasma glucose and urinary hippurate across both strains, as well as
decreases in plasma lipids in non-healing BALB/c mice. To investigate the differences in metabolic
infection-related responses between the two models, finalised results (Table S2) were based on O-PLS-
DA on spectra that took into account strain differences unrelated to infection by adjusting each infected
group to their respective uninfected control strain, a method that was also applied to subsequent
cytokine and microbiome data (Materials and Methods). Metabolites with significantly higher levels in
the non-healing strain for at least one post-infection time-point included alanine (in plasma and faeces),
succinate (faeces), 3-hydroxybutyrate (3-HB) and glucose (in plasma), as well as the gut-microbiota-
associated metabolites phenylacetylglcyine (PAG) and trimethylamine (TMA) in the urine. In contrast,
12
metabolites found in higher concentrations in the self-healing strain after infection included urinary
acetate and several fatty acid moieties from lipoproteins in plasma.
Out of the nine cytokines initially tested in plasma, four displayed detectable levels, namely IL-1β,
IL-10, IL-12 and CXCL1. IL-1β was the only cytokine to be significantly different between the two
strains prior to infection (higher in BABL/c mice, p=0.006). Following strain adjustment, infection-
related differences between the models (Figure S1) showed that non-healing mice generally had higher
levels of the pro-inflammatory cytokines CXCL1 and IL-1β than the self-healing model over all time-
points, though reaching statistical significance only for IL-1β, 6 days post-infection (d 6 p.i., p=0.036).
They also had higher levels of cytokine IL-12 than self-healing mice, 2 days post infection (d 2 p.i.,
p=0.013).
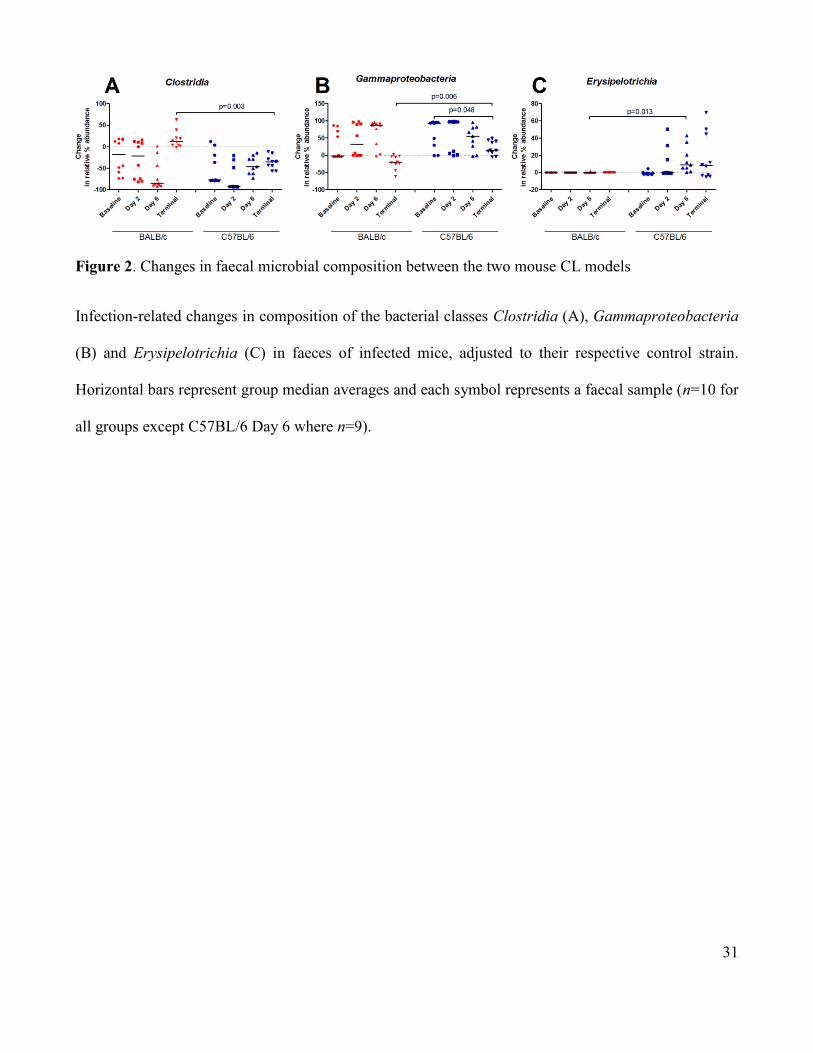
To compare faecal microbial composition between animals, we assessed changes in percentage
abundance of bacterial classes (further outlined in Materials and Methods). Clostridia (phylum
Firmicutes) and Gammaproteobacteria (phylum Proteobacteria) were the most dominant classes of
faecal bacteria observed in this study across both strains, accounting for over 85% relative abundance
of the total data. Initial trends showed that Clostridia were higher in BALB/c mice whilst
Gammaproteobacteria were higher in C57BL/6 mice before infection, yet this was not significant.
Following strain-adjustment, infection-related microbial levels for Clostridia remained consistently
higher in the BALB/c strain, reaching significance at the terminal time-point (p=0.003, Figure 2A). A
considerable decrease in relative Gammaproteobacteria levels was observed in both strains by the end
of the study (significant in C57BL/6 mice, p=0.048), although levels in C57BL/6 mice remained
significantly higher than in BALB/c mice (p=0.006, Figure 2B).
Erysipelotrichia represented the third most abundant bacterial class, which was largely absent in
BALB/c mice and, where present, was significantly lower than in self-healing C57BL/6 mice, d 6 p.i.
(p=0.013; Figure 2C, Table S3). The remaining bacterial classes were only detected at low levels

13
(typically less than 5% relative abundance), although significant changes relative to baseline were
detected in self-healing mice, e.g. increases in Alphaproteobacteria (d 2 p.i., p=0.048) and Bacteroidia
(d 2 p.i., p=0.012 and terminal, p=0.048) and decreases in Actinobacteria (d 6 p.i., p=0.027) and Bacilli
(terminal day, p=0.048; Table S4). No significant changes in faecal bacterial composition were evident
over the study period in non-healing mice, indicating a more static microbial population than that
observed in the self-healing model (Tables S3 and S4).
Peripheral cytokines correlate with the systemic host metabolism
Correlation analysis was performed between cytokine and NMR spectral data, in order to identify
associations between the host immune and metabolic system in response to infection, for each of the
murine phenotypes. Results showed that multiple interactions existed between the cytokine and the
metabolite data for all three biofluids (Table 1), with a higher number of correlations determined in the
self-healing strain. Certain immune-metabolic correlates were common to both the self-healing and
non-healing models, e.g. a negative association between urinary hippurate and IL-10. Other
correlations were specific to a particular CL model: urinary ureidopropanoate, for instance, was found
to be negatively correlated with IL-12, IL-1β and CXCL1 in the non-healing strain but did not correlate
with cytokines in the self-healing model. In several instances, particularly in non-healing mice,
metabolites that were correlated with IL-12, IL-1β and or CXCL1 produced opposing or no correlative
associations with regulatory cytokine IL-10. These disparate correlation patterns included 2-
oxoisocaproate, PAG and lactate in the urine.
Clostridia and Gammaproteobacteria display opposing associations with host metabolites
Extending further from the immune-metabolic correlations, associations between the host faecal
microbiome and metabolism were similarly investigated, using percentage abundance of the different

14
bacterial classes and spectral NMR data as input parameters. Results for plasma and faeces have been
summarised in Table 2 (Table S5 for urine). The majority of the metabolites that were negatively
linked with the Clostridia class were positively linked to Gammaproteobacteria and vice versa in both
mouse models. Such correlative metabolites included choline, glycerophosphocholine (GPC), plasma
lipids, lactate, the gut-microbiota associated molecules hippurate, PAG and TMA, and metabolites
related to the tricarboxylic acid cycle (e.g. acetate and fumarate) in the urine. Erysipelotrichia
displayed similar correlation patterns with host urinary and faecal metabolites as Clostridia in both CL
models, as well as with plasma metabolites in the self-healing C57BL/6 strain.
Multiple links between cytokines and faecal microbial classes in both infection models
Details of the correlation analyses between cytokine concentrations and microbial class abundances
are summarised in Table 3. IL-1β displayed the highest number of correlations with the microbiota in
the self-healing phenotype. IL-1β was found to be positively correlated with all microbial classes for at
least one time-point in self-healing mice, yet was only correlated with Bacilli and
Gammaproteobacteria in non-healing mice. IL-12 and IL-10 displayed the most immune-microbial
correlations out of all the cytokines in the non-healing mice. Actinobacteria and Bacteroidia classes
were strongly positively correlated with IL-10 levels in both strains, suggesting these commensal
bacteria may exert IL-10 dependent anti-inflammatory effects on the host.
Differences in metabolic and microbial responses to L. major infection dominate separation
between the self-healing and the non-healing phenotype
To ascertain the relative contribution of the host metabolic, immunological, and microbial
backgrounds towards differentiating the two mouse strains’ responses to L. major infection, metabolite
integrals, cytokine concentrations, and bacterial percentage abundances were co-analysed by Partial

15
Least Squares discriminatory analyses (PLS-DA), shown in Figure 3. Average correlation of variances
(CV’s) for the selected metabolites across all post-infection time-points were 27.7% (urine), 39.2%
(plasma) and 16.4% for BALB/C mice, and 32.8% (urine), 35.3% (plasma) and 20.5% for C57BL/6
mice. Analyses showed that metabolites in the urine and plasma represented the major drivers of
separation between host responses of the two strains to infection, particularly at the beginning of
infection, e.g. urinary hippurate and plasma glycine were found in higher concentrations in the self-
healing phenotype (Figure 3). Hippurate remained consistently higher in this strain throughout the
study, in addition to urinary creatine, faecal glutamate, and levels of the Erysipelotrichia and
Betaproteobacteria. In contrast CXCL1, urinary PAG and plasma levels of 3-HB and lipid methyl
groups were consistently higher in non-healing mice throughout infection. With infection progression,
the faecal microbiota became the most discriminatory variables between the two strains. By the
terminal time-point, members of the Gammaproteobacteria class were strongly linked with self-healing
mice whilst Clostridia and Bacilli classes were associated with the non-healing phenotype (Figure 3).
Parasitic load associated with a select set of metabolic, immunological and microbial markers
In order to assess whether parasitic burden was linked to host metabolism, immune status and/or
faecal microbiota, relative fluorescent intensities of lesion-derived L. major DNA were correlated with
the same variables as used for the previous PLS-DA models (Figure 4). Faecal succinate and IL-12
were found to be positively linked with parasitic load in the self-healing mouse strain. In contrast,
plasma scyllo-inositol, faecal acetate and Betaproteobacteria were positively associated with parasite
ounts in non-healing mice, whereas urinary 2-oxoisocaproate was negatively correlated.
L. major results in a CL model-specific systems response between host metabolism, immune
system and microbiota
16
Pair-wise Pearson correlation analysis was performed between selected variables to assess potential
associations between the different host responses within each infection model. A separate model was
built for each time-point and plotted as correlation network wheels, shown in Figure 5. The level of
inter-connectivity between the variables differed between the two strains, even prior to infection, where
the non-healing strain displayed hardly any correlations between variables (Figure S2). Infection
resulted in a substantial increase in the number of correlative associations in the self-healing strain at d
2 p.i., the highest observed in this study, whereby each variable was directly correlated with at least one
other variable. At d 6 p.i., non-healing mice displayed more associations between variables than earlier
time-points, whilst correlations between variables in self-healing mice became more confined to their
individual biological matrices. Multiple correlations were still observed in both models at the terminal
time-point, whereby the two strains displayed many similarities in their correlation patterns.
Whilst the constrained format of the correlation wheels allows for direct comparisons of variables
between strains or time-points, results were additionally depicted as network maps (Figures 6 and S3).
The topology of the network maps is more conducive to interpretation than the correlation wheels,
favouring the visualization of major hubs and chains of correlation within the networks, and thus more
aligned with mapping to biological pathways. The maps demonstrated that metabolites in plasma and
urine represented the core frameworks within the networks during the course of infection in both
models, displaying the highest number of inter- and intra-matrix correlations. Acetate, citrate, and
alanine represented major network hubs in the self-healing mouse model, with some of the highest
numbers of direct associations across all three post-infection time-points. Unlike C57BL/6, network
hubs in the non-healing strain were less stable through time and alternated throughout the course of the
study, with only plasma lactate remaining highly correlated with other variables at the three post-
infection time-points.

17
With the exception of d 2 p.i. in the BALB/c mice, IL-10 was consistently connected with multiple
host components within the core network of both phenotypes, highlighting its systemic regulatory role
within the host. The pro-inflammatory cytokine CXCL1 was directly correlated with numerous
bacterial classes and metabolites across different biological matrices in both infected strains. IL-12
produced negligible correlations in the self-healing strain in the current study. Within the microbiota
data, Bacilli and Bacteroidia classes were consistently disconnected from the core network hubs and
were connected largely with themselves, if correlated at all. Clostridia and Gammaproteobacteria were
negatively correlated with each other in both models across multiple time-points.

18
DISCUSSION
The current study presents a systematic characterisation of the global metabolic profile, peripheral
cytokine status, and the faecal microbiome in both susceptible BALB/c and self-healing C57BL/6
mouse models of CL. The specific objective of the work was to reveal the immune–metabolic–
microbial phenotype that underlies a successful response to L. major, using an integrated network
approach. Within the immunological context of this study, the first assessed post-infection time-point
(d 2 p.i.) represents an immune response that is entirely driven by innate factors. The two later time-
points assessed (d 6 p.i. and terminal) are generally thought to be driven by the host’s adaptive
immunity.32 Whilst our study focused only on the early stages of disease, trends in increased lesion size
and parasitic burden were already apparent in the non-healing model.
Key differences in strain-related metabolic responses towards infection included changes in glucose
and lipid metabolism. The non-healing BALB/c mice appeared to rely predominantly on fatty acids
rather than glucose as source of energy during infection, reflected by the relative increases in plasma
glucose and 3-HB: a ketone body generated from fatty acid breakdown.33 Biochemical blood results
from the supplier indicate that BALB/c mice typically have nearly twice as much circulating
triglycerides and lower levels of glucose in their blood than C57BL/6 mice.34, 35 This finding was in
line with our results, where baseline plasma lipid moieties were also higher in BALB/c mice than in the
C57BL/6 strain. However, L. major infection induced a pronounced decrease in lipids BALB/c mice
only. It may thus be speculated that due to their high bioavailability, metabolism of fatty acids
represents a major alternative for energy production in BALB/c mice not only in general but also more
importantly in response to infection.
Alanine and succinate concentrations were found to be consistently higher across multiple biofluids (in
faeces and for alanine, also in plasma) in the non-healing phenotype throughout infection. Both
19
metabolites represent major waste products of Leishmania species36 and our results showed that
succinate was also directly correlated with parasitic burden. Earlier in vitro studies have shown
concentrations of alanine and succinate to be significantly higher in cell media from L. major infected
macrophages when compared to uninfected macrophages37, highlighting their potential role as
biomarkers of Leishmania infection. It is thus plausible that these metabolites may in fact be directly
derived from the parasite. Urinary hippurate levels decreased upon infection in both strains and, upon
control-strain adjustment, were consistently found to be lower in the non-healing infected BALB/C
mice when compared to the self-healing strain. Interestingly, a decrease in hippurate has also been
observed in previous experimental rodent parasitic models (e.g. in Trypanosoma brucei brucei and
Schistosoma. mansoni infections), indicating that this may be a more general marker of parasitic
infection.16, 17
Immunological investigation of the two infected strains confirmed the importance of the innate immune
system driving the differential response during early stages of infection, whereby the non-healing
model displayed an inherent pro-inflammatory phenotype compared with the self-healing strain. In
contrast to published evidence38, defining the role of Th1 cytokine IL-12 in the current study proved
difficult, not only owing to the variable concentrations measured over the course of infection in both
strains, but due to its observed positive association with parasitic load.
Following infection, marked changes in faecal bacterial composition were observed, most notably, the
expression levels of members of the Clostridia class, which were higher in the non-healing strain, and
Gammaproteobacteria classes, that were higher in self-healing mice. Our results indicate that the
abundance of Clostridia and Gammaproteobacteria were inversely correlated, a finding that was also
reported following weight-loss through bariatric surgery in rats by Li and colleagues.39 In our study, the
20
two bacterial classes are often linked with the same metabolite but demonstrate contrasting
directionality, a phenomenon that was apparent in both strains of mice.
Parasitic counts within the lesion of infected mice produced significant correlations with select
biomarkers across the different responses assessed in this study. Twice as many correlates were
observed in the non-healing mice. Plasma scyllo-inositol, an organic osmolyte that has recently been
found to be associated brain disorders40, represented the strongest associated variable with parasite
counts in this strain.
Correlation network analyses between the host metabolic, cytokine, and faecal microbial responses
during infection uniquely demonstrated direct statistical interactions between host components.
Remarkable differences in the level of inter- and intra-matrix correlations were observed between the
two strains and sampling time-points. The self-healing C57BL/6 strain displayed the maximal number
of correlations between cytokines, microbiota, and metabolites 2 days after infection. Acetate, citrate
and alanine represented major network hubs in the self-healing strain, implying that these metabolites
may prove significant in orchestrating a systemic response towards Leishmania.
Acetate represents a key metabolite central to the metabolism of both carbohydrates and fatty acids,
used predominantly for the formation of acetyl coenzyme A. Additionally, it is the main short-chain
fatty acid readily reabsorbed from the colon back into systemic circulation and thus also acts as a
marker of colonic fermentation of dietary carbohydrate.41 Both citrate (a tricarboxylic acid
intermediate) and alanine (a gluconeogenic amino acid via the Cahill pathway42) represent markers
linked with host energy metabolism. Thus results from our study emphasise the focal role of
carbohydrate metabolism within the self-healing model during infection, presumably to account for the
high energy requirements to mount a successful system response towards the pathogen. In the non-
healing mice, the highest number of associations between variables was observed 6 days post-infection,

21
with few correlations observed at earlier time-points. The associations in the non-healing phenotype
appeared to be connected at random (disordered) rather than as functionally structured hubs, as in self-
healing mice. It could thus be hypothesised that these highly connected interactions between multiple
compartments within the host are vital for mounting a rapid and effective innate immune response
towards L. major, as seen in the self-healing state.
CONCLUSIONS
In summary, our systemic approach to the characterisation of two experimental models of a L. major
infection adds a novel aspect to the assessment of host defence, which can be applied to other disease
models. Tangible differences between the infection models included differences in energy metabolism,
inflammatory status, and gut microbial composition. Furthermore, our study revealed parasitic-linked
metabolites that were higher in the non-healing model and provide novel candidates to be further
investigated as potential biomarkers of Leishmania infection. Globally we have shown that already
during the innate immune response, an efficiently orchestrated network of metabolic, immunological,
and gut microbial features may be linked to a successful pathogen defence. Infection in the self-healing
model displayed a comprehensive correlation network between multiple biological responses towards
the parasite that was not present in the non-healing model, which may explain the superiority of this
strain in controlling disease. We have also identified a suite of metabolic candidates that represented
major network hubs linked to a successful immune response to L. major, which can be further explored
to ascertain potential indices for immune-modulatory and/or leishmanicidal activity.
22
ASSOCIATED CONTENT
Supporting Information
This section contains three figures and five tables and supporting protocols, titles listed below. This
material is available free of charge via the Internet at http://pubs.acs.org.
Figure S1. L. major infection-related changes in cytokine levels in plasma from two CL
models
Figure S2. Statistical inter-connectivity of metabolic, immune, and microbial markers in
mouse models prior to infection
Figure S3. Correlation network map of metabolic, immune and microbial markers of CL
models (Terminal day)
Table S1. Physiological and pathological measures of CL mouse models
Table S2. Infection-related discriminatory metabolic markers between the two CL models
Table S3. Infection-related differences in faecal microbiotal composition between the two CL
models
Table S4. Infection-related differences in faecal microbiotal composition over time within
each CL model
Table S5. Microbial-metabolic correlates in urine of CL models
Supporting Protocols

23
AUTHOR INFORMATION
Corresponding author
* E-mail: [email protected]
Author Contributions
JS, KS, SC and EH conceived and designed the study. Animal handling and sample collection were
performed by JS. Sample preparation, acquisition and analyses were performed by SDL. EG and SDL
performed parasitic burden assessment, under the supervision and guidance of MER. Faecal microbial
DNA extraction and PCR were performed by SDL, under the supervision and guidance of JRM. KAV
and JMP provided statistical guidance and analytical MATLAB codes for correlation analyses. SDL, JS
and EH wrote the manuscript, including critical input and final approval from all authors.
Notes
The authors declare that they have no competing interests.
ACKNOWLEDGMENTS
We would like to thank the Wellcome Trust for financial support of the research presented in the
current manuscript (Sir Henry Wellcome Fellowship JS, Award number 089002/B/09/Z) and the MRC
and Imperial College for the MRC Doctoral Training Award for SDL’s studentship funds. KAV
acknowledges the junior research fellowship scheme by Imperial College London. We would like to
thank The Royal Society for funding the compute cluster HIVE at Cardiff University and the
Biotechnology and Biological Sciences Research Council for support for MER and EG (David Phillips
Fellowship MER, Award number BB/H022406/1). The funding bodies had no role in study design,
data collection and analysis, decision to publish, or preparation of the manuscript.

24
ABBREVIATIONS
CL, Cutaneous Leishmaniaisis; CXCL, chemokine (C-X-C motif) ligand; DALY, disability-adjusted
life year; IL, Interleukin; PCR, polymerase chain reaction; Th, T helper cell.

25
REFERENCES
1. Desjeux, P. Nat Rev Micro 2004, 9, 692-693.
2. Alvar, J.; Velez, I. D.; Bern, C.; Herrero, M.; Desjeux, P.; Cano, J.; Jannin, J.; den Boer, M.; WHO
Leishmaniasis Control Team PLoS One 2012, 5, e35671.
3. Croft, S. L.; Olliaro, P. Clin. Microbiol. Infect. 2011, 10, 1478-1483.
4. Scott, P. J. Immunol 1991, 9, 3149-3155.
5. Sypek, J. P.; Chung, C. L.; Mayor, S. E.; Subramanyam, J. M.; Goldman, S. J.; Sieburth, D. S.;
Wolf, S. F.; Schaub, R. G. J. Exp. Med. 1993, 6, 1797-1802.
6. Sadick, M. D.; Heinzel, F. P.; Holaday, B. J.; Pu, R. T.; Dawkins, R. S.; Locksley, R. M.
J. Exp. Med. 1990, 1, 115-127.
7. Kopf, M.; Brombacher, F.; Köhler, G.; Kienzle, G.; Widmann, K. H.; Lefrang, K.; Humborg, C.;
Ledermann, B.; Solbach, W. J. Exp. Med. 1996, 3, 1127-1136.
8. Belkaid, Y.; Piccirillo, C. A.; Mendez, S.; Shevach, E. M.; Sacks, D. L. Nature 2002, 6915, 502-507.
9. Woelbing, F.; Kostka, S. L.; Moelle, K.; Belkaid, Y.; Sunderkoetter, C.; Verbeek, S.; Waisman, A.;
Nigg, A. P.; Knop, J.; Udey, M. C.; von Stebut, E. J. Exp. Med. 2006, 1, 177-188.
10. Peters, N. C.; Egen, J. G.; Secundino, N.; Debrabant, A.; Kimblin, N.; Kamhawi, S.; Lawyer, P.;
Fay, M. P.; Germain, R. N.; Sacks, D. Science 2008, 5891, 970-974.

26
11. Iniesta, V.; Carcelen, J.; Molano, I.; Peixoto, P. M. V.; Redondo, E.; Parra, P.; Mangas, M.;
Monroy, I.; Campo, M. L.; Gomez Nieto, C.; Corraliza, I. Infect. Immun. 2005, 9, 6085-6090.
12. Kropf, P.; Fuentes, J. M.; Fahnrich, E.; Arpa, L.; Herath, S.; Weber, V.; Soler, G.; Celada, A.;
Modolell, M.; Muller, I. FASEB Journal 2005, 8, 1000-1002.
13. Li, P.; Yin, Y.; Li, D.; Woo Kim, S.; Wu, G. Br. J. Nutr. 2007, 02, 237-252.
14. Saric, J. Parasitology 2010, Special Issue 09, 1451.
15. Ferrante Jr, A. W. J. Clin. Invest. 2013, 12, 4992-4993.
16. Wang, Y.; Holmes, E.; Nicholson, J. K.; Cloarec, O.; Chollet, J.; Tanner, M.; Singer, B. H.;
Utzinger, J. Proc. Natl. Acad . Sci. U. S. A. 2004, 34, 12676-12681.
17. Wang, Y.; Utzinger, J.; Saric, J.; Li, J. V.; Burckhardt, J.; Dirnhofer, S.; Nicholson, J. K.; Singer, B.
H.; Brun, R.; Holmes, E. Proc. Natl. Acad . Sci. U. S. A. 2008, 16, 6127-6132.
18. Dumas, M.; Maibaum, E. C.; Teague, C.; Ueshima, H.; Zhou, B.; Lindon, J. C.; Nicholson, J. K.;
Stamler, J.; Elliott, P.; Chan, Q.; Holmes, E. Anal. Chem. 2006, 7, 2199-2208.
19. Schreier, C.; Kremer, W.; Huber, F.; Neumann, S.; Pagel, P.; Lienemann, K.; Pestel, S. Biomed.
Res. Int. 2013, , 878374.
20. Saric, J.; Li, J. V.; Swann, J. R.; Utzinger, J.; Calvert, G.; Nicholson, J. K.; Dirnhofer, S.; Dallman,
M. J.; Bictash, M.; Holmes, E. J. Proteome Res. 2010, 5, 2255-2264.
21. Saric, J.; Li, J. V.; Wang, Y.; Keiser, J.; Bundy, J. G.; Holmes, E.; Utzinger, J. PLoS
Negl. Trop. Dis. 2008, 7, e254.

27
22. Oliveira, M. R.; Tafuri, W. L.; Afonso, L. C.; Oliveira, M. A.; Nicoli, J. R.; Vieira, E. C.; Scott, P.;
Melo, M. N.; Vieira, L. Q. Parasitology 2005, 4, 477-488.
23. Beckonert, O.; Keun, H. C.; Ebbels, T. M.; Bundy, J.; Holmes, E.; Lindon, J. C.; Nicholson, J. K.
Nat. Protoc 2007, 11, 2692-2703.
24. Dieterle, F.; Ross, A.; Schlotterbeck, G.; Senn, H. Anal. Chem. 2006, 13, 4281-4290.
25. Lewis, D. A.; Brown, R.; Williams, J.; White, P.; Jacobson, S. K.; Marchesi, J.; Drake, M. J.
Front. Cell. Infect. Microbiol. 2013, 41,.
26. de La Llave, E.; Lecoeur, H.; Besse, A.; Milon, G.; Prina, E.; Lang, T. Cell. Microbiol. 2011, 1, 81-
91.
27. Solcà, M. d. S.; Guedes, C. E. S.; Nascimento, E. G.; Oliveira, G. G. d. S.; Santos, W. L. C. d.;
Fraga, D. B. M.; Veras, P. S. T. Vet. Parasitol. 2012, 2–4, 133-140.
28. Hotelling, H. J. Educ. Psychol. 1933, 6, 417.
29. Trygg, J.; Holmes, E.; Lundstedt, T. J. Proteome Res. 2007, 2, 469-479.
30. Posma, J. M.; Robinette, S. L.; Holmes, E.; Nicholson, J. K. Bioinformatics 2013, .
31. Storey, J. D.; Tibshirani, R. PNAS 2003, 16, 9440-9445.
32. Janeway, C. A. J.; Travers, P.; Walport, M.; Shlomchik, M. J. Principles of innate and adaptive
immunity. In Immunobiology: The Immune System in Health and Disease; Garland Science: New
York, 2001; .

28
33. Morris, A. A. M. J. Inherit. Metab. Dis. 2005, 2, 109-121.
34. Charles River Laboratories Clinical Pathology Data for BALB/c Mouse Colonies in North America
for January 2008 - December 2012. http://www.criver.com/files/pdfs/rms/balbc/rm_rm_r_balb-
c_mouse_clinical_pathology_data.aspx (accessed August 5, 2014).
35. Charles River Laboratories Biochemistry and Hematology for C57BL/6NCrl Mouse Colonies in
North American for January 2008 – December 2012.
http://www.criver.com/files/pdfs/rms/c57bl6/rm_rm_r_c57bl6_mouse_clinical_pathology_data.aspx
(accessed August 5, 2014).
36. McConville, M. J.; de Souza, D.; Saunders, E.; Likic, V. A.; Naderer, T. Trends Parasitol. 2007, 8,
368-375.
37. Lamour, S. D.; Choi, B.; Keun, H. C.; Müller, I.; Saric, J. J. Proteome Res. 2012, 8, 4211-4222.
38. Sacks, D.; Noben-Trauth, N. Nat. Rev. Immunol. 2002, 11, 845.
39. Li, J. V.; Ashrafian, H.; Bueter, M.; Kinross, J.; Sands, C.; le Roux, C. W.; Bloom, S. R.; Darzi, A.;
Athanasiou, T.; Marchesi, J. R.; Nicholson, J. K.; Holmes, E. Gut 2011, 9, 1214-1223.
40. Griffith, H. R.; den Hollander, J. A.; Stewart, C. C.; Evanochko, W. T.; Buchthal, S. D.; Harrell, L.
E.; Zamrini, E. Y.; Brockington, J. C.; Marson, D. C. NMR Biomed. 2007, 8, 709-716.
41. Hijova, E.; Chmelarova, A. Bratisl. Lek. Listy 2007, 8, 354-358.
42. Felig, P.; Pozefsk, T.; Marlis, E.; Cahill, G. F. Science 1970, 3920, 1003-1004.

29
30
FIGURES
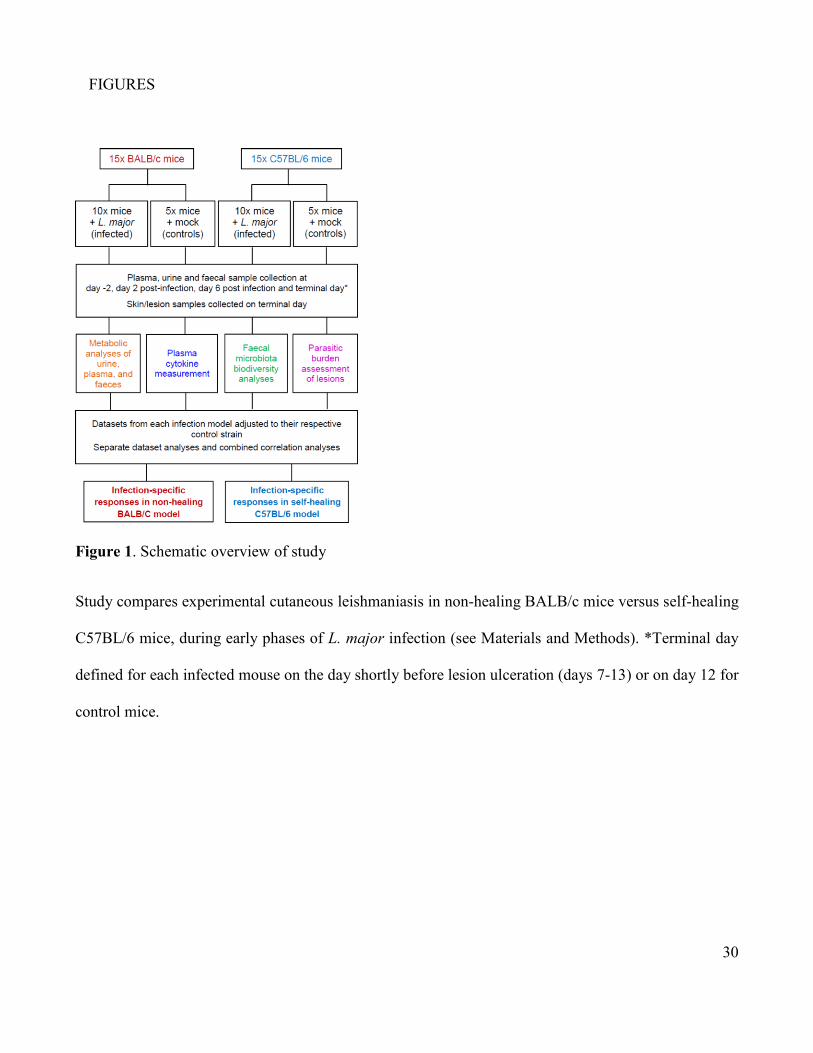
Figure 1. Schematic overview of study
Study compares experimental cutaneous leishmaniasis in non-healing BALB/c mice versus self-healing
C57BL/6 mice, during early phases of L. major infection (see Materials and Methods). *Terminal day
defined for each infected mouse on the day shortly before lesion ulceration (days 7-13) or on day 12 for
control mice.
31
Figure 2. Changes in faecal microbial composition between the two mouse CL models
Infection-related changes in composition of the bacterial classes Clostridia (A), Gammaproteobacteria
(B) and Erysipelotrichia (C) in faeces of infected mice, adjusted to their respective control strain.
Horizontal bars represent group median averages and each symbol represents a faecal sample (n=10 for
all groups except C57BL/6 Day 6 where n=9).

32
Figure 3. Discriminatory variables between two infection models for each post-infection time-point
assessed via PLS-DA
Scores plots (A) and corresponding loadings plots (B) of Partial Least Squares discriminatory analyses
(PLS-DA) between the two infected strains are presented, based on the first component vector for 2
days and 6 days post-infection and at the terminal study day. A) Each circle represents one sample.
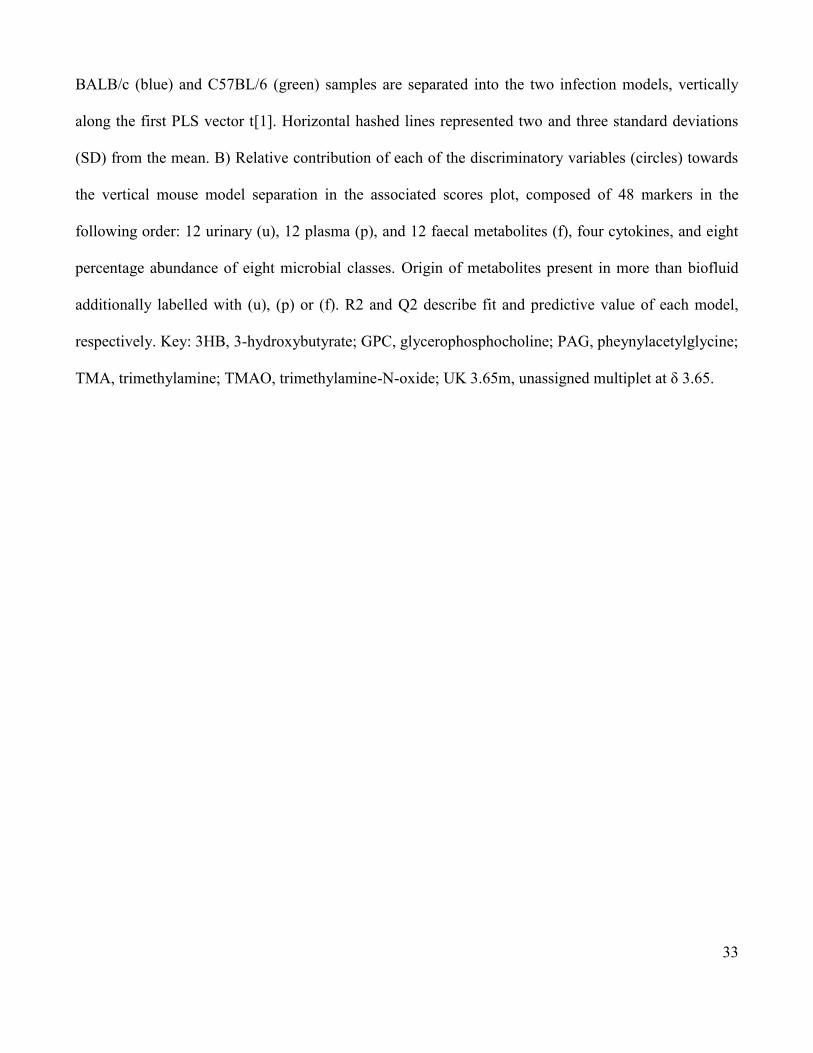
33
BALB/c (blue) and C57BL/6 (green) samples are separated into the two infection models, vertically
along the first PLS vector t[1]. Horizontal hashed lines represented two and three standard deviations
(SD) from the mean. B) Relative contribution of each of the discriminatory variables (circles) towards
the vertical mouse model separation in the associated scores plot, composed of 48 markers in the
following order: 12 urinary (u), 12 plasma (p), and 12 faecal metabolites (f), four cytokines, and eight
percentage abundance of eight microbial classes. Origin of metabolites present in more than biofluid
additionally labelled with (u), (p) or (f). R2 and Q2 describe fit and predictive value of each model,
respectively. Key: 3HB, 3-hydroxybutyrate; GPC, glycerophosphocholine; PAG, pheynylacetylglycine;
TMA, trimethylamine; TMAO, trimethylamine-N-oxide; UK 3.65m, unassigned multiplet at δ 3.65.

34
Figure 4. Correlation between parasitic burden and host response markers in non-healing and self-
healing CL models
Plot shows Pearson correlation between relative amount of L. major DNA in lesions (Table S1) from
infected BALB/c and C57BL/6 mice, and levels of infection-related metabolic, immune and faecal
microbial variables (terminal time-point). Each variable is represented by a small circle, where
significantly positively correlated variables are boxed in red and negative in blue (q<0.3). Key: faecal
metabolites; 1, unassigned multiplet peak at δ 3.65; 2, tyramine; 3, trimethylamine (TMA); 4,
dimethylamine; 5, glutamate; 6, taurine; 7, succinate; 8, lipid (CH3); 9, lactate; 10, propionate; 11,
butyrate; 12, acetate. Plasma metabolites; 13, citrate; 14, glycine; 15, creatine; 16, alanine; 17, scyllo-
inositol; 18, glycerophophocholine; 19, choline; 20, 3-hydroxybutyrate; 21, lipid (CH2); 22, lipid
(CH3); 23, glucose; 24, lactate. Urine metabolites; 25, ureidopropanoate; 26, citrate; 27, acetate; 28, 2-
oxoisocaproate; 29, creatinine; 30, creatine; 31, lactate; 32, trimethylamine-N-oxide; 33, TMA; 34,

35
phenylacetylglycine; 35, hippurate; 36, taurine. Bacterial classes; 37, Clostridia; 38,
Gammaproteobacteria; 39, Erysipelotrichia; 40, Alphaproteobacteria; 41, Betaproteobacteria; 42,
Bacilli; 43, Actinobacteria; 44, Bacteroidia. Cytokines; 45, CXCL1; 46, IL-1ß; 47, IL-12; 48, IL-10.
36
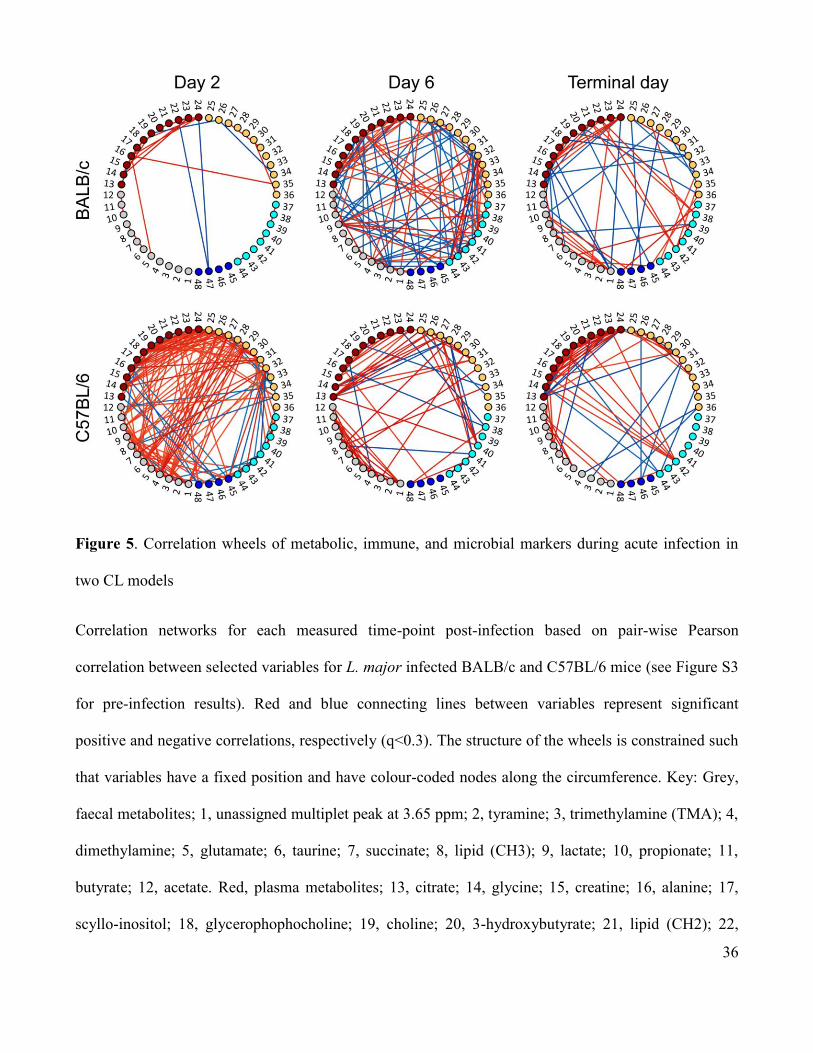
Figure 5. Correlation wheels of metabolic, immune, and microbial markers during acute infection in
two CL models
Correlation networks for each measured time-point post-infection based on pair-wise Pearson
correlation between selected variables for L. major infected BALB/c and C57BL/6 mice (see Figure S3
for pre-infection results). Red and blue connecting lines between variables represent significant
positive and negative correlations, respectively (q<0.3). The structure of the wheels is constrained such
that variables have a fixed position and have colour-coded nodes along the circumference. Key: Grey,
faecal metabolites; 1, unassigned multiplet peak at 3.65 ppm; 2, tyramine; 3, trimethylamine (TMA); 4,
dimethylamine; 5, glutamate; 6, taurine; 7, succinate; 8, lipid (CH3); 9, lactate; 10, propionate; 11,
butyrate; 12, acetate. Red, plasma metabolites; 13, citrate; 14, glycine; 15, creatine; 16, alanine; 17,
scyllo-inositol; 18, glycerophophocholine; 19, choline; 20, 3-hydroxybutyrate; 21, lipid (CH2); 22,

37
lipid (CH3); 23, glucose; 24, lactate. Yellow, urine metabolites; 25, ureidopropanoate; 26, citrate; 27,
acetate; 28, 2-oxoisocaproate; 29, creatinine; 30, creatine; 31, lactate; 32, trimethylamine-N-oxide; 33,
TMA; 34, phenylacetylglycine; 35, hippurate; 36, taurine. Cyan, bacterial classes; 37, Clostridia; 38,
Gammaproteobacteria; 39, Erysipelotrichia; 40, Alphaproteobacteria; 41, Betaproteobacteria; 42,
Bacilli; 43, Actinobacteria; 44, Bacteroidia. Dark blue, cytokines; 45, CXCL1; 46, IL-1ß; 47, IL-12;
48, IL-10.

38
Figure 6. Correlation network map of metabolic, immunologic and microbial markers in response to
early infection in two mouse CL models
Correlation networks based on pair-wise Pearson correlation between all variables for BALB/c and
C57BL/6 mice infected with L. major, at 2 and 6 days post-infection (see Figure S3 for terminal). Red
and blue connecting lines between variables represent significant positive or negative correlations,
respectively (q<0.3). Variables are grouped according to correlation clusters and are colour coded in

39
boxes according to their compartments: urine in yellow, plasma in red, cytokines in dark blue and
bacterial classes in cyan. Key: 3HB, 3-hydroxybutyrate; DMA, dimethylamine; GPC,
glycerophosphocholine; PAG, phenylacetylglycine; TMA, trimethylamine; TMAO, trimethylamine-N-
oxide; UK 3.65m, unassigned multiplet peak at δ 3.65.

40
TABLES
Table 1. Immune–metabolic correlates in urine, plasma, and faeces of the self-healing and non-healing
CL infection models
Biofluid Metabolite
Correlate
Infected BALB/c Infected C57BL/6
IL-10 IL-12 IL-1β CXCL1 IL-10 IL-12 IL-1β CXCL1
Urine
2-oxoadipate* - - 2-oxoglutarate - 2-oxoisocaporate + - - - + Acetate - - cis-Aconitate - Citrate - + + Creatine - +/- + Creatinine - Fumarate - Guanidoacetate - + Hippurate - - - Lactate + - - - - PAG + +/- + + + Succinate - - Taurine - - +/- +/- - + + TMA - - TMAO + + +/- Ureidopropanoate - - -
Plasma
3-HB + Choline + Glucose + + - +/- + +/- Glycine - GPC - Lactate +/- - - + Lipid CH2 - + + Lipid CH3 - + + Lipid* 3.22(m) + + scyllo-Inositol* -
Faeces
Butyrate - - + Glutamate - Lactate + +/- Lipid CH3 + Propionate + + + Succinate - + Taurine +

41
Key: +, positive correlations; -, negative correlations; +/-, direction of correlation alternated between
different time-points; *, tentative assignment; 3-HB, 3-hydroxybutyrate; GPC, glycerophoshocholine;
(m), unassigned multiplet (accompanied by chemical shift region); PAG, phenylacetylglycine; TMA,
trimethylamine; TMAO; trimethylamine-N-oxide.
Table 2. Microbial–metabolic correlates in plasma and faeces in the self-healing and non-healing
infection models
Biofluid Metabolic
Correlate Clos Gamma Erysi Alpha Beta Bacil Actino Bacter
BALB/c:
Plasma
3-HB + + + Choline + - + + + + Glucose - + - - - + - + GPC - + + - - - Lactate +/- - - Lipid* 3.22(m) + - + Lipid CH2 + + +/- - + Lipid CH3 + +/- - + s-Inositol* - +/- + -
BALB/c:
Faeces
Acetate - Butyrate - + - + + - Lactate - Propionate + - - Succinate -
C57BL/6:
Plasma
3-HB - + - - Choline - + Glucose - - - - + + GPC - + Lactate - - Lipid* 3.22(m) - + - Lipid CH2 - + - Lipid CH3 - -
C57BL/6: Acetate + + - Butyrate -

42
Faeces DMA - Glutamate - - Lactate - + - - + Propionate - + - Succinate - + - -
Key: +, positive correlations at one time-point; ++ positive correlations for at least two time-points; -,
negative correlations at one time-point; --; negative correlation for at least two time-points; +/-,
direction of correlation alternating between different time-points; *, tentative assignment; 3.22(m),
multiplet spectral peak at δ 3.22; 3-HB, 3-hydroxybutyrate; Actino, Actinobacteria; Alpha,
Alphaproteobacteria; Bacil, Bacilli; Bacter, Bacteroidia; Beta, Betaproteobacteria; Clos, Clostridia;
DMA; dimethylamine; Erysi, Erysipelotrichia; Gamma, Gammaproteobacteria; GPC,
glycerophoshocholine; (m), unassigned multiplet (accompanied by chemical shift region); PAG,
phenylacetylglycine; s-, scyllo.
Table 3. Immune–microbial correlates across the self-healing and non-healing infection models
Microbial Class
Infected BALB/c Infected C57BL/6
IL-10 IL-12 IL-1β CXCL
1 IL-10 IL-12 IL-1β
CXCL
1
Clostridia + ++
+ ++
Gammaproteobacteria
+/- + +
+ + Erysipelotrichia
+
++ + + +
Alphaproteobacteria ++ +
+ ++
Betaproteobacteria +/-
+ ++
Bacilli
+ +
+ + +
Actinobacteria ++ +
++
+
Bacteroidia ++ +
+ + +

43
Key: +, positive correlations at one time-point; ++ positive correlations for at least two time-points;
+/-, direction of correlation alternating between different time-points.
44
SUPPORTING INFORMATION
Metabolic, immune, and gut microbial signals mount a systems response to
Leishmania major infection
Sabrina D. Lamour, Kirill A. Veselkov, Joram M. Posma, Emilie Giraud, Matthew E. Rogers, Simon
Croft, Julian R. Marchesi, Elaine Holmes, Karin Seifert, and Jasmina Saric
This section contains three figures, five tables, and supporting protocols.

45
Figure S1. L. major infection-related changes in cytokine levels in plasma from two CL models
Graphs displaying plasma levels of IL-1β (A), IL-10 (B), IL-12 (C), and CXCL1 (D) from infected
mice, adjusted to their respective control strain. Horizontal bars represent group median average and
each symbol represents one sample. n=10 for all groups except C57BL/6 Day 6 where n=9.

46
Figure S2. Statistical inter-connectivity of metabolic, immune, and microbial markers in mouse models
prior to infection
Correlation wheels (A) and maps (B) based on pair-wise Pearson correlation between all variables for
BALB/c and C57BL/6 mice, two days prior to infection. Positive and negative correlations between
variables are marked with red lines and blue lines, respectively. Red or blue connecting lines between
variable represent significant (q<0.3) positive or negative correlations, respectively. The structure of
47
the wheels is constrained such that variables have a fixed position and have colour-coded nodes along
the circumference whilst in maps, variables are grouped according to correlation clusters and are
colour-coded in boxes according to their compartments. Key: Grey, fecal metabolites; 1, unassigned
multiplet peak at δ 3.65 (UK 3.65m); 2, tyramine; 3, trimethylamine (TMA); 4, dimethylamine
(DMA); 5, glutamate; 6, taurine; 7, succinate; 8, lipid (CH3); 9, lactate; 10, propionate; 11, butyrate; 12,
acetate. Red, plasma metabolites; 13, citrate; 14, glycine; 15, creatine; 16, alanine; 17, scyllo-inositol;
18, glycerophophocholine (GPC); 19, choline; 20, 3-hydroxybutyrate (3HB); 21, lipid (CH2); 22, lipid
(CH3); 23, glucose; 24, lactate. Yellow, urine metabolites; 25, ureidopropanoate; 26, citrate; 27,
acetate; 28, 2-oxoisocaproate; 29, creatinine; 30, creatine; 31, lactate; 32, trimethylamine-N-oxide
(TMAO); 33, TMA; 34, phenylacetylglycine; 35, hippurate; 36, taurine. Cyan, bacterial classes; 37,
Clostridia; 38, Gammaproteobacteria; 39, Erysipelotrichia; 40, Alphaproteobacteria; 41,
Betaproteobacteria; 42, Bacilli; 43, Actinobacteria; 44, Bacteroidia. Dark blue, cytokines; 45, CXCL1;
46, IL-1ß; 47, IL-12; 48, IL-10.

48
Figure S3. Correlation network map of metabolic, immune and microbial markers of CL models
(Terminal day)
Correlation networks based on pair-wise Pearson correlation between all variables for infected BALB/c
mice and infected C57BL/6 mice on the terminal study day. Red and blue connecting lines between
variables represent significant (q<0.3) positive and negative correlations, respectively. Variables are
grouped according to correlation clusters and are colour-coded in boxes according to their
compartments: urine in yellow, plasma in red, cytokines in dark blue and bacterial classes in cyan. Key:
3HB, 3-hydroxybutyrate; DMA, dimethylamine; GPC, glycerophosphocholine; PAG,
phenylacetylglycine; TMA, trimethylamine; TMAO, trimethylamine-N-oxide; UK 3.65m, unassigned
multiplet peak at δ 3.65.

49
Table S1. Physiological and pathological measures of CL mouse models
Group Median (range) p-value
Infected
BALB/
c
Control
BALB/
c
Infected
C57BL/
6
Control
C57BL/
6
Difference
between
Strains
Difference
between
Infection
Status
Difference
over time
Weight
(g)
Baseline
18.2
(17.2-
19.4)
18.00
(17.1-
19.0)
18.7
(17.3-
19.5)
16.9
(16.5-
19.2)
NS NS NS
Day 2
18.7
(17.6-
20.0)
18.2
(17.9-
19.7)
18.3
(17.2-
19.5)
17.6
(15.5-
18.8)
NS NS NS
Day 6
19.1
(17.8-
20.0)
19.4
(18.2-
20.4)
18.5
(17.1-
19.6)
17.50
(15.7-
18.9)
NS NS NS
PCV
Baseline
0.63
(0.57-
0.66)
NT
0.54
(0.48-
0.59)
NT p=0.007
(-) NS NS
Day 2
0.60
(0.58-
0.65)
0.65
(0.62-
0.69)
0.53
(0.50-
0.55)
0.53
(0.51-
0.55)
p=0.005
(-) NS NS
Day 6
0.62
(0.60-
0.65)
0.56
(0.52-
0.60)
0.53
(0.46-
0.56)
0.52
(0.48-
0.55)
p=0.007
(-) NS NS
Lesion
Day of
Onset
7.5
(5-10) N/A
7.9
(5-11) N/A NS N/A N/A
Max Area
(mm2)
20.22
(3.93-
28.27)
N/A
11.78
(9.42-
25.13)
N/A NS N/A N/A
Parasitic
Burden
(A.U.)
Lesion
70.61
(1-
2010)
N/A
15.95
(1-
806.8)
N/A NS N/A N/A
Key: (-) significantly lower in C57BL/6 mice than BALB/c mice; A.U., arbitrary units; N/A, Not
applicable; NS, Not statistically significant; NT, not tested; PCV, packed cell volume (haematocrit).

50
Table S2. Infection-related discriminatory metabolic markers between the two CL models
Biofluid Positively correlated
BALB/c
Positively correlated
with C57BL/6
Strain association
varied between time-
points
Urine
2-oxoglutarate
Creatinine
Dimethylamine
Fumarate
Lipid CH2
Phenylacetylglycine
Succinate
Trimethylamine
Ureidopropanoate
2-oxoisocaproate
3-
hydroxyisovalerate*
Acetate
Creatine
Dimethylglycine
Glycerophosphochol
ine
Taurine
2-oxoadipate*
2-oxovalerate*
3-methyl-2-
oxovalerate*
cis-Aconitate
Citrate
Hippurate
Indoxylsulphate
Lactate
Plasma
3-hydroxybutyrate
Alanine
Citrate
Creatine
Glucose
Glutamine
Lipid* 0.66(m)
Lipid* 3.21(m)
Pyruvate*
Valine
Glycerophosphochol
ine
Glycine
Lipid* 1.14(m)
Lipid CH2-CH2-CO
Lipid CH=CH-CH2-
CH2
Lipid CH2-CO
scyllo-Inositol*
Acetate
Lactate
Lipid CH2
Lipid CH3
Feces
Alanine
Glycine
Lactate
Lipid CH3
Succinate
Trimethylamine
Trimethylamine-N-
oxide
Tyramine
Glutamate
Acetate
Bile Acid*
Butyrate
Cholate*
Glycocholate*
Tyrosine*
Key: *, tentative assignment; ADP, adenosine diphosphate; ATP, adenosine triphosphate; (m),
multiplet peak (accompanied with chemical shift region in parts per million); UDP, uridine diphospho

51
Table S3. Infection-related differences in fecal microbiotal composition between the two CL models
p-values of strain-dependent differences
Baseline Day 2 Day 6 Terminal
Clostridia NS NS NS 0.003 (+)
Gammaproteobacteria NS NS NS 0.006 (-)
Erysipelotrichia NS NS 0.013 (-) NS
Alphaproteobacteria NS NS NS NS
Betaproteobacteria NS NS NS NS
Bacilli NS NS NS 0.003 (+)
Actinobacteria NS NS 0.010 (+) NS
Bacteroidia NS 0.035 (+) NS NS
Key: (+), significantly (p<0.05) higher in BALB/C mice than C57BL/6 mice; (-), significantly lower
in BALB/c mice than C57BL/6 mice; NS, Not statistically significant.

52
Table S4. Infection-related differences in fecal microbiotal composition over time within each CL
model
p-values of Infected BALB/c p-values of Infected C57BL/6
Friedman
Test
Wilcoxon matched-
pair Tests
Friedman
Test
Wilcoxon matched-pair
Tests
All time-
points
Base
vs.
Day 2
Base
vs.
Day 6
Base vs.
Terminal
All time-
points
Base
vs.
Day 2
Base
vs.
Day 6
Base vs.
Terminal
Clostridia 0.002 NS NS NS 0.026 NS NS NS
Gammaproteobacteria 0.003 NS NS NS 0.004 NS NS 0.048 (-)
Erysipelotrichi NS NS NS NS 0.022 NS NS NS
Alphaproteobacteria 0.012 NS NS NS 0.0002 0.048
(+) NS NS
Betaproteobacteria 0.006 NS NS NS 0.012 NS NS NS
Bacilli 0.015 NS NS NS 0.0002 NS NS 0.048 (-)
Actinobacteria NS NS NS NS 0.0003 NS 0.027 (-
) NS
Bacteroidia 0.015 NS NS NS 0.004 0.012
(+) NS 0.048 (+)
Key: (+), significant (p<0.05) increase relative to baseline levels; (-), significant decrease relative to
baseline; NS, Not statistically significant.

53
Table S5. Microbial-metabolic correlates in urine of CL models
Metabolic
Correlate Clos Gamma Erysi Alpha Beta Bacil Actino Bacter
BALB/c
2-oxoadipate - +
-
2-oxoglutarate
- - +
2-oxoisocaporate + -
+ + - + + +
Acetate - + -
+
cis-Aconitate + -
+
-
Citrate - - + +
- - -
Creatine
-
Creatinine + - - +
+
+ + +
Dimethylamine
+/-
+
Fumarate - +
Glycine + -
+
Guanidoacetate
+ -
+/- +
Hippurate + -
+
-
-
Lactate - +
- +
PAG + + -
+ -
+
Succinate
+/-
Taurine - +
-
+ - +
TMA + -
+ +
TMAO + -
+ +
Ureidopropanoate*
+
C57BL/6
2-oxoglutarate
+
2-oxoisocaproate
+/- + +
Acetate
+
cis-Aconitate
- - -
Creatine
-
+
Creatinine - + - -
- - - -
Dimethylamine
- -
Lactate +/-
+
-
PAG -
-
-
Taurine
- - - - +/- -
TMA +
+
-
TMAO +/- + + +/- +
Ureidoproanoate*
+
Key: +, positive correlations at one time-point; ++ positive correlations for at least two time-points; -,
negative correlations at one time-point; --; negative correlation for at least two time-points; +/-,
direction of correlation alternating between different time-points; *, tentative assignment; Actino,

54
Actinobacteria; Alpha, Alphaproteobacteria; Bacil, Bacilli; Bacter, Bacteroida; Beta,
Betaproteobacteria; Clos, Clostridia; Erysi, Erysipelotrichia; Gamma, Gammaproteobacteria; (m),
multiplet; PAG, phenylacetylglycine; TMA, trimethylamine; TMAO, trimethylamine-N-oxide.

55
Supporting Protocols
Parasite culture methods
An in-house glycerol stock of L. major MHOM/SA/85/JISH118 promastigotes (passage 1), was
cultivated in 5 ml Schneider's insect medium, supplemented with 10% fetal bovine serum (FBS), in a
small tissue culture flask. The culture was left to incubate at 26°C and counted daily. By day 2, an
aliquot containing 2.32 x 10⁷ parasites/ml was expanded 1:10 into 10 ml of Schneider's insect medium
(with 10% FBS) in a new culture flask. Culture was further incubated at 26°C and counted daily until
parasites had stopped expanding and remained stationary, by day 6. Final parasite count on day 6 was
3.14 x 10⁸ parasites in 10 ml (passage 2). An aliquot of 2 ml was taken and centrifuged at 2,400 rpm for
5 mins. Supernatant was discarded and pellet was resuspended in Schneider’s medium without FBS to
a final concentration of 2 x 10⁷, used for in vivo infection. Final volume for infection inocula was
100 µl per mouse, containing 2 x 10⁶ stationary-phase L. major promastigotes.
Fecal preparation for 1H NMR
Fecal preparation based on protocols for tissue metabolite extraction by Beckonert et al., 200723, with
following modifications: methanol/chloroform/water solvent mixture was added via a 1:1:0.7125 ratio,
using half the amount of fecal mass (~50 mg) for the same volume of solvents as for tissues. This was
followed by a homogenisation step with 1 mm Zirconia beads (BioSpec Products Inc.) using a
Precellys® 24 Tissue homogenizer (Bertin Technologies).

56
1H NMR Data Acquisition Settings
Acquisition for all samples was performed using a standard one-dimensional pulse program, which
included water irradiation during the recycle delay (set at 2 sec). The pulse sequence was as follows:
recycle delay-90°-t-90°-tm-90°-ACQ, whereby 90° pulse length was set to between 11-16.5 μs
(depending on biological matrix), t= short delay set to 2 seconds, tm= mixing time set to 100 ms and
ACQ = data acquisition period at 2.73 seconds per scan. Number of dummy scans was 8 for all
samples, followed by 128 acquisition scans of 1H-free induction decays (FIDs) for tissue and fecal
extracts or 256 scans for plasma and urine samples, using a 20 ppm window. Additionally, a Carr-
Purcell Meibom-Gill (CPMG) pulse sequence was applied to the plasma samples (256 scans) to further
examine peaks from metabolites with small molecular weight. The FIDs were multiplied by an
exponential function with a 0.3 Hz line broadening prior to Fourier transformation, used for spectral
processing and analyses.
Fecal preparation for Microbiota Diversity Analysis
Fecal samples were washed twice in PBS to remove formalin, followed by DNA extraction using
QIAmp Stool Mini Kit (QIAGEN) based on manufacturer’s instructions. Minor protocol amendments
included a 0.1 mm Zirconia bead-beating homogenisation step of samples in ASL buffer via the
Precellys® 24 homogenizer. Proteinase K was increased to 35 μl per sample, and both ASL and AL
incubation times were increased to 20 mins (at 95°C for ASL). Final DNA was eluted in 2 x 50 μl AE
buffer and DNA concentration was quantified using Nanodrop® (ND-1000, Thermo Scientific).