Meta-regression in Stata - Timberlake Consultants€¦ · · 2015-07-23Meta-regression in Stata...
54
Meta-regression in Stata: metareg 2010 UK Stata Users Group Meeting 10 September, LSHTM, London Roger Harbord
Transcript of Meta-regression in Stata - Timberlake Consultants€¦ · · 2015-07-23Meta-regression in Stata...

Meta-regression in Stata:
metareg
2010 UK Stata Users Group Meeting
10 September, LSHTM, London
Roger Harbord

Acknowledgements
• Stephen Sharp
(MRC Epidemiology
Unit, Cambridge, UK)
• Julian Higgins
• Simon Thompson
(MRC Biostatistics Unit,
Cambridge, UK)

Example: exercise for depression
-2 -1 0 1
Study
Mutrie
McNeil
Reuter
Doyne
Hess-Homeier
Epstein
Martinsen
Singh
Klein
Veale
Favours exercise
Standardized mean difference
Favours control
Estimates and 95% confidence intervals
Lawlor DA, Hopker SW.
BMJ 2001; 322: 763-7

Meta-regression to compare
subgroups
• Assumes the between-study variance 2 is the same in
all subgroups
• Sensible when some or all subgroups have few studies
• Estimates the difference in treatment effect between
subgroups
• Example: Long duration vs. short duration
Difference in SMD = 0.5 (95%CI: –0.5 to 1.5), p = 0.32
• longer duration trials have a less negative SMD
• i.e. treatment effect is smaller in long duration trials
• Weak statistical evidence for this being a true effect
• but dichotomization reduces statistical power
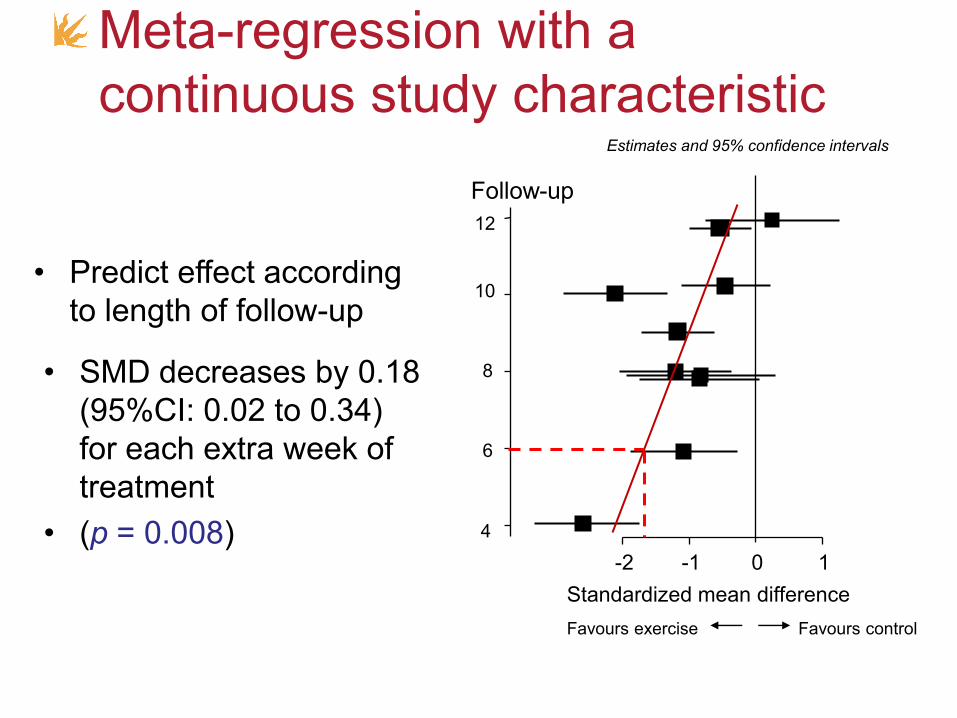
Meta-regression with a
continuous study characteristic
-2 -1 0 1
Favours exercise
Standardized mean difference
Favours control
Estimates and 95% confidence intervals
4
12
8
10
6
Follow-up
• Predict effect according
to length of follow-up
• SMD decreases by 0.18
(95%CI: 0.02 to 0.34)
for each extra week of
treatment
• (p = 0.008)

‗Bubble plots‘Circle sizes vary with inverse of within-study variance
(weight in a fixed-effect meta-analysis)
Has effectiveness of fluoride gels changed over time? Marinho et al (2004)
-1-.
50
.51
Pre
ve
nte
d fra
ctio
n
1960 1970 1980 1990 2000
Year

Problems and pitfalls
• Choice of explanatory variables and
spurious findings
• Confounding by study-level characteristics
• Lack of power
• Aggregation bias (ecological bias)

Further reading
For more on planning and interpretation of meta-
regression analyses see:
• Thompson S & Higgins JPT Statistics in Medicine 2002
• Higgins & Thompson Statistics in Medicine 2004
• Thompson & Higgins The Lancet 2005

Meta-regression in Stata
• metareg was originally written by Stephen
Sharp in 1998 (sbe23 in STB 42)
• Rewritten by me from 2004 onwards
• To install, type findit metareg in Stata
• For more explanation and discussion, seeHarbord & Higgins Stata Journal 2008; 8(4):493-519

My enhancements to metareg• Improved algorithm for the estimation of the between-
study variance, τ², by residual max. likelihood (REML)
• Modification to the calculation of SEs, p-values, and Cis
for coefficients suggested by Knapp and Hartung (2003)
• Various enhancements to the output
• Optional graph of the fitted model with a single covariate
• Option to calculate permutation-based p-values,
including an adjustment for multiple testing based on the
work of Higgins and Thompson (2004)
• Support for many of Stata‘s postestimation commands,
including predict

Possible future extensions
• I consider metareg to be fairly mature, but there
are a couple of possible extensions:
• Restricted iterative generalized least squares
(RIGLS) is equivalent to REML (Goldstein
Biometrika 1989) — option for when REML fails?
• Hedges, Tipton & Johnson (Research Synthesis
Methods 2010) investigate use of cluster-robust
variance estimation for dependent study results.

Meta-analysis of diagnostic test
accuracy studies: metandi & midas
2010 UK Stata Users Group Meeting
10 September, LSHTM, London
Roger Harbord

Acknowledgements
• Penny Whiting
• Jonathan Sterne
• MRC (grant no. G0801405)
• Petra Macaskill
• Constantine Gatsonis
• Jon Deeks
• Joseph Coveney
• Sophia Rabe-Hesketh
• Susan Mallett

Outline
• Diagnostic test accuracy (DTA)
• Study design
• Measures
• Methods for meta-analysis of DTA
• Simple methods
• Hierarchical models
• Software for meta-analysis of DTA
• Stata: metandi and midas

Basic Test Accuracy Study
Series of patientsSeries of patients
Index testIndex test
Reference standardReference standard
Blinded CrossBlinded Cross--classificationclassification

Measures of diagnostic
accuracy

TP
TP + FN
TN
TN + FP
a
a + c
d
d + b
Sensitivity =
Specificity =
=
=
Sensitivity and Specificity
Sensitivity and Specificity• Computed along the columns of the 2x2 table:
• The proportion of those with the condition who have positive test results
• The proportion of those without the condition who have negative test results
• Clinically not directly useable
• In theory not influenced by the prevalence of the target condition – in practice they are
• Will often vary across populations due to differences in patient spectrum
• Values depend on choice of thresholds

LR+: True positive rate = Sensitivity
False positive rate 1-Specificity
LR-: False negative rate = 1- Sensitivity
True negative rate Specificity
Likelihood ratios

Likelihood ratios
• Tell us how many times more likely a test result is to be expected in a person with compared to a person without the disease
• Gives direct information on the power of a test to rule in / rule out a condition
• Allows the calculation of post-test probabilities from pre-test probabilities:• Post-test Odds= Pre-test Odds x LR

TP FN
FP TN=
sens (1-sens)
(1-spec) specDOR = =
LR +
LR -
Diagnostic odds ratio
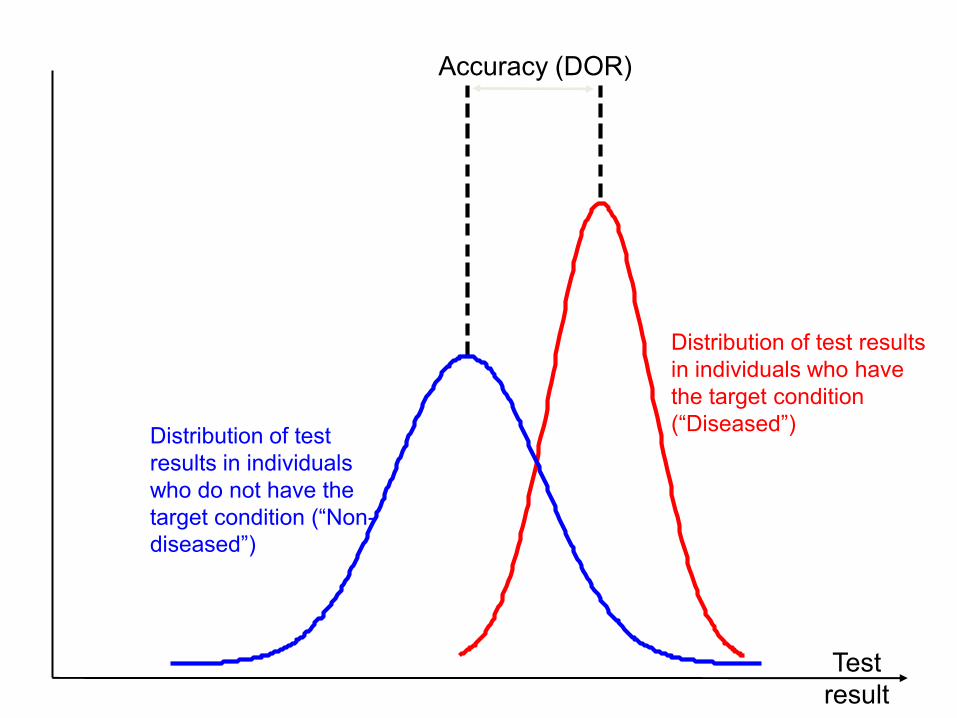
Accuracy (DOR)
Distribution of test results
in individuals who have
the target condition
(―Diseased‖)Distribution of test
results in individuals
who do not have the
target condition (―Non-
diseased‖)
Test
result

Diagnostic odds ratio (DOR)
• Overall measure of diagnostic accuracy
• Not useful in clinical practice since it doesn‘t tell us
the implications of positive and negative results

What‘s different about meta-analysis
of diagnostic studies?
• Observational – not randomized, not balanced
• Odds ratios are often huge (100 or more)
• Studies are often small
• Vary widely in design, reporting and risk of bias
• Substantial statistical heterogeneity is usual
• Need to estimate two parameters:
sensitivity and specificity
• These are typically negatively correlated
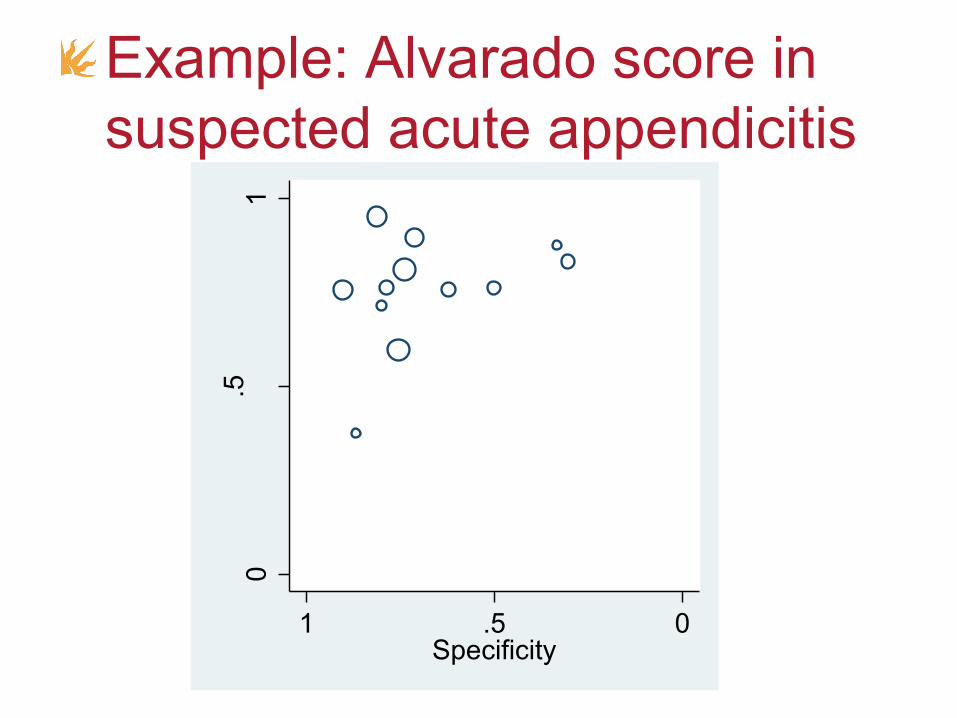
0.5
1
Sen
sitiv
ity
0.51Specificity
Example: Alvarado score in
suspected acute appendicitis
• Chance (sampling variation)
• Threshold effects
• Study quality
Variability between study
results

Diseased
Non-diseased
Threshold

Diseased
Non-diseased
Threshold
Increase specificity, decrease sensitivity

Diseased
Non-diseased
Threshold
Increase sensitivity, decrease specificity
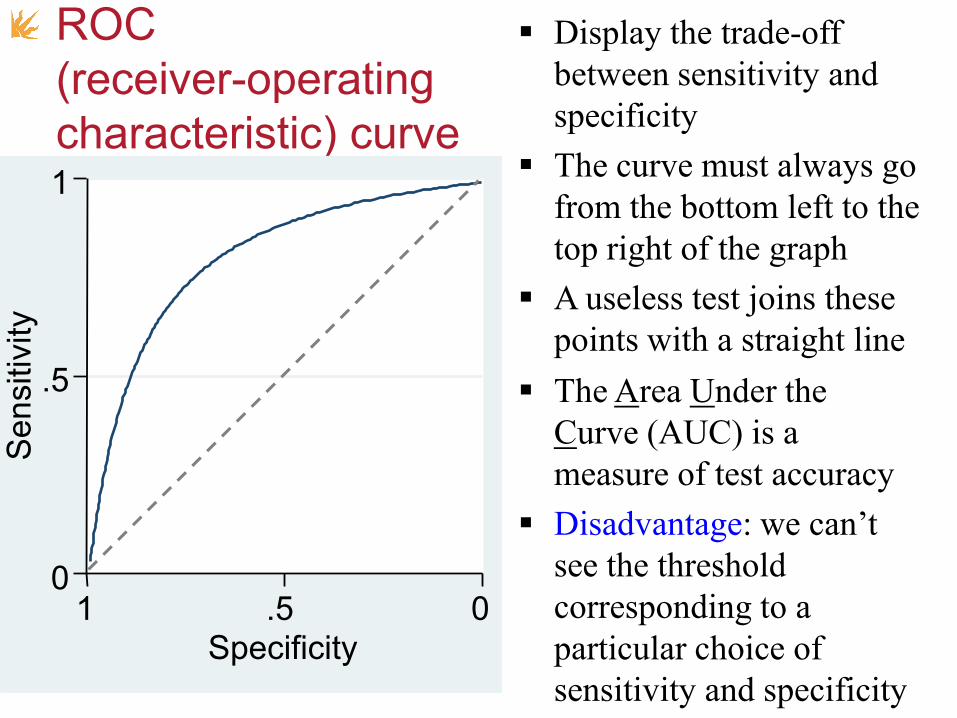
ROC
(receiver-operating
characteristic) curve
0
.5
1
Sen
sitiv
ity
0.51
Specificity
Display the trade-off
between sensitivity and
specificity
The curve must always go
from the bottom left to the
top right of the graph
The Area Under the
Curve (AUC) is a
measure of test accuracy
Disadvantage: we can’t
see the threshold
corresponding to a
particular choice of
sensitivity and specificity
A useless test joins these
points with a straight line

0
.5
1
Se
ns
0.51Spec
0
.5
1
Se
ns
0.51Spec
ROC curve: increase accuracy
0
.5
1
Se
ns
0.51Spec

0
.5
1
Se
ns
0.51Spec
ROC curve: Change shape
parameter (different variances)
0
.5
1
Se
ns
0.51Spec
0
.5
1
Se
ns
0.51Spec
0
.5
1
Se
ns
0.51Spec

0
.5
1
Se
nsitiv
ity
0.51Specificity
ROC plot – single study
threshold
shape
accuracy

Meta-analysis of Dx accuracy:
What methods are available?All based on 2×2 table from each study
• Easily implemented methods:• M-A of (Diagnostic) Odds Ratios (DORs)
• Separate M-A of Sensitivity & Specificity
• Moses-Littenberg Summary ROC (SROC) curve
• Hierarchical models:• Hierarchical Summary ROC curve (HSROC) model
• Bivariate random-effects meta-analysisGatsonis & Paliwal, Am. J. Roentgenol. 2006; 187:271-288Leeflang et al. Annals Int. Med. 2008; 149:889-897.
Hierarchical models
• Recommended for formal statistical
inference (CIs, p-values…)
• 2 forms:
• Hierarchical Summary ROC (HSROC)
• Bivariate model
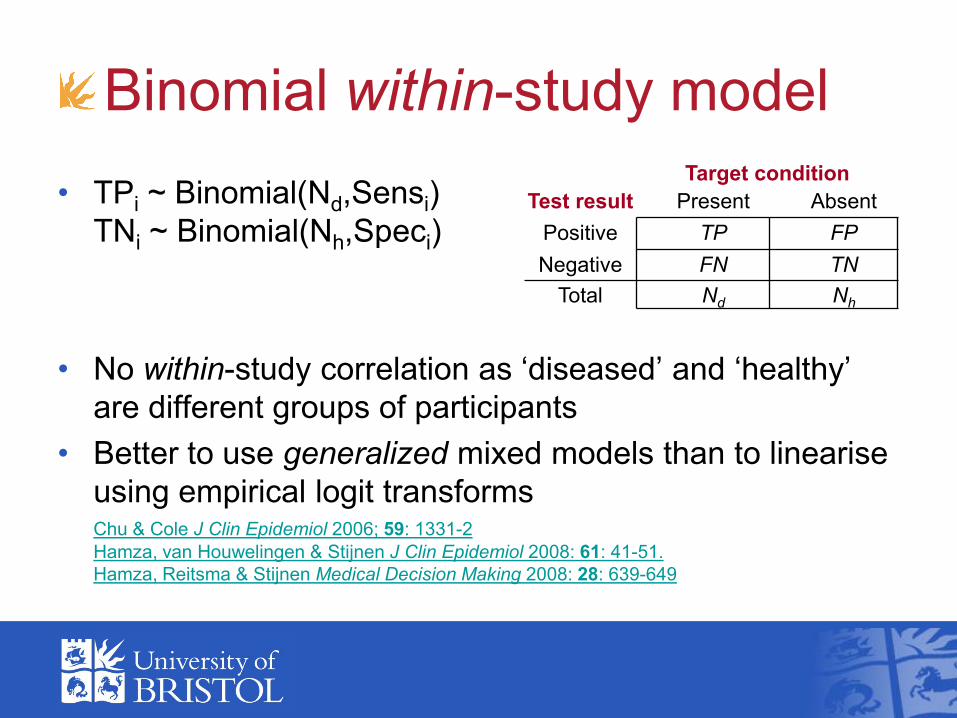
Binomial within-study model
• TPi ~ Binomial(Nd,Sensi)
TNi ~ Binomial(Nh,Speci)
• No within-study correlation as ‗diseased‘ and ‗healthy‘
are different groups of participants
• Better to use generalized mixed models than to linearise
using empirical logit transformsChu & Cole J Clin Epidemiol 2006; 59: 1331-2
Hamza, van Houwelingen & Stijnen J Clin Epidemiol 2008: 61: 41-51.
Hamza, Reitsma & Stijnen Medical Decision Making 2008: 28: 639-649
Target condition
Test result Present Absent
Positive TP FP
Negative FN TN
Total Nd Nh

0
.5
1
Se
nsitiv
ity
0.51Specificity
HSROC modelsummary ROC plot
accuracythreshold
shape
5 parameters:
Mean + variance
of both accuracy
& threshold
Shape (scale,
asymmetry)
parameter
Rutter & Gatsonis.
Statist. Med. 2001;
20:2865-84

Bivariate model
• Based on logit-transform of sensitivity and
specificity
• van Houwelingen et al. Statist. Med. 2002; 21: 589-624
• Reitsma et al. J. Clin. Epidemiol. 2005; 58: 982-990

-4
-2
0
2
4
log
it(S
en
s)
.01
.1
.5
.9
.99
Se
ns
-4-2024logit(Spec)
.01.1.5.9.99Spec
-4
-2
0
2
4
log
it(S
en
s)
.01
.1
.5
.9
.99
Se
ns
-4-2024logit(Spec)
.01.1.5.9.99Spec
Bivariate model
5 parameters:
Mean & variance
of logit(Sens) &
logit(Spec)
+ correlation
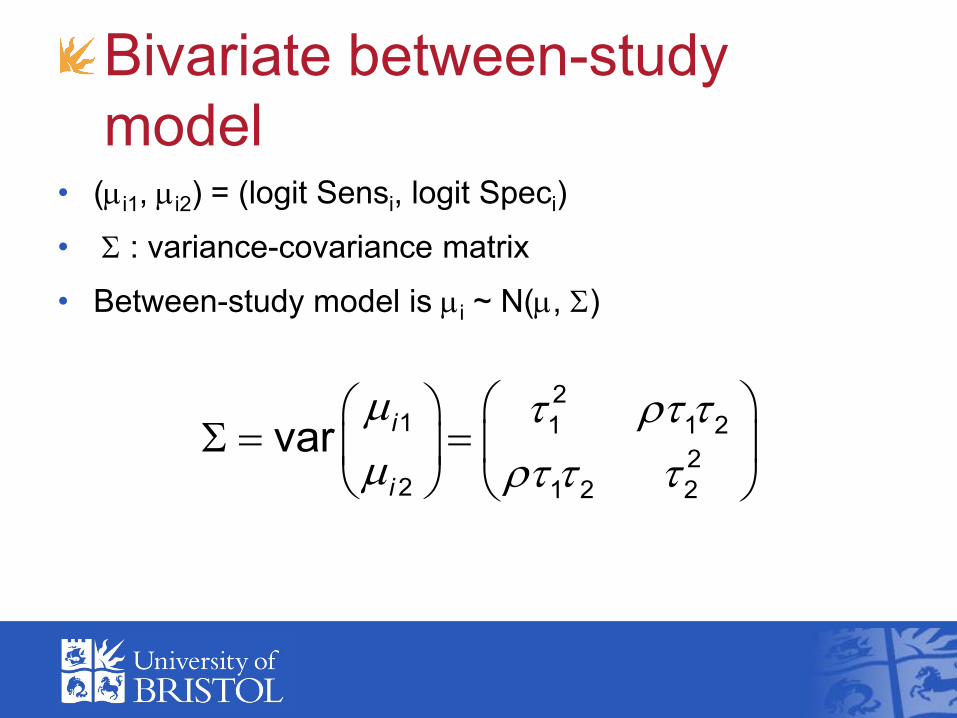
Bivariate between-study
model• (mi1, mi2) = (logit Sensi, logit Speci)
• S : variance-covariance matrix
• Between-study model is mi ~ N(m, S)
m
m
S
21 1 1 2
22 1 2 2
vari
i

How are the hierarchical
models related?
• Without study-level covariates,
the HSROC and bivariate models are
precisely the same
– just different parameterisations
• Harbord, Deeks, Egger, Whiting & Sterne Biostatistics 2007; 8: 239-251
• Arends, Hamza, van Houwelingen, Heijenbrok-Kal, Hunink & Stijnen
Medical Decision Making 2008; 28:621-638

How are the hierarchical
models related?
• Can allow a covariate to affect:
• bivariate model: sensitivity or specificity
• HSROC model: threshold or accuracy
• If a covariate affects both, models are
equivalent
• Only the HSROC model can also allow a
covariate to affect shape

Comparison
Bivariate HSROC
Coordinates Sensitivity &
Specificity (logit-transformed)
Accuracy &
Precision
Usual
interpretation
Summary point
and region
Summary
ROC curve

Model outputs
Can get same point,
line and regions
from either HSROC
or bivariate
parameter estimates
0
.25
.5
.75
1
Se
nsitiv
ity
0.25.5.751Specificity
SROC curve
95% confidence region
95% prediction region

Interpretation
• Summary point is meaningful if:
• Threshold is similar in all studies
• Between-study heterogeneity is modest
• Summary curve is meaningful if
threshold chosen at random(Arends & Stijnen 2008; conference presentation)
• I recommend prediction regions to indicate
heterogeneity visually
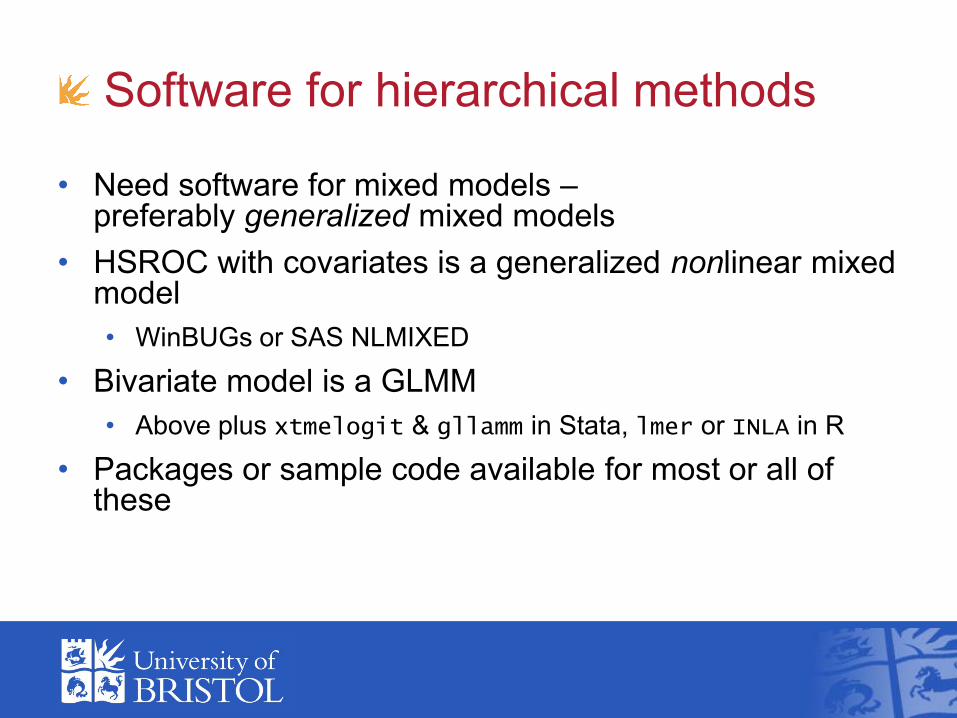
Software for hierarchical methods
• Need software for mixed models –preferably generalized mixed models
• HSROC with covariates is a generalized nonlinear mixed model
• WinBUGs or SAS NLMIXED
• Bivariate model is a GLMM
• Above plus xtmelogit & gllamm in Stata, lmer or INLA in R
• Packages or sample code available for most or all of these

metandi
• Harbord & Whiting Stata Journal 2009; 9: 211-229
(type findit metandi within Stata)
• Fits bivariate model using xtmelogit or gllamm
• xtmelogit
• Requires Stata 10 or above
• Fast
• gllamm
• Slower
• Sometimes more reliable?

Features of metandi
• Command has a simple syntax
• Package includes (several) help-files
• Easy to generate a default plot
• Plot can be customized using metandiplot
• Post-estimation facilities for model-checking and
identification of influential studies
• Does not handle covariates (yet)

midas
• By Ben Dwamena, University of Michigan
• Available from SSC
• SJ-style paper recently added to package
• Fits bivariate model using xtmelogit or gllamm
• Additionally provides many other analyses and
plots: Model checking plots, study quality tables & charts, Forest
plots of Sens & Spec, Deeks‘ test for study-size effects, Galbraith
plot, Fagan nomogram, probability updating curve, LR scatter plot ...

Comparison
metandi
• Concentrates on
hierarchical model
• Text output formatted as
standard for Stata
estimation command
• e-class, supports post-
estimation commands
including predict
midas
• Comprehensive range of
facilities for diagnostic
test meta-analysis
• Text output formatting
somewhat ad-hoc
• r-class

Demonstration
Few studies
What to do when there are < 4 studies?
• Not enough to fit hierarchical models with all 5 parameters by maximum likelihood
~

Few studies: approaches
• Just plot individual study estimates
• M-A of ORs
• Separate univariate M-A of Sens & Spec
• Fit 4-parameter model by assuming equal between-study variances, giving symmetric SROC curve
• Use Bayesian approach with (weakly) informative priors for variance parameters

Future extensions to metandi
• Univariate M-A and symmetric model
(implemented in unreleased version)
• Allow one (or more?) covariates
• Interface to R package INLA (Integrated
Nested Laplace Approximations) to allow
Bayesian approach?Paul M, Riebler A, Bachmann LM, Rue H, Held L. Statistics in Medicine
2010; 29(12):1325-1339