Mesopic vision model and its application János Schanda Virtual Environments and Imaging...
42
Mesopic vision model and its application János Schanda Virtual Environments and Imaging Technologies Laboratory University of Pannonia
-
Upload
mikel-grimshaw -
Category
Documents
-
view
218 -
download
2
Transcript of Mesopic vision model and its application János Schanda Virtual Environments and Imaging...
Mesopic vision model and its
application
János Schanda Virtual Environments and Imaging
Technologies Laboratory
University of Pannonia
Overview
Mesopic vision fundamentals The five photosensitive cells in the
human retina Luminance type and brightness type
description The CIE TC 1-69 mesopic model Examples of application
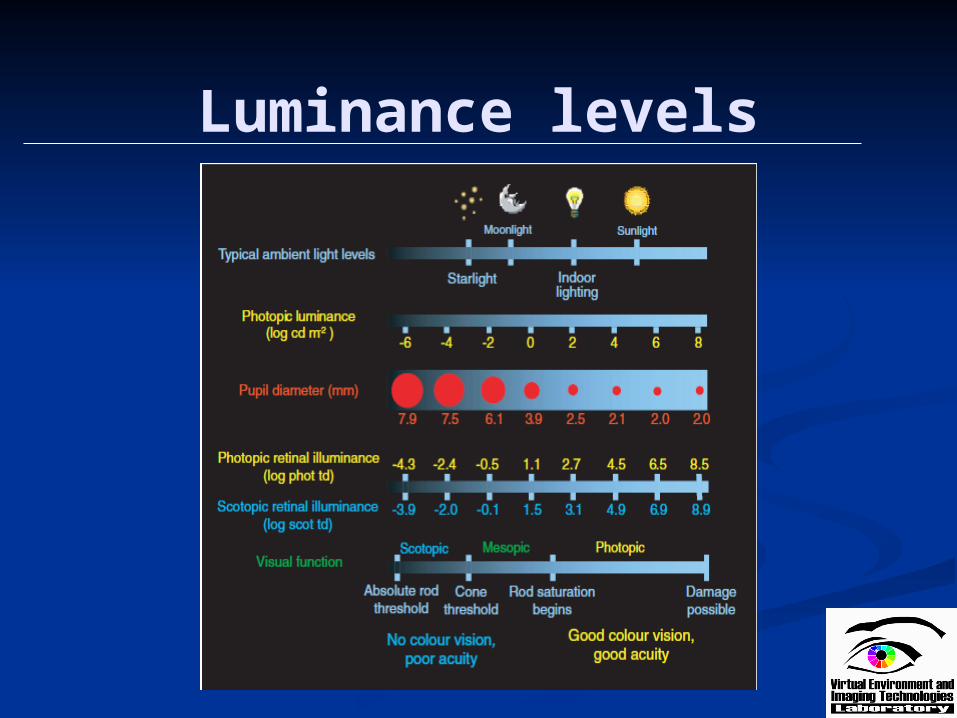
Luminance levels

Mesopic vision
Classical interpretation Daylight: photopic –
cones Dark adaptation:
scotopic – rods Twilight vision:
mesopic – cones + rods
Present day knowledge Foveal vision:
photopic Pupil diameter:
intrinsically photosensitive Retinal Ganglion Cells (ipRGC)?
Difference between perception and detection
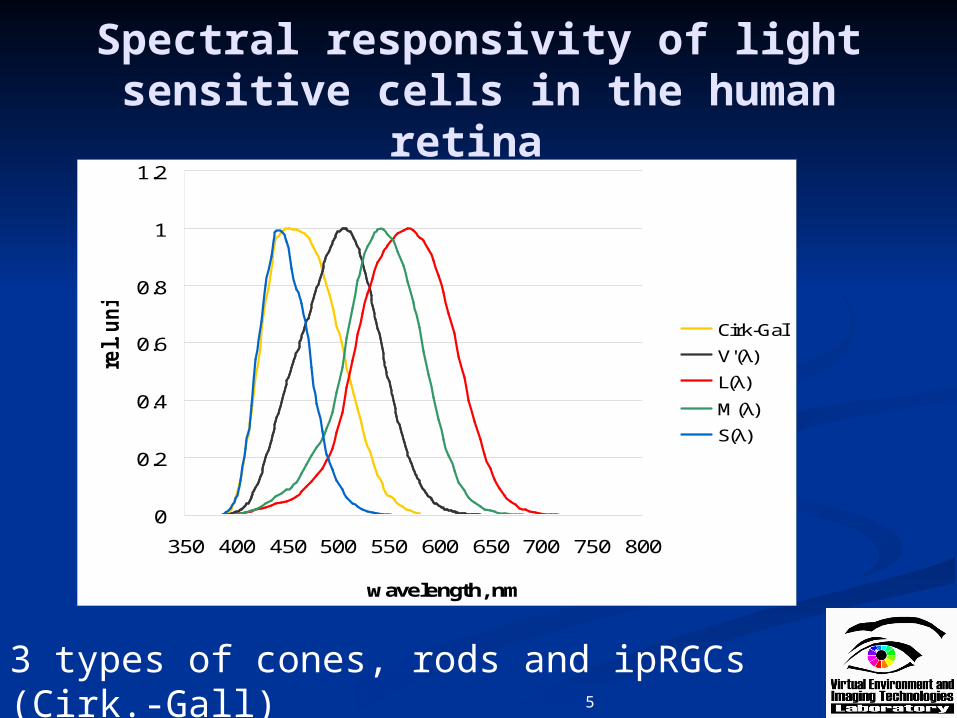
Spectral responsivity of light sensitive cells in the human retina
5
3 types of cones, rods and ipRGCs (Cirk.-Gall)
0
0.2
0.4
0.6
0.8
1
1.2
350 400 450 500 550 600 650 700 750 800
wavelength, nm
rel.
un
its
Cirk-Gall
V'(λ)
L(λ)
M(λ)
S(λ)
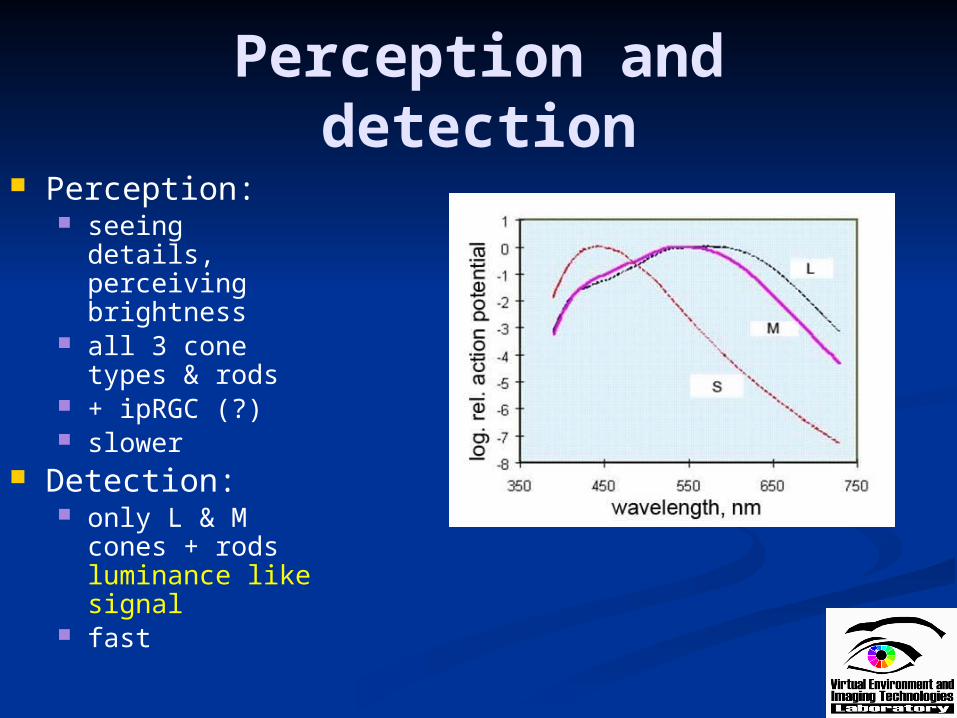
Perception and detection Perception:
seeing details, perceiving brightness
all 3 cone types & rods
+ ipRGC (?) slower
Detection: only L & M cones
+ rodsluminance like signal
fast
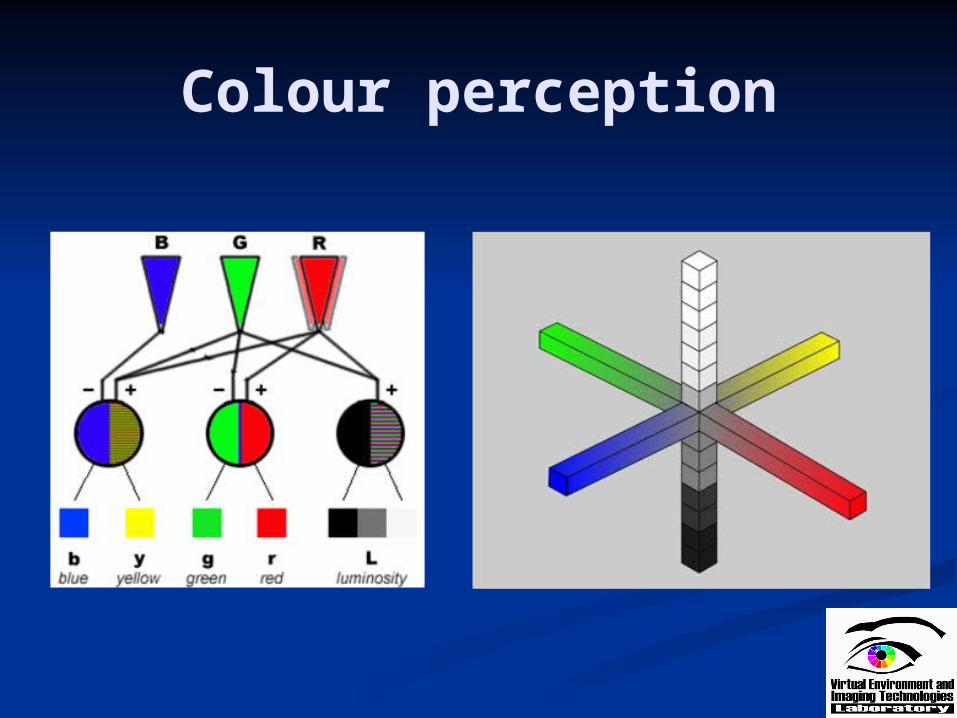
Colour perception

Historic overview
The two stumbling blocks of mesopic photometry: Purkinje shift
rod and cone interaction transition from cone to rod sp.resp. differs
from Purkinje shift Helmhotz-Kohlrausch effect
difference between luminance and brightness

Early investigations
Fovea: only cones Luminance like:
rapid, contrast Brightness +
colour: slower mechanism
Peripheric vision: rods + cones In mesopic the
influence of rods increases
Abramov-Gordon
-4
-3.5
-3
-2.5
-2
-1.5
-1
-0.5
0
400 500 600 700
wavelength, nm
log
. se
nsi
tivi
ty
5', foveal
1.5°, foveal
1.5°, Exc.:45°
6.5°, Exc.:45°
Stiles-Crawford (1935)
1.5
2
2.5
3
3.5
4
4.5
5
400 500 600 700
wavelength, nm
log
. re
l. s
ensi
tivi
ty
foveal
Exc.: 5°
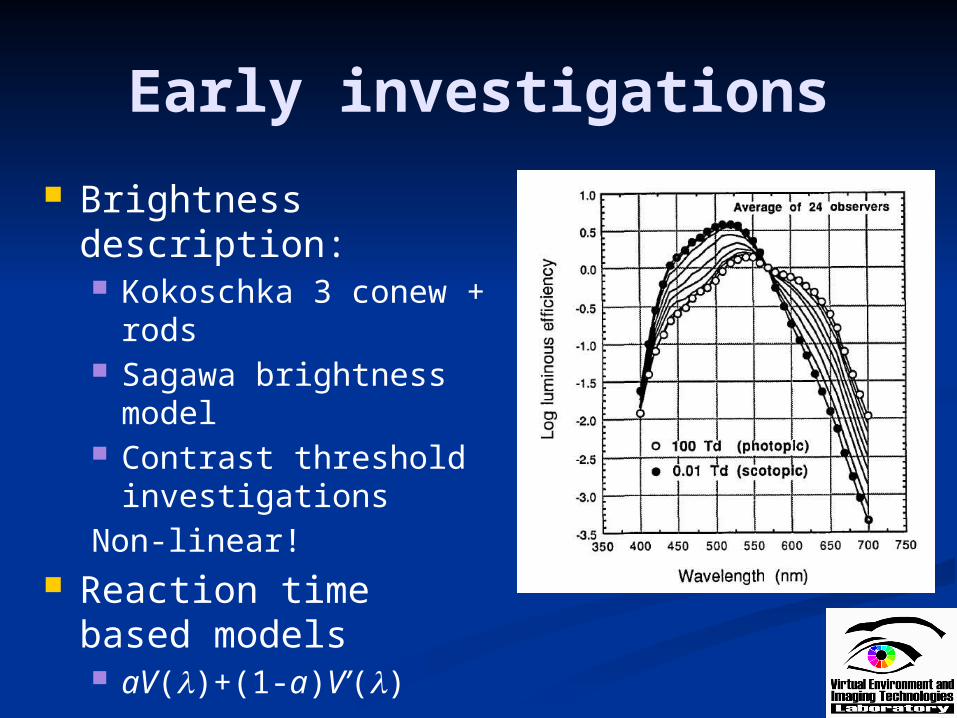
Early investigations
Brightness description: Kokoschka 3 conew +
rods Sagawa brightness
model Contrast threshold
investigationsNon-linear!
Reaction time based models aV(l)+(1-a)V’(l)
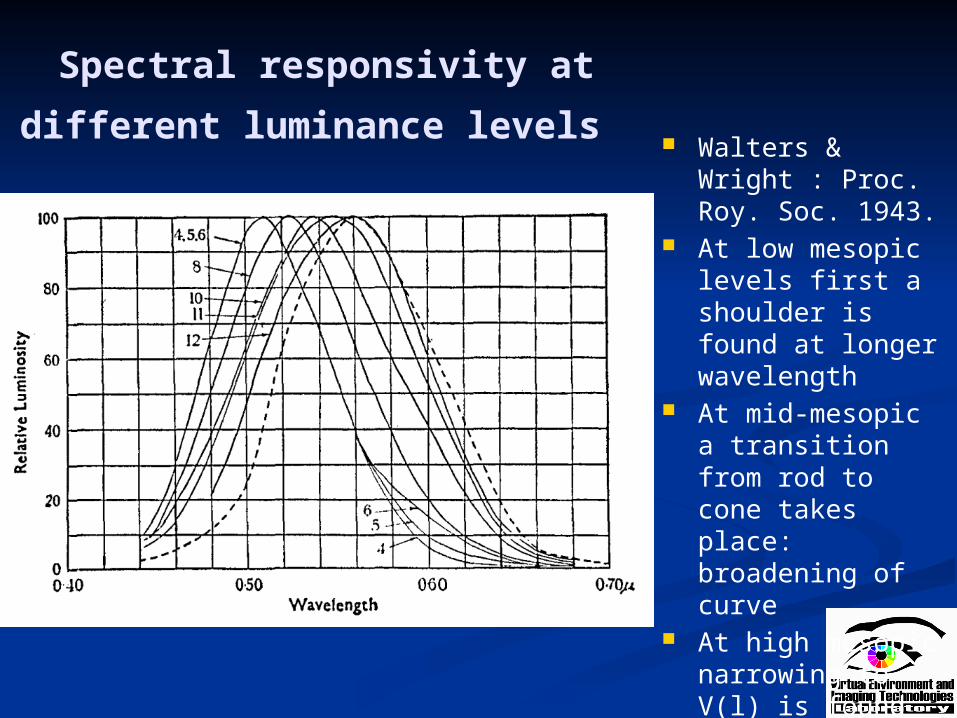
Spectral responsivity at
different luminance levels Walters & Wright :
Proc. Roy. Soc. 1943.
At low mesopic levels first a shoulder is found at longer wavelength
At mid-mesopic a transition from rod to cone takes place: broadening of curve
At high mesopic narrowing to V(l) is found
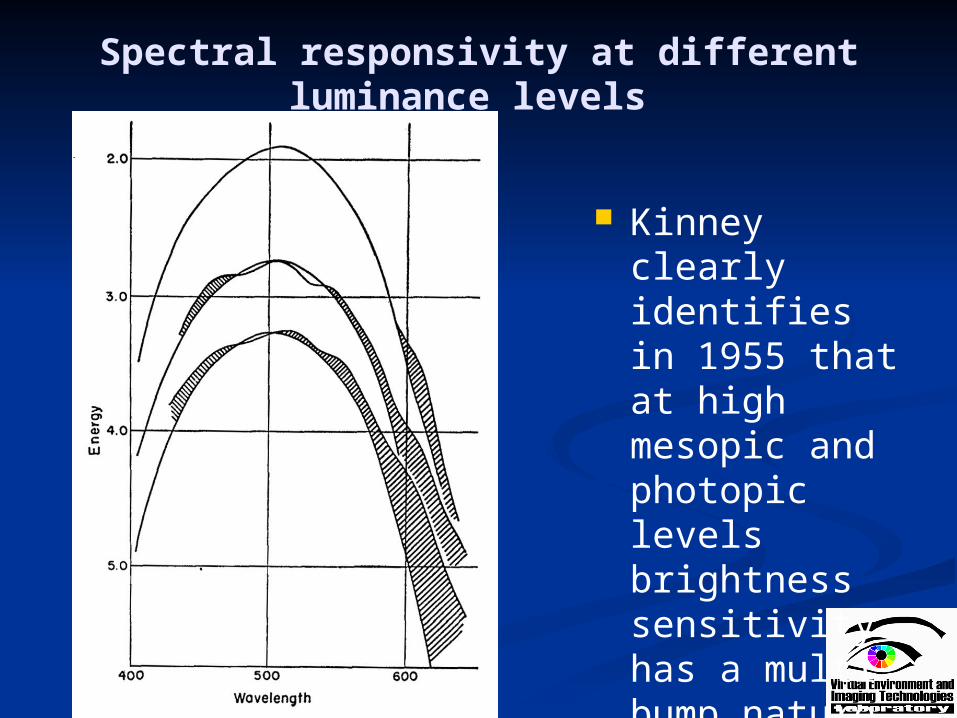
Spectral responsivity at different luminance levels
Kinney clearly identifies in 1955 that at high mesopic and photopic levels brightness sensitivity has a multi bump nature
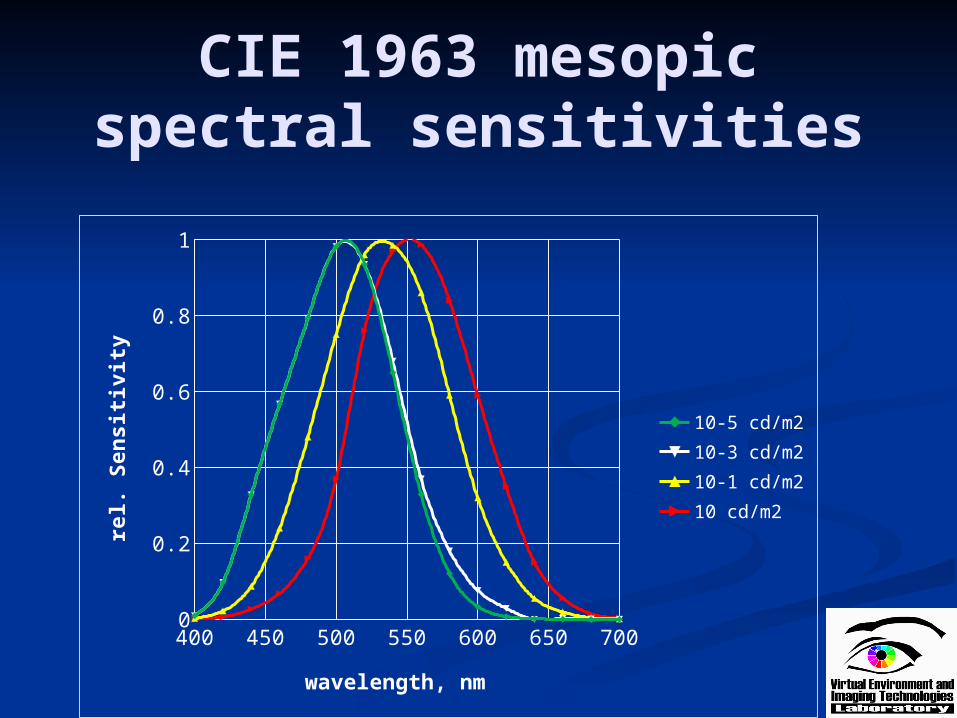
CIE 1963 mesopic spectral sensitivities
400 450 500 550 600 650 7000
0.2
0.4
0.6
0.8
1
10-5 cd/m210-3 cd/m210-1 cd/m210 cd/m2
wavelength, nm
rel.
Sen
siti
vit
y

Brightness perception
Observation Coloured lights
brighter that white (or yellow)
Influence of S cones Rods, even in
daylight ipRGC,
responsible also for the circadian rhythm
Quantitative descriptions of mesopic luminance
Equivalent luminance (CIE 1963):„The equivalent luminance of the field of an arbitrary spectral composition is the standard luminance of another field which has the colour temperature of 2042 K and which in particular photometric conditions seems to be equally bright to the first field.”
Mesopic 2 function brightness scale
Palmer (1966, 1967, 1968): Equivalent luminance (L) for large fields L(S,P)=(MS+P 2)/(M+P)where:
S: scotopic value P: photopic (10°) value M parameter, 6.28 . 10-2 cd/m2 for 15° field
Other models used direct cone brightness functions (e.g. Ikeda & Shimozono, 1981; Nakano & Ikeda, 1986; Sagawa & Takeichi, 1983; modified Palmer formula)
Mesopic 4 function brightness
Helmhotz-Kohlrausch effect: brightness non-additivity, influence of all three cone types Kokoschka model Trezona – Clarke model Problem of transition between
luminance type (photopic) and brightness type (scotopic) experimental data: Viénot et al.
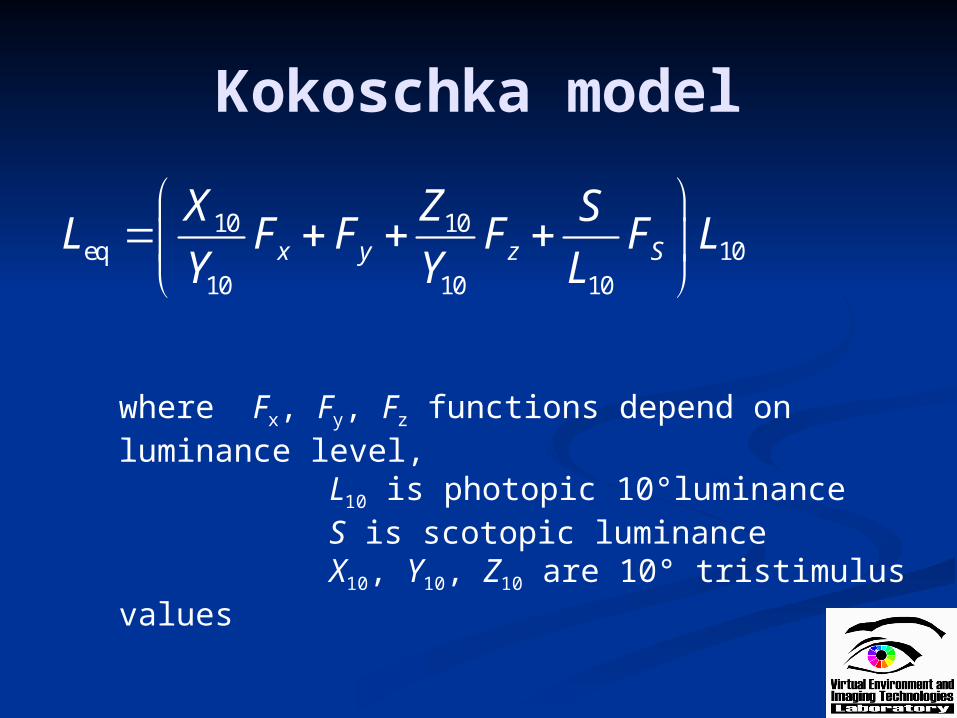
Kokoschka model
10 10eq 10
10 10 10x y z S
X Z SL F F F F L
Y Y L
where Fx, Fy, Fz functions depend on luminance level, L10 is photopic 10°luminance S is scotopic luminance X10, Y10, Z10 are 10° tristimulus values

Mesopic models Lighting Research Center of North America system:
with 0,001 cd/m2 < Lmes < 0,6 cd/m2
MOVE model, based on Ability to detect target Speed of detection Ability to identify details of target
with soft transition to scotopic and photopic at 0,01 cd/m2 < Lmes < 10 cd/m2
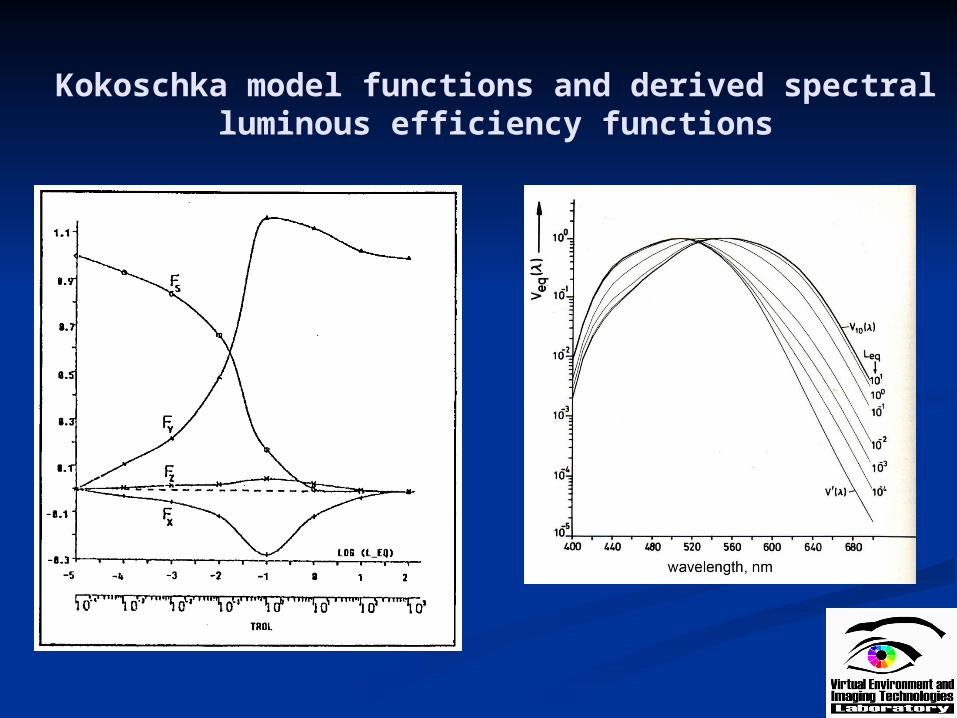
Kokoschka model functions and derived spectral luminous efficiency functions
Brightness/luminance discrepancy & rod/cone interaction + ipRGCs
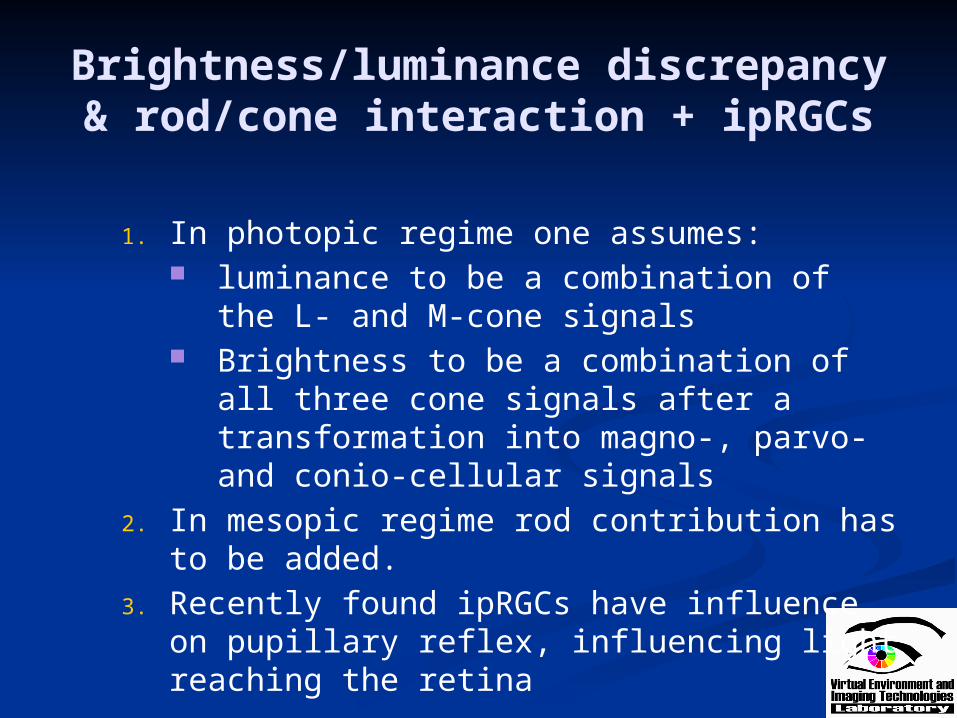
1. In photopic regime one assumes: luminance to be a combination of the L-
and M-cone signals Brightness to be a combination of all
three cone signals after a transformation into magno-, parvo- and conio-cellular signals
2. In mesopic regime rod contribution has to be added.
3. Recently found ipRGCs have influence on pupillary reflex, influencing light reaching the retina

Photopic regime: brightness/luminance
Magnocellular pathway: luminance like
Brightness: all 3 channels
B=(L2+d2+t2)1/2
(Guth model) Influence of
ipRGCs?Different brightness of metameric samples
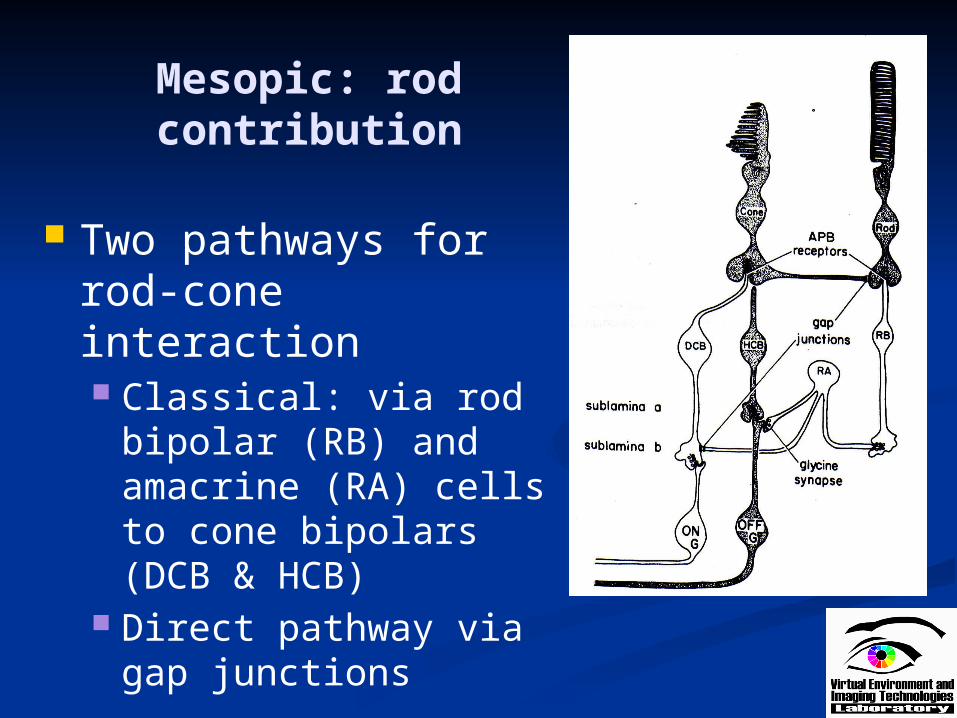
Mesopic: rod contribution
Two pathways for rod-cone interaction Classical: via rod
bipolar (RB) and amacrine (RA) cells to cone bipolars (DCB & HCB)
Direct pathway via gap junctions
From Buck SL: Rod-cone interaction in human vision, The visual neuroscience
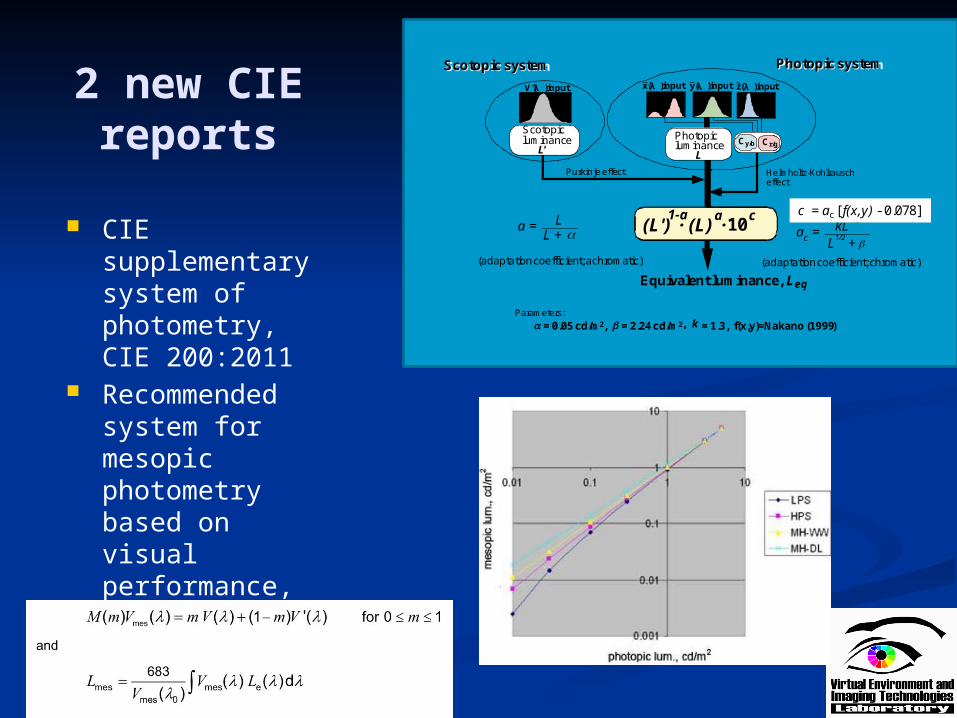
2 new CIE reports
CIE supplementary system of photometry, CIE 200:2011
Recommended system for mesopic photometry based on visual performance, based on MOVE and X-models
Helm holtz-Kohlrauscheffect
Purkinje effect
Equivalent luminance, Leq
a = 0.05 cd/m2, b = 2.24 cd/m2, k = 1.3, f(x,y)=Nakano (1999)Parameters:
a =L + a
L
(adaptation coefficient; achromatic)
Photopic luminance
L
Scotopicluminance
L'
(L') · (L) ·101-a a c
ac =L
1/2+ b
kL1/2
(adaptation coefficient; chromatic)
c =ac · f(x,y)
Cr/gCy/b
Scotopic system Photopic system
V'(λ )input z(λ )inputy(λ )inputx(λ )input
c = ac [ f(x,y) - 0.078]
Detection
Traffic situation Detecting the presence of an obstacle Rapid action necessary
Can be approximated by and additive system Abney’s law holds photometry
possible Should have smooth transition to
photopic and scotopic at the two ends.
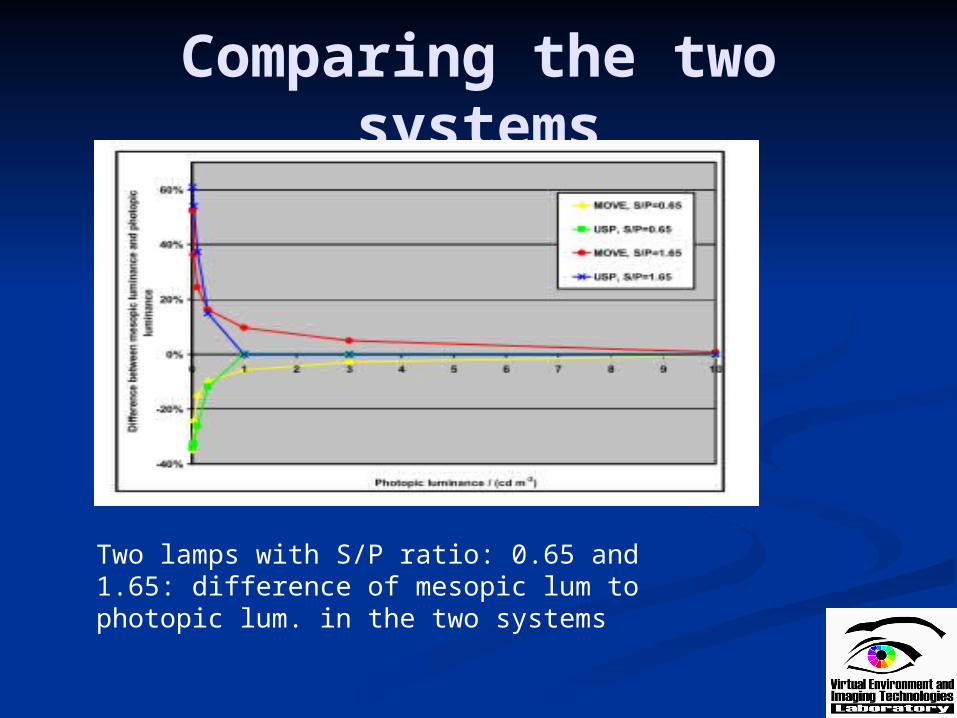
Comparing the two systems
Two lamps with S/P ratio: 0.65 and 1.65: difference of mesopic lum to photopic lum. in the two systems
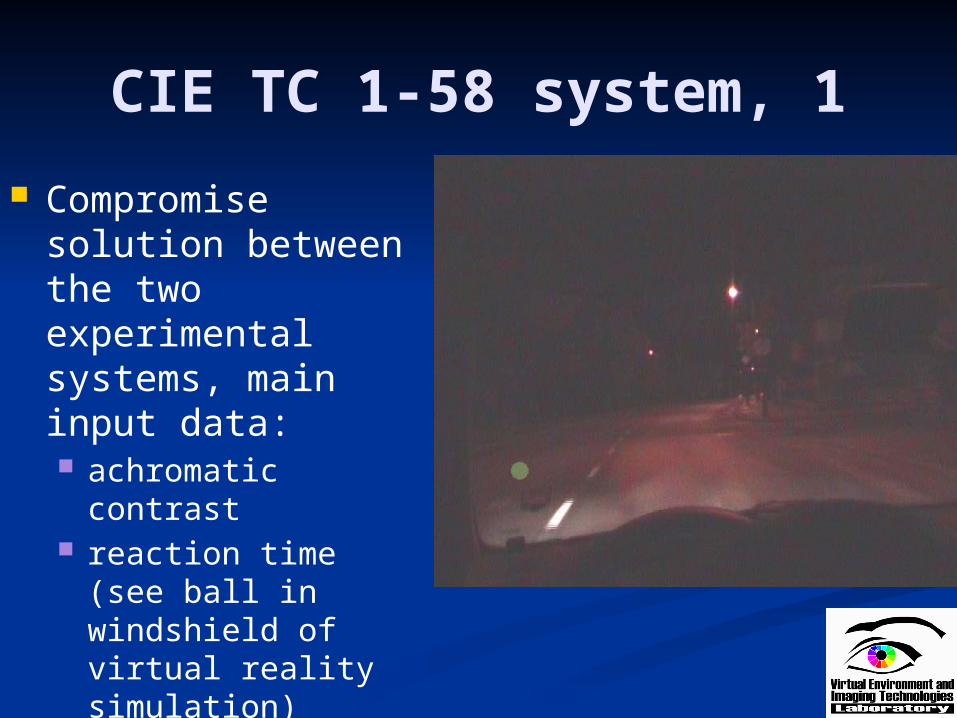
CIE TC 1-58 system, 1
Compromise solution between the two experimental systems, main input data: achromatic contrast reaction time (see
ball in windshield of virtual reality simulation)
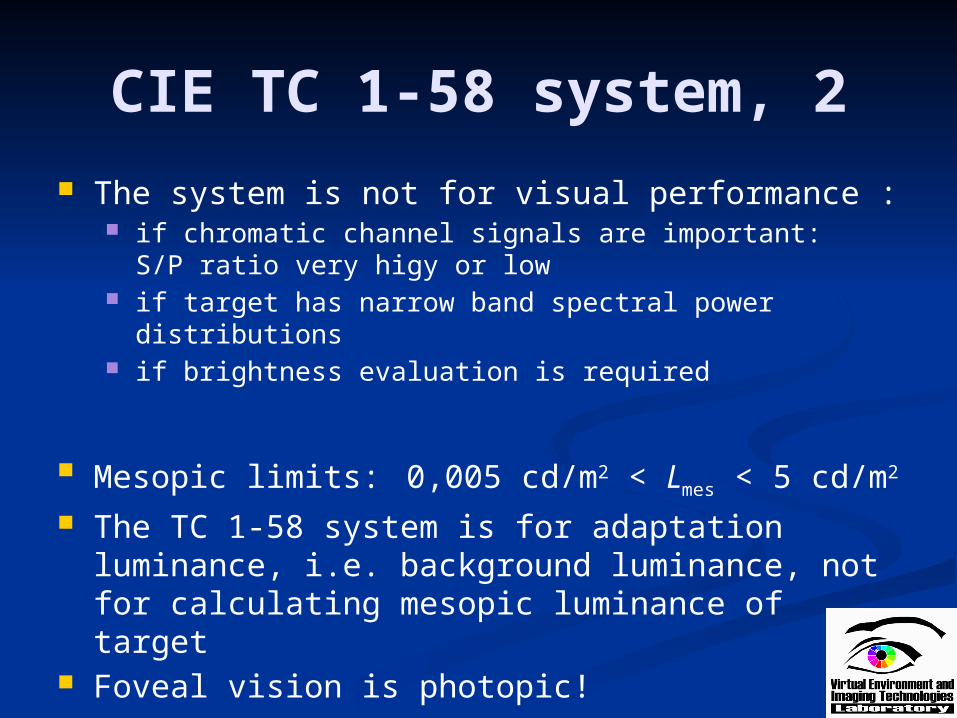
CIE TC 1-58 system, 2 The system is not for visual performance :
if chromatic channel signals are important:S/P ratio very higy or low
if target has narrow band spectral power distributions if brightness evaluation is required
Mesopic limits: 0,005 cd/m2 < Lmes < 5 cd/m2
The TC 1-58 system is for adaptation luminance, i.e. background luminance, not for calculating mesopic luminance of target
Foveal vision is photopic!
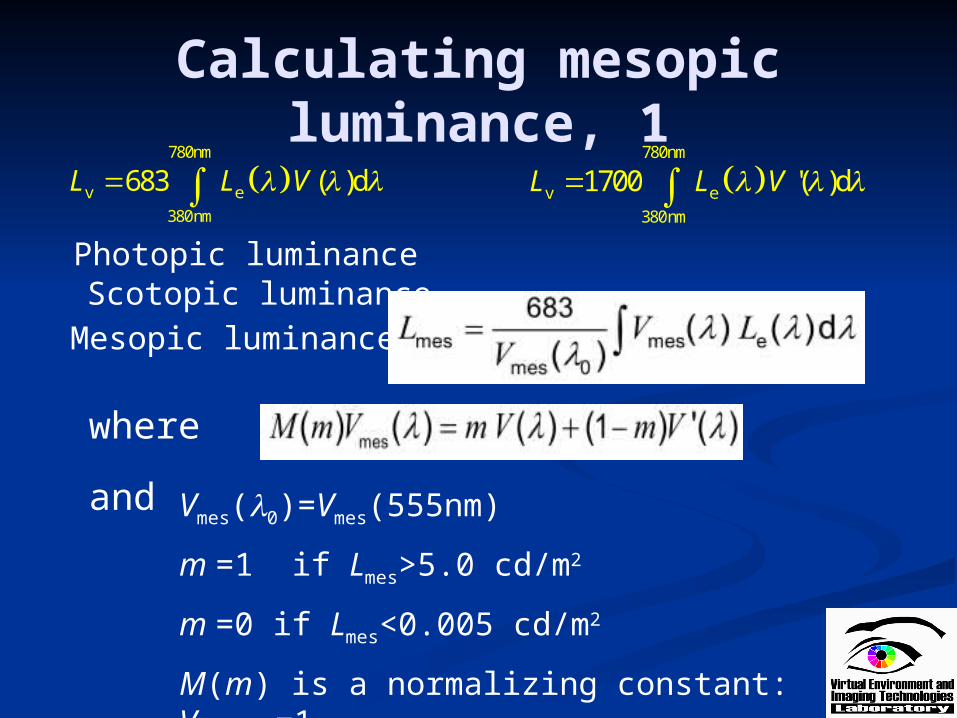
Calculating mesopic luminance, 1
Photopic luminance Scotopic luminance
Mesopic luminance:
780nm
v e
380nm
683 ( )dL L V 780nm
v e
380nm
1700 '( )dL L V
where
and Vmes(l0)=Vmes(555nm)
m =1 if Lmes>5.0 cd/m2
m =0 if Lmes<0.005 cd/m2
M(m) is a normalizing constant: Vmes,max=1

Calculating mesopic luminance, 2
m is calculated using iteration Start with m0=0.5 Calculate Lmes,n from Lmes, n-1:
where
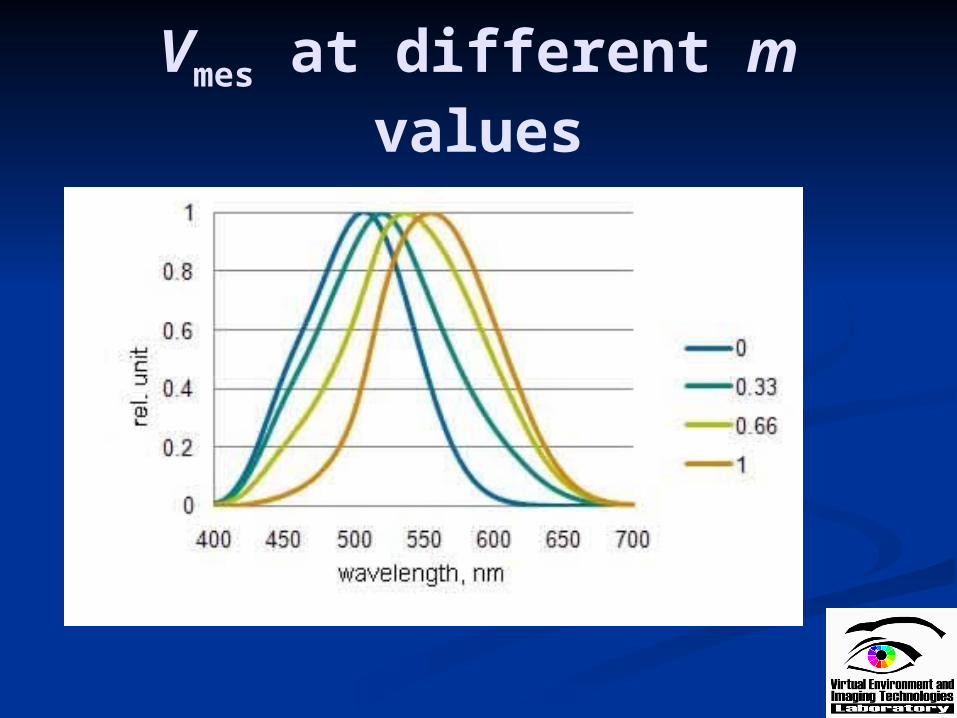
Vmes at different m values
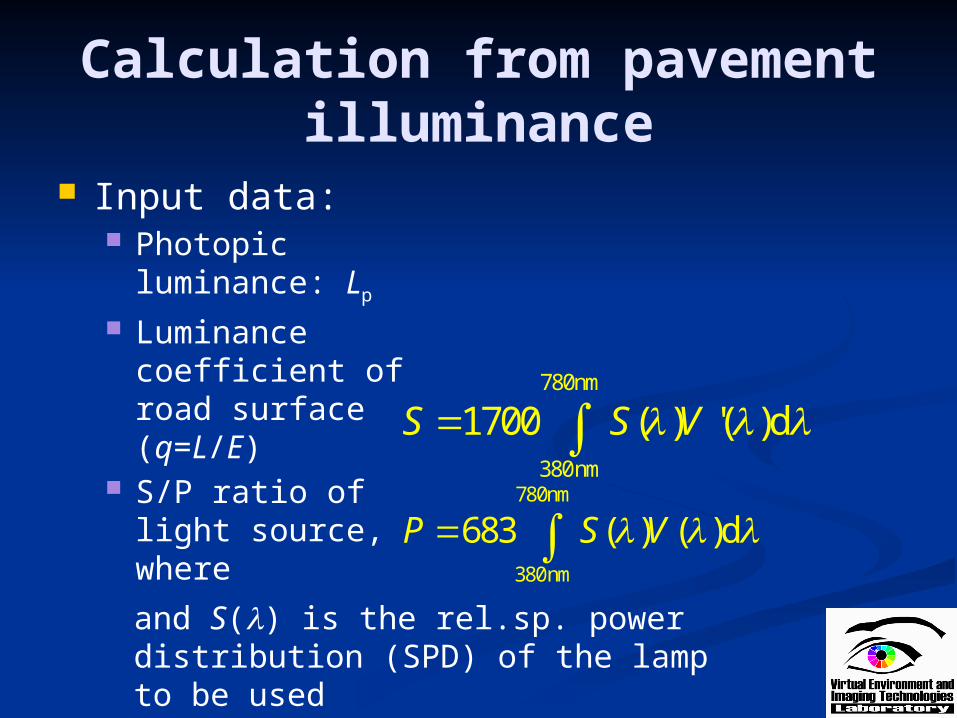
Calculation from pavement illuminance
Input data: Photopic luminance:
Lp
Luminance coefficient of road surface (q=L/E)
S/P ratio of light source, where
780nm
380nm
1700 ( ) '( )dS S V 780nm
380nm
683 ( ) ( )dP S V and S(l) is the rel.sp. power distribution (SPD) of the lamp to be used
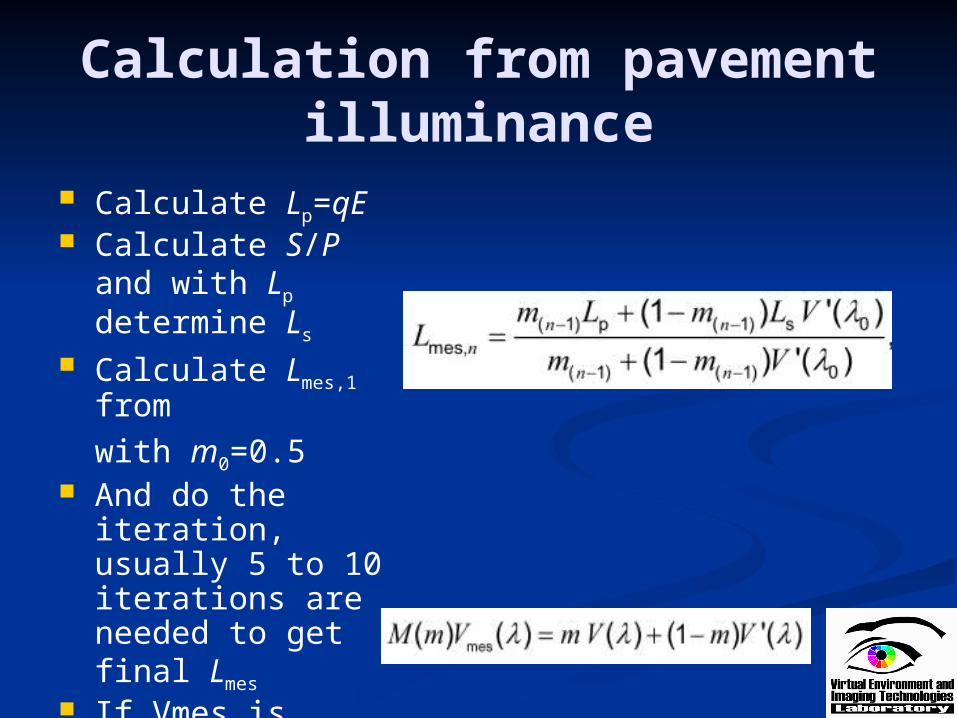
Calculation from pavement illuminance
Calculate Lp=qE Calculate S/P and
with Lp determine Ls
Calculate Lmes,1 fromwith m0=0.5
And do the iteration, usually 5 to 10 iterations are needed to get final Lmes
If Vmes is required, used

Some examples q= 0.0016 and q= 0.032 Typical light source
S/P values:
S/PLPS 0,25
HPS 0,75
LED-2700K 1,12
LED-4000K 1,91
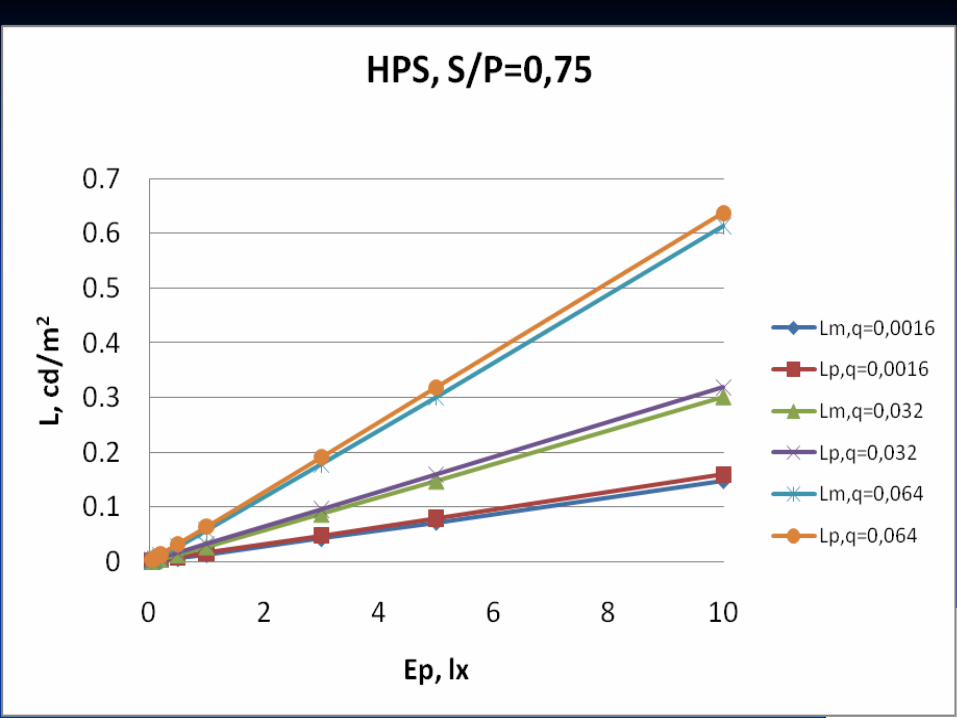
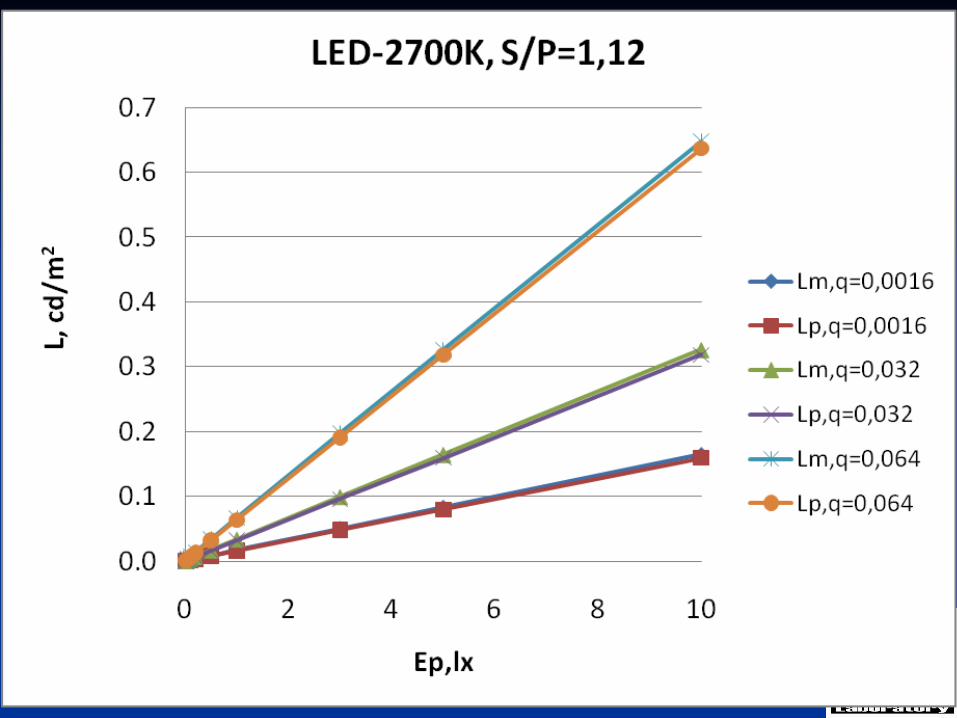
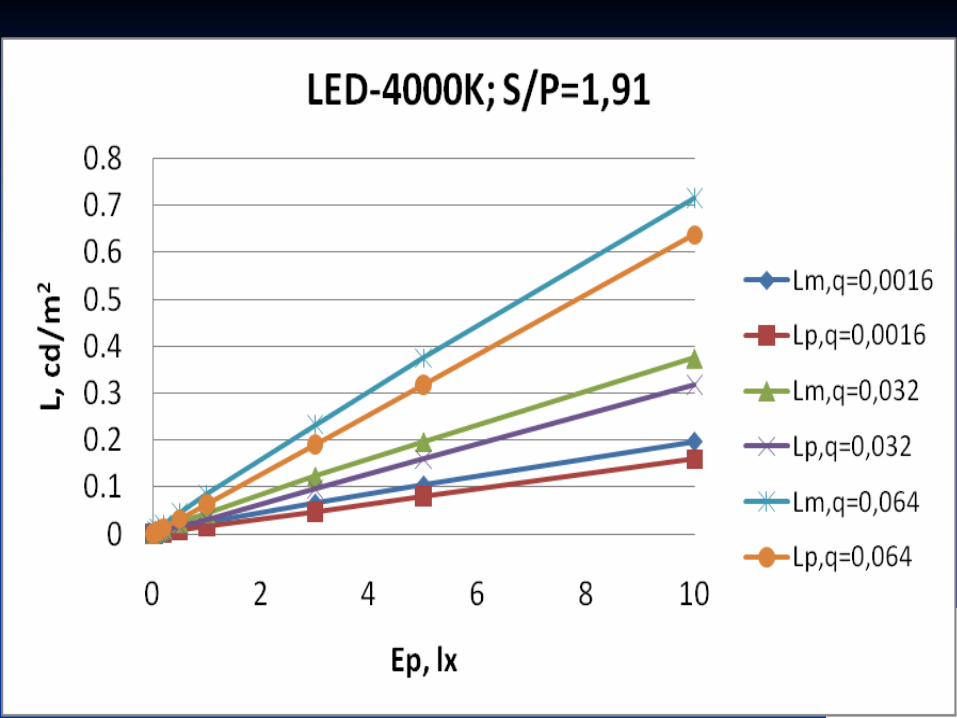
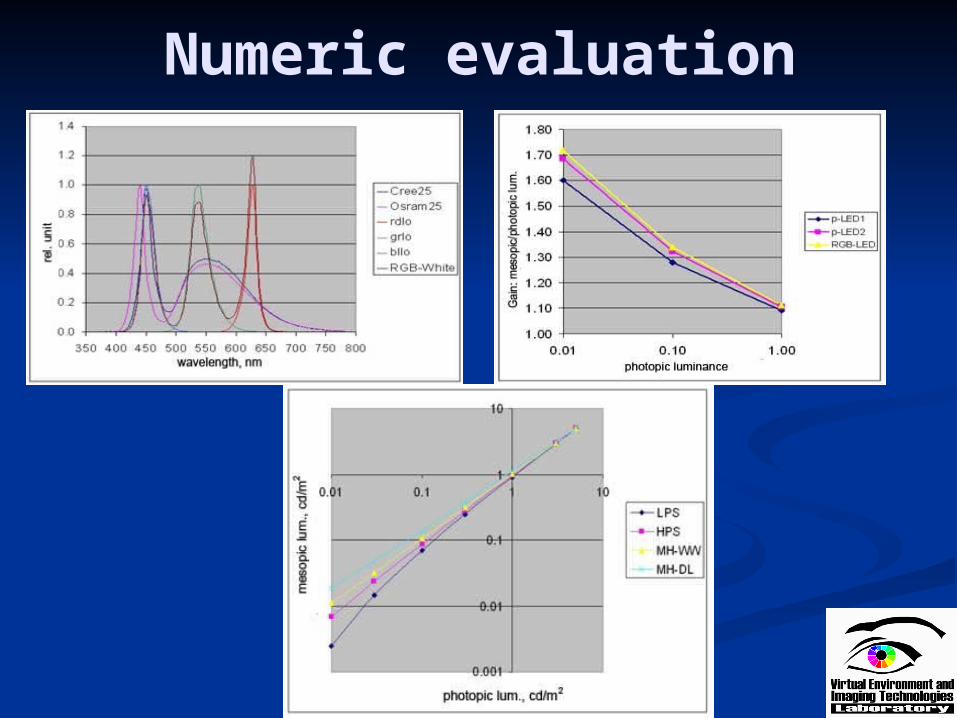
Numeric evaluation
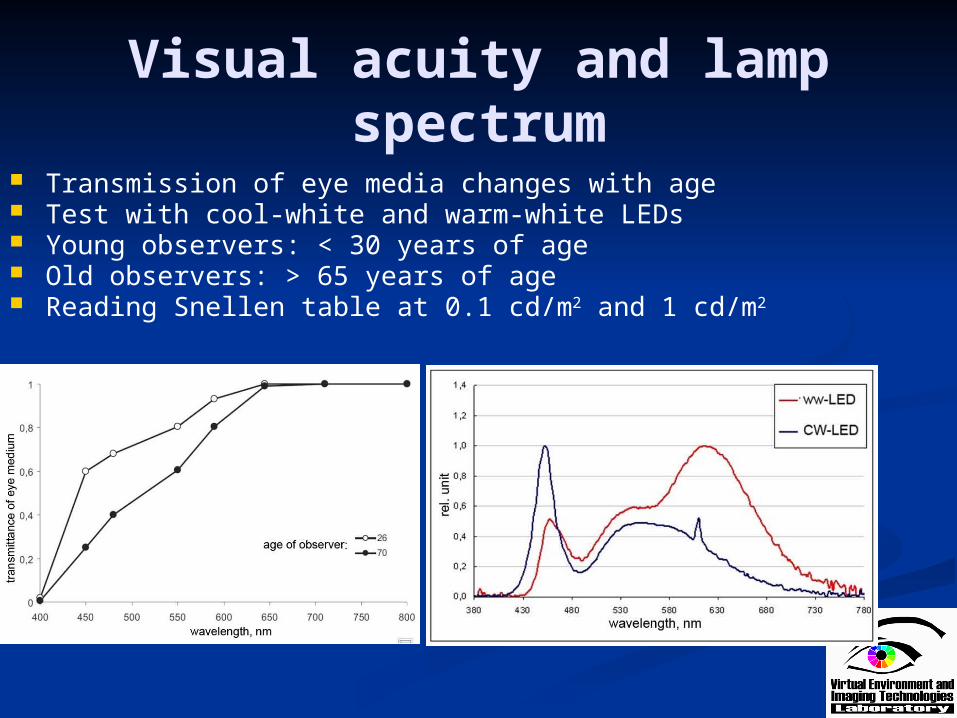
Visual acuity and lamp spectrum
Transmission of eye media changes with age Test with cool-white and warm-white LEDs Young observers: < 30 years of age Old observers: > 65 years of age Reading Snellen table at 0.1 cd/m2 and 1 cd/m2
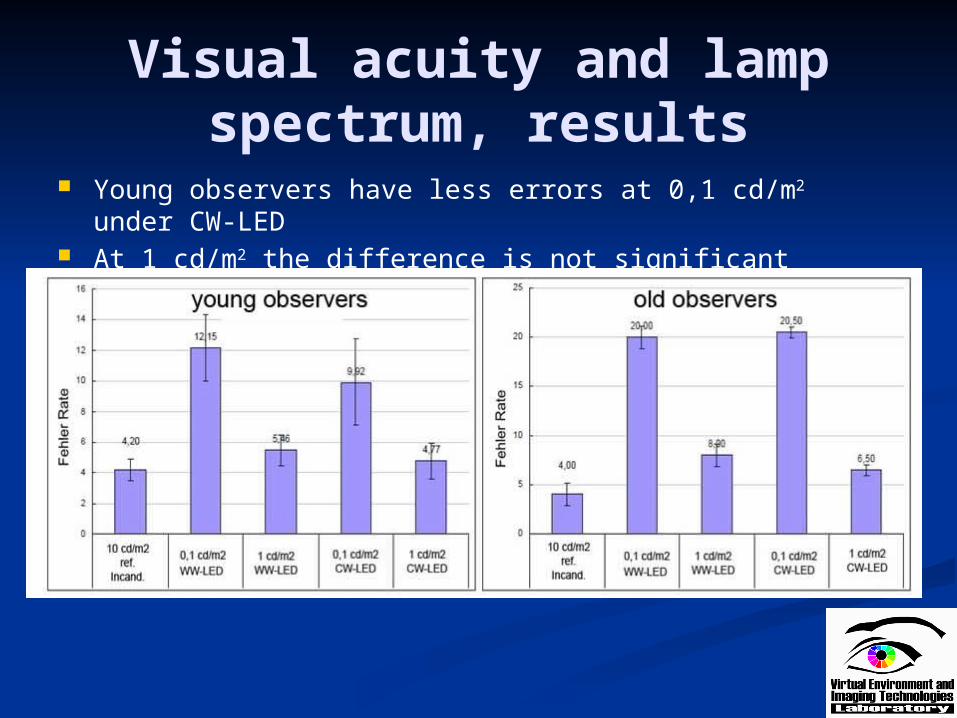
Visual acuity and lamp spectrum, results
Young observers have less errors at 0,1 cd/m2 under CW-LED
At 1 cd/m2 the difference is not significant
Summary The mesopic photometry model is valid for
background adaptation luminance It refers to reaction time type of tasks, not
brightness For foveal vision V(l) based metric (photopic
photometry) is valid! It is an experimental model for trial, has to be
validated with real street lighting tests and
accident simulations In preparing new recommendations spectral
vision differences between young and old observers should be considered

Peter Kaisers vision of the future photometer in 1981
Modern image taking photometers are almost there
+ info:
background ipRGCs