
Mercury in boreal freshwater fish factors and processes ...
83
1 Mercury in boreal freshwater fish – factors and processes governing increasing concentrations DISSERTATION FOR THE DEGREE OF PHILOSOPHIÆ DOCTOR Hans Fredrik Veiteberg Braaten Department of Chemistry Faculty of Mathematics and Natural Science University of Oslo 2015
Transcript of Mercury in boreal freshwater fish factors and processes ...

1
Mercury in boreal freshwater fish – factors and processes governing increasing concentrations
DISSERTATION FOR THE DEGREE OF PHILOSOPHIÆ DOCTOR
Hans Fredrik Veiteberg Braaten
Department of Chemistry
Faculty of Mathematics and Natural Science
University of Oslo
2015

2
Acknowledgements
Writing the last few words of this thesis makes me quite overwhelmed thinking of all the people who
have helped me over the last four and a half years, making the present document a possibility. There
are too many of you to thank individually in this short Acknowledgement, but you know yourself who
you are. I am very grateful to you all.
First of all, I would like to thank my supervisor, Thorjørn Larssen. When you brought me to
NIVA, you gave me the opportunity to work on an exciting project with very skilful colleagues. Now,
I find it hard to explain in words how much help you have offered over these years. I am still
astonished every day by your ability to, despite limited time, offer constructive feedback, raise critical
questions, support and back me up when needed. Thank you!
Secondly, I would like to thank all my colleagues at NIVA. Thanks to Heleen, Eirik, Markus,
Tor Erik, Espen, Sigurd and Amanda for helping me writing papers and discussing environmental
issues. A special thanks goes to Chris for teaching me the basics in the world of article publishing.
Additionally I will never forget the laughs over lunch or coffee with Sissel, Merete and everybody else
at section 312. I learn something new every day from working with you all.
I would also like to thank my co-supervisor Rolf Vogt and his Environmental Chemistry
Group at UiO. You have given me the opportunity to present my work in an informal setting, where all
questions have been welcome. Thank you also to Erlend for close collaboration, particularly in the lab.
My family and friends also deserves a big thank you for supporting me and making me believe
in myself, even though you have no idea what I do for a living. Frode, although you like to teach me
on scientific issues, thanks for adding some football and home brew to my life.
Finally, the biggest thank you goes to Kate. You know what I think of all you have done for
me. The last 12 months have been incredible and quite the journey. Now the rest of our lives are
waiting for us, I cannot wait to spend it with you and Aksel.
Hans Fredrik
Oslo, 16.03.2015

3
Contents
Abstract
List of publications
Abbreviations
1 Introduction
1.1 Hg speciation
1.2 Hg in freshwater ecosystems
1.2.1 Hg in freshwater fish
1.2.2 Trophic transfer of MeHg
1.2.3 Hg transport, production and fate
1.2.4 Drivers of Hg in aquatic environments
1.3 Trends in global Hg emissions
1.4 Objectives
2 Materials and methods
2.1 Study sites
2.1.1 Langtjern
2.1.2 Breidtjern and Tollreien
2.1.3 Vuorasjavri
2.2 Sampling
2.2.1 Water sampling
2.2.2 Fish sampling
2.2.3 Lower food chain biota sampling
2.3 Chemical analysis
2.3.1 Water sample treatment and analysis
2.3.2 Biological analysis
2.4 Data sources
2.5 Statistical analysis
2.5.1 Spatial water data (paper 2)
2.5.2 Fish data treatment and calculations (paper 5)
3 Results and discussion
3.1 Methodological developments
3.1.1 Water sample preservation techniques
3.1.2 Acid extraction of MeHg in biota
3.2 Hg concentration in Norwegian freshwater fish
3.3 Catchment Hg cycling
3.3.1 Organic matter as transport vector
3.3.2 Catchment base cation status
3.3.3 Catchment area
3.3.4 Nutrient mediated methylation
3.4 Aquatic in-lake processes
3.4.1 Organic matter as methylation substrate
3.4.2 PD of MeHg
3.4.3 Future PD loss scenarios
3.4.4 Habitat specific in-lake methylation
3.4.5 Chlorophyll and TOC associated MeHg transport
3.5 Biological food chain mechanisms
3.5.1 Changing fish trophic position
3.5.2 Variation of MeHg biomagnification
3.5.3 Temperature dependent MeHg biomagnification
3.5.4 Biological influence on MeHg biomagnification
4 Conclusions
5 Future work
6 References
Papers

4
Abstract
Mercury (Hg) is a natural element, present all over the world at trace concentrations. Due to its
volatility the element can undergo long-range transport in the atmosphere, and is historically
accumulated in catchment soils of remote locations. Inorganic Hg can become methylated into toxic
and bioaccumulative methylmercury (MeHg), which is biomagnified in aquatic food chains with
potential harmful effects on organisms. Although awareness was raised concerning Hg as an
environmental concern almost 6 decades ago, the complexity of the mechanisms controlling
accumulation of MeHg in freshwater food chains are still largely unknown.
Due to the propensity of MeHg to accumulate, concentrations can often be low in various
natural environmental matrices, e.g. water and biota at the bottom of the food chain. As is documented
through studies of sample pre-treatment methods for water and biota in the present thesis, care must be
taken when choosing sampling and analytical approaches to avoid erroneous results and conclusions.
For water samples, using one bottle for both MeHg and total Hg (TotHg) determination, could lead to
an underestimation of approximately 10 % of the TotHg concentrations. Similarly, choosing an
alkaline digestion method instead of an acid extraction technique for biological material could lead to
an underestimation of more than 30 % of the MeHg concentration.
In remote areas, where no local inputs of Hg exist, catchment loading of Hg to surface waters
is shown to dominate over direct on-lake atmospheric Hg deposition. Hence, the factors and
mechanisms controlling and affecting accumulation of Hg in freshwater fish, directly and indirectly,
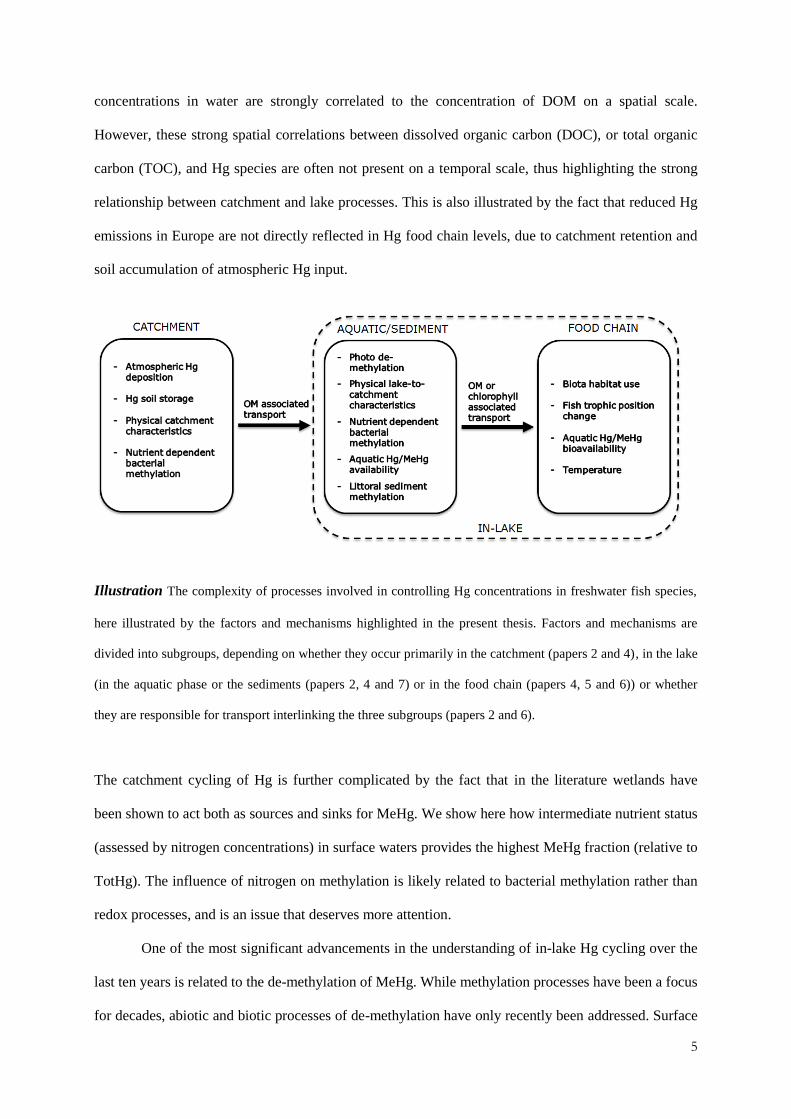
can be divided into three sub-groups (see Illustration): i) catchment Hg cycling; ii) aquatic and
sediment in-lake processes; and iii) biological food chain processes. In the present thesis significant
processes that are influencing Hg concentrations in fish are highlighted in all three sub-groups, with a
specific focus on factors driving spatial and temporal trends of Hg concentrations in the aquatic phase
and the food chain. Additionally, it is shown how the three sub-groups of processes are strongly
interlinked and how, although on different concentration scales, processes are similar in boreal and
subarctic regions.
Historically stored Hg is transported from catchment soils to surface waters with dissolved
organic matter (DOM) as a transport vector. We show how variations of MeHg and TotHg
5
concentrations in water are strongly correlated to the concentration of DOM on a spatial scale.
However, these strong spatial correlations between dissolved organic carbon (DOC), or total organic
carbon (TOC), and Hg species are often not present on a temporal scale, thus highlighting the strong
relationship between catchment and lake processes. This is also illustrated by the fact that reduced Hg
emissions in Europe are not directly reflected in Hg food chain levels, due to catchment retention and
soil accumulation of atmospheric Hg input.
Illustration The complexity of processes involved in controlling Hg concentrations in freshwater fish species,
here illustrated by the factors and mechanisms highlighted in the present thesis. Factors and mechanisms are
divided into subgroups, depending on whether they occur primarily in the catchment (papers 2 and 4), in the lake
(in the aquatic phase or the sediments (papers 2, 4 and 7) or in the food chain (papers 4, 5 and 6)) or whether
they are responsible for transport interlinking the three subgroups (papers 2 and 6).
The catchment cycling of Hg is further complicated by the fact that in the literature wetlands have
been shown to act both as sources and sinks for MeHg. We show here how intermediate nutrient status
(assessed by nitrogen concentrations) in surface waters provides the highest MeHg fraction (relative to
TotHg). The influence of nitrogen on methylation is likely related to bacterial methylation rather than
redox processes, and is an issue that deserves more attention.
One of the most significant advancements in the understanding of in-lake Hg cycling over the
last ten years is related to the de-methylation of MeHg. While methylation processes have been a focus
for decades, abiotic and biotic processes of de-methylation have only recently been addressed. Surface

6
waters throughout Northern Europe show trends of increasing DOM levels, which leads to reduced
light penetration and reduced photo de-methylation (PD). We show how DOC concentrations affect
present PD of MeHg and also how it influences future MeHg budgets of pristine lake catchments in
Norway. We found that, if DOC concentrations increase by 20 %, PD loss will decrease by 31 % in a
humic lake.
The processes of Hg magnification through the food chain are well understood. However, the
issues related to how and where MeHg enters the food chain are less known. Climate driven factors
such as temperature and hydrology, as well as deposition of other elements (as nitrogen and sulphur)
are thought to indirectly affect the accumulation of Hg in food chains through lake productivity,
methylation rates, fish growth and changing habitat use. We show here how invertebrate habitat use
and changes in fish trophic position can also significantly influence the concentrations, accumulation
and magnification of MeHg in aquatic food chains. Additionally, we suggest that top predators (i.e.
top-down pressure on the food chain) in these lakes could significantly change the biomagnification
rates of MeHg. Together, these processes will, directly and indirectly, affect present and future
concentrations of Hg in Scandinavian freshwater fish.
Although a number of mechanisms are highlighted within this thesis, we struggle to see all the
possible mechanisms that are controlling the changing Hg concentrations observed in pristine
freshwater fish. While we look for connections and key processes, concentrations of Hg in top
predators in these pristine lakes continues to increase. In addition, concentrations vary significantly
from year to year, without any clear cause, making it difficult to pinpoint the most important
processes. Thousands of lakes worldwide have fish populations with Hg concentrations exceeding
health advisory limits. The lack of understanding of all processes involved in controlling Hg
accumulation in fish, and also how these processes interlink, limits the ability to predict future levels
of Hg in fish under environmental change.
In order to further increase our understanding of what controls Hg concentrations in fish in
northern ecosystems, future research needs to be focused on combined effects of climate and pollution
(i.e. atmospheric deposition), as well as transport and accumulation processes of MeHg. In particular,

7
a better understanding of factors that drive aqueous MeHg concentrations and bioavailability is critical
for improving predictions of bioaccumulation of Hg in those food chains.

8
List of publications
This thesis is based upon the work contained in the following papers:
Paper 1: Hans Fredrik Veiteberg Braaten, Heleen A. de Wit, Christopher Harman, Ulla Hageström
and Thorjørn Larssen, 2014. Effects of sample preparation and storage on mercury speciation in
natural stream water, International Journal of Environmental Analytical Chemistry, 94, 4, 381-384.
Paper 2: Hans Fredrik Veiteberg Braaten, Heleen A. de Wit, Eirik Fjeld, Sigurd Rognerud, Espen
Lydersen and Thorjørn Larssen, 2014. Environmental factors influencing mercury speciation in
subarctic and Boreal lakes, Science of the Total Environment, 476-477, 336-345.
Paper 3: Hans Fredrik Veiteberg Braaten, Christopher Harman, Ida B. Øverjordet and Thorjørn
Larssen, 2014. Effects of sample preparation on methylmercury concentrations in Arctic organisms,
International Journal of Environmental Analytical Chemistry, 94, 9, 863-873.
Paper 4: Markus Lindholm, Heleen A. de Wit, Tor Erik Eriksen and Hans Fredrik Veiteberg Braaten,
2014. Littoral as key habitat for mercury bioaccumulation in a humic lake, Water, Air & Soil
Pollution, 225:2141.
Paper 5: Hans Fredrik Veiteberg Braaten, Eirik Fjeld, Sigurd Rognerud, Espen Lund and Thorjørn
Larssen, 2014. Seasonal and year-to-year variation of mercury concentration in perch (Perca
fluviatilis) in Boreal lakes, Environmental Toxicology and Chemistry, 33, 12, 2661-2670.
Paper 6: Hans Fredrik Veiteberg Braaten, Tor Erik Eriksen, Markus Lindholm, Guttorm Christensen
and Thorjørn Larssen. Effects of water chemistry and ecology on the uptake and trophic transfer of
methylmercury in boreal and subarctic Norwegian lakes, manuscript.
Paper 7: Amanda Poste, Hans Fredrik Veiteberg Braaten, Heleen A. de Wit, Kai Sørensen and
Thorjørn Larssen. Effects of photo de-methylation on the methylmercury budget of boreal Norwegian
lakes, accepted for publication in Environmental Toxicology and Chemistry.
9
Abbreviations
AIC Akaike Information Criterion
BAF Bioaccumulation factor
BAFZ Zooplankton bioaccumulation factor
C/N Carbon/nitrogen ratio
CRM Certified reference material
CVAFS Cold vapor atomic fluorescence spectrometry
δ13
C Ratio of heavier to lighter stable isotopes of carbon
δ15
N Ratio of heavier to lighter stable isotopes of nitrogen
DI Deionized water
DOC Dissolved organic carbon
DOM Dissolved organic matter
DMHg Di methylmercury
e.g. Exempli gratia (for example)
EMERGE European mountain lake ecosystems: regionalisation, diagnostic and socio-economic
evaluation
EN European Standard
FEP Fluorinated ethylene propylene
FLPE Fluoropolymere bottles
GC Gas chromatography
GEM Gaseous elemental mercury
GIS Geographical Information System
Hg Mercury
Hg0
Elemental mercury
Hg(II) Inorganic divalent mercury
ICD Ice cover duration
i.e. Id est (that is)
LOD Limit of detection

10
m.a.s.l Meters above sea level
MDL Method detection limit
MeHg Methylmercury
%MeHg Fraction of methylmercury ([MeHg]/[TotHg]*100)
MMHg Mono methylmercury
NS Norwegian Standard
OM Organic matter
PAR Photosynthetically actice radiation
PD Photo de-methylation
pH Measure of hydronium ion concentration
PLS Partial Least Squares
QA/QC Quality assurance/quality control
RMSE Root mean square error
SRB Sulphate reducing bacteria
TMS Trophic magnification slope
TOC Total organic carbon
UNEP United Nations Environmental Programme
USEPA United States Environmental Protection Agency
UV-A/UV-B Ultraviolet A/Ultraviolet B radiation
WHO World Health Organisation
WMS Web Map Services
WMO World Meteorological Organisation

11
1 Introduction
Mercury (Hg) is a naturally occurring element which has a biogeochemical cycle that involves
atmospheric, aquatic and terrestrial compartments throughout the world (Selin, 2009). Over the last
few centuries, anthropogenic activities have altered the biogeochemical cycle of Hg (UNEP, 2002). In
fact, of the more than 5700 Mg of Hg emitted into the atmosphere every year, 2320 Mg are estimated
to be of direct anthropogenic origin and an additional fraction from re-emission (Pirrone et al., 2010).
Environmental and health impacts of Hg are however only indirectly related to atmospheric
concentrations of Hg species. It is the conversion of inorganic Hg species to the toxic and
bioaccumulative organic forms, of which methylmercury (MeHg) is the most important, that is of
major concern (Driscoll et al., 2013). Because of the accumulating properties of MeHg, low
concentrations in the natural environment can still lead to high concentrations in the top of the food
chain. So, although important in the overall budget of worldwide Hg cycling, anthropogenic activities
will not be the focus of this thesis. The main goal is to identify and discuss important factors and
mechanisms controlling changing Hg concentrations in freshwater environments without local Hg
sources, particularly in fish.
1.1 Hg speciation
Identification and quantification of different species of Hg is vital to be able to ascertain toxicity,
mobility and bioaccumulation within the environment. The important chemical species of Hg can be
divided into elemental Hg (Hg0), inorganic Hg and organic Hg (Leermakers et al., 2005), all of which
can be exchanged in and between atmospheric, aquatic and terrestrial systems (Morel et al., 1998).
Hg0, or gaseous elemental Hg (GEM), is volatile, is the most stabile form of Hg in the
atmosphere (Schroeder et al., 1993), and can be airborne for approximately 1 year (Slemr et al., 2003).
Inorganic Hg is found in oxidation state +1 and +2, where +2 (Hg(II)) is most common in the natural
environment. Hg(II) is easily soluble in water and the main form of Hg in aquatic systems (Schroeder
et al., 1993). Of the organic forms, mono methylmercury (MMHg, hereafter only MeHg) and di
methylmercury (DMHg) are the most common forms (Tessier and Turner, 1995). MeHg is toxic and
the most abundant form of Hg in most fish tissues (> 95 %, Bloom, 1992), because the specie

12
biomagnifies through the food chain. The biomagnifying properties of MeHg are due to the ability to
accumulate in proteins faster than it is excreted (Trudel and Rasmussen, 2006).
In studies of MeHg biomagnification, the term “bioavailable forms of Hg” (i.e. bioavailability
of Hg) is often used. Here, we use the term bioavailability of Hg to describe the Hg and MeHg that is
available for uptake into the base of the food chain (Barkay et al., 1997). French et al. (2014), shows
that the bioavailability of Hg is highly dependent on OM. In low DOC (< 8.5 mg/L) waters, Hg is
mainly associated with fulvic acids and readily taken up and accumulated in the food chain. However,
as DOC concentrations increase above 8.5 mg/L, Hg becomes associated with larger and less
bioavailable humic acids. As we discuss later on, how Hg is bound in water (e.g. to sulphur, chloride
etc.) will also affect the bioavailable and methylating properties of Hg.
1.2 Hg in freshwater ecosystems
In northern freshwater ecosystems with no direct local inputs of Hg contamination, surface water
concentrations of Hg are usually low (ng/L, paper 2). In such systems, long-range transported
atmospheric Hg is the main source of Hg contamination (Jackson, 1997) and has led to long-term
accumulation of Hg in catchment soils (Fitzgerald et al., 1998). Because of the catchment retention,
atmospheric inputs of Hg do not correlate directly to Hg in freshwaters (Larssen et al., 2008), and
catchment loading of Hg dominate over direct on-lake Hg deposition (Lee et al., 1998, Lee et al.,
2000). A large manipulation study in North America (The Mercury Experiment to Assess Atmospheric
Loading in Canada and the United States (METAALICUS)), where Hg were added to the catchment
as well as the lake, showed that an increase in Hg loading of approximately 7 times the ambient wet
deposition gave increased concentrations in biota (30-40 %, including young of the year fish) over a
three year period (Harris et al., 2007). Harris et al. (2007) state that “essentially all of the increase in
fish MeHg concentrations came from Hg deposited directly to the lake surface. In contrast, <1% of the
Hg isotope deposited to the watershed was exported to the lake.” Based on this, the authors suggest
that lakes receiving reduced input of Hg from the atmosphere due to increased emission controls,
would lower their fish Hg concentrations. The decline in the Hg content of fish would be rapid, as a
result of reduced direct deposition to the lake, followed by a slow (centuries) further decline due to re-

13
equilibration of the catchment pools. The size of the initial response to reduced deposition will
strongly depend on the lake to catchment ratio.
Since most Scandinavian lakes have a large catchment relative to the lake surface, the findings
from the North American manipulation study would imply that only a small initial response to reduced
atmospheric input can be expected, and the catchment pools of Hg will be of major importance
compared to direct atmospheric deposition to the lake, e.g. Larssen et al. (2008), Lee et al. (2000).
From Larssen et al. (2008) (and Lee et al., 2000) it is estimated that pristine catchments can contain
pools of Hg 8000 (and 15500) times larger than the annual stream water output and 2000 (and 600)
times larger than the input from throughfall and litterfall. The response of reduced atmospheric
deposition should therefore be expected to be very slow.
In addition the slow transport of Hg through the catchment, another important reason for the
often observed lack of direct relationships between atmospheric deposition of Hg and Hg
concentrations in fish is the processes involved in production of MeHg in a lake-catchment system.
The MeHg availability in a lake is determined by the balance between processes of methylation
(production of MeHg) and de-methylation (degredation of MeHg, Benoit et al., 2003). Through
methylation, inorganic Hg is tranformed into toxic and bioaccumulative MeHg (Bloom, 1992). MeHg
is accumulated in the aquatic food chain (Trudel and Rasmussen, 2006), and aquatic biota in northern
freshwater ecosystems contain elevated concentrations of Hg, related to historical anthropogenic
emissions of Hg to the atmosphere (Driscoll et al., 2013). Elevated concentrations of MeHg in aquatic
food chains can potentially show harmful effects on organisms (WHO, 1991) and humans (Mergler et
al., 2007) through fish consumption (UNEP, 2002).
1.2.1 Hg in freshwater fish
In thousands of North American and Scandinavian freshwater lakes, fish Hg concentrations exceed
limits advised for human consumption (0.3 – 0.5 mg/kg Hg wet weight, UNEP, 2002). A compilation
of multi-annual studies of Hg levels in terrestrial, freshwater and marine biota in polar and
circumpolar areas in North America and Scandinavia, under coordination of the Arctic Council,
suggests that neutral and rising trends of Hg are dominating (Riget et al., 2011). Riget et al. (2011)

14
states that data on Hg in fish covering the past one to three decades can be used to illustrate how Hg
concentrations have changed in recent times and will also suggest likely near-time future trends.
However, only a few time series for freshwater fish were included in the review by Riget et al. (2011).
In the present thesis the term trend is used to describe and illustrate how fish Hg
concentrations are changing over the past three decades (1990s, 2000s and 2010s) in Norway.
Increases in concentrations of Hg in freshwater fish from the 1990s onwards have been documented in
Sweden (Akerblom et al., 2012), Finland (Miller et al., 2013), Norway (Fjeld and Rognerud, 2009)
and Canada (Ontario, Gandhi et al., 2014), although this rising trend is not found in all regions and for
all fish species. Recent studies from lakes in Sweden (Akerblom et al., 2014, Miller et al., 2013) are in
fact showing declining concentrations of Hg in fish. However, despite reduced Hg emissions in several
world regions (Streets et al., 2011) and reduced or unchanged atmospheric Hg deposition in Northern
Europe (Wangberg et al., 2007, Harmens et al., 2008, Torseth et al., 2012) and Canada (Cole et al.,
2014), there is little evidence to suggest that Hg contamination in fish is beginning to decline.
Given the mixed results on data considering changing Hg concentrations in fish, there is a
clear need for more data considering year-to-year variations. In Gandhi et al. (2014), time trends were
considered for different fish species (to incorporate specie-specific differences in accumulation of
MeHg (Bhavsar et al., 2010)) and for different time periods (to document changing Hg trends at
different decades between 1970 and 2012). It was shown that while fish Hg concentrations from 1970
to 1990 was declining, concentrations in recent decades (time periods 1985-2005 and 1995-2012) were
increasing. Overall (1970-2012), patterns were shown to be neutral or declining, depending on the fish
species considered (Gandhi et al., 2014a).
1.2.2 Trophic transfer of MeHg
Studies have shown that variations in MeHg exposure and uptake at the base of the food chain drive
much of the variation seen in Hg concentrations at higher trophic levels (Chasar et al., 2009, de Wit et
al., 2012). However, data on MeHg and dietary markers (stable carbon and nitrogen isotopes) for
lower food chain compartments are lacking in the literature (Kidd et al., 2012), and little is known

15
regarding the environmental factors that determine the efficiency for which MeHg is taken up at the
base of the food chain.
MeHg concentrations increase with trophic position (Kidd et al., 1995), calculated from the
ratio of heavier to lighter stable isotopes of nitrogen (15
N/14
N = δ15N, Kidd et al., 1999, Peterson and
Fry, 1987). The linear regression between MeHg concentrations (on a logarithmic scale) and δ15N in
biota describes the degree of biomagnification, i.e. the mean change in organism MeHg concentration
with trophic level. The resulting Trophic Magnification Slope (TMS) is used as an indicator of the
potential for biomagnification of MeHg through a food chain (Yoshinaga et al., 1992).
The ratio of stable carbon isotopes (δ13C =
13C/
12C) values provide information on the major
source of energy for an organism, and are used to determine which food chain the organisms belong to
(Post, 2002). The three main lake habitats littoral, pelagial and profundal show contrasting quality of
carbon and nutrients (Chetelat et al., 2011), leading to differences in MeHg concentrations of primary
consumers depending on which zone they inhabit (Chetelat et al., 2011, paper 4). The supply of MeHg
to the food chains is suggested to be affected by factors such as Hg loading (Harris et al., 2007, van
der Velden et al., 2013), pH (Watras et al., 1998) and DOC (dissolved organic carbon, Rennie et al.,
2005, Chasar et al., 2009).
Both physicochemical and biological factors affect MeHg bioaccumulation (and hence values
of TMS). Acidity (Watras et al., 1998), concentrations of dissolved organic matter (DOM, Rolfhus et
al., 2011, Chetelat et al., 2011), Hg availability (DeForest et al., 2007, de Wit et al., 2012) and lake
productivity (Pickhardt et al., 2002) all affect bioaccumulation rates, as do temperature (Greenfield et
al., 2001, Lavoie et al., 2013), growth rates of biota (Dittman and Driscoll, 2009), energy sources
(Trudel and Rasmussen, 2006), prey contamination (Trudel and Rasmussen, 2006) and predation
effects (Henderson et al., 2012, Jones et al., 2013). A global review of the environmental drivers of
TMS identified latitude, DOC and productivity as important drivers, whilst a great deal of unexplained
variability remained, highlighting the need for further work (Lavoie et al., 2013).
16
1.2.3 Hg transport, production and fate
DOM measured as DOC is the main transport vector for Hg and MeHg from catchment soils to
surface waters (Grigal, 2002). Hg and other trace metals are bound to OM at the acid sites, where, for
inorganic and organic Hg, the most common acidic site is thiol groups (Ravichandran, 2004,
Amirbahman et al., 2002). The ionic binding between inorganic Hg (Hg+ and Hg
2+) and MeHg
(CH3Hg+) and thiol groups (reduced sulphur) in soil and aquatic OM (Ravichandran, 2004, Skyllberg
et al., 2006), leads to mobilisation of Hg species from soils to streams (Mierle and Ingram, 1991) and
lakes (Driscoll et al., 1995). Hence, the expression of OM as a transport vector for Hg and MeHg.
Following the arguments above, concentrations of total organic carbon (TOC) and DOC show
thus strong spatial correlations with concentrations of Hg in lake surface water in Scandinavia (Meili
et al., 1991, Skyllberg et al., 2003, Eklof et al., 2012) and North America (Driscoll et al., 1995, Benoit
et al., 2003, Shanley et al., 2008). Fluxes of Hg in lake outlets relative to the catchment storage of Hg
are usually small (Grigal, 2002, Grigal, 2003, Larssen et al., 2008), suggesting that leaching of
deposited Hg from soils to surface waters is likely to continue for decades to centuries.
Processes of methylation and de-methylation in the catchment and lake determine the aqueous
MeHg concentrations. Production of MeHg occurs primarily through methylation of inorganic Hg by
sulphur reducing bacteria (SRB) under anoxic conditions (Morel et al., 1998), but is also shown to
occur through other mechanisms (Gilmour et al., 2013). Thus the production of MeHg can take place
in the catchment wetlands (St. Louis et al., 1994, Tjerngren et al., 2012b), the sediments (Benoit et al.,
2003, Gilmour et al., 1998) or in the water phase itself (Xun et al., 1987).
The fraction of MeHg (as MeHg-to-TotHg ratio or %MeHg) is often used as an indicator of
the environment’s capability to produce MeHg (cf. methylation potential; McClain et al., 2003,
Mitchell et al., 2008a). The methylation mechanism is not understood in detail, but a number of
parameters have been identified as important. These parameters include the composition and activity
of the microbial community, which depend on sulphur (S) chemistry, availability of inorganic Hg and
OM, temperature and pH (Ullrich et al., 2001, Benoit et al., 2003). The role of OM as substrate in the
methylation process is related to carbon as an electron donor when sulphate is reduced to sulphide by
SRB (sometimes also Fe(III) reduced to Fe(II) by Fe reducing bacteria). The significance of both

17
carbon and sulphate for this process is documented through different stimulation studies, e.g. (Mitchell
et al., 2008b) and (Jeremiason et al., 2006).
Factors controlling MeHg production and degradation in the aquatic environment are reviewed
in (Benoit et al., 2003) and (Li and Cai, 2013). Benoit et al. (2003) states that although Hg methylation
is a function of Hg concentration, the variation of methylation rates is larger than the range in Hg
deposition rates, highlighting the importance of other factors as well. Of particular importance are the
concentrations of sulphur and sulphide: while the SRB utilises sulphate as energy source through
reduction (while oxidising carbon in OM), inorganic Hg is bound to sulphide and diffuses into the cell
membrane. Hence, a pattern of increased MeHg concentrations in high methylation rate areas, are
often accompanied by reduced sulphide concentrations (Benoit et al., 2003).
In addition, new studies show the importance of nutrient status on MeHg production rates in
boreal wetlands (Tjerngren et al., 2012b, Tjerngren et al., 2012a). Although the idea of a nutrient
influence on bacterial methylation of Hg is not new (Gilmour et al., 1998), the mechanisms behind the
influence are not well understood. Tjerngren et al. (2012a) suggest that the nutrient influence is related
to a higher availability of electron donors for methylating bacteria. However, Tjerngren et al. (2012a)
shows that as nutrient status increases, also pH increases, and demethylation is favoured over
methylation. Additional research on the influence of nutrient status on Hg cycling in general and Hg
methylation in particular is clearly of great importance.
The dominant MeHg degradation process in lake systems is thought to be photo de-
methylation (Lehnherr and Louis, 2009).
1.2.4 Drivers of Hg in aquatic environments
In 2009 a highly significant trend towards increasing Hg concentrations in freshwater fish in boreal
Norway since the 1990s, was discovered (Fjeld and Rognerud, 2009). The documented increase was
surprising, as the atmospheric deposition of Hg had decreased (or showed unchanged levels) over the
same period due to emission reductions in Europe (Torseth et al., 2012). Environmental features that
potentially drive Hg processes in aquatic environments include catchment characteristics, lake
18
chemistry, climate conditions and atmospheric deposition of Hg, S and nitrogen (N), in addition to the
biological features already mentioned (see 1.2.2 Trophic transfer of MeHg ).
Catchment characteristics which promote Hg leaching to freshwaters are wetlands and forests.
Wetlands act as hotspots for MeHg production (Tjerngren et al., 2012b, St. Louis et al., 1996), while
forests have large terrestrial Hg stores related to increased deposition from canopy scavenging of
atmospheric Hg (Graydon et al., 2008). Long time-trend data of MeHg are not abundant in current
literature, but records from catchments in Sweden, Finland and Canada show that temporal variations
in MeHg appear to be related to hydrology and temperature driven changes in Hg methylation rates
(Futter et al., 2012).
In freshwaters the elevated concentrations of Hg in fish appear to be particularly connected to
humus-rich waters (Hakanson et al., 1988), which makes a connection between the recent rise in
surface water DOC (Monteith et al., 2007) and increase in Hg in fish plausible, although the
mechanistic explanation for this is unclear. Browning of surface waters may lead to a higher exposure
of MeHg and increased energy transfer from land-derived DOC to the lower food chain, reduced
MeHg in algae (Luengen et al., 2012) and reduced in-lake losses from PD (Sellers et al., 1996). Chasar
et al. (2009), demonstrated that the availability of MeHg at the base of the food chain in streams is a
strong determinant of MeHg in top predators. Spatial and temporal variation of MeHg in primary
consumers was consistent with variations in exposure to aqueous MeHg and DOC, in addition to diet
and nutrient availability in boreal streams (de Wit et al., 2012). A better understanding of factors that
drive aqueous MeHg concentrations and bioavailability is therefore critical for improving predictions
of bioaccumulation of Hg in the food chain.
1.3 Trends in global Hg emissions
Emissions of Hg to the atmosphere have decreased by approximately 80 % in Europe since the 1980s
(Streets et al., 2011). However, due to increased emissions in Asia global emissions of Hg are
currently shown to be increasing (Pirrone et al., 2010, Streets et al., 2011). Unless emission controls
are widely implemented, this trend is expected to continue in the near future as a large amount of
equipment phased out from industrial processes is expected to become Hg-containing waste (Pirrone

19
et al., 2010). In fact, a new study reveals that previously unquantified use of Hg in products and
processes (so-called “commercial Hg”), has contributed a large anthropogenic source of Hg to the
global environment (Horowitz et al., 2014). In November 2013, the Minamata Convention for
Mercury was signed by 93 countries, aiming to protect human health and the environment from
adverse effects of Hg at a global scale (UNEP, 2014).
1.4 Objectives
Following the observed increase in concentrations of Hg in freshwater fish in Norway from the early
1990s to 2008 (Fjeld and Rognerud, 2009), the main goal of this project was to confirm the trend (i.e.
that 2008 was not an “outlier-year” with respect to Hg concentrations) and find the key explanatory
factors and processes. In areas where no local emission of Hg exists, catchment loading of Hg is
shown to dominate over direct on-lake atmospheric Hg deposition (Lee et al., 1998, Lee et al., 2000).
Hence, the factors and mechanisms controlling and affecting accumulation of Hg in freshwater fish,
directly and indirectly, can be divided into three sub-groups (see Illustration): catchment Hg cycling
(1); aquatic and sediment in-lake processes (2); and biological food chain mechanisms (3). In the
present project we highlighted significant processes in all three groups, with a specific focus on spatial
and temporal trends of in-lake and food chain processes. Specifically, addressed are the following
questions:
1. Are concentrations of Hg in freshwater fish in Norway still increasing (after 2008), and what
are the potential drivers behind such a possible increase?
2. What are the key variables explaining the spatial concentration levels of Hg and MeHg, in
addition to methylation potential, in Norwegian surface waters?
3. What are the main biological and physicochemical lake features, affecting the
bioaccumulation and biomagnification of MeHg through boreal and subarctic lake food
chains?
4. How does photochemical degradation affect concentration levels of MeHg in Norwegian
surface waters today and in terms of different future DOC concentration scenarios?
20
Firstly, we documented the spatial distribution of TotHg, MeHg and methylation potential together
with potential explanatory environmental variables in 51 Norwegian surface waters where high
concentrations of Hg in fish have previously been shown to be an issue (paper 2). Secondly, a subset
of the 51 lakes was used to investigate detailed mechanisms responsible for the potentially increasing
Hg concentrations in fish (n = 2, paper 5), controlling factors for MeHg biomagnification (n = 4, paper
6), MeHg habitat-specific bioaccumulation (n = 1, paper 4), and the importance of present and future
abiotic de-methylation of MeHg (n = 3 plus one additional lake, paper 7).
Thirdly, the importance of different sample treatment methods on analytical results were
investigated for water (MeHg and TotHg, paper 1) and biota samples (MeHg, paper 3).

21
2 Materials and methods
2.1 Study sites
Included in the present thesis is a study of the environmental factors controlling Hg speciation and
methylation potential in a total of 52 Norwegian freshwater lakes. The lakes are located in southeast
and northeast Norway (Figure 1), and chosen because they represent areas where previous
investigations indicate substantial concentrations of Hg in fish (Fjeld and Rognerud, 2009, Fjeld et al.,
2010). In some cases fish Hg concentrations are exceeding Norwegian fish advisory limits (0.5 mg/kg,
Norwegian Food Safety Authority, 2005). Of the 52 lakes we studied, 51 are included in a study of the
environmental factors controlling Hg speciation in surface water (paper 2, lake ID 1-51, Figure 1). Of
the 51 lakes from paper 2, we chose five lakes that were studied in more detail. Three of these are
typical boreal lakes located in southeast Norway (ID 1 Breidtjern, ID 11 Tollreien and ID 32
Langtjern, paper 4, 5, 6 and 7), while the fourth lake is subarctic (ID 40 Vuorasjavri, paper 6).
Additionally, one lake (ID 52 Sognsvann) was included as a clear-water lake for our PD study (paper
7).
The northern lakes (n = 5; ID 39 – 43) are located on a subarctic tundra plain with little
topographical differences. The area is dominated by birch forest and wetlands, with average yearly air
temperatures below zero (from -0.8 to -3.2 °C). The lakes in the southeast are located within generally
forested catchments, dominated by coniferous tree species, with presence of wetland, and in the boreal
ecotone. The mean yearly air temperature is above zero for all lakes (n = 47; ID 1 - 38; 44 - 52) in this
area (from 1.3 to 5.8 °C).
The chosen lakes represent a wide range of physical catchment characteristics. Included
potential explanatory factors for the 51 lakes included in paper 2 are elevation, lake and catchment
area, lake-to-catchment ratio, wetland area and wetland-to-catchment ratio (a summary in Table 1).
The surface areas of the studied lakes ranged from < 0.01 km2 to 16.6 km
2 and the size of the
catchment areas span four orders of magnitude from 0.02 km2 to 268.8 km
2. The lakes are situated
across a wide elevation range, running from 56 to 610 m.a.s.l. Seven of the southern lakes are located
in close proximity, i.e. within 5 km2 (Figure 1 inset; ID 32 - 38). Six of these (ID 33 - 38) are small (<
0.02 km2) and are located upstream of the seventh (ID 32). The surface area of the individual lakes,
22
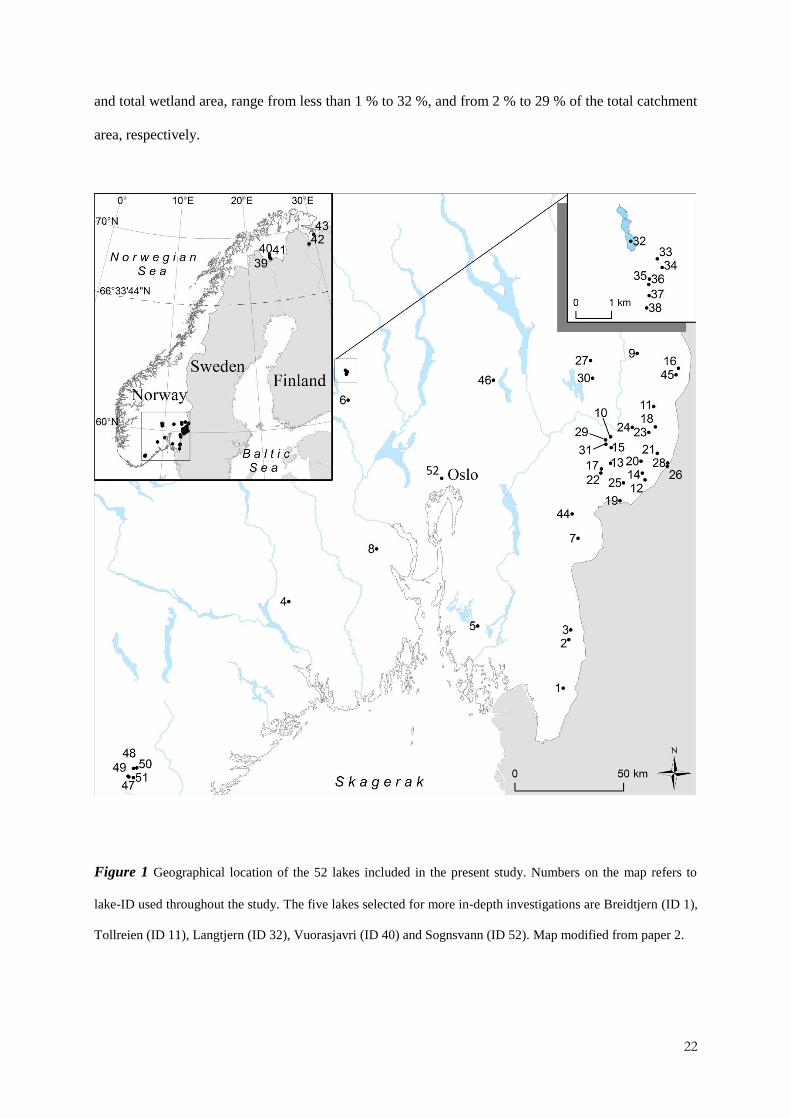
and total wetland area, range from less than 1 % to 32 %, and from 2 % to 29 % of the total catchment
area, respectively.
Figure 1 Geographical location of the 52 lakes included in the present study. Numbers on the map refers to
lake-ID used throughout the study. The five lakes selected for more in-depth investigations are Breidtjern (ID 1),
Tollreien (ID 11), Langtjern (ID 32), Vuorasjavri (ID 40) and Sognsvann (ID 52). Map modified from paper 2.

23
Table 1 Minimum, mean and maximum levels for all catchment characteristics, deposition patterns and climate
variables included in paper 2. Data from available lakes (n = 51) are separated into lakes located in the north (n =
5, ID 39-43) and lakes located in the south (n = 46, ID 1-38, 44-51). Table copied from paper 2.
2.1.1 Langtjern
Langtjern (60o37' N, 9
o73' E, ID 32, Figure 1), a 0.23 km
2 large humic lake situated at 518 m.a.s.l. in
the boreal conifer forest region of southern Norway, was one of the main study site for papers 1, 4, 6
and 7. The catchment has been included in the national acid rain monitoring programme since 1972,
which includes weekly monitoring of outlet chemistry for major cations and anions (Garmo et al.,
2013).
The physical and chemical characteristics of Langtjern are typical for small boreal humic
lakes. Maximum and mean depth in Langtjern is 12 and 2 m, respectively, and the summer
thermocline is located at approximately 3 m. The catchment area amounts to 4.69 km2, most of which
consists of sparse pine forest (63%), mire and bogs (16%) and exposed gneiss bedrocks (16%). The
lake is acidic, humic and dystrophic, with a mean annual lake outlet pH, TOC, nitrate (NO3-) and total
Specification Unit Mean value (minimum, maximum)
Subarctic lakes (n = 5) Boreal lakes (n = 46)
Catchment characteristics
Lake size km2
0.93 (0.20, 3.37) 0.88 (<0.01, 16.56)
Catchment size km2 26.67 (0.93, 60.51) 15.42 (0.02, 268.84)
Lake-to-catchment ratio % 8.3 (0.5, 21.5) 7.4 (0.7, 31.6)
Wetland area km2 4.50 (0.03, 15.30) 1.14 (<0.01, 18.37)
Wetland-to-catchment
ratio % 11.4 (3.0, 25.3) 12.0 (1.7, 28.9)
Elevation m.a.s.l 246 (56, 371) 307 (60, 610)
Deposition patterns
Top sediment Hg µg/g 0.16 (0.14, 0.21) 0.36 (0.30, 0.46)
N deposition mEq/m2/yr 10.5 (9.9, 11.9) 43.2 (33.7, 63.4)
S deposition mEq/m2/yr 8.0 (6.2, 10.7) 13.0 (10.3, 20.8)
Climate variables
Run-off mm/yr 316 (312, 324) 489 (230, 944)
Mean annual
temperature ° C -2.3 (-3.2, -0.8) 3.6 (1.3, 5.8)
Precipitation mm/yr 372 (329, 453) 816 (653, 1182)

24
phosphorous (Tot-P) concentration for 2009 to 2011 of respectively 5.1, 11.6 mg/L, 12 µg/L and 5
µg/L in the outlet (unpublished data). The area is acid-sensitive and acid deposition has driven the
original trout population to extinction. An artificial stocked trout community is re-established, where
limited numbers of farmed yearlings have been released every third year.
2.1.2 Breidtjern and Tollreien
Breidtjern (59°6’ N 11°40’ E, ID 1) and Tollreien (60°17’ N 12°19’ E, ID 11) are located in southeast
Norway (Figure 1), representing pristine boreal areas where previous studies indicate substantial levels
of Hg in freshwater fish (Fjeld and Rognerud, 2009, Fjeld et al., 2010). Both lake catchments are
dominated by forest with presence of wetlands, and with no agriculture. The two lakes are different in
both surface water (0.26 and 0.82 km2) and catchment area (2.1 and 34.7 km
2), with Tollreien being
the larger lake catchment system.
The mean yearly air temperature and precipitation is typical for southeast Norway; below 6 °C
and 900 mm, respectively. Chemical deposition patterns reveal the typical south-north gradient of
deposition seen in Norway, with higher deposition rates of N and S in Breidtjern (the lake located
furthest south, 58.6 and 17.7 mEq/m2/yr, respectively) compared to Tollreien (35.7 and 10.8
mEq/m2/yr, respectively). On the other hand there is little difference in the top sediment Hg
concentrations (0.30 and 0.33 µg/g, respectively for Breidtjern and Tollreien) and loading of Hg to the
two lakes are assumed similar. This is confirmed with patterns of Hg concentrations in moss
(Hylocomium splendens, Harmens et al., 2010).
Top consumers of the lake’s food chains were perch (Perca fluviatilis) in Breidtjern, and perch
and pike (Esox Lucius) in Tollreien.
2.1.3 Vuorasjavri
Vuorasjavri (68°58’ N 23°11’ E, ID 40) was selected to represent the subarctic region (Figure 1). The
lake location is dominated by birch forest and wetlands. It is the largest lake (3.4 km2) and catchment
(47.7 km2) of the five lakes included for in-depth analysis. The loading of Hg to the lake (top sediment
Hg concentration is 0.14 µg/g), and deposition of N (10.2 mEq/m2/yr) and S (6.3 10.2 mEq/m
2/yr) are

25
the lowest in the study, reflecting the significantly lower deposition of these compounds normally seen
in northern Norway (i.e. subarctic areas). Air temperature and precipitation is also lower than in the
south, representing the tundra plain described previously.
Top consumers were perch, pike, arctic charr (Salvelinus alpinus) and burbot (Lota lota) in the
Vuorasjavri food chain.
2.2 Sampling
2.2.1 Water sampling
Water sampling during the ice-covered winter period (between November and April) was conducted
using a water sampler (Ruttner, 1 L) at an approximate depth of 1 m below ice cover. The water
sampler was cleaned with acid (1 % trace level grade hydrochloric acid, HCl) followed by rinses with
deionized water (DI). Concentrations of TotHg and MeHg were measured in DI water added to the
sampler after cleaning and the concentrations were found satisfactory (TotHg < method detection limit
(MDL), MeHg < MDL). Samples collected during ice-free periods were taken at a depth of 1 m. All
samples were collected using 250 mL fluoropolymere (FLPE) bottles, following ultraclean sampling
procedures to avoid contamination (USEPA, 1996). Unless otherwise specified, all samples were
collected at the centre of the lake.
All sampling bottles used throughout this study were previously unused and pre-tested for
traces of TotHg (quality tested by Brooks Rand Labs; mean TotHg concentrations = 0.02 ng/L). As
discussed in paper 1, TotHg and MeHg were sampled in individual bottles to avoid errors caused by
loss of Hg during preservation (Parker and Bloom, 2005, paper 1). Samples were stored cold and kept
in double plastic bags. Preservation techniques are based on United States Environmental Protection
Agency (USEPA) method 1630 for MeHg (USEPA, 1998) and method 1631 for TotHg (USEPA,
2002). HCl (concentrated trace level grade, 1 mL) was added to yield a 0.4 % solution for the MeHg
samples. All samples used for TotHg analysis were oxidized with bromine monochloride (BrCl)
within 48 hours after sampling. Samples collected for general water chemistry were collected at the
same time and depths as the Hg samples, but in individual bottles (500 – 1000 mL).

26
2.2.2 Fish sampling
Sampling of fish for papers 5 and 6 focused on populations of perch (Perca fluviatilis) as this specie is
of major relevance regarding exceeding the Norwegian recommended human consumption limits
(Norwegian Food Safety Authority, 2005). Perch is also common in south east Norway and is thus
easily caught in an appropriate sample number. The exception from this is Langtjern, where we
collected trout as perch is not present.
We caught fish with series of gill nets (1.5 m x 25 m) of different mesh size (5 – 45 mm), so a
broad distribution of fish sizes could be targeted. All fish were frozen immediately after sampling and
kept at - 18 °C until analysis. Recording of fish data (length, weight and sex) and sampling of muscle
tissue, otoliths and operculum were conducted according to the EMERGE (European mountain lake
ecosystems: regionalisation, diagnostic and socio-economic evaluation) manual (Rosseland et al.,
2001). For fish age determination we used opercula. Fish maturity stage was determined according to
a method modified from (Dahl, 1917) and described in (Jonsson and Matzow, 1979).
2.2.3 Lower food chain biota sampling
Zooplankton (littoral and pelagic) was sampled using a 250 µm plankton haul net, towed horizontally
through the upper waters (0-2 m). Composition of species was identified in each sample, while
chemical analyses were conducted on pooled samples, due to small body size (specific data given in
paper 4 and supporting information of paper 6). Littoral zoobenthos were collected by kick sampling,
using a hand net with a frame opening of 25 x 25 cm and a mesh size of 0.5 mm that was swept
through the water for 20 seconds, while walking slowly backwards and stirring the bottom substrate
with the feet. The procedure followed guidelines for sampling and devices for benthic macro-
invertebrates in freshwater (EN ISO 10870, 2012). Littoral samples were collected down to 1.0 m
water depth, on bottom substrates made up by periphyton, particulate detritus and accumulated
flocculated peaty DOM between stones and larger rocks. The zoobenthic communities were species-
poor, as is common in humic boreal, and subarctic, lakes of the kind studied in this thesis.

27
2.3 Chemical analysis
2.3.1 Water sample treatment and analysis
The analytical method for MeHg in water was based on USEPA Method 1630 (USEPA, 1998) for
determining MeHg in water by distillation, aqueous ethylation, purge and trap, and cold vapor atomic
fluorescence spectrometry (CVAFS). The method for TotHg followed USEPA Method 1631 for
determining Hg in water by oxidation, purge and trap and CVAFS (USEPA, 2002). The MDL was
0.02 ng/L and 0.1 ng/L (3 standard deviations of method blanks) for MeHg and TotHg, respectively.
For both species automated systems were used for analysis (Brooks Rand Labs MERX automated
systems with Model III AFS Detector). Due to low concentrations of particulate matter all samples
were analysed unfiltered.
For every batch of Hg analysis in water (n = 24 individual samples) quality assurance and
quality control (QA/QC) measures included method blanks (n = 5), blank spikes (n = 5), sample
duplicates (n = 3) and matrix spikes (n = 3). The relative difference of sample duplicates was < 10 %
and < 20 % for TotHg and MeHg, respectively. Recovery of blank spikes and matrix spikes were 80 –
120 % for MeHg and 90 – 110 % for TotHg.
Samples for determination of general water chemistry were analysed according to Norwegian
Standard (NS) and European Standard (EN-ISO). pH was measured by potensiometry (NS4720);
alkalinity was measured by titration (NS-EN-ISO9963); total N (Tot-N; NS4743), total phosphorous
(Tot-P; NS-EN1189) and NO3- (NS4745) was measured by spectrophotometry; and sulphate was
measured by liquid chromatography (NS-EN-ISO10304-1). TOC was measured by infrared
spectrophotometry after high temperature and catalytic combustion to CO2 (NS-EN1484).
2.3.2 Biological analysis
All lower food chain biota samples (except a few samples from paper 4) were extracted and analysed
utilising an acid extraction method described in paper 3. The method is based on Hintelmann and
Nguyen (2005). In short, samples (minimum 0.03 g) were weighed out, added 10 mL 30 % nitric acid
(HNO3) and heated at 60 °C overnight (approximately 15 hours). Before analysis the extraction
solution was added 10 mL DI water. 0.050 mL extraction solution was neutralized with 0.050 mL 15

28
% potassium hydroxide (KOH) and ethylated before purge/trap and gas chromatography CVAFS
analysis and detection as described below.
The analysis method for MeHg is based on USEPA Method 1630 (USEPA, 1998) for
determining MeHg by aqueous ethylation, purge and trap, and CVAFS. As described previously,
automated systems were used for analysis (Brooks Rand Labs MERX automated systems with Model
III AFS Detector). For every batch of MeHg analysis (n = 30 individual samples) QA/QC measures
included method blanks (n = 4), sample duplicates (n = 3), matrix spikes (n = 3) and certified reference
materials (CRMs, n = 6).
Concentrations of MeHg in blank extractions were 1.0 ± 0.3 pg/mL (mean ± 1 standard
deviation). This translates to detection limits (DL) of 1.0 pg/mL or better (3 standard deviations of
blank concentrations). The actual limit of detection (LOD) varies depending on the weight of sample
available for analysis. For sample weights included in this study (0.02 – 0.15 g), the LOD is in the
range of 0.1 – 1.0 ng/g (3 standard deviations). No sample concentrations in the present study were
found to be below the LOD.
The certified MeHg concentrations of the CRMs used were 0.355 ± 0.056 mg/kg (±
uncertainty), 0.152 ± 0.013 mg/kg and 28.09 ± 0.31 µg/kg for DORM-3 fish protein, TORT-2 lobster
hepatopancreas and SRM-2976 mussel tissue, respectively. Samples that were analysed in duplicates
were also used for matrix spike samples. Samples chosen for matrix spikes were added 1000 pg (0.1
mL of 10.0 ng/mL MeHg hydroxide; MeHgOH). The relative difference of sample duplicates was
always < 10 %, recovery of the CRM within 90 – 110 % and matrix spikes recovery within 75 – 125
%.
More than 90 % of Hg in fish is shown to be present as MeHg (Bloom, 1992), and Hg
concentrations in fish were therefore determined as TotHg. Wet samples of muscle tissue were
analysed by thermal decomposition and direct atomic absorption spectrophotometry (AAS, Lumex
Mercury Analyser RA915). For every 10 samples of Hg analysis, QA/QC measures included method
blanks sample duplicates (n = 2) and CRM (DORM-3 fish protein; n = 2). The relative difference of
sample duplicates was always < 10 % and recovery of the CRM within 90 – 110 %. If QA/QC
measures were not met, samples were re-analysed.
29
2.4 Data sources
Catchment area and wetland area were determined using Geographical Information System (GIS)
software (ESRI ArcMap 10.0). The GIS software was used in combination with Web Map Services
(WMS) available from The Norwegian Geo Network. Background lake data (i.e. lake size, lake
identification number and elevation) were gathered from the National Lake Database of The
Norwegian Water Resources and Energy Directorate (NVE).
Deposition data for S and N were supplied by The Norwegian Institute for Air Research
(NILU). The data set is based on interpolated data from the period 2007 to 2011 (Aas et al., 2012;
samples collected on a daily or weekly basis). Top sediment (0 – 0.5 cm) TotHg concentrations were
interpolated by kriging, based on measurement of sediment TotHg in Norway during 2006 – 2008
(Skjelkvåle, 2008). Investigations of lake sediments indicated considerable enrichment of Hg in top
sediments compared with preindustrial sediments, and good correlations between contents of moss Hg
and Hg in top sediments, indicate that the top sediment TotHg concentrations can be used as a proxy
for TotHg deposition (Fjeld et al., 1994).
Temperature and precipitation is presented as the yearly average value for each lake between
1961 and 1990, based on procedures described by World Meteorological Organisation (WMO, 1989).
We chose data from the last available standard reference period in climatology as it represents the
“normal” climate conditions in a specific area. The data is available from Norwegian Meteorological
Institute (eKlima, 2013). Run-off was estimated for each lake based on models from NVE (Beldring et
al., 2003) and show the annual average between 1961 and 1990 (NVE, 2013).
2.5 Statistical analysis
All statistical analyses and calculations were performed in JMP 9.0 or JMP 11.0 with a significance
level α = 0.05, unless otherwise mentioned. Utilised statistical tests and methods are described in
detail in the individual papers, while statistical modelling (paper 2 and 5) are described in the
following paragraphs.

30
2.5.1 Spatial water data (paper 2)
To avoid influence from non-normality and reduce heteroscedasticity in the statistical analysis from
paper 2, all data variables were tested by the Shapiro-Wilks test. Variables that showed non-normality
were transformed to a logarithmic scale and again tested for normality. For variables that did not show
normality after a logarithmic transformation the Box and Cox transformation were used to find a
power transformation that fitted the response best.
Multivariate correlations between selected variables (predictors) and responses (MeHg
concentrations, TotHg concentrations and %MeHg) were explored by Pearson’s correlation
coefficient, r. To avoid over-fitted models due to multi co-linearity between our predictors we chose
partial least squares (PLS) analysis to model and show the predictors that can best describe the spatial
variations of our responses in the studied lakes. The PLS method is designed to include co-linear
predictors by constructing new variables underlying the observed predictors. By doing this, most
variance in the observed predictors is concentrated in the first new variables and the number of
dimensions is effectively reduced (Dormann et al., 2013). The final models are represented by the
goodness of fit (r2) and the root mean square error (RMSE) of the linear regression, in addition to
individual model coefficients for the selected predictors.
To test for significant differences in lake characteristics between subarctic and boreal
catchments, or other groups of lakes/characteristics, Student’s t-tests were used.
2.5.2 Fish data treatment and calculations (paper 5)
When Hg concentration in fish is to be compared between lakes, years and seasons, a length and/or
age adjustment is needed due to the strong co-variation between Hg concentration and fish size (i.e.
length and weight; Sonesten, 2003, Chasar et al., 2009) and hence, also age (paper 5). To investigate
the Hg concentration variations, we utilised a covariance analysis creating a general linear model.
Potential explanatory variables to the model included season and year of sampling, as well as the fish
characteristics; length, weight, age, sex, maturity stage and δ13
C and δ15
N . To evaluate potential
changes in the relationship between fish length and Hg concentrations (length*season and
31
length*year) and between fish age and Hg concentrations over time (age*year), interaction terms were
also included in the model (also season*year). Additionally, we included the interaction term
evaluating change in relationship between δ15
N data and Hg concentrations over time (δ15
N*year).
Explanatory variables were chosen, evaluated and included in the model based on significance and the
Akaike Information Criterion (AIC). To avoid influence from non-normality and reduce
heteroscedasticity in the statistical analysis, the numerical data variables fish Hg concentrations,
length, weight and age were transformed to a logarithmic scale.

32
3 Results and discussion
3.1 Methodological developments
Despite an increasing focus on low level methods for determination of Hg species in general and
MeHg specifically in different matrices over the last decades, few studies have paid attention to direct
effects and comparisons of different sample preparation methods. Important aspects of this are
preservation techniques for water samples and choice of method for biota extraction and digestion.
3.1.1 Water sample preservation techniques
In paper 1 we demonstrate that different preservation techniques give significantly different
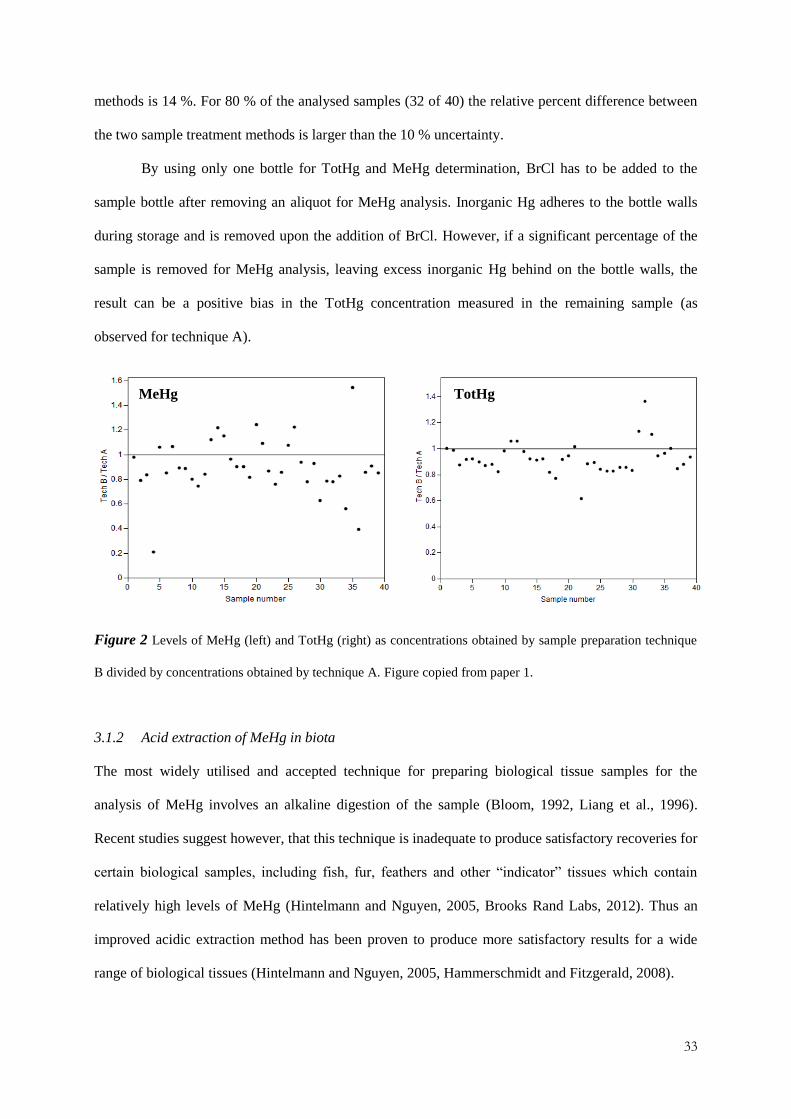
concentrations of TotHg and MeHg in freshwaters (9 and 14 % on average, respectively, Figure 2).
Natural stream samples from a forested lake catchment were studied. Mean stream sample
concentrations of TotHg (3.6 ng/L) and MeHg (0.06 ng/L) reflect levels typical for pristine humic
boreal catchments.
Two sample preparation techniques were tested, A and B. Technique A involved the use of
one bottle (fluorinated ethylene propylene (FEP) 125 mL) for determining both MeHg and TotHg.
These samples were preserved with HCl upon arrival at the laboratory (3-5 days after field sampling)
and the analysis proceeded by the removal of a sample aliquot (25 mL) for determining MeHg first,
before BrCl was added and the remainder of the sample used for determination of TotHg. Technique B
involved the determination of MeHg and TotHg in two separate bottles (FLPE, 250 mL). HCl was
added to the MeHg bottle just prior to sampling and BrCl to the TotHg bottle upon arrival to the
laboratory.
The main causes of the observed differences in TotHg and MeHg concentrations between
technique A and B is the use of one instead of two sample bottles and the timing of sample
acidification, respectively. Delayed timing of sample acidification (3-5 days after sampling) could
possibly cause in-bottle methylation and lead to increased MeHg concentrations (as observed for
technique A). For MeHg, the analytical uncertainty value is 10 % (determined as relative percentage
difference of sample duplicates), while the mean difference between the two studied sample treatment
33
methods is 14 %. For 80 % of the analysed samples (32 of 40) the relative percent difference between
the two sample treatment methods is larger than the 10 % uncertainty.
By using only one bottle for TotHg and MeHg determination, BrCl has to be added to the
sample bottle after removing an aliquot for MeHg analysis. Inorganic Hg adheres to the bottle walls
during storage and is removed upon the addition of BrCl. However, if a significant percentage of the
sample is removed for MeHg analysis, leaving excess inorganic Hg behind on the bottle walls, the
result can be a positive bias in the TotHg concentration measured in the remaining sample (as
observed for technique A).
Figure 2 Levels of MeHg (left) and TotHg (right) as concentrations obtained by sample preparation technique
B divided by concentrations obtained by technique A. Figure copied from paper 1.
3.1.2 Acid extraction of MeHg in biota
The most widely utilised and accepted technique for preparing biological tissue samples for the
analysis of MeHg involves an alkaline digestion of the sample (Bloom, 1992, Liang et al., 1996).
Recent studies suggest however, that this technique is inadequate to produce satisfactory recoveries for
certain biological samples, including fish, fur, feathers and other “indicator” tissues which contain
relatively high levels of MeHg (Hintelmann and Nguyen, 2005, Brooks Rand Labs, 2012). Thus an
improved acidic extraction method has been proven to produce more satisfactory results for a wide
range of biological tissues (Hintelmann and Nguyen, 2005, Hammerschmidt and Fitzgerald, 2008).
MeHg TotHg

34
In paper 3 we compare the two methods on real sample material from different organisms of
an Arctic marine food chain, and reveal how this could lead to misinterpretation of analytical results.
Results show significantly (p < 0.05) lower concentrations of MeHg using alkaline digestion for large
parts of the food chain, especially in fish and birds (Figure 3). The mean differences in concentrations
found between the two different methods were 28, 31 and 25 % for fish (Polar and Atlantic cod),
seabird (Little Auk) and seagull (Kittiwake), respectively. For samples lower in the food chain (i.e.
zooplankton and krill) no significant differences were found. This leads to a clear underestimation of
the levels of MeHg found higher up in these food chains, the ratio of MeHg to Hg in biological
samples, and thus potentially erroneous conclusions drawn from these results concerning the
biological cycling of mercury species. Specifically, this has implications for studies of MeHg
biomagnification, through calculations of TMS.
Figure 3 Levels of MeHg in the biological samples as concentration obtained by the acid extraction divided by
concentrations obtained by the alkaline digestion. Figure shows Little Auk samples (left) and Polar and Atlantic
cod samples (right). The dotted horizontal lines represent the 1:1 relationship between the concentrations
obtained by the two sample treatment techniques ([Acid extraction]:[Alkaline digestion]). Samples are sorted by
increasing concentrations of MeHg obtained by the acid extraction method from left to right. Figure modified
from paper 3.

35
We hypothesize that the main reasons for the observed differences are poor extraction efficiency
and/or matrix effects on the ethylation step prior to analysis. This is the first study to examine the
effects of these artefacts on real environmental samples covering a complete food chain. Based on the
results we conclude that care must be taken when choosing the sample treatment method for analysis
of MeHg in biological samples, and that interpretation of results from alkaline digestions should be
carried out with caution.
3.2 Hg concentration in Norwegian freshwater fish
Based on the increased fish Hg concentrations documented for perch in southeast Norway between the
1990s and 2008 (Fjeld and Rognerud, 2009), lakes Breidtjern and Tollreien was investigated also for
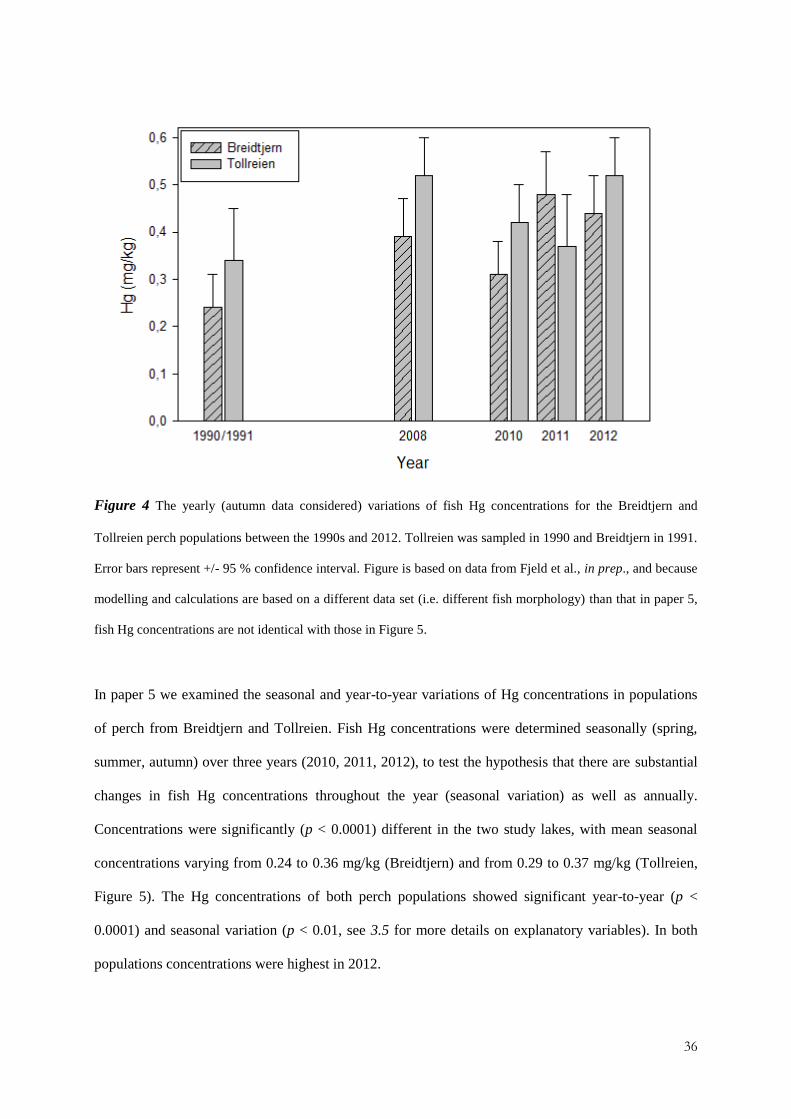
the period 2010 to 2012 (Figure 1, ID 1 and ID11, respectively). Concentrations obtained from 2010,
2011 and 2012 (only autumn data considered, Figure 4) confirm the trend suggested by Fjeld and
Rognerud (2009). Although concentrations in 2010 were lower in both Breidtjern (0.31 ± 0.07 mg/kg)
and Tollreien (0.42 ± 0.08 mg/kg) compared to concentrations in 2008 (0.39 ± 0.08 and 0.52 ± 0.08
mg/kg, respectively), concentrations in 2011 (0.48 ± 0.09 and 0.37 ± 0.11 mg/kg, respectively) and
2012 (0.44 ± 0.08 and 0.52 ± 0.08 mg/kg, respectively) confirms the trend of increasing
concentrations.
Recent literature suggests that concentrations of Hg in fish between the 1970s and today are
decreasing or increasing depending on the decades of sampling (Gandhi et al., 2014). Overall (1970-
2012) the data from the Great Lakes region in North America shows neutral or declining trends of Hg
concentrations (depending of fish species analysed). However, broken down into shorter time periods,
the data shows that the trends were decreasing in the early decades (1970-1990), while recent trends
are showing increasing concentrations (1985-2005 and 1995-2012). To get a clearer picture of whether
the changing concentrations observed in Norway between the 1990s and 2008 (Fjeld and Rognerud,
2009) was because of “outlier-years”, or because it was a general trend of increasing concentrations
between the 1990s and today, we studied recent developments in detail.
36
Figure 4 The yearly (autumn data considered) variations of fish Hg concentrations for the Breidtjern and
Tollreien perch populations between the 1990s and 2012. Tollreien was sampled in 1990 and Breidtjern in 1991.
Error bars represent +/- 95 % confidence interval. Figure is based on data from Fjeld et al., in prep., and because
modelling and calculations are based on a different data set (i.e. different fish morphology) than that in paper 5,
fish Hg concentrations are not identical with those in Figure 5.
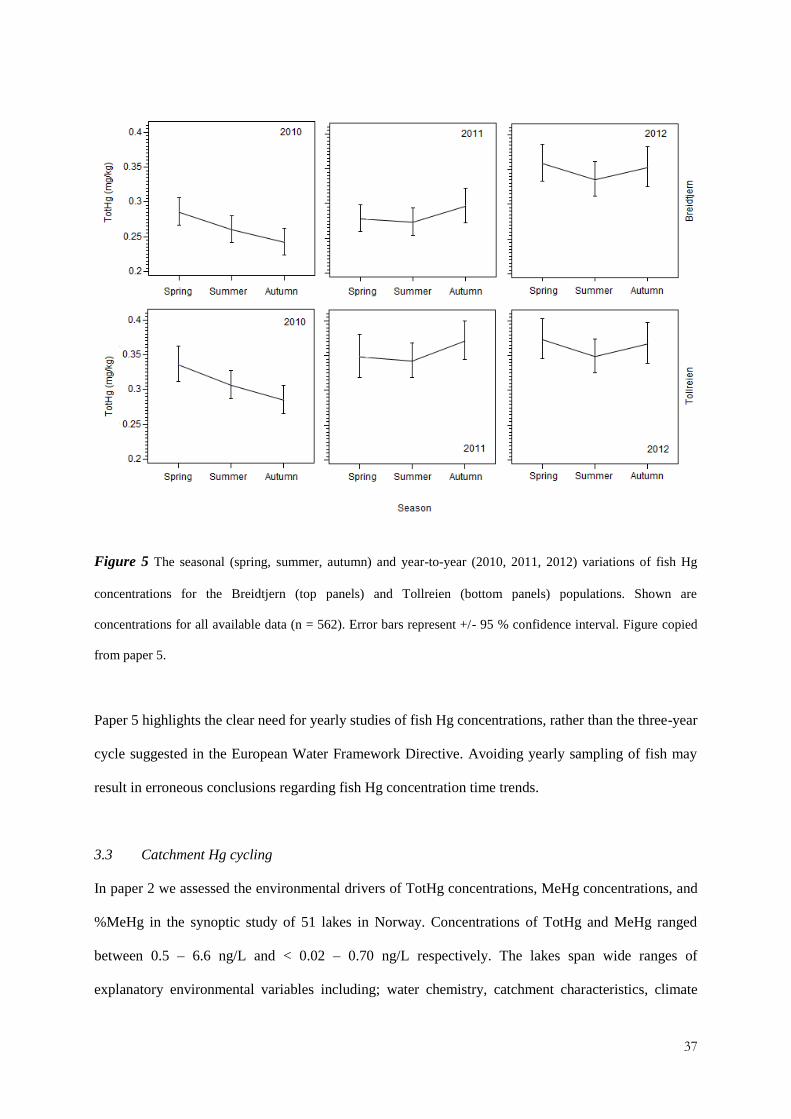
In paper 5 we examined the seasonal and year-to-year variations of Hg concentrations in populations
of perch from Breidtjern and Tollreien. Fish Hg concentrations were determined seasonally (spring,
summer, autumn) over three years (2010, 2011, 2012), to test the hypothesis that there are substantial
changes in fish Hg concentrations throughout the year (seasonal variation) as well as annually.
Concentrations were significantly (p < 0.0001) different in the two study lakes, with mean seasonal
concentrations varying from 0.24 to 0.36 mg/kg (Breidtjern) and from 0.29 to 0.37 mg/kg (Tollreien,
Figure 5). The Hg concentrations of both perch populations showed significant year-to-year (p <
0.0001) and seasonal variation (p < 0.01, see 3.5 for more details on explanatory variables). In both
populations concentrations were highest in 2012.
37
Figure 5 The seasonal (spring, summer, autumn) and year-to-year (2010, 2011, 2012) variations of fish Hg
concentrations for the Breidtjern (top panels) and Tollreien (bottom panels) populations. Shown are
concentrations for all available data (n = 562). Error bars represent +/- 95 % confidence interval. Figure copied
from paper 5.
Paper 5 highlights the clear need for yearly studies of fish Hg concentrations, rather than the three-year
cycle suggested in the European Water Framework Directive. Avoiding yearly sampling of fish may
result in erroneous conclusions regarding fish Hg concentration time trends.
3.3 Catchment Hg cycling
In paper 2 we assessed the environmental drivers of TotHg concentrations, MeHg concentrations, and
%MeHg in the synoptic study of 51 lakes in Norway. Concentrations of TotHg and MeHg ranged
between 0.5 – 6.6 ng/L and < 0.02 – 0.70 ng/L respectively. The lakes span wide ranges of
explanatory environmental variables including; water chemistry, catchment characteristics, climate

38
conditions and atmospheric deposition of Hg, sulphur and N. In addition to DOM-vectored transport
of Hg species (see 3.3.1) and catchment base cation status (see 3.3.2), a long range of other catchment
factors are previously shown to affect methylation of inorganic Hg and the surface water Hg species
concentration (Bishop and Lee, 1997). This includes; the size of the catchment area (Grigal, 2002, see
3.3.3), productivity (St. Louis et al., 1996, Tjerngren et al., 2012a, St. Louis et al., 1994), the size of
catchment wetlands (Eklof et al., 2012, see 3.3.4), and forestry operations (Bishop et al., 2009, Porvari
et al., 2003).
3.3.1 OM as transport vector
Dissolved organic matter (DOM), measured as TOC, was the variable most strongly correlated with
TotHg (r2
= 0.76) and MeHg (r2
= 0.64) concentrations in our study lakes (Figure 6). In several boreal
lakes, DOC is shown to be the largest pool of organic C (TOC consists of > 90 % DOC; Wetzel, 2001,
Hessen, 2005, Kortelainen et al., 2006, de Wit et al., 2012) and we used TOC as a measure of the
concentrations of OM in the lake systems. Additionally, the supply of allochthonous DOC in humic
lakes is many times higher than the production of autochthonous DOC (Hessen, 1992, Jonsson et al.,
2001). Of which, the major component originates from terrestrial catchment primary production
(Jansson et al., 2008, Wilkinson et al., 2013).
The relationship observed for both TotHg and MeHg with TOC has also been shown
elsewhere; both in Scandinavia (Meili et al., 1991, Skyllberg et al., 2003, Eklof et al., 2012) and North
America (Driscoll et al., 1995, Benoit et al., 2003, Shanley et al., 2005). The importance of this
correlation is also shown by the PLS analysis (Figure 7), where TOC was the strongest positive
explanatory variable for both species. The significant relationship (p < 0.05) between TOC
concentrations and TotHg and MeHg concentrations indicates that the relationship exists
independently of the other explanatory variables included in this study. In other words; independently
of location (i.e. climate), deposition patterns and size of the lake-catchment system, Hg species will be
transported by OM from the catchment soil to the surface water of the receiving lake.

39
Figure 6 Scatter plots of TotHg (left) and MeHg (right) concentrations versus TOC concentrations in our study
lakes (n = 51). Solid lines represent the linear regression models (TotHg = 0.11 + 0.31*TOC, r2 = 0.76; MeHg =
-0.06 + 0.02*TOC, r2 = 0.50). The shaded area represent the confidence curve for the linear line and the broken
lines the confidence curve for the individual values. Lakes from the subarctic are shown as triangles (n = 5);
lakes from the boreal Ecoregion as open circles; and filled data points indicate lakes where MeHg concentrations
are > 10% of TotHg (n = 2). Figure copied from paper 2.
3.3.2 Catchment base cation status
After TOC, the most significant explanatory variables in our synoptic lake study were N availability
(discussed in detail under 3.3.4), base cation status, lake size and catchment area. Both pH and
alkalinity were shown to be significant explanatory variables for TotHg concentrations, MeHg
concentrations, and %MeHg in the PLS analysis (Figure 7). TOC, pH and alkalinity are strongly
internally correlated (see paper 2 for Pearson’s correlations). Such internal correlations could hamper
an interpretation of independent effects of these variables on TotHg concentrations, because they have
opposite effects on TotHg (consistent with the sign of their internal correlation, Figure 7). However,
for MeHg and %MeHg the correlations with TOC, pH and alkalinity are all positive, which could
imply that TOC and pH/alkalinity are separate controls for MeHg and %MeHg. With lake water pH
and alkalinity and catchment base cation status being correlated (Pennanen et al., 1998), a possible

40
interpretation is that the microbial activity is stimulated in soils with lower acidity (i.e. higher pH) and
higher base cation status (Mulder et al., 2001, Oulehle et al., 2006). Higher MeHg production is a
possible side effect of this stimulation, as increased activity of the SRB community has been shown to
increase the MeHg production (Ullrich et al., 2001). However, the effect of pH on methylation is
debated, with studies showing both increased (Gilmour and Henry, 1991) and decreased (Steffan et al.,
1988) methylation rates under low pH conditions.
Figure 7 Individual model coefficients from the PLS analysis for each selected predictor for the responses:
TotHg concentrations (top left), MeHg concentrations (left) and %MeHg (right). The predictors shown are total
organic carbon (TOC), total phosphorous (Tot-P), total nitrogen (Tot-N), pH, alkalinity, lake size and catchment
area. Figure copied from paper 2.

41
3.3.3 Catchment area
In our synoptic study (paper 2), concentrations of TotHg were not significantly related to neither lake
size nor catchment area (p > 0.05). However, we found a significant negative relationship between
TotHg and lake-catchment ratio (r = -0.41, p < 0.01). This is consistent with the idea that catchment
loading of Hg dominates over direct on-lake Hg deposition (Lee et al., 1998, Lee et al., 2000). The
larger the catchment compared to the lake area, the larger this effect is. MeHg concentrations and
%MeHg were significantly negatively influenced by both lake size (r = -0.58 and r = -0.54,
respectively, both p < 0.01) and catchment area (r = -0.44 and r = -0.51, respectively, both p < 0.01,
Figure 7), but not by the lake-to-catchment ratio (r = -0.24, p = 0.10 and r = -0.01, p = 0.92,
respectively). We suggest that the effect of lake size and catchment area could be related to the amount
of surface water in the catchment, including both streamwater and the lake itself, where loss of MeHg
by PD (Sellers et al., 1996) contributes to decrease MeHg leached from catchment soils and wetlands.
The influence of PD on lake MeHg concentrations and future MeHg availability is discussed in detail
further on (3.4.3 PD of MeHg).
3.3.4 Nutrient mediated methylation
The main difference between significant explanatory variables for TotHg and MeHg concentrations in
paper 2 was Tot-N (Figure 7). While Tot-N concentrations were strongly positively correlated with
both concentrations of MeHg (r = 0.34, p < 0.01) and %MeHg (r = 0.40, p < 0.01), correlations with
TotHg were not significant (r = -0.03, p = 0.83). We tested other indicators of lake nutrient status (i.e.
NO3- concentrations, NO3
--to-Tot-N ratios and NO3
--to-Tot-P ratios; (Bergstrom et al., 2008), in
addition to C/N ratios) without finding similar relations with MeHg and %MeHg. Still, Tot-N is an
indicator of total N availability and therefore we suggest that methylation is stimulated by N
availability. To our knowledge, no previous study has shown a similar influence of N on methylation
of Hg in boreal lakes.
A recent study of Hg methylation in wetlands from Sweden (Tjerngren et al., 2012a) indicated
that intermediate levels of nutrient status (measured as C/N ratios in the soil and NO3- in outlet stream
waters) give the highest MeHg production rates. This is consistent with the two lakes that had ratios of

42
%MeHg outside the 1.5*interquartile range (14.7 and 27.1 %) in the present study (Figure 6). Both
lakes had intermediate concentrations of Tot-N (415 and 455 µg/L) and nitrate (43 and 57 µg/L). We
did not find support for a relationship between concentrations of NO3- and MeHg elsewhere in our
dataset however.
In contrast to our study, negative relationships were found between NO3- and MeHg
concentrations in studies of the water column (Todorova et al., 2009) and sediments (Matthews et al.,
2013) of a seasonally stratified, though contaminated lake in North America. The authors show that
high concentrations of NO3- suppress MeHg accumulation and interpret this as an effect of NO3
-
outcompeting sulphate as electron acceptor for NO3--reducing microorganisms. Further, the authors
hypothesize that a negative NO3- control of MeHg production could occur in remote areas impacted by
atmospheric Hg and N deposition.
In a study from the marine environment, nutrient loading (of mainly N) affected Hg
contamination by reducing bioavailability and trophic transfer (Driscoll et al., 2012). Driscoll et al.
(2012) conclude that a better understanding of the linkages between nutrient loading and Hg
contamination is needed. Another marine study (Zhang et al., 2013) indicates significant relationships
of both N and P with MeHg and TotHg concentrations in surface sediments. The authors do not
however, provide an explanation other than a link to the OM of the sediments. The relationship
between MeHg and N is also demonstrated in pore water and sediments of polluted reservoirs (He et
al., 2008). Our study indicates that relationships between methylation and nutrient status are poorly
understood and deserve more attention. Based on paper 2 we cannot conclude as to whether the
process of nutrient influenced methylation occurs in the catchment or the lake water phase.
3.4 Aquatic in-lake processes
In addition to the water chemistry parameters we investigated in paper 2, we also explored aquatic in-
lake processes in paper 7 (PD of MeHg), paper 4 (habitat specific methylation) and paper 6
(chlorophyll versus TOC associated transport of MeHg from the water to the food chain).

43
3.4.1 OM as methylation substrate
While the spatial study of Hg speciation in surface waters (paper 2) revealed a relatively strong
correlation between TOC and MeHg, this correlation is often not present at a temporal scale (paper 1,
data not shown). This is related to the fact that DOM, in addition to being a Hg transport vector, also
has an additional influence on MeHg concentrations. This is evident through the fact that the simple
linear regression we performed in paper 2 revealed no significant correlation between %MeHg and
TOC concentrations (r = 0.20, p > 0.05). The PLS analysis did however show that TOC had a
significant positive influence on the %MeHg, but the relationship was weaker than for both TotHg and
MeHg concentrations (Figure 7). The significant positive correlation for both TotHg and MeHg
concentrations with TOC concentrations is likely to be related to DOM as a transport vector for Hg
species from the catchment to the surface water (see 3.3.1). However, DOM is also a necessary factor
in the production of MeHg as a substrate for methylation (Ullrich et al., 2001). Possibly, this explains
the weaker, but still positive, influence of TOC concentrations on %MeHg.
3.4.2 PD of MeHg
In paper 7 we assessed the importance of PD for the MeHg concentrations in Breidtjern, Tollreien,
Sognsvann and Langtjern. We measured light attenuation coefficients for photosynthetically active
radiation (PAR) and ultraviolet radiation (UV-A and UV-B), and found that values differed strongly
between the study lakes (Langtjern and Sognsvann presented in Figure 8). Much more rapid
attenuation of light (for all wavelengths) was documented in the three humic study lakes (Breidtjern,
Tollreien and Langtjern) than in clear-water Sognsvann. We found close agreement between measured
attenuation coefficients for PAR, UV-A and UV-B and attenuation coefficients calculated based on
published relationships between DOC, chlorophyll a and attenuation (Morris et al., 1995). Together
this highlights the importance of OM in determining the attenuation of light in these boreal lakes. In
unproductive lakes with minimal suspended particulate matter, similar to the ones in the present study,
DOM can be expected to dominate the light absorption (as previously observed in several studies,
including Thrane et al., 2014 and Morris et al., 1995).

44
We also calculated the whole lake loss of MeHg for Langtjern and Sognsvann (cumulative
loss through the water profile shown in Figure 8). Langtjern and Sognsvann are the study lakes with
the highest and lowest concentrations of TOC in paper 7 (12.0 and 3.9 mg/L, respectively). Both lakes
show highest loss during summer months, due to seasonality in incident PAR flux (data shown in
paper 7). Maximum loss of MeHg was observed for June, with losses of 71 and 36 ng/m2 for Langtjern
and Sognsvann, respectively. The difference in PD loss between the two study sites is in part a
reflection of differences in lake water MeHg concentrations, given that Langtjern has 4-fold higher
MeHg concentrations than Sognsvann. However, despite this 4-fold difference in MeHg
concentrations, there was only a 2-fold difference in MeHg loss between the two lakes, due to higher
attenuation of light in Langtjern.
Figure 8 Attenuation (as % of surface light, x-axis) and cumulative areal loss (ng/m2, x-axis) of PAR (long
dashed lines), UV-A (dotted lines) and UV-B (short dashed lines) versus depth (y-axis, m) for Langtjern (left
panels) and Sognsvann (right panels). Shown is also total cumulative areal loss (solid line). Note the different
scaling on the y-axis for the two lakes. Figure copied from paper 7.
Our estimated annual whole lake losses of MeHg during the year (excluding periods of ice cover)
were, 68 and 63 mg/year for Langtjern and Sognsvann respectively. For Langtjern, detailed
information is available regarding Hg inputs, cycling and outputs (see paper 7 for details). Our
estimate of annual loss through PD for Langtjern suggests that nearly 27 % of the annual inputs (253

45
mg/yr) are lost to PD processes during the year (Table 2). Indeed, our estimates indicate that nearly 6
% (16 mg) is lost in June alone. Mean annual losses of MeHg from Langtjern through the lake outflow
were estimated to be 265 mg, 5 % higher than the estimated annual inputs. Given the substantial PD
losses that we have calculated for Langtjern, the difference in MeHg concentrations between inflow
and outflow suggests that there may be substantial methylation of Hg taking place within this lake.
3.4.3 Future PD loss scenarios
In many northern boreal regions, climate change and decreases in atmospheric deposition of sulphate
are expected to drive strong increases in DOC export from terrestrial catchments to surface waters
(Monteith et al., 2007, Larsen et al., 2011). Additionally, climate change is expected to lead to reduced
ice cover duration (ICD) in boreal lakes (Magnuson et al., 2000), with southern Norwegian lakes
expected to experience a reduction in ICD of approximately two weeks by 2100. Based on this, we
calculated future PD losses for Langtjern and Sognsvann (only Langtjern shown here, Table 2) based
on three scenarios: A) a 20 % increase in TOC concentration, B) a 20 % increase in TOC
concentration paired with a 20 % increase in MeHg concentrations (since MeHg concentrations are
shown to be significantly correlated with TOC concentrations in Norwegian lakes (paper 2)), and C)
scenario B along with a reduction in ICD based on estimated ICD for the year 2100.
Due to reduced light penetration, Langtjern PD losses under scenario A (47 mg/yr) were 31 %
lower than current values (68 mg/yr), indicating that increases in DOC loading to lakes can be
expected to strongly reduce PD of MeHg. In scenario B we tested the cumulative effects of a 20 %
increase in DOC paired with a 20 % increase in MeHg concentrations. In this scenario, increased
MeHg concentrations led to a 21 % increase (57 mg/yr) in areal PD loss relative to Scenario A.
However, if we assume that catchment MeHg inputs have increased 20 %, loss of MeHg through PD
relative to total inputs would be 22 % for Langtjern. These proportional losses are lower in Scenario B
than for the current situation (27 %), despite higher total inputs, suggesting that under Scenario B, we
may expect higher aqueous MeHg concentrations due to a combination of increased inputs and
reduced losses. It should also be noted that increased DOC inputs may also lead to increased Hg

46
methylation due to availability of substrate for methylation and increased anoxia (Ullrich et al., 2001),
which could act to further increase aqueous MeHg concentrations.
When future reduced ICD was considered, along with potential increases in DOC and MeHg
concentrations (Scenario C), we found that due to changes in ICD, PD losses would increase to 61
mg/yr (7 % increase calculated relative to Scenario B, 30 % increase calculated relative to Scenario
A). However, loss of MeHg through PD relative to total estimated inputs (Scenario C: 24 %) were
very similar to those observed for Scenario B (22 %), suggesting that reduced ICD will not offset the
negative effects of increased DOC loading on PD losses.
Table 2 The scenario parameters DOC concentrations, MeHg concentrations and ICD for study catchment
Langtjern with current and future calculated PD loss (both absolute values and relative to the total annual input
of 253 mg/yr). Shown are future PD loss scenarios A (20 % increase in DOC concentrations), B (scenario A plus
20 % increase in MeHg concentrations) and C (scenario B and year 2100 ICD estimate). Table modified from
paper 7.
Specification (Langtjern) Units Current
situation
Scenario
A
Scenario
B
Scenario
C
Scenario parameters
DOC
MeHg
ICD
mg/L
ng/L
days
12.0
0.08
185
14.4
0.08
185
14.4
0.10
185
14.4
0.10
168
Loss (PD)
mg/yr 68 47 57 61
Loss (ratio PD of total input) % 27 19 23 24
Combined, the future scenarios A, B and C highlight the importance of DOC-related light attenuation
in driving losses of MeHg through PD. The data suggest that future increases in DOM loading to
boreal aquatic ecosystems may lead to a shift in the balance between inputs and PD-related losses,
with the potential for higher aqueous MeHg concentrations. However, the effects of DOC on uptake
and trophic transfer of MeHg in aquatic food chains are highly complex, and it is difficult to predict
how DOC-related shifts in the aqueous MeHg balance of lakes will affect concentrations in the food
chain. There is evidence that DOC can reduce availability and phytoplankton uptake of MeHg

47
(Luengen et al., 2012). Additionally, French et al. (2014) report a unimodal response of invertebrate
MeHg bioaccumulation to DOC concentrations, with increasing MeHg bioaccumulation up to a
threshold of ~8.5 mg C/L and decreased bioaccumulation above this threshold. DOC-related
ecological changes may also influence MeHg uptake and concentrations at higher trophic levels
through changes in primary and bacterial productivity (Vallieres et al., 2008). In particular, increased
importance of bacterial food sources has been shown to lead to elevated food chain concentrations of
biomagnifying compounds such as MeHg (de Wit et al., 2012).
3.4.4 Habitat specific in-lake methylation
The relation between high Hg concentrations in aquatic organisms and coloured lakes is well
acknowledged (Hakanson et al., 1988), but less is known about how in-lake variation in MeHg relates
to habitat and dietary uptake to organisms. Concentration of MeHg in different habitats and associated
food chains may vary because of habitat characteristics that determine methylation and MeHg transfer.
There are strong variations in Hg bioaccumulation rates in lake food chains which are yet poorly
explained, but are believed to depend on physical and chemical lake characteristics (Clayden et al.,
2013). Few studies have combined focus on Hg concentrations in organisms and sediments in
coloured lakes. The three main lake habitats littoral, pelagial and profundal offer contrasting quality
and nutrients for their primary consumers (Chetelat et al., 2011, Vadeboncoeur et al., 2002).
The relation between habitat-dependent energy sources and MeHg remains unclear. Profundal
sediments are usually viewed as hot spots for MeHg, through methylation of inorganic Hg by SRB
under anoxic conditions (Morel et al., 1998, Benoit et al., 2003, Gilmour et al., 1998). In paper 4 we
found however, that in Langtjern MeHg in primary consumers increased from profundal to littoral, a
pattern reflected by surface sediments concentrations (Figure 9). These findings confirm the studies by
Kainz et al. (2003) and Ethier et al. (2010), where higher MeHg concentrations were found in littoral
compared to profundal sediments. Moreover, the methylation potential (expressed as the ratio of
MeHg to TotHg, %MeHg) was lower in profundal than in littoral sediments, suggesting that littoral
sediments have higher net methylation rates.

48
High MeHg concentrations in littoral primary consumers and sediments suggest that shallow lake
sediments are important for MeHg transfer to the aquatic food chain in boreal humic lakes (see 3.4.5
for more on transfer of MeHg to boreal and subarctic food chains). Lake morphometry, specifically the
fraction of littoral, is hence likely to add to differences in MeHg bioaccumulation rates in lake food
chains. For Langtjern, a small and relatively shallow lake with short water residence time (mean is 72
days for the period 1973-2012, Couture et al. in review), there is a high degree of water-sediment
contact due to the frequently exchange of water. This is of importance for the methylation of Hg
because maximal net methylation is often observed in surface sediments (Ramlal et al., 1993), due to
constant input of fresh OM (Benoit et al., 2003). This suggests that elevated concentrations of MeHg
in the littoral Langtjern sediments could be exchanged with overlying water and readily become
bioavailable for the food chain through biota in the aquatic phase in addition to biota in the top
sediments.
Figure 9 MeHg concentrations in primary consumers (ng MeHg/g, dry weight (dw), left panel) and MeHg and
TotHg concentrations in sediments (ng MeHg/g, dw, on x-axes and ng TotHg/g, dw, on y-axes, right panel) of
the three ecological main compartments in Langtjern. Error bars represent ± one standard deviation on mean
concentrations. Figure modified from paper 4.

49
The observed higher MeHg concentrations in littoral consumers relative to the profundal consumers
may have a significant impact for the higher trophic level species, particularly relevant for perch and
other fish species thought to feed largely on benthic organisms in the littoral zone (Hjelm et al., 2000,
paper 5).
3.4.5 Chlorophyll and TOC associated MeHg transport
MeHg concentrations in zooplankton from Breidtjern (ID 1), Tollreien (ID 11), Langtjern (ID 32) and
Vuorasjavri (ID 40, paper 6) reflect the aquatic MeHg concentrations in the epilimnion water and thus
correspond with the assumption that MeHg concentrations at the bottom of the food chain are
determined by the concentrations in the water column (Chasar et al., 2009). In paper 6, we also
observed a higher zooplankton bioaccumulation factor (BAFZ, [MeHg in organism, ng/kg] / [MeHg in
water, ng/L]) in Vuorasjavri (the subarctic lake, 4.3 L/kg) compared to Breidtjern, Tollreien and
Langtjern (the boreal lakes, 0.7 – 1.1 L/kg). This is consistent with the lower aquatic concentrations of
TotHg and MeHg in subarctic lakes compared to boreal lakes (paper 2), and more similar MeHg
concentrations in the primary and secondary consumers from the two regions (paper 6). However, as
fish Hg concentrations also are shown to be lower in the subarctic (Fjeld and Rognerud, 2009), it is
evident that also other factors affect accumulation of MeHg in fish in the subarctic (see 3.5 Biological
food chain mechanisms).
In the literature, bioconcentration of MeHg is shown to be significantly higher in low DOC
lake water (< 5 mg/L) compared to those in higher DOC water (Gorski et al., 2008). This is clearly
evident also in the present study, where we observe that the linear regression slope of BAF versus
baseline corrected δ15
N values are higher (1.6) in the subarctic lake compared to the boreal lakes (all <
0.8, Figure 10). In French et al. (2014), it is shown that MeHg BAF increases with increasing TOC
concentrations as long as TOC < 8.5 mg/L. Above this concentration limit, MeHg BAF is decreasing.
Since TOC concentrations are low in the subarctic lake of the present study (paper 6), aquatic MeHg
transfer to zooplankton is most likely chlorophyll associated rather than the detritus subsidized
transport in the boreal lakes (Kainz et al., 2008). This fits well with the observed high BAFZ in
Vuorasjavri (4.3 L/kg). Additionally, mean δ13
C levels were significantly higher (less negative) in the
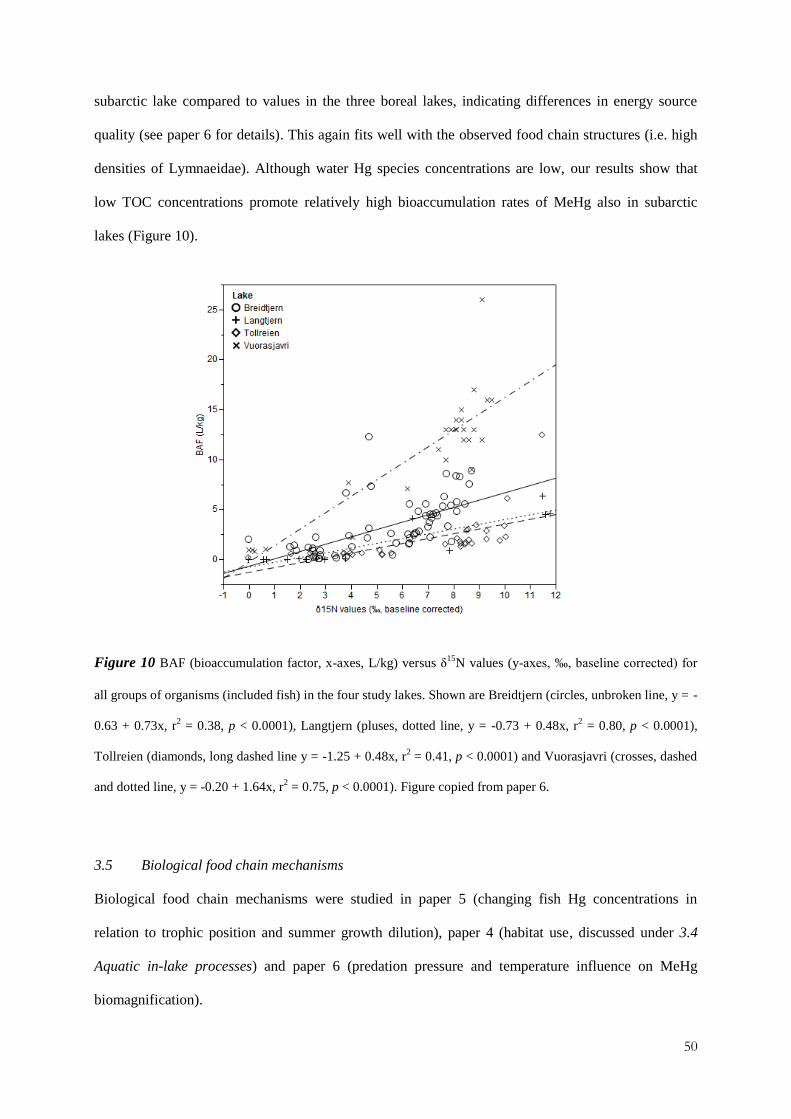
50
subarctic lake compared to values in the three boreal lakes, indicating differences in energy source
quality (see paper 6 for details). This again fits well with the observed food chain structures (i.e. high
densities of Lymnaeidae). Although water Hg species concentrations are low, our results show that
low TOC concentrations promote relatively high bioaccumulation rates of MeHg also in subarctic
lakes (Figure 10).
Figure 10 BAF (bioaccumulation factor, x-axes, L/kg) versus δ15
N values (y-axes, ‰, baseline corrected) for
all groups of organisms (included fish) in the four study lakes. Shown are Breidtjern (circles, unbroken line, y = -
0.63 + 0.73x, r2 = 0.38, p < 0.0001), Langtjern (pluses, dotted line, y = -0.73 + 0.48x, r
2 = 0.80, p < 0.0001),
Tollreien (diamonds, long dashed line y = -1.25 + 0.48x, r2 = 0.41, p < 0.0001) and Vuorasjavri (crosses, dashed
and dotted line, y = -0.20 + 1.64x, r2 = 0.75, p < 0.0001). Figure copied from paper 6.
3.5 Biological food chain mechanisms
Biological food chain mechanisms were studied in paper 5 (changing fish Hg concentrations in
relation to trophic position and summer growth dilution), paper 4 (habitat use, discussed under 3.4
Aquatic in-lake processes) and paper 6 (predation pressure and temperature influence on MeHg
biomagnification).

51
3.5.1 Changing fish trophic position
The fish populations from both Breidtjern and Tollreien show a significant increase in Hg
concentrations from 2010 to 2012 (p < 0.0001), with spring 2012 concentrations being the highest in
the data material (Figure 5). Model predicted Hg concentrations in perch from 2012 (least square mean
Breidtjern: 0.35 ± 0.03 mg/kg, Tollreien: 0.36 ± 0.03 mg/kg) are higher than any of the previous two
years. Based on autumn data, the concentration increase between 2010 and 2012 is 46 % and 28 % in
Breidtjern and Tollreien, respectively.
Interestingly, the concentration change in the two lakes is differently distributed between the
three years. In Breidtjern the increase was 25 % from 2010 to 2011, and 17 % from 2011 to 2012.
Similar numbers for Tollreien are 28 % from 2010 to 2011, while there was no change between 2011
and 2012 (0 %). As both lakes showed an increase from 2010 to 2012, with similar seasonal patterns
(Figure 5), governing processes on a regional scale could be suggested to explain this. But, since our
two lakes show different increases the three study years, processes on a smaller scale are also likely to
occur. The mechanisms controlling these seasonal and yearly variations of fish Hg concentrations are
however not clearly defined in the literature. Parameters suggested to influence temporal fish Hg
dynamics are water chemistry (OM and pH: Akerblom et al., 2012, Rask et al., 2007 and Porvari,
1998), climate factors (temperature: Rask et al., 2010), dietary patterns and trophic position (Rask et
al., 2010).
We investigated the abovementioned parameters, finding that only trophic position influenced
the temporal Hg concentration variations in the perch populations. However, the higher fish Hg
concentrations found in Tollreien compared to Breidtjern reflects the trends of different surface water
chemistry (Table 3), with mean annual concentrations of TotHg, MeHg and %MeHg being
significantly higher in Tollreien than Breidtjern for all three study years (t-tests, p < 0.001). Tollreien
is also more humic than Breidtjern (Table 3). Together this highlights how the availability of aqueous
Hg species to freshwater food chains (through catchment TOC transport: Grigal, 2002, and Hg
speciation in water: Chasar et al., 2009 and de Wit et al., 2012) controls the general fish Hg

52
concentration levels. However, as there is no significant yearly variation seen in the water chemistry,
this does not explain the short-term (yearly and seasonally) variation of fish Hg concentrations.
Mean seasonal δ13
C variations show no significant seasonal variations (p > 0.05, Figure 11),
indicating that the fish populations collected in the present study do not change dietary patterns
(within the same year). However, mean yearly δ13
C levels increase (i.e. less negative values)
significantly (comparisons for each pair using Student’s t, p < 0.05) in Breidtjern from 2010 (-28.7 ‰)
to 2011 (-28.4 ‰) and from 2011 to 2012 (-28.1 ‰, Figure 11). This small change in mean δ13
C signal
could indicate a shift in the carbon sources for the food chain, as previously documented for perch in
Finland (Rask et al., 2010). This could again lead to changing fish Hg uptake due to habitat specific
uptake of MeHg in primary consumers (paper 4).
Table 3 Mean (± one standard deviation) annual water Hg speciation and general water chemistry for Breidtjern
and Tollreien. Data from 2010, 2011 and 2012 is based on n = 3, n = 5 and n = 3 sampling dates, respectively.
Where no standard deviation is indicated, only 1 sample is considered. Table copied from paper 5.
Specification Unit Breidtjern Tollreien
Year 2010 2011 2012 2010 2011 2012
Hg speciation
TotHg ng/L
3.4 3.3 ± 0.8 3.0 ± 0.2 4.5 4.5 ± 1.5 4.6 ± 0.3
MeHg ng/L
0.07 0.08 ± 0.01 0.07 ± 0.01 0.18 0.16 ± 0.03 0.18 ± 0.01
%MeHg % 2.0 2.5 ± 0.4 2.4 ± 0.2 4.0 3.7 ± 0.6 4.0 ± 0.4
General water chemistry
pH - 4.4 ± 1.0 5.0 ± 0.3 5.0 ± 0.2 5.4 ± 0.1 5.4 ± 0.3 5. 4 ± 0.1
Alkalinity mmol/L 0.02 0.03 ± 0.01 0.03 ± 0.01 0.04 ± 0.01 0.05 ± 0.01 0.04 ± 0.01
TOC mg/L 9.5 ± 2.1 9.6 ± 2.2 8.1 ± 1.8 13.1 ± 2.5 14.6 ± 4.3 16.0 ± 0.8
Tot-N µg/L 295 ± 56 374 ± 19 358 ± 21 282 ± 32 341 ± 54 358 ± 11
Nitrate µg/L 21 ± 12 40 ± 9 44 ± 8 5 ± 4 22 ± 15 13 ± 5
Tot-P µg/L 3.7 ± 0.6 5.8 ± 1.5 6.3 ± 3.2 8.0 ± 1.0 9.2 ± 1.3 9.5 ± 3.5
Sulphate mg/L 1.7 ± 0.1 1.7 ± 0.2 1.6 ± 0.1 1.3 ± 0.2 1.3 ± 0.2 1.0 ± 0.1
However, based on present data, changing δ13
C levels will only influence the fish Hg concentrations
seen in Breidtjern, and cannot explain the yearly increase observed in Tollreien. In Tollreien, there is
in fact a significant decrease (i.e. more negative value) seen from 2010 (-29.6 ‰) to 2011 (-30.2 ‰),
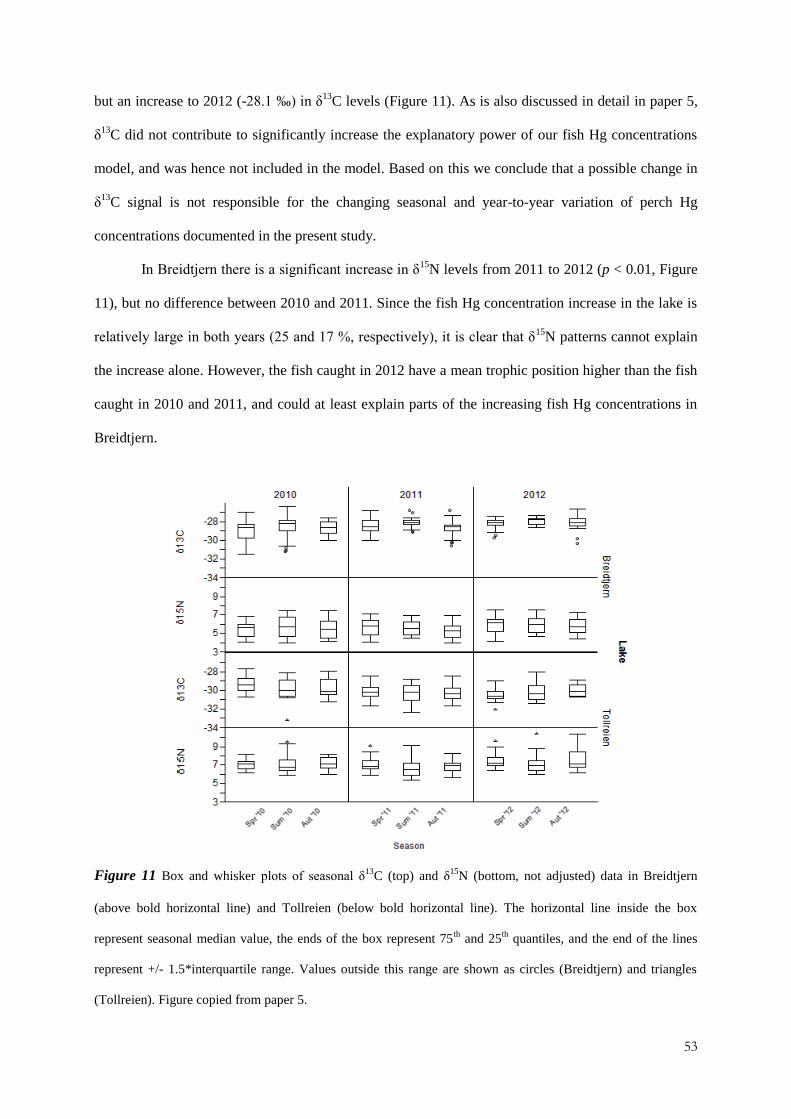
53
but an increase to 2012 (-28.1 ‰) in δ13
C levels (Figure 11). As is also discussed in detail in paper 5,
δ13
C did not contribute to significantly increase the explanatory power of our fish Hg concentrations
model, and was hence not included in the model. Based on this we conclude that a possible change in
δ13
C signal is not responsible for the changing seasonal and year-to-year variation of perch Hg
concentrations documented in the present study.
In Breidtjern there is a significant increase in δ15
N levels from 2011 to 2012 (p < 0.01, Figure
11), but no difference between 2010 and 2011. Since the fish Hg concentration increase in the lake is
relatively large in both years (25 and 17 %, respectively), it is clear that δ15
N patterns cannot explain
the increase alone. However, the fish caught in 2012 have a mean trophic position higher than the fish
caught in 2010 and 2011, and could at least explain parts of the increasing fish Hg concentrations in
Breidtjern.
Figure 11 Box and whisker plots of seasonal δ13
C (top) and δ15
N (bottom, not adjusted) data in Breidtjern
(above bold horizontal line) and Tollreien (below bold horizontal line). The horizontal line inside the box
represent seasonal median value, the ends of the box represent 75th
and 25th
quantiles, and the end of the lines
represent +/- 1.5*interquartile range. Values outside this range are shown as circles (Breidtjern) and triangles
(Tollreien). Figure copied from paper 5.

54
In Tollreien it is a significant (p < 0.05) decrease in δ15
N levels from 2010 to 2011 (Figure 11), while
the fish Hg concentrations increase with 28 %. From 2011 to 2012, δ15
N levels increase significantly
(p < 0.0001), while fish Hg concentrations show no increase (0 %). But, since it significantly increased
the explanatory power, data of δ15
N were added to our fish Hg concentrations model. This implies, as
for Breidtjern, that δ15
N can, if not alone, at least partly, explain the year-to-year increase in mean fish
Hg concentration from 2010 to 2012 (Figure 5).
A point that could clarify the observed relationship between year-to-year increase in fish Hg
concentrations and δ15
N levels is the bioaccumulation rates in the two fish populations (Figure 12). As
is discussed in paper 5, the mean perch collected from Tollreien is larger than the mean perch
collected from Breidtjern. However, Hg (i.e. MeHg) accumulates at a slower rate in Tollreien (TMS =
0.43, all data) compared to Breidtjern (TMS = 0.50). We hypothesise that this is related to the group of
large predatory fish in Tollreien that feed on smaller fish. This will lead to shortened life history for
the smaller fish due to stress, and they will not accumulate as much MeHg as fish without this top
predator pressure (as for Breidtjern perch). Hence, the TMS will be less steep than what is present in
Breidtjern where the smaller fish live longer.
Figure 12 Log Hg concentrations (y-axes, mg/kg) versus δ15
N values (x-axes, ‰, adjusted) for all fish included
in the present study. Shown are Breidtjern (left panel, circles) and Langtjern (right panel, diamonds). Trophic

55
magnification slopes for the years 2010 (unbroken lines), 2011 (dotted line) and 2012 (dashed line) is 0.56, 0.45
and 0.42 for Breidtjern. Similar numbers for Tollreien are 0.56, 0.47 and 0.34. Figure copied from paper 5.
The TMS are decreasing in both our lakes from 2010 through 2011 to 2012 (Figure 12). In 2010 TMS
values are 0.56 in both Breidtjern and Tollreien, while TMS in 2011 and 2012 are 0.45 and 0.47, and
0.42 and 0.34 in the two lakes, respectively. This indicate that MeHg is accumulating slower in the
fish populations every year, suggestion that biological mechanisms are responsible for the changing
fish Hg concentrations. An explanation for the reduced TMS could be increased pressure on the fish
population, for example from exterior factors we have been unable to access in the present data set,
leading to shorter life histories and reduced MeHg accumulation in the fish populations. This reflects
again the significant contribution from δ15
N levels on fish Hg concentrations, and hence explains the
increasing fish Hg concentrations observed.
3.5.2 Variation of MeHg biomagnification
In paper 6 we studied biomagnification of MeHg through documentation of lake-specific TMS and
BAF in four of our study lakes: Breidtjern, Tollreien, Langtjern and Vuorasjavri. Due to the long list
of variables suggested to affect MeHg bioaccumulation rates, TMS are shown to vary significantly
both within individual food chains and across systems with different physicochemical characteristics
(Lavoie et al., 2013, Kidd et al., 2012). Therefore, in paper 6, our main goal was to use the principles
of TMS and BAF for MeHg to determine the factors significantly controlling MeHg biomagnification
in boreal and subarctic lakes. We included a wide range of possible explanatory environmental
parameters, including different food chain characteristics in addition to physical and chemical lake
features. Our main hypothesis was that for lakes where physicochemical features and food chain
carbon sources are similar, biomagnification of MeHg are significantly affected by the top predator.
We found that mean concentrations of MeHg in organisms (excluding fish) from Vuorasjavri
(44 ± 59 ng/g) were significantly lower than the mean concentrations from Breidtjern (157 ± 201 ng/g,
Tukey-Kramer, p < 0.01). However, there were no significant difference between mean MeHg
concentrations in Vuorasjavri, Langtjern (63 ± 94 ng/g) or Tollreien (90 ± 32 ng/g, Kruskal-Wallis

56
test, p = 0.70). This is somewhat surprising, as concentrations of aqueous Hg species (both TotHg and
MeHg) in lakes from subarctic Norway are shown to be significantly lower than concentrations from
boreal lakes (paper 2). It is also documented a positive correlation between MeHg concentrations in
invertebrates and stream water concentrations of MeHg, TotHg and DOC (Chasar et al., 2009). A
previous study also indicates how an acidic lake food chain (pH 5.2 – 5.6) accumulates more Hg than
in a less acidic lake (pH 6.3 – 6.9), when concentrations of DOC (2.7 mg/L) are similar
(Scheuhammer and Graham, 1999).
MeHg concentrations increased significantly with trophic position in Breidtjern, Tollreien,
Langtjern and Vuorasjavri, as indicated by increasing δ15
N signatures (r2 = 0.43, 0.82, 0.91 and 0.93,
respectively, all p < 0.0001, lower food chain and fish data included, Figure 13). For three of the lakes,
ANCOVA revealed no significant differences in TMS (p = 0.33): Breidtjern (TMS ± 95 % confidence
interval: 0.34 ± 0.10), Tollreien (0.26 ± 0.04) and Vuorasjavri (0.31 ± 0.03). A previous review of
TMS values for MeHg biomagnification from food chain studies shows a mean TMS of 0.24 ± 0.08 (n
= 106) from freshwater when the complete food chain is considered (Lavoie et al., 2013). This is in
approximate agreement with what we found when including fish in our calculations from Tollreien,
Breidtjern and Vuorasjavri.
Other studies show that the variation can be even larger than what is documented in Lavoie et
al. (2013), e.g. Clayden et al. (2013): 0.13 – 0.23, Clayden et al. (2014): 0.46, and we found in fact a
higher TMS value in Langtjern (0.51 ± 0.09). Langtjern TMS was significantly higher than in the other
three lakes (ANCOVA, p < 0.001). Since water chemistry and climate is similar (not significantly
different) in Langtjern and the other boreal lakes (Breidtjern and Tollreien, Kruskal-Wallis test, p >
0.05), the explanation for the high TMS probably relates to biological factors (see discussion on
biological influence on MeHg biomagnification further on).

57
Figure 13 Log MeHg (Hg for fish) concentrations (x-axes, ng/g dw) versus δ15N values (y-axes, ‰, baseline
corrected) for all groups of organisms (included fish) in the four study lakes. Shown are Breidtjern (top left, y =
3.32 + 0.34x, r2 = 0.44, p < 0.0001), Langtjern (top right, y = 0.39 + 0.51x, r
2 = 0.91, p < 0.0001), Tollreien
(bottom left, y = 3.64 + 0.26x, r2 = 0.82, p < 0.0001) and Vuorasjavri (bottom right, y = 2.29 + 0.31x, r
2 = 0.93, p
< 0.0001). TMS are shown with confidence curves (broken lines). Figure copied from paper 6.
3.5.3 Temperature dependent MeHg biomagnification
In the Lavoie et al. (2013) review, the authors found that MeHg biomagnification in aquatic food
chains on a global scale is positively related to latitude (MeHg TMS versus latitude: r2 = 0.10, p <
0.001). TMS values are shown to be higher in polar (0.28 ± 0.09) compared to temperate regions (0.24
± 0.07). In our study, we did not find support for this to be true, as TMS values for the subarctic lake
Vuorasjavri (with and without fish: 0.31 ± 0.03 and 0.35 ± 0.17) did not significantly differ from TMS
values for the two boreal lakes Tollreien (0.26 ± 0.04 and 0.12 ± 0.10) and Breidtjern (0.34 ± 0.10 and
0.24 ± 0.20). The mechanisms thought to be responsible for a possible south-north gradient mainly

58
relate to temperature (discussed in Lavoie et al., 2013) and include growth dilution (increased in
warmer regions, Simoneau et al., 2005, trophic transfer efficiency, which is reduced in warmer
regions, and excretion rates of MeHg, which is reduced in colder regions, Trudel and Rasmussen,
1997). Mean annual temperature is lower in the subarctic region (-3.0 °C for the area of Vuorasjavri)
compared to the boreal areas where the three other lakes are located (1.3 – 5.8 °C, Table 1, also
discussed in paper 2), but still no significant TMS value difference was observed.
3.5.4 Biological influence on MeHg biomagnification
To assess the impact of top predators on MeHg biomagnification, we calculated TMS when fish
samples were removed from the data material (Figure 14). TMS values in Breidtjern and Tollreien
decreased from 0.34 ± 0.10 to 0.24 ± 0.20 (ANCOVA, p < 0.001) and from 0.26 ± 0.04 to 0.12 ± 0.10
(ANCOVA, p = 0.06), respectively. This is contrary to what Lavoie et al. (2013) reported, where TMS
values were found to increase to 0.31 ± 0.10 (n = 3), similar to what we observed in Langtjern (from
0.51 ± 0.09 to 0.62 ± 0.21, ANCOVA, p < 0.001) and Vuorasjavri (from 0.31 ± 0.03 to 0.35 ± 0.17,
ANCOVA, p < 0. 01). In the Lavoie et al. (2013) study, differences in TMS values were hypothesised
to be related to different energy requirements of chosen organisms. We suggest that additional factors
may deserve consideration. When fish was excluded from the TMS calculations, no significant
differences was evident in the data material (ANCOVA, p = 0.08).
When only fish was included in the calculations, values were 0.46 ± 0.16 (p < 0.0001), 0.46 ±
0.18 (p < 0.0001) and 0.18 ± 0.16 (p < 0.05) for Breidtjern, Tollreien and Vuorasjavri, respectively
(data not shown). In the three lakes, no significant difference in TMS was evident when only fish was
included (ANCOVA, p = 0.14). TMS for fish only were not calculated for Langtjern due to the small
number of samples available (n = 3).
Breidtjern and Tollreien both have abundant perch populations, with no (perch only fish
species) predator pressure on the perch (paper 5). Perch undergo life history dependent dietary shifts
(Collette et al., 1977), but in Breidtjern and Tollreien very few fish reach the sufficient size to be
piscivorous (paper 5). Hence, we assume that all fish in the two lakes prey on primary and secondary
invertebrates. Fish predation may principally induce various shifts in prey population dynamics

59
(Gilljam et al., 2011, Wooster and Sih, 1995), depending on predation intensity, prey behaviour, life
history and reproductive habits (Henderson et al., 2012). Increased stress (from predator pressure) may
cause prolonged development and could in principle favour MeHg accumulation. But high predator
pressure on the primary and secondary consumers could lead to shortened life history, as well.
Following this last argument, low MeHg concentrations relative to trophic level seems likely, as the
prey species do not live long enough to accumulate substantial amounts of MeHg. Hence, the process
counteracts optimal somatic growth in the prey community and lead to low MeHg magnification rates
(i.e. low TMS) for the food chain. This explains the patterns of significantly lower TMS observed in
Breidtjern (0.34 ± 0.10) and Tollreien (0.26 ± 0.04) compared to Langtjern (0.51 ± 0.09) when all data
is included (Figure 13).
The high TMS for Langtjern appears to be a function of lower MeHg concentrations in low
δ15
N species rather than higher MeHg concentrations in high δ15
N consumers (Figure 13), which,
following the arguments above, indicates low predation pressure. This is consistent with the low
number of fish caught in this lake. The weak top down signal from fish in Langtjern probably
increases the abundance of prey items compared to the other boreal lakes, as discussed by Gliwicz
(2002).
Le Jeune et al. (2012) found that in lakes inhabited by fish, the Chaoborus larvae were unable
to biomagnify MeHg, while in fishless lakes, Chaoborus larvae biomagnified MeHg. The authors
states that growth dilution, amount and type of prey items or trophic position could not explain the
different MeHg biomagnificqation patterns. In stead Le Jeune et al. (2012) points to other possible
biological explanations, specifically that the biomagnification capacities of Chaoborus larvae are
affected by diel vertical migration. The migration is affected by the fish patterns in the lakes (i.e.
whether fish is present or not), supporting the findings of our paper 6.
Breidtjern and Tollreien show the same pattern of higher TMS when fish is included in the
MeHg concentrations versus δ15
N levels plot (Figure 13 and 14), contrary to the patterns reported by
Lavoie et al. (2013). Based on this we would like to draw attention to other possible mechanisms
influencing MeHg biomagnification. With the high predator pressure from perch in these two lakes
(see paper 5 and 6 for details), we suggest that primary and secondary consumers do not grow old to

60
accumulate substantial amounts of MeHg. This will lead to low biomagnification rates of MeHg (i.e.
low TMS) through the lower parts of the food chain, compared to when the full food chain is
considered (higher TMS). This fits well with previous findings showing that biomass, individual body
size and population density are top-down controlled (Gliwicz, 2002).
Langtjern and Vuorasjavri show an opposite pattern. In Langtjern, the TMS increase from 0.51
± 0.09 to 0.62 ± 0.21 when fish is excluded from the calculations (Figure 13 and 14). We hypothesise
that this is related to a weak predator control in the Langtjern food chain, due to the sparse and
artificially stocked population of brown trout. Lower trophic levels in Langtjern remain relatively
undisturbed from predatory fish and may have accordingly a prolonged life history compared to the
primary and secondary consumers in Breidtjern and Tollreien. Following this argument, MeHg in
Langtjern will show higher biomagnification rates in invertebrates (0.62 ± 0.21) compared to when the
full food chain is considered (0.52 ± 0.09), opposite of what is observed in Breidtjern and Tollreien.
In Vuorasjavri we see a similar pattern to that of Langtjern (Figure 13 and 14), and a low TMS
when only fish is considered (0.18 ± 0.16). This is again opposite of the patterns in Breidtjern and
Tollreien, even though predator pressure is similar to Tollreien (see paper 5 and 6 for details). We
believe this to be an indication of the Vuorasjavri perch to be more stressed by other predators than
what we see in the two boreal lakes. Since TMS is higher in the subarctic lake when the fish is
excluded (0.35 ± 0.17), we suggest that the lower trophic levels in Vuorasjavri are less affected by fish
predation, probably because the perch population is under a considerable top down pressure from large
piscivorous perch and pike (and possibly other species as well). These conditions will then lead to a
TMS pattern similar to that of Langtjern.

61
Figure 14 Log MeHg concentrations (y-axes, ng/g dw) versus δ15
N values (x-axes, ‰, baseline corrected) for
all groups of organisms (excluded fish) in the four study lakes. Shown are Breidtjern (top left, y = 3.62 + 0.24x,
r2 = 0.06, p = 0.23), Langtjern (top right, y = 0.14 + 0.62x, r
2 = 0.83, p < 0.0001), Tollreien (bottom left, y = 4.13
+ 0.12x, r2 = 0.33, p < 0.05) and Vuorasjavri (bottom right, y = 2.22 + 0.35x, r
2 = 0.83, p < 0.01). TMS are
shown with confidence curves (broken lines) for the slopes. Figure copied from paper 6.

62
4 Conclusions
In pristine areas of Norway, where no local emission of Hg exists, concentrations of Hg in fish are not
only high, but also increasing. The explanatory factors and their processes that are directly and
indirectly governing Hg concentrations in freshwater fish are abundant and diverse. This thesis shows
that significant processes are occurring in the catchment, in the lake itself and also in the food chain
(see Illustration). Processes of particular importance highlighted in the present thesis are:
- Catchment Hg cycling:
OM as the transport vector from stored Hg in soil to the lake; OM as methylation substrate in the
catchment; and catchment nutrient mediated methylation.
- Aquatic in-lake processes:
OM as methylation substrate and nutrient mediated methylation in the aquatic phase or the
sediments; PD of aquatic MeHg; littoral sediment methylation; and chlorophyll versus DOM
associated MeHg transport from the aquatic phase to the food chain.
- Biological food chain processes:
Changing fish trophic position; predator related MeHg biomagnification variation.
Based on the observations documented in the present thesis, our four main objectives have given the
following conclusions:
1. Are concentrations of Hg in freshwater fish in Norway still increasing (after 2008), and what are
the potential drivers behind such a possible increase?
In both study lakes Tollreien and Breidtjern fish Hg concentrations are higher in all study years
(2008, 2010, 2011 and 2012) documented after the 1990s. So, although concentrations are varying
significantly from year-to-year, this suggests that the concentrations of Hg in perch in these lakes
are still increasing. In both Tollreien and Breidtjern perch Hg concentrations show a significantly
increase also from 2010 to 2012. Although the lakes are both located in south eastern Norway, the
increases of Hg concentrations are differently distributed between the study years 2010, 2011 and

63
2012. Together this suggests that both regional and local processes should be considered as
primary drivers for the increasing concentrations. However, with the present data set we can only
conclude that biological factors related to change in fish trophic position and changing MeHg
bioaccumulation are significant.
2. What are the key variables explaining the spatial concentration levels of Hg and MeHg, in
addition to methylation potential, in Norwegian surface waters?
TOC was the variable most strongly correlated with TotHg and MeHg concentrations in our
spatial data set. Statistical modelling revealed that, after TOC, the most significant explanatory
variables were N availability, base cation status, and lake and catchment size. A key process
driving TotHg concentrations is DOM as a transport vector, while the role of DOM for MeHg and
%MeHg is likely related to a combination of transport and DOM as a substrate for methylation.
The observed negative correlations between MeHg and catchment and lake size are consistent
with in-lake and in-stream de-methylation processes. Statistical modelling suggests that N
availability exerts a positive contribution on concentrations of MeHg and %MeHg.
3. What are the main biological and physicochemical lake features affecting the bioaccumulation
and biomagnification of MeHg through boreal and subarctic lake food chains?
Data from four lakes in boreal and subarctic Norway suggests that inter-lake differences in
pressure from predatory fish may significantly affect bioaccumulation and biomagnification of
MeHg through the food chains. Low predator pressure lead to prolonged life history for primary
and secondary consumers, producing higher TMS as a result of increased MeHg
biomagnification. In the subarctic lake we also show how aquatic MeHg transfer to zooplankton
is most likely chlorophyll associated, rather than the detritus associated transport in the boreal
lakes. As %MeHg is documented to be lower in profundal relative to littoral sediments and MeHg
concentrations in primary consumers follow this pattern, we also suggest that shallow lake
sediments are important for MeHg transfer to the aquatic food chains in boreal humic lakes.

64
4. How will photochemical degradation affect concentration levels of MeHg in Norwegian surface
waters today and in terms of different future DOC concentration scenarios?
For the study at Langtjern, losses of MeHg through PD equalled almost 1/3 of total annual inputs.
This clearly highlights the importance of PD in the MeHg budget of boreal lakes. Future scenario
calculations showed how changes in catchment DOC export to freshwaters may lead to higher
aqueous MeHg concentrations due to increased DOC-associated MeHg inputs paired with strong
decreases in losses of MeHg through PD due to increased light attenuation. The data also suggests
that future climate driven reduced ICD will not offset the negative effects of increased DOC
loading on PD losses.
65
5 Future work
With atmospheric deposition of Hg showing decreasing or unchanged patterns in the period where
concentrations in fish are increasing, the historically accumulated Hg in the catchment soil are likely
to affect the adjourning lake for decades and centuries. Policy on Hg in the environment must
acknowledge the large Hg stores in the environment, accumulated from centuries of anthropogenic and
natural Hg emissions, that may be mobilized and contaminate aquatic food chains. Climate change,
together with other factors and drivers, may enhance both mobility of recently and historically
deposited Hg and production of MeHg, as highlighted through the processes studied in the present
thesis.
However, to be able to increase our understanding of what controls the Hg concentrations in fish in
northern ecosystems, research needs to be focused on future combined effects of climate and pollution
(i.e. atmospheric deposition), as well as transport and accumulation processes of MeHg. Climate
factors such as precipitation and temperature can enhance the transport of Hg and production of MeHg
in the studied ecosystems, which will influence aqueous MeHg concentrations and bioavailability. A
detailed study of these factors under different pollution scenarios, e.g. atmospheric deposition of Hg, S
and N, is critical for improving predictions of bioaccumulation of Hg in these food chains.
66
6 References
AAS, W., HJELLBREKKE, A.-G. & TØRSETH, K. 2012. Deposition of major inorganic compounds
in Norway 2007-2011. Norwegian Institute for Air Research. TA 2992-2012.
AKERBLOM, S., NILSSON, M., YU, J., RANNEBY, B. & JOHANSSON, K. 2012. Temporal
change estimation of mercury concentrations in northern pike (Esox lucius L.) in Swedish
lakes. Chemosphere, 86, 439-445.
AKERBLOM, S., BIGNERT, A., MEILI, M., SONESTEN, L. & SUNDBOM, M. 2014. Half a
century of changing mercury levels in Swedish freshwater fish. Ambio, 43 Suppl 1, 91-103.
AMIRBAHMAN, A., REID, A. L., HAINES, T. A., KAHL, J. S. & ARNOLD, C. 2002. Association of
methylmercury with dissolved humic acids. Environmental Science & Technology, 36, 690-695.
BARKAY, T., GILLMAN, M. & TURNER, R. R. 1997. Effects of dissolved organic carbon and salinity on
bioavailability of mercury. Applied and Environmental Microbiology, 63, 4267-4271.
BELDRING, S., ENGELAND, K., ROALD, L. A., SAELTHUN, N. R. & VOKSO, A. 2003.
Estimation of parameters in a distributed precipitation-runoff model for Norway. Hydrology
and Earth System Sciences, 7, 304-316.
BENOIT, J. M., GILMOUR, C. C., HEYES, A., MASON, R. P. & MILLER, C. L. 2003.
Geochemical and biological controls over methylmercury production and degradation in
aquatic ecosystems. In: CAI, Y. & BRAIDS, O. C., editors. Biogeochemistry of
Environmentally Important Trace Elements, p. 262-297, chapter 19.
BERGSTROM, A. K., JONSSON, A. & JANSSON, M. 2008. Phytoplankton responses to nitrogen
and phosphorus enrichment in unproductive Swedish lakes along a gradient of atmospheric
nitrogen deposition. Aquatic Biology, 4, 55-64.
BISHOP, K. H. & LEE, Y. H. 1997. Catchments as a source of mercury/methylmercury in boreal
surface waters. Metal Ions in Biological Systems, Vol 34: Mercury and Its Effects on
Environment and Biology, 34, 113-130.
BISHOP, K., ALLAN, C., BRINGMARK, L., GARCIA, E., HELLSTEN, S., HOGBOM, L.,
JOHANSSON, K., LOMANDER, A., MEILI, M., MUNTHE, J., NILSSON, M., PORVARI,
P., SKYLLBERG, U., SORENSEN, R., ZETTERBERG, T. & AKERBLOM, S. 2009. The
67
effects of forestry on hg bioaccumulation in nemoral/boreal waters and recommendations for
good silvicultural practice. Ambio, 38, 373-380.
BLOOM, N. S. 1992. On the chemical form of mercury in edible fish and marine invertebrate tissue.
Canadian Journal of Fisheries and Aquatic Sciences, 49, 1010-1017.
BROOKS RAND LABS. 2012. Determining methylmercury concentrations in mammals and birds
utilizing nondestructive sample collection techniques. Brooks Rand Labs, Seattle, WA, USA.
CHASAR, L. C., SCUDDER, B. C., STEWART, A. R., BELL, A. H. & AIKEN, G. R. 2009. Mercury
cycling in stream ecosystems. 3. Trophic dynamics and methylmercury bioaccumulation.
Environmental Science & Technology, 43, 2733-2739.
CHETELAT, J., AMYOT, M. & GARCIA, E. 2011. Habitat-specific bioaccumulation of
methylmercury in invertebrates of small mid-latitude lakes in North America. Environmental
Pollution, 159, 10-17.
CLAYDEN, M. G., KIDD, K. A., WYN, B., KIRK, J. L., MUIR, D. C. G. & O'DRISCOLL, N. J.
2013. Mercury biomagnification through food webs is affected by physical and chemical
characteristics of lakes. Environmental Science & Technology, 47, 12047-12053.
CLAYDEN, M. G., KIDD, K. A., CHETELAT, J., HALL, B. D. & GARCIA, E. 2014.
Environmental, geographic and trophic influences on methylmercury concentrations in
macroinvertebrates from lakes and wetlands across Canada. Ecotoxicology, 23, 273-284.
COLE, A. S., STEFFEN, A., ECKLEY, C. S., NARAYAN, J., PILOTE, M., TORDON, R.,
GRAYDON, J. A., ST LOUIS, V. L., XU, X. & BRANFIREUN, B. A. 2014. A survey of
mercury in air and precipitation across Canada: patterns and trends. Atmosphere, 5, 635-668.
COLLETTE, B. B., ALI, M. A., HOKANSON, K. E. F., NAGIEC, M., SMIRNOV, S. A., THORPE,
J. E., WEATHERLEY, A. H. & WILLEMSEN, J. 1977. Biology of percids. Journal of the
Fisheries Research Board of Canada, 34, 1890-1899.
COUTURE, R-M., DE WIT, H.A., TOMINAGA K., KIURU, P. & MARKELOV, I. In review. Oxygen dynamic
in a boreal lake responds to long-term changes in climate, ice phenology and DOC inputs. Under review
in Journal of Geophysical Research: Biogeosciences.

68
DAHL, K. 1917. Studies and tests on trout and trout lakes (in Norwegian). Oslo, Centraltrykkeriet,
Kristiania.
DE WIT, H. A., KAINZ, M. J. & LINDHOLM, M. 2012. Methylmercury bioaccumulation in
invertebrates of boreal streams in Norway: Effects of aqueous methylmercury and diet
retention. Environmental Pollution, 164, 235-241.
DEFOREST, D. K., BRIX, K. V. & ADAMS, W. J. 2007. Assessing metal bioaccumulation in aquatic
environments: The inverse relationship between bioaccumulation factors, trophic transfer
factors and exposure concentration. Aquatic Toxicology, 84, 236-246.
DITTMAN, J. A. & DRISCOLL, C. T. 2009. Factors influencing changes in mercury concentrations
in lake water and yellow perch (Perca flavescens) in Adirondack lakes. Biogeochemistry, 93,
179-196.
DORMANN, C. F., ELITH, J., BACHER, S., BUCHMANN, C., CARL, G., CARRE, G.,
MARQUEZ, J. R. G., GRUBER, B., LAFOURCADE, B., LEITAO, P. J., MUNKEMULLER,
T., MCCLEAN, C., OSBORNE, P. E., REINEKING, B., SCHRODER, B., SKIDMORE, A.
K., ZURELL, D. & LAUTENBACH, S. 2013. Collinearity: a review of methods to deal with
it and a simulation study evaluating their performance. Ecography, 36, 27-46.
DRISCOLL, C. T., BLETTE, V., YAN, C., SCHOFIELD, C. L., MUNSON, R. & HOLSAPPLE, J.
1995. The role of dissolved organic-carbon in the chemistry and bioavailability of mercury in
remote adirondack lakes. Water Air and Soil Pollution, 80, 499-508.
DRISCOLL, C. T., CHEN, C. Y., HAMMERSCHMIDT, C. R., MASON, R. P., GILMOUR, C. C.,
SUNDERLAND, E. M., GREENFIELD, B. K., BUCKMAN, K. L. & LAMBORG, C. H.
2012. Nutrient supply and mercury dynamics in marine ecosystems: A conceptual model.
Environmental Research, 119, 118-131.
DRISCOLL, C. T., MASON, R. P., CHAN, H. M., JACOB, D. J. & PIRRONE, N. 2013. Mercury as a
global pollutant: sources, pathways, and effects. Environmental Science & Technology, 47,
4967-4983.
EKLIMA. 2013. Weather and climate data from the Norwegian Meteorological Institute [Online].
Available: eklima.met.no [Accessed 15.01.2013].

69
EKLOF, K., FOLSTER, J., SONESTEN, L. & BISHOP, K. 2012. Spatial and temporal variation of
THg concentrations in run-off water from 19 boreal catchments, 2000-2010. Environmental
Pollution, 164, 102-109.
EN ISO 10870. 2012. Water quality. Guidelines for the selection of sampling methods and devices for
benthic macroinvertebrates in fresh waters. ISBN: 978 0 580 66338 3, 26 pp.
ETHIER, A. L. M., SCHEUHAMMER, A. M., BLAIS, J. M., PATERSON, A. M., MIERLE, G.,
INGRAM, R. & LEAN, D. R. S. 2010. Mercury empirical relationships in sediments from
three Ontario lakes. Science of the Total Environment, 408, 2087-2095.
FITZGERALD, W. F., ENGSTROM, D. R., MASON, R. P. & NATER, E. A. 1998. The case for
atmospheric mercury contamination in remote areas. Environmental Science & Technology,
32, 1-7.
FJELD, E., ROGNERUD, S. & STEINNES, E. 1994. Influence of environmental-factors on heavy-
metal concentration in lake-sediments in southern Norway indicated by path-analysis.
Canadian Journal of Fisheries and Aquatic Sciences, 51, 1708-1720.
FJELD, E. & ROGNERUD, S. 2009. Contaminants in freshwater fish, 2008 (In Norwegian). NIVA
Report, OR-5851, 66 pp.
FJELD, E., ROGNERUD, S., CHRISTENSEN, G., DAHL-HANSSEN, G. & BRAATEN, H.F.V.
2010. Survey of mercury in perch, 2010 (In Norwegian). NIVA Report. OR-6090, 28 pp.
FJELD, E., ROGNERUD, S. & BRAATEN, H.F.V. In prep. Increasing mercury concentrations in
perch (Perca fluviatilis) in South-East Norway from 1990 to 2012.
FRENCH, T. D., HOUBEN, A. J., DESFORGES, J.-P. W., KIMPE, L. E., KOKELJ, S. V.,
POULAIN, A. J., SMOL, J. P., WANG, X. & BLAIS, J. M. 2014. Dissolved organic carbon
thresholds affect mercury bioaccumulation in arctic lakes. Environmental Science &
Technology, 48, 3162-3168.
FUTTER, M. N., POSTE, A. E., BUTTERFIELD, D., DILLON, P. J., WHITEHEAD, P. G.,
DASTOOR, A. P. & LEAN, D. R. S. 2012. Using the INCA-Hg model of mercury cycling to
simulate total and methyl mercury concentrations in forest streams and catchments. Science of
the Total Environment, 424, 219-231.

70
GANDHI, N., TANG, R. W. K., BHAVSAR, S. P. & ARHONDITSIS, G. B. 2014. Fish mercury
levels appear to be increasing lately: a report from 40 years of monitoring in the province of
Ontario, Canada. Environmental Science & Technology, 48, 5404-5414.
GILLJAM, D., THIERRY, A., EDWARDS, F. K., FIGUEROA, D., IBBOTSON, A. T., JONES, J. I.,
LAURIDSEN, R. B., PETCHEY, O. L., WOODWARD, G. & EBENMAN, B. 2011. Seeing
double: size-based and taxonomic views of food web structure. Advances in Ecological
Research, Vol 45: the Role of Body Size in Multispecies Systems, 45, 67-133.
GILMOUR, C. C. & HENRY, E. A. 1991. Mercury methylation in aquatic systems affected by acid
deposition. Environmental Pollution, 71, 131-169.
GILMOUR, C. C., RIEDEL, G. S., EDERINGTON, M. C., BELL, J. T., BENOIT, J. M., GILL, G. A.
& STORDAL, M. C. 1998. Methylmercury concentrations and production rates across a
trophic gradient in the northern Everglades. Biogeochemistry, 40, 327-345.
GILMOUR, C. C., PODAR, M., BULLOCK, A. L., GRAHAM, A. M., BROWN, S. D.,
SOMENAHALLY, A. C., JOHS, A., HURT, R. A., BAILEY, K. L. & ELIAS, D. A. 2013.
Mercury methylation by novel microorganisms from new environments. Environmental
Science & Technology, 47, 11810-11820.
GLIWICZ, Z. M. 2002. On the different nature of top-down and bottom-up effects in pelagic food
webs. Freshwater Biology, 47, 2296-2312.
GORSKI, P. R., ARMSTRONG, D. E., HURLEY, J. P. & KRABBENHOFT, D. P. 2008. Influence of
natural dissolved organic carbon on the bioavailability of mercury to a freshwater alga.
Environmental Pollution, 154, 116-123.
GRAYDON, J. A., LOUIS, V. L. S., HINTELMANN, H., LINDBERG, S. E., SANDILANDS, K. A.,
RUDD, J. W. M., KELLY, C. A., HALL, B. D. & MOWAT, L. D. 2008. Long-term wet and
dry deposition of total and methyl mercury in the remote boreal ecoregion of canada.
Environmental Science & Technology, 42, 8345-8351.
GREENFIELD, B. K., HRABIK, T. R., HARVEY, C. J. & CARPENTER, S. R. 2001. Predicting
mercury levels in yellow perch: use of water chemistry, trophic ecology, and spatial traits.
Canadian Journal of Fisheries and Aquatic Sciences, 58, 1419-1429.
71
GRIGAL, D. F. 2002. Inputs and outputs of mercury from terrestrial watersheds: a review.
Environmental Reviews, 10, 1-39.
GRIGAL, D. F. 2003. Mercury sequestration in forests and peatlands: A review. Journal of
Environmental Quality, 32, 393-405.
HAKANSON, L., NILSSON, A. & ANDERSSON, T. 1988. Mercury in fish in swedish lakes.
Environmental Pollution, 49, 145-162.
HAMMERSCHMIDT, C. R. & FITZGERALD, W. F. 2008. Methylmercury in arctic Alaskan
mosquitoes: implications for impact of atmospheric mercury depletion events. Environmental
Chemistry, 5, 127-130.
HARMENS, H., NORRIS, D. A., KOERBER, G. R., BUSE, A., STEINNES, E. & RUEHLING, A.
2008. Temporal trends (1990-2000) in the concentration of cadmium, lead and mercury in
mosses across Europe. Environmental Pollution, 151, 368-376.
HARRIS, R. C., RUDD, J. W. M., AMYOT, M., BABIARZ, C. L., BEATY, K. G., BLANCHFIELD,
P. J., BODALY, R. A., BRANFIREUN, B. A., GILMOUR, C. C., GRAYDON, J. A.,
HEYES, A., HINTELMANN, H., HURLEY, J. P., KELLY, C. A., KRABBENHOFT, D. P.,
LINDBERG, S. E., MASON, R. P., PATERSON, M. J., PODEMSKI, C. L., ROBINSON, A.,
SANDILANDS, K. A., SOUTHWORTH, G. R., LOUIS, V. L. S. & TATE, M. T. 2007.
Whole-ecosystem study shows rapid fish-mercury response to changes in mercury deposition.
Proceedings of the National Academy of Sciences of the United States of America, 104,
16586-16591.
HE, T., FENG, X., GUO, Y., QIU, G., LI, Z., LIANG, L. & LU, J. 2008. The impact of eutrophication
on the biogeochemical cycling of mercury species in a reservoir: A case study from Hongfeng
Reservoir, Guizhou, China. Environmental Pollution, 154, 56-67.
HENDERSON, B. L., CHUMCHAL, M. M., DRENNER, R. W., DENG, Y., DIAZ, P. & NOWLIN,
W. H. 2012. Effects of fish on mercury contamination of macroinvertebrate communities of
Grassland ponds. Environmental Toxicology and Chemistry, 31, 870-876.
HESSEN, D. 1992. Dissolved organic-carbon in a humic lake - effects on bacterial production and
respiration. Hydrobiologia, 229, 115-123.

72
HESSEN, D. 2005. Aquatic food webs: stoichiometric regulation of flux and fate of carbon. In: Jones
J, editor. International association of Theoretical and Applied Limnology.
HINTELMANN, H. & NGUYEN, H. 2005. Extraction of methylmercury from tissue and plant
samples by acid leaching. Analytical and Bioanalytical Chemistry, 381, 360-365.
HOROWITZ, H. M., JACOB, D. J., AMOS, H. M., STREETS, D. G. & SUNDERLAND, E. M. 2014.
Historical mercury releases from commercial products: global environmental implications.
Environmental Science & Technology, 48, 10242-10250.
JACKSON, T. 1997. Long-range atmospheric transport of mercury to ecosystems, and the importance
of anthropogenic emissions—a critical review and evaluation of the published evidence.
Environmental Reviews, 5 (2), 99-120.
JANSSON, M., HICKLER, T., JONSSON, A. & KARLSSON, J. 2008. Links between terrestrial
primary production and bacterial production and respiration in lakes in a climate gradient in
subarctic Sweden. Ecosystems, 11, 367-376.
JEREMIASON, J. D., ENGSTROM, D. R., SWAIN, E. B., NATER, E. A., JOHNSON, B. M.,
ALMENDINGER, J. E., MONSON, B. A. & KOLKA, R. K. 2006. Sulfate addition increases
methylmercury production in an experimental wetland. Environmental Science & Technology, 40,
3800-3806.
JONES, T. A., CHUMCHAL, M. M., DRENNER, R. W., TIMMINS, G. N. & NOWLIN, W. H. 2013.
Bottom-up nutrient and top-down fish impacts on insect-mediated mercury flux from aquatic
ecosystems. Environmental Toxicology and Chemistry, 32, 612-618.
JONSSON, A., MEILI, M., BERGSTROM, A. K. & JANSSON, M. 2001. Whole-lake mineralization
of allochthonous and autochthonous organic carbon in a large humic lake (Ortrasket, N.
Sweden). Limnology and Oceanography, 46, 1691-1700.
JONSSON, B. & MATZOW, D. 1979. Fish in water and waterways (in Norwegian). ISBN 82-03-
11943-3, Aschehoug, Norway.
KAINZ, M., LUCOTTE, M. & PARRISH, C. C. 2003. Relationships between organic matter
composition and methyl mercury content of offshore and carbon-rich littoral sediments in an
oligotrophic lake. Canadian Journal of Fisheries and Aquatic Sciences, 60, 888-896.

73
KAINZ, M., ARTS, M. T. & MAZUMDER, A. 2008. Essential versus potentially toxic dietary
substances: A seasonal comparison of essential fatty acids and methyl mercury concentrations
in the planktonic food web. Environmental Pollution, 155, 262-270.
KIDD, K. A., HESSLEIN, R. H., FUDGE, R. J. P. & HALLARD, K. A. 1995. The influence of
trophic level as measured by delta-n-15 on mercury concentrations in fresh-water organisms.
Water Air and Soil Pollution, 80, 1011-1015.
KIDD, K. A., PATERSON, M. J., HESSLEIN, R. H., MUIR, D. C. G. & HECKY, R. E. 1999. Effects
of northern pike (Esox lucius) additions on pollutant accumulation and food web structure, as
determined by delta C-13 and delta N-15, in a eutrophic and an oligotrophic lake. Canadian
Journal of Fisheries and Aquatic Sciences, 56, 2193-2202.
KIDD, K. A., MUIR, D. C. G., EVANS, M. S., WANG, X., WHITTLE, M., SWANSON, H. K.,
JOHNSTON, T. & GUILDFORD, S. 2012. Biomagnification of mercury through lake trout
(Salvelinus namaycush) food webs of lakes with different physical, chemical and biological
characteristics. Science of the Total Environment, 438, 135-143.
KORTELAINEN, P., RANTAKARI, M., HUTTUNEN, J. T., MATTSSON, T., ALM, J.,
JUUTINEN, S., LARMOLA, T., SILVOLA, J. & MARTIKAINEN, P. J. 2006. Sediment
respiration and lake trophic state are important predictors of large CO2 evasion from small
boreal lakes. Global Change Biology, 12, 1554-1567.
LARSEN, S., ANDERSEN, T. & HESSEN, D. O. 2011. Predicting organic carbon in lakes from
climate drivers and catchment properties. Global Biogeochemical Cycles, 25.
LARSSEN, T., DE WIT, H. A., WIKER, M. & HALSE, K. 2008. Mercury budget of a small forested
boreal catchment in southeast Norway. Science of the Total Environment, 404, 290-296.
LAVOIE, R. A., JARDINE, T. D., CHUMCHAL, M. M., KIDD, K. A. & CAMPBELL, L. M. 2013.
Biomagnification of mercury in aquatic food webs: a worldwide meta-analysis. Environmental
Science & Technology, 47, 13385-13394.
LE JEUNE, A.-H., BOURDIOL, F., ALDAMMAN, L., PERRON, T., AMYOT, M. & PINEL-
ALLOUL, B. 2012. Factors affecting methylmercury biomagnification by a widespread

74
aquatic invertebrate predator, the phantom midge larvae Chaoborus. Environmental Pollution,
165, 100-108.
LEE, Y. H., BISHOP, K. H., MUNTHE, J., IVERFELDT, A., VERTA, M., PARKMAN, H. &
HULTBERG, H. 1998. An examination of current Hg deposition and export in Fenno-
Scandian catchments. Biogeochemistry, 40, 125-135.
LEE, Y. H., BISHOP, K. H. & MUNTHE, J. 2000. Do concepts about catchment cycling of
methylmercury and mercury in boreal catchments stand the test of time? Six years of
atmospheric inputs and runoff export at Svartberget, northern Sweden. Science of the Total
Environment, 260, 11-20.
LEERMAKERS, M., BAEYENS, W., QUEVAUVILLER, P. & HORVAT, M. 2005. Mercury in
environmental samples: Speciation, artifacts and validation. Trac-Trends in Analytical
Chemistry, 24, 383-393.
LEHNHERR, I. & LOUIS, V. L. S. 2009. Importance of Ultraviolet Radiation in the
Photodemethylation of Methylmercury in Freshwater Ecosystems. Environmental Science &
Technology, 43, 5692-5698.
LI, Y. & CAI, Y. 2013. Progress in the study of mercury methylation and demethylation in aquatic
environments. Chinese Science Bulletin, 58, 177-185.
LIANG, L., HORVAT, M., CERNICHIARI, E., GELEIN, B. & BALOGH, S. 1996. Simple solvent
extraction technique for elimination of matrix interferences in the determination of
methylmercury in environmental and biological samples by ethylation gas chromatography
cold vapor atomic fluorescence spectrometry. Talanta, 43, 1883-1888.
LUENGEN, A. C., FISHER, N. S. & BERGAMASCHI, B. A. 2012. Dissolved organic matter reduces
algal accumulation of methylmercury. Environmental Toxicology and Chemistry, 31, 1712-
1719.
MAGNUSON, J. J., ROBERTSON, D. M., BENSON, B. J., WYNNE, R. H., LIVINGSTONE, D. M.,
ARAI, T., ASSEL, R. A., BARRY, R. G., CARD, V., KUUSISTO, E., GRANIN, N. G.,
PROWSE, T. D., STEWART, K. M. & VUGLINSKI, V. S. 2000. Historical trends in lake
and river ice cover in the Northern Hemisphere. Science, 289, 1743-1746.

75
MATTHEWS, D. A., BABCOCK, D. B., NOLAN, J. G., PRESTIGIACOMO, A. R., EFFLER, S. W.,
DRISCOLL, C. T., TODOROVA, S. G. & KUHR, K. M. 2013. Whole-lake nitrate addition
for control of methylmercury in mercury-contaminated Onondaga Lake, NY. Environmental
Research, 125, 52-60.
MCCLAIN, M. E., BOYER, E. W., DENT, C. L., GERGEL, S. E., GRIMM, N. B., GROFFMAN, P.
M., HART, S. C., HARVEY, J. W., JOHNSTON, C. A., MAYORGA, E., MCDOWELL, W.
H. & PINAY, G. 2003. Biogeochemical hot spots and hot moments at the interface of
terrestrial and aquatic ecosystems. Ecosystems, 6, 301-312.
MEILI, M., IVERFELDT, A. & HAKANSON, L. 1991. MERCURY IN THE SURFACE-WATER
OF SWEDISH FOREST LAKES - CONCENTRATIONS, SPECIATION AND
CONTROLLING FACTORS. Water Air and Soil Pollution, 56, 439-453.
MERGLER, D., ANDERSON, H. A., CHAN, L. H. M., MAHAFFEY, K. R., MURRAY, M.,
SAKAMOTO, M. & STERN, A. H. 2007. Methylmercury exposure and health effects in
humans: A worldwide concern. Ambio, 36.
MILLER, A., BIGNERT, A., PORVARI, P., DANIELSSON, S. & VERTA, M. 2013. Mercury in
Perch (Perca fluviatilis) from Sweden and Finland. Water Air and Soil Pollution, 224.
MITCHELL, C. P. J., BRANFIREUN, B. A. & KOLKA, R. K. 2008a. Spatial characteristics of net
methylmercury production hot spots in peatlands. Environmental Science & Technology, 42,
1010-1016.
MITCHELL, C. P. J., BRANFIREUN, B. A. & KOLKA, R. K. 2008b. Assessing sulfate and carbon controls on
net methylmercury production in peatlands: An in situ mesocosm approach. Applied Geochemistry, 23.
MONTEITH, D. T., STODDARD, J. L., EVANS, C. D., DE WIT, H. A., FORSIUS, M., HOGASEN,
T., WILANDER, A., SKJELKVALE, B. L., JEFFRIES, D. S., VUORENMAA, J., KELLER,
B., KOPACEK, J. & VESELY, J. 2007. Dissolved organic carbon trends resulting from
changes in atmospheric deposition chemistry. Nature, 450, 537-U9.
MOREL, F. M. M., KRAEPIEL, A. M. L. & AMYOT, M. 1998. The chemical cycle and
bioaccumulation of mercury. Annual Review of Ecology and Systematics, 29, 543-566.

76
MORRIS, D. P., ZAGARESE, H., WILLIAMSON, C. E., BALSEIRO, E. G., HARGREAVES, B. R.,
MODENUTTI, B., MOELLER, R. & QUEIMALINOS, C. 1995. The attentuation of solar UV
radiation in lakes and the role of dissolved organic carbon. Limnology and Oceanography, 40,
1381-1391.
MULDER, J., DE WIT, H. A., BOONEN, H. W. J. & BAKKEN, L. R. 2001. Increased levels of
aluminium in forest soils: Effects on the stores of soil organic carbon. Water Air and Soil
Pollution, 130, 989-994.
NORWEGIAN FOOD SAFETY AUTHORITY. 2005. Freshwater fish and mercury contamination
(In Norwegian) [Online]. Available:
http://www.matportalen.no/matvaregrupper/tema/fisk_og_skalldyr/ferskvannsfisk_og_kvikkso
lvforurensing [Accessed 06.01.2013].
NVE. 2013. NVE Atlas - yearly runoff [Online]. Available:
http://arcus.nve.no/website/geoc3/tema/nve_avrenn_p.html.
OULEHLE, F., HOFMEISTER, J., CUDLIN, P. & HRUSKA, J. 2006. The effect of reduced
atmospheric deposition on soil and soil solution chemistry at a site subjected to long-term
acidification, Nacetin, Czech Republic. Science of the Total Environment, 370, 532-544.
PARKER, J. L. & BLOOM, N. S. 2005. Preservation and storage techniques for low-level aqueous
mercury speciation. Science of the Total Environment, 337, 253-263.
PENNANEN, T., FRITZE, H., VANHALA, P., KIIKKILA, O., NEUVONEN, S. & BAATH, E.
1998. Structure of a microbial community in soil after prolonged addition of low levels of
simulated acid rain. Applied and Environmental Microbiology, 64, 2173-2180.
PETERSON, B. J. & FRY, B. 1987. STABLE ISOTOPES IN ECOSYSTEM STUDIES. Annual
Review of Ecology and Systematics, 18, 293-320.
PICKHARDT, P. C., FOLT, C. L., CHEN, C. Y., KLAUE, B. & BLUM, J. D. 2002. Algal blooms
reduce the uptake of toxic methylmercury in freshwater food webs. Proceedings of the
National Academy of Sciences of the United States of America, 99, 4419-4423.
PIRRONE, N., CINNIRELLA, S., FENG, X., FINKELMAN, R. B., FRIEDLI, H. R., LEANER, J.,
MASON, R., MUKHERJEE, A. B., STRACHER, G. B., STREETS, D. G. & TELMER, K.

77
2010. Global mercury emissions to the atmosphere from anthropogenic and natural sources.
Atmospheric Chemistry and Physics, 10, 5951-5964.
PORVARI, P. 1998. Development of fish mercury concentrations in Finnish reservoirs from 1979 to
1994. Science of the Total Environment, 213, 279-290.
PORVARI, P., VERTA, M., MUNTHE, J. & HAAPANEN, M. 2003. Forestry practices increase
mercury and methyl mercury output from boreal forest catchments. Environmental Science &
Technology, 37, 2389-2393.
POST, D. M. 2002. Using stable isotopes to estimate trophic position: Models, methods, and
assumptions. Ecology, 83, 703-718.
RASK, M., JONES, R. I., JARVINEN, M., PALOHEIMO, A., SALONEN, M., SYVARANTA, J. &
VERTA, M. 2007. Changes in fish mercury concentrations over 20 years in an acidified lake
subject to experimental liming. Applied Geochemistry, 22, 1229-1240.
RASK, M., VERTA, M., KORHONEN, M., SALO, S., FORSIUS, M., ARVOLA, L., JONES, R. I. &
KILJUNEN, M. 2010. Does lake thermocline depth affect methyl mercury concentrations in
fish? Biogeochemistry, 101, 311-322.
RAVICHANDRAN, M. 2004. Interactions between mercury and dissolved organic matter - a review.
Chemosphere, 55, 319-331.
RENNIE, M. D., COLLINS, N. C., PURCHASE, C. F. & TREMBLAY, A. 2005. Predictive models
of benthic invertebrate methylmercury in Ontario and Quebec lakes. Canadian Journal of
Fisheries and Aquatic Sciences, 62, 2770-2783.
RIGET, F., BRAUNE, B., BIGNERT, A., WILSON, S., AARS, J., BORN, E., DAM, M., DIETZ, R.,
EVANS, M., EVANS, T., GAMBERG, M., GANTNER, N., GREEN, N.,
GUNNLAUGSDOTTIR, H., KANNAN, K., LETCHER, R., MUIR, D., ROACH, P.,
SONNE, C., STERN, G. & WIIG, O. 2011. Temporal trends of Hg in Arctic biota, an update.
Science of the Total Environment, 409, 3520-3526.
ROLFHUS, K. R., HALL, B. D., MONSON, B. A., PATERSON, M. J. & JEREMIASON, J. D. 2011.
Assessment of mercury bioaccumulation within the pelagic food web of lakes in the western
Great Lakes region. Ecotoxicology, 20, 1520-1529.

78
ROSSELAND, B. O., MASSABUAU, J.-C., GRIMALT, J., HOFER, R., LACKNER, R., RADDUM,
G., ROGNERUD, S. & VIVES, I. 2001. Fish ecotoxicology, The EMERGE fish sampling
manual for live fish. The EMERGE Project (European Mountain lake Ecosystems:
Regionalisation, diagnostic and socio-economic valuation).
SCHEUHAMMER, A. M. & GRAHAM, J. E. 1999. The bioaccumulation of mercury in aquatic
organisms from two similar lakes with differing pH. Ecotoxicology, 8, 49-56.
SCHROEDER, W. H., YARWOOD, G. & NIKI, H. 1993. Transformation processes involving
mercury species in the atmosphere - results from a literature survey. Water Air and Soil
Pollution, 66, 203-203.
SELIN, N. E. 2009. Global biogeochemical cycling of mercury: a review. Annual Review of
Environment and Resources, 34, 43-63.
SELLERS, P., KELLY, C. A., RUDD, J. W. M. & MACHUTCHON, A. R. 1996. Photodegradation of
methylmercury in lakes. Nature, 380, 694-697.
SHANLEY, J. B., KAMMAN, N. C., CLAIR, T. A. & CHALMERS, A. 2005. Physical controls on
total and methylmercury concentrations in streams and lakes of the northeastern USA.
Ecotoxicology, 14, 125-134.
SHANLEY, J. B., MAST, M. A., CAMPBELL, D. H., AIKEN, G. R., KRABBENHOFT, D. P.,
HUNT, R. J., WALKER, J. F., SCHUSTER, P. F., CHALMERS, A., AULENBACH, B. T.,
PETERS, N. E., MARVIN-DIPASQUALE, M., CLOW, D. W. & SHAFER, M. M. 2008.
Comparison of total mercury and methylmercury cycling at five sites using the small
watershed approach. Environmental Pollution, 154, 143-154.
SIMONEAU, M., LUCOTTE, M., GARCEAU, S. & LALIBERTE, D. 2005. Fish growth rates
modulate mercury concentrations in walleye (Sander vitreus) from eastern Canadian lakes.
Environmental Research, 98, 73-82.
SKJELKVÅLE, B. L., CHRISTENSEN, G. N., RØYSET, O., ROGNERUD, S. & FJELD, E. 2008.
National lake survey, 2004-2006, part 2: Sediments. Contamination of metals, PAH and PCB
(In Norwegian). NIVA report 2362-2008.

79
SKYLLBERG, U., QIAN, J., FRECH, W., XIA, K. & BLEAM, W. F. 2003. Distribution of mercury,
methyl mercury and organic sulphur species in soil, soil solution and stream of a boreal forest
catchment. Biogeochemistry, 64, 53-76.
SLEMR, F., BRUNKE, E. G., EBINGHAUS, R., TEMME, C., MUNTHE, J., WANGBERG, I.,
SCHROEDER, W., STEFFEN, A. & BERG, T. 2003. Worldwide trend of atmospheric
mercury since 1977. Geophysical Research Letters, 30.
SONESTEN, L. 2003. Fish mercury levels in lakes - adjusting for Hg and fish-size covariation.
Environmental Pollution, 125, 255-265.
ST. LOUIS, V. L., RUDD, J. W. M., KELLY, C. A., BEATY, K. G., BLOOM, N. S. & FLETT, R. J.
1994. Importance of wetlands as sources of methyl mercury to boreal forest ecosystems.
Canadian Journal of Fisheries and Aquatic Sciences, 51, 1065-1076.
ST. LOUIS, V. L., RUDD, J. W. M., KELLY, C. A., BEATY, K. G., FLETT, R. J. & ROULET, N. T.
1996. Production and loss of methylmercury and loss of total mercury from boreal forest
catchments containing different types of wetlands. Environmental Science & Technology, 30,
2719-2729.
STEFFAN, R. J., KORTHALS, E. T. & WINFREY, M. R. 1988. Effects of acidification on mercury
methylation, demethylation, and volatilization in sediments from an acid-susceptible lake.
Applied and Environmental Microbiology, 54, 2003-2009.
STREETS, D. G., DEVANE, M. K., LU, Z., BOND, T. C., SUNDERLAND, E. M. & JACOB, D. J.
2011. All-Time Releases of Mercury to the Atmosphere from Human Activities.
Environmental Science & Technology, 45, 10485-10491.
TESSIER, A. & TURNER, D. R. 1995. Metal Speciation and bioavailability in aquatic systems, John
Wiley & Sons Ltd.
THRANE, J.-E., HESSEN, D. O. & ANDERSEN, T. 2014. The absorption of light in lakes: negative
impact of dissolved organic carbon on primary productivity. Ecosystems, 17, 1040-1052.
TJERNGREN, I., KARLSSON, T., BJORN, E. & SKYLLBERG, U. 2012a. Potential Hg methylation
and MeHg demethylation rates related to the nutrient status of different boreal wetlands.
Biogeochemistry, 108, 335-350.
80
TJERNGREN, I., MEILI, M., BJORN, E. & SKYLLBERG, U. 2012b. Eight Boreal Wetlands as
Sources and Sinks for Methyl Mercury in Relation to Soil Acidity, C/N Ratio, and Small-
Scale Flooding. Environmental Science & Technology, 46, 8052-8060.
TODOROVA, S. G., DRISCOLL, C. T., MATTHEWS, D. A., EFFLER, S. W., HINES, M. E. &
HENRY, E. A. 2009. Evidence for Regulation of Monomethyl Mercury by Nitrate in a
Seasonally Stratified, Eutrophic Lake. Environmental Science & Technology, 43, 6572-6578.
TORSETH, K., AAS, W., BREIVIK, K., FJAERAA, A. M., FIEBIG, M., HJELLBREKKE, A. G.,
MYHRE, C. L., SOLBERG, S. & YTTRI, K. E. 2012. Introduction to the European
Monitoring and Evaluation Programme (EMEP) and observed atmospheric composition
change during 1972-2009. Atmospheric Chemistry and Physics, 12, 5447-5481.
TRUDEL, M. & RASMUSSEN, J. B. 1997. Modeling the elimination of mercury by fish.
Environmental Science & Technology, 31, 1716-1722.
TRUDEL, M. & RASMUSSEN, J. B. 2006. Bioenergetics and mercury dynamics in fish: a modelling
perspective. Canadian Journal of Fisheries and Aquatic Sciences, 63, 1890-1902.
ULLRICH, S. M., TANTON, T. W. & ABDRASHITOVA, S. A. 2001. Mercury in the aquatic
environment: A review of factors affecting methylation. Critical Reviews in Environmental
Science and Technology, 31, 241-293.
UNEP (United Nations Environment Programme). 2002. Global Mercury Assessment. UNEP
Chemicals Branch, Geneva, Switzerland.
UNEP (United Nations Environment Programme). 2014. The Minamate Convention [Online].
Available: http://www.mercuryconvention.org/ [Accessed 24.09. 2014].
USEPA. 1996. Method 1669: Sampling Ambient Water for Trace Metals at EPA Water Quality
Criteria Level. USEPA, Office of water; 199639.
USEPA. 1998. Method 1630 Methylmercury in Water by Distillation, Aqueous Ethylation, Purge and
Trap, and Cold Vapor Atomic Fluorescence Spectrometry. USEPA, Office of water.
USEPA. 2002. Method 1631, Revision E: Mercury in Water by Oxidation, Purge and Trap, and Cold
Vapor Atomic Fluorescence Spectrometry. USEPA, Office of water.

81
VADEBONCOEUR, Y., VANDER ZANDEN, M. J. & LODGE, D. M. 2002. Putting the lake back
together: Reintegrating benthic pathways into lake food web models. Bioscience, 52, 44-54.
VALLIERES, C., RETAMAL, L., RAMLAL, P., OSBURN, C. L. & VINCENT, W. F. 2008.
Bacterial production and microbial food web structure in a large arctic river and the coastal
Arctic Ocean. Journal of Marine Systems, 74, 756-773.
VAN DER VELDEN, S., DEMPSON, J. B., EVANS, M. S., MUIR, D. C. G. & POWER, M. 2013.
Basal mercury concentrations and biomagnification rates in freshwater and marine food webs:
Effects on Arctic charr (Salvelinus alpinus) from eastern Canada. Science of the Total
Environment, 444, 531-542.
WANGBERG, I., MUNTHE, J., BERG, T., EBINGHAUS, R., KOCK, H. H., TEMME, C., BIEBER,
E., SPAIN, T. G. & STOLK, A. 2007. Trends in air concentration and deposition of mercury
in the coastal environment of the North Sea Area. Atmospheric Environment, 41, 2612-2619.
WATRAS, C. J., BACK, R. C., HALVORSEN, S., HUDSON, R. J. M., MORRISON, K. A. &
WENTE, S. P. 1998. Bioaccumulation of mercury in pelagic freshwater food webs. Science of
the Total Environment, 219, 183-208.
WETZEL, R. 2001. Limnology: Lake and River Ecosystems, Academic Press, San Diego.
WHO (World Health Organisation). 1991. Environmental Health criteria 101, Methyl Mercury.
Geneva, Switzerland: International programme on chemical safety.
WILKINSON, G. M., PACE, M. L. & COLE, J. J. 2013. Terrestrial dominance of organic matter in
north temperate lakes. Global Biogeochemical Cycles, 27, 43-51.
WMO (World Meteorological Organization). 1989. Calculation of monthly and annual 30-year
standard normals. 1989LV-4098.
WOOSTER, D. & SIH, A. 1995. A review of the drift and activity responses of stream prey to
predator presence. Oikos, 73, 3-8.
XUN, L., CAMPBELL, N. E. R. & RUDD, J. W. M. 1987. Measurements of specific rates of net
methyl mercury production in the water column and surface sediments of acidified and
circumneutral lakes. Canadian Journal of Fisheries and Aquatic Sciences, 44, 750-757.

82
YOSHINAGA, J., SUZUKI, T., HONGO, T., MINAGAWA, M., OHTSUKA, R., KAWABE, T.,
INAOKA, T. & AKIMICHI, T. 1992. Mercury concentration correlates with the nitrogen
stable isotope ratio in the animal food of papuans. Ecotoxicology and Environmental Safety,
24, 37-45.
ZHANG, Y. B., HUO, Y. L., LIU, X. Y., KUANG, W. M., YUAN, D. X. & JI, W. D. 2013.
Environmental impact factors and mercury speciation in the sediment along Fujian and eastern
Guangdong coasts. Acta Oceanologica Sinica, 32, 76-80.

83


