MERCER | COMPTRYX...HIGHLIGHTS MERCER | COMPTRYX On - demand analytics and industry peer...
21
HEALTH WEALTH CAREER MERCER | COMPTRYX UNDERSTANDING PEOPLE COSTS: YOUR KEY TO UNLOCKING THE WORKFORCE ANALYTICS CONVERSATION Patrick Gutmann Frankfurt JUNE 2016
Transcript of MERCER | COMPTRYX...HIGHLIGHTS MERCER | COMPTRYX On - demand analytics and industry peer...

H E A L T H W E A L T H C A R E E R
M E R C E R | C O M P T R Y X
U N D E R S T A N D I N G P E O P L E C O S T S : Y O U R K E Y T O U N L O C K I N G T H E W O R K F O R C E A N A L Y T I C S C O N V E R S A T I O N
Patrick Gutmann Frankfurt
JUNE 2016

© MERCER 2016 1
W E L C O M E T O D A Y ’ S P R E S E N T E R
Patrick Gutmann
Sector Leader Europe [email protected]
Questions To submit a question, use the floating panel on the top of your screen and click the Q&A button:
CLICK HERE TO ASK A QUESTION TO “ALL PANELISTS.”

© MERCER 2016 2
G l o b a l S a l a r y S u r v e y
L a b o r C o s t
M o d e l i n g
D A T A F E A T U R E D T O D A Y H I G H L I G H T S M E R C E R | C O M P T R Y X
O n - d e m a n d a n a l y t i c s a n d i n d u s t r y p e e r b e n c h m a r k i n g f o r 2 0 + c r i t i c a l m e t r i c s i n c l u d i n g p a y r o l l c o s t , p r o d u c t i v i t y , o r g a n i z a t i o n a l l e v e r a g e a n d t u r n o v e r
W o r k f o r c e M e t r i c s
G l o b a l p a y d a t a w i t h a d a t a b a s e o f n e a r l y 3 m i l l i o n r e c o r d s f o r 2 5 0 + j o b s
E n a b l e s i n s t a n t v i r t u a l o r g a n i z a t i o n d e s i g n t o m o d e l p a y r o l l c o s t s i n 8 5 + c o u n t r i e s a r o u n d t h e w o r l d
© MERCER 2016 3
U N D E R S T A N D I N G P E O P L E C O S T S
C A S E S T U D Y
W H Y P E O P L E C O S T S
M A T T E R
W R A P U P
© MERCER 2016 4
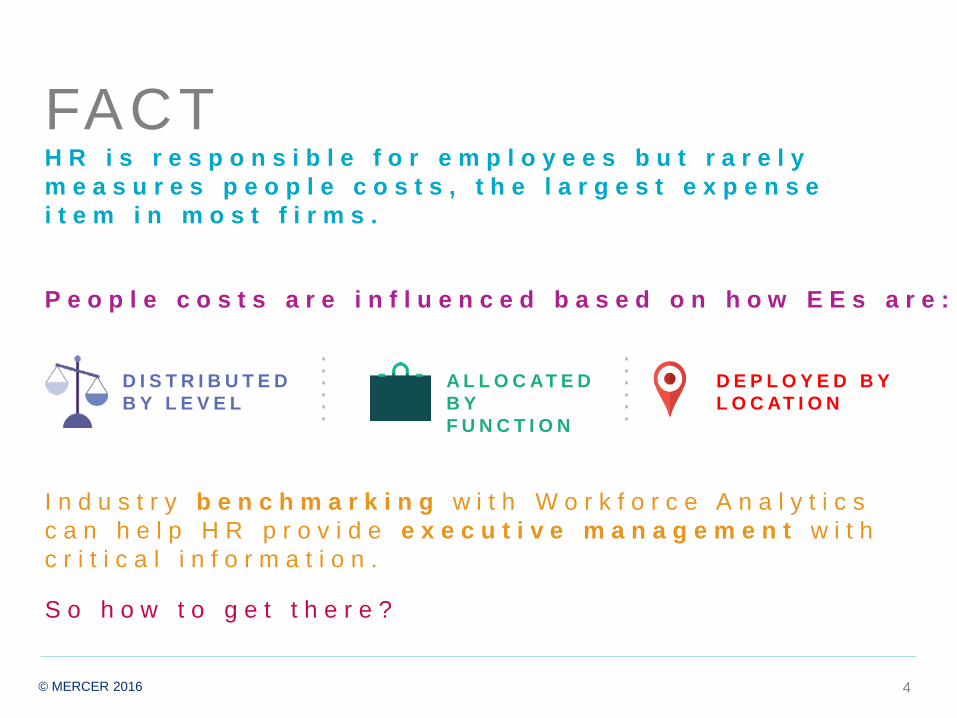
FACT H R i s r e s p o n s i b l e f o r e m p l o y e e s b u t r a r e l y m e a s u r e s p e o p l e c o s t s , t h e l a r g e s t e x p e n s e i t e m i n m o s t f i r m s .
P e o p l e c o s t s a r e i n f l u e n c e d b a s e d o n h o w E E s a r e :
A L L O C AT E D B Y F U N C T I O N
D I S T R I B U T E D B Y L E V E L
D E P L O Y E D B Y L O C AT I O N
I n d u s t r y b e n c h m a r k i n g w i t h W o r k f o r c e A n a l y t i c s c a n h e l p H R p r o v i d e e x e c u t i v e m a n a g e m e n t w i t h c r i t i c a l i n f o r m a t i o n .
© MERCER 2016
S o h o w t o g e t t h e r e ?

© MERCER 2016 5
M E R C E R | C O M P T R Y X W O R K F O R C E M E T R I C S
IF WORKFORCE METRICS CAN HELP IDENTIFY JUST $12M IN SAVINGS, SHARE PRICE COULD RISE 5%
Company A Improvement to Net Income: $12M
Revenue 1,800,000,000 Revenue 1,800,000,000
Net Income 250,000,000 Adj. Net Income 262,000,000
Shares Outstanding 300,000,000 Shares Outstanding 300,000,000
EPS $0.83 EPS $0.87
Multiple* 26.6 Multiple 26.6
Current Share Price $22.17 Current Share Price $23.23 *Multiple: factor used by investors to express how companies are valued

© MERCER 2016 6
Q U E S T I O N : C O N S I D E R T W O C O M P A N I E S …
• SAME BUSINESS, SAME HEADCOUNT, SAME REVENUES – BOTH USE SAME SALARY SURVEY WHICH SAYS BOTH
PAY ON MARKET – PEOPLE ARE THEIR SINGLE BIGGEST EXPENSE
DO THEY HAVE SIMILAR PEOPLE COSTS?
COMPANY A COMPANY B
– Majority of EEs in Silicon Valley
– Large Salesforce
– Small but well-experienced R&D staff
– Big executive team, low SOC*
– Majority of EEs in India
– Relatively small Sales team
– Use lots of less experienced Engineers
– Small executive team, high SOC*
*SOC: Span of control

© MERCER 2016 7
C A S E S T U D Y
N O T E : • M A R K E T D A T A I S A L W A Y S S H O W N I N D A R K B L U E • M A R K E T I S N ’ T “ R I G H T ”
SOFTWARE COMPANY $2B REVENUE
5,000 EMPLOYEES PARTICIPATE IN MERCER | COMPTRYX

© MERCER 2016 8
C A S E S T U D Y : B A S E P A Y A N A L Y S I S
ANALYSIS CONFIRMS: COMPANY A PAYS ON MARKET FOR BASE AND TOTAL TARGET CASH
0
40000
80000
120000
160000
Job 1 Job 2 Job 3 Job 4 Job 5 Job 6 Job 7 Job 8 Job 9 Job 10 Job 11 Job 12 Job 13 Job 14 Job 15 Job 16
Company A Market

© MERCER 2016 9
C A S E S T U D Y : P A Y A N A L Y S I S
TRADITIONAL SURVEY ANALYSIS RESULTS IN A MERIT BUDGET DECISION REPRESENTING
$19M IN COST
CO A. TARGET CASH
PAYROLL MERIT BUDGET PAYROLL RISE
$625,000,000 3% $18,750,000

© MERCER 2016 10
Revenue per FTE (in USD)
C A S E S T U D Y : F I N A N C I A L A N A L Y S I S
WHAT YOU PAY AND HOW MANY EEs YOU HAVE = PAYROLL COST 4% DIFFERENCE REPRESENTS $25M HIGHER PAYROLL COST
125,000
110,000
0
20000
40000
60000
80000
100000
120000
140000
Company A Market
EE Weighted Average (in USD)
400,000 425,000
0
50000
100000
150000
200000
250000
300000
350000
400000
450000
Company A Market
31.3%
27.5%
0%
5%
10%
15%
20%
25%
30%
35%
Company A Market
Payroll as a % of Revenue
4%

© MERCER 2016 11
C A S E S T U D Y : L E V E L A N A L Y S I S
LOWER SPAN OF CONTROL REPRESENTS $20M IN HIGHER PAYROLL COSTS!
Level Analysis: % of Headcount Span of Control
5.0%
74.4%
18.0%
2.6% 4.7%
79.2%
14.6%
1.5% 0
0.1
0.2
0.3
0.4
0.5
0.6
0.7
0.8
0.9
Support Professionals Management Executives
Company A
Market
3.9
5
0
1
2
3
4
5
6Company A
Market
$625M $605M Δ $20M
BUT, SPAN OF CONTROL CAN VARY BY FUNCTION!

© MERCER 2016 12
C A S E S T U D Y : S O C B Y F U N C T I O N
Level Analysis: Management Span by Function
2.3
3.8 4.1
7.9
10.7
8.2
3.5 3.2
4.1 3.5
8.5
10.9
6.9
7.8
2.4
3.7
0
2
4
6
8
10
12
Finance HR IT Ops Services R&D Mkt Sales
Company A
Market

© MERCER 2016 13
C A S E S T U D Y : L E V E L A N A L Y S I S -P R O F E S S I O N A L S
BUT REMEMBER, THE MARKET ISN’T RIGHT!
Level Analysis: % of Headcount
4.0%
12.0%
35.0%
32.0%
15.0%
2.0%
5.4%
18.2%
29.8% 30.5%
13.0%
3.0%
0
0.05
0.1
0.15
0.2
0.25
0.3
0.35
0.4
P1 P2 P3 P4 P5 P6
Company A
Market
2,4M 16,4M -18,3M -6,5M -11,9M 7,1M Δ $10,5M =

© MERCER 2016 14
C A S E S T U D Y : F U N C T I O N A N A L Y S I S - H E A D C O U N T
Level Analysis: % of Headcount
6.0%
2.0%
8.0%
2.0%
15.0%
38.0%
7.0%
22.0%
4.2% 1.4%
5.6% 4.0%
21.6%
42.0%
5.5%
15.7%
0
0.05
0.1
0.15
0.2
0.25
0.3
0.35
0.4
0.45
Finance HR IT Ops Servcies R&D Mkt Sales
Company AMarket
Level Analysis: % of Payroll
4.0% 1.0%
5.0% 1.0%
8.0%
48.0%
8.0%
25.0%
3.0% 1.3% 5.0% 4.0%
17.0%
38.0%
7.0%
24.7%
0
0.1
0.2
0.3
0.4
0.5
0.6
Finance HR IT Ops Servcies R&D Mkt Sales
Company AMarket

© MERCER 2016 15
C A S E S T U D Y : L O C A T I O N A N A L Y S I S - H E A D C O U N T
1.1% 0.5%
67.7%
5.4%
0.7%
6.8%
13.7%
3.0% 2.9% 0.5%
60.0%
3.7% 3.5% 5.5%
19.9%
2.4%
0
0.1
0.2
0.3
0.4
0.5
0.6
0.7
0.8
Canada Mexico United States China India S&E Asia Europe Africa
Company A
Market
© MERCER 2016 16
C A S E S T U D Y R E S U L T S
H R i d e n t i f i e s a b u s i n e s s p r o b l e m f o r
e x e c s
H R t a k e s o w n e r s h i p o f
w o r k f o r c e o p t i m i z a t i o n
H R c o n t r i b u t e s b u s i n e s s s o l u t i o n s

© MERCER 2016 17
M E R C E R | C O M P T R Y X W O R K F O R C E M E T R I C S
Payroll as a % of Revenue (Last FY): by Sector and
by Company Size
26.0%
37.8%
24.4%
37.1%
27.1%
35.8%
41.7%
0% 5% 10% 15% 20% 25% 30% 35% 40% 45%
Systems
Software
Semiconductor
Professional Services
Large Companies (>50k ee's)
Medium Companies (5k-50k ee's)
Small companies (<5k ee's)

© MERCER 2016 18
M E R C E R | C O M P T R Y X W O R K F O R C E M E T R I C S
Financial
Level Location
Function Demographics
Prof i le your organizat ion!
Track pay levels, cost structures, headcounts, turnover, demographics, promotions and top performers across your organisation and compare with the market
© MERCER 2016 19
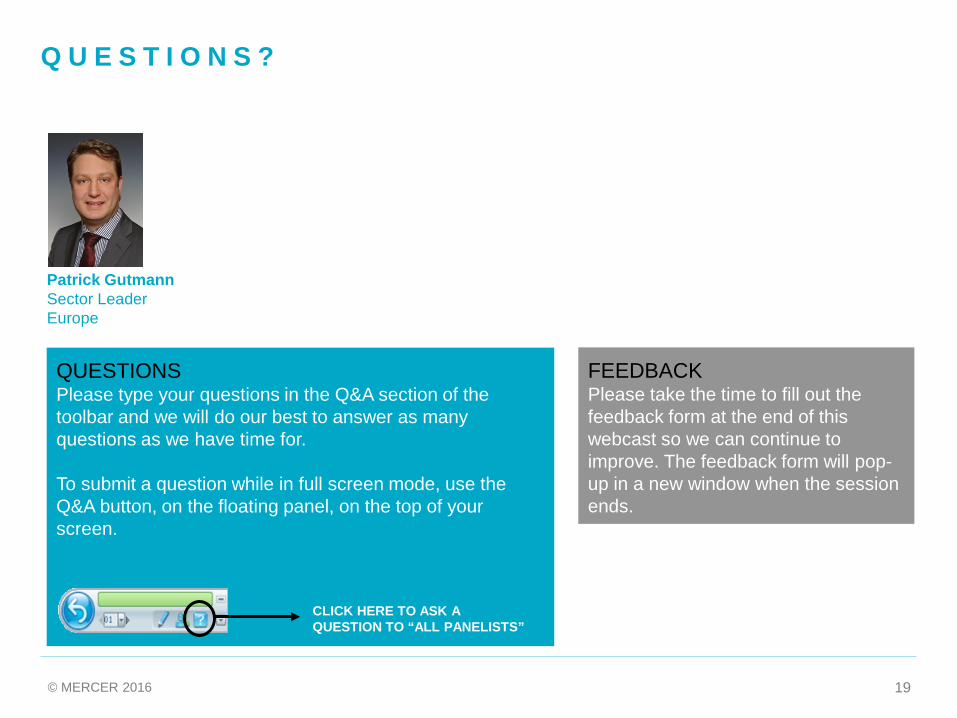
Q U E S T I O N S ?
Patrick Gutmann Sector Leader Europe
QUESTIONS Please type your questions in the Q&A section of the toolbar and we will do our best to answer as many questions as we have time for. To submit a question while in full screen mode, use the Q&A button, on the floating panel, on the top of your screen.
CLICK HERE TO ASK A QUESTION TO “ALL PANELISTS”
FEEDBACK Please take the time to fill out the feedback form at the end of this webcast so we can continue to improve. The feedback form will pop-up in a new window when the session ends.

© MERCER 2016 20