
MEMORANDUM - NASA AERONAUTICS AND SPACE ADMINISTRATION MEMORANDUM 1-20-59A BOUNDARY-LAYER...
54
NASA MEMO 1-20-5_A L'O I 0 Cq, I 0 NASA MEMORANDUM BOUNDARY-LAYER TRANSITION ON HOLLOW CYLINDERS IN SUPERSONIC FREE FLIGHT AS AFFECTED BY MACH NUMBER AND A SCREWTHREAD TYPE OF SURFACE ROUGHNESS By Carlton S. James Ames i_esearch Center Moffett Field, Calif. NATIONAL AERONAUTICS AND SPACE ADMINISTRATION WASH I NGTON February 1959 https://ntrs.nasa.gov/search.jsp?R=19980228370 2018-06-15T05:54:57+00:00Z
Transcript of MEMORANDUM - NASA AERONAUTICS AND SPACE ADMINISTRATION MEMORANDUM 1-20-59A BOUNDARY-LAYER...

NASA MEMO 1-20-5_A
L'OI
0Cq,
I
0 NASA
MEMORANDUM
BOUNDARY-LAYER TRANSITION ON HOLLOW CYLINDERS
IN SUPERSONIC FREE FLIGHT AS AFFECTED BY
MACH NUMBER AND A SCREWTHREAD TYPE
OF SURFACE ROUGHNESS
By Carlton S. James
Ames i_esearch Center
Moffett Field, Calif.
NATIONAL AERONAUTICS ANDSPACE ADMINISTRATION
WASH I NGTON
February 1959
https://ntrs.nasa.gov/search.jsp?R=19980228370 2018-06-15T05:54:57+00:00Z


NATIONAL AERONAUTICS AND SPACE ADMINISTRATION
MEMORANDUM 1-20-59A
BOUNDARY-LAYER TRThNSITION ON HOLLOW CYLINDERS
IN SUPERSONIC FREE FLIGHT AS AFFECTED BY
MACH I'gJMBER A_YD A SCREWI_READ TYPE
OF SURFACE ROUGHNESS
By Carlton S. James
SUMMARY
The effects of Mach number and surface-roughness variation on
boundary-layer transition were studied using fin-stabilized hollow-tube
models in free flight. _e tests were conducted over the Mach number
range from 2.8 to 7 at a nominally constant unit Reynolds number of
3 million per inch, and with heat transfer to the model surface. A
screwthread type of distributed two-dimensional roughness was used.
Nominal thread heights varied from i00 microinches to 2100 microinches.
Transition Reynolds number was found to increase _th increasing Mach
number at a rate depending simultaneously on Mach number and roughness
height. The laminar boundary layer was found to tolerate increasing amounts
of roughness as Mach number increased. For a given Mach number an optimum
roughness height was found which gave a maximum laminar run greater than
was obtained with a smooth surface.
INTRODUCTION
_e advantages of a laminar boundary layer_ in terms of reduced aero-
dynamic heating and skin friction, are well known. These advantages have
ass_ued increasing importance to the designer as flight speeds have
increased. It is of interest, therefore, to examine the effect of speed
itself on boundary-layer transition. At present there is little informa-
tion available on this subject for negligible stream turbulence and for
flight Reynolds numbers. Some wind-tunnel tests (refs. i and 2) have
indicated a decrease in the Reynolds number of transition with increasing
Mach n_nber in the Mach number range of approximately 1.5 to 3.5. Other
_nd-tunnel tests and some flight tests (ref. 3) have indicated an increase
in the Reynolds number of transition with increasing Mach number in the
same range. A few relatively recent investigations (refs. 4 and _) have
shown a tendency of transition Reynolds number to decrease as Mach number
is increased in this range, but to increase with a further increase in
Mach number. These apparently conflicting results could be due to differ-
ences in such variables as heat transfer, unit Reynolds number, surface

2
roughness or stream turbulence. To resolve the discrepancies it isnecessary to understand more than is presently understood about the com-bined effects of all of these variables.
In addition to Machnumber, a parameter knownto be important indetermining the extent of laminar flow is the surface roughness. Thepresence of surface roughness can influence the effect of someotherparameter upon transition. For example, the data of reference 6 showthat the observed trend of increasing transition Reynolds numberwithincreasing unit Reynolds number in the presence of small granular rough-ness is reversed if roughness is increased. Again, in references 7 and 8,the favorable effects of cooling (i.e., to increase transition Reynoldsnumber) are shownto be reversed at sufficiently large cooling rates inthe presence of surface roughness. It was considered important, therefore,in studying the effect of Machnumberon boundary-layer transition, todetermine also the simultaneous influence of surface roughness.
The present paper is concerned with an experimental study of theseeffects in the Machnumber range from 2.8 to 7 and for a particular formof two-dimensional distributed roughness. The tests were conducted in theAmessupersonic free flight wind tunnel with fin-stabilized hollow cylindersas test models. The model surfaces were highly cooled with respect to thestagnation temperature. Flow over the external surfaces of the cylinderswas considered to approximate closely two-dimensional flow because thelaminar boundary-layer thickness was small comparedto the cylinder radiusand the pitching amplitudes of the models were small.
Results from similar tests using a slender ogive-cylinder as the modelhave been reported in references 9 and i0. To aid comparison of the presentresults with those of the previous investigations, a quasi-two-dimensionalconfiguration was tested for which the outer surface of the cylinder wascontoured near the lea_ing edge to give approximately the samepressuregradient as that on the ogive-cylinder. Comparative results of the threeinvestigations are discussed herein.
SYMBOLS
Cp
H
M
n
N
pressure coefficient
roughness height, in. (see fig. i)
body nose length, in. (see fig. l(b))
Mach number
number of observations of xT less than or equal to an arbitrary
total number of observations of xT per model flight
X

P
R
Te
Tr
Tt
Tw
T_
I11
U
x
xT
6
thread pitch
UxReynolds number, -_-
boundary-layer-edge static temperature, OR
boundary-layer recovery temperature, OR
total temperature, OR
temperature of model surface, OR
free-stream static temperature, OR
velocity perturbation in stream direction, ft/sec
stream velocity, ft/sec
axial distance from model leading edge, in.
n
value of xT for which _ = 0.5 (see fig. 13)
thickness of laminar boundary layer, in.
kinematic viscosity, ft2/sec
Subscripts
e
T
oo
boundary-layer-edge value
transition-point value
free-stream value
MODELS AND TEST PROCEDURE
The tests described in this report were carried out by propelling
gun-launched models upstream through the test section of the Ames super-
sonic free flight wind tunnel. Mach numbers from 2.8 to 4.1 were obtained
by firing models through still air ("air-off" testing). Mach numbers
from 4.1 to 7 were obtained by firing models through the countercurrent
air stream of the wind tunnel (M = 2; "air-on" testing). The state of the
boundary layer on each model was observed from spark shadowgraphs, in
orthogonal planes, taken of the model at successive points along its flight
path. A detailed description of the wind-tunnel equipment and the test
techniques employed may be found in reference ii.

Model Geometry
The models were designed to permit observation of the quasi-two-dimensional boundary-layer flow over the external surface of sharp-edgedhollow cylinders, the axes of which were parallel to the stream direction.They consisted of fin-stabilized tubes 9 inches in length and 3/4 inch indiameter, machined from 7075-T6 aluminum. Twoexternal profiles weretested: a right circular cylinder to provide zero pressure gradient flow;and a contoured nose (open ogival segment) tangent to a cylinder to providean initial negative pressure gradient. The geometries and dimensions ofthese models are shownin figure i. To achieve an adequate pitch-stabilitymargin it was necessary to shift the center of gravity of each model forward
by fabricating a portion of the nose from a dense material. Phosphor bronze
was used for this purpose. In figure i the bronze portion of each model
is shown by crosshatching.
The models were launched from a l-i/2-inch smooth-bore gun. The fin
span of the models was made equal to the gun bore so that the models were
self-supported and self-alined in the barrel. The sabot used to drive the
model was machined from aluminum and was designed to be aerodynamically
stable to avoid hitting the tunnel walls. Attention was also given in its
design to minimizing separation disturbances to the model. Figure 2 is a
photograph showing the two model types and a launching sabot.
_e geometry of the slender ogive-cylinder model used for the test
reported in references 9 and i0 is shown in figure 3.
For convenience, the models of figures l(a), l(b), and 3 are referred
to in the present report as the straight tube, contoured tube, and pencil
model, respectively.
Surface Roughness and Leading-Edge Profile
Two types of surface roughness were employed: (i) a continuous screw-
thread, and (2) a circumferential scratch polish. Most of the data were
obtained with the continuous screwthread. This form of roughness has the
advantage of a simply defined geometry, the scale of which can be varied
over a wide range. It is also possible to reproduce accurately this form
of roughness on any number of models.
Screwthread roughness.- The screwthread was applied to the outer
surface of the models beginning 0.i0 inch behind the leading edge and
ending just forward of the fins. The geometric profile of the thread was
a single V having a pitch-to-depth ratio of 5. Thread depths between
O.OOO1 inch and 0.0021 inch were used. The threading detail is shown in
figure i. The initial choice of pitch-to-depth ratio was somewhat

5
arbitrary, but a fairly large thread angle was dictated by the machining
requirements of cleanness of cut and of tool life. In starting the thread
the lathe spindle was turned slowly by hand while the tool was fed grad-
ually into the work, one and a half turns being required to reach full
thread depth. The surface was then undercut slightly to ensure a full
profile with sharp peaks°
All threaded surfaces were examined under the microscope and photo-
graphed to provide accurate records of their dimensions. Coarse threads
were observed in shadow profile. Fine threads were observed with the aid
of an ingenious application by Tolansky (ref. 12) of a principle of optical
sectioning developed by Schmalz (ref. 13). This application makes use of
the optics of the microscope to cast the shadow of a fine wire obliquely
onto the threaded surface. The resulting shadow profile gives a measure
of dimensions normal to the surface. Photomicrographs of a typical screw-
thread in profile obtained using the wire shadow technique are compared
in figure 4. l
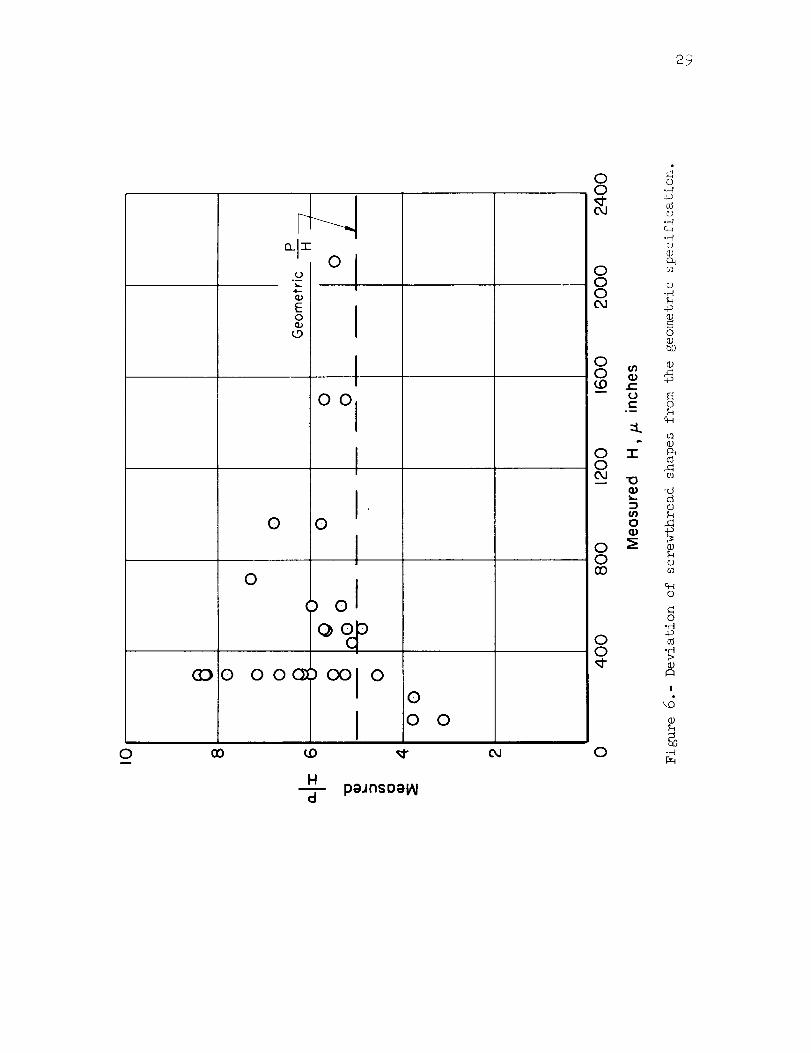
Example of the smallest and largest threads used are shown in figures
5(a) and 5(b). Some rounding at the peaks and roots of the profiles is
evident. Representative measurements of pitch and depth were made on all
threaded models. In figure 6 these measurements are shown as the ratio
of pitch to depth. The discrepancies observed were due almost entirely
to imperfect peaks and roots. In the turning of the finest threads some
plastic flow of the metal occurred randomly, causing them to be too deep
rather than too shallow.
Threads could not be cut immediately behind the leading edge because
of the thinness of the tube wall. To provide a uniformly smooth and known
surface, the area between the leading edge and the first thread was given
a circ_unferential scratch polish with grade 2/0 emery paper. The surface
profile of this section was first cut to coincide as closely as possible
with the extended locus of the thread peaks (see fig. i) in order to mini-
mize disturbances to the flow. The residual mismatch at the first thread
was kept _ithin 0.0003 inch with the unthreaded section high. A repre-
sentative profile at this station is illustrated in figure 5(c). In this
case the peaks of the first few threads have been flattened by the
polishing of the forward surface.
Scratch-polish roughness.- The scratch polish was applied to theinitial surface of all of the threaded models and to the entire surface of
four of the straight-tube models. This surface was produced with fine
emery paper using kerosene as a lubricant. Starting with a finish-
machined surface, the models were polished with successively finer grades
of emery paper until the desired finish was attained. With each change
of emery grade the direction of polishing motion was also changed to permit
the scratches of the new grade to be distinguished from those of the
iThe reticle scale, which appears in all of the photomicrographs,
cannot be used for direct dimensional comparison in this and subsequent
figures because the scale calibration depends upon the power of the
microscope objective.

6
previous grade. Polishing was then continued until examination under the
microscope showed that all of the scratches of the previous grade had been
removed. The final polish was applied in the circumferential direction.
Examples of the surface finish produced by this technique on 7075-T6
aluminum alloy are shown in the photomicrographs of figure 7. Figures 7(a)
and 7(b) show wire-shadow profiles of the 2/0 and 4/0 finishes, respectively.
The sensitivity of the wire shadow is not sufficient to resolve the 4/0
profile. Figure 7(c) is an interferogram of the same 4/0 surface. Fringe
spacing is i0 microinches. The maximum scratch depths measured on the 2/0
and 4/0 surfaces were approximately 50 microinches and 8 microinches,
respectively. These values apply also to the respective surfaces on
phosphor bronze.
Leading edge.- The leading edge of each model was carefully worked
over with emery paper until a flat forward-facing surface was produced as
uniform in width and as thin as practically possible. The corner between
the forward-facing surface and the outer surface of the tube was kept
square. A uniform leading-edge thickness of 0.0003 inch was set as a
goal. Average leading-edge thicknesses of 0.0003 to 0.0004 inch were
achieved. Because of the eccentricity between the inner and outer walls
of a given model, the finished leading edge varied in thickness by about
±35 percent of the average thickness, with the extreme dimensions diamet-
rically opposed. Figures 8(a) and 8(b) are photomicrographs of segments
of the forward face of a representative leading edge at the points of
maximum and minimum thickness. Figure 8(c) is a wire shadow profile of
the 2/0 outer surface of a straight tube at the leading edge, and indicates
that the rounding of the corner was nil within the resolution of the wire-
shadow technique.
Test Conditions
Mach number.- The test Mach number was varied between 2.8 and 7-
This range was dictated by internal choking in the cylinders at Mach
numbers below 2.8 and by incipient structural failure due to launching
stresses at Mach numbers above 7.
Reynolds number.- Unit Reynolds number (U/v)_ was held constant at
a nominal value of 3 million per inch by pressurizing the wind-tunnel test
section for the air-off (still air) shots and by controlling the reservoir
pressure for the air-on (countercurrent air stream) shots. A few models
were fired in the supersonic free flight underground range at atmospheric
pressure during a period when the wind tunnel was unavailable. For these
few shots the free-stream unit Reynolds number was approximately 2.3 mil-
lion per inch. In addition, a few models were tested at unit Reynolds
numbers up to 6 million per inch for the purpose of defining the effect
of the smaller variations in unit Reynolds number present in the main body
of the results.

7
Surface temperature.- Each model while in the gun barrel was at
ambient temperature° This temperature was assumed to prevail on the model
surface during the 15 to 25 millisecond time of flight. The validity of
this assumption has been examined in reference 9 and found to be reason-
able. 2 For this condition the ratio of model surface temperature to free-
stream static temperature was 1.0 for air-off testing and 1.8 for air-on
testing for which the Mach number of the air stream was 2.
The relationship of the test temperature ratios to the theoretical
conditions for infinite laminar boundary-layer stability is illustrated
in figure 9- The theoretical boundary calculated by Van Driest (ref. 14)
from the theory of Lees and Kin (refs. 15 and 16) is sho_ as the dotted
curve. The boundary for complete stability with respect to two-dimensional
disturbances according to the modified theory of Dunn and Kin (ref, 17)
is shown as the solid curve. The ratio (Tw - Tr)/Tt is used as the measure
of relative heat transfer in order to show the degree of surface cooling
and to emphasize the change in heat flow rate with Mach number for the
conditions of the test.
Pressure gradient.- To provide a basis for comparison between results
from the contoured tube and from the pencil model, the radius of the con-
toured tube nose ogive was chosen to give a pressure gradient closely
approximating that over the nose of the pencil model. The pressure distri-
bution on the pencil model was obtained from the results of Rossow (ref. 18).
For the contoured tube two-dimensional shock-expansion theory was used. The
theoretical pressure distributions for these models at Mach numbers of 3
and 6 are presented in figure i0. At Mach number 3 the pressure gradients
were closely matched on the model noses but differed immediately behind
the nose where on the pencil model an adverse gradient existed. At Mach
number 6 the pressure gradients were not so closely matched on the model
noses but were nearly the same behind the nose.
Surface roughness parameter.- For the screwthread surface, the vertical
peak-to-valley distance, H, was taken as a measure of the roughness scale.
For the scratch polish, H was defined as the peak-to-valley distance of
the deepest scratches. The roughness measure was made dimensionless by
21n reference 9 the temperature rise of the model skin due to aero-
dynamic heating was calculated for the pencil model. It was concluded that
during the short time of the model flight the skin temperature increased by
less than i percent, except in the immediate neighbo_lood of the tip where
a maximum temperature of 300 ° R above the average skin temperature was fotuud
to be possible. Similar calculations for the hollow-tube models show that
leading-edge temperatures approximately 230 ° R at M = 3.5 and 670o R at
M = 7 above average skin temperature were possible. The calculations were
conservatively based in two respects: (i) heat flow to the skin was con-
sidered constant at the initial rate, and (2) the axial temperature gradi-
ent was the limiting value determined by assuming the specific heat of the
model material to be zero (i.e., the value necessary to conduct heat out
of the tip as fast as it is received). The calculated temperature
differences_ therefore_ represent maximum possible values.

8
forming the parameter (H/$)_je, first proposed by Seiff, which relates
the roughness height to the boundary-layer thickness. For laminar flow
on a flat plate this parameter has the property of being independent of
distance from the leading edge, and is therefore convenient for specifying
the scale of distributed roughness on the straight tube. For configura-
tions such as the contoured tube and pencil model on which pressure gradi-
ents occur, the roughness parameter is a function of longitudinal position.
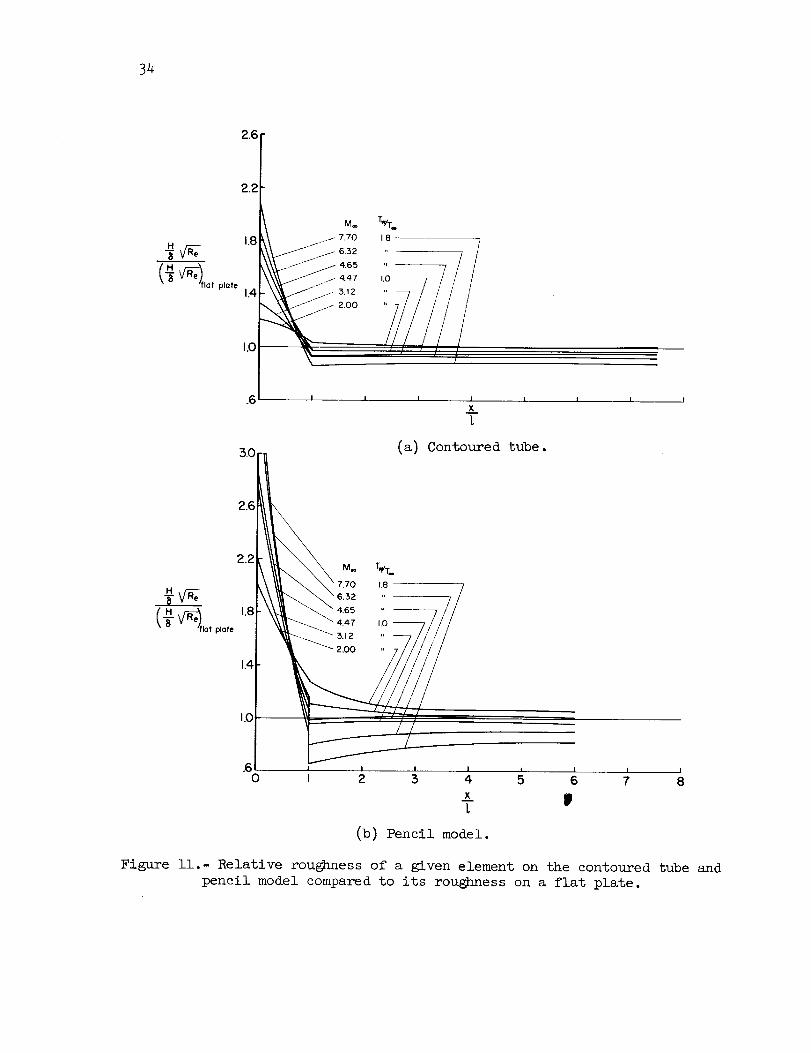
In figure ii values of the roughness parameter on these models are compared,
at several Mach numbers, in terms of the corresponding constant value on a
flat plate. The parameter shows a wide variation on the nose of each model.
However, it is virtually constant behind the nose of the contoured tube,
and relatively so on the cylinder of the pencil model. It was deemed
desirable to specify the value of the roughness parameter on the body
cylinder in order to preserve its independence of longitudinal position
and to avoid including implicitly in the parameter possible effects of
the nose contour on transition. For all data in which (H/5)_e was used
as an independent variable, transition occured on the body cylinder. It
was therefore somewhat arbitrarily decided to evaluate the roughness
parameter at the transition point, _T" In the computations of (H/5)_je,
the boundary-layer thicknesses, _, were calculated by the method outlined
by Cohen and Reshotko in references 19 and 20.
Transition Measurements
Each spark shadowgraph taken of a model in flight provided a record
of the instantaneous location of transition at two diametrically opposed
points on the model. These points are identified in the representative
shadowgraphs of figure 12. Since the distance, xt, from the leading
edge to a local transition point is a function of both time and meridian
angle on the model, a statistical method was used to determine a single
value of xt by which to define the mean location of transition for a
given model flight. From a total of 7 shadowgraphs per flight a maximum
of 14 observations of transition-point location could be made. For an
arbitrary value of x the ratio of the number of observations of xt
less than or equal to x, to the total number of observations, can be
formed. This ratio, n/N, represents statistically the fraction of the
boundary layer which is turbulent at the point Xo By plotting n/N as
a function of x, a distribution curve is obtained which defines the
transition region. Typical distribution curves are illustrated in fig-
ure 13. For a given distribution curve the transition region lies between
the values of x corresponding to the intercepts of the curve at
n/N = O and n/N = 1. These two x positions are often referred to as
the beginning of transition and the end of the transition, respectively.
The value of x for which half of the observations showed the boundary
layer to be turbulent (n/N = 0.5) was taken as the length of the laminar
r_n, xt. This was the characteristic length used to determine the
transition Reynolds number.

9
Factors Affecting Precision
Angle of attack.- A small amount of model pitching during flight was
inevitable. The maximum pitching amplitudes of the models used for data
were generally less than 1-i/2 °. As described in references 9 and i0 the
effect of angle of attack on the boundary-layer transition can be deter-
mined by plotting the individual values of XT, for a given model flight,
against the angle of attack. For pitching amplitudes greater than some
value depending on fineness ratio (about 3° for the hollow-cylinder models),
a correlation _th angle of attack is found from which extrapolation to
zero angle of attack appears to give reliable values of xT corresponding
to zero angle of attack. For smaller pitching amplitudes the data do not
correlate with angle of attack and are thus considered to be independent
of small an_unts of pitching. With respect to the hollow-cylinder models,
only data in this latter category were used in the present report.
Leading-edge thickness.- While the leading edges of the tube models
were made as thin as possible commensurate _th reasonable uniformity of
dimension, the large unit Reynolds number of the test resulted in leading-
edge-thickness Reynolds numbers of the order of l0 s . According to refer-
ence 21, transition Reynolds nmnbers prevailing for this leading-edge-
thickness Reynolds n_aber could be perhaps i0 percent higher than those
prevailing for a mathematically sharp leading edge. Reference 22 would
indicate a somewhat greater difference. Accordingly, the possibility of
the presence of a small increment in RT due to a finite leading-edge
thickness is recognized. Such an increment, however, should be nearly
constant in all of the data because of the unifo_lity of leading-edge
thic½_ess among the models and therefore should have at most a secondary
effect on the observed trends of RT with Mach number and surface
roughness.
Leading-edge distortion due to heating.- It was necessary to consider
the possibility that distortion of the lea_ing edge due to heating might
influence the transition measurements in an unknown and variable manner.
Calculations based on the thermal properties of the material and the esti-
mated limits of leading-edge temperature showed that if the aluminum leading
edge of the straight tube should become bell-mouthed as a result of thermal
expansion, it would produce a local re-entrant angle of the cylinder profile
of the order of i°o Similar distortion of the bronze leading edge of the
contoured tube would be approximately 50 percent greater. Double bow waves
were observed in the shadowgraphs of the straight tube. _ese might be
inferred as evidence that temperature distortion of the leading edge was
indeed affecting the boundary-layer flow. I{owever, it was also observed
on one or two occasions when the leading-edge profile of the straight tube
was not square but rounded (under the same test conditions) that the double
bow wave did not appear. It is believed therefore that the double bow wave
was due to flow separation at the 90° leading-edge corner and subsequent
reattachment on the cylinder. Re-entrant flow disturbance due to leading-
edge distortion probably would be less than that due to reattachmento No

i0
double bow waves were observed with the contoured tube, probably becausethe relatively high static pressure at the leading edge prevented flowseparation. The effect of leading-edge distortion in this case might bethrough a slight alteration of the local pressure distribution.
In searching for direct evidence of a leading-edge distortion effectit was anticipated that because of the transient nature of the heatingprocess and consequent progressive distortion of the leading edge thelocal flow pattern, or the distance to transition_ might show a progressivevariation with distance flown. However, variations of this sort were notdetected. It was concluded that any effects of leading-edge distortionwhich might be present were both small and, for a given Machnumber,constant.
Repeatability of the transition measurements.- The general repeat-
ability of the data is dependent both upon the precision with which the
measurements are made and upon the duplication of all aerodynamic and
geometric conditions of the test for successive model flights. In these
tests the precision of a given data point depended principally on the
errors of measurement of xT. Errors of measurement of the other physical
quantities from which Mach number and Reynolds number were determined were
of lower orders of magnitude. The value of the characteristic transition
distance, _, as determined by the method previously described, was foundto be relatively insensitive to the normal uncertainties in the choice of
local transition locations from the shadowgraphs. Repetitive determina-
tions of x--T usually agreed within approximately 1/8 inch. The corre-
sponding values of RT therefore are considered to be accurate to within
±I/2 million°
An indication of the precision with which specified test conditions
can be met is given by the repeatability of data from successive models
flown under the same set of test conditions° Only a very limited number
of such data were obtained with the hollow-cylinder models and these were
all for the straight-tube configuration° The available comparisons indi-
cate a repeatability of RT within ±i million for this configuration°
Similar comparisons for the pencil model indicate a repeatability of RTfor this model within ±1/2 million. For the contoured tube it is believed
that because the potential leading-edge effects appear to be fewer on this
model than on the straight tube, the repeatability of the data from this
configuration should be correspondingly more precise° It is believed to
approximate that for the pencil model.

ii
EXPERIMENTALRESULTS
Gross Trends
In order to show graphically the ranges of Machnumberand Reynoldsnumber in which the data fall, the transition data are plotted againstboundary-layer-edge Machnumber in figure 14. The length Reynolds numberof the point at which turbulence was first observed is designated by theopen symbol. The length Reynolds number of the point beyond which nolaminar flow was observed is designated by the filled symbol. For a givenmodel flight each such pair of symbols marks the beginning and the end ofthe transition region. This figure indicates an over-all trend of increas-ing transition Reynolds number with increasing Machn_nber. The increasein transition Reynolds numberbetween Machnumber 3 and Machnumber 7 isapproximately threefold. Within this group of data the average length ofthe transition region is roughly 7 million Reynolds number, and does notappear to be a function of Machnumber.
In this figure, surface roughness is a variable, the variation beingmore or less randomthroughout the Machnumberrange. The transitionrange for the roughest model (coarse screwthread) is labeled, and givesa preliminary indication of the detrimental effect of large roughness.
Lines of minimumcritical Reynolds numberaccording to Van Driest(ref. 14) are shownin figure 14 for the two values of wall to free-streamtemperature ratio which prevailed in the present test. The l_nim_m criticalReynolds number is defined in the stability theory of Lees and Lin (refs. 14,15, and 16) as the Reynolds numberbelow which small disturbances in thelaminar boundary layer are damped,and above which they are amplified.Transition is shownto have occurred, on models of the present test, atReynolds numbersbelow the minimumcritical, and the trend of transitionReynolds numberwith Machnumberappears to be continuous throu_ theminimumcritical Reynolds number.
Consideration has been given to the possible effects on the testresults of the simultaneous changes in wall to local static temperatureratio and stream turbulence at Me = 4.1o It would be expected, becauseof the higher cooling rate, that transition would occur at a higherReynolds numberbelow Me = 4.1 than above it. At the sametime theabsence of stream turbulence below Me = 4ol should tend to induce ahigher transition Reynolds numberbelow Me = 4.1 than above. Thereforethe potentially detrimental effects on transition of the discontinuouschanges in temperature ratio and turbulence level 2 are additive and/ if
3The turbulence level of the wind-tunnel air stream is not known
quantitatively. However, the effective turbulence experienced by the
moving model is_ because of its own velocity_ only about a third of that
which would be experienced by a static model in the same air stream.

12
significant, should be observable in the data. In figure 14 there is nosensible discontinuity in the trend of the data at Me = 4.1. Likewisein subsequent presentations there are no observable discontinuities atMe = 4.1. It is concluded that such effects are not significant in thepresent results. In reference i0 similar reasoning was used to reach thesameconclusion with respect to data for the pencil model.
Effect of MachNumber
To see more clearly the separate effect of Machnumberon boundary-layer transition the data are plotted separately for each configurationand for constant roughness height, H. In figure 15 the variations oftransition Reynolds numberwith Machnumberon the contoured tube, thepencil model, and the straight tube are compared. The data of figure 15(b)are reproduced from reference i0. Curves of constant surface roughness(nominal thread height, H) are faired through the data. It is clear thatfor a variety of test conditions, transition Reynolds number increaseswith increasing Machnumber. It is further apparent that the sensitivityof transition Reynolds number to Machnumbervariation is dependent on theranges of Machnumber and roughness prevailing. Point by point comparisonsbetween the data of figure 15(a), (b), and (c) indicate that transitionReynolds numbers differ on the different configurations for given conditionsof Machnumber and roughness height. In general the highest values ofRT occur on the contoured tube, while the comparison between the pencilmodel and straight tube appears inconclusive. However, a basis for a morecritical comparison of these data is established in the discussion sectionand the effects of configuration are subsequently considered in more detail°
Effect of Surface Roughness
To show the effect of roughness on transition, the samedata areplotted in figure 16 with surface roughness height, H, as the independentvariable. Curves of constant Machnumber are faired through the data.The manner of fairing of figures 15 and 16 was influenced by the fact thatsince each is a cross plot of the other, the fairings must be mutuallyconsistent. Figures 16(a) and (b) show that gross increases in roughnessheight produce substantial reductions in transition Reynolds number. Asbefore, it maybe observed that the sensitivity of transition Reynoldsnumber to roughness variation is dependent on the ranges of roughness andMachnumber prevailing.
An interesting phenomenonrevealed in these figures is that for thistype of roughness, on the models having a favorable pressure gradient overthe nose at least, the maximumlength of laminar run does not occur on thesmoothest surface, but on a surface having appreciable roughness. The

13
optimum roughness is dependent on Mach number and is seen to be not far
below the roughness which vrill cause the laminar run to be a _uinimum.
The increase in RT above the value for a smooth surface appears to be
approximately i0 to 15 percent of the smooth surface value. The relatively
large increase in RT with increasing roughness height indicated by the
data in figure 16(a) for nominal Mach numbers of 3.0 and 3-7 are believed
to be exaggerated as the result of an anomalous roughness characteristic
affecting the two points ha_ng nominal roughness heights of 120 _in.
The values of RT represented by these points are believed to be low
because the scre_hread roughness on the corresponding models was imper-
fectly formed. In cutting the threads on these two models the lathe tool
threw up small ridges of nonunifo_rl height along the thread peaks. These
ridges introduced a three-dimensional quality to the roughness on these
models. It is kno_ that a three-dimensional rou_ness of a given height
has a greater effectiveness in causing transition than has a two-
dimensional roughness of the same heig_t. For example, Carros observed
over a range of Mach numbers (see fig. 15(b)) that a sandblasted surface
having a maxim_a roughness height of i000 _in. caused earlier trsu_sition
than did a screwthread of 1500 _in. height. _%e roug_uless characteristic
just described was confined to the two models in question and therefore
does not explain the appearance of an optimum roughness at the higj_er Mach
numbers° This phenomenon is examined in more detail in the discussion
section.
Effect of Unit Reynolds Number
Published results of earlier transition experiments (e.g., refs. 23
through 27) show that, for small roughness, transition Reynolds number
increases as unit Reynolds number increases. For this reason it was con-
sidered important to hold unit Reynolds number constant in the present
experiment and this was done, within experimental accuracy, for most of
the data. Two situations developed, however, which made it desirable to
assess, at least roughly, the effect of unit Reynolds number variation
on R T for values of U/v of the order of 3 million per inch. Thefirst was the fact that unit Reynolds number for the underground ravage
shots could not be controlled independently of Mach number. The second
was the desire to make comparisons between the present results and those
obtained _ith the pencil model at lower unit Reynolds numbers.
To provide a basis for assessment of the effect of unit Reynolds
number variation on the test results a very few data points were obtained
with the straight tube and pencil model to determine the variation of
transition Reynolds n_ber with unit Reynolds number for constant Mach num-
ber and subcritical roughness height (i.e., roughness height less than that
required to influence transition). In figure 17 these data are compared
v_ith results of the earlier investigations° The trend of RT with (U/v)_
observed in the present range of unit Reynolds numbers appears to be _he
same as that observed previously on similar configurations at lower unit

14
Reynolds numbers. It is to be emphasized that comparisons should be made
between slopes of the individual curves rather than between specific values
of RT. On the log-log presentation of figure 17 most of the curves can
be approximated by the relation
logloRT = C1 + C21ogio _U_
where C I and C2 are constants for a given curve. The value of Cl is
dependent on many variables including Mach number, surface roughness, and
surface cooling. The slope, C2, appears to be considerably less sensitive
to these variables (at least for subcritical roughness). It is believed
that figure 17 provides a satisfactory basis for accounting for the effects
of relatively small differences in (u/v)_ in comparisons of transition
data obtained at different unit Reynolds numbers, if roughness is subcrit-
ical. The average value of C2 for all the curves of figure 17 is 0.40.
This value was used to adjust data for three of the underground range shots.
DISCUSSION
Mach Number and Roughness Effects on the Contoured Tube
Cross plots of the data.- To define precisely each of the highly
nonlinear curves of figures 15 and 16 would require many more data points
than were obtained in the present investigation. Therefore, in order to
gain a more complete understanding of the behavior of boundary-layer
transition under varying Mach number and roughness conditions, advantage
was taken of the fact that figures 15 and 16 are mutual cross plots.
Attention was focused on the data from the contoured tube since these were
the most complete and were obtained under the most precisely controlled
conditions. Two cross-plot families of curves were constructed about the
data of figures 15(a) and 16(a]. The fairings of these curve families
were iterated between the figures first assuming the data to have absolute
precision and then allowing the curves to miss individual data points by
the amount necessary to obtain quantitative consistency of the curve
families. In making these plots, surface roughness was made dimensionless
through the use of the parameter (H/5)./R e discussed under test conditions.
The quantitatively consistent cross plots resulting from this procedure are
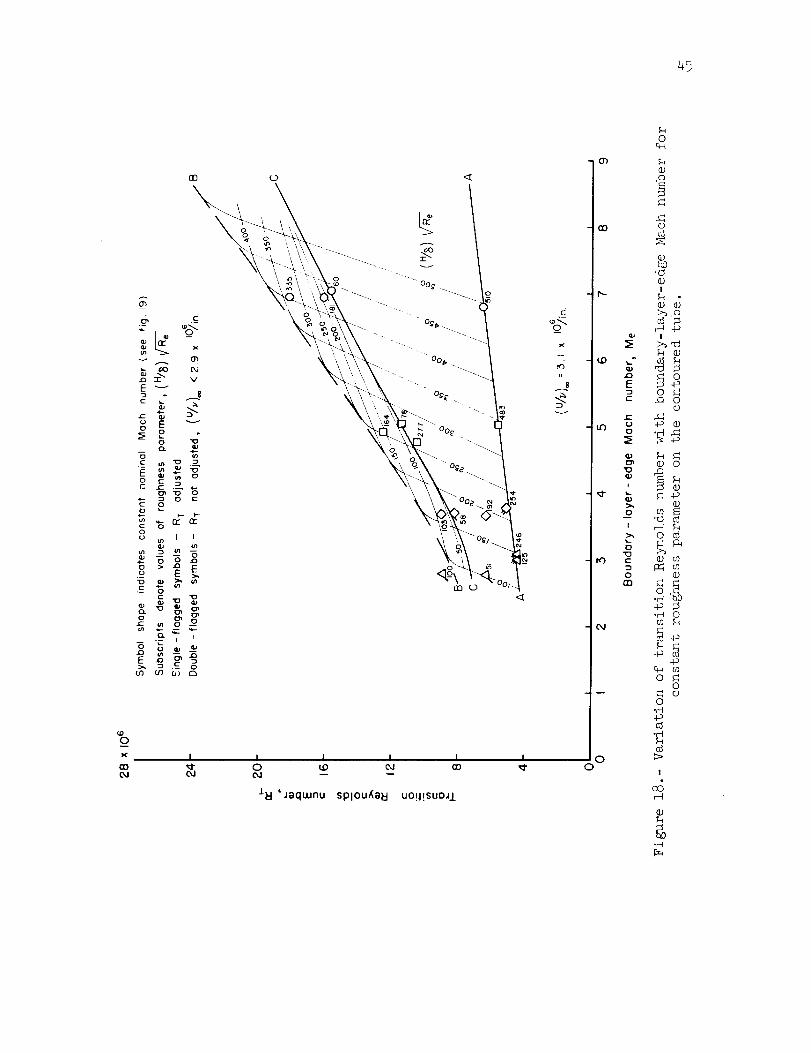
shown in figures 18 and 19. Unit Reynolds number is constant and equal
to 3.1 million per inch. 4 These figures are discussed separately in the
following paragraphs.
4Transition Reynolds • numbers of three data points from the underground_
range, for which surface roughness was below critical values, were adjusted
on the basis of figure 17 to correspond to this unit Reynolds number.
Single-flagged symbols identify these points.
Three other data points from the range (double-flagged symbols), for
which roughness was supercritical, were not adjusted because no suitable
basis was available. Data from reference 6 indicate qualitatively that
such adjustments should be smaller than - or even of opposite sign to those
for subcritical roughness°

15
Effect of Mach number.- In figure 18, transition Reynolds number is
plotted against local Mach number for constant values of the roughness
parameter. According to this figure, as Mach number increases, for a
given surface roughness, RT increases slowly along the curve A-A until
a critical Mach number is reached; RT then increases rapidly until a
second critical Mach number is reached at the envelope curve B-B; RT
then increases more slowly with the rate of increase approaching a nearly
constant value along curve C-C with further increase in Mach number.
On a sufficiently rough surface, then, R T increases with Me at a rate
indicated by the curve A-A, an8 on a sufficiently smooth surface RT
increases with Me at a rate indicated by the curve C-C. The reason for
this difference in rate is not clearly understood. It has been pointed
out in reference i0 that for a constant wall to local static temperature
ratio the relative cooling effect of the wall increases with Mach number.
This fact is evident also from an examination of figure 9. For such a
condition it would be expected on the basis of stability theory that the
boundary layer would remain laminar to higher Reynolds numbers as Mach
nu_nber increases. This is in agreement with the observed variation. The
effect of heat-transfer variation (surface cooling) is implicit in the
Mach number variation, ho_{ever, and therefore it cannot be ascertained
just what fraction of the observed increase in RT is due to increasing
heat transfer. Results from references 4, 5, 7, and 25 are compared with
the present results for the contoured tube in figure 20, where the curve
C-C of figure 18 is reproduced. The effect of roughness is believed to
be insignificant in these data, at least at the higher Mach numbers, so
that the data are most nearly comparable to curve C-C. Other test
conditions (e.g., unit Reynolds number, initial pressure gradient) differ
significantly, however, and the curves cannot be quantitatively compared.
They should be compared only as to trend. The variation observed in the
data of reference 7 for the cooled cone (Tw/T e = const) is similar to that
observed in the present test. On the other hand results from the insulated
cone and flat plates show a trend of decreasing RT with increasing Machnumber below a Mach number of about 3.8 but a reversal of the trend above
this Mach number. It appears therefore that while the differences in trend
below Me = 3.8 may be due to the effect of heat transfer, other effects
are also present which in addition to surface cooling tend to delay
transition as Mach number increases. These effects are as yet unidentified.
Effect of roughness.- In figure 19, transition Reynolds number is
plotted against the roughness parameter, (H/_)_7, for constant values of
Mach number. As the roughness parameter increases, for a given Mach number,
RT increases gradually to a maximum at some critical value of the roughness
parameter; RT then decreases rapidly until a second critical value of the
roughness parameter is reached, after which RT tends to remain constant
(at least at Me = 3) with further increase in (H/_)_e. Figure 19 indi-
cates the existence of two families of critical combinations of Mach number
and surface roughness. One family represents conditions for maximum
transition Reynolds number. The other family represents the minimum rough-
ness which gives the minimum value of transition Reynolds number. The loci
of these combinations are indicated in the figure by the dashed lines.

16
These lines separate the plot into three distinct regions of transition
Reynolds number variation" Region I in which RT is relatively low and
is only moderately sensitive to changes in Mach number; region II in which
RT varies rapidly _ith either Mach number or surface roughness; region III
in which RT is relatively high and has intermediate sensitivity to changes
in Mach number and roughness.
Optimum roughness phenomenon.- The appearance of an optimum roughness
height corresponding to the maximum laminar run at a given Mach number was
umexpected. T_e mechanism which operates to produce this phenomenon is
not yet understood. It is tentatively thought to be associated with the
shape of the roughness. According to figures 18 and 19 this effect becomes
increasingly significant as Mach number increases. The only other evidence
yet foumd of the existence of such a phenomenon comes from a recent investi-
gation of roughness effects in low speed flow. In reference 28 the transi-
tion Reynolds numbers on a two-dimensional surface with and without a single
tramsverse wire were compared at Me < 0.17. In two instances, where the
wire was relatively close to the leading edge, the data show that an optimum
ratio of roughness height to lamAnar-boumdary-layer momentum thickness
occurred in a way very similar to that observed in the present investigation.
There was no significant increase in transition Reynolds number, however.
A possible mechanism whereby the transverse screwthread type of rough-
ness could either produce or damp disturbances in the boundary layer is
suggested by the results of some experiments with single transverse rec-
tangular cutouts reported in references 29 and 30. In these experiments
acoustic radiation (periodic pressure waves) was observed to emanate from
the cutouts for certain co_oinations of Mach number and cutout dimensions.
It was shown that in the Mach number range 0.4 to 1.5 the frequency of the
radiation imcreased with increasing Mach number if the gap width was held
constant amd that the gap width necessary to maintain a constant frequency
increases with increasing Mach number. Vortex motion was observed within
the cutout_ and under certain conditions vortices appeared to be shed
periodically from the cutout. In the Ames supersonic free flight wind
tunnel_ acoustic radiation occasionally has been observed to emanate from
scre_hreads and tramsverse V-shaped grooves on models in supersonic free
flight. An example of this radiation is illustrated in figure 21, which
shows a short thin-walled hollow cylinder flying at a Mach number of 1.23.
The radiation originates at a group of five circumferential V-grooves,
each O.O03-inch deep, located a short distance behind the leading edge.
It may be inferred that the flow pattern in each groove of a screwthread
is similar to the flow in the rectangular cutout. A captive vortex in a
thread groove could act as an energy reservoir which umder the proper
flow conditions could absorb and redistribute energy perturbations in the
boundary layer and thus be a damping device. The vortex, whose size is
determined by the size of the groove, must have the proper characteristics
to resonate with the boundary-layer perturbations. If the groove were
much too small_ the vortex would not form. Zf the groove were much too
large_ the vortex might become umstable and shed into the boundary layer

17
causing a large disturbance (acoustic radiation). Since the energy which
drives the vortex comes from the main stream, it might be expected that
the combination of Mach number and groove size required to produce resonance
damping would vary qualitatively in the same way as that required to produce
acoustic radiation. Figure 19 indicates that as Mach number increases the
groove size required to obtain the maximum laminar run also increases, so
that this combination does in fact vary in a manner consistent with the
above expectation. In the case of the transverse wire of reference 28 a
vortex flow in the separated regions immediately forward and aft of the wire
could provide resonance damping of boundary-layer oscillations. On the
other hand, the shape of the curve for the sandblasted surface in fig-
ure 15(b) makes it appear that an optimum roughness height may occur for
this type of roughness. If such is the case then the above hypothesis
must be modified.
In any event the transverse groove or screwthread, under the present
test conditions, has the demonstrated ability to prolong laminar flow to
a higher Reynolds number than can an extremely smooth surface. At the
higher Mach numbers the optimum roughness resulted in transition Reynolds
numbers 15 percent higher than would be obtained with much smaller roughness.
The optimum roughness height at these Mach numbers was 8 to i0 percent of
the laminar boundary-layer thickness at transition. The corresponding
full-scale rougbn_ess height could be of the order of 0.i inch. This result
suggests the possibility of submerging miscellaneous surface imperfections
which are potential sources of turbulence (such as joints and rivet heads)
by applying a uniform transverse groove finish to the surface of an assem-
bled wing or body. In addition_ based on the theoretical results of
Chapman (ref. 31) there appears the possibility of reducing total heat
transfer and total skin friction by using the continuous screwthread to
produce controlled regions of separated flow. Such a possibility would
seem to warrant further investigation.
Critical combinations of Mach number and roughness parameter.- Curves
of the critical combinations of Mach number and roughness parameter observed
in figure 19 are plotted in figure 22. The three regions into which the
curves divide this plot correspond to those of figure 19; so that under the
present test conditions, for combinations of Mach number and roughness
parameter which fall into Region I, the presence of roughness will result
in minimum values of RT while, for combinations which fall into
Region III, roughness will have no adverse effect on RT. Figure 22 shows
rather clearly that as Mach number increases the laminar boundary layer is
able to negotiate increasingly rough surfaces before transition is influ-
enced adversely by the roughness. It is also evident that the incremental
increase in roughness necessary to reduce RT to a minimum (Region II)
becomes greater as Mach number increases. In other words the adverse
effect of roughness on transition is not as abrupt at high Mach numbers
as it is at low Mach numbers.

18
Comparison of Results From the Three Models
Although the curves of figures 15 and 16 for the pencil model and
straight tube do not present as complete nor as consistent a pattern of
variation as do the curves for the contoured tube, it is apparent that
the qualitative effects of Mach number and surface roughness on transition
Reynolds number are similar on all three models, and it is possible through
comparison with the complete patterns of figures 18 and 19 to identify
these data with respect to the trend regions defined in figures 19 and 22.
Such indications as there are of the critical values of roughness height
and Mach number for the pencil model and straight tube, when compared with
the corresponding values for the contoured tube, suggest that these values
do not vary greatly among the three configurations considered. However,
rather consistent differences in transition Reynolds number are seen to
exist between the curves for one configuration and the corresponding curves
for another. For example, looking at figures 15 and 16, parts (a) and (b),
it is apparent that an upward translation of approximately 3 million
Reynolds number of the curves for the pencil model would put them into
closer agreement with those for the contoured tube. With respect to the
straight tube, no models having large roughness were tested. Figure 16(c)
shows that the data for this model were confined to roughness values
generally less than those which figure 15(a) shows to be optimum for the
contoured tube. This suggests that the straight-tube data for the higher
Mach numbers at least, should fall within Region III as defined in fig-
ures 19 and 22. It follows that the straight-tube data in figure !5(c)
should be comparable to the curve C-C of figure 18. A comparison shows
the agreement to be reasonably good. As was observed with the pencil
model, however, the agreement would be improved if the data for the
straight tube were translated upward by approximately 3 million Reynolds
number. In the case of the pencil model, approximately a third of this
difference can be attributed to the difference in (U/v) . Otherwise these
roughly constant differences in RT between the curves of one configura-
tion and those of another reflect the influence of configuration change on
the environment of the laminar boundary layer.
Among the three configurations there are three important differences
in the boundary-layer environment:
i. Pressure gradient
2. Relative surface roughness on the nose
3o Local flow separation at the leading edge
The first two of these are apparent from figures i0 and ii.
Considering pressure gradient alone, it would be expected that
transition would be delayed on the contoured tube and pencil model to
higher Reynolds numbers than on the straight tube. On the other hand,
the roughness over the noses of these two models, in terms of boundary-
layer thickness, is considerably greater than on the straight tube. This
condition would be expected to have a detrimental effect which would oppose
the favorable effect of pressure gradient.

19
The adverse pressure gradient aft of the nose of the pencil model
is small compared to the favorable gradient over the nose. At Mach
number 6 it almost disappears. The major difference, therefore, between
the flow conditions over the pencil model and the contoured tube is in the
relative surface roughness over the nose. The relative roughness over the
nose of the pencil model is in the neighborhood of 50 to 75 percent greater
than that over the nose of the contoured tube. _is difference could be
responsible for the lower transition Reynolds numbers on the pencil model.
The third difference in boundary-layer environment is that of local
flow separation at the leading edge. This local separation at the leading
edge of the straight tube is illustrated in figures 12(d) and (e) where
the separation bubble is betrayed by the double bow wave. The contoured
tube (figs. 12(a), (b), and (c)) and the pencil model do not show evidence
of leading-edge separation. In spite of the sharpness of the leading edges
and the large value of unit Reynolds number, local separation occurred on
all models of the straight tube. While the effect of this local separation
on the transition Reynolds number is undoubtedly adverse, its magnitude is
not know,no It is therefore not possible to use the straight-tube results
as a standard by which to judge the relative importance of pressure
gradient and roughness on the other two models. It is believed, however,
that this effect could have reduced significantly the laminar flow on the
straight tube. It is believed to have been responsible for the greater
scatter in RT observed for this model.
CONCLUSIONS
The effects of Mach number and a screwthread form of distributed two-
dimensional surface roughness on boundary-layer transition were investi-
gated on hollow-cylinder models in free flight at Mach numbers between
2.8 and 7. The model surfaces were cold relative to stagnation temperatures
and the rate of boundary-layer cooling was a function of Mach number. The
observed effects were compared with results previously obtained on a slender
ogive-cylinder. The results of these tests are summarized in the following
conclusions:
i. Transition Reynolds number increased with increasing Mach number
for all magnitudes of roughness tested.
2. The minimum size of roughness which will influence transition
increases with increasing Mach number° The effect of a given roughness
size was found to depend strongly on the Mach number.

2O
3. For a given Machnumber, an optimum value of roughness heightwas found which gave a maximumlaminar run i0 to 15 percent greater thanwas obtained with very small roughness. This optimum roughness heightat the higher Machnumberswas 8 to i0 percent of the laminar boundary-layer thickness at transition°
AmesResearch CenterNational Aeronautics and SpaceAdministration
Moffett Field, Calif., Oct. 22, 1958
REFERENCES
l,
.
.
.
.
,
.
o
.
Lee, Roland E.: Measurements of Pressure Distribution and Boundary-
Layer Transition on a Hollow-Cylinder Model. NAVORD Rep. 2823,
April 28, 1953.
Czarnecki, K. R., and Sinclair, Archibald R.: Factors Affecting
Transition at Supersonic Speeds. NACA RML531!8a, 1953.
Gazley, Carl, Jr.: Boundary-Layer Stability and Transition in Subsonic
and Supersonic Flow. Jour. Aero. Sci., vol. 20, no. i, Jan. 1953,
pp. 19-28.
Laufer, John_ and Marte, Jack E.: Results and a Critical Discussion
of Transition-Reynolds-Number Measurements on Insulated Cones and
Flat Plates in Supersonic Wind Tunnels. CIT, JPL Rep. 20-96,
Nov. 30, 1955.
Korkegi, Robert H.: Transition Studies and Skin-Friction Measurements
on an Insulated Flat Plate at a Mach Number of 5.8. Jour. Aero.
Sci., vol. 23, no. 2, Feb. 1956, pp. 97-107.
Luther, Marvin: Fixing Boundary-Layer Transition on Supersonic-Wind-
Tunnel Models. CIT, JPL Progress Rep. 20-256, Aug. 12, 1955.
Van Driest, E. R., and Boison, J. Christopher: Experiments on
Boundary-Layer Transition at Supersonic Speeds. Jour. Aero. Sci.,
vol. 24, no. 12, Dec. 1957, PP. 885-899.
Jack, John R., Wisniewski, Richard J., and Diaconis, N. S.:
of Extreme Surface Cooling on Boundary-Layer Transition.
TN 4094, 1957.
Effects
NACA
Jedlicka, James R., Wilkins, Max E., and Seiff, Alvin: Experimental
Determination of Boundary-Layer Transition on a Body of Revolution
at M = 3.5. NACA TN 3342, 1954. (Supersedes NACA RMA53L18)

21
i0.
ii.
12.
13.
14.
15.
16.
17.
18.
19.
20.
Carros, Robert J. : Effect of Mach Number on Boundary Layer
Transition in the Presence of Pressure Rise and Surface Roughness
on an Ogive-Cylinder Body With Cold Wall Conditions. NACA
RM A56BIS, 1956.
Seiff, Alvin: A Free-Flight Wind Tunnel for Aerodynamic Testing
at Hypersonic Speeds. NACA Rep. 1222, 1955. (Supersedes NACA
A52_4)
Tolansky, Samuel: A Topographic Microscope. Scientific _unerican,
vol. 191, no. 2, Aug. 1954, pp. 54-59.
Schmalz, G.: Technische Oberflache_de, Julius Springer Verlag,
Berlin, 1936.
Van Driest, E. R.: Calculation of the Stability of the La:_inar
Boundary Layer in a Compressible Fluid on a Flat Plate _w_th Heat
Transfer. Jour. Aero. Sci., vol. 19, no. 12, Dec. 1952,
pp. 801-812, 828. (Also available as North American Aviation
Rep. AL-133%, Feb. 1952)
Lees, Lester, and Lin, Chia-Chiao: Investigation of the Stability
of the Laminar Boundary Layer in a Compressible Fluid. NACA
TN 1115, 1946.
Lees, Lester: The Stability of the Lan_nar Bou_zdary Layer in a
Compressible Fluid. NACA Rep. 876, 1947. (Supersedes NACA
TN 136o)
Dumn, D. W., and Lin, Chia-Chiao: On the Stability of the Laminar
Boundary Layer in a Compressible Fluid. Jour. Aero. Sci., vol. 22,
no. 7, July 1955, PP. 455-477.
Rossow, Vernon J.: Applicability of the Hypersonic Similarity
Rule to Pressure Distributions Which Include the Effects of
Rotation for Bodies of Revolution at Zero Angle of Attack.
NACA TN 2399, 1951.
Cohen, Clarence B., and Reshotko, Eli: Similar Solutions for the
Compressible L_minar Boundary Layer With Heat Transfer and
Pressure Gradient. NACA Rep. 1293, 1956. (Supersedes NACA
TH 3325)
Cohen, Clarence B., and Reshotko, Eli: The Compressibl_ Laminar
Boundary Layer With Heat Transfer and Arbitrary Pressure Gradient.
NACA Rep. 1294, 1956. (Supersedes NACA TN 3326, 1955)

22
21o Brinich, Paul Fo, and Sands, Norman: Effect of Bluntness onTransition for a Coneand a Hollow Cylinder at Mach3.1. NACATN 3979, 1957.
22. Bertram, Mitchel H.: Exploratory Investigation of Boundary-LayerTransition on a Hollow Cylinder at a MachNumberof 6.9. NACARepo 1313, 1957. (Supersedes NACATN 3546)
23. Potter, J. L.: NewExperimental Investigations of Friction Dragand Boundary Layer Transition on Bodies of Revolution at Super-sonic Speeds. NAVORDRep. 2371, April 1952.
24. Eward, J. C., Tucker, M., and Burgess, W. C., Jr.: StatisticalStudy of Transition-Point Fluctuations in Supersonic Flow.NACATN 3100, 1954.
25. Coles, Donald: Measurementsof Turbulent Friction on a SmoothFlatPlate in Supersonic Flow. Jour. Aero. Sci., vol. 21, no. 7,July 1954, pp. 433-448°
26° Brinich, Paul F.: Boundary-Layer Transition at Mach3o12 With andWithout Single RoughnessElements. NACATN 3267, 1954.
27. Brinich, Paul F.: A Study of Boundary-Layer Transition and SurfaceTemperature Distributions at Mach3.12. NACATN 3509, 1955.
28. Smith, A. M. 0., and Clutter, D. W.: The Smallest Height ofRoughnessCapable of Affecting Boundary-Layer Transition in Low-SpeedFlow. Douglas Aircraft Co. Rep. no. ES 26803, Aug. 31, 1957.
29° Krishnamurty, K.: Acoustic Radiation FromTwo-DimensionalRectangular Cutouts in Aerodynamic Surfaces. NACATN 3487, 1955.
30. Roshko, Anatol: SomeMeasurementsof Flow in a Rectangular Cutout.NACATN 3488, 1955.
31. Chapman,DeanR.: A Theoretical Analysis of Heat Transfer inRegions of Separated Flow. NACATN 3792, 1956.

I
0"_
-,- CH'_I -_ 0
23
.,-I

24
c_p
s
0r_ Lq.
ii
-_-f " I
Q_
c_ C_
(fJc
E
0
o,
c_rd _
o i
J_ r_o
_ °J-I

\\
29
o
_J
U]
o
4_
oo
@
-0
i1)
o
o3%b.O0
©
!
d

26
c.--
ur_
Lr_
_d
d
0
0
I|
0
o
c
c
B
o
E
°_
t-O
E
Eo_
"I0
°.
0Z
J
C7_
©
q-4
0
,-t.e4
°rl,-4
f_)!
0
!
(1)
.r4

27
(a) Shadow profile, IOOX.
(b) Wire shadow, IO00X.
Figure 4.- Photomicrographs of a typical screwthread; depth = 0.0003 inch;
pitch = 0.0015 inch.

28
E_ 4"
I
(a) Fine screwthread, 0.00008 inch deep; wire shadow; IOOOX.
(b) Coarse scre_thread, O.O021 inch deep; profile; IOOX.
)
(c) Beginning of screwthread; thread depth 0.0003 inch; wire shadow; 514X.
Figure 5.- Photomicrographs of screwthreads on test models.
2_
(O
0
0
O_7-0
(,.).I
Eo
LD
O0
0 0
oo oo I o0
0 0
o j0 "_
C_)
C3(D
0 _%
o
b.O
_ 5tO e-
l,.- o
q_::k
r_
_ 0
o "r _o s__ "10 m
0 _ _0 oCO m
q.-to
o.,-I
0 "_
I
,d
%
g0 1:0
H-_- paJnsoa_
o

3o
(a) 2/0 emery paper. Maximum scratch depth approximately 50 _in.;
wire shadow; IO00X.
(b) 4/0 emery paper. Maximum scratch depth approximately 8 bin.;wire shadow; IO00X.
(e) 4/0 emery paper. Interferogram; fringe spacing = I0 _in.; 200X.
Figure 7.- Photomicrographs of scratch-polished surfaces on 7075-T6
alluminum alloy.

31
(a) Forward face of the leading edge of a contoured-tube model at maximumthickness; thickness = 0.00045 inch; 20OX.
(b) Forward face of the leading edge of a contoured-tube model at minimumthickness; thickness = 0.0003 inch; 20OX.
(c) Outer cylindrical surface of a straight-tube model at the leading edge;2/0 finish; wire shadow; 514X.
Figure 8.- Photomicrographs of representative model leading edges.

32
qJ
C0 c _- o
._
a::2 ,.,_
_o oo-4- C _J
_o _ 0 qJ
-_ rr
c:: Q._ G;
•2._- -o. _..E_ .E-- E E_-_
_,'_o o,
_ . c
_o _ "-6_ 6 2 °
C C _ 4-
I III
I 'I I
I' i, !
I
I
/
/
//I/_
I
I
I
II
I/
//
"64.--
C "--
.2 55
E0 0
1-I--
iw
I
I
I
I
/
/
0t" I I
GOI"
a3
I_.
_o
tc_
c_J
o o,,,.."
I
3E
0,-t
©
q)
q-_ ,-tq)
O_
m 0
0 _
-_._4_ _3
©4j _
©
_4_
_-_
_ 4J0 m
m q)
0 _0
_o0
0
._'_c_
m %
0 CO
!
• 0Or', -0
%

33
'R:I" (M
:3 --
"13
-,0 0
E:3
E E:O
III
0 CO0 q
EL
8
qC'Mq
0
I
i |t
\
_Qed
t%l
0 _[ -'-),....2
(30
0I"
,-4
0
4-_r/l
0
ul
0
4._
,.Q.,-f
..p
%
m
I1)%
,---t
C.)
or-t4-_
%0
!
d
©
or-t
3#
2.6
H
2.2
1.8
plate1.4
1.0
.6
7.70 1.8
///3,12 " _V
I I I l I
x__
(a) Contoured tube.
M. T_,'T.
7.70 1.86.32
4.65
4.47 1.0 --
3.12
2.00
(b) Pencil model.
Figure ll.- Relative roughness of a given element on the contoured tube and
pencil model compared to its roughness on a flat plate.

3_
._1zL
00
_O
•., _
_ m
¢0
% 0
,-_ o3
hi?
tl _q_3
_ t
4-J ,-_
4_ _
0

36
.¢-tz#_
00c_
._
.elq-t
CI
o,,_
,-4
TI
o,_
©
4_
gt
o4-_
0c_
.r-t4_
o
i
d
.r--I

._1_L
00
2_
.rt
0J
5
%0
0
rl
°_
4._
(1)
04_
©0
Z"
i1)
4_
oo
!
.d,--t
(1)
.r-t
37

38

39
::L
C_
r_
0
fl
J_
_J_
r_
O
!

_-0
(13
I--
Ix
0
0
8@
@
4._
o
4.a.r--I1--t._
%-t-_
0
0.r"t
.r-t
4-_
,'--I
-0
!
,--I
I1)
r_

41
io B
io 7
5oJ
rr
Q)
E2
c
13
-6lO_
n-
5I
0
i
O
E30m
104
0
= ,
\\
\Minimum critical f
Reynolds number
( Ref. 14)
Roughest
model J
0 Beginning of Tronsition Region \
• End of Tronsition Region
/ ,I I
3 4 5 6 7
Boundory-loyer - edge Mech number, M e
Figure 14.- Movement of the transition regions on the test models with
variation of boundary-layer-edge Mach number.

42
20 x I0 e
16
E
12
o
o_ 8
4o
0
Symbol TW/T_
Open LO
Filled LB
/'/
/,IL
--4b--
J
(a) Contoured tube.
Symbol Nominalin
0 21 O0
[] 1450
0 cooI_ 5500 440a 250
0 200120
(u/u) x I°_n.
Unflogged 3.1 i 0.2
Flogged < 2.9
gE
g
OC
8
16 .-, IOs
12
8
(u/,,) =2.3
4
Symbol TW/T_
Open 1,0
Filled 1,8
X IO_n /
C •
Symbol Nominal Hin.
0 2000
[] 1500_7 lOOO
700
[h 500
0 400
A IOOO,sandblasted
Flogged - from ref. 9 ;
(u/v) . • 2 x IO_in.
Arrows indicate laminar flow at
limit of observation
(b) Pencil model; Carros (ref. lO).
gE
n_
8
8
16 ^ I0 _
12
oo
Symbol TW/T_
Open 1,0
Filled 1.8
Symbol Nominal H
A vin"
D 50o(3
_f _ o 3000 200
-6
(U/z/). x IO/in,Unflogged ?..8 L 0.3
Flagged 2.3
2 3 4 5 6 7 8
Mach number, Me
(c) Straight tube.
Figure 15.- Effect of Mach number variation on transition Reynolds number.

43
20 x I0 6
JQ
E
_2
8
o
0
Symbol
Open
Filled
(a) Contoured tube.
T_T.
1.0
1.8
Symbol Nominal Me0 7.0[] 5.0
3,7A 3.0
(°I,,L x '°Tin
Unflogged 3.1 i 0.2Flogged < 2_.9
16 x,u
E 12_
o
g.
g_ 4
gI.--
0
/._ Symbol
Open
Filled
(b) Pencil model.
T_T_I0
1.8
Symbol Nominal Me0 6.4[] 4.9
3.5
X interpolated
Ref, (u/u). x 10",Tin
Unflogged I0 2.3Flagged 9 2.0
Arrows indicate laminar flow at
limil of observation
16
E= 12_E
_ 8,
OC
.3 4
I.-
x IU
AA
Symbol TYf'T=
Open 1.0
Filled 1.8
00 800 1600 2400
Roughness height, H, M" in.
(c) Straight tube.
Symbol Nominal MeO 6.8[] 5.0
42A 3.1
I -e(u/v)" x °/in
Unflagged 2.8 A 0.3
Flogged 2.3
Figure 16.- Effect of roughness height variation on transition Reynoldsnumber.

_4
,¢
0
co
z = = = =
E _ : = = = =z .J
w
I_0 ,
I
t
=
II i_ 9
\\
\
\
\\
%
\
I
"Lid ' JequJnu sp[ou,_tl uou!suoJ.l
\\
\
_0
x
_o
cO
q-
O.
o
0
J0 v
o °• 0::
0
OOq
oJq
cd
O_
U
c_
CO
0
Y_0)
_dr_0
c_
-r-I
U]
o
"r-I
0
4-_
%4-_
rt--t0
0
4-_
%
I
°,-J
4_
0
x
O3 0
\\
e')Ch
,- "_ e4
E
o E _
° _
o _ _C .C ._
_ '10 0
0_ k-- _
0
EEc,- o
_ _ o§I I
m ('/3 O) 123
I I_ 0
<
rn
I
_gqlUNU
I
splou_e_
I00
uo!l!suo_i
x
u
8
<_
I
CO
_0
E
c
u0
_0
i
0
I
0
C
0
m
O_
00
oc_
0
¢0_9
©!
% •
,--4 4_!
o __ o
C)
(I) ©
_ 4 _©
o cd
_)
o
4_4_
o _o
0
4-_
I
%

46
Q
q
0
splou_e_
(;0
uo!l!suoJl
0
0c_J
0
0
0
0 _
E
0
0 "
00 n-
O
0co
0
I
o_a
-o
4-_
oo
%i1)
-0
%
m 4._m
oo4-_
o
%
%
o
0
4o ©
m %
.P ,--t
o
0
-o_3
0_%
!
&

47
:D
),(
o,I
OD t_
'_" c_ r,--It-
C
b_ _
_ _ d c_ d
(...)
\
I
CO
o c o_1 "- 0 o
o o o _1
U CC _ C ---0 C "-- '_
_ 0_ ,-r °o_
0
I, O_I
(._
oo
'10
"L"I
_.o0
ex
Eo
"0
c
o
J-_ ' Jaqtunu sPlOU,_aEI uo!$!suoJl
+)c_
cOq_o6
0
_ o0 4_
o
0
_ o
.0 4-_
C _ I1)
e- _-t
0
II)
"1° o
I -0
o %
_1 _ o
_ o3
°_-o o
_ °_
12) o,1%4-_
,r-t

48
Figure 21.- Periodic pressure wavelets due to acoustic radiation from
annular grooves cut in the outer surface of a short thin-walled
hollow cylinder in free flight at Mach number 1.23.

49
640
560
480
"-" 400
"r"
E_ 320O
e-
= 240::30nr"
160
80
C0
(uA,)®:s.I xIo_'i..
Region I- low RT
Critical for
minimum RT -._
//gion1,-/
// variotion_
/ of RT_
/Region m-
high R T
Critical for"r_
maximum R T "-
2 3 4 5 6 T 8
Boundary-layer-edge Mach number, Me
Figure 22.- Critical combinations of Mach number and roughness parameter
for transition Reynolds number maximums and minimums on the contoured
tube.
NASA- Langley Field, Va. A-!2 9


<
,.4 _ _ _ _. "
_. • _._,
m_N,._ r,.) M_ _ _ '._._
2 o o o_<
Z
z
o_
[2
._. =_
_1 0
,%,1,--
o _:_ -- ._ 0._
. . • _ --_._ _o _ _ :.__=_
• " " ¢_ io • • .
0 _ _ t_
_ %0
,-1 _ m._ d :_
0 0 o _2 0 __
0
• rn ' _ _o_°_ °
_ _'_ 0 w'_ _ _-* "_ _,_ _-_ " 0
<[
Z
E
8
g