Membership of the 117th Congress: A Profile
13
Membership of the 117 th Congress: A Profile Updated August 5, 2021 Congressional Research Service https://crsreports.congress.gov R46705
Transcript of Membership of the 117th Congress: A Profile

Membership of the 117th Congress: A Profile
Updated August 5, 2021
Congressional Research Service
https://crsreports.congress.gov
R46705
Congressional Research Service
SUMMARY
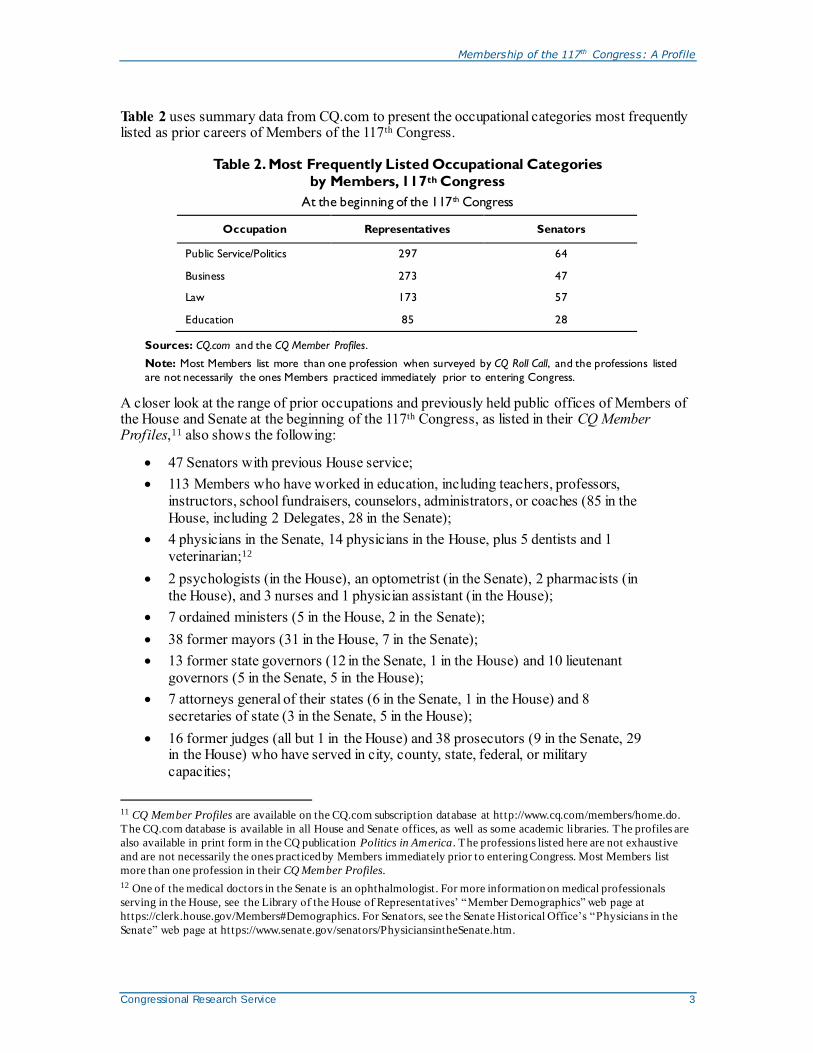
Membership of the 117th Congress: A Profile This report presents a profile of the membership of the 117th Congress (2021-2022) as of August
5, 2021, or at the beginning of the 117th Congress (January 3, 2021), where noted. Statistical information is included on selected characteristics of Members, including data on party affiliation, average age, occupation, education, length of congressional service, religious
affiliation, gender, ethnicity, foreign birth, and military service.
In the House of Representatives, there are 224 Democrats (including 4 Delegates), 214 Republicans (including 1 Delegate and the Resident Commissioner of Puerto Rico), and 3 vacant seats. The Senate has 50
Republicans, 48 Democrats, and 2 Independents, who both caucus with the Democrats. Additionally,
The average age of Members of the House at the beginning of the 117th Congress was 58.4 years; of Senators, 64.3 years.
The overwhelming majority, 96%, of Members of Congress have a college education.
The dominant professions of Members are public service/politics, business, and law.
Most Members identify as Christians, and the collective majority of these affiliate with a Protestant denomination. Roman Catholics account for the largest single religious denomination, and numerous other affiliations are represented, including Jewish, Mormon, Buddhist, Muslim, Hindu, Greek Orthodox,
Pentecostal Christian, Unitarian Universalist, and Adventist.
The average length of service for Representatives at the beginning of the 117th Congress was 8.9 years (4.5 House terms); for Senators, 11.0 years (1.8 Senate terms).
One hundred forty-seven women serve in the 117th Congress: 123 in the House, including 3 Delegates and the Resident Commissioner, and 24 in the Senate.
There are 57 African American Members of the House and 3 in the Senate. This House number includes two Delegates.
There are 54 Hispanic or Latino Members (a record number) serving: 47 in the House, including 2 Delegates and the Resident Commissioner, and 7 in the Senate.
There are 21 Members (16 Representatives, 3 Delegates, and 2 Senators) who are Asian Americans or Pacific Islander Americans.
A record five Native Americans (American Indians or Native Hawaiians) serve in the House.
The portions of this report covering political party affiliation, gender, ethnicity, and vacant seats may be updated as events
warrant. The remainder of the report will not be updated.
R46705
August 5, 2021
Jennifer E. Manning Senior Research Librarian

Membership of the 117th Congress: A Profile
Congressional Research Service
Contents
Overview and Total Members in History............................................................................. 1
Party Breakdown ............................................................................................................ 1
Age............................................................................................................................... 2
Occupations ................................................................................................................... 2
Education ...................................................................................................................... 5
Congressional Service...................................................................................................... 6
Religion......................................................................................................................... 6
Gender and Ethnicity ....................................................................................................... 7
Women Members ...................................................................................................... 7 African American Members ........................................................................................ 7 Hispanic/Latino American Members............................................................................. 8 Asian/Pacific Islander American Members .................................................................... 8 American Indian Members .......................................................................................... 9 Foreign Birth ............................................................................................................ 9 Military Service ........................................................................................................ 9
Tables
Table 1. Average Age of Members, 114th-117th Congresses .................................................... 2
Table 2. Most Frequently Listed Occupational Categories by Members, 117th Congress ............. 3
Table 3. Average Length of Service for Members of Congress, 113th-117th Congresses ............... 6
Contacts
Author Information ....................................................................................................... 10

Membership of the 117th Congress: A Profile
Congressional Research Service 1
Overview and Total Members in History Congress is composed of 541 individuals1 from the 50 states, the District of Columbia, Guam, the
U.S. Virgin Islands, American Samoa, the Northern Mariana Islands, and Puerto Rico. Since
1789, 12,419 individuals2 have served as either Representatives (11,105 individuals) or Senators
(1,994 individuals).3 Of these individuals, 680 have served in both chambers. An additional 178
individuals have served in the House in the roles of territorial Delegates or Resident Commissioners.4
The following is a profile of the 117th Congress (2021-2022).5
Party Breakdown In the 117th Congress, the current party alignments as of August 5, 2021,6 are as follows:
House of Representatives: 224 Democrats (including 4 Delegates), 214 Republicans (including 1 Delegate and the Resident Commissioner of Puerto
Rico), and 3 vacant seats.
Senate: 50 Republicans, 48 Democrats, and 2 Independents, who both caucus
with the Democrats.
1 This 541 number is the maximum number of individuals who may currently serve in the House and Senate and
assumes that no seat is temporarily vacant. As of August 5, 2021, there were three House vacancies. The 541 number
includes the 535 Members from the 50 states (100 Senators, 435 Representatives), 5 Members who are Delegates (fro m
the District of Columbia, Guam, American Samoa, the U.S. Virgin Islands, and the Northern Mariana Islands), and 1
Member who is Resident Commissioner from Puerto Rico. References in this report to “Representative(s)” include the
435 Members of the House from the 50 states and exclude the Members who are Delegates and the Resident
Commissioner. Percentages in this report assume a full Congress of 541 Members.
For more information on the status of the Delegates and Resident Commissioner, refer to CRS Report R40170,
Parliamentary Rights of the Delegates and Resident Commissioner from Puerto Rico , by Christopher M. Davis.
2 U.S. Congress, House, Office of the Historian, “Total Members of the House and State Representation,” at
http://history.house.gov/Institution/Total-Members/Total-Members/, updated January 21, 2021, and CRS calculations.
Information about all the Members who have served in Congress is available in the Biographical Directory of the United States Congress, a website maintained by the Clerk of the House and the Secretary of the Senate at
http://bioguide.congress.gov.
3 A cumulative, chronological list of all U.S. Senators is available on the Senate website at http://www.senate.gov/
artandhistory/history/common/briefing/senators_chronological.htm. Information about all House Members is available
on the House website at http://history.house.gov/Institution/Total-Members/Total-Members/.
4 The Resident Commissioner from Puerto Rico serves a four-year term, unlike other House members who serve two-
year terms. The Philippines was represented in the House by Resident Commissioners from 1907 until 1946, when it
became an independent nation. For more information, see CRS Report R40555, Delegates to the U.S. Congress:
History and Current Status, by Christopher M. Davis. 5 For background information on the previous Congress, refer to CRS Report R45583, Membership of the 116th
Congress: A Profile, by Jennifer E. Manning.
6 The 117th Congress began on January 3, 2021, with the following party alignments: House of Representatives: 226
Democrats (including 4 Delegates), 213 Republicans (including 1 Delegate and the Resident Commissioner of Puerto
Rico), and 2 vacant seats; Senate: 51 Republicans, 46 Democrats, 2 Independents, who both caucus with the
Democrats, and 1 vacant seat.

Membership of the 117th Congress: A Profile
Congressional Research Service 2
Age The average age at the beginning of the 117th Congress was 58.4 years for Representatives and 64.3 years for Senators.7
Table 1 shows the average ages at the beginning of the 117th and three previous Congresses.
Table 1. Average Age of Members, 114th-117th Congresses
Average (mean) age at the beginning of the Congress
Congress Representatives
Newly Elected
Representatives Senators
Newly Elected
Senators
117th
116th
115th
114th
58.4 years
57.6 years
57.8 years
57.0 years
50.6 years
47.9 years
50.8 years
52.3 years
64.3 years
62.9 years
61.8 years
61.0 years
56.1 years
58.1 years
54.8 years
50.7 years
Source: CRS calculations based on CQ, “117 th Congress: Birthdays,” https://plus.cq.com/members/factfile/
birthdays.
Notes: Representatives’ age data do not include the Delegates and the Resident Commissioner. Newly elected
Members’ data do not include those returning to the House or Senate for a second time.
The U.S. Constitution requires Representatives to be at least 25 years old when they take office.8 The youngest Representative in the 117th Congress, and the youngest House Member since 1965,9
is Madison Cawthorn (R-NC), born August 1, 1995, who was 25 at the beginning of the 117th Congress. The oldest Representative is Don Young (R-AK), born June 9, 1933, who was 87.
Senators must be at least 30 years old when they take office. The youngest Senator in the 117 th
Congress is Jon Ossoff (D-GA), born February 16, 1987, who was 33 at the beginning of the
Congress. The oldest Senator in the 117th Congress is Dianne Feinstein (D-CA), born June 22, 1933, who was 87.
Occupations According to data on occupations provided by CQ.com, in the 117th Congress, public
service/politics is the most commonly declared profession of Senators, followed by law, then
business; for Representatives, public service/politics is first, closely followed by business, then law.10
7 For more information about age distributions in the 117 th Congress, see Pew Research Center, “Boomers, Silents still
have most seats in Congress, though number of Millennials, Gen Xers is up slightly,” February 12, 2021, at
https://www.pewresearch.org/fact-tank/2021/02/12/boomers-silents-still-have-most-seats-in-congress-though-number-
of-millennials-gen-xers-is-up-slightly/.
8 Article I, Section 2, clause 2, of the U.S. Constitution. 9 Rep. Jed Johnson Jr. (D-OK) was sworn into the 89 th Congress (1965-66) seven days after he turned 25.
10 These data do not include the Delegates and Resident Commissioner.
For more summary information on the occupational backgrounds of Members of Congress, 1953-present, see the “Prior
Occupations” tables in Chapter 1, “Demographics of members of Congress” in Vital Statistics on Congress at
https://www.brookings.edu/multi-chapter-report/vital-statistics-on-congress/, a joint project of the American Enterprise
Institute and Brookings Institution.
Please note that the data in these third-party resources are unlikely to be updated after publication.
Membership of the 117th Congress: A Profile
Congressional Research Service 3
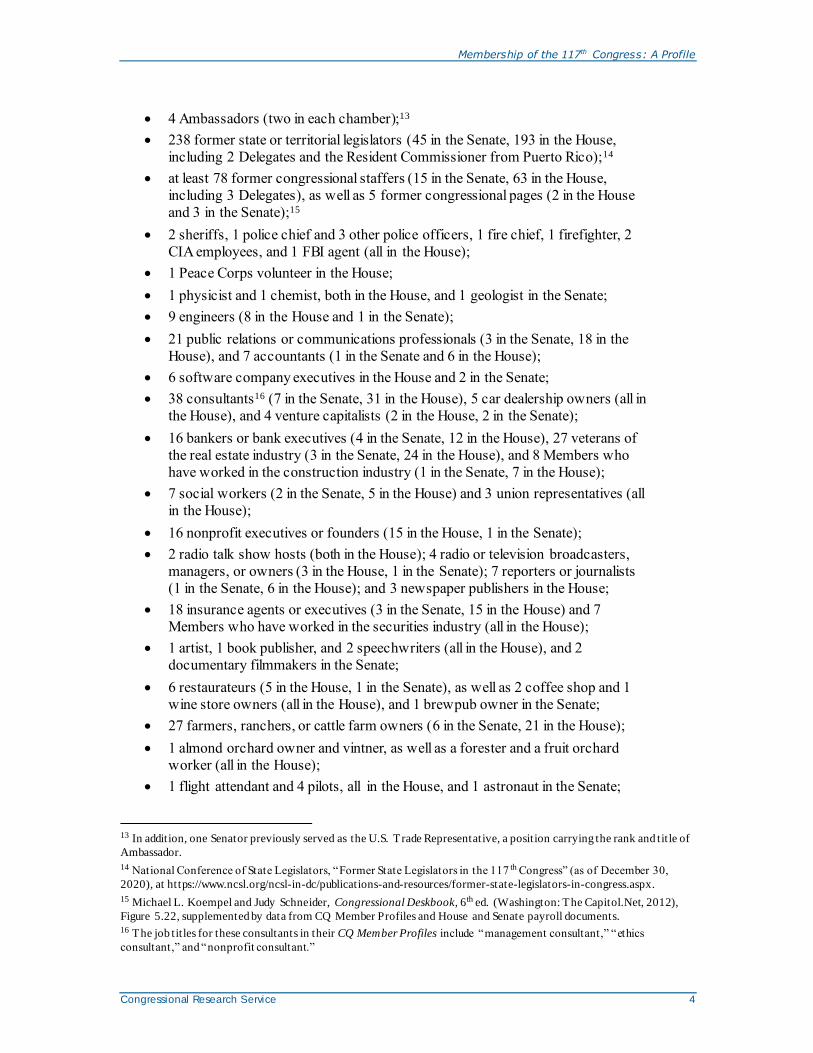
Table 2 uses summary data from CQ.com to present the occupational categories most frequently listed as prior careers of Members of the 117th Congress.
Table 2. Most Frequently Listed Occupational Categories by Members, 117th Congress
At the beginning of the 117th Congress
Occupation Representatives Senators
Public Service/Politics 297 64
Business 273 47
Law 173 57
Education 85 28
Sources: CQ.com and the CQ Member Profiles.
Note: Most Members list more than one profession when surveyed by CQ Roll Call, and the professions listed
are not necessarily the ones Members practiced immediately prior to entering Congress.
A closer look at the range of prior occupations and previously held public offices of Members of the House and Senate at the beginning of the 117th Congress, as listed in their CQ Member Profiles,11 also shows the following:
47 Senators with previous House service;
113 Members who have worked in education, including teachers, professors,
instructors, school fundraisers, counselors, administrators, or coaches (85 in the
House, including 2 Delegates, 28 in the Senate);
4 physicians in the Senate, 14 physicians in the House, plus 5 dentists and 1
veterinarian;12
2 psychologists (in the House), an optometrist (in the Senate), 2 pharmacists (in
the House), and 3 nurses and 1 physician assistant (in the House);
7 ordained ministers (5 in the House, 2 in the Senate);
38 former mayors (31 in the House, 7 in the Senate);
13 former state governors (12 in the Senate, 1 in the House) and 10 lieutenant
governors (5 in the Senate, 5 in the House);
7 attorneys general of their states (6 in the Senate, 1 in the House) and 8
secretaries of state (3 in the Senate, 5 in the House);
16 former judges (all but 1 in the House) and 38 prosecutors (9 in the Senate, 29 in the House) who have served in city, county, state, federal, or military
capacities;
11 CQ Member Profiles are available on the CQ.com subscription database at http://www.cq.com/members/home.do.
The CQ.com database is available in all House and Senate offices, as well as some academic libraries. The profiles are
also available in print form in the CQ publication Politics in America. The professions listed here are not exhaustive
and are not necessarily the ones practiced by Members immediately prior to entering Congress. Most Members list
more than one profession in their CQ Member Profiles.
12 One of the medical doctors in the Senate is an ophthalmologist. For more information on medical professionals
serving in the House, see the Library of the House of Representatives’ “Member Demographics” web page at
https://clerk.house.gov/Members#Demographics. For Senators, see the Senate Historical Office’s “Physicians in the
Senate” web page at https://www.senate.gov/senators/PhysiciansintheSenate.htm.
Membership of the 117th Congress: A Profile
Congressional Research Service 4
4 Ambassadors (two in each chamber);13
238 former state or territorial legislators (45 in the Senate, 193 in the House,
including 2 Delegates and the Resident Commissioner from Puerto Rico);14
at least 78 former congressional staffers (15 in the Senate, 63 in the House,
including 3 Delegates), as well as 5 former congressional pages (2 in the House
and 3 in the Senate);15
2 sheriffs, 1 police chief and 3 other police officers, 1 fire chief, 1 firefighter, 2
CIA employees, and 1 FBI agent (all in the House);
1 Peace Corps volunteer in the House;
1 physicist and 1 chemist, both in the House, and 1 geologist in the Senate;
9 engineers (8 in the House and 1 in the Senate);
21 public relations or communications professionals (3 in the Senate, 18 in the
House), and 7 accountants (1 in the Senate and 6 in the House);
6 software company executives in the House and 2 in the Senate;
38 consultants16 (7 in the Senate, 31 in the House), 5 car dealership owners (all in
the House), and 4 venture capitalists (2 in the House, 2 in the Senate);
16 bankers or bank executives (4 in the Senate, 12 in the House), 27 veterans of
the real estate industry (3 in the Senate, 24 in the House), and 8 Members who
have worked in the construction industry (1 in the Senate, 7 in the House);
7 social workers (2 in the Senate, 5 in the House) and 3 union representatives (all
in the House);
16 nonprofit executives or founders (15 in the House, 1 in the Senate);
2 radio talk show hosts (both in the House); 4 radio or television broadcasters,
managers, or owners (3 in the House, 1 in the Senate); 7 reporters or journalists
(1 in the Senate, 6 in the House); and 3 newspaper publishers in the House;
18 insurance agents or executives (3 in the Senate, 15 in the House) and 7
Members who have worked in the securities industry (all in the House);
1 artist, 1 book publisher, and 2 speechwriters (all in the House), and 2
documentary filmmakers in the Senate;
6 restaurateurs (5 in the House, 1 in the Senate), as well as 2 coffee shop and 1
wine store owners (all in the House), and 1 brewpub owner in the Senate;
27 farmers, ranchers, or cattle farm owners (6 in the Senate, 21 in the House);
1 almond orchard owner and vintner, as well as a forester and a fruit orchard
worker (all in the House);
1 flight attendant and 4 pilots, all in the House, and 1 astronaut in the Senate;
13 In addition, one Senator previously served as the U.S. Trade Representative, a position carrying the rank and tit le of
Ambassador.
14 National Conference of State Legislators, “Former State Legislators in the 117 th Congress” (as of December 30,
2020), at https://www.ncsl.org/ncsl-in-dc/publications-and-resources/former-state-legislators-in-congress.aspx.
15 Michael L. Koempel and Judy Schneider, Congressional Deskbook, 6th ed. (Washington: The Capitol.Net, 2012),
Figure 5.22, supplemented by data from CQ Member Profiles and House and Senate payroll documents. 16 The job tit les for these consultants in their CQ Member Profiles include “management consultant,” “ethics
consultant,” and “nonprofit consultant.”

Membership of the 117th Congress: A Profile
Congressional Research Service 5
3 professional football players, 1 hockey player, 1 baseball player, and 1 mixed
martial arts fighter (all in the House); and
7 current members of the military reserves (6 in the House, 1 in the Senate) and 7
current members of the National Guard (all in the House).
Other occupations listed in the CQ Member Profiles include emergency dispatcher, letter carrier,
animal nutrition specialist, waiter, electrician, rodeo announcer, carpenter, video game developer, computer systems analyst, software engineer, R&D lab executive, and explosives expert.
Education As has been true in recent Congresses, the vast majority of Members (93.8% of House Members
and 100% of Senators) at the beginning of the 117th Congress have earned at least a bachelor’s
degree. Sixty-seven percent of House Members and 76% of Senators hold educational degrees
beyond a bachelor’s.17 The CQ Member Profiles at the beginning of the 117th Congress indicate the following:
22 Members of the House have no educational degree beyond a high school
diploma or GED;
5 Members of the House have associate’s degrees as their highest degrees;
108 Members of the House and 18 Senators earned a master’s degree as their
highest attained degrees;
144 Members of the House (32.7% of the House) and 50 Senators (50% of the
Senate) hold law degrees;
22 Representatives and 4 Senators have doctoral (Ph.D., D.Phil., Ed.D., or
D. Min) degrees;18 and
20 Members of the House and 5 Senators have medical degrees.19
By comparison, 35 years ago in the 100th Congress (1987-1988), 85.5% of House Members and
89% of Senators held bachelor’s degrees. Forty-five years ago, in the 95th Congress (1977-1978),
82.7% of House Members and 87% of Senators held bachelor’s degrees. Sixty years ago, in the
87th Congress (1961-1962), 76% of House Members and 76% of Senators held bachelor’s degrees.20
Three Representatives and one Senator are graduates of the U.S. Military Academy, five Representatives and one Senator graduated from the U.S. Naval Academy, one Representative
graduated from the U.S. Air Force Academy, and one Senator graduated from the U.S. Merchant
Marine Academy. Five Representatives and one Senator were Rhodes Scholars, two
Representatives were Fulbright Scholars, two Representatives were Marshall Scholars, and two Representatives and one Senator were Truman Scholars.21
17 CQ, “117th Congress: Education,” at https://plus.cq.com/members/factfile/education.
18 An additional House Member with a doctoral degree was sworn in in April 2021. 19 Four Senators and 14 Representatives have M.D. degrees, 1 Senator has an O.D. (doctor of optometry) degree, 5
Representatives have D.D.S. (doctor of dental surgery) degrees, and 1 Representative has a D.V.M. (doctor of
veterinary medicine) degree.
20 CRS Report R42365, Representatives and Senators: Trends in Member Characteristics Since 1945 , coordinated by
R. Eric Petersen. 21 Rhodes and Marshall scholarships fund study at British universities; Fulbright scholarships fund international
exchange programs; Truman scholarships fund graduate study toward public service.

Membership of the 117th Congress: A Profile
Congressional Research Service 6
Congressional Service The average length of service for Representatives at the beginning of the 117th Congress was 8.9 years (4.5 House terms); for Senators, 11.0 years (1.8 Senate terms).
Table 3. Average Length of Service for Members of Congress, 113th-117th Congresses
Average (mean) at the beginning of the Congress, in years and numbers of terms
Congress Representatives Senators
117th 8.9 years (4.5 terms) 11.0 years (1.8 terms)
116th 8.6 years (4.3 terms) 10.1 years (1.7 terms)
115th 9.4 years (4.6 terms) 10.1 years (1.7 terms)
114th 8.8 years (4.4 terms) 9.7 years (1.6 terms)
113th 9.1 years (4.6 terms) 10.2 years (1.7 terms)
Source: CRS Report R41545, Congressional Careers: Service Tenure and Patterns of Member Service, 1789-2021, by
Sarah J. Eckman and Amber Hope Wilhelm.
Notes: Representatives are elected for two-year terms. Senators are elected for six-year terms. Note that 47
Senators in the 117th Congress have previously served in the House. Their House service is not included in this
average, nor is the House service of Senators included in previous Congresses.
At the beginning of the 117th Congress, 57 of the House Members (12.9% of the total House
membership) had first been elected to the House in November 2020, and 9 of the Senators (9% of
the total Senate membership) had first been elected to the Senate in November 2020.22 At the beginning of the 116th Congress, 20.4% of the House and 9% of the Senate were newly elected “freshmen.”
At the beginning of the 117th Congress, 131 House Members (29.7% of House Members) had no more than two years of House experience, and 18 Senators (18% of Senators) had no more than two years of Senate experience.
For more historical information on the tenure of Members of Congress, see CRS Report R41545, Congressional Careers: Service Tenure and Patterns of Member Service, 1789-2021, by Sarah J. Eckman and Amber Hope Wilhelm.
Religion Ninety-seven percent of the Members of the 117th Congress report an affiliation with a specific religion.23
Statistics gathered by the Pew Research Center on Religion and Public Life, which studies the
religious affiliation of Representatives and Senators, and CQ at the beginning of the 117th Congress showed the following:
55.4% of Members (236 in the House, 58 in the Senate) are Protestant, with
Baptist as the most represented denomination, followed by Methodist;
22 In addition, one Senator was appointed to and sworn into the Senate in January 2021, after the 117 th Congress began. 23 Nineteen Members of the 117 th Congress do not specify a religious affiliation, or report themselves as unaffiliated.
Pew Research Center on Religion and Public Life Project, “Faith on the Hill: The Religious Composition of the 117 th
Congress,” January 4, 2021, at https://www.pewforum.org/2021/01/04/faith-on-the-hill-2021/.

Membership of the 117th Congress: A Profile
Congressional Research Service 7
29.8% of Members (134 in the House, 24 in the Senate) are Catholic;
6.3% of Members (25 in the House, 9 in the Senate) are Jewish;
1.7% of Members (6 in the House, 3 in the Senate) are Mormon (Church of Jesus
Christ of Latter-day Saints);
2 Members (1 in the House, 1 in the Senate) are Buddhist, 3 Representatives are
Muslim, and 2 Representatives are Hindu; and
other religious affiliations represented include Greek Orthodox, Pentecostal
Christian, Unitarian Universalist, and Adventist.24
Gender and Ethnicity
Women Members
One hundred forty-seven women Members (27.2% of the total membership) serve in the 117th
Congress, 16 more than at the beginning of the 116th Congress.25 One hundred twenty-three
women, including 3 Delegates as well as the Resident Commissioner, serve in the House and 24
in the Senate. Of the 123 women in the House, 90 are Democrats, including 2 of the Delegates,
and 33 are Republicans, including 1 Delegate as well as the Resident Commissioner. Of the 24 women in the Senate, 16 are Democrats and 8 are Republicans.26
By comparison, approximately 35 years ago in the 100th Congress (1987-1988), 24 women served
in the House, and 2 in the Senate. Approximately 45 years ago, in the 95th Congress (1977-1978), there were 18 women in the House, and 3 in the Senate.
African American Members
There are a record 60 African American Members (11.1% of the total membership) in the 117th
Congress, 3 more than at the beginning of the 116th Congress.27 Fifty-seven serve in the House,
including two Delegates, and three serve in the Senate. This number includes two Representatives
who are of African American and Asian ancestry, and two Representatives who are of African
American and Hispanic ancestry. In this report, each of these three Members is counted as
24 Detailed religious affiliation information for Members of the 117 th Congress, and comparisons to the U.S. general
population, are available at https://www.pewforum.org/2021/01/04/faith-on-the-hill-2021/. 25 The 117th Congress began with 148 women Members; one woman House Member was sworn in in February 2021,
one woman Senator resigned in January 2021 to become Vice President, and another woman Senator’s temporary term
ended in January 2021. In March 2021, two women House Members resigned to join the President’s Cabinet, and an
additional woman House Member was sworn in in April 2021, followed by another in June 2021.
26 For more information, see CRS Report RL30261, Women in Congress, 1917-2020: Service Dates and Committee
Assignments by Member, and Lists by State and Congress, by Jennifer E. Manning and Ida A. Brudnick; and the Office
of the House Historian’s Women in Congress website at http://history.house.gov/Exhibition-and-Publications/WIC/
Women-in-Congress/. 27 The 117th Congress began with 62 African American Members. In January 2021, after the 117 th Congress began, one
African American House Member resigned to become Senior Advisor and Director of Public Engagement in the Biden
Administration, one Senator resigned to become Vice President of the United States, and another Senator was sworn in.
in March 2021, one African American House Member resigned to become Secretary of Housing and Urban
Development. One African American House Member died in April 2021, and another was sworn in in May 2021.
For more information, see the Office of the House Historian’s Black Americans in Congress website at
https://history.house.gov/baic/.

Membership of the 117th Congress: A Profile
Congressional Research Service 8
belonging to two ethnic groups. Fifty-five of the African American House Members, including
two Delegates, are Democrats, and two are Republicans. Two of the Senators are Democrats and
one is Republican. Twenty-six African American women, including two Delegates, serve in Congress, all in the House.28
By comparison, approximately 35 years ago in the 99th Congress (1985-1986), 21 African
American Members served in the House, and none in the Senate. Sixty years ago, in the 87 th
Congress (1961-1962), there were 4 African American Members of Congress, all serving in the House.
Hispanic/Latino American Members
There are 54 Hispanic or Latino Members in the 117th Congress, 10.0% of the total membership and a record number.29 Forty-seven serve in the House, including two Delegates and the Resident
Commissioner, and 7 in the Senate. These numbers include two House Members who are also of
Asian descent, and two House Members also of African ancestry; these Members are counted in
both ethnic categories in this report. Of the Members of the House, 34 are Democrats (including 2
Delegates) and 13 are Republicans (including the Resident Commissioner). Fourteen are women, including the Resident Commissioner. Of the seven Hispanic Senators (three Republicans, four
Democrats), one is a woman. By comparison, approximately 35 years ago in the 99th Congress
(1985-1986), 14 Hispanic or Latino Members served in Congress. All 14 were male Members of the House.
Asian/Pacific Islander American Members
Twenty-one Members of the 117th Congress (3.9% of the total membership) are of Asian, South
Asian, or Pacific Islander ancestry.30 Nineteen of them (16 Democrats, 3 Republicans) serve in the House, and 2 (both Democrats) serve in the Senate. These numbers include two House
Members who are also of African American ancestry, two House Members also of Hispanic
ancestry, and one Member who is also Native Hawaiian (Native American); these Members are
counted in both ethnic categories in this report. Of those serving in the House, three are
Delegates. Eleven of the Asian, Pacific Islander, or South Asian American Members are female: nine in the House, and two in the Senate. By comparison, approximately 35 years ago in the 99th
Congress (1985-1986), there were five Asian/Pacific Islander Americans in the House, and two in the Senate.
28 For more information, see CRS Report RL30378, African American Members of the U.S. Congress: 1870-2020, by
Ida A. Brudnick and Jennifer E. Manning, and the Office of the House Historian’s Black Americans in Congress
website at https://history.house.gov/baic/. Due to differences in data collection or characterization, demographic data in
other studies on Members of Congress may differ from those presented in this report.
29 This number includes four House Members and one Senator who are of Portuguese ancestry and belong, or have
belonged, to the Congressional Hispanic Caucus or the Congressional Hispanic Conference. For more information, see
the Office of the House Historian’s Hispanic Americans in Congress website at http://history.house.gov/Exhibitions-and-Publications/HAIC/Hispanic-Americans-in-Congress/. Due to differences in data collection or characterization,
demographic data in other studies on Members of Congress may differ from those presented in this report.
30 The 117th Congress began with a record 22 Asian/Pacific Islander American Members; one Senator resigned in
January 2021 to become Vice President of the United States.
For more information, see the Office of the House Historian’s Asian and Pacific Islander Americans in Congress
website at http://history.house.gov/apa/. Due to differences in data collection or characterization, demographic data in
other studies on Members of Congress may differ from those presented in this report.

Membership of the 117th Congress: A Profile
Congressional Research Service 9
American Indian Members
There are five American Indian (Native American) or Native Hawaiian Members of the 117th Congress: three Republicans and two Democrats, all in the House.31 This is .9% of the total congressional membership, and a record number.
Foreign Birth
Twenty-eight Representatives and five Senators (6.1% of the 117th Congress) were born outside
the United States. Their places of birth include Canada, Cuba, Germany, Guatemala, Japan, Peru,
and India. Some of these Members were born to American citizens working or serving abroad.32
The U.S. Constitution requires that Representatives be citizens for seven years and Senators be citizens for nine years before they take office.33
Military Service
At the beginning of the 117th Congress, there were 91 individuals (16.8% of the total
membership) who had served or were serving in the military, 5 fewer than at the beginning of the
116th Congress (96 Members). According to lists compiled by CQ, the House as of January 2021
had 75 veterans (including 4 female Members, as well as 1 Delegate); the Senate had 16 veterans,
including 2 women.34 These Members’ service included tours of duty in the Vietnam War and the Persian Gulf War, and combat or peacekeeping missions in Afghanistan, Iraq, and Kosovo. Six
House Members and one Senator are still serving in the reserves, and seven House Members are still serving in the National Guard. Two of the six female veterans are combat veterans.
The number of veterans in the 117th Congress reflects the trend of steady decline in recent
decades in the number of Members who have served in the military. For example, 64% of the
Members of the 97th Congress (1981-1982) were veterans, and in the 92nd Congress (1971-1972),
73% of the Members were veterans. According to the Military Times, the 117th Congress veterans numbers are at the “lowest since the start of World War II.”35
31 The 117th Congress began with six Native American or Native Hawaiian Members. One Native American House
Member resigned in March 2021 to become Secretary of the Interior. One Native Hawaiian Member is also of Asian
ancestry and is counted in both ethnic categories in this report.
This number includes only Members who are enrolled members of federally recognized tribes. For more information,
see CRS congressional distribution memorandum, Members of Congress of American Indian Descent, by Jennifer
Manning, available to congressional offices upon request.
32 For more information, see Pew Research Center, “Immigrants and Children of Immigrants make up at least 14% of
the 117th Congress,” February 12, 2021, at https://www.pewresearch.org/fact-tank/2021/02/12/immigrants-and-
children-of-immigrants-make-up-at-least-14-of-the-117th-congress/; Office of the Senate Historian’s Senators Born
Outside the United States list at https://www.senate.gov/senators/Foreign_born.htm; and the Library of the House of
Representatives’ Foreign Born list at https://clerk.house.gov/documents/Foreign_Born.pdf. 33 Article I, Section 2, clause 2, and Article I, Section 3, clause 3 of the U.S. Constitution.
34 CQ, “117th Congress: House Military Veterans,” at https://plus.cq.com/members/factfile/house-veterans; and “117th
Congress: Senate Military Veterans,” at https://plus.cq.com/members/factfile/senate-veterans. Both lists are frequently
updated to reflect changes since the 117 th Congress convened. 35 For more information and a list of current veteran Members, see the Military Times, “Veterans in the 117th Congress,
by the numbers,” December 28, 2020, at https://www.militarytimes.com/news/pentagon-congress/2020/12/28/veterans-
in-the-117th-congress-by-the-numbers.
Membership of the 117th Congress: A Profile
Congressional Research Service R46705 · VERSION 9 · UPDATED 10
For summary information on the demographics of Members in selected past Congresses,
including age trends, occupational backgrounds, military veteran status, and educational
attainment, see CRS Report R42365, Representatives and Senators: Trends in Member Characteristics Since 1945, coordinated by R. Eric Petersen.36
Author Information
Jennifer E. Manning Senior Research Librarian
Disclaimer
This document was prepared by the Congressional Research Service (CRS). CRS serves as nonpartisan shared staff to congressional committees and Members of Congress. It operates solely at the behest of and under the direction of Congress. Information in a CRS Report should not be relied upon for purposes other
than public understanding of information that has been provided by CRS to Members of Congress in connection with CRS’s institutional role. CRS Reports, as a work of the United States Government, are not subject to copyright protection in the United States. Any CRS Report may be reproduced and distributed in
its entirety without permission from CRS. However, as a CRS Report may include copyrighted images or material from a third party, you may need to obtain the permission of the copyright holder if you wish to
copy or otherwise use copyrighted material.
36 Because of differences in data sources used, some demographic information may differ between CRS Report
R42365, Representatives and Senators: Trends in Member Characteristics Since 1945 , coordinated by R. Eric Petersen,
this report, and other demographic studies of Congress.
In addition to the CQ Member Profiles, other sources of demographic information for the 117th Congress include Vital
Statistics on Congress at https://www.brookings.edu/multi-chapter-report/vital-statistics-on-congress/, a joint project of
the American Enterprise Institute and the Brookings Institution; and the Library of the House of Representatives’
“Member Demographics” web page at https://clerk.house.gov/Members#Demographics, which features lists of House
Members such as “117 th Congress—Lawyers” and “117 th Congress—Former Mayors.” The Secretary of the Senate also
maintains a collection of lists about Senators at https://www.senate.gov/reference/Senators.htm.
For summary information, see Pew Research Center Fact Tank’s “Racial, ethnic diversity increases yet again with the
117th Congress,” at https://www.pewresearch.org/fact-tank/2021/01/28/racial-ethnic-diversity-increases-yet-again-with-
the-117th-congress/.