Mega-Trends Influencing the Future of Auto Insurance National Auto Insurance ExecuSummit Uncasville,...
57
Mega-Trends Influencing the Future of Auto Insurance National Auto Insurance ExecuSummit Uncasville, CT October 19, 2010 Steven N. Weisbart, Ph.D., CLU, Senior Vice President & Chief Economist Insurance Information Institute 110 William Street New York, NY 10038
-
Upload
deanna-starlin -
Category
Documents
-
view
217 -
download
1
Transcript of Mega-Trends Influencing the Future of Auto Insurance National Auto Insurance ExecuSummit Uncasville,...

Mega-Trends Influencing the Future of Auto
InsuranceNational Auto Insurance ExecuSummit
Uncasville, CTOctober 19, 2010
Steven N. Weisbart, Ph.D., CLU, Senior Vice President & Chief EconomistInsurance Information Institute 110 William Street New York, NY 10038Office: 212.346.5540 Cell: (917) 494-5945 [email protected] www.iii.org

2
Competition in the Auto Insurance Market

3
In Many States, the PP Auto Marketin 2009 was Highly Competitive
5
0
3
8
1110
7
4
2
0
2
4
6
8
10
12
under 700 700-799 800-899 900-999 1000-1099
1100-1199
1200-1299
1300-1399
1400 andover
*Herfindahl-Hirschman Index, a standard measure of market concentrationSources: Insurance Information Institute research from SNL Financial.
Number of States with HHI* in Indicated Range
An HHI Under 1000 is Generally Considered a Highly Competitive Market; HHIs Between 1000 and 1800 Indicate a Moderately Competitive Market;
Over 1800 Suggests a Concentrated Market
HHI Range
Highly Competitive Moderately Competitive

What HHIs of 775 and 1200 Look Like
Sources: SNL Financial; Insurance Information Institute
In the Highly Competitive Market, The Top 10 Carriers Have 77.8% Market Share; In the Moderately Competitive Market, the Top 10 Have 97.8%
The bar segments show the market share of the top 10 insurers in the state’s market plus(far right, light gray) the combined share of rest of the companies in that state’s market

5
PP Auto Competitive Environment Varies by State and Region*
1490
.614
28.9
1176
.511
63.7
1139
.611
23.2
1121
.111
11.9
1059
.410
03.1
983.
196
0.2
1265
.512
52.0
1184
.710
01.4
944.
2
1285
.789
9.3
731.
871
6.2
689.
464
5.7
1628
.1
1254
.7
600
800
1000
1200
1400
1600
1800
LA WV SC AL
MS TN KY FL AR
VA
GA
NC DE
MD NY
PA NJ
MA RI
NH CT
VT
ME
AK HI
*Data for 2009
Sources: SNL Financial; Insurance Information Institute.
Southeast Mid-Atlantic New EnglandHHI
6
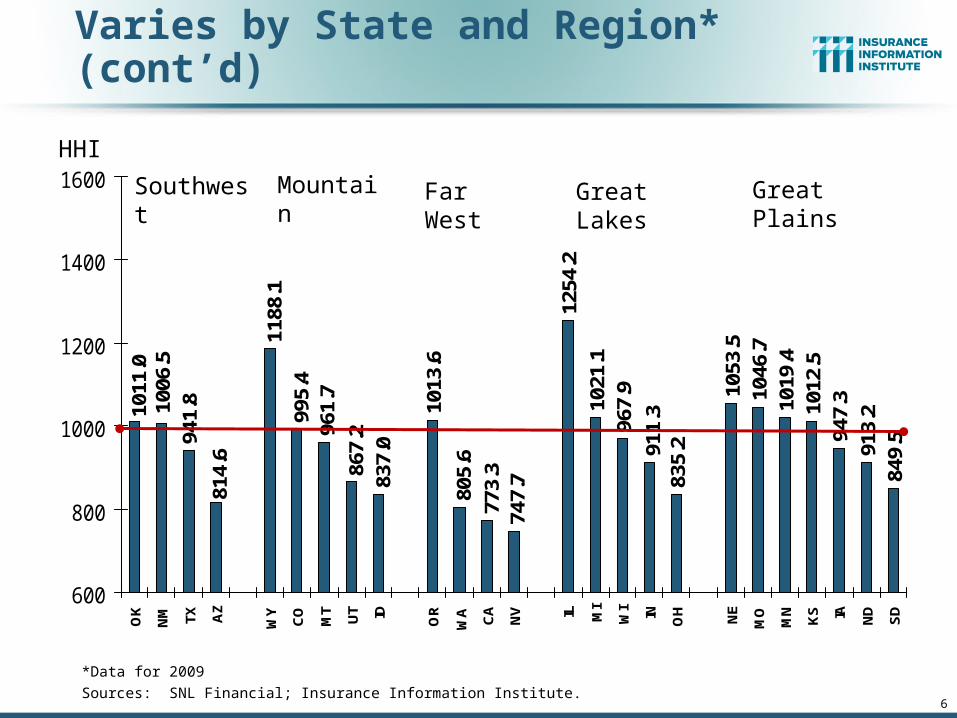
PP Auto Competitive EnvironmentVaries by State and Region* (cont’d)
1013
.6
1254
.2
1012
.594
7.3
913.
284
9.5
747.
777
3.3
805.
6 911.
383
5.2
1019
.4
967.
9 1046
.710
53.5
1021
.1
995.
4
837.
086
7.296
1.7
1188
.1
1006
.594
1.8
814.
6
1011
.0
600
800
1000
1200
1400
1600
OK
NM TX AZ
WY
CO
MT
UT ID OR
WA CA
NV IL MI
WI IN O
H NE
MO
MN
KS IA ND
SD
*Data for 2009
Sources: SNL Financial; Insurance Information Institute.
Southwest Mountain Far West Great PlainsGreat Lakes
HHI

7
Profitabilityin the Auto Insurance Market

8
Auto Insurance Return on Net Worth, 2008, Varies by Line, State and Region
9.7%
-0.7
%
7.4% 8.0%
7.9%
2.1%
5.5% 6.
3%
4.7%
3.4%
5.5%
2.1%
6.3%
4.7%
4.4%
1.5%
0.0%
13.1
%
12.2
%
12.3
%
6.5%
8.9%
7.8% 9.
5%
20.1
%
3.9%
7.5%
9.8%
5.8%
1.4%
8.0%
6.9%
6.9% 8.
5%
5.3%
8.5%
13.2
%
9.7%
7.2%
4.6%
12.2
%
12.5
%
16.3
%
15.2
%
14.0
%
12.9
%
22.1
%
20.1
%
13.0
%
13.8
%
-6%
-3%
0%
3%
6%
9%
12%
15%
18%
21%
24%
AL AR SC MS VA LA WV TN NC KY GA FL PA MD NY DE NJ ME NH VT MA RI CT AK HI
PP Auto Total Commercial Auto Total
Sources: NAIC Report on Profitability by Line by State in 2008, pp. 103-104, 109-110; Insurance Information Institute.
Southeast Mid-Atlantic New England

9
Auto Insurance Return on Net Worth, 2008, Varies by Line, State and Region
8.6%
7.9%
0.8% 1.2%
3.7%
9.5% 10
.1%
5.0%
5.1%
12.8
% 15.9
%
13.2
%
2.9%
8.0%
15.6
%
9.8%
-8.9
%
15.4
%
12.1
%
7.0% 7.
9% 9.7% 11
.2%
6.8% 8.
3%
1.8%
4.8%
13.9
%
3.6%
7.0%7.6%
2.8%
5.9%
3.9%
2.4%
5.2%
9.9%
5.1%
9.3%
3.1%4.
6%8.
0%
12.2
%
9.1%
0.9%
-4.1
%
10.8
%
6.7%
-12%
-9%
-6%
-3%
0%
3%
6%
9%
12%
15%
18%
21%
NM AZ TX OK ID CO WY UT MT CA OR WA NV OH WI IN IL MI SD ND IA MN KS NE MO
PP Auto Total Commercial Auto Total
Sources: NAIC Report on Profitability by Line by State in 2008, pp. 103-104, 109-110; Insurance Information Institute.
Southwest Mountain Far West Great PlainsGreat Lakes

10
Premium Growth Trendsin Auto Insurance
They’re Not In SyncWith the Economy

11
Monthly Change* in Auto Insurance Prices, 2005-2010
(Percent Changefrom same month,prior year)
* Percentage change from same month in prior year, seasonally adjusted.Sources: US Bureau of Labor Statistics; Insurance Information Institute
3.4%
3.3%
3.0%
2.9%
2.4%
2.2%
2.0%
1.9%
1.3%
0.6% 0.
9%0.
5%0.
2% 0.4%
0.4% 0.5%
0.3%
0.2%
0.2%
1.0%
1.6%
1.1%
0.8%
0.7% 0.8%
0.6%
0.4%
-0.2
%0.
3% 0.6%
0.6%
0.4%
0.1% 0.2% 0.
5%0.
9% 1.1% 1.
4% 1.7%
2.6%
2.6% 2.7% 3.
0% 3.1% 3.
4%3.
8% 4.0%
4.0% 4.
3% 4.4% 4.
6%4.
6% 4.7%
4.6%
4.6%
4.6%
4.6%
4.6% 4.7%
4.7% 4.
9%5.
3%5.
3%5.
3%5.
1% 5.3%
5.1%
0.9%
-1%
0%
1%
2%
3%
4%
5%
6%
Jan
05F
eb 0
5M
ar 0
5A
pr 0
5M
ay 0
5Ju
n 05
Jul 0
5A
ug 0
5S
ep 0
5O
ct 0
5N
ov 0
5D
ec 0
5Ja
n 06
Feb
06
Mar
06
Apr
06
May
06
Jun
06Ju
l 06
Aug
06
Sep
06
Oct
06
Nov
06
Dec
06
Jan
07F
eb 0
7M
ar 0
7A
pr 0
7M
ay 0
7Ju
n 07
Jul 0
7A
ug 0
7S
ep 0
7O
ct 0
7N
ov 0
7D
ec 0
7Ja
n 08
Feb
08
Mar
08
Apr
08
May
08
Jun
08
Jul 0
8A
ug 0
8S
ep 0
8O
ct 0
8N
ov 0
8D
ec 0
8Ja
n 09
Feb
09
Mar
09
Apr
09
May
09
Jun
09Ju
l 09
Aug
09
Sep
09
Oct
09
Nov
09
Dec
09
Jan
10F
eb 1
0M
ar 1
0A
pr 1
0M
ay 1
0Ju
n 10
Jul 1
0A
ug 1
0
Auto Insurance Price Increases Have Averaged About 5% in 2010 over 2009, After
Averaging About 4.5% in 2009 over 2008
A Really Soft Market for Auto Insurance Lasted From Oct 2005 Through Dec
2007 (When the Great Recession Began!)

12
Average Expenditures on Auto Insurance
$651$668
$691$705
$726
$786
$830$842
$831$816
$795$816
$853
$895
$690$685$703
$600
$650
$700
$750
$800
$850
$900
$950
94 95 96 97 98 99 00 01 02 03 04 05 06 07 08* 09* 10*
Countrywide Auto Insurance Expenditures Increased2.6% in 2008 and 4.5% Pace in 2009 (est.) and 5% in 2010 (est.)
* Insurance Information Institute Estimates/ForecastsSources: NAIC, Insurance Information Institute estimates 2008-2010 based on CPI data for Auto Insurance.

13
Private Passenger Auto InsuranceNet Written Premium, 2000–2009
$110
$120
$130
$140
$150
$160
$170
2000 2001 2002 2003 2004 2005 2006 2007 2008 2009
Sources: A.M. Best; Insurance Information Institute.
$ Billion

14
Commercial Auto InsuranceNet Written Premium, 2000–2009
$25.43
$23.72
$21.80
$26.73
$21.77
$25.52
$26.68$26.62
$24.57
$19.53
$18
$20
$22
$24
$26
$28
2000 2001 2002 2003 2004 2005 2006 2007 2008 2009
Sources: A.M. Best; Insurance Information Institute.
$ Billion
15
Exposure Driversin Auto Insurance

16
Registered Passenger Carsand Other 2-axle, 4-tire Vehicles
181.
97
181.
33
183.
60
187.
32
190.
78
194.
13 198.
86
199.
97
203.
17 207.
79 212.
70
221.
82
220.
93
222.
86 228.
28
231.
91
234.
52
237.
40
238.
31
175
200
225
250
90 91 92 93 94 95 96 97 98 99 00 01 02 03 04 05 06 07 08
It is likely that the number of vehicles dropped during and following the “Great Recession.” Recovery depends on employment and lending trends.
Sources: http://www.bts.gov/publications/national_transportation_statistics/html/table_01_11.html Insurance Information Institute
Millions
Recession years in gold

17
16.9
16.5
16.1
13.1
10.3
11.5
12.7
16.9
16.617
.117.5
17.8
17.4
9
10
11
12
13
14
15
16
17
18
19
99 00 01 02 03 04 05 06 07 08 09 10F 11F
(Millions of Units)
Auto/Light Truck Sales, 1999-2011F
Source: U.S. Department of Commerce; Blue Chip Economic Indicators (9/10); Insurance Information Institute.
Car/Light Truck Sales Will Recover from the 2009 Low Point, but High Unemployment, Tight Credit Are Still Restraining Sales;
Gas Prices Could Once Again Become a Factor Too
New auto/light truck sales fell to the lowest level since the late 1960s. Forecast for 2010-11 is still far below 1999-2007 yearly
average of 17 million units
Sharply lower auto sales will have a smaller effect on auto insurance
exposure level than problems in the housing market will on home insurers
“Cash for Clunkers” generated about $300M in net new personal auto premiums

18
Miles Driven*, 1990–2010**
*Moving 12-month total **Most recent month is July 2010. Note: Recessions indicated by gray shaded columns.Sources: Federal Highway Administration (http://www.fhwa.dot.gov/ohim/tvtw/tvtpage.cfm ); National Bureau of Economic Research (recession dates); Insurance Information Institute.
Billions
2,100
2,200
2,300
2,400
2,500
2,600
2,700
2,800
2,900
3,000
3,100
'90 '91 '92 '93 '94 '95 '96 '97 '98 '99 '00 '01 '02 '03 '04 '05 '06 '07 '08 '09 '10
Sharp rise in gas prices, then pullback
Two of the past three recessions temporarily slowed the rise in miles driven.
Will the trend toward hybrid and non-gasoline-powered vehicles affect
miles driven? What about the aging and
retirement of the baby boomers?
Growth per Decade1999 vs. 1989: 27.2%2009 vs. 1999: 9.4%

Do Changes in Miles Driven AffectAuto Collision Claim Frequency? No.
7.00
6.81
6.59
6.80 6.786.91
6.65
6.32
6.025.92
5.71
5.85
5.705.62
5.55
5.0
5.5
6.0
6.5
7.0
96 97 98 99 00 01 02 03 04 05 06 07 08 09 10*
Pa
id C
laim
Fre
q
2400
2500
2600
2700
2800
2900
3000
3100
Bil
lio
ns
of
Mil
es D
rive
n
Collision Claim FrequencyBillions of Vehicle Miles
Sources: Federal Highway Administration (http://www.fhwa.dot.gov/ohim/tvtw/09dectvt/page2.cfm; ISO Fast Track Monitoring System, Private Passenger Automobile Fast Track Data: 2nd Qtr. 2010, published Sep. 30, 2010 and earlier reports. *2010 FHWA and ISO figures are for 12 months ending 6/30/2010.
Paid Claim Frequency = (No. of paid claims)/(Earned Car Years) x 100

Source: ISO, US DOT.
Oct. 17, 1973: Arab oil
embargo begins
Frequency Effects of the Embargo:Collision: -7.7%
PD: -9.5%BI: -13.3%
March 17, 1974: Arab oil states announce end
to embargo
Driving StatsGas prices rose
35-40%Miles driven fell
6.7% in 1974
Collision frequency began
to rebound almost immediately after
the embargo ended and reached
pre-embargo levels within 9
months
Auto Insurance: Claim Frequency Impacts of Energy Crisis/Recession of 1973/74
Liability claim frequency
remained below pre-embargo levels for 2
years
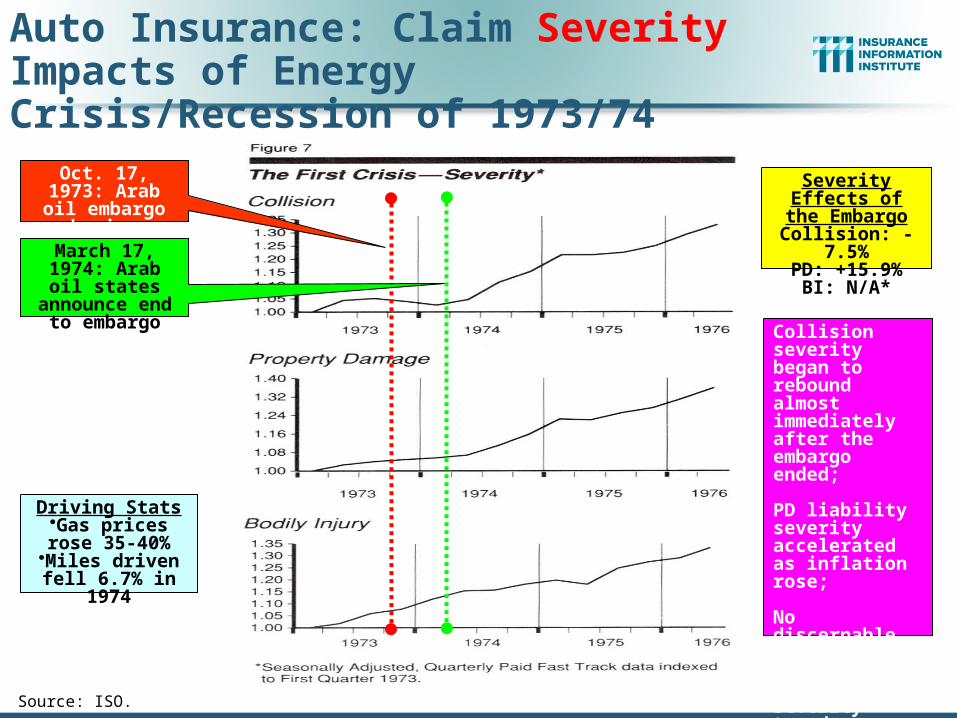
Source: ISO.
Severity Effects of the EmbargoCollision: -7.5%
PD: +15.9%BI: N/A*
Driving StatsGas prices rose
35-40%Miles driven fell
6.7% in 1974
Oct. 17, 1973: Arab oil
embargo begins
March 17, 1974: Arab oil states
announce end to embargo
Collision severity began to rebound almost immediately after the embargo ended;
PD liability severity accelerated as inflation rose;
No discernable trend change in BI liability severity trend.
Auto Insurance: Claim Severity Impacts of Energy Crisis/Recession of 1973/74

Commercial Auto Will Also
See Slow Growth

23
Real GDP Growth,Yearly, 1970-2014F
Estimates/Forecasts from Blue Chip Economic Indicators, 10/2010 issue.Sources: (GDP) U.S. Department of Commerce at http://www.bea.gov/national/xls/gdpchg.xls.
-3%
0%
3%
6%
9%
Real GDP Growth (%)
The “consensus” forecast is for several years of real yearly GDP growth around 3%--weaker than
following most recent recessions

66%
68%
70%
72%
74%
76%
78%
80%
82%
Ma
r 0
1
Ju
n 0
1
Se
p 0
1
De
c 0
1
Ma
r 0
2
Ju
n 0
2
Se
p 0
2
De
c 0
2
Ma
r 0
3
Ju
n 0
3
Se
p 0
3
De
c 0
3
Ma
r 0
4
Ju
n 0
4
Se
p 0
4
De
c 0
4
Ma
r 0
5
Ju
n 0
5
Se
p 0
5
De
c 0
5
Ma
r 0
6
Ju
n 0
6
Se
p 0
6
De
c 0
6
Ma
r 0
7
Ju
n 0
7
Se
p 0
7
De
c 0
7
Ma
r 0
8
Ju
n 0
8
Se
p 0
8
De
c 0
8
Ma
r 0
9
Ju
n 0
9
Se
p 0
9
De
c 0
9
Ma
r 1
0
Ju
n 1
0
Recovery in Capacity Utilization is a Positive Sign for Commercial Exposures
Source: Federal Reserve Board statistical releases at http://www.federalreserve.gov/releases/g17/Current/default.htm. 24
Percent of Manufacturing Capacity
Hurricane Katrina
March 2001-November 2001
recession
“Full Capacity”
The closer the economy is to operating at “full
capacity,” the greater the inflationary pressure
The US operated at 74.7% of industrial
capacity in August 2010,
above the June 2009 low of
68.3%
Recession began December 2007
27
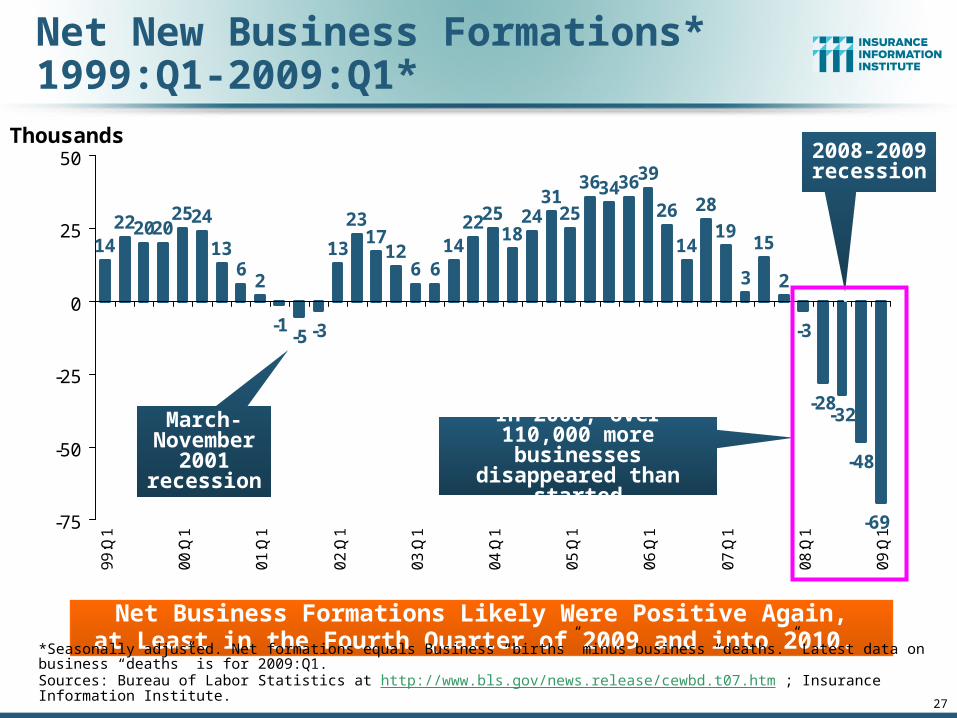
Net New Business Formations*1999:Q1-2009:Q1*
14222020
2524
136
2
-1-5 -3
13
2317
126 6
142225
1824
3125
36343639
26
14
28
19
3
15
2
-3
-28-32
-48
-69-75
-50
-25
0
25
50
99
:Q1
00
:Q1
01
:Q1
02
:Q1
03
:Q1
04
:Q1
05
:Q1
06
:Q1
07
:Q1
08
:Q1
09
:Q1
Net Business Formations Likely Were Positive Again,at Least in the Fourth Quarter of 2009 and into 2010.
*Seasonally adjusted. Net formations equals Business “births” minus business “deaths.” Latest data on business “deaths” is for 2009:Q1.Sources: Bureau of Labor Statistics at http://www.bls.gov/news.release/cewbd.t07.htm ; Insurance Information Institute.
Thousands
March-November
2001 recession
2008-2009 recession
In 2008, over 110,000 more businesses
disappeared than started

28
Unemployment and UnderemploymentRates: Is the Worst Over?
2
4
6
8
10
12
14
16
18
Jan00
Jan01
Jan02
Jan03
Jan04
Jan05
Jan06
Jan07
Jan08
Jan09
Jan10
Traditional Unemployment Rate U-3
Unemployment + Underemployment Rate U-6
September 2010 unemployment rate (U-3) was
9.6%. Peak rate in the last 30
years: 10.8% in Nov - Dec 1982
Source: U.S. Bureau of Labor Statistics; Insurance Information Institute.
U-6 hit 17.5% in Oct 2009 but is now
17.1%
January 2000 through September 2010, Seasonally Adjusted (%)
Recession ended in
November 2001
Unemployment kept rising
slightly for 19 months more
Recession began in
December 2007
Recession ended in
June 2009
Gap between U-3 and U-6 is
normally 4 percentage
points but is now 7.5 points
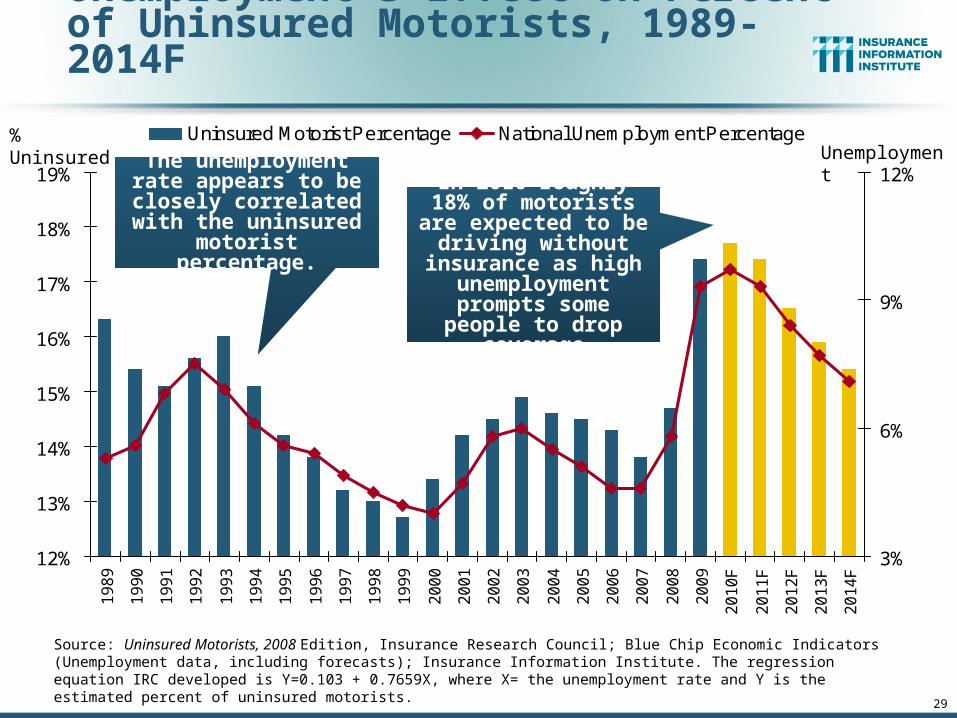
Unemployment’s Effect on Percent of Uninsured Motorists, 1989-2014F
12%
13%
14%
15%
16%
17%
18%
19%
19
89
19
90
19
91
19
92
19
93
19
94
19
95
19
96
19
97
19
98
19
99
20
00
20
01
20
02
20
03
20
04
20
05
20
06
20
07
20
08
20
09
20
10
F
20
11
F
20
12
F
20
13
F
20
14
F
3%
6%
9%
12%
Uninsured Motorist Percentage National Unemployment Percentage
Source: Uninsured Motorists, 2008 Edition, Insurance Research Council; Blue Chip Economic Indicators (Unemployment data, including forecasts); Insurance Information Institute. The regression equation IRC developed is Y=0.103 + 0.7659X, where X= the unemployment rate and Y is the estimated percent of uninsured motorists.
Unemployment% Uninsured
The unemployment rate appears to be closely
correlated with the uninsured motorist
percentage.
In 2010 roughly 18% of motorists are expected
to be driving without insurance as high
unemployment prompts some people
to drop coverage
29
30
Underwriting Trends in Auto Insurance
31
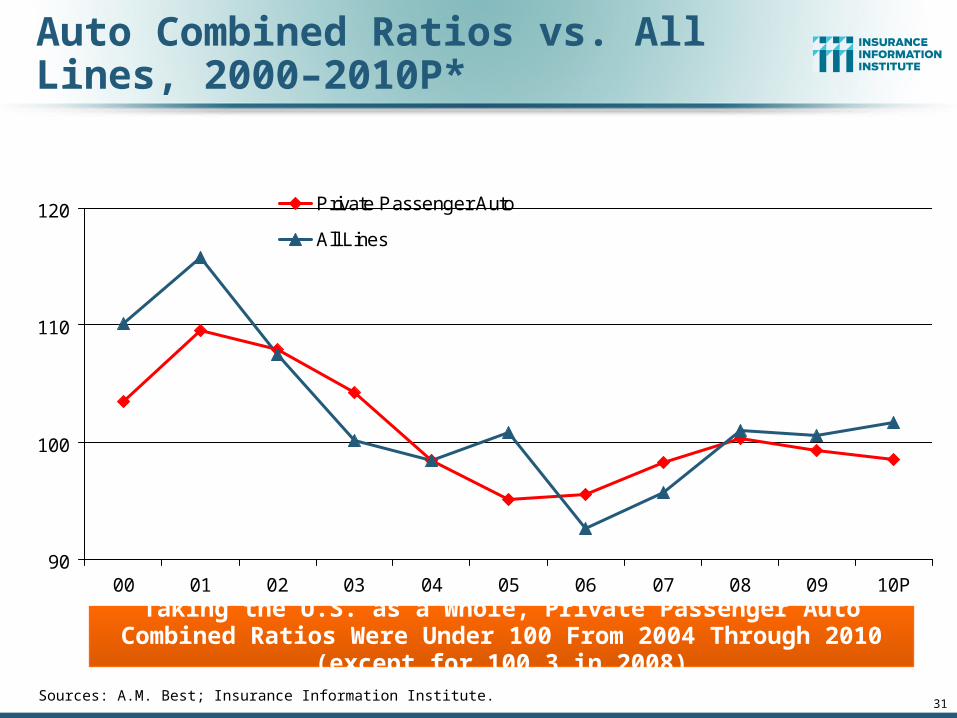
Auto Combined Ratios vs. All Lines, 2000–2010P*
90
100
110
120
00 01 02 03 04 05 06 07 08 09 10P
Month Recession Started
Private Passenger Auto
All Lines
Sources: A.M. Best; Insurance Information Institute.
Taking the U.S. as a Whole, Private Passenger Auto Combined Ratios Were Under 100 From 2004 Through 2010 (except for 100.3 in 2008)

32
Reduction in Combined Ratio Necessary to Offset 1% Decline in Investment Yield to Maintain Constant ROE, by Line*
*Based on 2008 Invested Assets and Earned PremiumsSource: A.M. Best; Insurance Information Institute.
Lower Investment Earnings Place a Greater Burden on Underwriting and Pricing Discipline
-1.8%
-1.9%-1.9%
-1.9%
-1.9%
-1.9%
-1.8%
-1.8%
-1.8%
-1.8%
-1.8%
-1.7%Pvt Pass Auto Comml Auto

33
Claim Trends
Rising Severity Held in Checkby Falling Frequency:
Can That Pattern Be Sustained?

34
PPAuto Bodily Injury Liability: Severity Trends Offset the Decline in Frequency
-5.4%
-3.8%-5.0%
-3.1% -3.2%-2.2%
2.9%
4.7%5.9% 6.1%
2.1%1.2%
-6%
-4%
-2%
0%
2%
4%
6%
8%
2005 2006 2007 2008 2009 2010*
Severity Frequency
*For 2010, data are for the 4 quarters ending with 2010:Q2.Source: ISO/PCI Fast Track data; Insurance Information Institute
Annual Change, 2005 through 2010*
Cost Pressures Will Increase if BI Severity Increases Outpace Declines in Frequency
35
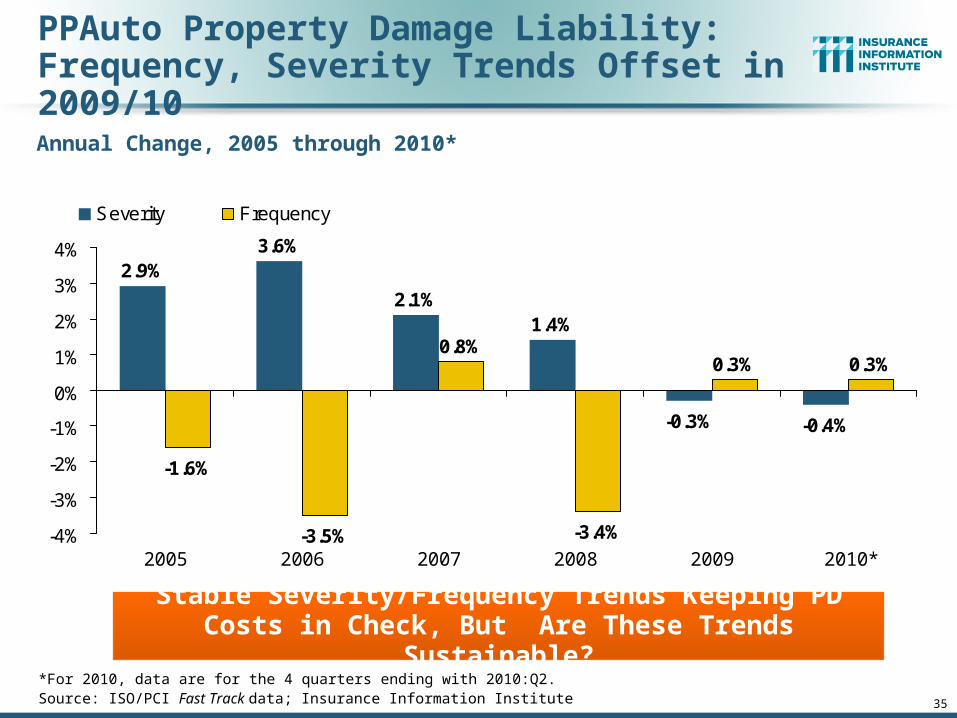
PPAuto Property Damage Liability:Frequency, Severity Trends Offset in 2009/10
-1.6%
-3.5%
0.8%
-3.4%
0.3% 0.3%
2.9%3.6%
2.1%1.4%
-0.3% -0.4%
-4%
-3%
-2%
-1%
0%
1%
2%
3%
4%
2005 2006 2007 2008 2009 2010*
Severity Frequency
Annual Change, 2005 through 2010*
Stable Severity/Frequency Trends Keeping PD Costs in Check, But Are These Trends Sustainable?
*For 2010, data are for the 4 quarters ending with 2010:Q2.Source: ISO/PCI Fast Track data; Insurance Information Institute

36
No-Fault (PIP) Liability: Frequency & Severity Trends Are Adverse*
-4.8%-5.7%
-2.7%
-6.9%
5.9%6.6%
4.7%
2.4%
6.3% 6.4% 6.5%5.2%
-8%
-6%
-4%
-2%
0%
2%
4%
6%
8%
2005 2006 2007 2008 2009 2010*
Severity Frequency
*No-fault states included are: FL, HI, KS, KY, MA, MI, MN, NY, ND and UT; 2010 data are for the 4 quarters ending 2010:Q2.Source: ISO/PCI Fast Track data; Insurance Information Institute
Annual Change, 2005 through 2010*
Multiple States Are Experiencing Severe Fraud and Abuse Problems in their No-Fault Systems, Especially FL, MI, NY and NJ

37
Collision Coverage: Frequency and Severity Trends Have Been Favorable
-1.8%
-3.5%
2.3%
-2.4%-1.6% -1.4%
3.9%3.1%
0.7% 0.4%
-2.3%-1.6%
-4%
-3%
-2%
-1%
0%
1%
2%
3%
4%
5%
2005 2006 2007 2008 2009 2010*
Severity Frequency
Annual Change, 2005 through 2010*
The Recession, High Fuel Prices Have Helped Push Down Frequency and Temper Severity, But this Trend Will Likely Be
Reversed Based on Evidence from Past Recoveries*For 2010, data are for the 4 quarters ending with 2010:Q2.Source: ISO/PCI Fast Track data; Insurance Information Institute

38
Comprehensive Coverage: Severity Trends Very Favorable in 2009/2010
-3.1%
-9.8%-6.6%
1.6% 1.5%
6.6%
15.5%
-1.4% -1.4%
13.0%
-8.3%-10.3%
-15%
-10%
-5%
0%
5%
10%
15%
20%
2005 2006 2007 2008 2009 2010*
Severity Frequency
Annual Change, 2005 through 2010*
Weather Creates Volatility for Comprehensive Coverage; Recession Has Helped Push Down Frequency and Temper
Severity, But This Factors Will Weaken as Economy Recovers*For 2010, data are for the 4 quarters ending with 2010:Q2.Source: ISO/PCI Fast Track data; Insurance Information Institute
Hurricane Katrina

39
Subdued Inflation Doesn’t Reflect P/C Cost Pressures
Inflation
40
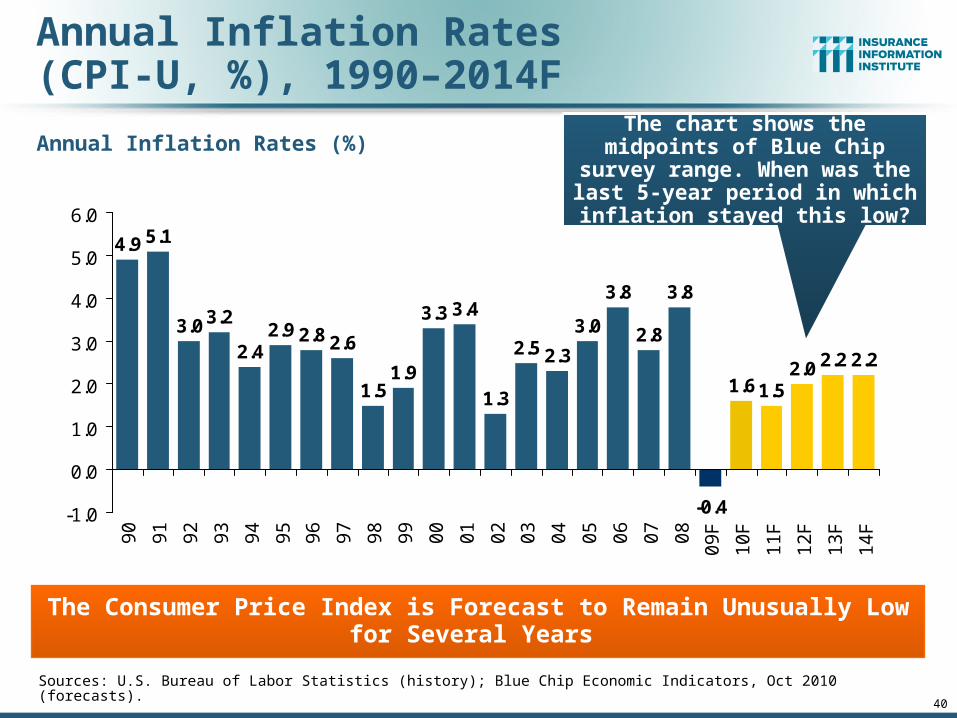
Annual Inflation Rates(CPI-U, %), 1990–2014F
2.8 2.6
1.51.9
3.3 3.4
1.3
2.5 2.3
3.0
3.8
2.8
3.8
-0.4
1.6 1.52.0 2.2 2.2
2.92.4
3.23.0
5.14.9
-1.0
0.0
1.0
2.0
3.0
4.0
5.0
6.0
90
91
92
93
94
95
96
97
98
99
00
01
02
03
04
05
06
07
08
09
F
10
F
11
F
12
F
13
F
14
F
Sources: U.S. Bureau of Labor Statistics (history); Blue Chip Economic Indicators, Oct 2010 (forecasts).
The Consumer Price Index is Forecast to Remain Unusually Low for Several Years
Annual Inflation Rates (%) The chart shows the midpoints of Blue Chip survey range. When was the last 5-year period in
which inflation stayed this low?

Auto BI Liability Insurers Feel Higher Inflation than the CPI Measures
Source: Bureau of Labor Statistics; Insurance Information Institute.
1.1% 0.9%
6.9%
3.3%2.8%
4.2%
3.0%2.5%
0%
2%
4%
6%
8%
Overall CPI "Core" CPI HospitalServices
Physicians'Services
DentalServices
PrescriptionDrugs
Medical CareCommodities
Other MedicalProfessional
Services
(Percent increase Aug 09 to Aug 10)
Healthcare Costs Are a Major Auto BI Liability Insurance Cost Driver. They Are Likely to Increase Faster than the CPI for the Next Few Years, at Least
41
Excludes Food and Energy
Inpatient Services Rose 7.7%;
Outpatient Services Rose 5.0%

Auto Physical Damage Insurers Feel Higher Inflation than the CPI Measures
Sources: U.S. Dept of Labor, Bureau of Labor Statistics; Insurance Information Institute
1.1%0.9%
4.3%
2.7%2.4%
0%
1%
2%
3%
4%
5%
Overall CPI "Core" CPI Legal Services Motor VehicleBody Work
Motor VehicleRepair
(Percent increase Aug 09 to Aug 10)
Legal/Tort Costs and Auto Repair Costs Are Major Auto Physical Damage Insurance Cost Drivers That Are Expected to Increase Above the Inflation Rate Indefinitely
42

All Segments of French Motor Insurance CostsHave Grown Faster than the CPI for Over 20 Years
Source : Fédération Française des Sociétés d’Assurance
Average cost of motor insurance
100
120
140
160
180
200
220
1987
1988
1989
1990
1991
1992
1993
1994
1995
1996
1997
1998
1999
2000
2001
2002
2003
2004
2005
2006
2007
100
= 1
987
Liability for materials
Theft & FireGlass breakage
Accidental damagesCPI

44
Top Risks for Auto Insurersif Inflation Is Reignited
Source: Insurance Information Institute.
Rising Claim SeveritiesCost of claims settlement rises across the board (property and
liability)
Rate InadequacyRates inadequate due to low trend assumptions arising from use of
historical data
Reserve InadequacyReserves may develop adversely and become inadequate
(deficient)
Burn Through on RetentionsRetentions, deductibles burned through more quickly
Reinsurance Penetration/ExhaustionHigher costs risks burn through their retentions more quickly,
tapping into reinsurance more quickly and potentially exhausting their reinsurance more quickly

45
We Can Have InflationDespite High Unemployment
We can “import” inflation.
For example, China is raising interest rates to tame a growing inflation rate. If the prices of things we import rise, importers will try to pass these increases along to buyers.
And if the dollar depreciates vs. currencies of nations from which we import, the dollar price of imports will rise.
We had high inflation during the 1980 and 1981-82 recessions.

The Aging Population
46

47
6.468
10.110
14.575
0
2
4
6
8
10
12
14
16
Under 18 18-64 65+
Increase in Population by Age Category, 2010 to 2020
(Millions)
Source: US Census Bureau
Over the next decade, the demand for personal lines
insurance will be driven by an increasingly older population
Claim Trends in Personal Lines Will Shift With Demographics; Insurers Must Adapt

Labor Force Participation Rate, Ages 55-64, Quarterly, 1998-2010:Q3
61.0% 61.5%
61.5%
61.8%62.9%
62.6%
62.3% 63.0%
62.8%
61.9%
61.8% 62.7%
62.6%
62.9%
62.9%63.3%
63.5%
63.7%
63.6%
64.0%
63.8%
63.5%
63.8%
64.1% 64.8%
64.1%
64.0%65.3%
65.3%
64.5%
64.5%
64.4% 65.0%65.4%
64.9%
61.8%
59.2%
59.2%
59.5%
59.8%
58.8%
59.2%
59.3%
59.4%
59.7%
58.9%
59.0%59.4% 60.1%
60.3%
60.2%
56%
58%
60%
62%
64%
66%
68%
1998.1
1998.2
1998.3
1998.4
1999.1
1999.2
1999.3
1999.4
2000.1
2000.2
2000.3
2000.4
2001.1
2001.2
2001.3
2001.4
2002.1
2002.2
2002.3
2002.4
2003.1
2003.2
2003.3
2003.4
2004.1
2004.2
2004.3
2004.4
2005.1
2005.2
2005.3
2005.4
2006.1
2006.2
2006.3
2006.4
2007.1
2007.2
2007.3
2007.4
2008.1
2008.2
2008.3
2008.4
2009.1
2009.2
2009.3
2009.4
2010.1
2010.2
2010.3
Source: US Bureau of Labor Statistics, US Department of Labor; Insurance Information Institute.
The brown bars indicate recessions.
Labor Force participation rate
This percent is forecast to grow to 68.1% by 2018
The labor force participation rate for workers 55-64 grew from about 59% in 2000to 64% by 2006 and then flattened, but might be inching up again.

Labor Force Participation Rate, Ages 55-64, Quarterly, 1998-2018P
61.0% 61.5%
61.5%
61.8%62.9%
62.6%
62.3% 63.0%
62.8%
61.9%
61.8% 62.7%
62.6%
62.9%
62.9%
63.3%
63.5%
63.7%
63.6%
64.0%
63.8%
63.5%
63.8%
64.1% 64.8%
64.1%
64.0%65.3%
65.3%
64.5%
64.5%
64.4% 65.0%65.4%
64.9%
65.0%
65.1%
65.2%
65.3%
65.4%
65.5%
65.6%
65.7%
65.8%
65.9%
66.0%
66.1%
66.2%
66.3%
66.4%
66.5%
66.6%
66.7%
66.8%
66.9%
67.0%
67.1%
67.2%
67.3%
67.4%
67.5%
67.6%
67.7%
67.8%
67.9%
61.8%
59.2%
59.2%
59.5%
59.8%
58.8%
59.2%
59.3%
59.4%
59.7%
58.9%
59.0%59.4% 60.1%
60.3%
60.2%
56%
58%
60%
62%
64%
66%
68%
1998
.1
1999
.1
2000
.1
2001
.1
2002
.1
2003
.1
2004
.1
2005
.1
2006
.1
2007
.1
2008
.1
2009
.1
2010
.1
2011
.1
2012
.1
2013
.1
2014
.1
2015
.1
2016
.1
2017
.1
2018
.1
Source: US Bureau of Labor Statistics, US Department of Labor; Insurance Information Institute.
Labor Force participation rate
This is what happens if the labor force
participation rate for this group grows by 0.1% per
quarter
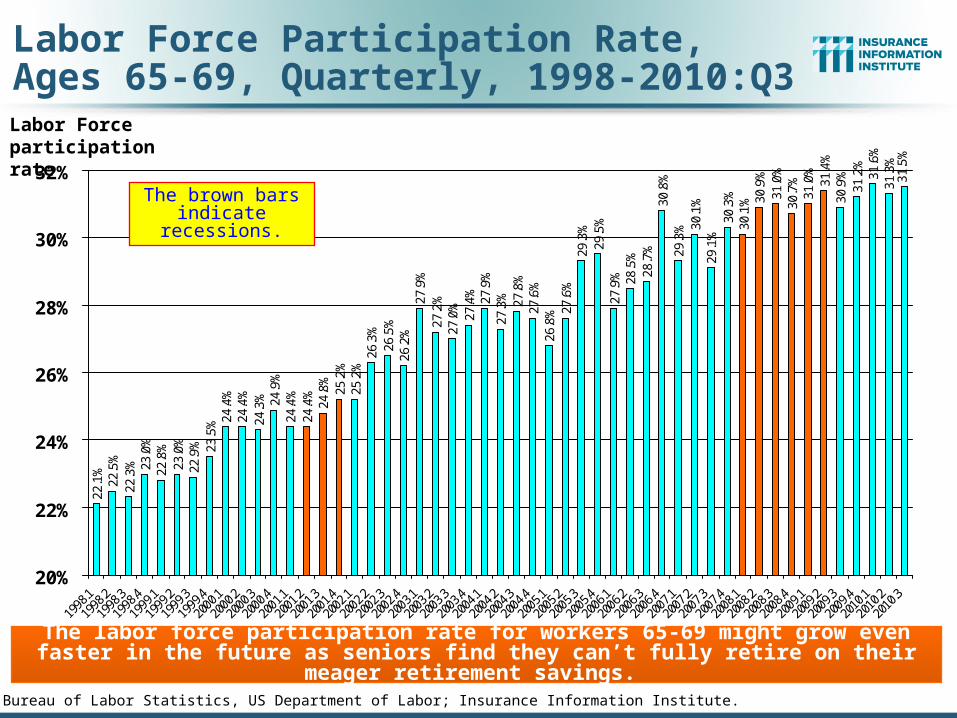
Labor Force Participation Rate, Ages 65-69, Quarterly, 1998-2010:Q3
25.2%
25.2%26.3%
26.5%
26.2%
27.9%
27.2%
27.4% 27.9%
27.3% 27.8%
27.6%
26.8% 27.6%
29.3%
29.5%
27.9% 28.5%
28.7%
30.8%
29.3% 30.1%
29.1%30.3%
30.1% 30.9%
31.0%
30.7%
31.0%
31.4%
30.9%
31.2%
31.6%
31.3%
31.5%
27.0%
22.9%
23.0%
22.8%
23.0%
22.3%
22.5%
22.1%
23.5% 24.4%
24.4%
24.3% 24.9%
24.4%
24.4%24.8%
20%
22%
24%
26%
28%
30%
32%
1998.1
1998.2
1998.3
1998.4
1999.1
1999.2
1999.3
1999.4
2000.1
2000.2
2000.3
2000.4
2001.1
2001.2
2001.3
2001.4
2002.1
2002.2
2002.3
2002.4
2003.1
2003.2
2003.3
2003.4
2004.1
2004.2
2004.3
2004.4
2005.1
2005.2
2005.3
2005.4
2006.1
2006.2
2006.3
2006.4
2007.1
2007.2
2007.3
2007.4
2008.1
2008.2
2008.3
2008.4
2009.1
2009.2
2009.3
2009.4
2010.1
2010.2
2010.3
Source: US Bureau of Labor Statistics, US Department of Labor; Insurance Information Institute.
The brown bars indicate recessions.
Labor Force participation rate
The labor force participation rate for workers 65-69 might grow even faster in the future as seniors find they can’t fully retire on their meager retirement savings.

Labor Force Participation Rate,Ages 70-74, Quarterly, 1998-2010:Q3
14.2%
13.8%14.2%
14.0%
14.0%14.4%
14.4% 14.9%
14.9% 15.4%
15.6%
15.3%
16.4% 17.0%
15.8%16.2% 16.7%
16.9%
17.2%
17.0%
16.7%
16.8%
18.0%
17.5%
17.3%
16.9%
18.6%
18.2%
17.7%
17.9%18.9%
19.2%
18.0%
18.1%
17.4%
14.6%
13.1%13.6%
12.4%12.9%
12.4%
12.2%
12.5% 13.1%
13.3%
13.5%
13.6%
13.8% 14.4%
13.7% 14.2%
10%
12%
14%
16%
18%
20%
Source: US Bureau of Labor Statistics, US Department of Labor; Insurance Information Institute.
Labor Force participation rate
The labor force participation rate for workers 70-74 grew by about 50% since 1998,but growth has stalled since the Great Recession began.

Labor Force Participation Rate,Ages 75 & over, Quarterly, 1998-2010:Q3
5.4%
5.1%5.1% 5.2%
5.0%
5.5%
5.9%
5.8% 5.9% 6.0% 6.1%
6.5%
6.1%
6.6%
6.3%
6.7%
6.4%6.6%
6.0%
6.5%6.5%
7.1%
7.0%
6.9%6.9%
7.2%7.4%7.6%7.6%
7.0%7.2% 7.3%7.3%
6.9%
7.7%
5.8%
5.4%
5.1%
4.8%5.0%
4.6%4.6%
4.5%
5.2%5.4%
5.3%
5.2% 5.3%
5.2%5.2%
5.1%
4%
5%
6%
7%
8%
Source: US Bureau of Labor Statistics, US Department of Labor; Insurance Information Institute.
Labor Force participation rate
These people were born before 1935
This percent is forecast to grow to
10.3% by 2018
The labor force participation rate for workers 70-74 grew by about 50% since 2002,but growth has stalled since the Great Recession began.

Younger and Older Drivers Are Over- Represented in Fatal Crashes
Share of Drivers in Age Group
Sources: US DOT, NHTSA, Federal Highway Administration; Insurance Information Institute
0.1%
6.3% 6.7%
17.4%19.2%
15.2%
8.6%6.5%
20.0%
21.37
17.10
19.28
29.89
52.80
24.93
21.86
45.06
0%
5%
10%
15%
20%
25%
Under 16 16 to 20 21 to 24 25 to 34 35 to 44 45 to 54 55 to 64 65 to 74 75+0
10
20
30
40
50
60
Percent of Licensed Total Drivers in Age GroupInvolvement Rate in Fatal Crashes
Immigration and High Birth Rates in Some Demographic Groups, Combined With Baby Boomers Aging Creates Challenges for Insurers and Auto Safety Experts
Involvement Rate per 100,000 Drivers

Motor Vehicle Deaths per 100,000 Persons by Age, 2008
Problem: How to Keep the Elderly Safe in Cars (Not Just When They’re Behind the Wheel)
Sources: Insurance Institute for Highway Safety; Insurance Information Institute
The elderly are almost as likely to be killed in a motor vehicle
accident as a teenager. As the Baby Boomers age, this is a looming public health crisis

55
Fraud & Abuse in Private Passenger Auto Insurance
Skyrocketing No-Fault (PIP) Claim Costs Are a Major Concern in
Several States

56
Increase in No-Fault Claim Severity: 2004-2010*
*2010 figure is for the 4 quarters ending 2010:Q2. Sources: Insurance Information Institute research from ISO/PCI Fast Track data.
$34,364
$16,640
$8,807 $7,711 $6,887$5,212$6,674$5,871
$12,136
$24,385
$0$5,000
$10,000$15,000$20,000$25,000$30,000$35,000$40,000
Michigan New Jersey New York Florida Minnesota
2004 2010
The no-fault systems in MI, NJ, NY, FL, and MN are under stressdue to rising fraud and abuse
which will ultimately lead to higher premiums for drivers
+36.8%
+37.1%
+50.0% +15.5% +32.1%

57
New York State No-Fault Claim Severity, 2001:Q1–2010:Q2
Sources: ISO/PCI Fast Track data; Insurance Information Institute.
$8,3
27
$7,8
88
$7,5
07
$8,2
34
$9,2
35
$8,7
27$8
,577
$7,7
73
$7,3
11
$6,9
58
$6,8
70
$6,1
56
$6,0
52
$5,8
20
$5,9
91
$5,6
15
$6,0
94
$5,9
14 $6,2
50$6
,269 $6
,530
$6,6
06
$7,0
63 $7,3
23
$7,3
78
$7,2
97 $7,6
70
$7,7
40
$8,4
43
$8,1
77 $8,5
07$8
,025
$8,5
62
$8,7
48
$8,6
90
$8,8
62
$8,6
66 $9,0
07
$5,000
$5,500
$6,000
$6,500
$7,000
$7,500
$8,000
$8,500
$9,000
$9,500
1:01
1:03
2:01
2:03
3:01
3:03
4:01
4:03
5:01
5:03
6:01
6:03
7:01
7:03
8:01
8:03
9:01
9:03
10:0
1
1.4%
1.6%
1.8%
2.0%
2.2%
2.4%Avg. Claim Severity
Frequency
About 20% of No-Fault Claim Costs Are Attributable to Fraud and Abuse
No-Fault Claim Severity No-Fault Claim Frequency
Avg. Claim Severity Rose 63% in 5 years
after 1997 Presbyterian
Decision

58
$12
$504
$875
$1,390
$1,561$1,644
$0
$200
$400
$600
$800
$1,000
$1,200
$1,400
$1,600
$1,800
2005 2006 2007 2008 2009** 2010F
Estimated Per-Claim Cost of No-Fault Fraud in New York State, 2005-2010F*
*No-fault severity reached a post-reform low in 2004 before, hence selection of 2005 as the first year of analysis. Actual no-fault losses in 2005 and beyond are higher than estimates indicate due to baselevel of fraud imbedded in 2004 data.**2009 figure is estimated based on 4 quarters ending 2009:Q3 (latest available).Source: Insurance Information Institute analysis and research.
No-fault fraud costs per claim could rise
to $1,644 in 2010 without reform
The estimated per claim cost of no-fault fraud (a.k.a. Fraud Tax) in NY state was $1,561 in 2009, up 12.3% from 2008 and
78.4% from 2007

www.iii.org
Thank you for your timeand your attention!
Insurance Information Institute Online: