Meeting Power Demand and Emission Standards in Malaysia
29
Meeting Power Demand and Emission Standards in Malaysia By Noor Asihin Surani TNB Fuel Services Sdn Bhd Indonesia Coal Mining 2019 18 – 19 September 2019 Jakarta International Expo
Transcript of Meeting Power Demand and Emission Standards in Malaysia

MeetingPower Demand and
Emission Standards in Malaysia
ByNoor Asihin Surani
TNB Fuel Services Sdn Bhd
Indonesia Coal Mining 201918 – 19 September 2019
Jakarta International Expo

Contents
Objective
Energy Mix
Malaysia Electricity Supply
Procurement Principle
Emission Standard in Malaysia
Conclusion
12
3
54
6

Objective
To share on Malaysia electricity outlook and challenges from Economic, Environment and Economic Prospects.
Disclaimer
All information contained herein are solely for the purpose of this presentation only and cannot be used orreferred to by any party for other purposes without prior written consent from TNB. Information containedherein is the property of TNB and it is protected and confidential information. TNB has exclusive copyright overthe information and you are prohibited from disseminating, distributing, copying, reproducing, using and /ordisclosing this information.

Malaysia
PENINSULAR
MALAYSIA
40% of land area;
80% of population.
STATES OF
SABAH & SARAWAK
60% of land area;
20% of population.
Population Max Demand Capacity Access to Electricity
18,545MW32.66 Million
April 2019
(Peninsular Malaysia)
23,867MW
March 2019 (Peninsular Malaysia)
97.6%
Q1 2019 11th Malaysia Plan2016-2020

T E N A G A N A S I O N A L B E R H A D ( T N B )
9.65 Mil l ionCustomer Base 2018
118,814 GWhElectricity sales for 2018
About Us
(Customers & Sales in Peninsular Malaysia, Sabah and Labuan)
35,574Employees TNB Group
T N B F U E L S E R V I C E S ( T N B F )

85employees
100% owned by
TNB
Currently imports about
33 mtpa of coal
TNBF’s credibility proven internationally since its inception in 1998
Expected to be the largest single buyer in the Asia Pacific region by 2020
Expected to import
coal about 40 mtpa by 2020
Business Snapshot

Electricity Demand
-
5,000
10,000
15,000
20,000
25,0002
00
6
20
07
20
08
20
09
20
10
20
11
20
12
20
13
20
14
20
15
20
16
20
17
20
18
20
19
20
20
20
21
20
22
20
23
20
24
20
25
MW
Electricity Demand MW (2006-2025)
Historical Forecast
202520,651 MW
200612,990 MW
201918,545 MW
Malaysia High Impact Projects
Light Rail Transit 3
East Cost Rail Link
Mass Rapid Transit 2
Bandar Malaysia

Generation Mix
Historical (1990-2016)Major Generation Projects
As at Feb 2019
Gas
Coal
Hydro
Others
ac: aggregate capacity
Coal55.90%
Solar0.03%
Gas40.13%
Hydro3.89%
Others0.05%
2018
•Partially Completed
•1,000MWac
•COD:2020
•Construction
•1,440MW
•COD: 1st July 2020
•Construction
•2,400MW
•COD:31st Dec 2021
•Unit 1 : COD 15th June 19
•Unit 2 : Construction
•2,000MW
•COD:U2: 15th
Dec 2019JimahEast
Power
Large Scale Solar
EdraProject
Southern Power
Generation (SPG)

Janamanjung4100MW
Jimah East2000MW
(Commissioned 2020)
Jimah Energy 1400MW
Kapar1600MW
Tanjung Bin3100MW
Coal Fired Power Plant
System Generation
12,200 MW
(2020)
CFPP Design with Flexibility
IndonesiaAustralia
Russia
South Africa
2019 60%
2%
25%
13%
Country Diversification

The Balanced Generation Mix (Post 2020)
Environment
Economic
Security
To provide affordable,
reliable and sustainable electricity

Economic
Coal & Renewable Energy Complements Each OtherCoal is cheapest fuel source
Th-Coal
Hyd-base
CCGT
Th-Gas
Hyd-Peak
OCGT
Average Coal PriceLNG Average Distillate Average MFO

Security
5.3
5.5
4.7
6.0
5.0
4.2
5.9
4.74.5
3.1
4.3
3.8
2.52.2
2.5
2.5
2.6
2.6
FY'11 FY'12 FY'13 FY'14 FY'15 FY'16 FY'17 FY'18 FY'19
GDP Demand Growth
PPA/SLA Expiry 2019-2025 : 4,774 MW (non-coal)
OCGT10%
CCGT68%
Hydro22%
Population Growth (est 1.1%)
10,497
8845
7820
4596
2540
820
S.Korea Singapore Japan Malaysia Thailand Indonesia
kWh
/Cap
ita
GDP & Rate of Demand Growth (2011-2019)
1st Coal Fired Power Plant to be expiredon PPA is Kapar Energy Ventures (1600MW) in July 2029, followed by TNBJanamanjung (2100 MW).
Options & Construction Lead Time
Power Plant Years
Coal Fired Power Plant 4-5
Gas/Combine Cycle Power Plant 2-3
IEA Statistics © OECD/IEA 2014
2019
32.7 Million
2025
35Million

The Asean Post April 2019 , KPMG
IEA Statistics © OECD/IEA 2018
Environment
• Nuclear
• Gas
• Coal
Options for Thermal
• Gas
• Coal
Medium Term
Country Target
Malaysia 20% Gen Mix by 2025 (Revised)
Singapore 1 GW Solar post 2020
Thailand 30% Gen Mix in 2036
Vietnam 12 GW Solar, 6 GW Wind by 2030
Indonesia 23% Gen Mix by 2025
Options for Renewables
• Solar PV
• Biogas (Agri Waste)
• Biomass/Solid Waste
• Small Hydro
Medium Term
• Renewables such as solar energy will grow
significantly.

Generation Mix Projection (2019-2023)
Single Buyer, 2019
53%
42%
4%0%
61%
35%
4%1%
56%
40%
4%1%
56%
40%
4%1%
56%
39%
4%2%
0%
10%
20%
30%
40%
50%
60%
70%
Coal Gas Hydro Solar/RE
2019
2020
2021
2022
2023
LSS increases from 0.4% in
2019 to 2% in 2023
0.4%
2020 Increase – new Plant
2021 Reduce – new Gas
2020 Reduce-Coal Plant
2021 Increase – new Gas

Electricity Reforms

Electricity Reforms
The Malaysian Electricity Supply Industry (MESI) has continuously undergone reforms over the past decades
MESI 1.0
MESI 2.0
Key Objectives of Electricity
Reform
(MESI 2.0)
Green
•environmentalsustainability
Security
•of supply and reliability
of the system
Efficiency
•for lowest cost of energy
Experience
•more choice from more
competition

Shaping Electricity Industry
Life Cycle Management for Power Plant
Nurture New Product & Supplier
Risk Management
Research & Development
Embrace New Technology
TNBF Strategic Procurement Principles
Economic
Quality
Security

Environmental Quality (Clean Air) Regulations 2014
Heat and Power Generation : Boilers
Pollutant Limit Value
Sum of SO2 and SO3 expressed as SOx 500mg/m³
Sum of NO and NO2 expressed as NO2 500mg/m³
Particulate Matter, PM 50 mg/m³

Clean Coal Combustion Technology
Pulverized Fuel Firing (PFF)
Flue Gas Desulphurization (FGD)
Electrostatic Precipitator (ESP) / Fabric Filter
Low Sulphur sub-bituminous grade coal
Low NOx burners
Provision of high chimney (200 m) for exhaust gas
Crushed and ground to 75 microns
for better combustion
Exit velocity 22 m/s
With FGD – 82 oC
Without FGD – 130 oC
SO2 absorbed by sea water and oxidized
into harmless sulfate
Dust/ash trapped and collected
Sold to cement industry
4800-6500 kcal/kg,
1% Sulfur, 15% ash, 27% moisture
High efficiency burner and low
generation of NOx
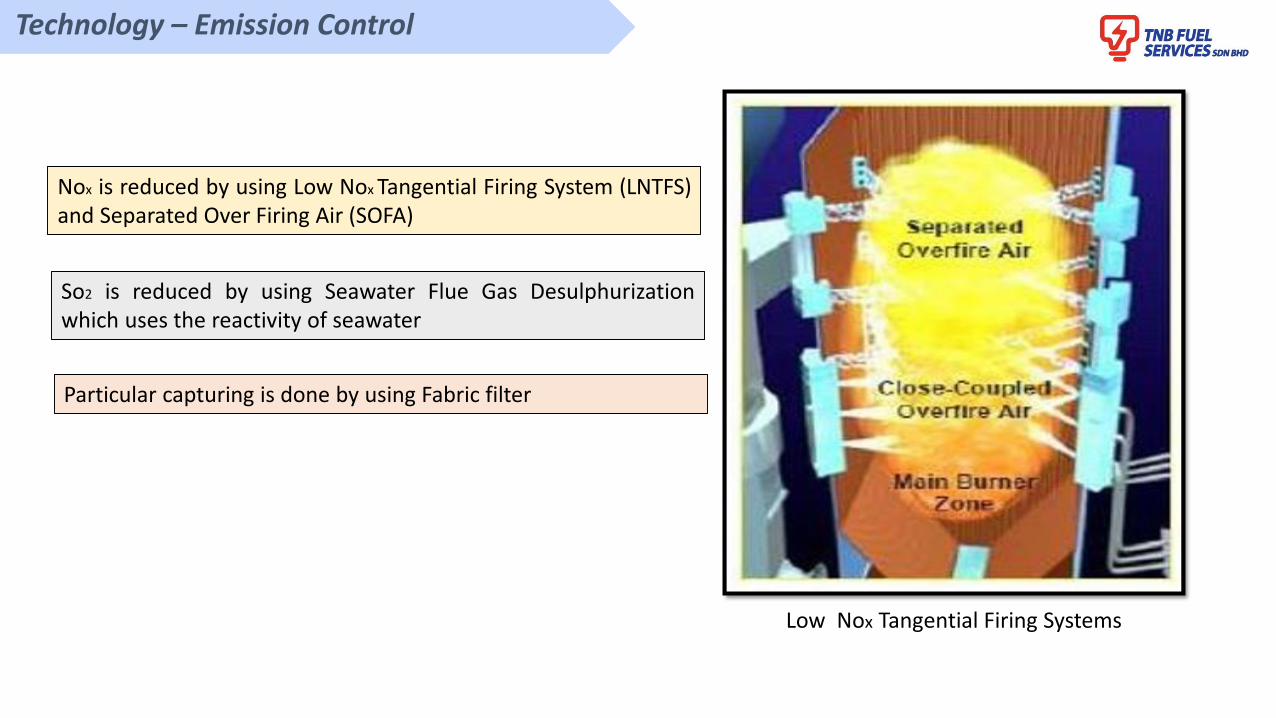
Technology – Emission Control
Nox is reduced by using Low Nox Tangential Firing System (LNTFS)and Separated Over Firing Air (SOFA)
So2 is reduced by using Seawater Flue Gas Desulphurizationwhich uses the reactivity of seawater
Particular capturing is done by using Fabric filter
Low Nox Tangential Firing Systems

1
Best Practices in Clean Coal Use and Technology Innovation
at Manjung Coal Fired Power Plant

Manjung Coal Fired Power Plant
TNBJ and M5 supplies 23%of Peninsular Malaysia’s electricity demand and is currently the largest Independent Power Producer (IPP) in Malaysia
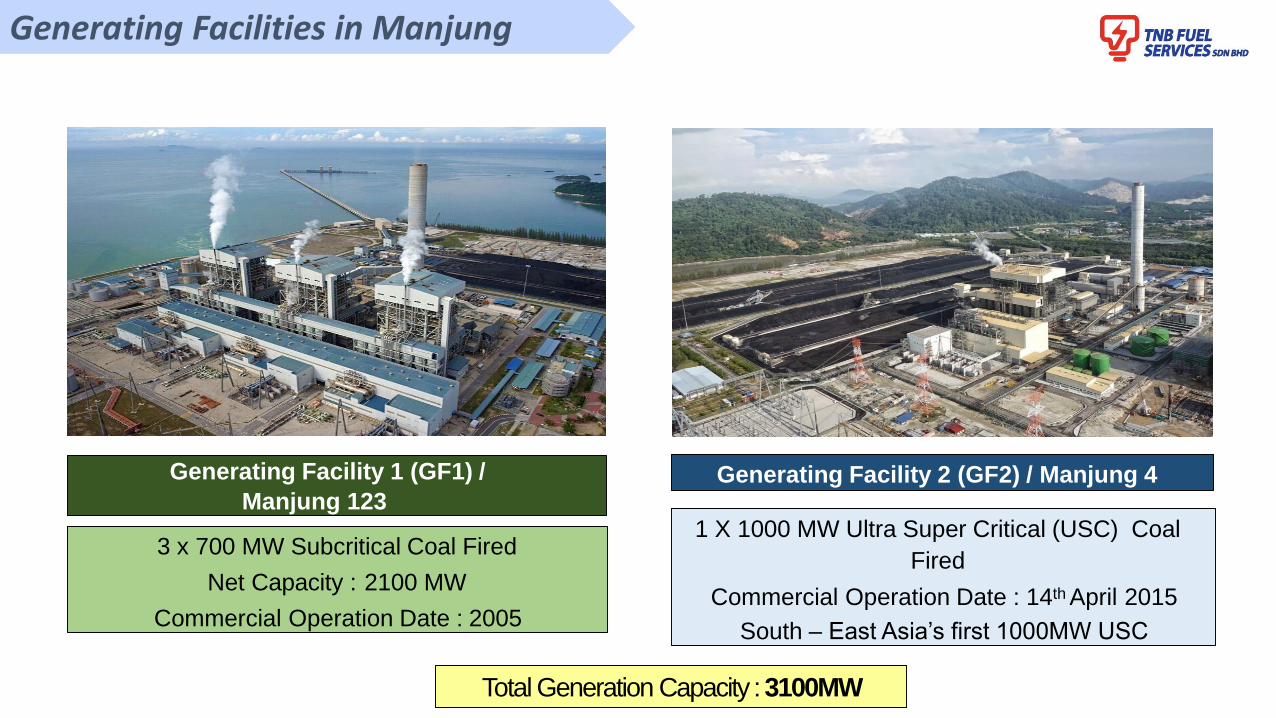
Generating Facilities in Manjung
Generating Facility 1 (GF1) /
Manjung 123Generating Facility 2 (GF2) / Manjung 4
3 x 700 MW Subcritical Coal Fired
Net Capacity : 2100 MW
Commercial Operation Date : 2005
1 X 1000 MW Ultra Super Critical (USC) Coal
Fired
Commercial Operation Date : 14th April 2015
South – East Asia’s first 1000MW USC
Total Generation Capacity : 3100MW

Generating Facilities in Manjung
Manjung 5
1 X 1000 MW USC Coal Fired
Commercial Operation Date : 28th September 2017

Energy and Economy (Heat Rate Improvement)
Steam Plant - Benefits of High Efficiency
ParameterManjung 1,2,3
(SubC)Typical SC
PlantManjung 4
(USC)
Gross unit output (MWe) 765 660 1080
Main steam pressure (bar) 175 250 270
Main /reheat steam temperature (°C) 540/540 656/565 595/603
Heat rate (kJ/kWh) improvement Base +3.5% +6.2%
Annual coal Consumption (ton/year) Base -107,800 -192,000
Annual fuel cost savings (@100$/ton/year) Base + 11M$ + 19M$
Annual C02 emission (ton/year) Base -316,000 -563,000
Efficiency increase is key to reduce fuel consumption andemissions

Emission Limit Comparisons
Parameters
CAR 1978
mg/Nm3
max.
World Bank
mg/Nm3
max.
M 1,2 &3mg/Nm3
max.
M4mg/Nm3
max.
M5mg/Nm3
max.
CAR 2014
mg/Nm3
max.
Nitrogen Oxide 1700 650 650 500 500 500
Sulfur Dioxide 3500 750 750 500 500 500
Particulates / Dust 400 50 50 50 50 50
Carbon Monoxide NA 200 200 200 200 200
Opacity 40% 20% 20% 20% 20% 20%
Emission ControlEquipment
- - ESP, FGD
Bag Filter, FGD
Bag Filter, FGD
-

1
Continuous Emission Monitoring Systems
(CEMS)
Emission parameters are being monitored on-line by DOE
Monitoring Parameters: Smoke
density/opacity Particulate/dust Sulfur DioxideNitrogen Oxide
(NO2) Carbon Monoxide
(CO)
2
Ambient Air Quality around the power
plant is monitored at three locations :
Within the compound of the power plant as example in Manjung
Sekolah MenengahTeknik Seri Manjung(3km radius)
Pejabat TNB Distribution Seri Manjung(5km radius)
3
Air Quality Monitoring System
Monitoring Parameters :
Sulfur Dioxide (SO2)Nitrogen Oxide
(NOX, NO, & NO2) Carbon Monoxide
(CO)Ozone (O3) Total Hydrocarbon PM10 & PM2.5Wind Direction,
Wind Speed, Rain Fall & Visibility Index
4
Acid Rain Monitoring
Monitoring Locations :
Sek. Men. Teknik Seri Manjung (3km Radius)
TNB Distribution Seri Manjung (5km Radius)
Stesen JanakuasaSultan Azlan Shah, Manjung
Monitoring FrequencyWeekly
Monitoring Parameter pH
Emissions Air Quality Monitoring

Conclusions
Electricity demand increases as Malaysia vision to become high-income country and developed
nation.
Significant reduction on generation supply for post 2030.
Fossil fuel (Coal & Gas) become dominant in electricity generation.
Renewable (Solar PV) will grow significantly and Flexibility in procurement strategy
Conclusions
Major reform of electricity industry

Thank you