Medicare: Insolvency Projections
17
Medicare: Insolvency Projections Updated October 25, 2021 Congressional Research Service https://crsreports.congress.gov RS20946
Transcript of Medicare: Insolvency Projections
Medicare: Insolvency Projections
Updated October 25, 2021
Congressional Research Service
https://crsreports.congress.gov
RS20946

Medicare: Insolvency Projections
Congressional Research Service
Summary Medicare is the nation’s health insurance program for persons aged 65 and older and certain
disabled persons. Medicare consists of four distinct parts: Part A (Hospital Insurance, or HI);
Part B (Supplementary Medical Insurance, or SMI); Part C (Medicare Advantage, or MA); and Part D (the outpatient prescription drug benefit).
The Part A program is financed primarily through payroll taxes levied on current workers and
their employers; these taxes are credited to the HI trust fund. The Part B program is financed
through a combination of monthly premiums paid by current enrollees and general revenues.
Income from these sources is credited to the SMI trust fund. As an alternative, beneficiaries can choose to receive all their Medicare services through private health plans under the MA program;
payment is made on beneficiaries’ behalf in appropriate parts from the HI and SMI trust funds.
The Part D drug benefit is funded through a separate account in the SMI trust fund and is
financed through general revenues, state contributions, and beneficiary premiums. The HI and
SMI trust funds are overseen by the Medicare Board of Trustees, which makes an annual report to Congress concerning the financial status of the funds.
Since the inception of Medicare in 1966, the HI trust fund has always faced a projected shortfall.
The insolvency date has been postponed a number of times, for example, through legislative changes that have had the effect of restraining growth in program spending. The 2021 Medicare
Trustees Report projects that, under intermediate assumptions, the HI trust fund will become insolvent in 2026, the same year as estimated in the prior three years’ reports.

Medicare: Insolvency Projections
Congressional Research Service
Contents
Introduction ................................................................................................................... 1
Medicare Hospital Insurance Financing .............................................................................. 2
What Is the HI Trust Fund?............................................................................................... 2
History of HI Trust Fund Solvency Projections .................................................................... 3
Current Insolvency Projections.......................................................................................... 4
What Would Happen If the HI Trust Fund Became Insolvent? ................................................ 6
Medicare Financing Issues................................................................................................ 7
Figures
Figure 1. Projected Number of Years Until Medicare HI Trust Fund Insolvency ........................ 3
Figure 2. HI Trust Fund Assets at Beginning of Year as a
Percentage of Annual Expenditures ................................................................................. 6
Tables
Table 1. Year of Projected Insolvency of the Hospital Insurance (HI) Trust Fund in Past
and Current Trustees Reports ......................................................................................... 4
Table A-1. Operation of the Hospital Insurance Trust Fund, CY1970-CY2030 .......................... 8
Table B-1. Tax Rates and Maximum Tax Bases.................................................................. 10
Appendixes
Appendix A. Operation of the Hospital Insurance Trust Fund ................................................. 8
Appendix B. Historical Payroll Tax Rates ......................................................................... 10
Appendix C. Changes in HI Trust Fund Insolvency Projections: 1997-2020 ........................... 11
Contacts
Author Information ....................................................................................................... 13
Acknowledgments......................................................................................................... 13
Medicare: Insolvency Projections
Congressional Research Service 1
Introduction Medicare is a federal insurance program that pays for covered health care services of qualified
beneficiaries. It was established in 1965 under Title XVIII of the Social Security Act as a federal
entitlement program to provide health insurance to individuals aged 65 and older, and it has been expanded over the years to include permanently disabled individuals under the age of 65.
Medicare consists of four distinct parts, A through D. Part A covers hospital services, skilled
nursing facility (SNF) services, home health visits, and hospice services. Most persons aged 65
and older are automatically entitled to premium-free Part A because they or their spouse paid
payroll taxes for at least 40 quarters (10 years) on earnings covered by either the Social Security or the Railroad Retirement systems. Part B covers a broad range of medical services, including
physician services, laboratory services, durable medical equipment, and outpatient hospital
services. Enrollment in Part B is voluntary; however, most beneficiaries with Part A also enroll in
Part B. Part C, Medicare Advantage (MA), provides private plan options, such as managed care,
for beneficiaries who are enrolled in both Part A and Part B. Part D provides optional outpatient prescription drug coverage.1
Medicare expenditures are driven by various factors, including the level of enrollment, provider
payment rates, the quantity and complexity of medical services provided, health care inflation, and life expectancy. In 2020, Medicare provided benefits to about 63 million persons at an estimated total cost of $926 billion.2
The Medicare program has two separate trust funds—the Hospital Insurance (HI) trust fund and
the Supplementary Medical Insurance (SMI) Trust fund. The Part A program, which is financed
mainly through payroll taxes levied on current workers, is accounted for through the HI trust
fund. The Part B and Part D programs, which are funded primarily through general revenue and
beneficiary premiums, are accounted for through the SMI trust fund.3 Both funds are maintained
by the Department of the Treasury and overseen by the Medicare Board of Trustees, which reports annually to Congress concerning the funds’ financial status.4 Financial projections are
made using economic assumptions based on current law, including estimates of consumer price index, workforce size, wage increases, and life expectancy.
From its inception, the HI trust fund has faced a projected shortfall and eventual insolvency.
Because of the way it is financed, the SMI trust fund cannot become insolvent; however, the Medicare trustees continue to express concerns about the rapid growth in SMI costs.5
1 For additional information on the Medicare program, see CRS Report R40425, Medicare Primer.
2 Boards of Trustees, Federal Hospital Insurance and Federal Supplementary Medical Insurance Trust Funds, 2021
Annual Report of the Boards of Trustees of the Federal Hospital Insurance and Federal Supplementary Medical
Insurance Trust Funds, August 31, 2021, Table II.B1, at https://www.cms.gov/files/document/2021-medicare-trustees-
report.pdf (hereinafter, 2021 Report of the Medicare Trustees). 3 Payments are made for beneficiaries enrolled in Part C from the Hospital Insurance (HI) and Supplementary Medical
Insurance (SMI) trust funds based on estimates of HI and SMI spending under Part C.
4 Medicare Trustees Reports from 1966 through 1994 may be found on the Social Security History webpage at
https://www.ssa.gov/history/reports/trust/trustyears.html. More recent reports may be found on the CMS webpage,
“Trustees Report & Trust Funds,” at https://www.cms.gov/Research-Statistics-Data-and-Systems/Statistics-Trends-
and-Reports/ReportsTrustFunds.
5 For further information on Medicare financing, see CRS Report R43122, Medicare Financial Status: In Brief.

Medicare: Insolvency Projections
Congressional Research Service 2
Medicare Hospital Insurance Financing Similar to the Social Security program, the HI portion of Medicare was designed to be self-
supporting and is financed through dedicated sources of income, rather than relying on general
tax revenues. The primary source of income credited to the HI trust fund is payroll taxes paid by
employees and employers; each pays a tax of 1.45% on earnings. The self-employed pay 2.9%.
Unlike Social Security, there is no upper limit on earnings subject to the tax.6 The Patient Protection and Affordable Care Act (ACA; P.L. 111-148, as amended) imposes an additional tax
of 0.9% on high-income workers with wages over $200,000 for single filers and $250,000 for joint filers, effective for taxable years beginning in 2013.7
Additional income to the HI trust fund consists of premiums paid by voluntary enrollees who are
not entitled to premium-free Medicare Part A through their (or their spouse’s) work in covered
employment, a portion of the federal income taxes paid on Social Security benefits ,8 and interest on federal securities held by the HI trust fund.
What Is the HI Trust Fund? The HI trust fund is a financial account in the U.S. Treasury into which all income to the Part A
portion of the Medicare program is credited and from which all benefits and associated
administrative costs of the Part A program are paid. The trust fund is solely an accounting mechanism—no actual money is transferred into or out of the fund.9
HI operates on a “pay-as-you-go” basis, meaning the annual revenues to the HI trust fund,
primarily the taxes paid by current workers and their employers, are used to pay Part A benefits
for today’s Medicare beneficiaries. When the government receives Medicare revenues (e.g.,
payroll taxes), income is credited by the Treasury to the appropriate trust fund in the form of special issue interest-bearing government securities.10 (Interest on these securities is also credited
to the trust fund.) The tax income exchanged for these securities then goes into the General Fund
of the Treasury and is indistinguishable from other cash in the General Fund; this cash may be
used for any government spending purpose. When payments for Medicare Part A services are
made, the payments are paid out of the General Fund of the Treasury and a corresponding amount of securities is deleted from (written off) the HI trust fund.
In years in which the HI trust fund spends less than it receives in income, the fund has a cash-flow
surplus. When this occurs, the HI trust fund securities exchanged for any income in excess of spending show up as assets on the trust fund’s financial accounting balance sheets and are
6 Prior to 1991, the upper limit on taxable earnings was the same as for Social Security. The Omnibus Budget
Reconciliation Act of 1990 (OBRA 90; P.L. 101-508) raised the limit in 1991 to $125,000. Under automatic indexing
provisions, the maximum was increased to $130,200 in 1992 and $135,000 in 1993. The Omnibus Budget
Reconciliation Act of 1993 (OBRA 93; P.L. 103-66) eliminated the upper limit entirely beginning in 1994.
7 For additional detail, see CRS Report R41128, Health-Related Revenue Provisions in the Patient Protection and
Affordable Care Act (ACA). 8 Since 1994, the HI trust fund has had an additional funding source; OBRA 93 increased the maximum amount of
Social Security benefits subject to income tax from 50% to 85% and provided that the additional revenues would be
credited to the HI trust fund.
9 There are about 200 federal trust funds. For additional information on how federal trust funds operate within the
context of the federal budget , see CRS Report R41328, Federal Trust Funds and the Budget.
10 Unlike marketable securities, special issues can be redeemed at any time at face value. Investment in special issues
gives the trust funds the same flexibility as holding cash.
Medicare: Insolvency Projections
Congressional Research Service 3
available to the system to meet future obligations. The trust fund surpluses are not reserved for
future Medicare benefits but are simply bookkeeping entries that indicate how much Medicare
has lent to the Treasury (or, alternatively, what is owed to Medicare by the Treasury). From a
unified budget perspective, these assets represent future budget obligations and are treated as liabilities.11
If, in a given year, the HI trust fund spends more than it receives in income, the fund has a cash-
flow deficit. In deficit years, Medicare can redeem any securities accumulated in previous years
(including interest). When the securities are redeemed, the government must raise the resources necessary to pay for the securities and the monies are transferred from the Treasury’s General
Fund to the HI trust fund. When the assets credited to the trust fund reach zero, the fund is
deemed insolvent. (See Appendix A for a discussion of recent and projected HI cash flows and for data on historical and projected HI operations through 2030.)
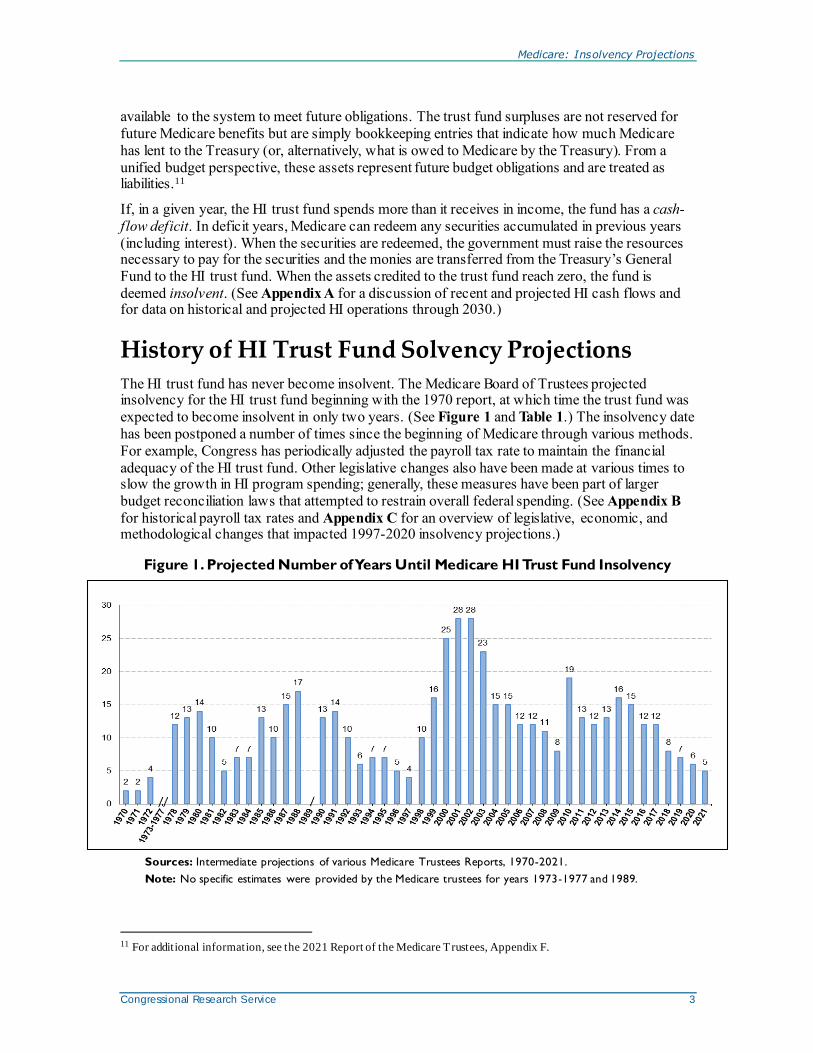
History of HI Trust Fund Solvency Projections The HI trust fund has never become insolvent. The Medicare Board of Trustees projected insolvency for the HI trust fund beginning with the 1970 report, at which time the trust fund was
expected to become insolvent in only two years. (See Figure 1 and Table 1.) The insolvency date
has been postponed a number of times since the beginning of Medicare through various methods.
For example, Congress has periodically adjusted the payroll tax rate to maintain the financial
adequacy of the HI trust fund. Other legislative changes also have been made at various times to slow the growth in HI program spending; generally, these measures have been part of larger
budget reconciliation laws that attempted to restrain overall federal spending. (See Appendix B
for historical payroll tax rates and Appendix C for an overview of legislative, economic, and methodological changes that impacted 1997-2020 insolvency projections.)
Figure 1. Projected Number of Years Until Medicare HI Trust Fund Insolvency
Sources: Intermediate projections of various Medicare Trustees Reports, 1970-2021.
Note: No specific estimates were provided by the Medicare trustees for years 1973-1977 and 1989.
11 For additional information, see the 2021 Report of the Medicare Trustees, Appendix F.
Medicare: Insolvency Projections
Congressional Research Service 4
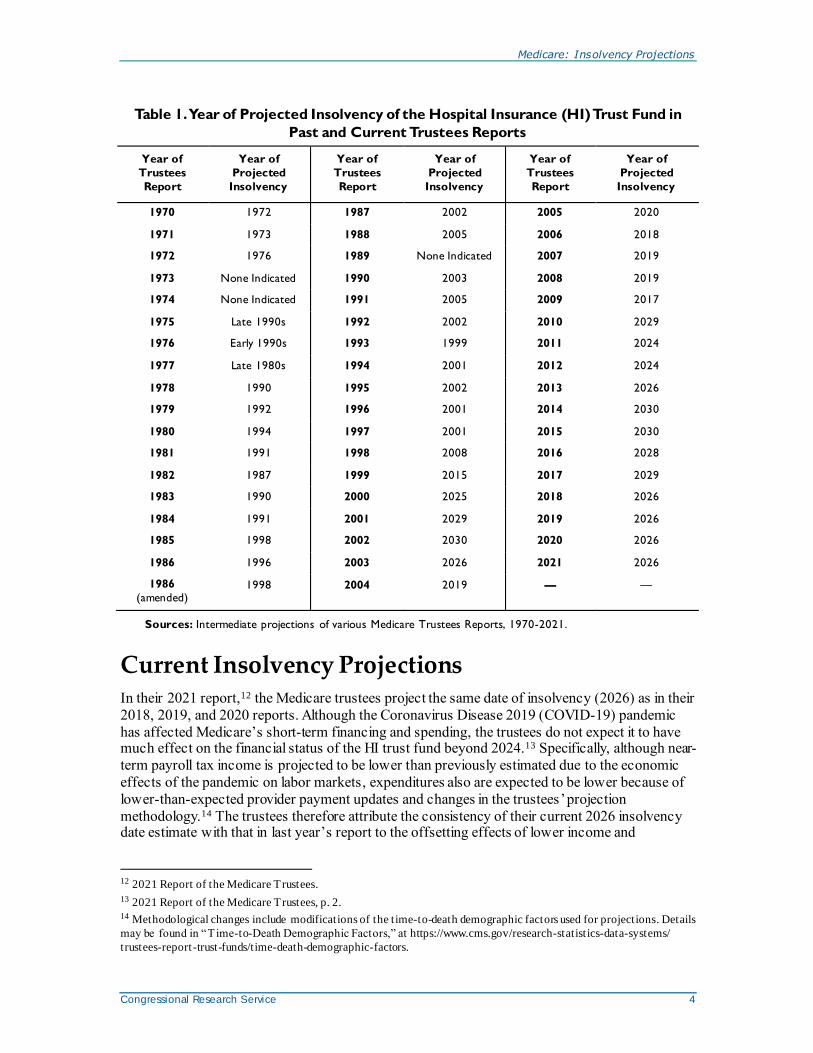
Table 1. Year of Projected Insolvency of the Hospital Insurance (HI) Trust Fund in
Past and Current Trustees Reports
Year of
Trustees
Report
Year of
Projected
Insolvency
Year of
Trustees
Report
Year of
Projected
Insolvency
Year of
Trustees
Report
Year of
Projected
Insolvency
1970 1972 1987 2002 2005 2020
1971 1973 1988 2005 2006 2018
1972 1976 1989 None Indicated 2007 2019
1973 None Indicated 1990 2003 2008 2019
1974 None Indicated 1991 2005 2009 2017
1975 Late 1990s 1992 2002 2010 2029
1976 Early 1990s 1993 1999 2011 2024
1977 Late 1980s 1994 2001 2012 2024
1978 1990 1995 2002 2013 2026
1979 1992 1996 2001 2014 2030
1980 1994 1997 2001 2015 2030
1981 1991 1998 2008 2016 2028
1982 1987 1999 2015 2017 2029
1983 1990 2000 2025 2018 2026
1984 1991 2001 2029 2019 2026
1985 1998 2002 2030 2020 2026
1986 1996 2003 2026 2021 2026
1986
(amended) 1998 2004 2019 — —
Sources: Intermediate projections of various Medicare Trustees Reports, 1970-2021.
Current Insolvency Projections In their 2021 report,12 the Medicare trustees project the same date of insolvency (2026) as in their
2018, 2019, and 2020 reports. Although the Coronavirus Disease 2019 (COVID-19) pandemic
has affected Medicare’s short-term financing and spending, the trustees do not expect it to have much effect on the financial status of the HI trust fund beyond 2024.13 Specifically, although near-
term payroll tax income is projected to be lower than previously estimated due to the economic
effects of the pandemic on labor markets, expenditures also are expected to be lower because of
lower-than-expected provider payment updates and changes in the trustees’ projection
methodology.14 The trustees therefore attribute the consistency of their current 2026 insolvency date estimate with that in last year’s report to the offsetting effects of lower income and
12 2021 Report of the Medicare Trustees.
13 2021 Report of the Medicare Trustees, p. 2. 14 Methodological changes include modifications of the time-to-death demographic factors used for projections. Details
may be found in “Time-to-Death Demographic Factors,” at https://www.cms.gov/research-statistics-data-systems/
trustees-report-trust-funds/time-death-demographic-factors.
Medicare: Insolvency Projections
Congressional Research Service 5
expenditures in the HI trust fund in the near term and their expectation that the pandemic’s effects will last only a few years.
Starting in 2008, expenditures in the HI trust fund exceeded income each year through 2015. Although the Medicare trustees reported small surpluses in 2016 and 2017, the HI trust fund
again experienced deficits in 2018 and 2019. (See Table A-1.) In 2020, the HI trust fund
experienced a larger deficit, primarily due to accelerated and advance payments made to health
care providers during the COVID-19 pandemic.15 The trustees projected these payments would be
repaid in 2021 and 2022, resulting in a smaller deficit in 2021 and a surplus in 2022. (HI spending in 2020 also was affected by the provision of COVID-19-related treatments, as well as by a
number of regulatory and statutory changes made during the COVID-19 public health
emergency;16 however, these increases were more than offset by a decline in spending on non-
COVID-related care compared with both actual spending in 2019 and expected spending in 2020.)
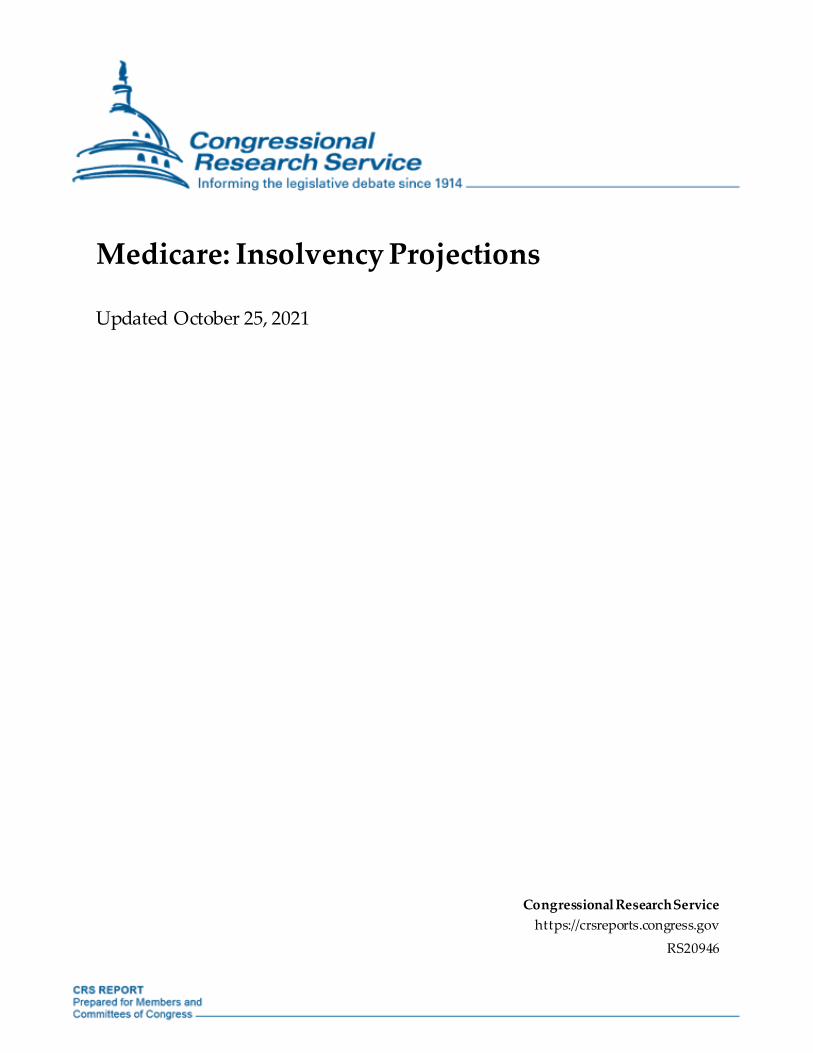
In all future years beyond 2022, expenditure growth is projected to continue to outpace growth in
income. Trust fund assets are expected to be used to make up the difference between income and expenditures until the assets are depleted in 2026. (See Figure 2.)
Each year, beginning in 2010, the Centers for Medicare & Medicaid Services (CMS) actuaries
have issued an illustrative alternative scenario that assumes certain ACA changes that reduce Part
A provider reimbursements would be phased out gradually.17 As the 2021 alternative scenario assumes this phaseout would begin in 2028 (i.e., after the projected 2026 HI insolvency date), this alternative analysis assumes the same 2026 date of insolvency.
15 Under this program, health care providers were able to receive accelerated or advance payments for services provided or to be provided in the future; in 2020, about $67.1 billion was paid out of the HI trust fund for such
payments. For additional information on this program, see CRS Report R46698, Medicare Accelerated and Advance
Payments and COVID-19: Frequently Asked Questions.
16 These include waiving the prior three-day inpatient stay requirement for skilled nursing facility services, increasing
payments for COVID-19-related hospital stays by 20%, and suspending the 2% provider payment reductions under
sequestration. For additional information, see CRS Report R46334, Selected Health Provisions in Title III of the
CARES Act (P.L. 116-136); CRS Report R45106, Medicare and Budget Sequestration ; and CMS, “COVID-19
Emergency Declaration Blanket Waivers for Health Care Providers,” at https://www.cms.gov/files/document/covid-19-
emergency-declaration-waivers.pdf. 17 Memo from John D. Shatto and M. Kent Clemens, “ Projected Medicare Expenditures Under an Illustrat ive Scenario
with Alternative Payment Updates to Medicare Providers,” August 31, 2021, at https://www.cms.gov/files/document/
illustrative-alternative-scenario-2021.pdf.

Medicare: Insolvency Projections
Congressional Research Service 6
Figure 2. HI Trust Fund Assets at Beginning of Year as a
Percentage of Annual Expenditures
(estimates from selected 2009-2021 Medicare Trustees Reports)
Sources: Data from the Boards of Trustees, Federal Hospital Insurance and Federal Supplementary Medical
Insurance Trust Funds, 2009 Annual Report of the Boards of Trustees of the Federal Hospital Insurance and the Federal
Supplementary Medical Insurance Trust Funds, Table II.E1, and Summaries of the applicable 2011 through 2021
Annual Reports of the Social Security and Medicare Boards of Trustees, Chart D (2011) and Chart E (201 3,
2015-2021).
Notes: The 2010 estimated insolvency date was 2029. The 2012 insolvency date estimate was the same as the
date projected in the 2011 report (2024). The 2014 insolvency date estimate was the same as that in the 2015
report (2030). The 2016 insolvency date was 2028, and the 2018 insolvency date was the same as projected in
the 2019 and 2021 reports (2026). The 2020 projections were almost identical to those in 2019; the 2020
projections did not, however, reflect potential effects of the COVID-19 pandemic on the Medicare program.
What Would Happen If the HI Trust Fund Became
Insolvent? The practical function of the HI trust fund is to permit the continued payment of bills in the event
of a temporary financial strain (e.g., lower income or higher costs than expected) without
requiring legislative action. As long as the HI trust fund has a balance (i.e., securities are credited to the fund), the Treasury Department is authorized to make payments for Medicare Part A
services. If the HI trust fund is not able to pay all current expenses out of current income and accumulated trust fund assets, the HI trust fund is considered to be insolvent.18
To date, the HI trust fund has never become insolvent. There are no provisions in the Social
Security Act that govern what would happen if insolvency were to occur. For example, the
program has no statutory authority to use general revenues to fund Part A services in the event of
18 From time to time, it is reported that Medicare is on the verge of “bankruptcy” ; however, in the context of federal trust funds, this term is not meaningful. It is true that a trust fund’s outgo can be greater than its income and that trust
funds can have a zero balance, but , unlike private businesses, the federal government is not in danger of “going out of
business” or having its assets seized by creditors. As noted, Congress has often taken actions to increase the trust fund’s
revenues or reduce its outgo when the Medicare HI trust fund has faced imminent insolvency.
Medicare: Insolvency Projections
Congressional Research Service 7
such a shortfall; transfers from the general fund of the Treasury could not be made for this purpose without new legislation.
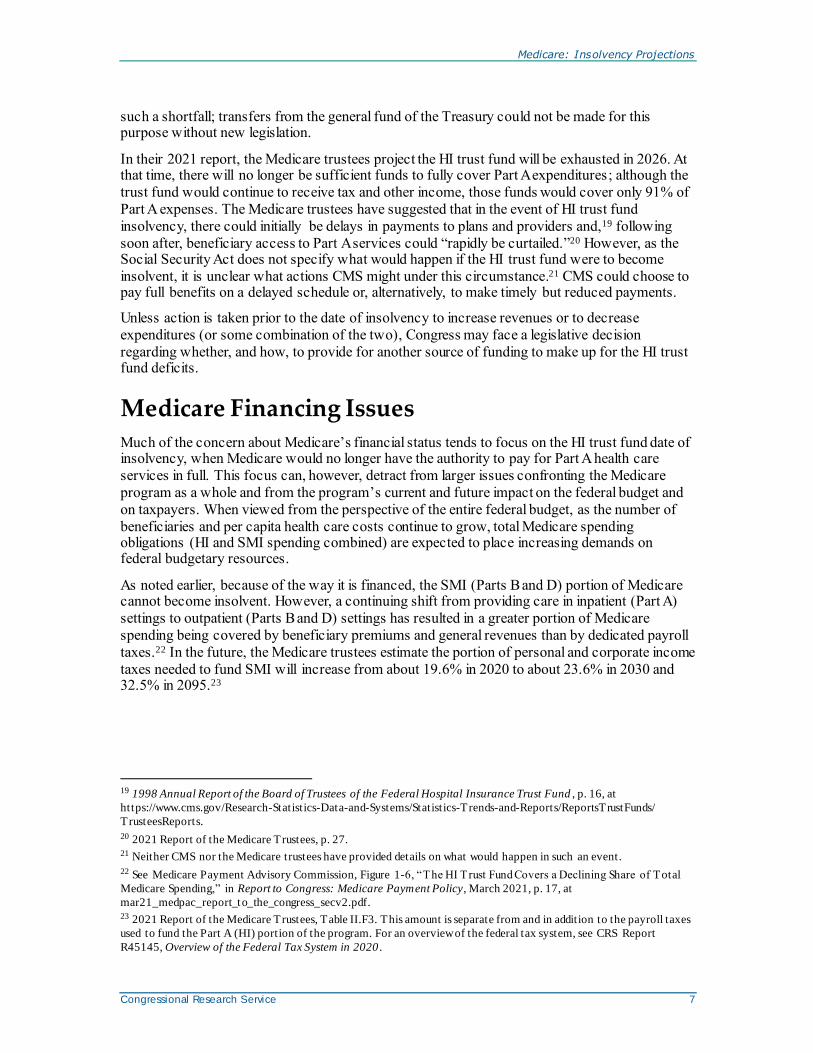
In their 2021 report, the Medicare trustees project the HI trust fund will be exhausted in 2026. At that time, there will no longer be sufficient funds to fully cover Part A expenditures; although the
trust fund would continue to receive tax and other income, those funds would cover only 91% of
Part A expenses. The Medicare trustees have suggested that in the event of HI trust fund
insolvency, there could initially be delays in payments to plans and providers and,19 following
soon after, beneficiary access to Part A services could “rapidly be curtailed.”20 However, as the Social Security Act does not specify what would happen if the HI trust fund were to become
insolvent, it is unclear what actions CMS might under this circumstance.21 CMS could choose to pay full benefits on a delayed schedule or, alternatively, to make timely but reduced payments.
Unless action is taken prior to the date of insolvency to increase revenues or to decrease
expenditures (or some combination of the two), Congress may face a legislative decision
regarding whether, and how, to provide for another source of funding to make up for the HI trust fund deficits.
Medicare Financing Issues Much of the concern about Medicare’s financial status tends to focus on the HI trust fund date of insolvency, when Medicare would no longer have the authority to pay for Part A health care
services in full. This focus can, however, detract from larger issues confronting the Medicare
program as a whole and from the program’s current and future impact on the federal budget and
on taxpayers. When viewed from the perspective of the entire federal budget, as the number of
beneficiaries and per capita health care costs continue to grow, total Medicare spending obligations (HI and SMI spending combined) are expected to place increasing demands on federal budgetary resources.
As noted earlier, because of the way it is financed, the SMI (Parts B and D) portion of Medicare cannot become insolvent. However, a continuing shift from providing care in inpatient (Part A)
settings to outpatient (Parts B and D) settings has resulted in a greater portion of Medicare
spending being covered by beneficiary premiums and general revenues than by dedicated payroll
taxes.22 In the future, the Medicare trustees estimate the portion of personal and corporate income
taxes needed to fund SMI will increase from about 19.6% in 2020 to about 23.6% in 2030 and 32.5% in 2095.23
19 1998 Annual Report of the Board of Trustees of the Federal Hospital Insurance Trust Fund , p. 16, at
https://www.cms.gov/Research-Statistics-Data-and-Systems/Statistics-Trends-and-Reports/ReportsTrustFunds/
TrusteesReports.
20 2021 Report of the Medicare Trustees, p. 27. 21 Neither CMS nor the Medicare trustees have provided details on what would happen in such an event.
22 See Medicare Payment Advisory Commission, Figure 1-6, “The HI Trust Fund Covers a Declining Share of Total
Medicare Spending,” in Report to Congress: Medicare Payment Policy, March 2021, p. 17, at
mar21_medpac_report_to_the_congress_secv2.pdf. 23 2021 Report of the Medicare Trustees, Table II.F3. This amount is separate from and in addition to the payroll taxes
used to fund the Part A (HI) portion of the program. For an overview of the federal tax system, see CRS Report
R45145, Overview of the Federal Tax System in 2020 .

Medicare: Insolvency Projections
Congressional Research Service 8
Appendix A. Operation of the Hospital Insurance
Trust Fund In 2004, Medicare Part A expenditures began to exceed tax income (from payroll taxes and from
the taxation of Social Security benefits). In 2008, expenditures began to exceed total income (tax income plus all other sources of revenue) and Hospital Insurance (HI) assets (the balance of the
HI trust fund at the beginning of the year) were used to meet the portion of expenditures that
exceeded income. Expenditures exceeded income every year from 2008 through 2015. In 2016
and 2017, the HI trust fund ran a small surplus, but in 2018 and 2019, the fund again experienced
deficits. In 2020, the HI trust fund experienced a larger-than-normal deficit because of accelerated
and advance payments made to providers during the COVID-19 pandemic. (See “Current
Insolvency Projections.”) The trustees project these payments will be repaid in 2021 and 2022, resulting in a smaller deficit in 2021 and a surplus in 2022. In all future years beyond 2022,
expenditure growth is expected to continue to outpace growth in income, and trust fund assets
will be used to make up the difference between income and expenditures until the assets are
depleted in 2026. At that time, the HI trust fund will no longer have sufficient funds to allow for
the full payment of Part A expenditures. (See Table A-1, below, for historical and projected Medicare financial data through 2030).
Table A-1. Operation of the Hospital Insurance Trust Fund, CY1970-CY2030
(in billions of dollars)
Year
Income Expenditures Trust Fund
Payroll
Taxes
Interest,
Transfers,
Othera Total
Benefit
Payments
Admin.
Expenses Total
Net
Change
from Prior
Year
Balance at
End of
Year
Historical Data
1970 $4.9 $1.2 $6.0 $5.1 $0.2 $5.3 $0.7 $3.2
1975 11.5 1.4 13.0 11.3 0.3 11.6 1.4 10.5
1980 23.8 2.1 26.1 25.1 0.5 25.6 0.5 13.7
1985 47.6 3.9 51.4 47.6 0.8 48.4 4.8 20.5
1990 72.0 8.4 80.4 66.2 0.8 67.0 13.4 98.9
1995 98.4 16.7 115.0 116.4 1.2 117.6 -2.6 130.3
2000 144.4 22.9 167.2 128.5 2.6 131.1 36.1 177.5
2005 171.4 28.0 199.4 180.0 2.9 182.9 16.4 285.8
2006 181.3 30.2 211.5 189.0 2.9 191.9 19.6 305.4
2007 191.9 31.9 223.7 200.2 2.9 203.1 20.7 326.0
2008 198.7 32.0 230.8 232.3 3.3 235.6 -4.7 321.3
2009 190.9 34.5 225.4 239.3 3.2 242.5 -17.1 304.2
2010 182.0 33.6 215.6 244.5 3.5 247.9 -32.3 271.9
2011 195.6 33.4 228.9 252.9 3.8 256.7 -27.7 244.2
2012 205.7 37.3 243.0 262.9 3.9 266.8 -23.8 220.4

Medicare: Insolvency Projections
Congressional Research Service 9
Year
Income Expenditures Trust Fund
Payroll
Taxes
Interest,
Transfers,
Othera Total
Benefit
Payments
Admin.
Expenses Total
Net
Change
from Prior
Year
Balance at
End of
Year
2013 220.8 30.3 251.1 261.9 4.3 266.2 -15.0 205.4
2014 227.4 33.9 261.2 264.9 4.5 269.3 -8.1 197.3
2015 241.1 34.3 275.4 273.4 5.5 278.9 -3.5 193.8
2016 253.5 37.3 290.8 280.5 4.9 285.4 5.4 199.1
2017 261.5 37.8 299.4 293.3 3.2 296.5 2.8 202.0
2018 268.3 38.3 306.6 303.0 5.2 308.2 -1.6 200.4
2019 285.1 37.4 322.5 322.8 5.4 328.3 -5.8 194.6
2020 303.3 38.4 341.7 397.7 4.5 402.2 -60.4 134.1
Intermediate Estimates
2021 298.5 35.5 334.1 340.6 4.7 345.3 -11.2 122.9
2022 330.7 41.9 372.6 359.1 4.6 363.7 8.9 131.8
2023 344.2 44.8 389.1 412.6 4.8 417.4 -28.3 103.5
2024 359.4 47.8 407.0 435.4 5.0 440.5 -33.5 70.0
2025 374.9 50.8 425.6 463.0 5.3 468.2 -42.6 27.4
2026 391.0 57.4 448.5 492.3 5.6 497.8 -49.3 -22.0
2027 407.0 64.6 471.6 523.6 5.8 529.4 -57.7 -79.7
2028 424.4 67.4 491.8 556.8 6.1 562.9 -71.2 -150.9
2029 442.3 69.7 512.0 591.2 6.4 597.5 -85.5 -236.4
2030 460.3 71.4 531.7 623.6 6.8 630.4 -98.6 -335.0
Source: Boards of Trustees, Federal Hospital Insurance and Federal Supplementary Medical Insurance Trust
Funds, 2021 Annual Report of the Boards of Trustees of the Federal Hospital Insurance and Federal Supplementary
Medical Insurance Trust Funds, August 31, 2021 (hereinafter, 2021 Medicare Trustees Report), Table III.B4.
Notes: Sums may not equal totals due to rounding. CY = calendar year.
a. Includes income from the taxation of Social Security benefits, Railroad Retirement account transfers,
premiums paid by voluntary enrollees, and interest.

Medicare: Insolvency Projections
Congressional Research Service 10
Appendix B. Historical Payroll Tax Rates
Table B-1. Tax Rates and Maximum Tax Bases
Calendar Year Maximum Tax Base
Tax Rate (percentage of taxable earnings)
Employees and
Employers, Each Self-Employed
1966 $6,600 0.35% 0.35%
1967 6,600 0.50 0.50
1968-1971 7,800 0.60 0.60
1972 9,000 0.60 0.60
1973 10,800 1.00 1.00
1974 13,200 0.90 0.90
1975 14,100 0.90 0.90
1976 15,300 0.90 0.90
1977 16,500 0.90 0.90
1978 17,700 1.00 1.00
1979 22,900 1.05 1.05
1980 25,900 1.05 1.05
1981 29,700 1.30 1.30
1982 32,400 1.30 1.30
1983 35,700 1.30 1.30
1984 37,800 1.30 2.60
1985 39,600 1.35 2.70
1986 42,000 1.45 2.90
1987 43,800 1.45 2.90
1988 45,000 1.45 2.90
1989 48,000 1.45 2.90
1990 51,300 1.45 2.90
1991 125,000 1.45 2.90
1992 130,200 1.45 2.90
1993 135,000 1.45 2.90
1994-2012 No limit 1.45 2.90
2013 and latera No limit 1.45 2.90
Source: 2021 Medicare Trustees Report, Table III.B2.
a. Beginning in 2013, workers pay an additional 0.9% of their earnings above $200,000 (those who file
individual tax returns) or $250,000 (those who file joint tax returns).
Medicare: Insolvency Projections
Congressional Research Service 11
Appendix C. Changes in HI Trust Fund Insolvency
Projections: 1997-2020 The HI trust fund has faced insolvency since its inception; however, it has never become
insolvent. The insolvency date has been postponed a number of times since the beginning of Medicare through various methods. For example, in early years of the program, the payroll tax
rate was adjusted periodically to maintain the financial adequacy of the HI trust fund. (See Appendix B for historical payroll tax rates.)
Other legislative changes have been made at various times to slow the growth in HI program
spending, primarily by adjusting Part C plan and Part A provider reimbursement methodologies.
Generally, these measures have been part of larger budget reconciliation laws that attempted to
restrain overall federal spending. For example, in early 1997, the Medicare trustees projected the
HI trust fund would become insolvent within four years—in 2001.24 However, following enactment of the Balanced Budget Act of 1997 (BBA 97; P.L. 105-33), significant improvements
were made in the insolvency projections over the next few years. The new projections reflected a
number of factors, including lower expected expenditures as a result of changes made by BBA 97
(primarily resulting from modifications in Medicare Part C payments and the establishment of
prospective payment systems for certain Part A providers);25 continued efforts to combat fraud and abuse; and strong economic growth, which was expected to generate more revenues to the trust fund from payroll taxes.
There were concerns, however, that the savings achieved through the enactment of BBA 97 were
greater than intended at the time of enactment and had unintended consequences for health care
providers. As a result of these concerns, Congress enacted two measures: the Balanced Budget
Refinement Act of 1999 (BBRA 99; P.L. 106-113) and the Medicare, Medicaid, and SCHIP
Benefits Improvement and Protection Act of 2000 (BIPA 2000; P.L. 106-554). These measures
were designed to reverse some of the BBA 97 spending reductions. Despite enactment of BBRA 99 and BIPA 2000, which increased program spending, the 2001 and 2002 Medicare Trustees
Reports continued to delay the projected insolvency date. These improvements in solvency
projections reflected both stronger-than-expected economic growth and lower-than-expected
program costs due to lower projected enrollment in Medicare Part C, heightened antifraud and abuse initiatives, and lower-than-expected increases in health care costs.
The 2003 report projections, however, shifted direction. The projected insolvency date was 2026,
four years earlier than the 2030 date projected in the 2002 report. The revision was due to lower-
than-expected HI-taxable payroll and higher-than-expected hospital expenditures.26 In the next year, the 2004 report projected that the HI trust fund would become insolvent in 2019, seven
years earlier than projected in 2003. A number of factors contributed to the revision of the
projected insolvency date, including slow wage growth (on which payroll taxes are based) and
faster growth in inpatient hospital benefits. In addition, the enactment of the Medicare
Prescription Drug, Improvement, and Modernization Act of 2003 (MMA; P.L. 108-173) added
24 Medicare Trustees reports may be found on the CMS webpage, “Trustees Report & Trust Funds,” at
https://www.cms.gov/Research-Statistics-Data-and-Systems/Statistics-Trends-and-Reports/ReportsTrustFunds.
25 The Balanced Budget Act of 1997 (BBA 97; P.L. 105-33) established the Medicare + Choice program under Part C.
Medicare Part C was changed to Medicare Advantage by the Medicare Prescription Drug, Improvement, and
Modernization Act of 2003 (MMA; P.L. 108-173).
26 The lower projection of payroll taxes was primarily due to a revision by the Bureau of Economic Analysis in national
wages and salaries for 2001 and 2002.

Medicare: Insolvency Projections
Congressional Research Service 12
significantly to HI costs, primarily through higher payments to rural hospitals and to private plans under the MA program.27
The 2005 Medicare Trustees Report projected that the HI trust fund would become insolvent one year later than projected in 2004, in 2020. The revision reflected slightly higher income and
slightly lower costs in 2004 than previously estimated. The 2006 report moved the insolvency
date forward again, to 2018. The revision reflected expectations of slightly higher costs and
increased utilization of HI services. Both the 2007 and 2008 reports projected a 2019 insolvency
date, although the 2008 report indicated that insolvency would occur earlier in the year. The 2009 report moved the insolvency date forward to 2017, due primarily to lower payroll tax income resulting from the December 2007 to June 2009 economic recession (the “Great Recession”).
The 2010 Medicare Trustees Report, issued subsequent to the enactment of the ACA, estimated that the combination of lower Part A costs and higher payroll-tax revenues expected to result
from the ACA would postpone depletion of the HI trust fund’s assets until 2029, 12 years later
than the date projected in the 2009 report.28 However, the 2011 report projected that the HI trust
fund would become insolvent in 2024, five years earlier than projected in the 2010 report. The
worsening financial outlook was primarily due to lower-than-expected payroll taxes stemming from higher-than-expected unemployment, and slow wage growth in 2010 caused by the
continuing effects of the 2007-2009 economic recession. The 2012 Medicare Trustees Report
projected the same 2024 insolvency date. Although income from payroll taxes was expected to
increase at a faster rate than expenditures through 2018 due to the projected economic recovery,
the application of an additional 0.9% HI payroll tax for high-income workers beginning in 2013,29
and the 2% reduction in spending required by the Budget Control Act of 2011 (BCA; P.L. 112-25) from 2013 through 2021,30 income was still expected to be insufficient to fully cover projected HI expenses during that period.
In their 2013 report, the Medicare trustees projected a somewhat better short-term outlook for the
HI trust fund. They moved the insolvency date two years later than their 2012 estimate, to 2026.
The improved projections were primarily due to lower-than-expected expenditures in 2012, the
base year used to project future expenditures, and a larger-than-estimated impact of ACA
payment methodology changes on MA costs.31 In their 2014 report, the Medicare trustees
reported some improvement in Medicare’s financial outlook and therefore moved the insolvency date four years later than their 2013 estimate, to 2030. This improvement was mainly due to
lower expected utilization of and/or spending for certain Part A services, including inpatient
hospital, skilled nursing, and home health care. The 2015 Trustees Report projected a similar short-term financial outlook and maintained the 2030 insolvency date estimate.
The 2016 Medicare Trustees Report projected a slightly worsened short-term outlook for the HI
trust fund and therefore moved the insolvency date two years earlier than their 2015 estimate, to
27 The Part D outpatient prescription drug program, which was created by the MMA, is funded under SMI; the
increased expenditures associated with this new benefit therefore had lit t le impact on projections of Medicare (HI)
solvency.
28 The expected reductions were primarily due to productivity adjustments to Part A provider payment updates and
reduced payments to Medicare Advantage plans. 29 The high-income payroll tax was added by the ACA. See “ Medicare Hospital Insurance Financing.”
30 Subsequent legislation extended the reductions for an additional nine years, through FY2030. For additional
information on the Budget Control Act of 2011 (BCA; P.L. 112-25) and required Medicare spending reductions, see
archived CRS Report R41965, The Budget Control Act of 2011, CRS Report R40425, Medicare Primer, and CRS
Report R45106, Medicare and Budget Sequestration . 31 See archived CRS Report R41196, Medicare Provisions in the Patient Protection and Affordable Care Act
(PPACA): Summary and Timeline.
Medicare: Insolvency Projections
Congressional Research Service 13
2028. This change was primarily due to lower-than-expected payroll-tax income in 2015 and to
assumptions of a slowing in real wage growth. In their 2017 report, the Medicare trustees
projected a slightly improved short-term outlook for the HI trust fund and therefore moved the
insolvency date one year later than their 2016 estimate, to 2029. This change was primarily due to
lower-than-expected HI expenditures in 2016 (which reduced the projection base) and lower projected future utilization of inpatient hospital services.
The 2018 Medicare Trustees Report projected a worsened short-term outlook for the HI trust
fund, and therefore moved the insolvency date three years earlier than their 2017 estimate, to 2026 (from 2029 in the 2017 report). This shift was primarily due to changes in estimates
affecting HI revenues, including a reduction in projected income from payroll taxes due to lower-
than-expected wages in 2017 and projections of slower gross domestic product growth, as well as
expectations of reduced income from taxes on Social Security benefits as a result of 2017 legislation that lowered individual income taxes through 2025.
In their 2019 report, the Medicare trustees projected the same date of insolvency (2026) as in
their 2018 report. However, HI income was projected to be lower than estimated in the 2018
report due to lower-than-expected payroll tax revenue and reduced income from the taxation of Social Security benefits. Additionally, although expenditures were expected to be slightly higher
than the prior year’s estimates because of higher-than-projected 2018 HI expenditures and higher
projected updates to provider payments, these updated spending estimates were mostly offset by an expectation of lower future utilization of skilled nursing facility services.
In their 2020 report,32 the Medicare trustees again projected the same date of insolvency (2026) as
in their 2018 and 2019 reports. Although HI income was projected to be lower than estimated in
the 2019 report due to expected lower payroll tax revenue, expenditures also were expected to be
lower than the 2019 estimates, because of lower-than-expected 2019 HI expenditures, lower-than-expected provider payment updates, and a change in the trustees’ projection methodology. Higher
projected spending growth for Medicare Advantage was expected to partially offset the projected
decrease in HI expenditures. (See “Current Insolvency Projections” for the 2021 Medicare Trustees Report projections.)
Author Information
Patricia A. Davis Specialist in Health Care Financing
Acknowledgments
Isaac A. Nicchitta, CRS Research Assistant, contributed to this report update.
32 The 2020 Report of the Medicare Trustees, April 22, 2020, did not reflect potential economic and healthcare impacts
of the COVID-19 pandemic on the Medicare program.
Medicare: Insolvency Projections
Congressional Research Service RS20946 · VERSION 29 · UPDATED 14
Disclaimer
This document was prepared by the Congressional Research Service (CRS). CRS serves as nonpartisan shared staff to congressional committees and Members of Congress. It operates solely at the behest of and
under the direction of Congress. Information in a CRS Report should not be relied upon for purposes other than public understanding of information that has been provided by CRS to Members of Congress in
connection with CRS’s institutional role. CRS Reports, as a work of the United States Government, are not subject to copyright protection in the United States. Any CRS Report may be reproduced and distributed in its entirety without permission from CRS. However, as a CRS Report may include copyrighted images or
material from a third party, you may need to obtain the permission of the copyright holder if you wish to copy or otherwise use copyrighted material.