sustainability statements Risk management and control · capital and liquidity to avoid insolvency....
23
33 Overview Ensuring our sustainability Annual financial statements Ensuring our sustainability 32 Stanbic Bank Uganda Limited Annual report for the year ended 31 December 2013 Stanbic Bank Uganda Limited Annual report for the year ended 31 December 2013 Stanbic Bank Uganda Limited Annual report for the year ended 31 December 2013 Sustainability report 32 Stanbic Bank Uganda Limited Annual report for the year ended 31 December 2013 Risk management and control The bank’s board of directors has ultimate responsibility for risk management, which includes setting the tone at the top, setting the risk appetite and ensuring that the bank’s risk management framework and internal controls are effectively implemented. It has delegated its risk-related responsibilities primarily to three committees, the risk management committee, the audit committee and the credit committee, with each committee focusing on different aspects of risk management. Basel II The Basel II Capital Adequacy Framework (Basel II) as defined by the Bank for International Settlements (BIS) under three pillars, Pillar I; Minimum capital requirements, Pillar II; Supervisory review, Pillar III; Market disclosure, aims at encouraging banks, through minimum capital requirements, to improve their risk management process mainly across credit risk, market risk and operational risk disciplines. Stanbic Bank Uganda Limited has over the years taken appropriate steps to align its strategic and operational goals and objectives as well as its internal systems and processes to Basel II best practices as appropriate. Risk management in banking activities The management of all significant risks to Stanbic Bank Uganda Limited and the general banking industry in Uganda are discussed below. Credit risk The bank has set in place comprehensive resources, expertise and controls to ensure efficient and effective management of credit risk, specifically in the banking activities described below. • In lending transactions; credit risk arises through non-performance by a counter party for credit facilities utilized. Such facilities are typically loans and advances, including the advancement of securities and contracts to support customer obligations (such as letters of credit and performance guarantees). • In trading activities; credit risk arises due to non-performance by a counter party for payments linked to trading related financial obligations. Approach to managing credit risk Credit risk is managed by means of a governance structure with clearly defined mandates and delegated authorities and also the use of relevant credit assessment tools in evaluation of new and outstanding facilities for the customers under the respective business units discussed below. In prior years, Stanbic Bank undertook a number of initiatives in this regard, including: • Partnering with our Corporate and Investment Banking (CIB) customers to provide health and maternity support to residents in Kumi, Mpigi, Kasese, Mityana and Kalangala districts. • Donation of solar power equipment to children’s wards, women’s wards and maternity wards of hospitals in Lira and Kitgum, as well as to health centres and hospitals in Bundibudyo, Kamwenge and Kisoro districts. • Sponsoring financial literacy seminars targeting secondary schools in Kampala. • Partnering with the International School of Uganda Charity Run to support community schools. In 2013, we continued to invest in communities, creating a stronger framework and structure to drive and manage our investments in the social sector. We invested in over 12 local initiatives and transformed the lives of over 18,000 underprivileged people across the country. All this was in a bid to contribute toward social development and alleviate poverty sustainably by working in cooperation with community organizations and channeling investment into our four key focus areas i.e. Education, Entrepreneurial Skills Development, Health and Environmental Management. SBUL invested over UShs 500 million across our four focus areas as shown below. The effective management of risk is critical to the earnings and balance sheet of Stanbic Bank Uganda Limited where a culture that encourages sound economic decision-making, which adequately balances out risk and reward, is embedded in all our banking activities. A description of Stanbic Bank Uganda Limited’s approach to risk management covering a summary of the overall methodology and the management of individual types of risks is as expounded below. The bank’s risk management framework is based on a well-established governance process, with different lines of defence and relies both on individual responsibility and collective oversight, supported by a comprehensive reporting and escalation process. This approach balances stringent corporate oversight with independent risk management structures within the business units. The bank has in place governance standards for all major risk types. All the standards are applied consistently across the bank and are approved by the board. These standards form an integral part of the bank’s governance infrastructure, reflecting the expectations and requirements of the board in respect of key areas of control across the group. The standards ensure alignment and consistency in the manner that major risk types across the bank are identified, measured, managed, controlled, and reported. The bank’s internal audit function independently audits the adequacy and effectiveness of the bank’s risk management framework. The Head of Internal Audit reports and provides independent assurance on the same to the Audit Committee of the Board and has unrestricted access to the Chief Executive, the Chairman of the Audit Committee and the Chairman of the Board. Risk appetite and tolerance Risk appetite is the quantum of risk the bank is willing to accept in the normal course of business in pursuit of its strategic and financial objectives. It is normal business practice that even risks taken within “appetite” may give rise to expected losses; however these are adequately covered by expected earnings through provisioning. Risk tolerance is an assessment of the maximum risk the bank is willing to sustain for short periods of time. It emphasises the “downside” of the risk distribution, and the bank’s capacity to survive unexpected losses. The capacity to take unexpected losses depends on having sufficient capital and liquidity to avoid insolvency. Risk tolerance typically provides a useful upper boundary for the bank’s risk appetite. Education Entrepren eurial Skills Development Health Water/ Environment 2013 Community Investment ('000) 85 000 150 000 112 000 155 000 2012 Community Investment ('000) 119 000 50 000 30 500 7 500 No. Beneficiaries 2013 400 2 200 4 296 11 200 No. Beneficiaries 2012 1 180 2000 1500 5000 12000 10000 8000 6000 4000 2000 0 0 20 000 40 000 60 000 80 000 100 000 120 000 140 000 160 000 180 000 Ushs’000 CSI activity - Beneficiaries and costs by intervention 2013 and 2012 compared Internal control framework 1 st line of defence 2 nd line of defence Financial Crime Control 3 rd line of defence Regulators ALL staff Exco Board Internal audit External audit Overview of the bank’s risk management framework. Compliance Risk Credit Risk Market Risk Operational risk Liquidity Risk
Transcript of sustainability statements Risk management and control · capital and liquidity to avoid insolvency....
33
Overview Ensuring our sustainability
Annual financial statements
Ensuring oursustainability
32 Stanbic Bank Uganda Limited Annual report for the year ended 31 December 2013 Stanbic Bank Uganda Limited Annual report for the year ended 31 December 2013Stanbic Bank Uganda Limited Annual report for the year ended 31 December 2013
Sustainability report
32 Stanbic Bank Uganda Limited Annual report for the year ended 31 December 2013
Risk management and control
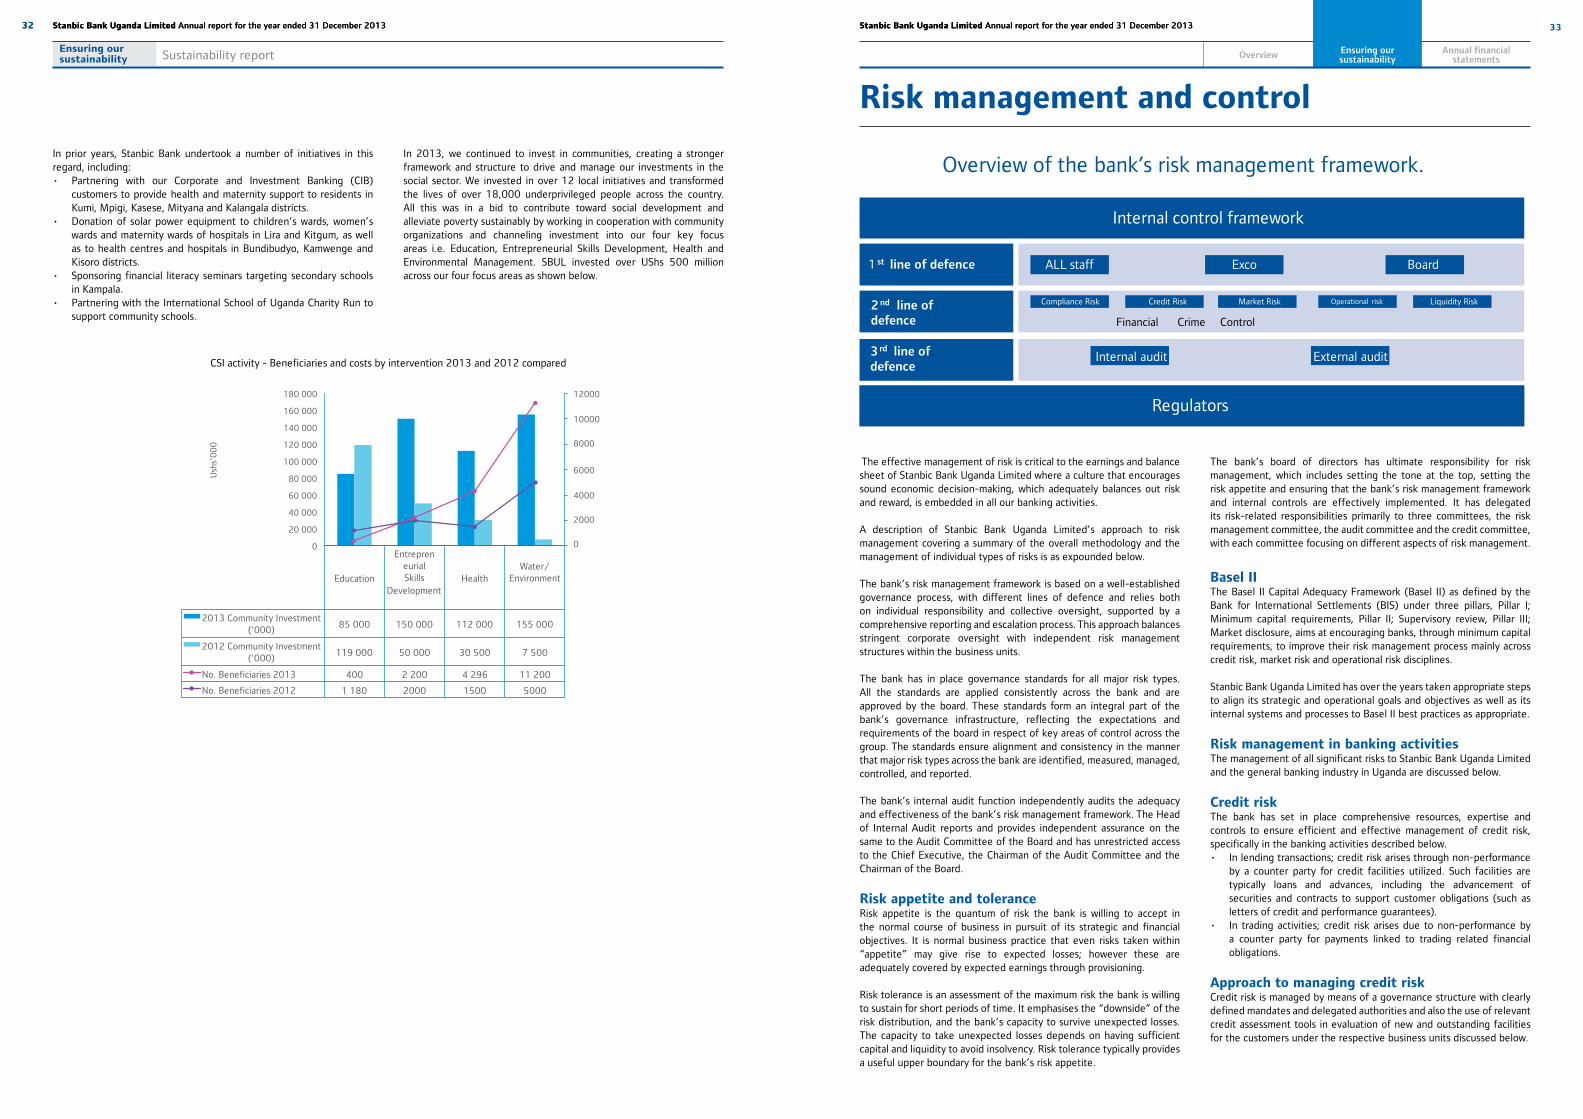
The bank’s board of directors has ultimate responsibility for risk management, which includes setting the tone at the top, setting the risk appetite and ensuring that the bank’s risk management framework and internal controls are effectively implemented. It has delegated its risk-related responsibilities primarily to three committees, the risk management committee, the audit committee and the credit committee, with each committee focusing on different aspects of risk management.
Basel IIThe Basel II Capital Adequacy Framework (Basel II) as defined by the Bank for International Settlements (BIS) under three pillars, Pillar I; Minimum capital requirements, Pillar II; Supervisory review, Pillar III; Market disclosure, aims at encouraging banks, through minimum capital requirements, to improve their risk management process mainly across credit risk, market risk and operational risk disciplines.
Stanbic Bank Uganda Limited has over the years taken appropriate steps to align its strategic and operational goals and objectives as well as its internal systems and processes to Basel II best practices as appropriate.
Risk management in banking activitiesThe management of all significant risks to Stanbic Bank Uganda Limited and the general banking industry in Uganda are discussed below.
Credit riskThe bank has set in place comprehensive resources, expertise and controls to ensure efficient and effective management of credit risk, specifically in the banking activities described below.• In lending transactions; credit risk arises through non-performance
by a counter party for credit facilities utilized. Such facilities are typically loans and advances, including the advancement of securities and contracts to support customer obligations (such as letters of credit and performance guarantees).
• In trading activities; credit risk arises due to non-performance by a counter party for payments linked to trading related financial obligations.
Approach to managing credit riskCredit risk is managed by means of a governance structure with clearly defined mandates and delegated authorities and also the use of relevant credit assessment tools in evaluation of new and outstanding facilities for the customers under the respective business units discussed below.
In prior years, Stanbic Bank undertook a number of initiatives in this regard, including:• Partnering with our Corporate and Investment Banking (CIB)
customers to provide health and maternity support to residents in Kumi, Mpigi, Kasese, Mityana and Kalangala districts.
• Donation of solar power equipment to children’s wards, women’s wards and maternity wards of hospitals in Lira and Kitgum, as well as to health centres and hospitals in Bundibudyo, Kamwenge and Kisoro districts.
• Sponsoring financial literacy seminars targeting secondary schools in Kampala.
• Partnering with the International School of Uganda Charity Run to support community schools.
In 2013, we continued to invest in communities, creating a stronger framework and structure to drive and manage our investments in the social sector. We invested in over 12 local initiatives and transformed the lives of over 18,000 underprivileged people across the country. All this was in a bid to contribute toward social development and alleviate poverty sustainably by working in cooperation with community organizations and channeling investment into our four key focus areas i.e. Education, Entrepreneurial Skills Development, Health and Environmental Management. SBUL invested over UShs 500 million across our four focus areas as shown below.
The effective management of risk is critical to the earnings and balance sheet of Stanbic Bank Uganda Limited where a culture that encourages sound economic decision-making, which adequately balances out risk and reward, is embedded in all our banking activities.
A description of Stanbic Bank Uganda Limited’s approach to risk management covering a summary of the overall methodology and the management of individual types of risks is as expounded below.
The bank’s risk management framework is based on a well-established governance process, with different lines of defence and relies both on individual responsibility and collective oversight, supported by a comprehensive reporting and escalation process. This approach balances stringent corporate oversight with independent risk management structures within the business units.
The bank has in place governance standards for all major risk types. All the standards are applied consistently across the bank and are approved by the board. These standards form an integral part of the bank’s governance infrastructure, reflecting the expectations and requirements of the board in respect of key areas of control across the group. The standards ensure alignment and consistency in the manner that major risk types across the bank are identified, measured, managed, controlled, and reported.
The bank’s internal audit function independently audits the adequacy and effectiveness of the bank’s risk management framework. The Head of Internal Audit reports and provides independent assurance on the same to the Audit Committee of the Board and has unrestricted access to the Chief Executive, the Chairman of the Audit Committee and the Chairman of the Board.
Risk appetite and toleranceRisk appetite is the quantum of risk the bank is willing to accept in the normal course of business in pursuit of its strategic and financial objectives. It is normal business practice that even risks taken within “appetite” may give rise to expected losses; however these are adequately covered by expected earnings through provisioning.
Risk tolerance is an assessment of the maximum risk the bank is willing to sustain for short periods of time. It emphasises the “downside” of the risk distribution, and the bank’s capacity to survive unexpected losses. The capacity to take unexpected losses depends on having sufficient capital and liquidity to avoid insolvency. Risk tolerance typically provides a useful upper boundary for the bank’s risk appetite.
!
Education
Entrepreneurial Skills
Development Health
Water/ Environment
2013 Community Investment ('000)
85 000 150 000 112 000 155 000
2012 Community Investment ('000)
119 000 50 000 30 500 7 500
No. Beneficiaries 2013 400 2 200 4 296 11 200
No. Beneficiaries 2012 1 180 2000 1500 5000
12000
10000
8000
6000
4000
2000
00
20 000
40 000
60 000
80 000
100 000
120 000
140 000
160 000
180 000
Ush
s’0
00
CSI activity - Beneficiaries and costs by intervention 2013 and 2012 compared
Internal control framework
1 st line of defence
2nd line of defence Financial Crime Control
3rd line of defence
Regulators
ALL staff Exco Board
Internal audit External audit
Overview of the bank’s risk management framework.
Compliance Risk Credit Risk Market Risk Operational risk Liquidity Risk

35
Overview Ensuring our sustainability
Annual financial statements
Ensuring oursustainability
34 Stanbic Bank Uganda Limited Annual report for the year ended 31 December 2013 Stanbic Bank Uganda Limited Annual report for the year ended 31 December 2013
Risk management and control
34 Stanbic Bank Uganda Limited Annual report for the year ended 31 December 2013 Stanbic Bank Uganda Limited Annual report for the year ended 31 December 2013
Corporate and Investment Banking (CIB)The use of risk rating models combined with an in depth knowledge and understanding of each customer is essential in assessing the credit risk of each CIB counter party. A consistent credit rating framework is in place to assist the bank in making credit decisions on new commitments and in managing the portfolio of existing exposures. The probabilities of default under these models are an important component of the formal credit assessment process of new and existing business. The validation and ongoing enhancement of these models is a continuous focus area to ensure that the tools used in these credit assessments remain relevant and adequate.
Personal and Business Banking (PBB) The nature of the products and strength of historical data is a fundamental dependence under credit risk management for the personal business and private banking customers. A diverse range of performance analysis techniques are applied across product sets and potential credits in recognition of the differing asset, maturity and individual or business profiles.
Rehabilitation and recovery forms a key component of the credit cycle. All credit portfolios are closely monitored on a regular basis to evaluate the level of risk assumed against expected risk levels. This role is competently executed by a fully fledged rehabilitation and recovery unit within the credit function.
Liquidity riskLiquidity risk arises if the bank has insufficient funds or marketable assets available to fulfil their current or future cash flow obligations at the least possible cost.
The nature of banking and trading activities results in a continuous exposure to liquidity risk. The bank’s liquidity risk management framework however is designed to measure and manage the liquidity position at various levels to ensure that all payment obligations can be met under both normal and stressed conditions without incurring unbearable costs.
Approach to managing liquidity riskThe following elements are incorporated as part of a cohesive liquidity management process.• Maintaining a structurally sound balance sheet; • Foreign currency liquidity management; • Ensuring the availability of sufficient contingency liquidity; • Preserving a diversified funding base; • Undertaking regular liquidity scenario/stress testing;• Maintaining adequate liquidity contingency plans; and• Short term and long term cash flow management.
The cumulative impact of the above elements is monitored on a monthly basis by the bank’s Asset and Liability Committee (ALCO) and the process is underpinned by a system of extensive internal and external controls. The latter includes the application of purpose built techniques, documented processes and procedures, independent oversight by risk management and regular independent reviews and evaluations of the effectiveness of the system.
Active liquidity and funding management is an integrated effort across a number of functional areas. Short term cash flow projections are used to plan for and meet the day-to-day requirements of the business, including adherence to prudential and ALCO requirements. Long term funding needs are derived from the projected balance sheet structures and positions are regularly updated to ensure the bank’s adherence to all funding regulations.
Liquidity contingency plans are in place to, as far as possible, protect stakeholder interests and maintain market confidence in order to ensure
a positive outcome in the event of a liquidity crisis. The plans incorporate an extensive early warning indicators methodology supported by a clear and decisive crisis response strategy. These plans are reviewed periodically for relevance and reliability.
Market riskMarket risk arises from a decrease in the market value of a portfolio of financial instruments caused by an adverse move in market variables such as equity, bond and commodity prices, currency exchange rates, interest rates and credit spreads, as well as implied volatilities on all of the above. Market risk exposures as a result of trading activities are contained within the bank’s Corporate and Investment Banking trading operations. The board grants authority to take on market risk exposure to the ALCO. The bank manages market risk through a range of market risk limits and triggers. It uses a suite of risk measurement methodologies and tools to establish limits, including Value at Risk (VaR), Securities revaluation models (Mark to Market), PV01(Present value of the nominal at the adverse shock of interest rates by one basis point), stress testing, loss triggers and other basic risk management measures and internal controls.
A clear segregation of duties as well as independent reporting lines exists between the bank’s Global Markets, Global Markets Operations and Market risk functions.
Approach to managing market riskMarket risk exposure principally involves the management of the potential adverse effect of interest/ FX rate movements the economic value of equity. This structural interest rate risk is caused by the differing re-pricing characteristics of banking assets and liabilities. The governance framework adopted for the management of structural interest rate risk and FX volatility mirrors that of liquidity risk management in terms of committee structures and the setting of standards, policies and limits. This is also true for the monitoring process and internal controls.
Operational riskOperational risk is the potential for loss resulting from the inadequacy of, or a failure in internal processes, people, systems or external events.
The bank recognizes the significance of operational risk, and the fact that it is inherent in all business units. The bank’s operational risk governance standard codifies the core governing principles for operational risk management and defines a common framework with the basic components for the identification, assessment, management, monitoring and reporting of operational risk.
This common framework defines the minimum requirements whilst ensuring an element of flexibility for each business unit’s particular operating environments. This framework is further supported by a set of comprehensive operational risk management policies.
Approach to managing operational riskThe bank’s approach to managing operational risk has been the adoption of practices that are fit for increasing the efficiency and effectiveness of the bank’s resources, minimizing losses and effectively utilizing opportunities. This approach is aligned to the bank’s enterprise wide risk management framework and adopts sound risk management practices recommended by the Basel II Accord’s sound practices for the management and supervision of operational risk and the Bank of Uganda risk management guidelines among others.
The bank’s independent operational risk management function performs control and oversight roles, over the implementation of a set of appropriate policies, governance standards and tools. The tools include:
• A centralized operational loss database providing management reports used to identify improvements to processes and controls arising from loss trends;
• Risk and control self assessments through which existing and potential future risks and their related controls are identified and assessed; and
• Key risk indicators which measure specific factors to provide an early warning to proactively address potential exposures.
• An escalation matrix that supports the identification, assessment, quantification and timely escalation of risk incidents to management for appropriate decision making.
• A robust business continuity management framework, with disaster recovery plans to ensure that the bank appropriately manages the adverse impact from unforeseeable disasters to the business.
• A fully fledged financial crime control unit charged with forensic investigations, fraud prevention and physical security. The Unit is mandated by the audit committee, and is responsible for supporting the implementation of the bank’s fraud risk management framework.
• An independent operational risk function, tasked with the effective implementation of the Bank’s operational risk management framework. Mandated by the board risk management committee, the strategic approach focuses on operational risk identification, assessment, quantification and control.
The bank further maintains a comprehensive insurance programme to cover residual risk as a result of losses from fraud, theft, professional liability claims, and damage to physical assets while additionally operating comprehensive internal audit and risk assurance reviews on all operational aspects of the Bank.
Financial crime controlAn independent Financial Crime Control unit within the risk management function, is charged with forensic investigations, fraud prevention as well as the overall management of the physical security risk of the bank. This function ensures the effective implementation of the bank’s risk management framework through the appropriate management of fraud risk.
Business continuity managementBusiness Continuity Management (BCM) is defined as a holistic management process that identifies potential impacts that threaten an organization, provides a framework for building resilience and the effective response that safeguards the interests of its key stakeholders, reputation, brand and value creating activities.
Business continuity ensures timely availability of all key processes which are required to support essential activities and customer services in the event of a disruption of business.
The Bank periodically and as appropriate tests its business continuity plans, IT Disaster recovery plan, conducts evacuation drills and simulation exercises across all its points of representation with a view of validating the adequacy, relevance, reliability and resilience of its business continuity management framework.
Compliance riskCompliance is an independent core risk management function, with unrestricted access to the Board Audit Committee, the Chief Executive and the chairman of the board. The bank is subject to extensive supervisory and regulatory regimes. Executive management implements the bank’s compliance risk framework, by ensuring that the bank conducts its business within the set legal and regulatory requirements and guidelines.
The bank operates a centralized compliance risk management structure run by a fully equipped specialized unit that grants oversight on all
compliance related matters. The Compliance unit provides leadership and guidance on compliance with Anti-money laundering, terrorist financing, occupational health and safety and any other emerging legislative developments. The unit also, provides training and awareness on regulatory developments.
Money laundering controlLegislation pertaining to money laundering and terrorist financing control imposes significant record keeping and customer identification requirements on financial institutions, as well as obligations to detect, prevent and report money laundering and terrorist financing incidents to Bank of Uganda. The bank continues to strengthen its anti-money laundering and terrorist financing measures as the regulatory environment becomes more dynamic.
Occupational health and safety The health and safety of employees, clients and other stakeholders continues to be a priority. The bank seeks to effectively identify, reduce or control accidents or injuries to employees, contractors and clients. The bank continues to focus on ensuring compliance with current legal and regulatory framework and ensuring that occupational health and safety procedures are closely linked to the operational needs of the business.
Taxation riskTaxation risk is the possibility of suffering loss, financial or otherwise, as a result of the misapplication of tax systems (whether in legislative systems, rulings or practices) applicable to the entire spectrum of taxes and other fiscal obligations to which the bank is subject.
The bank fulfills its responsibilities under tax law in relation to compliance, planning or client service matters. Tax law includes all responsibilities which the bank may have in relation to company taxes, personal taxes, capital gains taxes, indirect taxes and tax administration. The identification and management of tax risk is the primary objective of the bank tax and regulatory function, and this objective is achieved through the application of a tax risk matrix approach, which measures the fulfillment of tax responsibilities against the specific requirements of each category of tax to which the bank is exposed, in the context of the various types of activity the bank conducts.
Reputational riskSafeguarding the bank’s reputation is of paramount importance to its continued operations and is the responsibility of every member of staff. Reputational risks can arise from social, ethical or environmental issues, or as a consequence of operational risk events. The bank’s strong reputation is dependent on the way it conducts its business, but it can also be affected by the way in which its clients, to whom it provides financial services, conduct themselves. Effective management of all operating activities is emphasized to establish a strong internal control framework to minimize the risk of operational and financial failure and to ensure that a full assessment of reputational implications is made before strategic decisions are taken. The bank sets clear standards and policies on all major aspects of the business and these standards and policies are integral to the bank’s system of internal controls and are communicated through procedures, manuals and appropriate staff training.
Business/ Strategic riskStrategic risk is the risk of adverse outcomes resulting from a weak competitive position or from a choice of strategy, markets, products, activities or structures. Major potential sources of strategic risk include revenue volatility due to factors such as macroeconomic conditions, inflexible cost structures, uncompetitive products or pricing, and structural inefficiencies.

37
Overview Ensuring our sustainability
Annual financial statements
Ensuring oursustainability
36 Stanbic Bank Uganda Limited Annual report for the year ended 31 December 2013 Stanbic Bank Uganda Limited Annual report for the year ended 31 December 2013Stanbic Bank Uganda Limited Annual report for the year ended 31 December 2013
Risk management and control
36 Stanbic Bank Uganda Limited Annual report for the year ended 31 December 2013
It is not cost effective to attempt to eliminate all business or strategic risk and it would not, in any event, be possible to do so. Events of small significance are expected to occur and are accepted as inevitable; events of material significance are rare and the bank seeks to reduce the risk from these in a framework consistent with its expected risk profile and appetite.
Independent AssuranceThe bank’s internal audit function operates under a mandate from the Board Audit Committee. The Internal audit’s primary objective is to provide assurance to the audit committee on the quality of controls in the bank’s operational activities. It assists the executive management teams in meeting their business objectives by examining the bank’s activities, assessing the risks involved and evaluating the adequacy and effectiveness of processes, systems and controls to manage these risks. A risk based audit approach has been adopted. Material or significant control weaknesses and planned management remedial actions are reported to management and Board Audit Committee. These issues are tracked to ensure that agreed remedial actions have been implemented. Overdue issues are also reported to the Board Audit Committee on a quarterly basis.
Capital adequacy Minimum requirementsThe capital adequacy ratio reflects the capital strength of an entity compared to the minimum requirement set out by the regulator. Stanbic Bank Uganda Limited is required to meet the Central Bank capital requirements, set at a minimum capital adequacy ratio of 8% (based on core capital) and 12% (based on total capital). These regulations are based on guidelines developed by the Bank for International Settlements.
Qualifying capital Qualifying capital is divided into two tiers: primary and secondary.
Primary capital (Tier I) comprises funds raised through the issue of ordinary shares; non-redeemable, non-cumulative preference shares; retained earnings and reserves (other than regulatory reserves).
Secondary capital (Tier II) comprises cumulative preference shares, certain subordinated loan funding and general debt provisions net of any related deferred tax.
Risk weighted assets Risk-weighted assets are determined by applying a set risk-weighting to on and off-balance sheet financial instruments, according to the relative credit risk of the counterparty. Included in the overall risk-weighted assets is a notional risk-weighting for the trading assets, calculated based on the market, counterparty and large exposure risks
Operational and financial review
Slow economic activity dampened the momentum of our performance in 2013. Despite a significant drop in lending rates compared to 2012, lending activity remained muted for most of the year. This happened at a time when we began to absorb significant IT costs related to our new Finacle Banking platform.
Pre-tax profits declined 24% from UShs 177.7 bn to UShs 134.8 bn while after tax profits declined 22% from UShs 130.7 bn to UShs 101.9 bn
Financial Review
The Bank’s profit after tax fell behind 2012 levels on account of falling yields on assets, relatively high credit impairments charges and generally subdued economic activity during the year. This environment impacted growth in new credit and affordability of credit remained a challenge as well. Overall industry credit growth remained on a negative trajectory for most of the year.
During the final quarter however, there were clear signs of an economic recovery leading to an uptick in lending and transactional activities.
While a number of teething problems were experienced with the recently introduced core banking system, many of these were addressed by the end of the year leading to improvement in the straight through transactional volumes of the bank.
Key highlights of our results for the year• Falling yields across all products by up to 22% negatively impacted
net Interest Income• Challenges with core banking platform impacted negatively on non
interest revenue.• Credit impairment levels remained relatively high during the year as
economic activity was largely weak during the year.• Operating costs increases were largely driven by IT investments
which significantly arose from the first year impact of the cost of Finacle, the Bank’s core banking system.
Financial Performance ReviewThe key assets / liabilities in the statement of financial position are as follows:
Investment securitiesWith strong liquidity and weak credit appetite, the bank continued holding significant levels of assets in investment securities and repos. Growth in investment securities is however expected to reduce as the loans and advances book grows in line with anticipated improvements in the economic environment. Compared to prior year, investment securities on our balance sheet were 38% up compared to 2012.
Loans and advances to customersLoans and advances to customers were marginally lower than prior year. This was mainly due to slow business lending due to low activity in the economy. The Bank also tightened the credit process frustrating UShs 16 bn worth of new loans with documentation fraud. With the recovery of economic activity, it is expected that loans and advances would begin to see much strong growth.
Customer depositsCustomer deposits declined during the year by 14.8% as a number of wholesale accounts were exited in the face of the surplus liquidity. Also, with the challenges initially experienced on the Finacle payment platform, the Bank witnessed a decline in the average balances on a number of corporate transactional accounts. This is however currently recovering following the upgrades recently introduced.
The key operational factors impacting the Bank during the year are discussed below:
MarginsMargins faced a significant reduction through the year. The Central Bank Rate (CBR) dropped rates from an average of 18.0% in 2012 to 11.7% in 2013. This represented a decline of 35%. Similarly, the bank’s earnings on assets consequently dropped by an average of 18% due to the impact of compressed margins. While lower interest rates will consequently lead to low credit losses, the Bank’s overall appetite for marginal credit remained low.
Credit lossThe credit risk levels during the year were generally above the Bank’s risk appetite. Additional credit losses in Business Banking and the credit cards book were observed during the year.
InflationInflation was largely contained over the year. While there were initial fears of strong food inflation, these were largely abated by the end of the year. Average inflationary impact for the year of 6.7% was therefore tolerable.
The key financial results of the Bank reported are as follows:
Net Interest IncomeNet interest income for the year of UShs 247 bn was lower than that reported for 2012 of UShs 296 bn by 16.5%. A 22% decline in yields and a 3% reduction in loans and advances to customers over the year were the main factors behind the reduction in net interest income.
Non Interest RevenueNon-interest income fell by 6% over the previous year. Notable challenge was under fees and commission income which were lower than prior year.
Transactional activity for the Bank was low during the first half of the year as the Bank addressed the processing difficulties experienced on Finacle. This impacted fee and commission income during the period.
Trading revenue was marginally higher as compared to 2012. Generally the market was less volatile in comparison with prior year leading to weaker trading margins. Besides, the one-off fees earned on the IPO of Umeme last year were not similarly repeated.
Credit Impairment chargesCredit impairment charges decreased by 61% over the previous year. The prudent decision to write off delinquent accounts in 2012 proved right as the pace of recovery on these accounts have been slow. During the year additional provisions were largely in the area of personal and business banking as the lag effects of the economic challenges faced by individuals and Small and Medium sized Enterprises during the difficult economic environment of 2011 - 2012.
Operating ExpensesTotal operating expenses of UShs 256 bn ended the year 24% higher than previous year.
Employee costs increased by 18% year on year. During the year, a number of new recruitments were made to improve the depth of talent in the bank. These were considered essential in the fulfilment of the strategic plan of the bank and were often a little more expensive than their replacements.
Other operating costs increased year on year by UShs 33 bn or 29%. Included in this cost is the first time impact of the cost of the core banking system in addition to a number investments in the peripheral units. The Bank considers these investments as essential to enable it compete appropriately and deliver competitive levels of efficiency and service to customers.
39
Overview Ensuring our sustainability
Annual financial statements
Ensuring oursustainability
38 Stanbic Bank Uganda Limited Annual report for the year ended 31 December 2013 Stanbic Bank Uganda Limited Annual report for the year ended 31 December 2013
Operational and financial review
38 Stanbic Bank Uganda Limited Annual report for the year ended 31 December 2013 Stanbic Bank Uganda Limited Annual report for the year ended 31 December 2013
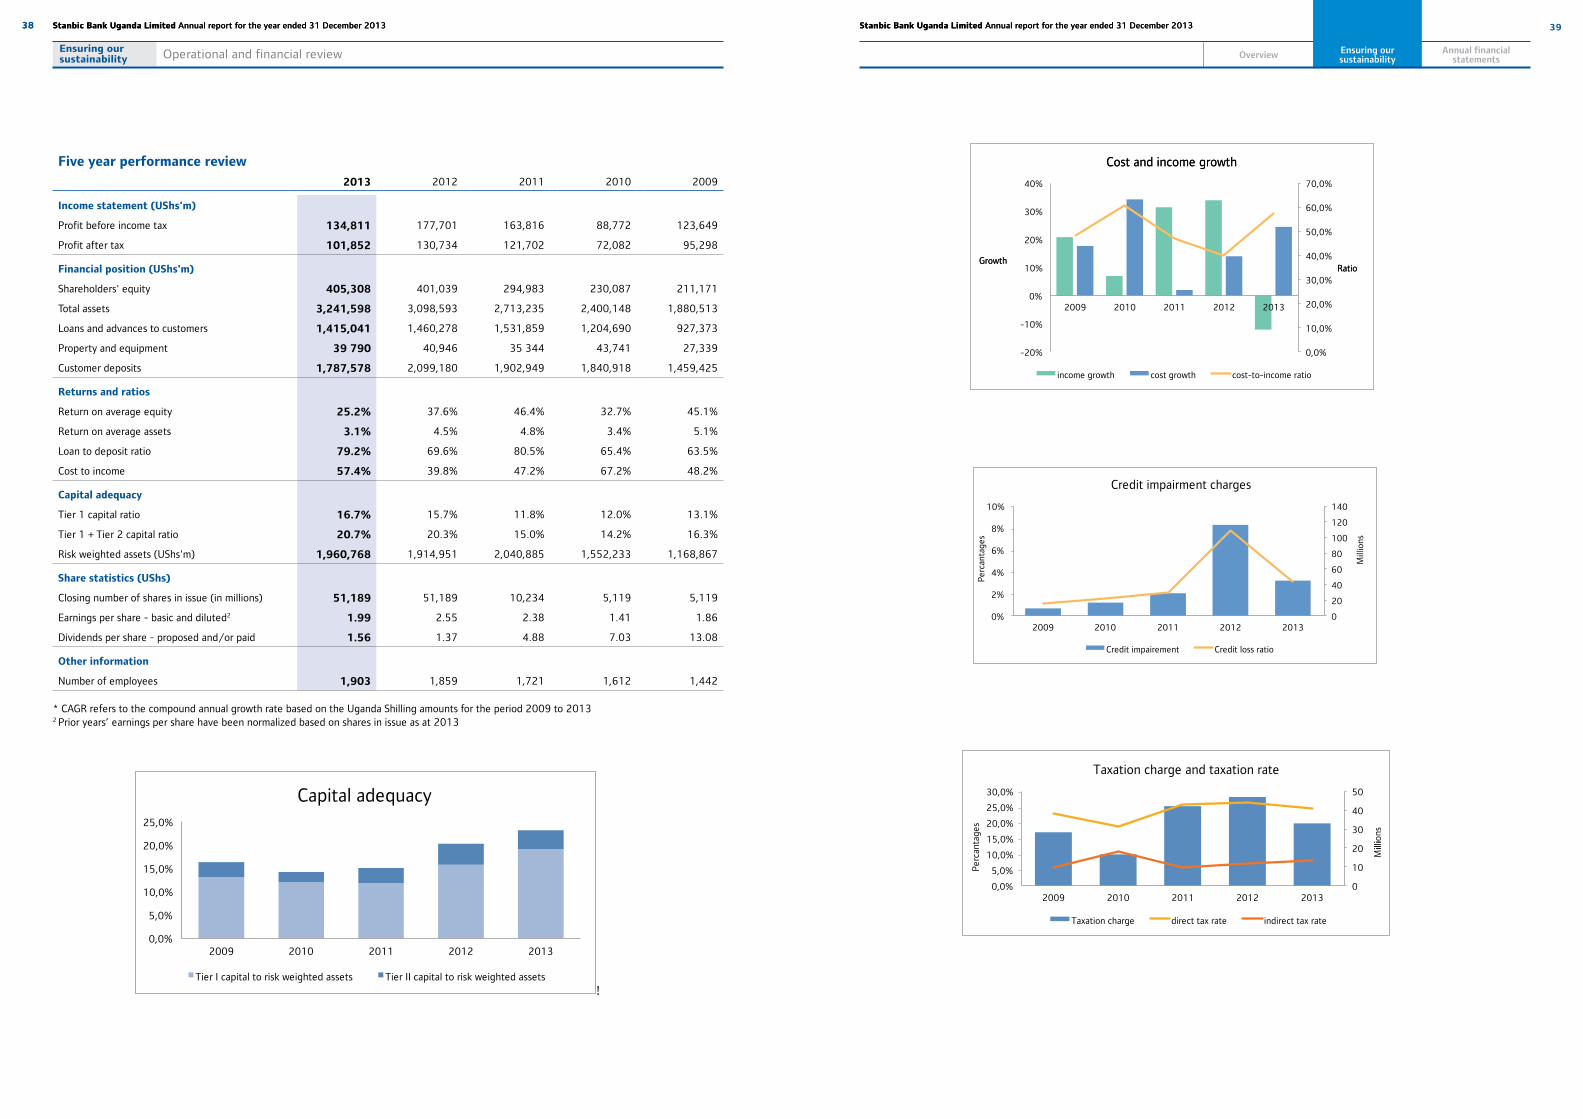
Five year performance review
2013 2012 2011 2010 2009
Income statement (UShs'm)
Profit before income tax 134,811 177,701 163,816 88,772 123,649
Profit after tax 101,852 130,734 121,702 72,082 95,298
Financial position (UShs'm)
Shareholders' equity 405,308 401,039 294,983 230,087 211,171
Total assets 3,241,598 3,098,593 2,713,235 2,400,148 1,880,513
Loans and advances to customers 1,415,041 1,460,278 1,531,859 1,204,690 927,373
Property and equipment 39 790 40,946 35 344 43,741 27,339
Customer deposits 1,787,578 2,099,180 1,902,949 1,840,918 1,459,425
Returns and ratios
Return on average equity 25.2% 37.6% 46.4% 32.7% 45.1%
Return on average assets 3.1% 4.5% 4.8% 3.4% 5.1%
Loan to deposit ratio 79.2% 69.6% 80.5% 65.4% 63.5%
Cost to income 57.4% 39.8% 47.2% 67.2% 48.2%
Capital adequacy
Tier 1 capital ratio 16.7% 15.7% 11.8% 12.0% 13.1%
Tier 1 + Tier 2 capital ratio 20.7% 20.3% 15.0% 14.2% 16.3%
Risk weighted assets (UShs'm) 1,960,768 1,914,951 2,040,885 1,552,233 1,168,867
Share statistics (UShs)
Closing number of shares in issue (in millions) 51,189 51,189 10,234 5,119 5,119
Earnings per share - basic and diluted2 1.99 2.55 2.38 1.41 1.86
Dividends per share - proposed and/or paid 1.56 1.37 4.88 7.03 13.08
Other information
Number of employees 1,903 1,859 1,721 1,612 1,442
* CAGR refers to the compound annual growth rate based on the Uganda Shilling amounts for the period 2009 to 2013 2 Prior years’ earnings per share have been normalized based on shares in issue as at 2013
!
0,0%
5,0%
10,0%
15,0%
20,0%
25,0%
2009 2010 2011 2012 2013
Capital adequacy
Tier I capital to risk weighted assets Tier II capital to risk weighted assets
0,0%
10,0%
20,0%
30,0%
40,0%
50,0%
60,0%
70,0%
-20%
-10%
0%
10%
20%
30%
40%
2009 2010 2011 2012 2013
RRaattiioo GGrroowwtthh
CCoosstt aanndd iinnccoommee ggrroowwtthh
income growth cost growth cost-to-income ratio
0
20
40
60
80
100
120
140
0%
2%
4%
6%
8%
10%
2009 2010 2011 2012 2013
Mill
ions
Credit impairment charges
Credit impairement Credit loss ratio
Per
cant
ages
0
10
20
30
40
50
0,0%
5,0%
10,0%
15,0%
20,0%
25,0%
30,0%
2009 2010 2011 2012 2013
Miillll
iions
Taxation charge and taxation rate
Taxation charge direct tax rate indirect tax rate
Per
cant
ages
41
Overview Ensuring our sustainability
Annual financial statements
Ensuring oursustainability
40 Stanbic Bank Uganda Limited Annual report for the year ended 31 December 2013 Stanbic Bank Uganda Limited Annual report for the year ended 31 December 2013
Operational and financial review
40 Stanbic Bank Uganda Limited Annual report for the year ended 31 December 2013
CAGR Compound annual growth rate
Profit for the year (Shs) Annual income statement profit attributable to ordinary share holders, minorities and preference shareholders
Earnings per share (cents) Earnings attributable to ordinary shareholders divided by the weighted average number of ordinary shares in issue.
Return on average equity (%) Earnings as a percentage of average ordinary shareholders’ funds.
Return on average assets (%) Earnings as a percentage of average total assets.
Net interest margin (%) Net interest income as a percentage of monthly average total assets
Credit loss ratio (%) Provision for credit losses per the income statement as a percentage of average net loans and advances
Cost-to-income ratio (%) Operating expenses as a percentage of total income before deducting the provision for credit losses
Effective tax rate (%) The income tax charge as a percentage of income before tax excluding income from associates
Dividend per share (Shs) Total ordinary dividends declared per share in respect of the year
Dividend cover (times) Earnings per share divided by ordinary dividends per share
Price earnings ratio (%) Closing share price divided by headline earnings per share
Dividend yield (%) Dividends per share as a percentage of the closing share price
Core capital Permanent shareholders equity in the form of issued and fully paid-up shares plus all disclosed reserves, less goodwill or any intangible assets
Supplementary capital General provisions which are held against future and current unidentified losses that are freely available to meet losses which subsequently materialise, and revaluation reserves on banking premises, and any other form of capital as may be determined from time to time, by the Central Bank
Total capital The sum of core capital and supplementary capital.
Total capital adequacy (%) Total capital divided by the sum of the total risk weighted assets and total risk weighted contingent claims.
Financial definitions
The directors submit their report together with the audited financial statements for the year ended 31 December 2013, which disclose the state of affairs of Stanbic Bank Uganda Limited (“the Bank”).
Principal activitiesThe Bank is a licensed financial institution under the Financial Institutions Act, 2004 and is a member of the Uganda Bankers Association.
The Bank is engaged in the business of commercial banking and the provision of related banking services. The Bank is also among the six primary dealers selected by the Bank of Uganda to deal in Government of Uganda securities.
Results The Bank’s results for the year ended 31 December 2013 are shown in the income statement on page 46, and an operational and financial review of the results for the year is given on pages 37 to 40.
A general review of the business is given by the Chairman and Chief Executive on pages 12 to 17.
DividendsThe Directors recommend the payment of final dividend of UShs 50 billion. During the year, an interim dividend of UShs 30 billion was issued bringing the total dividend to UShs 80 billion for the year ended 31 December 2013 (2012: UShs 70 billion)
Share CapitalThe total number of issued ordinary shares as at yearend was 51,188,669,700
DirectorsThe directors who held office during the year and to the date of this report were:
H Karuhanga - Chairman
P Odera - Chief Executive
K Mbathi - Non-executive Director
S Sejjaaka - Non-executive Director
B Mulwana - Non-executive Director
P Masambu - Non-executive Director
R Emunu - Non-executive Director
J Okot - Non-executive Director
P Mweheire - Executive Director
Directors’ interest in sharesAt the date of this report, the following directors held directly an interest in the company’s ordinary issued share capital as reflected in the table below
Director Number of Shares
K Mbathi 1,095,000
P Masambu 500,000
Total 1,595,000
InsuranceThe Bank maintained directors and officers’ liability insurance during the year.
Events subsequent to balance sheet dateThere is no material event that has occurred between the reporting date and the date of this report that would require adjustment to these financial statements.
Management by third partiesNone of the business of the Bank has been managed by a third person or a company in which a director has had an interest during the year.
By order of the board
Brendah Nabatanzi MpangaCompany Secretary
Date: 10 March 2014
Directors’ report

42 Stanbic Bank Uganda Limited Annual report for the year ended 31 December 2013 43Stanbic Bank Uganda Limited Annual report for the year ended 31 December 201342 Stanbic Bank Uganda Limited Annual report for the year ended 31 December 2013
Statement of directors’ responsibilities Independent auditor’s report
The Ugandan Companies Act requires the directors to prepare financial statements for each financial year that give a true and fair view of the state of affairs of the Bank as at the end of the financial year and of its profit or loss. It also requires the directors to ensure that the Bank keeps proper accounting records that disclose, with reasonable accuracy, the financial position of the Bank. They are also responsible for safeguarding the assets of the Bank.
The directors accept responsibility for the financial statements, which have been prepared using appropriate accounting policies supported by reasonable estimates, in conformity with International Financial Reporting Standards and the requirements of the Ugandan Companies Act and the Financial Institutions Act, 2004. The directors are of the opinion that the financial statements give a true and fair view of the state of the financial affairs of the Bank and of its profit in accordance with International Financial Reporting Standards. The directors further accept responsibility for the maintenance of accounting records that may be relied upon in the preparation of financial statements and of such internal control as the directors determine is necessary to enable the preparation of financial statements that are free from material misstatements, whether due to fraud or error.
Nothing has come to the attention of the directors to indicate that the Bank will not remain a going concern for at least twelve months from the date of this statement.
……………………………………... …………………………………….Chairman, Board of Directors Chief Executive
Date: 10 March 2014 Date: 10 March 2014
Statement of directors’ responsibilities
We have audited the accompanying financial statements of Stanbic Bank Uganda Limited (“the Bank”), as set out on pages 46 to 101. These financial statements comprise the statement of financial position as at 31 December 2013 and the income statement, statement of comprehensive income, statement of changes in equity and statement of cash flows for the year then ended, and a summary of significant accounting policies and other explanatory notes.
Directors’ responsibilities for the financial statementsThe directors are responsible for the preparation and fair presentation of these financial statements in accordance with International Financial Reporting Standards, the Financial Institutions Act 2004 and in the manner required by the Ugandan Companies Act, and for such internal control as the directors determine is necessary to enable the preparation of financial statements that are free from material misstatement, whether due to fraud or error.
Auditor’s responsibilityOur responsibility is to express an independent opinion on the financial statements based on our audit. We conducted our audit in accordance with International Standards on Auditing. Those standards require that we comply with ethical requirements and plan and perform our audit to obtain reasonable assurance that the financial statements are free from material misstatement.
An audit involves performing procedures to obtain audit evidence about the amounts and disclosures in the financial statements. The procedures selected depend on the auditor’s judgement, including the assessment of the risks of material misstatement of financial statements, whether due to fraud or error. In making those risk assessments, the auditor considers internal controls relevant to the entity’s preparation and fair presentation of the financial statements in order to design audit procedures that are appropriate in the circumstances, but not for the purpose of expressing an opinion on the effectiveness of the Bank’s internal controls. An audit also involves evaluating the appropriateness of accounting policies used and the reasonableness of accounting estimates made by the directors, as well as evaluating the overall presentation of the financial statements.
We believe that the audit evidence we have obtained is sufficient and appropriate to provide a basis for our opinion.
OpinionIn our opinion the financial statements give a true and fair view of the financial affairs of the Bank as at 31 December 2013 and of its profit and cash flows for the year then ended in accordance with International Financial Reporting Standards, the Financial Institutions Act 2004 and the Ugandan Companies Act.
Report on other legal requirements
The Ugandan Companies Act requires that in carrying out our audit we consider and report to you on the following matters. We confirm that:
i) We have obtained all the information and explanations which to the best of our knowledge and belief were necessary for the purposes of our audit;
ii) In our opinion proper books of account have been kept by the Bank, so far as appears from our examination of those books; and
iii) The Bank’s statement of financial position and income statement are in agreement with the books of account.
Certified Public AccountantsKampala, Uganda
Date: 8 April 2014
Report of the independent auditor to the members of Stanbic Bank Uganda Limited

45
Overview Ensuring our sustainability
44 Stanbic Bank Uganda Limited Annual report for the year ended 31 December 2013 Stanbic Bank Uganda Limited Annual report for the year ended 31 December 2013
- KAMWENDO AND THE DESKS
Our mission is to transform lives across Uganda. In 2013, we are proud to have partnered with the MTN marathon to provide safe, clean water in Kotido and Moroto. We strive to make a difference in the lives of the communities in which we operate. We are committed to contributing to the socio-economic development of Uganda by providing financial services and products responsibly, bearing in mind the needs of the society, our customers, our staff, our shareholders, the environment and the future generations.
www.stanbicbank.co.ug
Transforming LivesMoving forward also means giving back to the community.
We are proud to have provided school furniture to Aywee Primary School. In so doing, we helped to create a conducive learning environment for the children at the school.
www.stanbicbank.co.ug
Transforming LivesMoving forward also means giving back to the community.

47
Overview Ensuring our sustainability Financial statements
Financialstatements
46 Stanbic Bank Uganda Limited Annual report for the year ended 31 December 2013 Stanbic Bank Uganda Limited Annual report for the year ended 31 December 2013
2013 2012
Notes UShs' 000 UShs' 000
Interest income 6 284 985 795 348 918 145
Interest expense 7 (37 228 207) (52 225 935)
Net interest income 247 757 588 296 692 210
Fee and commission income 8 101 971 172 118 466 099
Fee and commission expenses 8 (3 353 123) (3 308 786)
Net fees and commission income 98 618 049 115 157 313
Net trading income 9 99 183 211 95 436 048
Other operating income 10 1 602 112 1 241 195
Total Income before credit impairment charge 447 160 960 508 526 766
Impairment charge for credit losses 11 (44 932 277) (115 932 886)
Total Income after credit impairment charge 402 228 683 392 593 880
Employee benefit expenses 12 (104 967 207) (88 610 597)
Depreciation and amortisation 26 and 27 (14 827 291) (12 028 012)
Other operating expenses 13 (147 623 424) (114 253 940)
Profit before income tax 134 810 761 177 701 331
Income tax expense 14 (32 959 234) (46 967 259)
Profit for the year 101 851 527 130 734 072
Earnings per share for profit attributable to the equity hold-ers of the Bank during the year (expressed In UShs per share):
Basic and diluted 15 1,99 2,55
Income statement
2013 2012
Notes UShs' 000 UShs' 000
Profit for the year
Other comprehensive income for the year after tax: 101 851 527 130 734 072
Net gains on available for sale financial assets 29 2 049 315 24 731 090
Total comprehensive income for the year 103 900 842 155 465 162
Statement of comprehensive income

49
Overview Ensuring our sustainability Financial statements
Financialstatements
48 Stanbic Bank Uganda Limited Annual report for the year ended 31 December 2013 Stanbic Bank Uganda Limited Annual report for the year ended 31 December 2013
Statement of financial position
Notes 2013 2012
UShs' 000 UShs' 000
Assets
Cash and balances with Bank of Uganda 16 421 381 332 507 437 302
Derivative financial instruments 31 129 020 1 032 432
Government securities - held for trading 17 340 221 294 274 966 482
Government securities - available for sale 17 618 069 090 449 407 315
Pledged assets 18 1 851 658 2 651 551
Loans and advances to banks 19 181 124 853 223 595 642
Amounts due from group companies 40 148 418 567 50 548 733
Loans and advances to customers 20 1 415 040 925 1 460 277 630
Other investment securities 21 1 146 198 1 051 920
Current income tax recoverable 14 10 708 472 7 454 070
Deferred income tax asset 23 7 549 346 8 871 029
Prepaid operating leases 24 129 674 140 012
Other assets 25 52 005 348 65 718 661
Goodwill and other intangible assets 26 4 031 905 4 494 862
Property and equipment 27 39 790 358 40 945 759
Total assets 3 241 598 040 3 098 593 400
Shareholders' equity and liabilities
Shareholders' equity
Ordinary share capital 28 51 188 670 51 188 670
Available for sale fair value reserve 29 (3 351 374) (5 400 689)
Statutory credit risk reserve 30 8 276 510 15 365 256
Retained earnings 299 194 691 269 886 049
Proposed dividend 37 50 000 000 70 000 000
Total shareholders’ equity 405 308 497 401 039 286
Liabilities
Derivative financial instruments 31 1 521 864 -
Customer deposits 32 1 787 577 713 2 099 180 118
Deposits and balances due to banks 33 238 472 365 33 957 043
Amounts due to group companies 40 638 486 748 344 854 604
Borrowed funds 34 18 840 955 24 703 479
Other liabilities 35 103 578 230 145 746 355
Subordinated debt 36 47 811 668 49 112 515
Total liabilities 2 836 289 543 2 697 554 114
Total equity and liabilities 3 241 598 040 3 098 593 400
The financial statements were approved for issue by the Board of Directors on 10 March 2014 and signed on its behalf by:
……………………………………………… ………………………………………………. Hannington Karuhanga Philip Odera Chairman Chief Executive
……………………………………………… ………………………………………………. Samuel Sejjaaka Brendah Nabatanzi Mpanga Director Company Secretary
Sta
tem
ent
of
chan
ges
in
eq
uit
y
No
tes
Sh
are
cap
ital
A
vail
able
fo
r sa
le r
eval
uat
ion
re
serv
e
Sta
tuto
ry
Cre
dit
Ris
k
Res
erve
Pro
po
sed
d
ivid
end
Ret
ain
ed
earn
ing
s T
ota
l
USh
s' 0
00
U
Sh
s' 0
00
U
Sh
s' 0
00
U
Sh
s’ 0
00
USh
s' 0
00
U
Sh
s' 0
00
At
1 J
anu
ary
20
13
5
1 1
88
67
0
(5
40
0 6
89
) 1
5 3
65
25
6
70
00
0 0
00
26
9 8
86
04
9
40
1 0
39
28
6
Pro
fit
for
the
year
-
--
10
1 8
51
52
7
10
1 8
51
52
7
Net
cha
nge
in f
air
valu
e on
ava
ilabl
e fo
r sa
le in
vest
men
ts
29
-
2
04
9 3
15
-
-
-
2 0
49
31
5
To
tal
com
pre
hen
sive
in
com
e fo
r th
e p
erio
d
-
2 0
49
31
5
-
- 1
01
85
1 5
27
1
03
90
0 8
42
Tra
nsa
ctio
ns
wit
h o
wn
ers
reco
rded
dir
ectl
y in
eq
uit
y
Div
iden
d pa
id
37
--
-(7
0 0
00
00
0)
(7
0 0
00
00
0)
Inte
rim
div
iden
d pa
id(3
0 0
00
00
0)
(30
00
0 0
00
)
Sta
tuto
ry c
redi
t ri
sk r
eser
ve
30
-
-
(7
08
8 7
46
) 7
08
8 7
46
-
Equ
ity-
sett
led
shar
e-ba
sed
paym
ent
tran
sact
ions
-
-
-
3
68
36
9
36
8 3
69
Pro
pose
d di
vide
nd3
7
-
-
-
50
00
0 0
00
(50
00
0 0
00
) -
Bal
ance
at
31
Dec
emb
er 2
01
3
51
18
8 6
70
(
3 3
51
37
4)
8 2
76
51
0
50
00
0 0
00
29
9 1
94
69
1
40
5 3
08
49
7

51
Overview Ensuring our sustainability Financial statements
Financialstatements
50 Stanbic Bank Uganda Limited Annual report for the year ended 31 December 2013 Stanbic Bank Uganda Limited Annual report for the year ended 31 December 2013
No
tes
Sh
are
cap
ital
A
vail
able
fo
r sa
le r
eval
uat
ion
re
serv
e
Sta
tuto
ry
Cre
dit
Ris
k
Res
erve
Pro
po
sed
d
ivid
end
Ret
ain
ed
earn
ing
s T
ota
l
USh
s' 0
00
U
Sh
s' 0
00
U
Sh
s' 0
00
U
Sh
s’ 0
00
USh
s' 0
00
U
Sh
s' 0
00
At
1 J
anu
ary
20
12
1
0 2
37
73
4
(3
0 1
31
77
9)
1 0
16
78
0
50
00
0 0
00
24
3 4
49
46
9
29
4 9
83
47
0
Pro
fit
for
the
year
-
-
-
1
30
73
4 0
72
1
30
73
4 0
72
Net
cha
nge
in f
air
valu
e on
ava
ilabl
e fo
r sa
le in
vest
men
ts
29
-
2
4 7
31
09
0
-
- 2
4 7
31
09
0
To
tal
com
pre
hen
sive
in
com
e fo
r th
e p
erio
d
-
24
73
1 0
90
-
1
30
73
4 0
72
1
55
46
5 1
62
Tra
nsa
ctio
ns
wit
h o
wn
ers
reco
rded
dir
ectl
y in
eq
uit
y
Bon
us s
hare
s is
sued
2
8
40
95
0 9
36
-
-
(
20
53
9 6
70
) -
Div
iden
d pa
id
(50
00
0 0
00
)(5
0 0
00
00
0)
Sta
tuto
ry c
redi
t ri
sk r
eser
ve
-
-
14
34
8 4
76
(
14
34
8 4
76
) -
Equ
ity-
sett
led
shar
e-ba
sed
paym
ent
tran
sact
ions
-
-
-
5
90
65
4
59
0 6
54
Pro
pose
d di
vide
nd 3
7
-
-
-
70
00
0 0
00
(7
0 0
00
00
0)
-
Bal
ance
at
31
Dec
emb
er 2
01
2
51
18
8 6
70
(
5 4
00
68
9)
15
36
5 2
56
7
0 0
00
00
0 2
69
88
6 0
49
4
01
03
9 2
86
Sta
tem
ent
of
chan
ges
in
eq
uit
y (C
on
tin
ued
)
Statement of cash flows
2013 2012
Notes UShs' 000 UShs' 000
Cash flows from operating activities
Interest received 292 241 673 333 252 917
Interest paid (39 568 062) (50 198 765)
Net fees and commissions received 98 669 906 114 859 291
Net trading and other Income/recoveries 115 588 763 105 810 870
Cash payment to employees and suppliers (248 709 669) (206 960 256)
Cash flows from operating activities before changes
in operating assets and Liabilities 218 222 611 296 764 057
Changes in operating assets and liabilities
Income tax paid 14 (35 770 231) (47 869 023)
Decrease/(increase) in Derivative financial instrumentss 903 412 (1 032 432)
(Increase)/decrease in government securities - AFS maturing in 90 days
(290 845 879) 115 837 052
(Increase) in government securities - trading (65 254 812) (268 742 140)
Decrease/(increase) in pledged assets 799 893 (1 886 673)
Decrease/(increase) in cash reserve requirement 30 210 000 (25 660 000)
Decrease/(increase) in loans and advances to customers (21 910 913) 42 988 493
Decrease in other assets 13 577 516 11 631 135
(Decrease)/increase in customer deposits (309 262 550) 196 231 612
Increase/(decrease) in deposits and balances due to other banks 204 515 322 (172 112 360)
Increase/(decrease) in deposits from group companies 293 632 144 231 539 785
(Decrease)/increase in Derivative financial instruments 1 521 864 (146 470)
(Decrease)/increase in other liabilities (45 680 718) 18 775 023
Net cash from / (used in) operating activities (5 342 341) 396 318 060
Cash flows from investing activities
Purchase of property and equipment 27 (13 283 444) (17 558 265)
Purchase of computer software (126 807) (2 729 838)
Proceeds from sale of property and equipment 357 340 97 207
Sale of investment in associate - 3 213 219
Net cash used in investing activities (13 052 911) (16 977 677)
Cash flows from financing activities
Dividends paid to shareholders (100 000 000) (50 000 000)
Dividends received from associate - 112 941
Decrease in borrowed funds (5 862 524) (1 928 291)
Increase in subordinated debt (1 300 847) 1 607 582
Net cash used financing activities (107 163 371) (50 207 768)
Net increase / (decrease) in cash and cash equivalents (125 558 623) 329 132 615
Cash and cash equivalents at beginning of the year 886 526 593 557 393 978
Cash and cash equivalents at end of the year 39 760 967 971 886 526 593
53
Overview Ensuring our sustainability Financial statements
Financialstatements Notes
52 Stanbic Bank Uganda Limited Annual report for the year ended 31 December 2013 Stanbic Bank Uganda Limited Annual report for the year ended 31 December 2013
1. General information Stanbic Bank Uganda Limited provides personal, business, corporate and investment banking services in Uganda. The Bank is a limited liability company and is incorporated and domiciled in Uganda. The address of its registered office is:
Plot 17 Hannington RoadShort Tower - Crested TowersP O Box 7131 Kampala
The Bank’s shares are listed on the Uganda Securities Exchange (USE).
For Ugandan Companies Act reporting purposes, the balance sheet is represented by the statement of financial position and the profit and loss account by the income statement in these financial statements.
2. Summary of significant accounting policiesThe principal accounting policies adopted in the preparation of these financial statements are set out below. These policies have been consistently applied to all years presented, unless otherwise stated.
a) Basis of preparationThe annual financial statements are prepared in compliance with International Financial Reporting Standards (IFRS) as issued by the International Accounting Standards Board (IASB), its interpretations adopted by the IASB as well as the Uganda listing requirements and Companies Act 2012. The financial statements are presented in the functional currency, Uganda Shillings (UShs), rounded to the nearest thousand, and prepared under the historical cost convention except for assets and liabilities held for trading, financial instruments designated at fair value through profit or loss; liabilities for cash-settled share-based payment arrangements and available-for-sale financial assets that are measured at fair value.
The preparation of the financial statements in conformity with IFRS requires management to make judgements, estimates and assumptions that affect the application of accounting policies and the reported amounts of assets, liabilities, income and expenses. Actual results may differ from these estimates.
Estimates and underlying assumptions are reviewed on an ongoing basis. Revisions to accounting estimates are recognised in the period in which the estimate is revised and in any future periods affected.
Information about significant areas of estimation uncertainty and critical judgements in applying accounting policies that have the most significant effect on the amounts recognised in the consolidated financial statements are described in notes 4.
New and amended standards adopted by the Bank
IAS 1, ‘Presentation of financial statements’ (applicable beginning on or after 1 July 2012) - The amendment changes the disclosure of items presented in other comprehensive income (OCI) in the statement of comprehensive income. The bank will be required to separate items presented in other comprehensive income (“OCI”) into two groups, based on whether or not they may be recycled to profit or loss in the future. Items that will not be recycled will be presented separately from items that may be recycled in the future. If the bank chooses to present OCI items before tax, it will be required to show the amount of tax related to the two groups separately.
The title used by IAS 1 for the statement of comprehensive income has changed to ‘statement of profit or loss and other comprehensive income’, though IAS 1 still permits entities to use other titles.
IAS 19, ‘Employee benefits’ (applicable beginning on or after 1 January 2013) - The amendment to IAS 19, ‘Employee benefits’ makes significant changes to the recognition and measurement of defined benefit pension expense and termination benefits and to the disclosures for all employee benefits. Key features are as follows:• Actuarial gains and losses are renamed ‘re-measurements’ and can
only be recognized in ‘other comprehensive income’ without any recycling through profit or loss in subsequent periods
• Past service costs will be recognized in the period of a plan amendment and curtailment occurs only when an entity reduces significantly the number of employees.
• The amendment clarifies the definition of termination benefits. Any benefit that has a future service obligation is not a termination benefit.
Annual benefit expense for a funded benefit plan will include net interest expense or income, calculated by applying the discount rate to the net defined benefit asset or liability.
This amendment is not expected to have any impact as the bank does not operate a defined benefit fund.
IFRS 13, ‘Fair value measurement’ (applicable beginning on or after 1 January 2013) - IFRS 13 explains how to measure fair value and aims to enhance fair value disclosures; it does not say when to measure fair value or require additional fair value measurements. A fair value measurement assumes that the transaction to sell the asset or transfer the liability takes place in the principal market for the asset or liability or, in the absence of a principal market, in the most advantageous market for the asset or liability.
The principal market is the market with the greatest volume and level of activity for the asset or liability that can be accessed by the entity. The guidance includes enhanced disclosure requirements that could result in significantly more work for the Bank. The requirements are similar to IFRS 7, ‘Financial instruments: Disclosures’ but apply to all assets and liabilities measured at fair value, not just financial ones.
Standards and interpretations issued but not yet effective
The Bank has chosen not to early adopt the following standards and intepretations that were issued but not effective for accounting periods beginning on 1st January 2013.
IFRS 9, ‘Financial instruments’ part 1: Classification and measurement and part 2: Financial liabilities and De-recognition of financial instruments – (applicable beginning on or after 1 January 2015)
IFRS 9, part 1 was issued in November 2009 and replaces those parts of IAS 39 relating to the classification and measurement of financial assets. Key features are as follows:
• Financial assets are required to be classified into two measurement categories: those to be measured subsequently at fair value, and those to be measured subsequently at amortised cost. The decision is to be made at initial recognition. The classification depends on the entity’s business model for managing its financial instruments and the contractual cash flow characteristics of the instrument.
• An instrument is subsequently measured at amortised cost only if it is a debt instrument and both the objective of the entity’s business model is to hold the asset to collect the contractual cash flows, and the asset’s contractual cash flows represent only payments of principal and interest (that is, it has only ‘basic loan features’). All other debt instruments are to be measured at fair value through the income statement.
• All equity instruments are to be measured subsequently at fair value. Equity instruments that are held for trading will be measured at fair value through profit or loss. For all other equity investments, an
Notes
irrevocable election can be made at initial recognition, to recognise unrealised and realised fair value gains and losses through other comprehensive income rather than profit or loss. There is to be no recycling of fair value gains and losses to profit or loss. This election may be made on an instrument-by-instrument basis. Dividends are to be presented in profit or loss, as long as they represent a return on investment.
• While adoption of IFRS 9 is mandatory from 1 January 2015, earlier adoption is permitted. The Bank is considering the implications of the Standard, the impact on the Bank and the timing of its adoption.
• IFRS 9, part 2 was issued in October 2010 and includes guidance on financial liabilities and de-recognition of financial instruments. The accounting and presentation of financial liabilities and for derecognising financial instruments has been relocated from IAS 39, ‘Financial instruments: Recognition and Measurement’, without change except for financial liabilities that are designated at fair value through profit or loss.
Under the new standard, entities with financial liabilities at fair value through profit or loss recognise changes in the liability’s credit risk directly in other comprehensive income. There is no subsequent recycling of the amounts in other comprehensive income to profit or loss, but accumulated gains or losses may be transferred within equity.
There are no other IFRSs or IFRIC interpretations that are not yet effective that would have a material impact on the financial statements of the Bank.
(b) Interest income and expense Interest income and expense are recognised in the income statement on an accrual basis for all interest bearing financial instruments, except for those classified at fair value through profit or loss using the effective interest method.
The effective interest method is a method of calculating the amortised cost of a financial asset or a financial liability and of allocating the interest income or interest expense over the relevant period. The effective interest rate is the rate that exactly discounts estimated future cash payments or receipts through the expected life of the financial instrument or, when appropriate, a shorter period to the net carrying amount of the financial asset or financial liability. The calculation includes all fees paid or received between parties to the contract that are an integral part of the effective interest rate, transaction costs and all other premiums or discounts.
Interest income and expense presented in the income statement include interest on financial assets and financial liabilities measured at amortised cost calculated on an effective interest basis.
When loans and advances become doubtful of collection, they are written down to their recoverable amounts and interest income is thereafter recognised based off the original effective interest rate that is used to discount the future cash flows for the purpose of measuring the recoverable amount. (c) Fees and commissionFees and commission income and expense that are integral to the effective interest rate on a financial asset or liability are included in the measurement of the effective interest rate. Loan commitment fees for loans that are likely to be drawn down are deferred (together with related direct costs) and recognised over the life of the loan.
Fees and commissions are generally recognised on an accrual basis when the service has been provided.
(d) Net trading revenueNet trading revenue comprises gains or losses related to trading assets and liabilities, and include all realised and unrealised fair value changes, interest and foreign exchange differences.
(e) Net income from other financial instruments at fair value through Income statementNet income from other financial instruments at fair value through income statement relates to non-trading derivatives held for risk management purposes that do not form part of a qualifying hedge relationship and financial assets and liabilities designated at fair value through the income statement, and include all realised and unrealised fair value changes, interest and foreign exchange differences.
(f) DividendsDividend income is recognised when the right to receive income is established. Usually this is the ex-dividend date for equity securities. Dividends are reflected as a component of other operating income based on the underlying classification of the equity investment.
(g) Segment reportingAn operating segment is a distinguishable component of the Bank engaged in providing products or services that are subject to risks and returns that are different from those of other business segments and whose operating results are reviewed to assess its performance and for which discrete financial information is available. The Bank’s primary business segmentation is based on the Bank’s internal reporting about components of the Bank as regularly reviewed by the board and executive management committees. Segments results include items directly attributable to a segment as well as those that are allocated on a reasonable basis. Business segments are the only segments presented since the Bank operates in a single geographical segment, Uganda.
In accordance with IFRS 8, the Bank has the following business segments: Personal and Business Banking, Corporate and Investment Banking and Treasury and Capital management. The transactions between segments are priced at market related rates
(h) Foreign currency translation(i) Functional and presentation currency Items included in the Bank’s financial statements are measured
using the currency of the primary economic environment in which the entity operates, Uganda shillings (“the functional currency”). The financial statements are presented in Uganda shillings (UShs) and figures are stated in thousands of UShs unless otherwise stated.
(ii) Transactions and balances Foreign currency transactions are translated into the functional
currency using the exchange rates prevailing at the dates of the transactions.
Monetary items denominated in foreign currency are translated with the closing rate as at the reporting date. If several exchange rates are available, the forward rate is used at which the future cash flows represented by the transaction or balance could have been settled if those cash flows had occurred. Non-monetary items measured at historical cost denominated in a foreign currency are translated with the exchange rate as at the date of initial recognition; non-monetary items in a foreign currency that are measured at fair value are translated using the exchange rates at the date when the fair value was determined.
Foreign exchange gains and losses resulting from the settlement of foreign currency transactions and from the translation at year-end exchange rates of monetary assets and liabilities denominated in foreign currencies are recognized in profit or loss.
2. Summary of significant accounting policies (Continued)
55
Overview Ensuring our sustainability Financial statements
Financialstatements Notes
54 Stanbic Bank Uganda Limited Annual report for the year ended 31 December 2013 Stanbic Bank Uganda Limited Annual report for the year ended 31 December 2013
Changes in the fair value of monetary assets denominated in foreign currency classified as available-for-sale are analyzed between translation differences resulting from changes in the amortized cost of the security and other changes in the carrying amount of the security. Translation differences related to changes in the amortized cost are recognized in profit or loss, and other changes in the carrying amount, are recognized in other comprehensive income.
Translation differences on non-monetary financial instruments, such as equities held at fair value through profit or loss, are reported as part of the fair value gain or loss. Translation differences on non-monetary financial instruments, such as equities classified as available-for-sale financial assets, are included in other comprehensive income.
(i) Financial assets and liabilities Financial assetsThe Bank classifies its financial assets into the following categories: financial assets at fair value through profit or loss; loans, advances and receivables; held-to-maturity investments; and available-for-sale financial assets and liabilities. Management determines the appropriate classification of its investments at initial recognition.
(i) Financial assets at fair value through profit or loss This category has two sub-categories: financial assets held for
trading, and those designated at fair value through profit or loss at inception. A financial asset is classified in this category if acquired principally for the purpose of selling in the short term or if so classifying eliminates or significantly reduces a measurement inconsistency. Derivatives are also categorised as held for trading or designated at fair value through profit or loss at inception.
(ii) Loans, advances and receivables Loans and receivables are non-derivative financial assets with fixed
or determinable payments that are not quoted in an active market, other than:
(a) those that the entity intends to sell immediately or in the short term, which are classified as held for trading, and those that the entity upon initial recognition designates as at fair value through profit or loss;
(b) those that the entity upon initial recognition designates as available for sale; or
(c) those for which the holder may not recover substantially all of its initial investment, other than because of credit deterioration.
Loans and receivables are initially recognised at fair value – which
is the cash consideration to originate or purchase the loan including any transaction costs – and measured subsequently at amortised cost using the effective interest method. Loans and receivables are reported in the statement of financial position as loans and advances to banks or customers or as investment securities. Interest on loans is included in the income statement and is reported as ‘Interest income’. In the case of impairment, the impairment loss is reported as a deduction from the carrying value of the loan and recognised in the income statement as ‘Impairment charge for credit losses’.
(iii) Held-to maturity Held-to-maturity investments are non-derivative financial assets
with fixed or determinable payments and fixed maturities that management has the positive intention and ability to hold to maturity. Were the Bank to sell more than an insignificant amount of held-to-maturity assets, the entire category would have to be reclassified as available for sale.
(iv) Available-for-sale Available-for-sale financial assets are financial assets that are
intended to be held for an indefinite period of time, which may be sold in response to needs for liquidity or changes in interest rates, exchange rates or equity prices or those that are non-derivative financial assets that are not classified under any of the categories (i) to (iii) above.
Purchases and sales of financial assets at fair value through profit
or loss, held-to-maturity and available-for-sale are recognised on trade-date – the date on which the Bank commits to purchase or sell the asset. Financial assets are initially recognised at fair value plus, for all financial assets except those carried at fair value through profit or loss, transaction costs.
Financial assets are derecognised when the rights to receive cash flows from the financial assets have expired or where the Bank has transferred substantially all risks and rewards of ownership.
Loans, advances and receivables and held-to-maturity investments are carried at amortised cost using the effective interest method. Available-for-sale financial assets and financial assets at fair value through profit or loss are carried at fair value. Gains and losses arising from changes in the fair value of ‘financial assets at fair value through profit or loss’ are included in the income statement in the period in which they arise. Gains and losses arising from changes in the fair value of available-for-sale financial assets are recognised directly in equity until the financial asset is derecognised or impaired, at which time the cumulative gain or loss previously recognised in equity is recognised in the income statement. However, interest calculated using the effective interest method is recognised in the income statement. Dividends on available-for-sale equity instruments are recognised in the income statement when the Bank’s right to receive payment is established.
Fair value measurement Fair value is the amount for which an asset could be exchanged, or a
liability settled, between knowledgeable, willing parties in an arm’s length transaction on the measurement date.
When available, the Bank measures the fair value of an instrument using quoted prices in an active market for that instrument. A market is regarded as active if quoted prices are readily and regularly available and represent actual and regularly occurring market transactions on an arm’s length basis.
If a market for financial instrument is not active, the Bank establishes fair value using a valuation technique. Valuation techniques include using recent arm’s length transactions between knowledgeable, willing parties (if available), reference to the current fair value of other instruments that are substantially the same, discounted cash flow analyses and option pricing models.
Financial assets that are transferable to a third party but do not qualify for de-recognition are presented in the statement of financial position as ‘Pledged assets’.
Amortised cost measurement The amortised cost of a financial asset or liability is the amount at
which the financial asset or liability is measured at initial recognition, minus principal repayments, plus or minus the cumulative amortisation using the effective interest method of any difference between the initial amount recognised and the maturity amount, minus any reduction for impairment.
(v) De-recognition The bank derecognises a financial asset when the contractual rights
to the cash flows from the financial asset expire, or when it transfers
2. Summary of significant accounting policies (Continued)
the financial asset in a transaction in which substantially all the risks and rewards of ownership of the financial asset are transferred or in which the bank neither transfers nor retains substantially all the risks and rewards of ownership and it does not retain control of the financial asset.
Any interest in transferred financial assets that qualify for de-recognition that is created or retained by the bank is recognised as a separate asset or liability in the statement of financial position. On de-recognition of a financial asset, the difference between the carrying amount of the asset (or the carrying amount allocated to the portion of the asset transferred), and consideration received (including any new asset obtained less any new liability assumed) is recognised in profit or loss.
(vi) Offsetting Financial assets and liabilities are offset and the net amount
presented in the statement of financial position when, and only when, the bank has a legal right to set off the recognised amounts and it intends either to settle on a net basis or to realise the asset and settle the liability simultaneously.
Income and expenses are presented on a net basis only when permitted under IFRSs, or for gains and losses arising from a group of similar transactions such as in the bank’s trading activity.
(j) Impairment of financial assets
(i) Assets carried at amortised cost The Bank assesses at each statement of financial position date
whether there is objective evidence that a financial asset or a group of financial assets is impaired. A financial asset or a group of financial assets is impaired and impairment losses are incurred if, and only if, there is objective evidence of impairment as a result of one or more events that occurred after initial recognition of the asset (a “loss event”) and that loss event (or events) has an impact on the estimated future cash flows of the financial asset or group of financial assets that can be reliably estimated. Objective evidence that a financial asset or group of assets is impaired includes observable data that comes to the attention of the Bank about the following loss events:
- significant financial difficulty of the issuer or obligor;
- a breach of contract, such as default or delinquency in interest or principal repayments;
- the Bank granting to the borrower, for economic or legal reasons relating to the borrower’s financial difficulty, a concession that the lender would not otherwise consider;
- it becoming probable that the borrower will enter bankruptcy or other financial reorganisation;
- the disappearance of an active market for that financial asset because of financial difficulties; or
- observable data indicating that there is a measurable decrease in the estimated future cash flows from a group of financial assets since the initial recognition of those assets, although the decrease cannot yet be identified with the individual financial assets in the group, including:
• adverse changes in the payment status of borrowers in the group; or
• National or local economic conditions that correlate with defaults on the assets in the group.
The Bank first assesses whether objective evidence of impairment exists individually for financial assets that are individually significant, and individually or collectively for financial assets that are not individually significant. If the Bank determines no objective evidence of impairment exists for an individually assessed financial
asset, whether significant or not, it includes the asset in a group of financial assets with similar credit risk characteristics and collectively assesses them for impairment. Assets that are individually assessed for impairment and for which an impairment loss is or continues to be recognised are not included in a collective assessment of impairment.
If there is objective evidence that an impairment loss on loans or
held-to-maturity investments carried at amortised cost has been incurred, the amount of the loss is measured as the difference between the asset’s carrying amount and the present value of estimated future cash flows (excluding future credit losses that have not been incurred) discounted at the financial instrument’s original effective interest rate. The carrying amount of the asset is reduced through the use of an allowance account and the amount of the loss is recognised in the income statement. If a loan or held-to-maturity investment has a variable interest rate, the discount rate for measuring any impairment loss is the current effective interest rate determined under the contract. As a practical expedient, the Bank may measure impairment on the basis of an instrument’s fair value using an observable market price.
The calculation of the present value of the estimated future cash flows of a collateralised financial asset reflects the cash flows that may result from foreclosure less costs for obtaining and selling the collateral, whether or not foreclosure is probable.
When a loan is uncollectible, it is written off against the related provision for loan impairment. Such loans are written off after all the necessary procedures have been completed and the amount of the loss has been determined. Subsequent recoveries of amounts previously written off decrease the amount of the provision for loan impairment in the income statement.
If, in a subsequent period, the amount of the impairment loss
decreases and the decrease can be related objectively to an event occurring after the impairment was recognised (such as an improvement in the debtor’s credit rating), the previously recognised impairment loss is reversed by adjusting the allowance account. The amount of the reversal is recognised in the income statements.
In addition to the measurement of impairment losses on loans and advances in accordance with the International Financial Reporting Standards as set out above, the Bank is also required by the Financial Institutions Act (FIA) 2004 to establish provisions for losses on loans and advances as follows
i) A specific provision for those loans and advances considered to be non-performing based on criteria and classification of such loans and advances established by the Bank of Uganda, as;
a) substandard assets being facilities in arrears between 91 and 180 days – 20%;
b) doubtful assets being facilities in arrears between 181 days and 360 days – 50%;
c) loss assets being facilities in arrears between over 360 days – 100%; and
ii) A general provision of at least 1% of their total outstanding credit facilities net of specific provisions and interest in suspense.
Where provisions for impairment of loans and advances determined in accordance with the Financial Institutions Act 2004 exceed amounts determined in accordance with International Financial Reporting Standards, the excess is taken to the statutory credit risk reserve as an appropriation of retained earnings. Otherwise no further accounting entries are made.
2. Summary of significant accounting policies (Continued)
57
Overview Ensuring our sustainability Financial statements
Financialstatements Notes
56 Stanbic Bank Uganda Limited Annual report for the year ended 31 December 2013 Stanbic Bank Uganda Limited Annual report for the year ended 31 December 2013
(ii) Assets carried at fair value Available-for-sale financial assets are impaired if there is objective
evidence of impairment, resulting from one or more loss events that occurred after initial recognition but before the statement of financial position date, that have an impact on the future cash flows of the asset. In addition, an available-for-sale equity instrument is generally considered impaired if a significant or prolonged decline in the fair value of the instrument below its cost has occurred. Where an available-for-sale asset, which has been re-measured to fair value directly through equity, is impaired, the impairment loss is recognised in the income statement. If any loss on the financial asset was previously recognised directly in equity as a reduction in fair value, the cumulative net loss that had been recognised in equity is transferred to the income statement and is recognised as part of the impairment loss. The amount of the loss recognised in the income statement is the difference between the acquisition cost and the current fair value, less any previously recognized impairment loss.
If, in a subsequent period, the amount relating to impairment loss
decreases and the decrease can be linked objectively to an event occurring after the write-down, the write-down is reversed through the income statement.
Financial liabilitiesThe Bank’s holding in financial liabilities represents mainly deposits from banks and customers and other liabilities. Such financial liabilities are initially recognized at fair value and subsequently measured at amortized cost.
(k) Property and equipment Recognition and measurementItems of property and equipment are measured at cost less accumulated depreciation and accumulated impairment losses.
Cost includes expenditures that are directly attributable to the acquisition of the asset. The cost of self-constructed assets includes the cost of materials and direct labour, any other costs directly attributable to bringing the assets to a working condition for their intended use, the costs of dismantling and removing the items and restoring the site on which they are located and capitalised borrowing costs. Purchased software that is integral to the functionality of the related equipment is capitalised as part of that equipment.
When parts of an item of property or equipment have different useful lives, they are accounted for as separate items (major components) of property and equipment.
Items of property and equipment are derecognised on disposal or when no future economic benefits are expected from their use or disposal. The gain or loss on disposal of an item of property and equipment is determined by comparing the proceeds from disposal with the carrying amount of the item of property and equipment, and are recognised net within other income in profit or loss.
Subsequent costsThe cost of replacing a part of an item of property or equipment is recognised in the carrying amount of the item if it is probable that the future economic benefits embodied within the part will flow to the Bank and its cost can be measured reliably.
The carrying amount of the replaced part is derecognised. The costs of the day-to-day servicing of property and equipment are recognised in profit or loss as incurred.
DepreciationDepreciation is recognised in profit or loss on a straight-line basis over the estimated useful lives of each part of an item of property and equipment since this most closely reflects the expected pattern of consumption of the future economic benefits embodied in the asset. Leased assets under finance leases are depreciated over the shorter of the lease term and their useful lives. Land is not depreciated.
The estimated useful lives for the current and comparative periods are as follows:
Leasehold buildings over the shorter period of lease or 50 years
Furniture and fittings 5 years
Motor vehicles 5 years
Other computer equipment 5 years
Laptops and personal computers 4 years
Office equipment 8 years
Depreciation methods, useful lives and residual values are reassessed at each financial year-end and adjusted if appropriate
(l) Impairment of non-financial assetsAn impairment loss in respect of goodwill is not reversed. In respect of other assets, impairment losses recognised in prior periods are assessed at each reporting date for any indications that the loss has decreased or no longer exists. An impairment loss is reversed if there has been a change in the estimates used to determine the recoverable amounts.
An impairment loss is reversed only to the extent that the asset’s carrying amount does not exceed the carrying amount that would have been determined, net of depreciation or amortisation, if no impairment loss had been recognised. (m) Income taxIncome tax expense is the aggregate of the charge to the income statement in respect of current income tax and deferred income tax. Current tax is determined for current period transactions and events and deferred tax is determined for future tax consequences Current income tax is the amount of income tax payable on the taxable profit for the year determined in accordance with the Ugandan Income Tax Act. Deferred income tax is provided in full, using the liability method, for all temporary differences arising between the tax bases of assets and liabilities and their carrying values for financial reporting purposes. However, if the deferred income tax arises from the initial recognition of an asset or liability in a transaction other than a business combination that at the time of the transaction affects neither accounting nor taxable profit nor loss, it is not accounted for.
Deferred income tax is determined using tax rates that have been enacted or substantively enacted at the statement of financial position date and are expected to apply when the related deferred income tax asset is realised or the deferred income tax liability is settled.
Deferred income tax assets are recognised only to the extent that it is probable that future taxable profits will be available against which temporary differences can be utilised.
Deferred tax related to fair value re-measurement of available –for-sale investments are credited or charged directly to equity.
2. Summary of significant accounting policies (Continued) 2. Summary of significant accounting policies (Continued)
(n) Cash and cash equivalentsFor the purposes of the statement of cash flows, cash and cash equivalents comprise balances with less than three months’ maturity from the date of acquisition, including cash and non-restricted balances with central banks, treasury bills and other eligible bills, loans and advances to banks, amounts due from other banks and government securities.
(o) Accounting for leases Leases in which a significant portion of the risks and rewards of ownership are retained by the lessor are classified as operating leases. Leases where the lessee assumes substantially all the risks and rewards incidental to ownership are classified as finance leases. Similarly leases of assets under which the lessor retains a significant portion of the risks and rewards of ownership are classified as operating leases (a) With the Bank as lessee To date, all leases entered into by the Bank are operating leases.
Payments made under operating leases are charged to the income statement on a straight-line basis over the period of the lease. Lease incentives received are recognised as an integral part of the total lease expense, over the term of the lease.
(b) With the Bank as lessor When assets are leased out under a finance lease, the present value
of the lease payments is recognised as a receivable. The difference between the gross receivable and the present value of the receivable is recognised as unearned finance income. Lease income is recognised over the term of the lease using the net investment method (before income tax), which reflects a constant periodic rate of return.
(p) Employee benefits(i) Retirement benefit obligations The Bank operates a defined contribution pension scheme for its
employees. The defined contribution plan is a pension plan under which the Bank pays fixed contributions into a fund managed by a board of trustees and will have no legal or constructive obligations to pay further contributions if the fund does not hold sufficient assets to pay all employees benefits relating to employee service in the current and prior periods.
In addition all employees are obliged to be members of the National Social Security Fund, a state managed defined contribution pension scheme. The Bank contributes to the scheme in line with the requirements of the National Social Security Fund Act.
The regular contributions by the Bank and employees constitute net periodic costs for the year in which they are due and as such are included in employee benefit expenses.
The Bank’s contributions to the defined contribution schemes are charged to the income statement in the year to which they relate.
(ii) Short term benefits Short term benefits consist of salaries, accumulated leave
payments, bonuses and any non-monetary benefits such as medical aid contributions. Short-term employee benefit obligations are measured on an undiscounted basis and are expenses as the related service is provided. A liability is recognised for the amount expected to be paid under short term cash bonus plans or accumulated leave if the Bank has a present legal or constructive obligation to pay this amount as a result of past service provided by the employee and the obligation can be estimated reliably.
(iii) Termination benefits Termination benefits are recognised as an expense when the
Bank is committed without realistic possibility of withdrawal, to a formal detailed plan to terminate employment before the normal retirement date, or to provide termination benefits as a result of an offer made to encourage voluntary redundancy. Termination benefits for voluntary redundancies are recognised if the Bank has made an offer encouraging voluntary redundancy, it is probable that the offer will be accepted, and the number of acceptances can be reliably estimated.
(iv) Share based payment transactions The grant date fair value of equity-settled share-based payment
awards (i.e. stock options) granted to employees is recognised as an employee expense, with a corresponding increase in equity, over the period in which the employees unconditionally become entitled to the awards. The amount recognised as an expense is adjusted to reflect the number of share awards for which the related service and non-market performance vesting conditions are expected to be met such that the amount ultimately recognised as an expense is based on the number of share awards that do meet the related service and non-market performance conditions at the vesting date. For share-based payment awards with non-vesting conditions, the grant-date fair value of the share-based payment is measured to reflect such conditions and there is no true-up for differences between expected and actual outcomes. The estimate of the number of options/shares expected to vest is reassess and adjusted against p/l and equity over the remaining vesting period. Also include the accounting treatment upon vesting and settlement of shares/options.
(v) Other entitlements The estimated monetary liability for employees’ accrued annual
leave entitlement at the reporting date is recognised as an expense accrual.
(q) Derivative financial instrumentsDerivatives, which comprise forward foreign exchange contracts and swaps, are initially recognised at fair value on the date the derivative contract is entered into and are subsequently measured at fair value. The fair value is determined using forward exchange market rates at the statement of financial position date or appropriate pricing models. The derivatives do not qualify for hedge accounting. Changes in the fair value of derivatives are recognised immediately in the income statement.
(r) BorrowingsBorrowings are recognised initially at fair value, being their issue proceeds (fair value of consideration received) net of transaction costs incurred. Borrowings are subsequently stated at amortised cost; any difference between proceeds net of transaction costs and the redemption value is recognised in the income statement over the period of the borrowings using the effective interest method.
(s) Sale and repurchase agreements
Securities sold subject to repurchase agreements (‘repos’) are classified in the financial statements as pledged assets when the transferee has the right by contract or custom to sell or re-pledge the collateral; the counterparty liability is included in amounts due to other banks, deposits from banks, other deposits or deposits due to customers, as appropriate.
Securities purchased under agreements to resell (‘reverse repos’) are recorded as loans and advances to other banks or customers, as appropriate.

59
Overview Ensuring our sustainability Financial statements
Financialstatements Notes
58 Stanbic Bank Uganda Limited Annual report for the year ended 31 December 2013 Stanbic Bank Uganda Limited Annual report for the year ended 31 December 2013
The difference between sale and repurchase price is treated as interest and accrued over the life of the agreements using the effective interest method. Securities lent to counterparties are also retained in the financials. (t) Acceptances and letters of creditAcceptances and letters of credit are accounted for as off-balance sheet transactions and disclosed as contingent liabilities.
(u) Intangible assets GoodwillGoodwill represents the excess of the cost of an acquisition over the fair value of the Bank’s share of the net assets of the acquired company at the date of acquisition. Goodwill is tested annually for impairment and carried at cost less accumulated impairment losses.
Goodwill on acquisitions is reported in the statement of financial position as an intangible asset.
At each statement of financial position date the Bank assesses whether there is any indication of impairment. If such indications exist, an analysis is performed to assess whether the carrying amount of goodwill is fully recoverable.
A write down is made if the carrying amount exceeds the recoverable amount. Impairment losses are allocated first to reduce the carrying amount of any goodwill allocated to a CGU and then to reduce the carrying amount of other assets in the CGU on a pro rata basis.
Computer software development costsCosts associated with maintaining computer software programmes are recognized as an expense as incurred. Development costs that are directly attributable to the design and testing of identifiable and unique software products controlled by the Bank are recognized as intangible assets when the following criteria are met:
• It is technically feasible to complete the software product so that it will be available for use;
• management intends to complete the software product and use or sell it;
• there is an ability to use or sell the software product;• it can be demonstrated how the software product will generate
probable future economic benefits;
• adequate technical, financial and other resources to complete the development and to use or sell the software product are available; and
• the expenditure attributable to the software product during its development can be reliably measured.
Directly attributable costs that are capitalized as part of the software product include the software development employee costs and an appropriate portion of relevant overheads.
Other development expenditures that do not meet these criteria are recognized as an expense as incurred. Development costs previously recognized as an expense are not recognized as an asset in a subsequent period.
Computer software development costs recognized as assets are amortized over their estimated useful lives, which does not exceed three years.
Acquired computer software licenses are capitalized on the basis of the costs incurred to acquire and bring to use the specific software. These costs are amortized on the basis of the expected useful lives. Software has a maximum expected useful life of 5 years.
(v) ProvisionsProvisions are recognised when the Bank has a present legal or constructive obligation as a result of past events, where it is probable that an outflow of resources embodying economic benefits will be required to settle the obligation, and a reliable estimate of the amount of the obligation can be made.
Employee entitlements to annual leave and long service leave are recognised when they accrue to employees.
A provision is made for the estimated liability for annual leave and long-service leave as a result of services rendered by employees up to the statement of financial position date.
(w) Share capital The bank classifies capital instruments as financial liabilities or equity instruments in accordance with the substance of the contractual terms of the instruments.
Dividends on ordinary sharesDividends on ordinary shares are charged to equity in the period in which they are declared. Dividends declared after the statement of financial position date are disclosed in the dividend note and not treated as an appropriation from retained earnings.
Earnings per shareThe Bank presents basic and diluted earnings per share (EPS) data for its ordinary shares. Basic EPS is calculated by dividing the profit or loss attributable to ordinary shareholders of the Bank by the weighted average number of ordinary shares outstanding during the period.
Diluted EPS is determined by adjusting the profit or loss attributable to ordinary shareholders and the weighted average number of ordinary shares outstanding for the effects of all dilutive potential ordinary shares.
Share issue costsIncreamental external costs directly attributable to a transaction that increases or decreases equity are deducted from equity, net of related tax. All other share issue costs are expensed.
(x) Financial guarantee contractsFinancial guarantee contracts are contracts that require the issuer to make specified payments to reimburse the holder for a loss it incurs because a specified debtor fails to make payment when due, in accordance with the terms of a debt instrument.
Such financial guarantees are given to banks, financial institutions and other bodies on behalf of customers to secure loans, overdrafts and other facilities.
Financial guarantees are initially recognised in the financial statements at fair value on the date the guarantee was given. Subsequent to initial recognition, the Bank’s liabilities under such guarantees are measured at the higher of the initial investment, less amortisation calculated to recognise in the income statement the fee income earned on a straight line basis over the life of the guarantee and the best estimate of the expenditure required to settle any financial obligation arising at the Statement of financial position date.
(y) Equity compensation plansThe parent company operates two equity settled share based compensation plans through which certain key management staff of the bank are compensated. The fair value of equity settled share options is determined on the grant date and accounted for as an employee service expense over the vesting period of the share options. At each Statement of financial position date the estimate of the number of options expected to vest is reassessed and adjusted against income over the remaining vesting period.
2. Summary of significant accounting policies (Continued)
(z) Investment in associates and joint venturesAssociates are those entities in which the bank has significant influence, but not control, over the financial and operating policies. Significant influence generally accompanies, but is not limited to, a shareholding of between 20% and 50% of the voting rights. Investments in mutual funds over whose financial and operating policies the group is able to exercise significant influence (including those in which the bank has between a 20% and 50% economic interest) are also classified as associates. A jointly controlled entity is one where a contractual arrangement establishes joint control over the economic activity of the entity.
Interests in associates and jointly controlled entities are accounted for using the equity method and are measured in the consolidated statement of financial position at an amount that reflects the group’s share of the net assets of the associate or jointly controlled entity (including goodwill).
Equity accounting involves recognising the investment initially at fair value, including goodwill, and subsequently adjusting the carrying value for the group’s share of the associates’ and jointly controlled entities’ income and expenses and OCI.
Equity accounting of losses in associates and jointly controlled entities is restricted to the interests in these entities, including unsecured receivables or other commitments, unless the group has an obligation or has made payments on behalf of the associate or jointly controlled entity.
Unrealised intra-group profits are eliminated in determining the group’s share of equity accounted profits. Unrealised losses are eliminated in the same way as unrealised gains, but only to the extent that there is no evidence of impairment.
Equity accounting is applied from the date on which the entity becomes an associate or jointly controlled entity up to the date on which it ceases to be an associate or jointly controlled entity. The accounting policies of associates and jointly controlled entities have been changed where necessary to ensure consistency with the policies of the group.
Investments in associates and jointly controlled entities are accounted for at cost less impairment losses in the company’s annual financial statements
(aa) Comparatives Where necessary, the comparative figures have been adjusted to conform to changes in presentation in the current year.
3 Financial risk management
(a) Strategy in using financial instrumentsBy their nature, the Bank’s activities are principally related to the use of financial instruments including derivatives. The Bank accepts deposits from customers at both fixed and floating rates, and for various periods, and seeks to earn above-average interest margins by investing these funds in high-quality assets. The Bank seeks to increase these margins by consolidating short-term funds and lending for longer periods at higher rates, while maintaining sufficient liquidity to meet all claims that might fall due.
The Bank’s risk management policies are designed to identify and analyse these risks, to set appropriate risk limits and controls, and to monitor the risks and adherence to limits by means of reliable and up-to-date information systems. The Bank regularly reviews its risk management policies and systems to reflect changes in markets, products and emerging best practice. Risk management is carried out
centrally under policies approved by the Board of Directors. The Global Markets team identifies, evaluates and hedges financial risks in close co-operation with the Bank’s operating units.
The Board provides written principles for overall risk management, as well as written policies covering specific areas, such as foreign exchange risk, interest rate risk, credit risk, use of derivative financial instruments and non-derivative financial instruments. In addition, internal audit is responsible for the independent review of risk management and the control environment. The most important types of risk are credit risk, liquidity risk, market risk and other operational risk. Market risk includes currency risk, interest rate and other price risk.
The Bank also seeks to raise its interest margins by obtaining above-average margins, net of allowances, through lending to commercial and retail borrowers with a range of credit standing. Such exposures involve not just on-statement of financial position loans and advances; the Bank also enters into guarantees and other commitments such as letters of credit and performance, and other bonds.
The Bank also trades in financial instruments where it takes positions in traded and over-the-counter instruments to take advantage of short-term market movements in bonds, currency and interest rate. The Board places trading limits on the level of exposure that can be taken in relation to both overnight and intra-day market positions.
Foreign exchange and interest rate exposures associated derivatives are normally offset by entering into counterbalancing positions, thereby controlling the variability in the net cash amounts required to liquidate market positions.
(b) Capital managementThe Bank’s objectives when managing capital, which is a broader concept than the equity on the face of the statement of financial position, are:
• To comply with the capital requirements set by the regulator, Bank of Uganda.
• To safeguard the Bank’s ability to continue as a going concern so that it can continue to provide returns for shareholders and benefits for other stakeholders; and
• To maintain a strong capital base to support the development of its business.
The Bank monitors the adequacy of its capital using ratios established by Bank of Uganda (BOU), which ratios are broadly in line with those for the Bank for International Settlements (BIS). These ratios measure capital adequacy by comparing the Bank’s eligible capital with its Statement of financial position assets, off-balance-sheet commitments and market and other risk positions at weighted amounts to reflect their relative risk.
The market risk approach covers the general market risk and the risk of open positions in currencies and debt and equity securities. Assets are weighted according to broad categories of notional credit risk, being assigned a risk weighting according to the amount of capital deemed to be necessary to support them. Four categories of risk weights (0%, 20%, 50%, and 100%) are applied. Certain asset categories have intermediate weightings.
The Bank is required at all times to maintain a core capital (tier 1) of not less than 8% of total risk adjusted assets plus risk adjusted off statement of financial position items and a total capital (tier 1 + tier 2) of not less than 12% of its total risk adjusted assets plus risk adjusted off Statement of financial position items.
Off-balance-sheet credit related commitments and forwards are taken into account by applying different categories of credit conversion
2. Summary of significant accounting policies (Continued)

61
Overview Ensuring our sustainability Financial statements
Financialstatements Notes
60 Stanbic Bank Uganda Limited Annual report for the year ended 31 December 2013 Stanbic Bank Uganda Limited Annual report for the year ended 31 December 2013
factors, designed to convert these items into statement of financial position equivalents. The resulting credit equivalent amounts are then weighted for credit risk using the same percentages as for Statement of financial position assets.
Tier 1 capital consists of shareholders’ equity comprising paid up share capital, share premium and retained earnings less intangible assets and investments in financial companies, not consolidated. Tier 2 capital includes the Bank’s eligible long-term loans, mark to market adjustment on available for sale securities and general provisions. Tier 2 capital is limited to 100% of Tier 1 capital.
The table below summarises the composition of the regulatory capital.
2013 2012
UShs' 000 UShs' 000
Core capital (Tier 1)
Shareholders' equity 51 188 670 51 188 670
Share premium - -
Prior years retained profits 339 886 049 259 151 980
Current year profits 101 851 527 130 734 072
Available for sale revaluation reserve (3 351 374) (5 400 689)
Dividends paid/proposed (150 000 000) (120 000 000)
Less: Deductions determined by Bank of Uganda (12 796 873) (14 422 546)
Total core capital 326 777 999 301 251 487
Supplementary capital (Tier 2)
Unencumbered general provisions for losses 22 951 274 22 273 850
Statutory credit risk reserve 8 276 510 15 365 255
Subordinated term debt 47 811 668 49 112 515
Total supplementary capital 79 039 452 86 751 621
Total capital (core and supplementary) 405 817 451 388 003 108
Breakdown of deductions determined by Bank of Uganda
2013 2012
UShs' 000 UShs' 000
Goodwill and other intangible assets 4 031 905 4 494 862
Equity investments in unconsolidated entities 1 088 789 207 720
unrealised foreign exchange gains on securities 126 833 848 934
Deferred tax income 7 549 346 8 871 029
Total deductions determined by Central bank 12 796 873 14 422 545
The Bank’s capital adequacy level was as follows:
Financial position nominal balance Risk weighted balance
2013 2012 2013 2012
UShs' 000 UShs' 000 UShs' 000 UShs' 000
Statement of financial position
Cash and balances with Bank of Uganda 421 381 332 507 437 302 - -
Government securities - available for sale 618 069 090 449 407 315 - -
Government securities - held for trading 340 221 294 274 966 482 - -
Pledged assets 1 851 658 2 651 551 - -
Placements with local banks 2 500 689 20 000 000 500 138 4 000 000
Repo - Bank of Uganda 27 049 301 - - -
Placements with foreign/group banks 299 993 430 254 144 375 155 488 320 94 172 769
Loans and advances to customers 1 415 040 925 1 460 277 630 1 415 040 925 1 468 743 153
Other investment securities 1 146 198 1 051 920 57 409 844 200
Prepaid operating leases 129 674 140 012 129 674 140 012
Other assets 70 392 186 83 076 192 62 843 494 64 395 802
Goodwill 1 901 592 1 901 592 - -
Other intangible assets 2 130 313 2 593 270 - -
Property and equipment 39 790 358 40 945 759 39 790 358 40 945 759
3 241 598 040 3 098 593 400 1 673 850 318 1 673 241 695
Off-balance sheet items
Contingencies secured by cash collateral 9 520 550 15 453 133 - -
Guarantees and acceptances 108 859 815 68 932 131 108 859 815 68 932 131
Performance bonds 65 082 461 87 198 412 32 541 231 43 599 206
Trade related and self liquidating credits 74 392 579 50 102 814 14 878 516 10 020 563
Other commitments 261 276 846 238 314 664 130 638 423 119 157 332
519 132 251 460 001 154 286 917 985 241 709 232
Total risk weighted assets 1 960 768 303 1 914 950 927
Capital Bank ratio FIA minimum ratio
2013 2012 2013 2012 2013 2012
UShs' 000 UShs' 000 % % % %
Tier 1 capital 326 777 998 301 251 487 16.7% 15.7% 8% 8%
Tier 1 + Tier 2 capital 405 817 450 388 003 108 20.7% 20.3% 12% 12%
3 (b) Capital management (Continued)
63
Overview Ensuring our sustainability Financial statements
Financialstatements Notes
62 Stanbic Bank Uganda Limited Annual report for the year ended 31 December 2013 Stanbic Bank Uganda Limited Annual report for the year ended 31 December 2013
(c) Credit riskThe Bank takes on exposure to credit risk, which is the risk that a counter party will cause a financial loss for the Bank by failing to discharge an obligation in full when due. Impairment provisions are provided for losses that have been incurred at the statement of financial position date. Significant changes in the economy, or in the health of a particular industry segment that represents a concentration of the Bank’s portfolio, could result in losses that are different from those provided for at the statement of financial position date. Management therefore carefully manages its exposure to credit risk.
The Bank structures the levels of credit risk it undertakes by placing limits on the amount of risk accepted in relation to one borrower, or groups of borrowers, and to industry segments. Such risks are monitored on a revolving basis and subject to annual or more frequent review. Limits on the level of credit risk by product, industry sector and by country are approved by the Board of Directors.
The exposure to any one borrower including banks is further restricted by sub-limits covering on- and off-balance sheet exposures and daily delivery risk limits in relation to trading items such as forward foreign exchange contracts. Actual exposures against limits are monitored daily.
Exposure to credit risk is managed through regular analysis of the ability of borrowers and potential borrowers to meet interest and capital repayment obligations and by changing lending limits where appropriate. Exposure to credit risk is also managed in part by obtaining collateral and corporate and personal guarantees, but a significant portion is personal lending where no such facilities can be obtained.
(a) Credit risk measurement Debt securitiesAll debt securities the bank purchases are government paper with no credit risk associated.
Loans and advancesIn measuring credit risk of loan and advances to customers and to banks at a counterparty level, the Bank reflects three components
(i) the ‘probability of default’ by the client or counterparty on its contractual obligations;
(ii) current exposures to the counterparty and its likely future development, from which the Bank derives the ‘exposure at default’; and
(iii) the likely recovery ratio on the defaulted obligations (the ‘loss given default’).
These credit risk measurements, which reflect expected loss (the ‘expected loss model’) and are required by the Basel Committee on Banking Regulations and the Supervisory Practices (the Basel Committee), are embedded in the Bank’s daily operational management. The operational measurements can be contrasted with impairment allowances required under IAS 39, which are based on losses that have been incurred at the statement of financial position date (the ‘incurred loss model’) rather than expected losses (Note 3 (I) (ii)).
(i) The Bank assesses the probability of default of individual counterparties using internal rating tools tailored to the various categories of counterparty. They have been developed internally and combine statistical analysis with credit officer judgment and are validated, where appropriate, by comparison with externally available data. Clients of the Bank are segmented into four rating classes. The Bank’s rating scale, which is shown below, reflects the range of default probabilities defined for each rating class. This means that, in principle, exposures migrate between classes as the assessment of their probability of default changes. The
rating tools are kept under review and upgraded as necessary. The Bank regularly validates the performance of the rating and their predictive power with regard to default events.
The Bank’s internal ratings scale and mapping to external ratings and representing days in arrears is as below:
Bank’s rating Description Day
1 Standard monitoring 0-29
2 Special monitoring 30-89
3 Sub-standard 90-180
4 Doubtful 181-365
5 Loss 365+
Observed defaults per rating category vary year on year, especially over an economic cycle.
(ii) Exposure at default is based on the amounts the Bank expects to be owed at the time of default. For example, for a loan this is the face value. For a commitment, the Bank includes any amount already drawn plus the further amount that may have been drawn by the time of default, should it occur.
(iii) Loss given default or loss severity represents the Bank’s expectation of the extent of loss on a claim should default occur. It is expressed as percentage loss per unit of exposure and typically varies by type of counterparty, type and seniority of claim and availability of collateral or other credit mitigation.
(a) Collateral The Bank employs a range of policies and practices to mitigate
credit risk. The most traditional of these is the taking of security for funds advanced, which is common practice. The Bank implements guidelines on the acceptability of specific classes of collateral or credit risk mitigation. The principal collateral types for loans and advances are:
• Mortgages over residential properties;
• Charges over business assets such as premises, inventory and accounts receivable;
• Charges over financial instruments such as debt securities and equities.
Longer-term finance and lending to corporate entities are generally secured; revolving individual credit facilities are generally unsecured. In addition, in order to minimise the credit loss the Bank will seek additional collateral from the counterparty as soon as impairment indicators are noticed for the relevant individual loans and advances.
Collateral held as security for financial assets other than loans and advances is determined by the nature of the instrument. Debt securities, treasury and other eligible bills are generally unsecured, with the exception of asset-backed securities and similar instruments, which are secured by portfolios of financial instruments.
(b) Derivatives The Bank maintains strict control limits on net open derivative
positions (ie, the difference between purchase and sale contracts), by both amount and term. At any one time, the amount subject to credit risk is limited to the current fair value of instruments that are favourable to the Bank (ie, assets where their fair value
is positive), which in relation to derivatives is only a small fraction of the contract, or notional values used to express the volume of instruments outstanding. This credit risk exposure is managed as part of the overall lending limits with customers, together with potential exposures from market movements. Collateral or other security is not usually obtained for credit risk exposures on these instruments, except where the Bank requires margin deposits from counterparties.
Settlement risk arises in any situation where a payment in cash, securities or equities is made in the expectation of a corresponding receipt in cash, securities or equities. Daily settlement limits are established for each counterparty to cover the aggregate of all settlement risk arising from the Bank’s market transactions on any single day.
(c) Credit related commitments The primary purpose of these instruments is to ensure that funds
are available to a customer as required. Guarantees and standby letters of credit, which represent irrevocable assurances that Bank will make payments in the event that a customer cannot meet its obligations to third parties, carry the same credit risk as loans. Documentary and commercial letters of credit, which are written undertakings by the Bank on behalf of a customer authorising a third party to draw drafts on the Bank up to a stipulated amount under specific terms and conditions, are collateralised by the underlying shipments of goods to which they relate and therefore carry less risk than a direct borrowing.
Bank’s rating categories
2013 2012
Loans and advances %
Impairment provision % Loans and advances %
Impairment provision %
Standard and special monitoring 95.0 1.6 94.0 1.6
Sub-standard, doubtful and loss 5.0 53.3 6.0 49.6
100.0 4.2 100.0 4.5
The internal rating tool assists management to determine whether objective evidence of impairment exists under IAS 39, based on the following criteria set out by the Bank:
• Delinquency in contractual payments of principal or interest;
• Cash flow difficulties experienced by the borrower (e.g. equity ratio, net income percentage of sales);
• Breach of loan covenants or conditions;
• Initiation of bankruptcy proceedings;
• Deterioration of the borrower’s competitive position;
• Deterioration in the value of collateral; and
The Bank’s policy requires the review of individual financial assets that are above materiality thresholds at least annually or more regularly when individual circumstances require. Impairment allowances on individually assessed accounts are determined by an
3 (c) Credit risk (Continued)
Commitments to extend credit represent unused portions of authorisations to extend credit in the form of loans, guarantees or letters of credit. With respect to credit risk on commitments to extend credit, the Bank is potentially exposed to loss in an amount equal to the total unused commitments. However, the likely amount of loss is less than the total unused commitments, as most commitments to extend credit are contingent upon customers maintaining specific credit standards. The Bank monitors the term to maturity of credit commitments because longer-term commitments generally have a greater degree of credit risk than shorter-term commitments.
(b) Impairment and provisioning policy The internal and external rating systems described in Note 3(c) (i)
focus more on credit-quality mapping from the inception of the lending and investment activities. In contrast, impairment provisions are recognised for financial reporting purposes only for losses that have been incurred at the statement of financial position date based on objective evidence of impairment (see Note 2(I)). Due to the different methodologies applied, the amount of incurred credit losses provided for in the financial statements are usually lower than the amount determined from the expected loss model that is used for internal operational management and banking regulation purposes.
The impairment provision shown in the statement of financial position at year-end is derived from each of the five internal rating grades. However, the majority of the impairment provision comes from the bottom two gradings. The table below shows the percentage of the Bank’s on and off balance sheet items relating to loans and advances and the associated impairment provision for each of the Bank’s internal rating categories.
evaluation of the incurred loss at reporting date on a case-by-case basis, and are applied to all individually significant accounts. The assessment normally encompasses collateral held (including re-confirmation of its enforceability) and the anticipated receipts for that individual account.
Collectively assessed impairment allowances are provided for:
(i) Portfolios of homogenous assets that are individually below materiality thresholds; and
(ii) Losses that have been incurred but have not yet been identified, by using the available historical experience, experienced judgment and statistical techniques.
(iii) Maximum exposure to credit risk before collateral held or other credit impairments
65
Overview Ensuring our sustainability Financial statements
Financialstatements Notes
64 Stanbic Bank Uganda Limited Annual report for the year ended 31 December 2013 Stanbic Bank Uganda Limited Annual report for the year ended 31 December 2013
3 (c) Credit risk (Continued)
2013 2012
UShs' 000 UShs' 000
Bank of Uganda 229 327 587 319 069 431
Loans and advances to banks 326 787 104 274 144 375
Investment securities
Treasury bonds - available for sale 389 494 443 205 558 559
Treasury bills - available for sale 228 574 647 243 848 756
Treasury bills - pledged assets 1 851 658 2 651 551
Loans and advances to customers
Loans to individuals
Overdrafts 1 529 689 2 299 837
Term loans 417 877 764 342 187 425
Mortgages 109 467 891 113 494 677
Loans to corporate entities
Large corporate entities 631 905 826 681 065 739
Small and medium size entities 316 809 705 389 239 933
Trading assets
Treasury bonds 59 078 600 66 501 313
Treasury bills 281 142 694 208 465 169
Derivative financial instrumentss 129 020 1 032 432
Other 52 005 348 65 718 661
3 045 981 976 2 915 277 858
Credit risk exposures relating to assets not included on the statement of financial position are as follows:
2013 2012
UShs' 000 UShs' 000
Financial guarantees 177 277 890 161 819 874
Loan commitments and other credit related liabilities 341 854 361 298 181 280
519 132 251 460 001 154
3 565 114 226 3 375 279 011
The above table represents a worst case scenario of credit risk exposure to the Bank at 31 December 2013 and 2012, without taking account of any collateral held or other credit enhancements attached. For on-balance-sheet assets, the exposures set out above are based on net carrying amounts
as reported in the statement of financial position.
Credit risk exposures relating to assets included on the statement of financial position are as follows: The table below shows the collateral coverage for the customer loans as at 31 December 2013.
Customer loans Netting off agreements
Exposure after netting off
Collateral cover51-100%
Collateral coverOver 100%
Total
UShs' 000 UShs' 000 UShs' 000 UShs' 000 UShs' 000 UShs' 000
Secured loans 865 200 305 249 187 864 951 118 631 369 167 233 831 138 865 200 305
Unsecured loans 612 390 569 - 612 390 569 - - 612 390 569
1 477 590 874 249 187 1 477 341 687 631 369 167 233 831 138 1 477 590 874
As at 31 December 2012
Customer loans
Netting off
agreements Exposure after
netting off 51-100%
Over 100%
Total
UShs’ 000 UShs’ 000 UShs’ 000 UShs’ 000 UShs’ 000 UShs’ 000
Secured loans 1,085,364,238 1,333,353 1,084,030,885 666,286,854 419,077,384 1,085,364,238
Unsecured loans 442,923,372 - 442,923,372 - - 442,923,372
1,528,287,610 1,333,353 1,526,954,257 666,286,854 419,077,384 1,528,287,610
Management remains confident in its ability to continue to control the exposure of credit risk to the Bank resulting from both its loan and advances portfolio and debt securities based on the following:
• 95%oftheloansandadvancesportfolioiscategorisedinthetoptwogradesoftheinternalratingsystem(2012:94%);• Mortgageloans,arebackedbycollateral;• 76%oftheloansandadvancesportfolioareconsideredtobeneitherpastduenorimpaired(2012:78.7%);and• AlldebtsecuritiesheldbytheBankareissuedbytheBankofUgandaonbehalfoftheGovernmentofUganda.
(iv) Loans and advances are summarised as follows:
2013 2012
Loans and advances to customers
Loans and advances to banks
Loans and advances to customers
Loans and advances to banks
UShs'000 UShs'000 UShs'000 UShs'000
Neither past due nor impaired 1 122 895 989 181 124 853 1 203 435 688 223 595 642
Past due but not impaired 280 429 902 - 232 689 052 -
Impaired loans and advances 74 264 983 - 92 162 870 -
Gross loans and advances 1 477 590 874 181 124 853 1 528 287 610 223 595 642
Allowances for impairment (62 549 949) - (68 009 980) -
1 415 040 925 181 124 853 1 460 277 630 223 595 642
The total impairment provision for loans and advances is UShs 62,549 million (2012: UShs 68,009 million) of which UShs 39,598 million (2012: UShs 45,736 million) represents the individually impaired loans and the remaining amount of UShs 22,951 million (2012: UShs 22,274 million) represents the portfolio provision. Further information of the impairment allowance for loans and advances to banks and to customers is provided in Note 20.
3 (c) Credit risk (Continued)
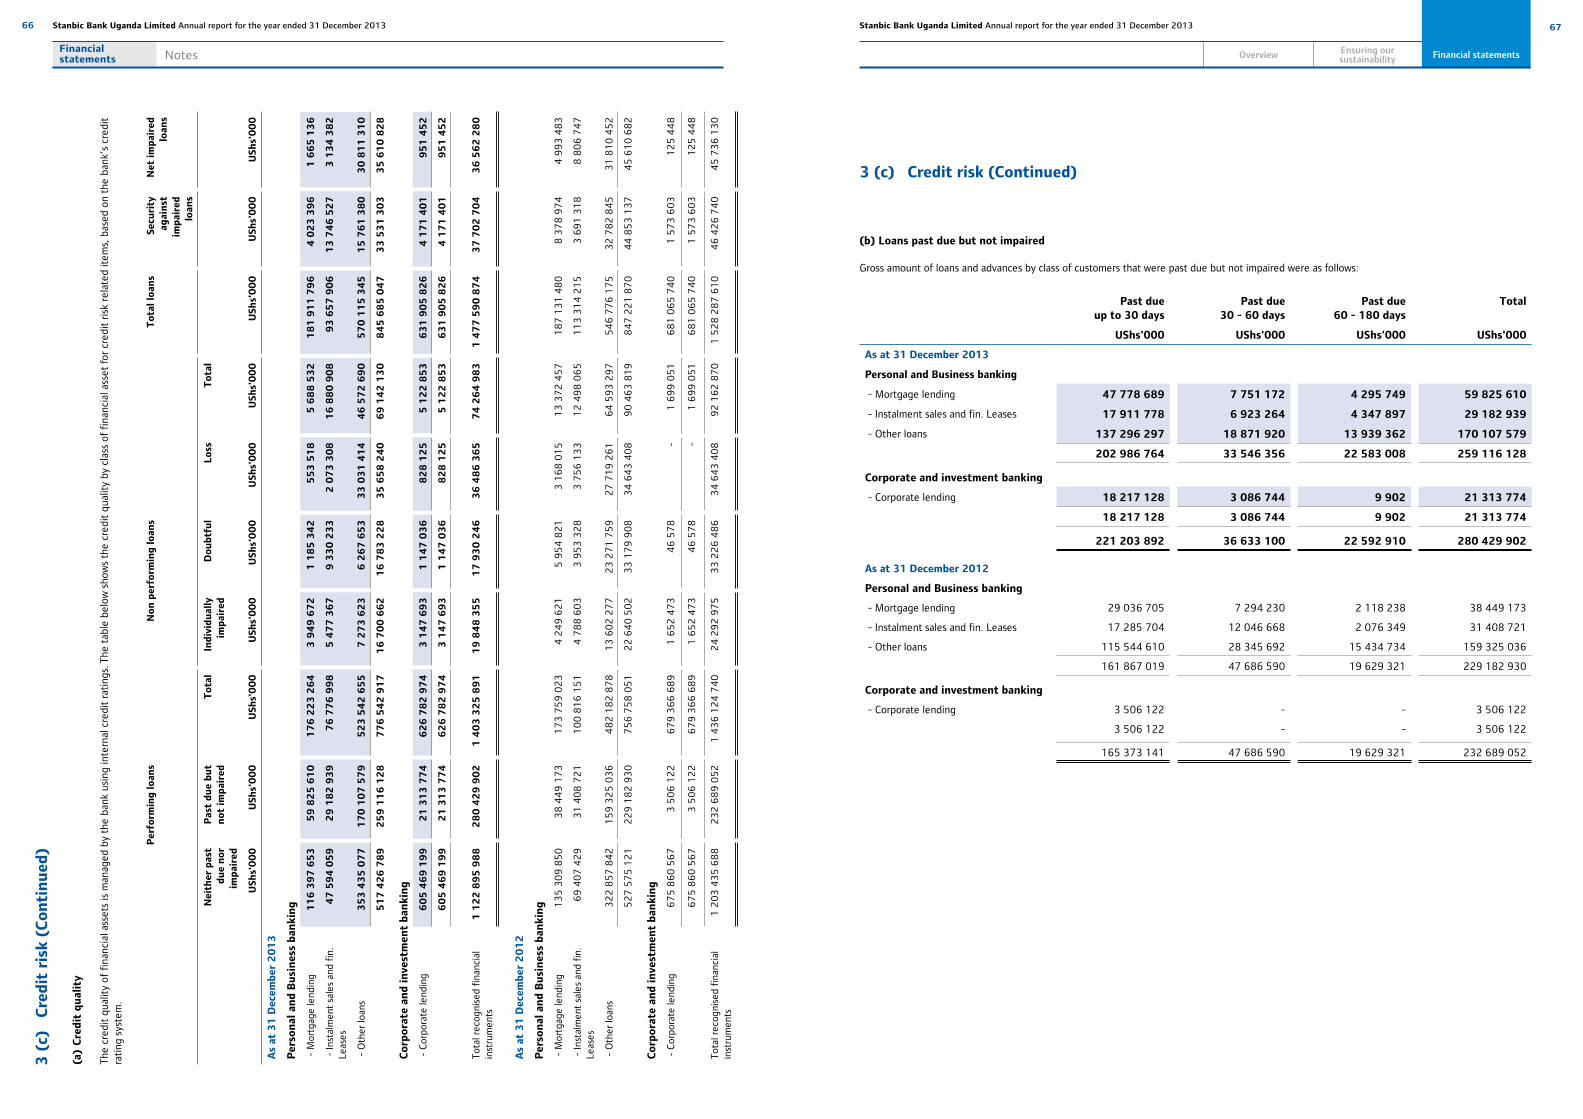
67
Overview Ensuring our sustainability Financial statements
Financialstatements Notes
66 Stanbic Bank Uganda Limited Annual report for the year ended 31 December 2013 Stanbic Bank Uganda Limited Annual report for the year ended 31 December 2013
(a)
Cre
dit
qu
alit
y
The
cre
dit
qual
ity
of f
inan
cial
ass
ets
is m
anag
ed b
y th
e ba
nk u
sing
inte
rnal
cre
dit
rati
ngs.
The
tab
le b
elow
sho
ws
the
cred
it q
ualit
y by
cla
ss o
f fi
nanc
ial a
sset
for
cre
dit
risk
rel
ated
item
s, b
ased
on
the
bank
’s c
redi
t ra
ting
sys
tem
.
Per
form
ing
lo
ans
No
n p
erfo
rmin
g l
oan
sT
ota
l lo
ans
Sec
uri
ty
agai
nst
im
pai
red
lo
ans
Net
im
pai
red
lo
ans
Nei
ther
pas
t d
ue
no
r im
pai
red
Pas
t d
ue
bu
t n
ot
imp
aire
dT
ota
lIn
div
idu
ally
im
pai
red
Do
ub
tfu
lL
oss
To
tal
USh
s'0
00
USh
s'0
00
USh
s'0
00
USh
s'0
00
USh
s'0
00
USh
s'0
00
USh
s'0
00
USh
s'0
00
USh
s'0
00
USh
s'0
00
As
at 3
1 D
ecem
ber
20
13
Per
son
al a
nd
Bu
sin
ess
ban
kin
g
- M
ortg
age
lend
ing
11
6 3
97
65
3
59
82
5 6
10
1
76
22
3 2
64
3
94
9 6
72
1
18
5 3
42
5
53
51
8
5 6
88
53
2
18
1 9
11
79
6
4 0
23
39
6
1 6
65
13
6
- In
stal
men
t sa
les
and
fin.
Le
ases
47
59
4 0
59
2
9 1
82
93
9
76
77
6 9
98
5
47
7 3
67
9
33
0 2
33
2
07
3 3
08
1
6 8
80
90
8
93
65
7 9
06
1
3 7
46
52
7
3 1
34
38
2
- O
ther
loan
s 3
53
43
5 0
77
1
70
10
7 5
79
5
23
54
2 6
55
7
27
3 6
23
6
26
7 6
53
3
3 0
31
41
4
46
57
2 6
90
5
70
11
5 3
45
1
5 7
61
38
0
30
81
1 3
10
51
7 4
26
78
9
25
9 1
16
12
8
77
6 5
42
91
7
16
70
0 6
62
1
6 7
83
22
8
35
65
8 2
40
6
9 1
42
13
0
84
5 6
85
04
7
33
53
1 3
03
3
5 6
10
82
8
Co
rpo
rate
an
d i
nve
stm
ent
ban
kin
g
- C
orpo
rate
lend
ing
60
5 4
69
19
9
21
31
3 7
74
6
26
78
2 9
74
3
14
7 6
93
1
14
7 0
36
8
28
12
5
5 1
22
85
3
63
1 9
05
82
6
4 1
71
40
1
95
1 4
52
60
5 4
69
19
9
21
31
3 7
74
6
26
78
2 9
74
3
14
7 6
93
1
14
7 0
36
8
28
12
5
5 1
22
85
3
63
1 9
05
82
6
4 1
71
40
1
95
1 4
52
Tot
al r
ecog
nise
d fi
nanc
ial
inst
rum
ents
1 1
22
89
5 9
88
2
80
42
9 9
02
1
40
3 3
25
89
1 1
9 8
48
35
5
17
93
0 2
46
3
6 4
86
36
5
74
26
4 9
83
1
47
7 5
90
87
4
37
70
2 7
04
3
6 5
62
28
0
As
at 3
1 D
ecem
ber
20
12
Per
son
al a
nd
Bu
sin
ess
ban
kin
g
- M
ortg
age
lend
ing
13
5 3
09
85
0
38
44
9 1
73
1
73
75
9 0
23
4
24
9 6
21
5
95
4 8
21
3
16
8 0
15
1
3 3
72
45
7
18
7 1
31
48
0
8 3
78
97
4
4 9
93
48
3
- In
stal
men
t sa
les
and
fin.
Le
ases
69
40
7 4
29
3
1 4
08
72
1
10
0 8
16
15
1
4 7
88
60
3
3 9
53
32
8
3 7
56
13
3
12
49
8 0
65
1
13
31
4 2
15
3
69
1 3
18
8
80
6 7
47
- O
ther
loan
s 3
22
85
7 8
42
1
59
32
5 0
36
4
82
18
2 8
78
1
3 6
02
27
7
23
27
1 7
59
2
7 7
19
26
1
64
59
3 2
97
5
46
77
6 1
75
3
2 7
82
84
5
31
81
0 4
52
52
7 5
75
12
1
22
9 1
82
93
0
75
6 7
58
05
1
22
64
0 5
02
3
3 1
79
90
8
34
64
3 4
08
9
0 4
63
81
9
84
7 2
21
87
0
44
85
3 1
37
4
5 6
10
68
2
Co
rpo
rate
an
d i
nve
stm
ent
ban
kin
g
- C
orpo
rate
lend
ing
67
5 8
60
56
7
3 5
06
12
2
67
9 3
66
68
9
1 6
52
47
3
46
57
8
-
1 6
99
05
1
68
1 0
65
74
0
1 5
73
60
3
12
5 4
48
67
5 8
60
56
7
3 5
06
12
2
67
9 3
66
68
9
1 6
52
47
3
46
57
8
-
1 6
99
05
1
68
1 0
65
74
0
1 5
73
60
3
12
5 4
48
Tot
al r
ecog
nise
d fi
nanc
ial
inst
rum
ents
1 2
03
43
5 6
88
2
32
68
9 0
52
1
43
6 1
24
74
0
24
29
2 9
75
3
3 2
26
48
6
34
64
3 4
08
9
2 1
62
87
0
1 5
28
28
7 6
10
4
6 4
26
74
0
45
73
6 1
30
3 (
c)
Cre
dit
ris
k (
Co
nti
nu
ed)
(b) Loans past due but not impaired
Gross amount of loans and advances by class of customers that were past due but not impaired were as follows:
Past due up to 30 days
Past due 30 - 60 days
Past due 60 - 180 days
Total
UShs'000 UShs'000 UShs'000 UShs'000
As at 31 December 2013
Personal and Business banking
- Mortgage lending 47 778 689 7 751 172 4 295 749 59 825 610
- Instalment sales and fin. Leases 17 911 778 6 923 264 4 347 897 29 182 939
- Other loans 137 296 297 18 871 920 13 939 362 170 107 579
202 986 764 33 546 356 22 583 008 259 116 128
Corporate and investment banking
- Corporate lending 18 217 128 3 086 744 9 902 21 313 774
18 217 128 3 086 744 9 902 21 313 774
221 203 892 36 633 100 22 592 910 280 429 902
As at 31 December 2012
Personal and Business banking
- Mortgage lending 29 036 705 7 294 230 2 118 238 38 449 173
- Instalment sales and fin. Leases 17 285 704 12 046 668 2 076 349 31 408 721
- Other loans 115 544 610 28 345 692 15 434 734 159 325 036
161 867 019 47 686 590 19 629 321 229 182 930
Corporate and investment banking
- Corporate lending 3 506 122 - - 3 506 122
3 506 122 - - 3 506 122
165 373 141 47 686 590 19 629 321 232 689 052
3 (c) Credit risk (Continued)

69
Overview Ensuring our sustainability Financial statements
Financialstatements Notes
68 Stanbic Bank Uganda Limited Annual report for the year ended 31 December 2013 Stanbic Bank Uganda Limited Annual report for the year ended 31 December 2013
(c) Loans and advances to banks The total gross amount of individually impaired loans and advances to banks as at 31 December 2013 was Nil (2012: nil). No collateral is held by
the Bank.
(d) Other Financial Assets No other financial assets are individually or collectively impaired (2012: nil). No collateral is held by the Bank.
(e) Re-possessed assets
2013 2012
UShs' 000 UShs' 000
Nature of assets
Residential properties 6 395 467 12 937 090
Commercial properties 41 879 819 45 195 861
Vehicles 750 109 589 381
49 025 395 58 722 332
Repossessed properties are sold as soon as practicable, with the proceeds used to reduce the outstanding indebtedness. Repossessed properties are not included in the statement of financial position.
(f) Renegotiated loans
2013 2012
UShs' 000 UShs' 000
Loans and advances to customers 1 361 315 21 233 128
Loans and advances to banks - -
1 361 315 21 233 128
3 (c) Credit risk (Continued)
(d)
Co
nce
ntr
atio
ns
of
risk
of
fin
anci
al a
sset
s w
ith
cre
dit
ris
k e
xpo
sure
T
he f
ollo
win
g ta
ble
brea
ks d
own
the
Ban
k’s
mai
n cr
edit
exp
osur
e at
the
ir c
arry
ing
amou
nts,
as
cate
gori
sed
by t
he in
dust
r y s
ecto
rs o
f ou
r co
unte
rpar
ties
.
Fin
anci
al in
stit
utio
ns
/ G
over
nmen
t M
anuf
uctu
ring
A
gric
ultu
re
Tra
nspo
rt
Indi
vidu
als
Oth
ers
Tot
al
USh
s' 0
00
USh
s' 0
00
USh
s' 0
00
USh
s' 0
00
USh
s' 0
00
USh
s' 0
00
USh
s' 0
00
As
at 3
1 D
ecem
ber
20
13
Gov
ernm
ent
secu
riti
es -
AFS
61
8 0
69
09
0
-
-
-
-
-
61
8 0
69
09
0
Loan
s an
d ad
vanc
es t
o ba
nks
32
9 5
43
42
0
-
-
-
-
-
32
9 5
43
42
0
Loan
s an
d ad
vanc
es t
o cu
stom
ers
3 0
99
2
96
52
7 7
09
1
08
60
5 5
12
4
7 0
52
75
7
41
1 7
59
49
5
61
3 6
42
30
2
1 4
77
59
0 8
74
Fin
anci
al a
sset
s d
esig
nat
ed a
t fa
ir
valu
e:
- D
ebt
secu
riti
es 3
40
22
1 2
94
-
-
-
-
-
3
40
22
1 2
94
- P
ledg
ed a
sset
s 1
85
1 6
58
-
-
-
-
-
1
85
1 6
58
- O
ther
ass
ets
-
-
-
-
-
52
00
5 3
48
5
2 0
05
34
8
1 2
89
68
8 5
61
2
96
52
7 7
09
1
08
60
5 5
12
4
7 0
52
75
7
41
1 7
59
49
5
66
5 6
47
65
0
2 8
19
28
1 6
84
As
at 3
1 D
ecem
ber
20
12
Gov
ernm
ent
secu
riti
es -
AFS
44
9 4
07
31
5
-
-
-
-
-
44
9 4
07
31
5
Loan
s an
d ad
vanc
es t
o ba
nks
27
4 1
44
37
5
-
-
-
-
-
27
4 1
44
37
5
Loan
s an
d ad
vanc
es t
o cu
stom
ers
-
29
7 9
18
35
9
11
9 9
90
00
5
11
5 3
49
95
4
34
1 0
86
80
3
65
3 9
42
48
9
1 5
28
28
7 6
10
Fin
anci
al a
sset
s d
esig
nat
ed a
t fa
ir
valu
e: -
- D
ebt
secu
riti
es 2
74
96
6 4
82
-
-
-
-
-
2
74
96
6 4
82
- P
ledg
ed a
sset
s 2
65
1 5
51
-
-
-
-
-
2
65
1 5
51
- O
ther
ass
ets
-
-
-
-
-
65
71
8 6
61
6
5 7
18
66
1
1 0
01
16
9 7
23
2
97
91
8 3
59
1
19
99
0 0
05
1
15
34
9 9
54
3
41
08
6 8
03
7
19
66
1 1
50
2
59
5 1
75
99
4

71
Overview Ensuring our sustainability Financial statements
Financialstatements Notes
70 Stanbic Bank Uganda Limited Annual report for the year ended 31 December 2013 Stanbic Bank Uganda Limited Annual report for the year ended 31 December 2013
(e) Market risk The Bank takes on exposure to market risks, which is the risk that
the fair value or future cash flows of a financial instrument will fluctuate because of changes in market prices. Market risks arise from open positions in interest rate, currency and equity products, all of which are exposed to general and specific market movements and changes in the level of volatility of market rates or prices such as interest rates, credit spreads, foreign exchange rates and equity prices.
Market risk measurement techniques:As part of the management of market risk, the Bank’s major measurement techniques used to measure and control market risk is value at risk and Pv01 (present value at one).
The Bank applies ‘value at risk’ methodology (VaR) to its trading portfolio, to estimate the market risk of foreign exchange positions held and the maximum losses expected. Management applies Pv01 methodology to it’s trading and non trading portfolios to estimate the market interest rate risk of positions held and the maximum losses that could arise. The estimates are based upon a number of assumptions for various changes in market conditions. The assets and liabilities
committee (ALCO) sets limits on both the value of risk and Pv01 that may be acceptable for the Bank. These are monitored on a weekly basis by the Risk Management department. VaR is a statistically based estimate of the potential loss on the current portfolio from adverse market movements. It expresses the ‘maximum’ amount the Bank might lose, but only to a certain level of confidence (98%). There is therefore a specified statistical probability (2%) that actual loss could be greater than the VAR estimate. Pv01 is the present value impact of a one basis point move in an interest rate.
The use of these approaches does not prevent losses outside of these limits in the event of more significant market movements.
As VaR and Pv01 constitute an integral part of the Bank’s market risk control regime, limits are established by the Board annually for all trading and non-trading portfolios. Actual exposure against limits, together with a consolidated group-wide VaR, is reviewed daily by the Bank’s Treasury. The quality of the VaR model is continuously monitored by back-testing the VaR results for trading books. All back-testing exceptions and any exceptional revenues on the profit side of the VAR distribution are investigated.
The VaR summaries for 2013 and 2012 are as follows:
12 months to 31 December 2013
Average Maximum Minimum 31 December 2013
UShs' 000 UShs' 000 UShs' 000 UShs' 000
Interest rate book - Trading 142 923 568 032 20 697 237 490
Interest rate book - Available for sale 533 479 993 542 167 955 663 805
Foreign exchange risk VAR 57 588 432 543 6 135 134 085
12 months to 31 December 2012
Average Maximum Minimum 31 December 2010
UShs' 000 UShs' 000 UShs' 000 UShs' 000
Interest rate book - Trading 17 374 37 272 (4 836) 15 446
Interest rate book - Available for sale 26 624 37 945 19 329 27 463
Foreign exchange risk VAR 101 316 661 236 2 811 116 312
There are several drivers for VaR that include the changes in foreign exchange (FX) Net Open Positions (NOP) held by the desk as well as the changes in exchange rates on a daily basis. The average NOP for 2013 was USD (3,929,958) 2012: USD (2,372,722).
The FX desk saw an increase in activity over the course of the year as economic activity picked up. The currency appreciated for most of the year on account of offshore activity and lower than expected demand. However, the desk was in most instances positioned on the right side of the market movements hence no spike in VaR even with the increase in average risk positions.
The movements in the PV01 are largely attributed to trading activity. The trading book, on average, held larger positions for most of the year in an effort to take advantage of the downward trend of interest rates. The banking Book position was relatively flat with no major increase but still well positioned to take advantage of the rates trend. The outlook on interest rates was of a downward trend as monetary policy was geared towards easing. The maturity profile of the banking book stood at 1-2years.
3 (e) Market risk (Continued)
(i) Foreign exchange risk The Bank takes on exposure to the effects of fluctuations in the prevailing foreign currency exchange rates on its financial position and cash flows.
The Asset and Liability Committee sets limits on the level of exposure by currency and in total for both overnight and intra-day positions, which are monitored daily.
The Bank had the following significant foreign currency exposure positions (all amounts expressed in millions of Uganda Shillings):
USD Euro Other Total
UShs'm UShs'm UShs'm UShs'm
As at 31 December 2013
Assets
Cash and balances with Bank of Uganda 89 779 4 447 5 108 99 334
Loans and advances to banks 114 443 21 650 8 261 144 354
Amounts due from group companies 129 764 12 584 3 314 145 662
Loans and advances to customers 690 603 2 866 - 693 469
Other investment securities - 57 - 57
Other assets 116 784 37 267 2 191 156 242
Total 1 141 373 78 871 18 874 1 239 119
Liabilities:
Customer deposits 399 509 59 521 8 850 467 880
Amounts due to banks 106 206 4 550 - 110 756
Amounts due to group companies 599 520 - 6 709 606 229
Other liabilities 33 410 14 828 2 778 51 016
Total 1 138 645 78 899 18 337 1 235 882
Net statement of financial position 2 728 (26) 536 3 239
As at 31 December 2012
Assets 935 274 72 483 31 240 1 038 997
Liabilities 915 708 72 483 31 022 1 019 213
Net statement of financial position 19 566 - 218 19 784

73
Overview Ensuring our sustainability Financial statements
Financialstatements Notes
72 Stanbic Bank Uganda Limited Annual report for the year ended 31 December 2013 Stanbic Bank Uganda Limited Annual report for the year ended 31 December 2013
3 (e) Market risk (Continued)
(ii) Interest rate risk The Bank takes on exposure to the effects of fluctuations in the prevailing levels of market interest rates on both its fair value and cash flow risks.
Interest margins may increase as a result of such changes but may reduce or create losses in the event that unexpected movements arise. The Asset and Liability Committee (ALCO) sets limits on the level of mismatch of interest rate re-pricing that may be undertaken, which is monitored daily.
The table below summarises the Bank’s exposure to interest rate risks. Included in the table are the Bank’s assets and liabilities at carrying amounts, categorised by the earlier of contractual re-pricing or maturity dates. The Bank does not bear an interest rate risk on items not on the statement of financial position.
Up to 1 month
UShs'm
1 - 6 months UShs'm
6 - 12 months UShs'm
Over 1 year UShs'm
Non-interest bearing UShs'm
Total UShs'm
At 31 December 2013
Assets:
Cash and balances with Bank of Uganda - - - - 421 381 421 381
Government securities - available for sale
8 797 106 070 185 336 40 019 - 340 222
Government securities - for trading 19 310 148 179 137 731 312 849 - 618 069
Deposits and balances due from other banks
168 589 2 089 2 089 8 357 - 181 125
Amounts due from group companies 148 148 259 12 - - 148 419
Loans and advances to customers 162 132 145 796 59 701 1 047 412 - 1 415 041
Pledged assets 1 852 - - - - 1 852
Derivative financial instrumentss - - - - 129 129
Other investment securities - - - - 1 146 1 146
Tax recoverable - - - - 10 708 10 708
Other assets - - - - 103 506 103 506
Total 508 828 402 393 384 869 1 408 637 536 870 3 241 598
Liabilities
Customer deposits 1 719 404 58 804 8 793 577 - 1 787 578
Deposits due to other banks 238 472 - - - - 238 472
Borrowed funds 637 - 10 18 194 - 18 841
Amounts due to group companies 117 379 519 805 1 303 - - 638 487
Derivative financial instruments - - - 1 522 1 522
Other liabilities - - - - 103 578 103 578
Subordinated bonds / debts - - - 47 812 - 47 812
Total 2 075 892 578 609 10 106 66 583 105 100 2 836 290
Total interest repricing gap (1 567 064) (176 216) 374 763 1 342 054 431 770 392 772
At 31 December 2012
Assets 1 794 072 414 804 82 509 171 057 636 151 3 098 593
Liabilities 559 415 235 469 18 743 390 279 1 493 648 2 697 554
Total Interest Re-pricing gap 1 234 657 179 335 63 766 (219 222) (857 497) 401 039
2013 2012
UShs' 000 UShs' 000
Liquid assets to deposit ratio
Total liquid assets held 1 010 796 144 1 055 919 239
Total deposits 1 898 647 790 2 133 137 161
Liquidity ratio 53,2% 49,5%
Regulatory requirement 20,0% 20,0%
3 (e) Market risk (Continued)
Furthermore the ALCO monitors the sensitivity of net interest income to changes in interest rates. Limits are set and monitored monthly.
ALCO increased the interest rate shock parameter from 200 basis points (bps) to 400 basis points (bps) to reflect the increased volatility (in absolute terms) of the interest rates throughout the year and this has been applied through in 2013.
The statement of financial position is shocked up and down by 400bps to get an indicative level of the potential drop or increase in forecasted annual NII. The interest rate risk limit is set at 10% (for a 4%
shock, a drop in NII is not expected to exceed 10%. Where this is exceeded, then it is indicative of an adverse interest rate positioning of the statement of financial position.
The table below summarises the sensitivity of a flat interest rate increase or decrease of 400bps at 31st December 2013 and December 2012.
31st December 2013 31st December 2012
Change in net interest Income Ushs'000
% of net interest income
Change in net interest Income Ushs'm
% of net interest income
400bps decrease in interest rates (8 646 593) (3,9) (10 675 214) (5,1)
400bps increase in interest rates 12 106 033 5,5 8 902 714 4,3
(f) Liquidity risk
Liquidity risk is the risk that the Bank is unable to meet its payment obligations associated with its financial liabilities when they fall due and to replace funds when they are overdrawn. The consequence may be the failure to meet obligations to repay depositors and fulfil commitments to lend.
The Bank is exposed to daily calls on its available cash resources from overnight deposits, current accounts, maturing deposits, and calls on cash settled contingencies. The Bank does not maintain cash resources to meet all of these needs as experience shows that a minimum level of reinvestment of maturing funds can be predicted with a high level of certainty.
The Asset and Liability Committee sets limits on the minimum proportion of maturing funds available to meet such calls and on the minimum level of inter-bank and other borrowing facilities that should be in place to cover withdrawals at unexpected levels of demand.
The Bank’s liquidity management process, as carried out within the Bank and monitored by the Treasury and Capital Management (TCM) team, includes:
• Day-to-day funding,managedbymonitoring futurecash flows toensure that requirements can be met. These include replenishment of funds as they mature or are borrowed by customers. • Maintainingaportfolioofhighlymarketableassetsthatcaneasilybe liquidated as protection against any unforeseen interruption to cash flow;• Monitoring balance sheet liquidity ratios against internal andregulatory requirements; and managing the concentration and profile of debt maturities.• Monitoringandreportingtaketheformofcashflowmeasurementand projections for the next day, week and month respectively, as these are key periods for liquidity management. The starting point for those projections is an analysis of the contractual maturity of the financial liabilities and the expected collection date of the financial assets
The assets and liability management team (ALM) within TCM also monitors unmatched medium-term assets, the level and type of undrawn lending commitments, the usage of overdraft facilities and the impact of contingent liabilities such as standby letters of credit and guarantees.

75
Overview Ensuring our sustainability Financial statements
Financialstatements Notes
74 Stanbic Bank Uganda Limited Annual report for the year ended 31 December 2013 Stanbic Bank Uganda Limited Annual report for the year ended 31 December 2013
The table below presents the cash flows payable by the Bank under financial liabilities by remaining contractual maturities at the statement of financial position date.
Up to 1 month Ushs'm
1 - 6 months Ushs'm
6 - 12 months Ushs'm
Over 1 year Ushs'm
Total Ushs'm
At 31 December 2013
Assets:
Cash and balances with Bank of Uganda 421 381 - - - 421 381
Government securities - for trading 8 797 106 070 185 336 40 019 340 222
Government securities - available for sale 19 310 148 179 137 731 312 849 618 069
Deposits and balances due from other banks 168 589 2 089 2 089 8 357 181 124
Amounts due from group companies 148 148 259 12 - 148 419
Loans and advances to customers 162 132 145 796 59 701 1 047 412 1 415 041
Pledged assets 1 852 - - - 1 852
Derivative financial instrumentss - 115 14 - 129
Other investment securities - - - 1 146 1 146
Investment in associate - - - - -
Prepaid operating lease - - - 130 130
Total 930 209 402 508 384 883 1 409 913 3 127 513
Liabilities:
Customer deposits 1 719 404 58 804 8 793 577 1 787 578
Deposits due to other banks 238 472 - - - 238 472
Borrowed funds 637 - 10 18 194 18 841
Amounts due to group companies 117 379 519 805 1 303 - 638 487
Derivative financial instruments 201 895 426 - 1 522
Other liabilities 103 578 - - - 103 578
Subordinated bonds / debt - - - 47 812 47 812
Total 2 179 671 579 504 10 532 66 583 2 836 290
Net liquidity gap (1 249 462) (176 996) 374 351 1 343 330 291 223
Cummulative liquidity gap (1 249 462) (1 426 458) (1 052 107) 291 223 -
As at 31 December 2012
Assets ( expected maturity dates ) 1 056 147 758 814 245 721 976 007 3 036 689
Liabilities ( Contractual maturity dates ) 2 394 220 235 469 18 743 49 123 2 697 555
Liquidity gap (1 338 073) 523 345 226 978 926 884 339 134
Cumulative liquidity gap (1 338 073) (814 728) (587 750) 339 134 -
Assets available to meet all of the liabilities and to cover outstanding loan commitments include cash, central bank balances, items in the course of collection; loans and advances to banks; and loans and advances to customers. In addition, debt securities and treasury and other bills have been pledged to secure liabilities. The Bank would also be able to meet unexpected net cash outflows by selling securities and accessing additional funding sources such as asset-backed markets
3 (f) Liquidity risk (Continued) 3 (f) Liquidity risk (Continued)
Not later than 1 year 1 to 5 years Total
UShs'000 UShs'000 UShs'000
As at 31 December 2013
Letters of credit 80 577 515 - 80 577 515
Guarantees 177 220 016 57 874 177 277 890
Commitments to extend credit 261 276 846 - 261 276 846
Operating lease commitments 6 715 459 7 487 046 14 202 505
525 789 836 7 544 920 533 334 756
As at 31 December 2012
Letters of credit 59 866 616 - 59 866 616
Guarantees 161 358 374 461 500 161 819 874
Commitments to extend credit 238 314 664 - 238 314 664
Operating lease commitments 3 534 415 16 649 251 20 183 666
463 074 069 17 110 751 480 184 820
(g) Off-balance sheet items
(i) Loan commitments The dates of the contractual amounts of the Bank’s off-balance
sheet financial instruments that commit it to extend credit to customers and other facilities (Note 38), are summarised in the table below.
(ii) Other financial facilities Other financial facilities (Note 38) are also included below based on
the earliest contractual maturity date.
(iii) Operating lease commitments Where the Bank company is the lessee, the future minimum lease
payments under non-cancellable operating leases, as disclosed in Note 38, are summarised in the table below.

77
Overview Ensuring our sustainability Financial statements
Financialstatements Notes
76 Stanbic Bank Uganda Limited Annual report for the year ended 31 December 2013 Stanbic Bank Uganda Limited Annual report for the year ended 31 December 2013
(h) Fair value of financial assets and liabilities
The table below summarises the carrying amounts and fair values of those financial assets and liabilities not presented on the Bank’s statement of financial position at their fair value.
Carrying Value Fair Value
2013 2012 2013 2012
UShs'000 UShs'000 UShs'000
Financial assets
Loans and advances to banks 181 124 853 223 595 642 181 124 853 223 595 642
Amounts due from group companies 148 418 567 50 548 733 148 418 567 50 548 733
Loans and advances to customers 1 415 040 925 1 460 277 630 1 415 040 925 1 460 277 630
Other Investment securities 1 146 198 1 051 920 1 146 198 1 051 920
Other assets 52 005 348 65 718 661 52 005 348 65 718 661
Financial liabilities
Customer deposits 1 787 577 713 2 099 180 118 1 787 577 713 2 099 180 118
Amounts due to other banks 238 472 365 33 957 043 238 472 365 33 957 043
Borrowed funds 18 840 955 24 703 479 18 840 955 24 703 479
Amounts due to group companies 638 486 748 344 854 604 638 486 748 344 854 604
Other liabilities 103 578 230 145 746 355 103 578 230 121 635 899
(i) Due from other banks and group companies Due from other banks includes inter-bank placements and items in
the course of collection.The fair value of floating rate placements and overnight deposits is their carrying amount. The estimated fair value of fixed interest bearing deposits is based on discounted cash flows using prevailing money-market interest rates for debts with similar credit risk and remaining maturity.
(ii) Loans and advances to customers Loans and advances are net of provisions for impairment. The
estimated fair value of loans and advances represents the discounted amount of estimated future cash flows expected to be received. Expected cash flows are discounted at current market rates to determine fair value.
(iii) Investment securities Investment securities include only interest-bearing assets held to
maturity; assets classified as available for sale are measured at fair value. Fair value for held-to-maturity assets is based on market prices or broker/dealer price quotations. Where this information is not available, fair value is estimated using quoted market prices for securities with similar credit, maturity and yield characteristics.
(iv) Due to other banks, customers and group companies The estimated fair value of deposits with no stated maturity, which
includes non-interest-bearing deposits, is the amount repayable on demand.
The estimated fair value of fixed interest-bearing deposits and other borrowings not quoted in an active market is based on discounted cash flows using interest rates for new debts with similar remaining maturity.
(i) Fair value hierarchyThe determination of fair value for financial assets and liabilities for which there is no observable market price requires the use of valua-tion techniques as described in accounting policy 2 (e)(v). For financial instruments that trade infrequently and have little price transparency, fair value is less objective, and requires varying degrees of judgment depending on liquidity, concentration, uncertainty of market factors, pricing assumptions and other risks affecting the specific instrument.
The Bank measures fair values using the following fair value hierarchy that reflects the significance of the inputs used in making the measure-ments:
Level 1: Quoted market price (unadjusted) in an active market for an identical instrument.
Level 2: Valuation techniques based on observable inputs, either di-rectly (i.e., as prices) or indirectly (i.e., derived from prices). This cat-egory includes instruments valued using: quoted market prices in active markets for similar instruments; quoted prices for identical or similar instruments in markets that are considered less than active; or other valuation techniques where all significant inputs are directly or indirectly observable from market data.
Level 3: Valuation techniques using significant unobservable inputs. This category includes all instruments where the valuation technique in-cludes inputs not based on observable data and the unobservable inputs have a significant effect on the instrument’s valuation. This category includes instruments that are valued based on quoted prices for similar instruments where significant unobservable adjustments or assumptions are required to reflect differences between the instruments.
The information below shows the classification of financial instruments held at fair value into the valuation hierarchy set out below for the year ended 31 December 2013 and 2012:
31 December 2013 Level 1 Level 2 Level 3 Total
UShs' 000 UShs' 000 UShs' 000 UShs' 000
Financial assets
- Derivative financial instruments - 129 020 - 129 020
- Government securities - Held for trading - 340 221 294 - 340 221 294
- Government securities - AFS - 618 069 090 - 618 069 090
- Pledged assets - 1 851 658 - 1 851 658
- Other investment securities - - 1 146 198 1 146 198
Total - 960 271 062 1 146 198 961 417 260
Financial liabilities
- Derivative financial instruments - 1 521 864 - 1 521 864
Total - 1 521 864 - 1 521 864
31 December 2012 Level 1 Level 2 Level 3 Total
UShs' 000 UShs' 000 UShs' 000 UShs' 000
Financial assets
- Derivative financial instruments - 1 032 432 - 1 032 432
- Government securities - Held for trading - 274 966 482 - 274 966 482
- Government securities - AFS - 799 588 399 - 799 588 399
- Pledged assets - 2 651 551 - 2 651 551
- Other investment securities - - 1 051 920 1 051 920
Total - 1 078 238 864 1 051 920 1 079 290 784
(i) Fair value hierarchy (Continued)