D-STAR InfoCon 2014 at Dayton Hamvention Part 3 – Doing More With D-STAR

Medicare 2015 Part C & D
Star Rating Technical Notes
Updated – 10/03/2014

(Last Updated 10/03/2014) Page i
Document Change Log
Previous Version Description of Change
Revision Date
- Initial release of the Final 2014 Part C & D Star Ratings Technical Notes – incorporates all changes from preview versions 10/03/2014
(Last Updated 10/03/2014) Page ii
Table of Contents
DOCUMENT CHANGE LOG .............................................................................................................................. I
INTRODUCTION ............................................................................................................................................... 1 Table 1: Contract Year 2015 Organization Types Reported in the 2015 Star Ratings ....................................................... 1
DIFFERENCES BETWEEN THE 2014 STAR RATINGS AND 2015 STAR RATINGS ..................................... 1
CONTRACT ENROLLMENT DATA .................................................................................................................. 2
HANDLING OF BIASED, ERRONEOUS AND/OR NOT REPORTABLE (NR) DATA ....................................... 2
HOW THE DATA ARE REPORTED .................................................................................................................. 3 Table 2: Highest Rating by Contract Type .......................................................................................................................... 3 Table 3: Relation of 2015 Organization Types to Contract Types in the 2015 Star Ratings .............................................. 3
METHODOLOGY FOR ASSIGNING PART C AND D MEASURE STAR RATINGS ........................................ 4
PREDETERMINED THRESHOLDS .................................................................................................................. 4
METHODOLOGY FOR CALCULATING STARS FOR INDIVIDUAL MEASURES ............................................ 4
A. Relative Distribution and Clustering: ..................................................................................................................... 4
B. Relative Distribution and Significance Testing (CAHPS): ................................................................................... 4
METHODOLOGY FOR CALCULATING STARS AT THE DOMAIN LEVEL ..................................................... 5 Table 4: Domain Rating Requirements ............................................................................................................................... 5
WEIGHTING OF MEASURES ........................................................................................................................... 5
METHODOLOGY FOR CALCULATING PART C AND PART D SUMMARY RATINGS .................................. 6 Table 5: Part C and Part D Summary Rating Requirements .............................................................................................. 6
METHODOLOGY FOR CALCULATING THE OVERALL MA-PD RATING ...................................................... 6 Table 6: Overall Rating Requirements ................................................................................................................................ 7
APPLYING THE IMPROVEMENT MEASURE(S) ............................................................................................. 7 Table 7: Improvement Measure Calculation Requirements ................................................................................................ 7
APPLYING THE INTEGRATION FACTOR (REWARD FOR CONSISTENTLY HIGH PERFORMANCE) ......... 8 Table 8: Performance Summary Thresholds ...................................................................................................................... 9 Table 9: Variance Thresholds ............................................................................................................................................. 9
CALCULATION PRECISION ............................................................................................................................ 9
ROUNDING RULES FOR MEASURE SCORES: ............................................................................................ 10
ROUNDING RULES FOR SUMMARY AND OVERALL SCORES: ................................................................. 10 Table 10: Rounding Rules for Summary and Overall Scores ........................................................................................... 10
METHODOLOGY FOR CALCULATING THE HIGH PERFORMING ICON ..................................................... 10
METHODOLOGY FOR CALCULATING THE LOW PERFORMING ICON ..................................................... 10 Table 11: Example LPI contracts ...................................................................................................................................... 11
ADJUSTMENTS FOR CONTRACTS UNDER SANCTION ............................................................................. 11
CAHPS METHODOLOGY ............................................................................................................................... 11
SPECIAL NEEDS PLAN (SNP) DATA ............................................................................................................ 12
STAR RATINGS AND MARKETING ............................................................................................................... 12
CONTACT INFORMATION ............................................................................................................................. 12

(Last Updated 10/03/2014) Page iii
FRAMEWORK AND DEFINITIONS FOR THE DOMAIN AND MEASURE DETAILS SECTION ..................... 13
PART C DOMAIN AND MEASURE DETAILS ................................................................................................ 14
Domain: 1 - Staying Healthy: Screenings, Tests and Vaccines ................................................................................... 14 Measure: C01 - Colorectal Cancer Screening .................................................................................................................. 14 Measure: C02 - Cardiovascular Care – Cholesterol Screening ........................................................................................ 15 Measure: C03 - Diabetes Care – Cholesterol Screening .................................................................................................. 16 Measure: C04 - Annual Flu Vaccine ................................................................................................................................. 17 Measure: C05 - Improving or Maintaining Physical Health ............................................................................................... 17 Measure: C06 - Improving or Maintaining Mental Health ................................................................................................. 18 Measure: C07 - Monitoring Physical Activity ..................................................................................................................... 19 Measure: C08 - Adult BMI Assessment ............................................................................................................................ 20
Domain: 2 - Managing Chronic (Long Term) Conditions ............................................................................................. 21 Measure: C09 - Special Needs Plan (SNP) Care Management ....................................................................................... 21 Measure: C10 - Care for Older Adults – Medication Review ............................................................................................ 22 Measure: C11 - Care for Older Adults – Functional Status Assessment .......................................................................... 23 Measure: C12 - Care for Older Adults – Pain Assessment .............................................................................................. 24 Measure: C13 - Osteoporosis Management in Women who had a Fracture ................................................................... 24 Measure: C14 - Diabetes Care – Eye Exam ..................................................................................................................... 25 Measure: C15 - Diabetes Care – Kidney Disease Monitoring .......................................................................................... 26 Measure: C16 - Diabetes Care – Blood Sugar Controlled ................................................................................................ 26 Measure: C17 - Diabetes Care – Cholesterol Controlled ................................................................................................. 27 Measure: C18 - Controlling Blood Pressure ..................................................................................................................... 28 Measure: C19 - Rheumatoid Arthritis Management ......................................................................................................... 29 Measure: C20 - Improving Bladder Control ...................................................................................................................... 30 Measure: C21 - Reducing the Risk of Falling ................................................................................................................... 31 Measure: C22 - Plan All-Cause Readmissions ................................................................................................................. 32
Domain: 3 - Member Experience with Health Plan ........................................................................................................ 34 Measure: C23 - Getting Needed Care .............................................................................................................................. 34 Measure: C24 - Getting Appointments and Care Quickly ................................................................................................. 35 Measure: C25 - Customer Service .................................................................................................................................... 36 Measure: C26 - Rating of Health Care Quality ................................................................................................................. 37 Measure: C27 - Rating of Health Plan .............................................................................................................................. 38 Measure: C28 - Care Coordination ................................................................................................................................... 39
Domain: 4 - Member Complaints and Changes in the Health Plan's Performance ................................................... 40 Measure: C29 - Complaints about the Health Plan........................................................................................................... 40 Measure: C30 - Members Choosing to Leave the Plan .................................................................................................... 41 Measure: C31 - Health Plan Quality Improvement ........................................................................................................... 42
Domain: 5 - Health Plan Customer Service .................................................................................................................... 43 Measure: C32 - Plan Makes Timely Decisions about Appeals ......................................................................................... 43 Measure: C33 - Reviewing Appeals Decisions ................................................................................................................. 44
PART D DOMAIN AND MEASURE DETAILS ................................................................................................ 45
Domain: 1 - Drug Plan Customer Service ...................................................................................................................... 45 Measure: D01 - Appeals Auto–Forward ............................................................................................................................ 45 Measure: D02 - Appeals Upheld ....................................................................................................................................... 46
Domain: 2 - Member Complaints and Changes in the Drug Plan’s Performance ...................................................... 47 Measure: D03 - Complaints about the Drug Plan ............................................................................................................. 47 Measure: D04 - Members Choosing to Leave the Plan .................................................................................................... 48 Measure: D05 - Drug Plan Quality Improvement .............................................................................................................. 49
Domain: 3 - Member Experience with the Drug Plan .................................................................................................... 50 Measure: D06 - Rating of Drug Plan ................................................................................................................................. 50 Measure: D07 - Getting Needed Prescription Drugs ........................................................................................................ 51
Domain: 4 - Drug Safety and Accuracy of Drug Pricing ............................................................................................... 52 Measure: D08 - MPF Price Accuracy ................................................................................................................................ 52 Measure: D09 - High Risk Medication .............................................................................................................................. 53 Measure: D10 - Diabetes Treatment ................................................................................................................................. 54

(Last Updated 10/03/2014) Page iv
Measure: D11 - Medication Adherence for Diabetes Medications .................................................................................... 56 Measure: D12 - Medication Adherence for Hypertension (RAS antagonists) .................................................................. 57 Measure: D13 - Medication Adherence for Cholesterol (Statins) ..................................................................................... 59
ATTACHMENT A: CAHPS CASE-MIX ADJUSTMENT .................................................................................. 61 Table A-1: Part C CAHPS Measures ....................................................................................................................... 61 Table A-2: Part D CAHPS Measures ....................................................................................................................... 62
ATTACHMENT B: COMPLAINTS TRACKING MODULE EXCLUSION LIST................................................. 63 Table B-1: Exclusions since September 25, 2010 ................................................................................................... 63 Table B-2: Exclusions prior to September 25, 2010 ................................................................................................ 64
ATTACHMENT C: NATIONAL AVERAGES FOR PART C AND D MEASURES ........................................... 65 Table C-1: National Averages for Part C Measures ................................................................................................ 65 Table C-2: National Averages for Part D Measures ................................................................................................ 66
ATTACHMENT D: PART C AND D DATA TIME FRAMES............................................................................. 67 Table D-1: Part C Measure Data Time Frames ....................................................................................................... 67 Table D-2: Part D Measure Data Time Frames ....................................................................................................... 68
ATTACHMENT E: SNP MEASURE SCORING METHODOLOGIES .............................................................. 69
A. Medicare Part C Reporting Requirements Measure (C09: SNP Care Management) ....................................... 69
B. NCQA HEDIS Measures - (C10 - C12: Care for Older Adults) ............................................................................ 70
ATTACHMENT F: CALCULATING MEASURE C22: PLAN ALL-CAUSE READMISSIONS ......................... 71
ATTACHMENT G: WEIGHTS ASSIGNED TO INDIVIDUAL PERFORMANCE MEASURES ......................... 72 Table G-1: Part C Measure Weights ........................................................................................................................ 72 Table G-2: Part D Measure Weights ........................................................................................................................ 73
ATTACHMENT H: CALCULATION OF WEIGHTED STAR RATING AND VARIANCE ESTIMATES ............ 74
ATTACHMENT I: CALCULATING THE IMPROVEMENT MEASURE AND THE MEASURES USED ............ 75 Calculating the Improvement Measure ............................................................................................................................. 75 General Standard Error Formula....................................................................................................................................... 76 Standard Error Numerical Example. ................................................................................................................................. 76 Standard Error Formulas for Specific Measures ............................................................................................................... 77
Table I-1: Part C Measures Used in the Improvement Measure ............................................................................. 79 Table I-2: Part D Measures Used in the Improvement Measure ............................................................................. 80
ATTACHMENT J: STAR RATINGS MEASURE HISTORY ............................................................................. 81 Table J-1: Part C Measure History ........................................................................................................................... 81 Table J-2: Part D Measure History ........................................................................................................................... 83
ATTACHMENT K: INDIVIDUAL MEASURE STAR ASSIGNMENT PROCESS .............................................. 85
ATTACHMENT L: MEDICATION ADHERENCE MEASURE CALCULATIONS ............................................. 87 Days Covered Calculation ................................................................................................................................................. 87
Example 1: Non-Overlapping Fills of Two Different Drugs ........................................................................................... 87 Example 2: Overlapping Fills of the Same Drug ........................................................................................................... 87 Example 3: Overlapping Fills of the Same and Different Drugs ................................................................................... 88
Days Covered Modification for Inpatient Stays, Hospice Enrollment and Skilled Nursing Facility Stays ......................... 89 Calculating the PDC Adjustment for IP Stays, Hospice Enrollments, and SNF Stays ..................................................... 89
Example 1 – IP Stay with excess post-IP coverage gap .............................................................................................. 90 Figure 1: Drug Coverage Assigned Before Modification in Example 1 .................................................................... 90 Figure 2: Drug Coverage Assigned After Modification in Example 1 ....................................................................... 90
Example 2 – IP stay with post-IP coverage gap < IP length of stay ............................................................................. 90 Figure 3: Drug Coverage Assigned Before Modification in Example 2 .................................................................... 90 Figure 4: Drug Coverage Assigned After Modification in Example 2 ....................................................................... 90
Example 3 – IP stay with no post-IP coverage gap ...................................................................................................... 91 Figure 5: Drug Coverage Assigned Before Modification in Example 3 .................................................................... 91 Figure 6: Drug Coverage Assigned After Modification in Example 3 ....................................................................... 91

(Last Updated 10/03/2014) Page v
ATTACHMENT M: METHODOLOGY FOR PRICE ACCURACY MEASURE ................................................. 92 Contract Selection ............................................................................................................................................................. 92 PF Price Accuracy Index ................................................................................................................................................... 92 Example of Accuracy Index Calculation ............................................................................................................................ 93
Table M-1: Example of Price Accuracy Index Calculation ....................................................................................... 94
ATTACHMENT N: MISSING DATA MESSAGES ........................................................................................... 95 Measure level messages .................................................................................................................................................. 95
Table N-1: Measure level missing data messages .................................................................................................. 95 1. Assignment rules for Part C measure messages ...................................................................................................... 95 2. Assignment rules for Part D measure messages ...................................................................................................... 99
Domain, Summary and Overall level messages ............................................................................................................. 101 Table N-2: Domain, Summary and Overall level missing data messages ............................................................. 101
1. Assignment rules for Part C & Part D domain rating level messages..................................................................... 101 2. Assignment rules for Part C & Part D summary rating level messages.................................................................. 101 3. Assignment rules for overall rating level messages ................................................................................................ 102
ATTACHMENT O: GLOSSARY OF TERMS ................................................................................................. 103
ATTACHMENT P: HEALTH PLAN MANAGEMENT SYSTEM MODULE REFERENCE .............................. 106
PART C REPORT CARD MASTER TABLE ................................................................................................. 106
A. Measure Data page .............................................................................................................................................. 106
B. Measure Detail page ............................................................................................................................................ 106 Table P-1: Measure Detail page fields ................................................................................................................... 106
C. Measure Detail – SNP page ................................................................................................................................. 107 Table P-2: Measure Detail – SNP page fields ....................................................................................................... 107 Table P-3: HEDIS 2014 Audit Designations and 2015 Star Ratings ..................................................................... 107
D. Measure Detail – CTM page................................................................................................................................. 107 Table P-4: Measure Detail – CTM page fields ....................................................................................................... 108
E. Measure Detail – Disenrollment .......................................................................................................................... 108 Table P-5: Measure Detail – Disenrollment ........................................................................................................... 108
F. Measure Detail – Improvement page .................................................................................................................. 108 Table P-6: Measure Improvement Results ............................................................................................................ 109
G. Measure Stars page ............................................................................................................................................. 109
H. Domain Stars page ............................................................................................................................................... 109
I. Summary Rating page ......................................................................................................................................... 109 Table P-7: Part C Summary Rating View ............................................................................................................... 109
J. Overall Rating page ............................................................................................................................................. 110 Table P-8: Overall Rating View .............................................................................................................................. 110
K. Low Performing Contract List............................................................................................................................. 110 Table P-9: Low Performing Contract List ............................................................................................................... 111
L. High Performing Contract List ............................................................................................................................ 111 Table P-10: High Performing Contract List ............................................................................................................ 111
M. Technical Notes link ............................................................................................................................................ 111
PART D REPORT CARD MASTER TABLE ................................................................................................. 112
N. Measure Data page .............................................................................................................................................. 112
O. Measure Detail page ............................................................................................................................................ 112 Table P-11: Measure Detail page fields ................................................................................................................. 112
P. Measure Detail – CTM page................................................................................................................................. 112 Table P-12: Measure Detail – CTM page fields ..................................................................................................... 113
Q. Measure Detail – Auto-Forward page ................................................................................................................. 113 Table P-13: Measure Detail – Auto-Forward page fields ....................................................................................... 113
(Last Updated 10/03/2014) Page vi
R. Measure Detail – Upheld page ............................................................................................................................ 113 Table P-14: Measure Detail – Upheld page fields ................................................................................................. 113
S. Measure Detail – Disenrollment .......................................................................................................................... 114 Table P-15: Measure Detail – Disenrollment ......................................................................................................... 114
T. Measure Detail – Improvement page .................................................................................................................. 114 Table P-16: Measure Improvement Results .......................................................................................................... 114
U. Measure Star page ............................................................................................................................................... 115
V. Domain Star page ................................................................................................................................................. 115
W. Summary Rating page ......................................................................................................................................... 115 Table P-17: Part D Summary Rating View ............................................................................................................. 115
X. Low Performing Contract List............................................................................................................................. 115 Table P-18: Low Performing Contract List ............................................................................................................. 116
Y. High Performing Contract List ............................................................................................................................ 116 Table P-19: High Performing Contract List ............................................................................................................ 116
Z. Technical Notes link ............................................................................................................................................ 116
AA. Medication NDC List – High Risk Medication Measure link ............................................................................. 116
BB. Medication NDC List – Diabetes Treatment Measure link ................................................................................ 117
CC. Medication NDC List – Medication Adherence Measure link ........................................................................... 117

(Last Updated 10/03/2014) Page 1
Introduction
This document describes the methodology for creating the Part C and D Star Ratings displayed on the Medicare Plan Finder (MPF) on http://www.medicare.gov/ and posted on the CMS website at
http://go.cms.gov/partcanddstarratings.
These ratings are also displayed in the Health Plan Management System (HPMS) for contracts and sponsors. In the HPMS Quality and Performance section, the Part C data can be found in the Part C Performance Metrics module in the Part C Report Card Master Table section. The Part D data are located in the Part D Performance Metrics and Report module in the Part D Report Card Master Table section.
All of the health/drug plan quality and performance measure data described in this document are reported at the contract level. Table 1 lists the contract year 2015 organization types and whether they are included in the Part C and/or Part D Star Ratings.
Table 1: Contract Year 2015 Organization Types Reported in the 2015 Star Ratings
Organization Type 1876 Cost
Chronic Care Demo
Employer/Union Only Direct Contract
HCPP - 1833 Cost
Local CCP* MSA*
National PACE PDP PFFS*
Regional CCP* Local CCP* PDP PFFS*
Part C Ratings Yes No Yes Yes No Yes No Yes Yes No No Yes Yes
Part D Ratings Yes (If drugs are offered) No Yes Yes Yes Yes No Yes No No Yes Yes Yes
* Note: These organization types are Medicare Advantage Organizations
The Star Ratings strategy is consistent with CMS’ Three Aims (better care, healthier people/healthier communities, and lower costs through improvements) with measures spanning the following five broad categories:
1. Outcomes: Outcome measures focus on improvements to a beneficiary’s health as a result of the care that is provided.
2. Intermediate outcomes: Intermediate outcome measures help move closer to true outcome measures. Controlling Blood Pressure is an example of an intermediate outcome measure where the related outcome of interest would be better health status for beneficiaries with hypertension.
3. Patient experience: Patient experience measures represent beneficiaries’ perspectives about the care they have received.
4. Access: Access measures reflect issues that may create barriers to receiving needed care. Plan Makes Timely Decisions about Appeals is an example of an access measure.
5. Process: Process measures capture the method by which health care is provided.
Differences between the 2014 Star Ratings and 2015 Star Ratings
There have been several changes between the 2014 Star Ratings and the 2015 Star Ratings. This section provides a synopsis of the significant differences; the reader should examine the entire document for full details about the 2015 Star Ratings. The complete history of measures used in the Star Ratings can be found in Attachment J.
Changes a. Part C measure: C04 – Annual Flu Vaccine - CAHPS survey respondents were asked if they
received a flu shot since July of each year (instead of September). Due to this specification change, the predetermined 4-star threshold was removed for this measure.
b. Part C & D measures: C31 & D05 – Quality Improvement - increased measure weights to 5.
c. Part D measure: D09 – High Risk Medication – now uses the updated Pharmacy Quality Alliance (PQA) HRM list.

(Last Updated 10/03/2014) Page 2
d. Part D measure: D11 - Medication Adherence for Diabetes Medications – added two drug classes (meglitinides and incretin mimetic agents) to the numerator and denominator.
e. Part D measures: D11, D12 & D13 – all three measures adjusted to account for beneficiaries with hospice enrollment and/or Skilled Nursing Facility (SNF) stays.
f. Improvement measure – contracts must have 2.5 or more stars as their highest rating calculated without inclusion of the improvement measure in order to be eligible to have their data calculated with the improvement measures included.
g. The Part C & Part D ratings mailboxes ([email protected] and [email protected]) have been combined and replaced with the new mailbox [email protected]. The old mailboxes have been configured to forward emails to the new mailbox to ensure that all submissions receive a response.
6. Additions
a. Part C measure: C09 – Special Needs Plan (SNP) Care Management: with a weight of 1.
7. Transitioned measures (Moved to the display measures which can be found on the CMS website at this
address: http://go.cms.gov/partcanddstarratings)
a. Part C measure: Breast Cancer Screening
b. Part C & D measures: Beneficiary Access and Performance Problems
8. Dropped measures
a. Part C measure: Glaucoma Testing - NCQA has stopped collecting this HEDIS measure.
b. Part C & D Call Center – Foreign Language Interpreter and TTY Availability measures.
Contract Enrollment Data
The enrollment data used in the Part C and D "Complaints about the Health/Drug Plan" measures were pulled from the HPMS. These enrollment files represent the number of beneficiaries the contract was paid for in a specific month. For this measure, six months of enrollment files were pulled (January 2014 through June 2014), and the average enrollment from those months was used in the calculations.
The enrollment data used in the Part D "Appeals Auto–Forward" measure were pulled from the HPMS. These enrollment files represent the number of beneficiaries the contract was paid for in a specific month. For this measure, twelve months of enrollment files were pulled (January 2013 through December 2013) and the average enrollment from those months was used in the calculations.
Enrollment data are also used to combine plan level data into contract level data in the three Part C Care for Older Adults HEDIS measures. This only occurs when the eligible population was not included in the submitted SNP HEDIS data and the submitted rate was NR (see following section). For these measures, twelve months of plan level enrollment files were pulled (January 2013 through December 2013), and the average enrollment in the plan for those months was used in calculating the combined rate.
Handling of Biased, Erroneous and/or Not Reportable (NR) Data
The data used for CMS’ Star Ratings must be accurate and reliable. CMS has identified issues with some contracts’ data used for Star Ratings, and CMS has taken several steps in the past years to protect the integrity of the data. We continue to guard against new vulnerabilities when inaccurate or biased data are included. CMS’ policy is to reduce a contract’s measure rating to 1 star and set the numerical data value to “CMS identified issues with this plan’s data” if it is identified that biased or erroneous data have been submitted by the plan or identified by CMS.
This would include cases where CMS finds plans’ mishandling of data, inappropriate processing, or implementation of incorrect practices has resulted in biased or erroneous data. Examples would include, but are not limited to: a contract’s failure to adhere to HEDIS, HOS, or CAHPS reporting requirements; a contract’s failure to adhere to Plan Finder data requirements; a contract’s errors in processing coverage determinations,

(Last Updated 10/03/2014) Page 3
organizational determinations, and appeals; a contract’s failure to adhere to CMS-approved point-of-sale edits; compliance actions taken against the contract due to errors in operational areas that would directly impact the data reported or processed for specific measures; and a contract’s failure to pass data validation directly related to data reported for specific measures.
For the Healthcare Effectiveness Data and Information Set (HEDIS) data, NRs are assigned when the individual measure score is materially biased (e.g., the auditor informs the contract the data cannot be reported to the National Committee for Quality Assurance (NCQA) or CMS) or the contract decides not to report the data for a particular measure. When NRs have been assigned for a HEDIS measure rate, because the contract has had materially biased data or the contract has decided not to report the data, the contract receives 1 star for each of these measures and the numerical value will be set to “CMS identified issues with this plan’s data”. The measure score will also receive the footnote “Not reported. There were problems with the plan's data” for materially biased data or "Measure was not reported by plan" for unreported data.
If an approved CAHPS vendor does not submit a contract’s CAHPS data by the data submission deadline, the contract will automatically receive a rating of 1 star for the CAHPS measures.
How the Data are Reported
For 2015, the Part C and D Star Ratings are reported using five different levels of detail.
Base: At the base level, with the most detail, are the individual measures. They are comprised of numeric data for all of the quality and performance measures except for the improvement measures which are explained in the section titled “Applying the Improvement Measure(s)”.
Star: Each of the base level measure ratings are then scored on a 5-star scale.
Domain: Each measure is also grouped with similar measures into a second level called a domain. A domain is assigned a Star Rating.
Summary: All of the Part C measures are grouped together to form the Part C summary rating for a contract. There is also a Part D summary rating formed by grouping all of the Part D measures.
Overall: All the Part C and Part D measures are grouped together to form the Overall rating for a contract.
Because different organization types offer different benefits, CMS must classify contracts into three categories of contract types. Each of these contract types has a different highest level rating associated with it because of the set of measures available. Table 2 illustrates how CMS classifies contracts for purposes of the Star Ratings.
Table 2: Highest Rating by Contract Type
Contract Type Offers Part C or 1876 Cost Offers Part D Highest Rating
MA-only Yes No Part C rating
MA-PD Yes Yes Overall rating
PDP No Yes Part D rating
Table 3 relates the three contract types to the organization types reported on in the 2015 Star Ratings.
Table 3: Relation of 2015 Organization Types to Contract Types in the 2015 Star Ratings
Organization Type
1876 Cost (not offering drugs)
1876 Cost (offers drugs) Demo
Employer/Union Only Direct Contract Local
CCP MSA PDP PFFS Regional
CCP Local CCP PDP PFFS
Rated As MA-only MA-PD MA-PD MA-PD PDP MA-PD MA-PD MA-only PDP MA-PD MA-PD
For the highest rating, the improvement measure(s) may not be used under certain circumstances which are explained in the section titled “Applying the Improvement Measure(s)”.
There are a total of 9 domains (topic areas) comprised of up to 46 measures.
1. MA-only contracts are measured on 5 domains with up to 33 measures.
2. PDPs are measured on 4 domains with up to 13 measures.

(Last Updated 10/03/2014) Page 4
3. MA-PD contracts are measured on all 9 domains with up to 44 unique measures.
Methodology for Assigning Part C and D Measure Star Ratings
CMS develops Part C and Part D Star Ratings in advance of the annual enrollment period each fall. Ratings are calculated at the contract level.
The principle for assigning Star Ratings for a measure is based on grouping measure scores so that the variation in measure scores within Star Rating categories is minimized.
CMS has posted a document about the trends in Part C & D Star Rating cut points on the website at
http://go.cms.gov/partcanddstarratings. This document will be updated after each rating cycle is released.
Predetermined Thresholds
CMS has set fixed 4-star thresholds for many measures. These were originally set to define expectations about what it takes to be a high quality contract and to drive quality improvement. Since then, however, we have found there is often an opposite effect on quality improvement. No new 4-star thresholds were set for the 2015 Star Ratings. Previously established 4-star thresholds were set on the performance of all contracts in prior years; therefore they have not been set for revised measures or for measures with less than 2 years of measurement experience and may be dropped if there is a significant change in a measures metric.
The distribution of data is evaluated to assign the other star values. For example, in the colorectal cancer screening measure, a contract that has a rate of 58% or more will receive at least 4 stars. A contract that had a colorectal cancer screening rate of 65% will receive 5 stars since they were well above other contracts.
Methodology for Calculating Stars for Individual Measures
CMS assigns stars for each measure by applying one of two different methods: clustering or relative distribution and significance testing. Each method is described in detail below. Attachment K explains this process in more detail.
A. Relative Distribution and Clustering:
This method is applied to the majority of CMS’ Star Ratings for star assignments, ranging from operational and process-based measures, to HEDIS and other clinical care measures.
The Star Rating for each of the individual measures using this methodology is determined by applying a clustering algorithm to the individual measure scores. Conceptually, the clustering algorithm identifies the “gaps” in the data and create five categories (one for each star rating) such that scores of contracts in the same score category (star rating) are as similar as possible, and scores of contracts in different categories are as different as possible.
The variance in measure scores is separated into within-cluster and between-cluster sum of squares components. The clusters reflect the groupings of individual measure scores that minimize the variance of measure scores within the clusters. The five measure Star Ratings levels are assigned to the cluster assignment that minimizes the within-cluster sum of squares. The cut points for star assignments are derived from the range of individual measure Star Ratings per cluster, and the star levels associated with each cluster are determined by ordering the means of each cluster.
B. Relative Distribution and Significance Testing (CAHPS):
This method is applied to determine valid star thresholds for CAHPS measures. In order to account for the reliability of scores produced from the CAHPS survey, the method combines evaluating the relative percentile distribution with significance testing. For example, to obtain 5 stars, a contract’s CAHPS measure score needs to be ranked above the 80th percentile and be statistically significantly higher than the national average CAHPS measure score, as well as either have not low reliability or a measure score more than one standard error above the 80th percentile. To obtain 1 star, a contract’s CAHPS measure score needs to be ranked below the

(Last Updated 10/03/2014) Page 5
15th percentile and be statistically significantly lower than the national average CAHPS measure score, as well as either have not low reliability or a measure score more than one standard error below the 15th percentile.
Methodology for Calculating Stars at the Domain Level
The domain rating is the average of the individual measure stars. To receive a domain rating, the contract must meet or exceed the minimum number of individual rated measures within the domain. The minimum number of measures required is determined as follows:
• If the total number of measures required for the organization type in the domain is odd, divide the number by two and round it to a whole number.
o Example: there are 3 required measures in the domain for the organization, 3 / 2 = 1.5, when rounded the result is 2. The contract needs to have at least 2 measures with a rating out of 3 measures for the domain to be rated.
• If the total number of measures required for the organization type in the domain is even, divide the number by two and then add one to the result.
o Example: there are 6 required measures in the domain for the organization, 6 / 2 = 3, add one to that result, 3 + 1 = 4. The contract needs at least 4 measures with Star Ratings out of the 6 measures for the domain to be rated.
Table 4 shows each domain and the number of measures needed by each contract type.
Table 4: Domain Rating Requirements
Part
Domain Contract Type
ID Name 1876
Cost † Demo
Local, E-Local & Regional
CCP w/o SNP
Local, E-Local & Regional
CCP with SNP MSA E-PDP & PDP
E-PFFS & PFFS
C 1 Staying Healthy: Screenings, Tests and Vaccines 5 of 8 5 of 8 5 of 8 5 of 8 5 of 8 N/A 5 of 8
C 2 Managing Chronic (Long Term) Conditions 5 of 9 8 of 14 6 of 10 8 of 14 6 of 10 N/A 6 of 10
C 3 Member Experience with Health Plan 4 of 6 4 of 6 4 of 6 4 of 6 4 of 6 N/A 4 of 6
C 4 Member Complaints and Changes in the Health Plan's Performance
2 of 3 2 of 3 2 of 3 2 of 3 2 of 3 N/A 2 of 3
C 5 Health Plan Customer Service 2 of 2 2 of 2 2 of 2 2 of 2 2 of 2 N/A 2 of 2
D 1 Drug Plan Customer Service 2 of 2* 2 of 2* 2 of 2 2 of 2 N/A 2 of 2 2 of 2
D 2 Member Complaints and Changes in the Drug Plan’s Performance
2 of 3* 2 of 3* 2 of 3 2 of 3 N/A 2 of 3 2 of 3
D 3 Member Experience with the Drug Plan 2 of 2* 2 of 2* 2 of 2 2 of 2 N/A 2 of 2 2 of 2
D 4 Drug Safety and Accuracy of Drug Pricing 4 of 6* 4 of 6* 4 of 6 4 of 6 N/A 4 of 6 4 of 6
* Note: Does not apply to MA-only 1876 Cost contracts which do not offer drug benefits. † Note: 1876 Cost contracts which do not submit data for the MPF measure must have a rating in 3 out of 5 Drug Pricing and Patient Safety measures to receive a rating in that domain.
Weighting of Measures
For the 2015 Star Ratings, CMS assigned the highest weight to the improvement measures, followed by the outcomes and intermediate outcomes measures, then by patient experience/complaints and access measures, and finally the process measures. Process measures are weighted the least. The Part C, Part D, and overall MA-PD ratings are thus calculated as weighted averages of the ratings of individual measures. The weights assigned to each measure for summary and overall Star Ratings are shown in Attachment G.
A measure given a weight of 3 counts three times as much as a measure given a weight of 1. For both the summary and overall ratings, the rating for a single contract is calculated as a weighted average of the measures available for that contact. The first step in this calculation is to multiply each individual measure’s weight by the measure’s Star Rating and then sum all results for all the measures available for each contract. The second step is to divide this result by the sum of the weights for the measures available for the contract.

(Last Updated 10/03/2014) Page 6
Methodology for Calculating Part C and Part D Summary Ratings
The Part C and Part D summary ratings are calculated by taking a weighted average of the measure level ratings for Part C and D, respectively. To receive a Part C and/or D summary rating, a contract must meet the minimum number of individual measures with assigned Star Rating. The Part C and D improvement measures are not included in the count for the minimum number of measures needed. The minimum number of measures required is determined as follows:
• If the total number of measures required for the organization type in the domain is odd, divide the number by two and round it to a whole number.
o Example: if there were 13 required Part D measures for the organization, 13 / 2 = 6.5, when rounded the result is 7. The contract needs at least 7 measures with ratings out of the 13 total measures to receive a Part D summary rating.
• If the total number of measures required for the organization type in the domain is even, divide the number of measures by two.
o Example: if there were 32 required Part C measures for the organization, 32 / 2 = 16. The contract needs at least 16 measures with ratings out of the 34 total measures to receive a Part C summary rating.
Table 5 shows the minimum number of measures having a rating needed by each contract type to receive a summary rating.
Table 5: Part C and Part D Summary Rating Requirements
Rating 1876 Cost † Demo Local, E-Local &
Regional CPP w/o SNP Local, E-Local &
Regional CPP with SNP MSA E-PDP & PDP
E-PFFS & PFFS
Part C Rating 14 of 27 16 of 32 14 of 28 16 of 32 14 of 28 N/A 14 of 28
Part D Rating 6 of 12 6 of 12 6 of 12 6 of 12 N/A 6 of 12 6 of 12
† Note: 1876 Cost contracts which do not submit data for the MPF measure must have ratings in 6 out of 11 measures to receive a Part D rating.
For this rating, half stars are also assigned to allow for more variation across contracts.
Additionally, to reward consistently high performance, CMS utilizes both the mean and the variance of individual performance ratings to differentiate contracts for the summary score. That is, a measure of individual performance score dispersion, specifically an integration factor (i-Factor), is added to the mean score to reward contracts if they have both high and stable relative performance. Details about the i-Factor can be found in the section titled “Applying the Integration Factor”.
Methodology for Calculating the Overall MA-PD Rating
For MA-PDs to receive an overall rating, the contract must have stars assigned to both the Part C summary rating and the Part D summary rating. If an MA-PD contract has only one of the two required summary ratings, it will show as, “Not enough data available”.
The overall Star Rating for MA-PD contracts is calculated by taking a weighted average of the Part C and D measure level stars.
There are a total of 46 measures (33 in Part C, 13 in Part D). The following two measures are contained in both the Part C and D measure lists:
1. Complaints about the Health/Drug Plan (CTM)
2. Members Choosing to Leave the Plan (MCLP)
These measures share the same data source, so CMS has only included the measure once in calculating the overall Star Rating. The Part C and D improvement measures are also not included in the count for the minimum number of measures. This results in a total of 42 distinct measures (the Part D CTM and MCLP measures are duplicates of the Part C measures).
(Last Updated 10/03/2014) Page 7
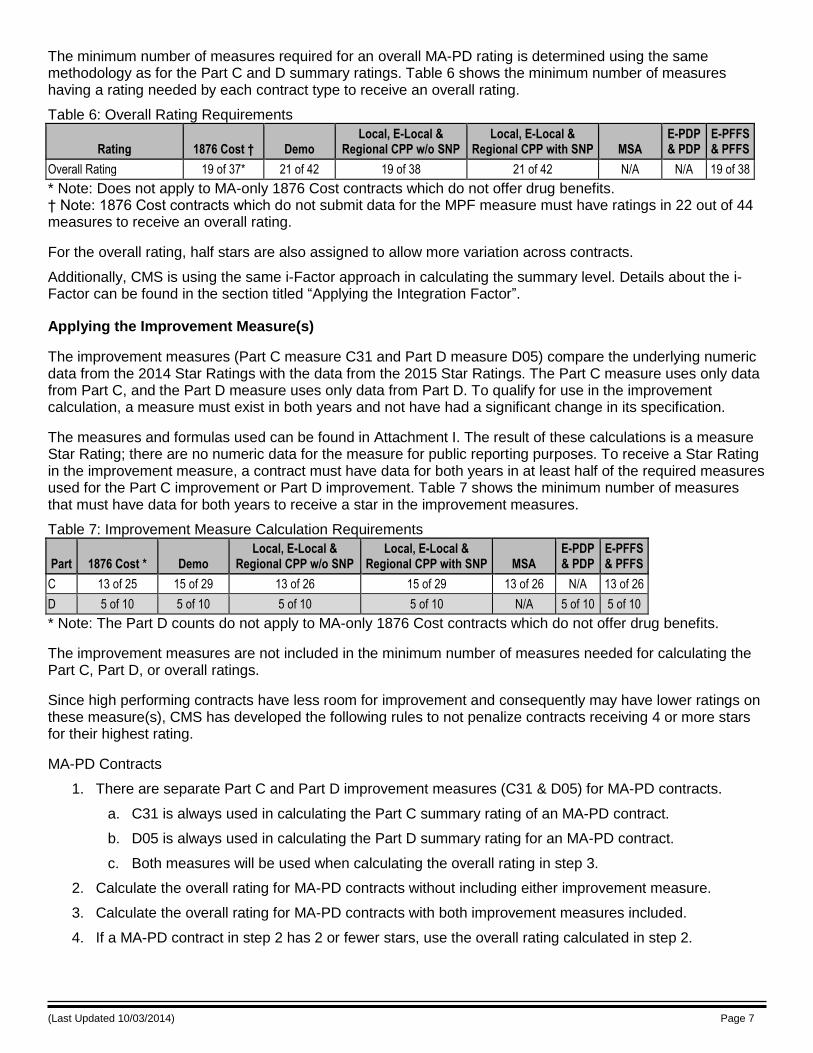
The minimum number of measures required for an overall MA-PD rating is determined using the same methodology as for the Part C and D summary ratings. Table 6 shows the minimum number of measures having a rating needed by each contract type to receive an overall rating.
Table 6: Overall Rating Requirements
Rating 1876 Cost † Demo Local, E-Local &
Regional CPP w/o SNP Local, E-Local &
Regional CPP with SNP MSA E-PDP & PDP
E-PFFS & PFFS
Overall Rating 19 of 37* 21 of 42 19 of 38 21 of 42 N/A N/A 19 of 38
* Note: Does not apply to MA-only 1876 Cost contracts which do not offer drug benefits. † Note: 1876 Cost contracts which do not submit data for the MPF measure must have ratings in 22 out of 44 measures to receive an overall rating.
For the overall rating, half stars are also assigned to allow more variation across contracts.
Additionally, CMS is using the same i-Factor approach in calculating the summary level. Details about the i-Factor can be found in the section titled “Applying the Integration Factor”.
Applying the Improvement Measure(s)
The improvement measures (Part C measure C31 and Part D measure D05) compare the underlying numeric data from the 2014 Star Ratings with the data from the 2015 Star Ratings. The Part C measure uses only data from Part C, and the Part D measure uses only data from Part D. To qualify for use in the improvement calculation, a measure must exist in both years and not have had a significant change in its specification.
The measures and formulas used can be found in Attachment I. The result of these calculations is a measure Star Rating; there are no numeric data for the measure for public reporting purposes. To receive a Star Rating in the improvement measure, a contract must have data for both years in at least half of the required measures used for the Part C improvement or Part D improvement. Table 7 shows the minimum number of measures that must have data for both years to receive a star in the improvement measures.
Table 7: Improvement Measure Calculation Requirements
Part 1876 Cost * Demo Local, E-Local &
Regional CPP w/o SNP Local, E-Local &
Regional CPP with SNP MSA E-PDP & PDP
E-PFFS & PFFS
C 13 of 25 15 of 29 13 of 26 15 of 29 13 of 26 N/A 13 of 26
D 5 of 10 5 of 10 5 of 10 5 of 10 N/A 5 of 10 5 of 10
* Note: The Part D counts do not apply to MA-only 1876 Cost contracts which do not offer drug benefits.
The improvement measures are not included in the minimum number of measures needed for calculating the Part C, Part D, or overall ratings.
Since high performing contracts have less room for improvement and consequently may have lower ratings on these measure(s), CMS has developed the following rules to not penalize contracts receiving 4 or more stars for their highest rating.
MA-PD Contracts
1. There are separate Part C and Part D improvement measures (C31 & D05) for MA-PD contracts.
a. C31 is always used in calculating the Part C summary rating of an MA-PD contract.
b. D05 is always used in calculating the Part D summary rating for an MA-PD contract.
c. Both measures will be used when calculating the overall rating in step 3.
2. Calculate the overall rating for MA-PD contracts without including either improvement measure.
3. Calculate the overall rating for MA-PD contracts with both improvement measures included.
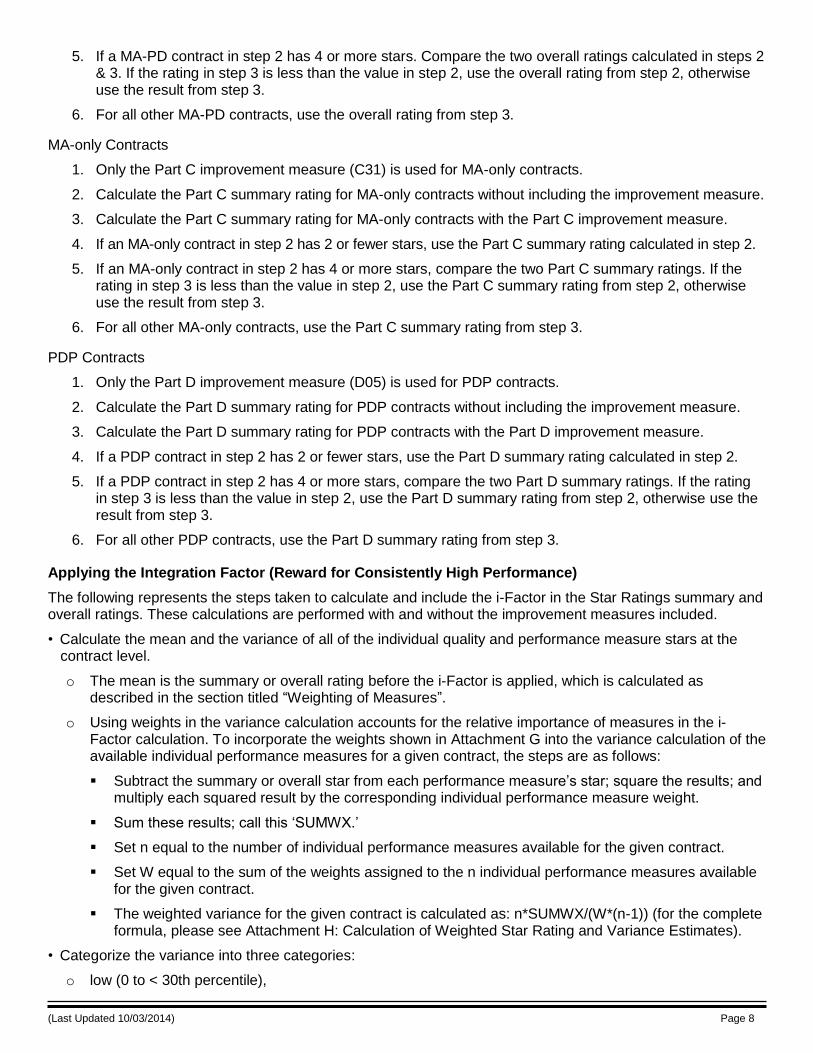
4. If a MA-PD contract in step 2 has 2 or fewer stars, use the overall rating calculated in step 2.
(Last Updated 10/03/2014) Page 8
5. If a MA-PD contract in step 2 has 4 or more stars. Compare the two overall ratings calculated in steps 2 & 3. If the rating in step 3 is less than the value in step 2, use the overall rating from step 2, otherwise use the result from step 3.
6. For all other MA-PD contracts, use the overall rating from step 3.
MA-only Contracts
1. Only the Part C improvement measure (C31) is used for MA-only contracts.
2. Calculate the Part C summary rating for MA-only contracts without including the improvement measure.
3. Calculate the Part C summary rating for MA-only contracts with the Part C improvement measure.
4. If an MA-only contract in step 2 has 2 or fewer stars, use the Part C summary rating calculated in step 2.
5. If an MA-only contract in step 2 has 4 or more stars, compare the two Part C summary ratings. If the rating in step 3 is less than the value in step 2, use the Part C summary rating from step 2, otherwise use the result from step 3.
6. For all other MA-only contracts, use the Part C summary rating from step 3.
PDP Contracts
1. Only the Part D improvement measure (D05) is used for PDP contracts.
2. Calculate the Part D summary rating for PDP contracts without including the improvement measure.
3. Calculate the Part D summary rating for PDP contracts with the Part D improvement measure.
4. If a PDP contract in step 2 has 2 or fewer stars, use the Part D summary rating calculated in step 2.
5. If a PDP contract in step 2 has 4 or more stars, compare the two Part D summary ratings. If the rating in step 3 is less than the value in step 2, use the Part D summary rating from step 2, otherwise use the result from step 3.
6. For all other PDP contracts, use the Part D summary rating from step 3.
Applying the Integration Factor (Reward for Consistently High Performance)
The following represents the steps taken to calculate and include the i-Factor in the Star Ratings summary and overall ratings. These calculations are performed with and without the improvement measures included.
• Calculate the mean and the variance of all of the individual quality and performance measure stars at the contract level.
o The mean is the summary or overall rating before the i-Factor is applied, which is calculated as described in the section titled “Weighting of Measures”.
o Using weights in the variance calculation accounts for the relative importance of measures in the i-Factor calculation. To incorporate the weights shown in Attachment G into the variance calculation of the available individual performance measures for a given contract, the steps are as follows:
Subtract the summary or overall star from each performance measure’s star; square the results; and multiply each squared result by the corresponding individual performance measure weight.
Sum these results; call this ‘SUMWX.’
Set n equal to the number of individual performance measures available for the given contract.
Set W equal to the sum of the weights assigned to the n individual performance measures available for the given contract.
The weighted variance for the given contract is calculated as: n*SUMWX/(W*(n-1)) (for the complete formula, please see Attachment H: Calculation of Weighted Star Rating and Variance Estimates).
• Categorize the variance into three categories:
o low (0 to < 30th percentile),

(Last Updated 10/03/2014) Page 9
o medium (≥ 30th to < 70th percentile) and
o high (≥ 70th percentile)
• Develop the i-Factor as follows:
o i-Factor = 0.4 (for contract w/ low variability & high mean (mean ≥ 85th percentile))
o i-Factor = 0.3 (for contract w/ medium variability & high mean (mean ≥ 85th percentile))
o i-Factor = 0.2 (for contract w/ low variability & relatively high mean (mean ≥ 65th & < 85th percentile))
o i-Factor = 0.1 (for contract w/ medium variability & relatively high mean (mean ≥ 65th & < 85th percentile))
o i-Factor = 0.0 (for all other contracts)
• Develop final summary score or overall scores using 0.5 as the star scale (create 10 possible overall scores as: 0.5, 1.0, 1.5, 2.0, 2.5, 3.0, 3.5, 4.0, 4.5, and 5.0).
• Apply rounding to final summary or overall scores such that stars that are within the distance of 0.25 above or below any half-star scale will be rounded to that half-star scale.
• Tables 8 and 9 show the final threshold values used in i-Factor calculations for the 2015 Star Ratings:
Table 8: Performance Summary Thresholds
Improvement Percentile Part C Rating Part D Rating (MA-PD) Part D Rating (PDP) Overall Rating
with 65th 3.691 3.807 3.800 3.716
with 85th 4.029 4.123 4.100 3.986
without 65th 3.694 3.723 3.733 3.670
without 85th 4.022 4.060 3.980 3.957
Table 9: Variance Thresholds
Improvement Percentile Part C Rating Part D Rating (MA-PD) Part D Rating (PDP) Overall Rating
with 30th .986 .731 1.094 .941
with 70th 1.405 1.379 1.668 1.374
without 30th 1.033 .716 1.096 .970
without 70th 1.467 1.371 1.665 1.398
Calculation Precision
CMS and its contractors have always used software called SAS (pronounced "sass", an integrated system of software products provided by SAS Institute Inc.) to perform the calculations used in the Star Ratings. For all measures, except the improvement measures, the precision used in scoring the measure is indicated next to the label “Data Display” within the detailed description of each measure. The improvement measures are discussed further below. The domain ratings are the average of the star measures and are rounded to the nearest integer.
The improvement measures, summary and overall ratings are calculated with at least six digits of precision after the decimal whenever the data allow it. With the exception of the Plan All-Cause Readmission measure, the HEDIS measure score input data have two digits of precision after the decimal. All other measures have at least six digits of precision in the improvement calculation.
During plan previews, we display three digits after the decimal in HPMS for easier human readability. We used to only display two digits after the decimal, but there were instances where this artificially rounded value made it appear that values had achieved a boundary when they actually did not. There will still be instances when displaying three digits that values will appear to be at a boundary. When those cases occur, the ratings mailbox may be contacted for higher precision values which were used in the actual calculations.
It is not possible to replicate CMS’ calculations exactly due to factors including, but not limited to, rounding of published raw measure data and CMS excluding some contracts’ ratings from publically-posted data (e.g., terminated contracts).

(Last Updated 10/03/2014) Page 10
Rounding Rules for Measure Scores:
Measure scores are rounded to the nearest whole number. Using standard rounding rules, raw measure scores that end in 0.49 or less are rounded down and raw measure scores that end in 0.50 or more are rounded up. So, for example, a measure score of 83.49 rounds down to 83 while a measure score of 83.50 rounds up to 84.
Rounding Rules for Summary and Overall Scores:
Summary and overall scores are rounded to the nearest half star (i.e., 0.5, 1.0, 1.5, 2.0, 2.5, 3.0, 3.5, 4.0, 4.5, 5.0). Table 10 shows how scores are rounded.
Table 10: Rounding Rules for Summary and Overall Scores
Raw Summary / Overall Score Final Summary / Overall Score
≥ 0.000 and < 0.250 0
≥ 0.250 and < 0.750 0.5
≥ 0.750 and < 1.250 1.0
≥ 1.250 and < 1.750 1.5
≥ 1.750 and < 2.250 2.0
≥ 2.250 and < 2.750 2.5
≥ 2.750 and < 3.250 3.0
≥ 3.250 and < 3.750 3.5
≥ 3.750 and < 4.250 4.0
≥ 4.250 and < 4.750 4.5
≥ 4.750 5.0
For example, a summary or overall score of 3.749 rounds down to 3.5, and a measure score of 3.751 rounds up to 4.
Methodology for Calculating the High Performing Icon
A contract may receive a high performing icon as a result of its performance on the Part C and D measures. The high performing icon is assigned to an MA-only contract for achieving a 5-star Part C summary rating, a PDP contract for a 5-star Part D summary ratings and a MA-PD contract for a 5-star overall rating. Figure 1 shows the high performing icon to be used in the MPF:
Figure 1: The High Performing Icon
Methodology for Calculating the Low Performing Icon
A contract can receive a low performing icon as a result of its performance on the Part C and/or Part D summary rating. The low performing icon is calculated by evaluating the Part C and Part D summary level ratings for the current year and the past two years (i.e., the 2013, 2014, and 2015 Star Ratings). If the contract had any combination of Part C and/or Part D summary rating of 2.5 or lower in all three years of data, it is marked with a low performing icon (LPI). A contract must have a rating in either Part C and/or Part D for all three years to be considered for this icon.
Table 11 shows example contracts which would receive an LPI.

(Last Updated 10/03/2014) Page 11
Table 11: Example LPI contracts
Contract/Rating Rated As 2013 C 2014 C 2015 C 2013 D 2014 D 2015 D LPI Awarded LPI Reason
HAAAA MA-PD 2 2.5 2.5 3 3 3 Yes Part C
HBBBB MA-PD 3 3 3 2.5 2 2.5 Yes Part D
HCCCC MA-PD 2.5 3 3 3 2.5 2.5 Yes Part C or D
HDDDD MA-PD 3 2.5 3 2.5 3 2.5 Yes Part C or D
HEEEE MA-PD 2.5 2 2.5 2 2.5 2.5 Yes Part C and D
HFFFF MA-only 2.5 2 2.5 - - - Yes Part C
SAAAA PDP - - - 2.5 2.5 2 Yes Part D
Figure 2 shows the low performing contract icon used in the MPF:
Figure 2: The Low Performing Icon
Adjustments for Contracts Under Sanction
Contracts under an enrollment sanction are automatically assigned 2.5 stars for their highest rating. If a contract under sanction already has 2.5 stars or below for their highest rating, it will receive a 1-star reduction. Contracts under sanction will be evaluated and adjusted at two periods each year.
• August 31st: Contracts under sanction as of August 31st will have their highest Star Rating reduced in that fall's rating on MPF.
• March 31st: Star Ratings for contracts either coming off sanction or going under sanction will be updated for the MPF and Quality Bonus Payment purposes. A contract whose sanction has ended after August 31st will have its original highest Star Rating restored. A contract that received a sanction after August 31st will have its highest Star Rating reduced. Contracts will be informed of the changes in time to synchronize their submission of plan bids for the following year. Updates will also be displayed on MPF.
CAHPS Methodology
The CAHPS measures are case-mix adjusted to take into account differences in the characteristics of enrollees across contracts that may potentially impact survey responses. See Attachment A for the case-mix adjusters.
The CAHPS star calculations also take into account statistical significance and reliability of the measure. The base stars are the number of stars assigned prior to taking into account statistical significance and reliability.
These are the rules applied to the base star values to arrive at the final CAHPS measure star value:
5 base stars: If significance is NOT above average OR reliability is low, the Final Star value equals 4.
4 base stars: Always stays 4 Final Stars.
3 base stars: If significance is below average, the Final Star value equals 2.
2 base stars: If significance is NOT below average AND reliability is low, the Final Star value equals 3.
1 base star: If significance is NOT below average AND reliability is low, the Final Star value equals 3 or if significance is below average and reliability is low, the Final Star value equals 2 or if significance is not below average and reliability is not low, the Final Star value equals 2.

(Last Updated 10/03/2014) Page 12
Special Needs Plan (SNP) Data
CMS has included four SNP-specific measures in the 2015 Star Ratings. One measure (C09) is based on data reported by contracts through the Medicare Part C Reporting Requirements. The other three measures (C10, C11, and C12) are based on data from the HEDIS Care for Older Adults measure. The data for all of these measures are reported at the plan benefit package (PBP) level, while the Star Ratings are reported at the contract level.
The methodology used to combine the PBP data to the contract level is different between the two data sources. The Part C Reporting Requirements data are summed into a contract-level rate after excluding PBPs that do not map to any PBP under any contract in the calendar year under which the Reporting Requirements data underwent data validation. The HEDIS data are summed into a contract-level rate as long as the contract will be offering a SNP PBP in the Star Ratings year.
The two methodologies used to combine the PBP data with in a contract for these measures are described further in Attachment E.
Star Ratings and Marketing
Plan sponsors must ensure the Star Ratings document and all marketing of Star Ratings information is compliant with CMS’ Medicare Marketing Guidelines. Failure to follow CMS’ guidance may result in compliance actions against the contract. The Medicare Marketing Guidelines were issued as Chapters 2 and 3 of the Prescription Drug Benefit Manual and the Medicare Managed Care Manual, respectively. Please direct questions about marketing Star Ratings information to your Account Manager.
Contact Information
The contact below can assist you with various aspects of the Star Ratings.
• Part C & D Star Ratings: [email protected]
If you have questions or require information about the specific subject areas associated with the Star Ratings please write to those contacts directly and cc the Part C & D Star Ratings mailbox.
• CAHPS (MA & Part D): [email protected]
• Call Center Monitoring: [email protected]
• HEDIS: [email protected]
• HOS: [email protected]
• Part C Plan Reporting: [email protected]
• Part C & D Plan Reporting Data Validation: [email protected]
• Marketing: [email protected]
• QBP Ratings and Appeals questions: [email protected]
• QBP Payment or Risk Analysis questions: [email protected]

(Last Updated 10/03/2014) Page 13
Framework and Definitions for the Domain and Measure Details Section
This page contains the formatting framework and definition of each sub-section that is used to describe the domain and measure details on the following pages.
Domain: Contains the domain to which the measures below it belong
Measure: The measure ID and common name of the ratings measure
Label for Stars: The label that will appear with the stars for this measure on Medicare.gov.
Label for Data: The label that will appear with the numeric data for this measure on Medicare.gov.
HEDIS Label: Optional – this sub-section is displayed for HEDIS measures only, it contains the full NCQA HEDIS measure name.
Measure Reference: Optional – when listed, this sub-section contains the location of the detailed measure specification in the NCQA documentation for all HEDIS and HEDIS/HOS measures.
Description: The English language measure description that will be shown for the measure on Medicare.gov. The text in this sub-section has been cognitively tested with beneficiaries to aid in their understanding the purpose of the measure.
Metric: Defines how the measure is calculated.
Exclusions: Optional – when listed, this sub-section will contain any exclusions applied to the data in the final measure.
Standard: Optional – when listed, this sub-section will contain information about any CMS standards that apply for the measure.
General Notes: Optional – when listed, this sub-section contains additional information about the measure and the data used.
Data Source: The source of the data used in the measure.
Data Source Description: Optional – when listed, this sub-section contains additional information about the data source for the measure.
CMS Framework Area: Contains the area where this measure fits into the CMS Quality Framework.
NQF #: The National Quality Framework (NQF) number for the measure or “None” if the measure is not NQF endorsed.
Data Time Frame: The time frame of data used from the data source. In some HEDIS measures this date range may appear to conflict with the specific data time frame defined in the NCQA Technical Specifications. In those cases, the data used by CMS is unchanged from what was submitted to NCQA. CMS uses the data time frame of the overall HEDIS submission which is the HEDIS measurement year.
General Trend: Indicates whether high values are better or low values are better for the measure.
Statistical Method: The methodology used for assigning stars in this measure, see the section titled “Methodology for Assigning Part C and Part D Measure Star Ratings” for an explanation of each of the possible entries in this sub-section.
Improvement Measure: Indicates whether this measure is included in the improvement measure or not.
Weighting Category: The category this measure belongs to for weighting.
Weighting Value: The numeric weight that will be used for this measure in the summary and overall rating calculations.
Data Display: The format that will be used to the display the numeric data on Medicare.gov
Reporting Requirements: Table indicating which organization types were required to report the measure. “Yes” for organizations required to report, “No” for organizations not required to report.
4-Star Threshold: Contains the pre-set 4-star threshold for the measure or “Not predetermined” if there is none.
Cut Points: Table containing the cut points used in the measure. For CAHPS measures, these cut points were used prior to the final star rules being applied.

(Last Updated 10/03/2014) Page 14
Part C Domain and Measure Details
See Attachment C for the national averages of individual Part C measures.
Domain: 1 - Staying Healthy: Screenings, Tests and Vaccines
Measure: C01 - Colorectal Cancer Screening
Label for Stars: Colorectal Cancer Screening
Label for Data: Colorectal Cancer Screening
HEDIS Label: Colorectal Cancer Screening (COL)
Measure Reference: NCQA HEDIS 2014 Technical Specifications Volume 2, page 85
Description: Percent of plan members aged 50-75 who had appropriate screening for colon cancer
Metric: The percentage of MA enrollees aged 50 to 75 (denominator) who had one or more appropriate screenings for colorectal cancer (numerator).
Exclusions: (optional) Members with a diagnosis of colorectal cancer or total colectomy. Look for evidence of colorectal cancer or total colectomy as far back as possible in the member’s history. Refer to NCQA HEDIS 2013 Technical Specifications Volume 2, page 87, Table COL-B for codes to identify exclusions. Contracts whose enrollment was less than 1,000 as of the July 2013 enrollment report were excluded from this measure.
Data Source: HEDIS
CMS Framework Area: Clinical care
NQF #: 0034
Data Time Frame: 01/01/2013 - 12/31/2013
General Trend: Higher is better
Statistical Method: Relative Distribution and Clustering
Improvement Measure: Included
Weighting Category: Process Measure
Weighting Value: 1
Data Display: Percentage with no decimal point
Reporting Requirements: 1876 Cost Demo
Local, E-Local & Regional CCP w/o SNP
Local, E-Local & Regional CCP with SNP MSA
E-PDP & PDP
E-PFFS & PFFS
Yes Yes Yes Yes Yes No Yes
4-Star Threshold: ≥ 58%
Cut Points: 1 Star 2 Star 3 Star 4 Star 5 Star
< 41% ≥ 41% to < 52% ≥ 52% to < 58% ≥ 58% to < 65% ≥ 65%

(Last Updated 10/03/2014) Page 15
Measure: C02 - Cardiovascular Care – Cholesterol Screening
Label for Stars: Cholesterol Screening for Patients with Heart Disease
Label for Data: Cholesterol Screening for Patients with Heart Disease
HEDIS Label: Cholesterol Management for Patients With Cardiovascular Conditions (CMC)
Measure Reference: NCQA HEDIS 2014 Technical Specifications Volume 2, page 130
Description: Percent of plan members with heart disease who have had a test for “bad” (LDL) cholesterol within the past year.
Metric: The percentage of MA enrollees 18–75 years of age who were discharged alive for Acute Myocardial Infarction (AMI), coronary artery bypass graft (CABG) or percutaneous coronary interventions (PCI) from January 1–November 1 of the year prior to the measurement year, or who had a diagnosis of ischemic vascular disease (IVD) during the measurement year and the year prior to the measurement year (denominator), who had an LDL-C screening test performed during the measurement year (numerator).
Exclusions: Contracts whose enrollment was less than 1,000 as of the July 2013 enrollment report were excluded from this measure.
Data Source: HEDIS
CMS Framework Area: Clinical care
NQF #: 0075
Data Time Frame: 01/01/2013 - 12/31/2013
General Trend: Higher is better
Statistical Method: Relative Distribution and Clustering
Improvement Measure: Included
Weighting Category: Process Measure
Weighting Value: 1
Data Display: Percentage with no decimal point
Reporting Requirements: 1876 Cost Demo
Local, E-Local & Regional CCP w/o SNP
Local, E-Local & Regional CCP with SNP MSA
E-PDP & PDP
E-PFFS & PFFS
Yes Yes Yes Yes Yes No Yes
4-Star Threshold: ≥ 85%
Cut Points: 1 Star 2 Star 3 Star 4 Star 5 Star
< 78% ≥ 78% to < 82% ≥ 82% to < 85% ≥ 85% to < 89% ≥ 89%

(Last Updated 10/03/2014) Page 16
Measure: C03 - Diabetes Care – Cholesterol Screening
Label for Stars: Cholesterol Screening for Patients with Diabetes
Label for Data: Cholesterol Screening for Patients with Diabetes
HEDIS Label: Comprehensive Diabetes Care (CDC) – LDL-C Screening
Measure Reference: NCQA HEDIS 2014 Technical Specifications Volume 2, page 144
Description: Percent of plan members with diabetes who have had a test for “bad” (LDL) cholesterol within the past year.
Metric: The percentage of diabetic MA enrollees 18-75 with diabetes (type 1 and type 2) (denominator) who had an LDL-C screening test performed during the measurement year (numerator).
Exclusions: (optional) • Members with a diagnosis of polycystic ovaries (Refer to NCQA HEDIS 2013 Technical Specifications Volume 2, page 156, Table CDC-O) who did not have a face-to-face encounter, in any setting, with a diagnosis of diabetes (Refer to NCQA HEDIS 2013 Technical Specifications Volume 2, page 156, Table CDC-B) during the measurement year or the year before the measurement year. Diagnosis may occur at any time in the member’s history, but must have occurred by December 31 of the measurement year. • Members with gestational or steroid-induced diabetes (CDC-O) who did not have a face-to-face encounter, in any setting, with a diagnosis of diabetes (CDC-B) during the measurement year or the year before the measurement year. Diagnosis may occur during the measurement year or the year before the measurement year, but must have occurred by December 31 of the measurement year. Contracts whose enrollment was less than 1,000 as of the July 2013 enrollment report were excluded from this measure.
Data Source: HEDIS
CMS Framework Area: Clinical care
NQF #: 1780
Data Time Frame: 01/01/2013 - 12/31/2013
General Trend: Higher is better
Statistical Method: Relative Distribution and Clustering
Improvement Measure: Included
Weighting Category: Process Measure
Weighting Value: 1
Data Display: Percentage with no decimal point
Reporting Requirements: 1876 Cost Demo
Local, E-Local & Regional CCP w/o SNP
Local, E-Local & Regional CCP with SNP MSA
E-PDP & PDP
E-PFFS & PFFS
Yes Yes Yes Yes Yes No Yes
4-Star Threshold: ≥ 85%
Cut Points: 1 Star 2 Star 3 Star 4 Star 5 Star
< 81% ≥ 81% to < 83% ≥ 83% to < 85% ≥ 85% to < 91% ≥ 91%

(Last Updated 10/03/2014) Page 17
Measure: C04 - Annual Flu Vaccine
Label for Stars: Annual Flu Vaccine
Label for Data: Annual Flu Vaccine
Description: Percent of plan members who got a vaccine (flu shot) prior to flu season.
Metric: The percentage of sampled Medicare enrollees (denominator) who received an influenza vaccination during the measurement year (numerator).
General Notes: This measure is not case-mix adjusted. CAHPS Survey results were sent to each contract's Medicare Compliance Officer in early August 2014. These reports provide further explanation of the CAHPS scoring methodology and provide detailed information on why a specific rating was assigned.
Data Source: CAHPS
Data Source Description: CAHPS Survey Question (question number varies depending on survey type): • Have you had a flu shot since July 1, 2013?
CMS Framework Area: Clinical care
NQF #: 0040
Data Time Frame: 02/15/2014 - 05/31/2014
General Trend: Higher is better
Statistical Method: Relative Distribution and Significance Testing
Improvement Measure: Included
Weighting Category: Process Measure
Weighting Value: 1
Data Display: Percentage with no decimal point
Reporting Requirements: 1876 Cost Demo
Local, E-Local & Regional CCP w/o SNP
Local, E-Local & Regional CCP with SNP MSA
E-PDP & PDP
E-PFFS & PFFS
Yes Yes Yes Yes Yes No Yes
4-Star Threshold: Not predetermined
Cut Points: 1 Star 2 Star 3 Star 4 Star 5 Star
< 65% ≥ 65% to < 69% ≥ 69% to < 75% ≥ 75% to < 79% ≥ 79%
Measure: C05 - Improving or Maintaining Physical Health
Label for Stars: Improving or Maintaining Physical Health
Label for Data: Improving or Maintaining Physical Health
Description: Percent of all plan members whose physical health was the same or better than expected after two years.
Metric: The percentage of sampled Medicare enrollees (denominator) whose physical health status was the same or better than expected (numerator).
Exclusions: Contracts with less than 30 responses are suppressed.
Data Source: HOS
Data Source Description: 2011-2013 Cohort 14 Performance Measurement Results (2011 Baseline data collection, 2013 Follow-up data collection) 2-year PCS change – Questions: 1, 2a-b, 3a-b & 5
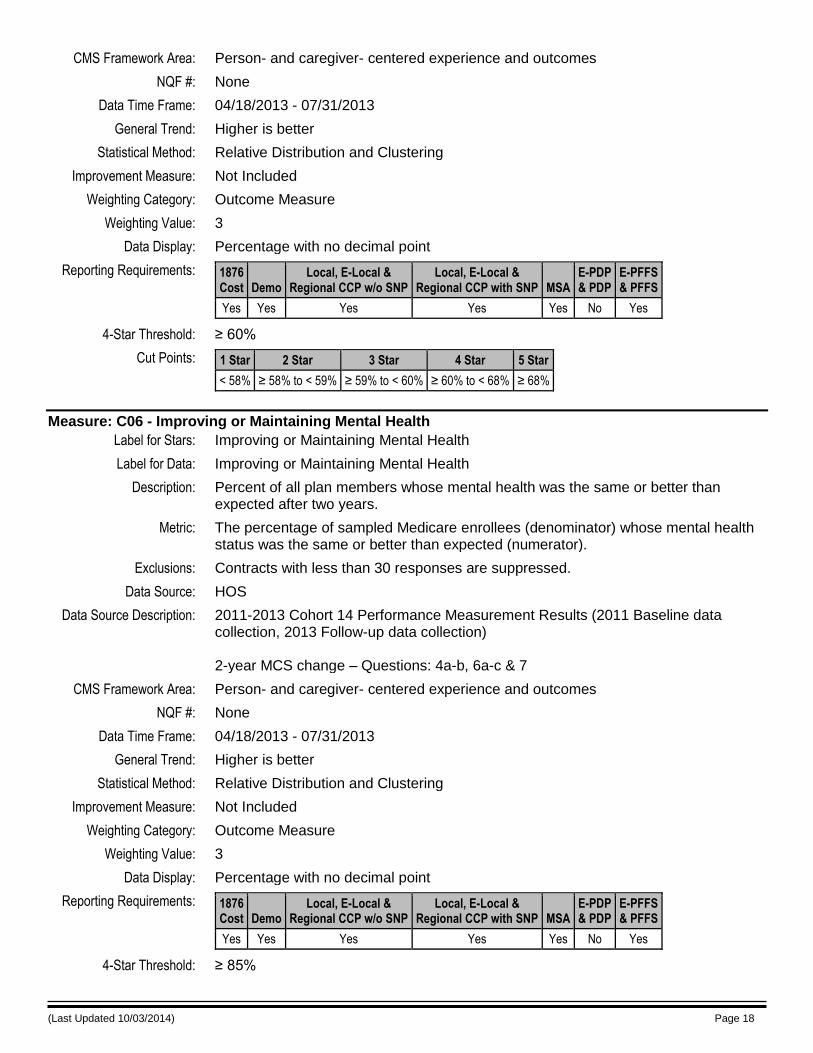
(Last Updated 10/03/2014) Page 18
CMS Framework Area: Person- and caregiver- centered experience and outcomes
NQF #: None
Data Time Frame: 04/18/2013 - 07/31/2013
General Trend: Higher is better
Statistical Method: Relative Distribution and Clustering
Improvement Measure: Not Included
Weighting Category: Outcome Measure
Weighting Value: 3
Data Display: Percentage with no decimal point
Reporting Requirements: 1876 Cost Demo
Local, E-Local & Regional CCP w/o SNP
Local, E-Local & Regional CCP with SNP MSA
E-PDP & PDP
E-PFFS & PFFS
Yes Yes Yes Yes Yes No Yes
4-Star Threshold: ≥ 60%
Cut Points: 1 Star 2 Star 3 Star 4 Star 5 Star
< 58% ≥ 58% to < 59% ≥ 59% to < 60% ≥ 60% to < 68% ≥ 68%
Measure: C06 - Improving or Maintaining Mental Health
Label for Stars: Improving or Maintaining Mental Health
Label for Data: Improving or Maintaining Mental Health
Description: Percent of all plan members whose mental health was the same or better than expected after two years.
Metric: The percentage of sampled Medicare enrollees (denominator) whose mental health status was the same or better than expected (numerator).
Exclusions: Contracts with less than 30 responses are suppressed.
Data Source: HOS
Data Source Description: 2011-2013 Cohort 14 Performance Measurement Results (2011 Baseline data collection, 2013 Follow-up data collection) 2-year MCS change – Questions: 4a-b, 6a-c & 7
CMS Framework Area: Person- and caregiver- centered experience and outcomes
NQF #: None
Data Time Frame: 04/18/2013 - 07/31/2013
General Trend: Higher is better
Statistical Method: Relative Distribution and Clustering
Improvement Measure: Not Included
Weighting Category: Outcome Measure
Weighting Value: 3
Data Display: Percentage with no decimal point
Reporting Requirements: 1876 Cost Demo
Local, E-Local & Regional CCP w/o SNP
Local, E-Local & Regional CCP with SNP MSA
E-PDP & PDP
E-PFFS & PFFS
Yes Yes Yes Yes Yes No Yes
4-Star Threshold: ≥ 85%
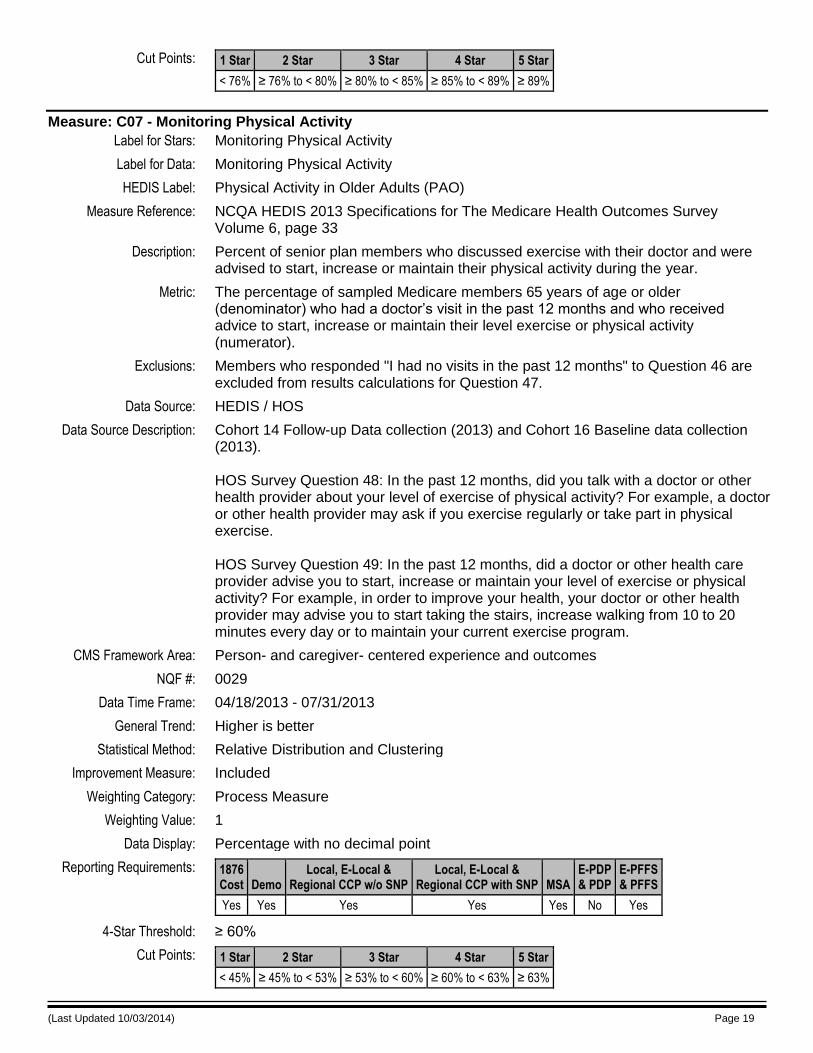
(Last Updated 10/03/2014) Page 19
Cut Points: 1 Star 2 Star 3 Star 4 Star 5 Star
< 76% ≥ 76% to < 80% ≥ 80% to < 85% ≥ 85% to < 89% ≥ 89%
Measure: C07 - Monitoring Physical Activity
Label for Stars: Monitoring Physical Activity
Label for Data: Monitoring Physical Activity
HEDIS Label: Physical Activity in Older Adults (PAO)
Measure Reference: NCQA HEDIS 2013 Specifications for The Medicare Health Outcomes Survey Volume 6, page 33
Description: Percent of senior plan members who discussed exercise with their doctor and were advised to start, increase or maintain their physical activity during the year.
Metric: The percentage of sampled Medicare members 65 years of age or older (denominator) who had a doctor’s visit in the past 12 months and who received advice to start, increase or maintain their level exercise or physical activity (numerator).
Exclusions: Members who responded "I had no visits in the past 12 months" to Question 46 are excluded from results calculations for Question 47.
Data Source: HEDIS / HOS
Data Source Description: Cohort 14 Follow-up Data collection (2013) and Cohort 16 Baseline data collection (2013). HOS Survey Question 48: In the past 12 months, did you talk with a doctor or other health provider about your level of exercise of physical activity? For example, a doctor or other health provider may ask if you exercise regularly or take part in physical exercise. HOS Survey Question 49: In the past 12 months, did a doctor or other health care provider advise you to start, increase or maintain your level of exercise or physical activity? For example, in order to improve your health, your doctor or other health provider may advise you to start taking the stairs, increase walking from 10 to 20 minutes every day or to maintain your current exercise program.
CMS Framework Area: Person- and caregiver- centered experience and outcomes
NQF #: 0029
Data Time Frame: 04/18/2013 - 07/31/2013
General Trend: Higher is better
Statistical Method: Relative Distribution and Clustering
Improvement Measure: Included
Weighting Category: Process Measure
Weighting Value: 1
Data Display: Percentage with no decimal point
Reporting Requirements: 1876 Cost Demo
Local, E-Local & Regional CCP w/o SNP
Local, E-Local & Regional CCP with SNP MSA
E-PDP & PDP
E-PFFS & PFFS
Yes Yes Yes Yes Yes No Yes
4-Star Threshold: ≥ 60%
Cut Points: 1 Star 2 Star 3 Star 4 Star 5 Star
< 45% ≥ 45% to < 53% ≥ 53% to < 60% ≥ 60% to < 63% ≥ 63%

(Last Updated 10/03/2014) Page 20
Measure: C08 - Adult BMI Assessment
Label for Stars: Checking to See if Members Are at a Healthy Weight
Label for Data: Checking to See if Members Are at a Healthy Weight
HEDIS Label: Adult BMI Assessment (ABA)
Measure Reference: NCQA HEDIS 2014 Technical Specifications Volume 2, page 56
Description: Percent of plan members with an outpatient visit who had their “Body Mass Index” (BMI) calculated from their height and weight and recorded in their medical records.
Metric: The percentage of MA enrollees 18-74 years of age (denominator) who had an outpatient visit and who had their body mass index (BMI) documented during the measurement year or the year prior the measurement year (numerator).
Exclusions: (optional) Members who have a diagnosis of pregnancy (Refer to NCQA HEDIS 2013 Technical Specifications Volume 2, page 59, Table ABA-C) during the measurement year or the year prior to the measurement year. Contracts whose enrollment was less than 1,000 as of the July 2013 enrollment report were excluded from this measure.
Data Source: HEDIS
CMS Framework Area: Clinical care
NQF #: 1690
Data Time Frame: 01/01/2013 - 12/31/2013
General Trend: Higher is better
Statistical Method: Relative Distribution and Clustering
Improvement Measure: Included
Weighting Category: Process Measure
Weighting Value: 1
Data Display: Percentage with no decimal point
Reporting Requirements: 1876 Cost Demo
Local, E-Local & Regional CCP w/o SNP
Local, E-Local & Regional CCP with SNP MSA
E-PDP & PDP
E-PFFS & PFFS
Yes Yes Yes Yes Yes No Yes
4-Star Threshold: Not predetermined
Cut Points: 1 Star 2 Star 3 Star 4 Star 5 Star
< 77% ≥ 77% to < 84% ≥ 84% to < 87% ≥ 87% to < 93% ≥ 93%

(Last Updated 10/03/2014) Page 21
Domain: 2 - Managing Chronic (Long Term) Conditions
Measure: C09 - Special Needs Plan (SNP) Care Management
Label for Stars: Members Whose Plan Did an Assessment of Their Health Needs and Risks
Label for Data: Members Whose Plan Did an Assessment of Their Health Needs and Risks
Description: The percent of members whose plan did an assessment of their health needs and risks in the past year. The results of this review are used to help the member get the care they need. (Medicare collects this information only from Medicare Special Needs Plans. Medicare does not collect this information from other types of plans.)
Metric: This measure is defined as the percent of eligible Special Needs Plan (SNP) enrollees who received a health risk assessment (HRA) during the measurement year. The denominator for this measure is the sum of the number of new enrollees (Element 13.1) and the number of enrollees eligible for an annual HRA (Element 13.2). The numerator for this measure is the sum of the number of initial HRAs performed on new enrollees (Element 13.3) and the number of annual reassessments performed (Element 13.4). The equation for calculating the SNP Care Management Assessment Rate is: [Number of initial HRAs performed on new enrollees (Element 13.3) + Number of annual reassessments performed (Element 13.4)] / [Number of new enrollees (Element 13.1) + Number of enrollees eligible for an annual HRA (Element 13.2)]
Exclusions: Contracts and PBPs with an effective termination date on or before the deadline to submit data validation results to CMS (June 30, 2014) are excluded and listed as “No data available”. SNP Care Management Assessment Rates are not provided for contracts that did not score at least 95% on data validation for the SNP Care Management reporting section. Rates are also not provided for contracts that scored 95% or higher on data validation for the SNP Care Management reporting section but that were not compliant with data validation standards/sub-standards for any the following SNP Care Management data elements: • Number of new enrollees (Element 13.1) • Number of enrollees eligible for an annual HRA (Element 13.2) • Number of initial HRAs performed on new enrollees (Element 13.3) • Number of annual reassessments performed (Element 13.4) Contracts excluded from the SNP Care Management Assessment Rates due to data validation issues are shown as “CMS identified issues with this plan's data”. Additionally, contracts must have 30 or more enrollees in the denominator [Number of new enrollees (Element 13.1) + Number of enrollees eligible for an annual HRA (Element 13.2) ≥ 30] in order to have a calculated rate. Contracts with fewer than 30 eligible enrollees are listed as "No data available.”
General Notes: More information about the data used to calculate this measure can be found in Attachment E.
Data Source: Plan Reporting
Data Source Description: Data were reported by contracts to CMS per the Part C Reporting Requirements through the Health Plan Management System. Validation of these data was performed during the 2014 Data Validation cycle.
CMS Framework Area: Clinical care

(Last Updated 10/03/2014) Page 22
NQF #: None
Data Time Frame: 01/01/2013 - 12/31/2013
General Trend: Higher is better
Statistical Method: Relative Distribution and Clustering
Improvement Measure: Not Included
Weighting Category: Process Measure
Weighting Value: 1
Data Display: Percentage with 1 decimal point
Reporting Requirements: 1876 Cost Demo
Local, E-Local & Regional CCP w/o SNP
Local, E-Local & Regional CCP with SNP MSA
E-PDP & PDP
E-PFFS & PFFS
No Yes No Yes No No No
4-Star Threshold: Not predetermined
Cut Points: 1 Star 2 Star 3 Star 4 Star 5 Star
< 32.7% ≥ 32.7% to < 49.7% ≥ 49.7% to < 60.0% ≥ 60.0% to < 78.4% ≥ 78.4%
Measure: C10 - Care for Older Adults – Medication Review
Label for Stars: Yearly Review of All Medications and Supplements Being Taken
Label for Data: Yearly Review of All Medications and Supplements Being Taken
HEDIS Label: Care for Older Adults (COA) – Medication Review
Measure Reference: NCQA HEDIS 2014 Technical Specifications Volume 2, page 93
Description: Percent of plan members whose doctor or clinical pharmacist has reviewed a list of everything they take (prescription and non-prescription drugs, vitamins, herbal remedies, other supplements) at least once a year. (This information about a yearly review of medications is collected for Medicare Special Needs Plans only. These plans are a type of Medicare Advantage Plan designed for certain types of people with Medicare. Some Special Needs Plans are for people with certain chronic diseases and conditions, some are for people who have both Medicare and Medicaid, and some are for people who live in an institution such as a nursing home.)
Metric: The percentage of Medicare Advantage Special Needs Plan enrollees 66 years and older (denominator) who received at least one medication review (Table COA-B) conducted by a prescribing practitioner or clinical pharmacist during the measurement year and the presence of a medication list in the medical record (numerator).
Exclusions: SNP benefit packages whose enrollment was less than 30 as of February 2013 SNP Comprehensive Report were excluded from this measure.
General Notes: The formula used to calculate this measure can be found in Attachment E.
Data Source: HEDIS
CMS Framework Area: Clinical care
NQF #: 0553
Data Time Frame: 01/01/2013 - 12/31/2013
General Trend: Higher is better
Statistical Method: Relative Distribution and Clustering
Improvement Measure: Included
Weighting Category: Process Measure
Weighting Value: 1

(Last Updated 10/03/2014) Page 23
Data Display: Percentage with no decimal point
Reporting Requirements: 1876 Cost Demo
Local, E-Local & Regional CCP w/o SNP
Local, E-Local & Regional CCP with SNP MSA
E-PDP & PDP
E-PFFS & PFFS
No Yes No Yes No No No
4-Star Threshold: Not predetermined
Cut Points: 1 Star 2 Star 3 Star 4 Star 5 Star
< 53% ≥ 53% to < 71% ≥ 71% to < 80% ≥ 80% to < 87% ≥ 87%
Measure: C11 - Care for Older Adults – Functional Status Assessment
Label for Stars: Yearly Assessment of How Well Plan Members Are Able to Do Activities of Daily Living
Label for Data: Yearly Assessment of How Well Plan Members Are Able to Do Activities of Daily Living
HEDIS Label: Care for Older Adults (COA) – Functional Status Assessment
Measure Reference: NCQA HEDIS 2014 Technical Specifications Volume 2, page 93
Description: Percent of plan members whose doctor has done a “functional status assessment” to see how well they are able to do “activities of daily living” (such as dressing, eating, and bathing). (This information about the yearly assessment is collected for Medicare Special Needs Plans only. These plans are a type of Medicare Advantage Plan designed for certain types of people with Medicare. Some Special Needs Plans are for people with certain chronic diseases and conditions, some are for people who have both Medicare and Medicaid, and some are for people who live in an institution such as a nursing home.)
Metric: The percentage of Medicare Advantage Special Needs Plan enrollees 66 years and older (denominator) who received at least one functional status assessment during the measurement year (numerator).
Exclusions: SNP benefit packages whose enrollment was less than 30 as of February 2013 SNP Comprehensive Report were excluded from this measure.
General Notes: The formula used to calculate this measure can be found in Attachment E.
Data Source: HEDIS
CMS Framework Area: Clinical care
NQF #: None
Data Time Frame: 01/01/2013 - 12/31/2013
General Trend: Higher is better
Statistical Method: Relative Distribution and Clustering
Improvement Measure: Included
Weighting Category: Process Measure
Weighting Value: 1
Data Display: Percentage with no decimal point
Reporting Requirements: 1876 Cost Demo
Local, E-Local & Regional CCP w/o SNP
Local, E-Local & Regional CCP with SNP MSA
E-PDP & PDP
E-PFFS & PFFS
No Yes No Yes No No No
4-Star Threshold: Not predetermined
Cut Points: 1 Star 2 Star 3 Star 4 Star 5 Star
< 49% ≥ 49% to < 59% ≥ 59% to < 73% ≥ 73% to < 83% ≥ 83%

(Last Updated 10/03/2014) Page 24
Measure: C12 - Care for Older Adults – Pain Assessment
Label for Stars: Yearly Pain Screening or Pain Management Plan
Label for Data: Yearly Pain Screening or Pain Management Plan
HEDIS Label: Care for Older Adults (COA) – Pain Screening
Measure Reference: NCQA HEDIS 2014 Technical Specifications Volume 2, page 93
Description: Percent of plan members who had a pain screening or pain management plan at least once during the year. (This information about pain screening or pain management is collected for Medicare Special Needs Plans only. These plans are a type of Medicare Advantage Plan designed for certain types of people with Medicare. Some Special Needs Plans are for people with certain chronic diseases and conditions, some are for people who have both Medicare and Medicaid, and some are for people who live in an institution such as a nursing home.)
Metric: The percentage of Medicare Advantage Special Needs Plan enrollees 66 years and older (denominator) who received at least one pain screening or pain management plan during the measurement year (numerator).
Exclusions: SNP benefit packages whose enrollment was less than 30 as of February 2013 SNP Comprehensive Report were excluded from this measure.
General Notes: The formula used to calculate this measure can be found in Attachment E.
Data Source: HEDIS
CMS Framework Area: Clinical care
NQF #: None
Data Time Frame: 01/01/2013 - 12/31/2013
General Trend: Higher is better
Statistical Method: Relative Distribution and Clustering
Improvement Measure: Included
Weighting Category: Process Measure
Weighting Value: 1
Data Display: Percentage with no decimal point
Reporting Requirements: 1876 Cost Demo
Local, E-Local & Regional CCP w/o SNP
Local, E-Local & Regional CCP with SNP MSA
E-PDP & PDP
E-PFFS & PFFS
No Yes No Yes No No No
4-Star Threshold: Not predetermined
Cut Points: 1 Star 2 Star 3 Star 4 Star 5 Star
< 50% ≥ 50% to < 60% ≥ 60% to < 78% ≥ 78% to < 88% ≥ 88%
Measure: C13 - Osteoporosis Management in Women who had a Fracture
Label for Stars: Osteoporosis Management
Label for Data: Osteoporosis Management
HEDIS Label: Osteoporosis Management in Women Who Had a Fracture (OMW)
Measure Reference: NCQA HEDIS 2014 Technical Specifications Volume 2, page 164
Description: Percent of female plan members who broke a bone and got screening or treatment for osteoporosis within 6 months.
Metric: The percentage of female MA enrollees 67 and older who suffered a fracture during the measurement year (denominator), and who subsequently had either a bone

(Last Updated 10/03/2014) Page 25
mineral density test or were prescribed a drug to treat or prevent osteoporosis in the six months after the fracture (numerator).
Exclusions: Contracts whose enrollment was less than 1,000 as of the July 2013 enrollment report were excluded from this measure.
Data Source: HEDIS
CMS Framework Area: Clinical care
NQF #: 0053
Data Time Frame: 01/01/2013 - 12/31/2013
General Trend: Higher is better
Statistical Method: Relative Distribution and Clustering
Improvement Measure: Included
Weighting Category: Process Measure
Weighting Value: 1
Data Display: Percentage with no decimal point
Reporting Requirements: 1876 Cost Demo
Local, E-Local & Regional CCP w/o SNP
Local, E-Local & Regional CCP with SNP MSA
E-PDP & PDP
E-PFFS & PFFS
Yes Yes Yes Yes Yes No Yes
4-Star Threshold: ≥ 60%
Cut Points: 1 Star 2 Star 3 Star 4 Star 5 Star
< 20% ≥ 20% to < 29% ≥ 29% to < 60% ≥ 60% to < 76% ≥ 76%
Measure: C14 - Diabetes Care – Eye Exam
Label for Stars: Eye Exam to Check for Damage from Diabetes
Label for Data: Eye Exam to Check for Damage from Diabetes
HEDIS Label: Comprehensive Diabetes Care (CDC) – Eye Exam (Retinal) Performed
Measure Reference: NCQA HEDIS 2014 Technical Specifications Volume 2, page 144
Description: Percent of plan members with diabetes who had an eye exam to check for damage from diabetes during the year.
Metric: The percentage of diabetic MA enrollees 18-75 with diabetes (type 1 and type 2) (denominator) who had an eye exam (retinal) performed during the measurement year (numerator).
Exclusions: Contracts whose enrollment was less than 1,000 as of the July 2013 enrollment report were excluded from this measure.
Data Source: HEDIS
CMS Framework Area: Clinical care
NQF #: 0055
Data Time Frame: 01/01/2013 - 12/31/2013
General Trend: Higher is better
Statistical Method: Relative Distribution and Clustering
Improvement Measure: Included
Weighting Category: Process Measure
Weighting Value: 1

(Last Updated 10/03/2014) Page 26
Data Display: Percentage with no decimal point
Reporting Requirements: 1876 Cost Demo
Local, E-Local & Regional CCP w/o SNP
Local, E-Local & Regional CCP with SNP MSA
E-PDP & PDP
E-PFFS & PFFS
Yes Yes Yes Yes Yes No Yes
4-Star Threshold: ≥ 64%
Cut Points: 1 Star 2 Star 3 Star 4 Star 5 Star
< 53% ≥ 53% to < 60% ≥ 60% to < 64% ≥ 64% to < 77% ≥ 77%
Measure: C15 - Diabetes Care – Kidney Disease Monitoring
Label for Stars: Kidney Function Testing for Members with Diabetes
Label for Data: Kidney Function Testing for Members with Diabetes
HEDIS Label: Comprehensive Diabetes Care (CDC) – Medical Attention for Nephropathy
Measure Reference: NCQA HEDIS 2014 Technical Specifications Volume 2, page 144
Description: Percent of plan members with diabetes who had a kidney function test during the year.
Metric: The percentage of diabetic MA enrollees 18-75 with diabetes (type 1 and type 2) (denominator) who had medical attention for nephropathy during the measurement year (numerator).
Exclusions: Contracts whose enrollment was less than 1,000 as of the July 2013 enrollment report were excluded from this measure.
Data Source: HEDIS
CMS Framework Area: Clinical care
NQF #: 0062
Data Time Frame: 01/01/2013 - 12/31/2013
General Trend: Higher is better
Statistical Method: Relative Distribution and Clustering
Improvement Measure: Included
Weighting Category: Process Measure
Weighting Value: 1
Data Display: Percentage with no decimal point
Reporting Requirements: 1876 Cost Demo
Local, E-Local & Regional CCP w/o SNP
Local, E-Local & Regional CCP with SNP MSA
E-PDP & PDP
E-PFFS & PFFS
Yes Yes Yes Yes Yes No Yes
4-Star Threshold: ≥ 85%
Cut Points: 1 Star 2 Star 3 Star 4 Star 5 Star
< 82% ≥ 82% to < 83% ≥ 83% to < 85% ≥ 85% to < 94% ≥ 94%
Measure: C16 - Diabetes Care – Blood Sugar Controlled
Label for Stars: Plan Members with Diabetes whose Blood Sugar is Under Control
Label for Data: Plan Members with Diabetes whose Blood Sugar is Under Control
HEDIS Label: Comprehensive Diabetes Care (CDC) – HbA1c poor control (>9.0%)
Measure Reference: NCQA HEDIS 2014 Technical Specifications Volume 2, page 144
Description: Percent of plan members with diabetes who had an A-1-C lab test during the year

(Last Updated 10/03/2014) Page 27
that showed their average blood sugar is under control.
Metric: The percentage of diabetic MA enrollees 18-75 (denominator) whose most recent HbA1c level is greater than 9%, or who were not tested during the measurement year (numerator). (This measure for public reporting is reverse scored so higher scores are better.) To calculate this measure, subtract the submitted rate from 100.
Exclusions: Contracts whose enrollment was less than 1,000 as of the July 2013 enrollment report were excluded from this measure.
Data Source: HEDIS
CMS Framework Area: Clinical care
NQF #: 0059
Data Time Frame: 01/01/2013 - 12/31/2013
General Trend: Higher is better
Statistical Method: Relative Distribution and Clustering
Improvement Measure: Included
Weighting Category: Intermediate Outcome Measure
Weighting Value: 3
Data Display: Percentage with no decimal point
Reporting Requirements: 1876 Cost Demo
Local, E-Local & Regional CCP w/o SNP
Local, E-Local & Regional CCP with SNP MSA
E-PDP & PDP
E-PFFS & PFFS
Yes Yes Yes Yes Yes No Yes
4-Star Threshold: ≥ 80%
Cut Points: 1 Star 2 Star 3 Star 4 Star 5 Star
< 61% ≥ 61% to < 70% ≥ 70% to < 80% ≥ 80% to < 86% ≥ 86%
Measure: C17 - Diabetes Care – Cholesterol Controlled
Label for Stars: Plan Members with Diabetes whose Cholesterol Is Under Control
Label for Data: Plan Members with Diabetes whose Cholesterol Is Under Control
HEDIS Label: Comprehensive Diabetes Care (CDC) – LDL-C control (<100 mg/dL)
Measure Reference: NCQA HEDIS 2014 Technical Specifications Volume 2, page 144
Description: Percent of plan members with diabetes who had a cholesterol test during the year that showed an acceptable level of “bad” (LDL) cholesterol.
Metric: The percentage of diabetic MA enrollees 18-75 (denominator) whose most recent LDL-C level during the measurement year was less than 100 (numerator).
Exclusions: Contracts whose enrollment was less than 1,000 as of the July 2013 enrollment report were excluded from this measure.
Data Source: HEDIS
CMS Framework Area: Clinical care
NQF #: 0064
Data Time Frame: 01/01/2013 - 12/31/2013
General Trend: Higher is better
Statistical Method: Relative Distribution and Clustering
Improvement Measure: Included
Weighting Category: Intermediate Outcome Measure

(Last Updated 10/03/2014) Page 28
Weighting Value: 3
Data Display: Percentage with no decimal point
Reporting Requirements: 1876 Cost Demo
Local, E-Local & Regional CCP w/o SNP
Local, E-Local & Regional CCP with SNP MSA
E-PDP & PDP
E-PFFS & PFFS
Yes Yes Yes Yes Yes No Yes
4-Star Threshold: ≥ 53%
Cut Points: 1 Star 2 Star 3 Star 4 Star 5 Star
< 41% ≥ 41% to < 49% ≥ 49% to < 53% ≥ 53% to < 62% ≥ 62%
Measure: C18 - Controlling Blood Pressure
Label for Stars: Controlling Blood Pressure
Label for Data: Controlling Blood Pressure
HEDIS Label: Controlling High Blood Pressure (CBP)
Measure Reference: NCQA HEDIS 2014 Technical Specifications Volume 2, page 134
Description: Percent of plan members with high blood pressure who got treatment and were able to maintain a healthy pressure.
Metric: The percentage of MA members 18–85 years of age who had a diagnosis of hypertension (HTN) (denominator) and whose BP was adequately controlled (<140/90) during the measurement year (numerator).
Exclusions: (optional) • Exclude from the eligible population all members with evidence of end-stage renal disease (ESRD) (refer to NCQA HEDIS 2013 Technical Specifications Volume 2, page 145, Table CBP-C) on or prior to December 31 of the measurement year. Documentation in the medical record must include a dated note indicating evidence of ESRD. Documentation of dialysis or renal transplant also meets the criteria for evidence of ESRD. • Exclude from the eligible population all members with a diagnosis of pregnancy (Table CBP-C) during the measurement year. • Exclude from the eligible population all members who had an admission to a nonacute inpatient setting during the measurement year. Refer to NCQA HEDIS 2013 Technical Specifications Volume 2, page 192 Table FUH-B for codes to identify nonacute care. Contracts whose enrollment was less than 1,000 as of the July 2013 enrollment report were excluded from this measure.
Data Source: HEDIS
CMS Framework Area: Clinical care
NQF #: 0018
Data Time Frame: 01/01/2013 - 12/31/2013
General Trend: Higher is better
Statistical Method: Relative Distribution and Clustering
Improvement Measure: Included
Weighting Category: Intermediate Outcome Measure
Weighting Value: 3

(Last Updated 10/03/2014) Page 29
Data Display: Percentage with no decimal point
Reporting Requirements: 1876 Cost Demo
Local, E-Local & Regional CCP w/o SNP
Local, E-Local & Regional CCP with SNP MSA
E-PDP & PDP
E-PFFS & PFFS
Yes Yes Yes Yes Yes No Yes
4-Star Threshold: ≥ 63%
Cut Points: 1 Star 2 Star 3 Star 4 Star 5 Star
< 42% ≥ 42% to < 53% ≥ 53% to < 63% ≥ 63% to < 75% ≥ 75%
Measure: C19 - Rheumatoid Arthritis Management
Label for Stars: Rheumatoid Arthritis Management
Label for Data: Rheumatoid Arthritis Management
HEDIS Label: Disease-Modifying Anti-Rheumatic Drug Therapy for Rheumatoid Arthritis (ART)
Measure Reference: NCQA HEDIS 2014 Technical Specifications Volume 2, page 162
Description: Percent of plan members with Rheumatoid Arthritis who got one or more prescription(s) for an anti-rheumatic drug.
Metric: The percentage of MA members who were diagnosed with rheumatoid arthritis during the measurement year (denominator), and who were dispensed at least one ambulatory prescription for a disease modifying anti-rheumatic drug (DMARD) (numerator).
Exclusions: (optional) • Members diagnosed with HIV (refer to NCQA HEDIS 2013 Technical Specifications Volume 2, page 167, Table ART-D). Look for evidence of HIV diagnosis as far back as possible in the member’s history through December 31 of the measurement year. • Members who have a diagnosis of pregnancy (Table ART-D) during the measurement year. Contracts whose enrollment was less than 1,000 as of the July 2013 enrollment report were excluded from this measure.
Data Source: HEDIS
CMS Framework Area: Clinical care
NQF #: 0054
Data Time Frame: 01/01/2013 - 12/31/2013
General Trend: Higher is better
Statistical Method: Relative Distribution and Clustering
Improvement Measure: Included
Weighting Category: Process Measure
Weighting Value: 1
Data Display: Percentage with no decimal point
Reporting Requirements: 1876 Cost Demo
Local, E-Local & Regional CCP w/o SNP
Local, E-Local & Regional CCP with SNP MSA
E-PDP & PDP
E-PFFS & PFFS
Yes Yes Yes Yes Yes No Yes
4-Star Threshold: ≥ 78%
Cut Points: 1 Star 2 Star 3 Star 4 Star 5 Star
< 60% ≥ 60% to < 71% ≥ 71% to < 78% ≥ 78% to < 88% ≥ 88%

(Last Updated 10/03/2014) Page 30
Measure: C20 - Improving Bladder Control
Label for Stars: Improving Bladder Control
Label for Data: Improving Bladder Control
HEDIS Label: Management of Urinary Incontinence in Older Adults (MUI)
Measure Reference: NCQA HEDIS 2013 Specifications for The Medicare Health Outcomes Survey Volume 6, page 31
Description: Percent of plan members with a urine leakage problem who discussed the problem with their doctor and got treatment for it within 6 months.
Metric: The percentage of Medicare members 65 years of age or older who reported having a urine leakage problem in the past six months (denominator) and who received treatment for their current urine leakage problem (numerator).
Exclusions: None listed.
Data Source: HEDIS / HOS
Data Source Description: Cohort 14 Follow-up Data collection (2013) and Cohort 16 Baseline data collection (2013). HOS Survey Question 44: Many people experience problems with urinary incontinence, the leakage of urine. In the past 6 months, have you accidentally leaked urine? HOS Survey Question 45: How much of a problem, if any, was the urine leakage for you? HOS Survey Question 46: Have you talked with your current doctor or other health provider about your urine leakage problem? HOS Survey Question 47: There are many ways to treat urinary incontinence including bladder training, exercises, medication and surgery. Have you received these or any other treatments for your current urine leakage problem?
CMS Framework Area: Clinical care
NQF #: 0030
Data Time Frame: 04/18/2013 - 07/31/2013
General Trend: Higher is better
Statistical Method: Relative Distribution and Clustering
Improvement Measure: Included
Weighting Category: Process Measure
Weighting Value: 1
Data Display: Percentage with no decimal point
Reporting Requirements: 1876 Cost Demo
Local, E-Local & Regional CCP w/o SNP
Local, E-Local & Regional CCP with SNP MSA
E-PDP & PDP
E-PFFS & PFFS
Yes Yes Yes Yes Yes No Yes
4-Star Threshold: ≥ 60%
Cut Points: 1 Star 2 Star 3 Star 4 Star 5 Star
< 33% ≥ 33% to < 40% ≥ 40% to < 60% ≥ 60% to < 71% ≥ 71%

(Last Updated 10/03/2014) Page 31
Measure: C21 - Reducing the Risk of Falling
Label for Stars: Reducing the Risk of Falling
Label for Data: Reducing the Risk of Falling
HEDIS Label: Fall Risk Management (FRM)
Measure Reference: NCQA HEDIS 2013 Specifications for The Medicare Health Outcomes Survey Volume 6, page 35
Description: Percent of plan members with a problem falling, walking or balancing who discussed it with their doctor and got treatment for it during the year.
Metric: The percentage of Medicare members 65 years of age or older who had a fall or had problems with balance or walking in the past 12 months (denominator), who were seen by a practitioner in the past 12 months and who received fall risk intervention from their current practitioner (numerator).
Exclusions: None listed.
Data Source: HEDIS / HOS
Data Source Description: Cohort 14 Follow-up Data collection (2013) and Cohort 16 Baseline data collection (2013). HOS Survey Question 50: A fall is when your body goes to the ground without being pushed. In the past 12 months, did your doctor or other health provider talk with you about falling or problems with balance or walking? HOS Survey Question 51: Did you fall in the past 12 months? HOS Survey Question 52: In the past 12 months have you had a problem with balance or walking? HOS Survey Question 53: Has your doctor or other health provider done anything to help prevent falls or treat problems with balance or walking? Some things they might do include: • Suggest that you use a cane or walker • Check your blood pressure lying or standing • Suggest that you do an exercise or physical therapy program • Suggest a vision or hearing testing
CMS Framework Area: Clinical care
NQF #: 0035
Data Time Frame: 04/18/2013 - 07/31/2013
General Trend: Higher is better
Statistical Method: Relative Distribution and Clustering
Improvement Measure: Included
Weighting Category: Process Measure
Weighting Value: 1
Data Display: Percentage with no decimal point
Reporting Requirements: 1876 Cost Demo
Local, E-Local & Regional CCP w/o SNP
Local, E-Local & Regional CCP with SNP MSA
E-PDP & PDP
E-PFFS & PFFS
Yes Yes Yes Yes Yes No Yes
4-Star Threshold: ≥ 59%

(Last Updated 10/03/2014) Page 32
Cut Points: 1 Star 2 Star 3 Star 4 Star 5 Star
< 50% ≥ 50% to < 55% ≥ 55% to < 59% ≥ 59% to < 73% ≥ 73%
Measure: C22 - Plan All-Cause Readmissions
Label for Stars: Readmission to a Hospital within 30 Days of Being Discharged (more stars are better because it means fewer members are being readmitted)
Label for Data: Readmission to a Hospital within 30 Days of Being Discharged (lower percentages are better because it means fewer members are being readmitted)
HEDIS Label: Plan All-Cause Readmissions (PCR)
Measure Reference: NCQA HEDIS 2014 Technical Specifications Volume 2, page 314
Description: Percent of senior plan members discharged from a hospital stay who were readmitted to a hospital within 30 days, either for the same condition as their recent hospital stay or for a different reason. (Patients may have been readmitted back to the same hospital or to a different one. Rates of readmission take into account how sick patients were when they went into the hospital the first time. This “risk-adjustment” helps make the comparisons between plans fair and meaningful.)
Metric: The percentage of acute inpatient stays during the measurement year that were followed by an acute readmission for any diagnosis within 30 days, for members 65 years of age and older using the following formula to control for differences in the case mix of patients across different contracts. For contract A, their case-mix adjusted readmission rate relative to the national average is the observed readmission rate for contract A divided by the expected readmission rate for contract A. This ratio is then multiplied by the national average observed rate. To calculate the observed rate and expected rate for contract A for members 65 years and older, the following formulas were used: 1. The observed readmission rate for contract A equals the sum of the count of 30-day readmissions across the three age bands (65-74, 75-84 and 85+) divided by the sum of the count of index stays across the three age bands (65-74, 75-84 and 85+). 2. The expected readmission rate for contract A equals the sum of the average adjusted probabilities across the three age bands (65-74, 75-84 and 85+), weighted by the percentage of index stays in each age band. See Attachment F: Calculating Measure C22: Plan All-Cause Readmissions for the complete formula, example calculation and National Average Observation value used to complete this measure.
Exclusions: None listed in the HEDIS Technical Specifications. CMS has excluded contracts whose denominator was 10 or less. Complaint rates are not calculated for contracts with less than 800 average enrollment during the measurement period.
General Notes: In the 2013 & 2014 Plan Ratings, five 1876 Cost contracts voluntarily reported data in this measure even though they were not required to do so. CMS has rated these five contracts based on their submitted data. We did not use the cost contracts data when calculating the NatAvgObs or when determining the cut points for this measure. This measure is not used in the final Part C summary or overall ratings for 1876 Cost contracts. The data for 1876 Cost contracts will be handled the same way in this measure for the 2015 Star Ratings.
Data Source: HEDIS

(Last Updated 10/03/2014) Page 33
CMS Framework Area: Care coordination
NQF #: 1768
Data Time Frame: 01/01/2013 - 12/31/2013
General Trend: Lower is better
Statistical Method: Relative Distribution and Clustering
Improvement Measure: Included
Weighting Category: Outcome Measure
Weighting Value: 3
Data Display: Percentage with no decimal point
Reporting Requirements: 1876 Cost Demo
Local, E-Local & Regional CCP w/o SNP
Local, E-Local & Regional CCP with SNP MSA
E-PDP & PDP
E-PFFS & PFFS
No Yes Yes Yes Yes No Yes
4-Star Threshold: Not predetermined
Cut Points: 1 Star 2 Star 3 Star 4 Star 5 Star
> 13% > 11% to ≤ 13% > 9% to ≤ 11% > 2% to ≤ 9% ≤ 2%

(Last Updated 10/03/2014) Page 34
Domain: 3 - Member Experience with Health Plan
Measure: C23 - Getting Needed Care
Label for Stars: Ease of Getting Needed Care and Seeing Specialists
Label for Data: Ease of Getting Needed Care and Seeing Specialists
Description: Percent of the best possible score the plan earned on how easy it is for members to get needed care, including care from specialists.
Metric: This case-mix adjusted composite measure is used to assess how easy it was for a member to get needed care and see specialists. The Consumer Assessment of Healthcare Providers and Systems (CAHPS) score uses the mean of the distribution of responses converted to a scale from 0 to 100. The score shown is the percentage of the best possible score each contract earned.
General Notes: CAHPS Survey results were sent to each contract's Medicare Compliance Officer in early August 2014. These reports provide further explanation of the CAHPS scoring methodology and provide detailed information on why a specific rating was assigned.
Data Source: CAHPS
Data Source Description: CAHPS Survey Questions (question numbers vary depending on survey type): • In the last 6 months, how often was it easy to get appointments with specialists? • In the last 6 months, how often was it easy to get the care, tests, or treatment you needed through your health plan?
CMS Framework Area: Person- and caregiver- centered experience and outcomes
NQF #: 0006
Data Time Frame: 02/15/2014 - 05/31/2014
General Trend: Higher is better
Statistical Method: Relative Distribution and Significance Testing
Improvement Measure: Included
Weighting Category: Patients’ Experience and Complaints Measure
Weighting Value: 1.5
Data Display: Percentage with no decimal point
Reporting Requirements: 1876 Cost Demo
Local, E-Local & Regional CCP w/o SNP
Local, E-Local & Regional CCP with SNP MSA
E-PDP & PDP
E-PFFS & PFFS
Yes Yes Yes Yes Yes No Yes
4-Star Threshold: ≥ 85%
Cut Points: 1 Star 2 Star 3 Star 4 Star 5 Star
< 80% ≥ 80% to < 83% ≥ 83% to < 85% ≥ 85% to < 87% ≥ 87%
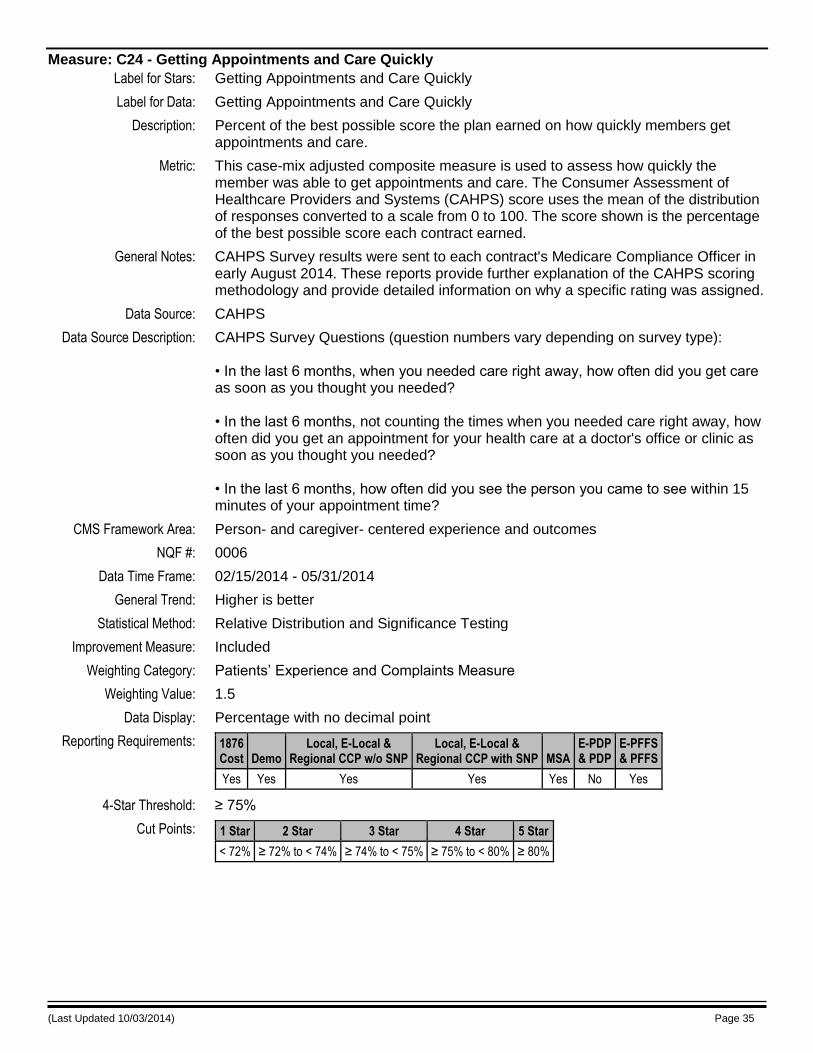
(Last Updated 10/03/2014) Page 35
Measure: C24 - Getting Appointments and Care Quickly
Label for Stars: Getting Appointments and Care Quickly
Label for Data: Getting Appointments and Care Quickly
Description: Percent of the best possible score the plan earned on how quickly members get appointments and care.
Metric: This case-mix adjusted composite measure is used to assess how quickly the member was able to get appointments and care. The Consumer Assessment of Healthcare Providers and Systems (CAHPS) score uses the mean of the distribution of responses converted to a scale from 0 to 100. The score shown is the percentage of the best possible score each contract earned.
General Notes: CAHPS Survey results were sent to each contract's Medicare Compliance Officer in early August 2014. These reports provide further explanation of the CAHPS scoring methodology and provide detailed information on why a specific rating was assigned.
Data Source: CAHPS
Data Source Description: CAHPS Survey Questions (question numbers vary depending on survey type): • In the last 6 months, when you needed care right away, how often did you get care as soon as you thought you needed? • In the last 6 months, not counting the times when you needed care right away, how often did you get an appointment for your health care at a doctor's office or clinic as soon as you thought you needed? • In the last 6 months, how often did you see the person you came to see within 15 minutes of your appointment time?
CMS Framework Area: Person- and caregiver- centered experience and outcomes
NQF #: 0006
Data Time Frame: 02/15/2014 - 05/31/2014
General Trend: Higher is better
Statistical Method: Relative Distribution and Significance Testing
Improvement Measure: Included
Weighting Category: Patients’ Experience and Complaints Measure
Weighting Value: 1.5
Data Display: Percentage with no decimal point
Reporting Requirements: 1876 Cost Demo
Local, E-Local & Regional CCP w/o SNP
Local, E-Local & Regional CCP with SNP MSA
E-PDP & PDP
E-PFFS & PFFS
Yes Yes Yes Yes Yes No Yes
4-Star Threshold: ≥ 75%
Cut Points: 1 Star 2 Star 3 Star 4 Star 5 Star
< 72% ≥ 72% to < 74% ≥ 74% to < 75% ≥ 75% to < 80% ≥ 80%

(Last Updated 10/03/2014) Page 36
Measure: C25 - Customer Service
Label for Stars: Health Plan Provides Information or Help When Members Need It
Label for Data: Health Plan Provides Information or Help When Members Need It
Description: Percent of the best possible score the plan earned on how easy it is for members to get information and help from the plan when needed.
Metric: This case-mix adjusted composite measure is used to assess how easy it was for the member to get information and help when needed. The Consumer Assessment of Healthcare Providers and Systems (CAHPS) score uses the mean of the distribution of responses converted to a scale from 0 to 100. The score shown is the percentage of the best possible score each contract earned.
General Notes: CAHPS Survey results were sent to each contract's Medicare Compliance Officer in early August 2014. These reports provide further explanation of the CAHPS scoring methodology and provide detailed information on why a specific rating was assigned.
Data Source: CAHPS
Data Source Description: CAHPS Survey Questions (question numbers vary depending on survey type): • In the last 6 months, how often did your health plan’s customer service give you the information or help you needed? • In the last 6 months, how often did your health plan’s customer service treat you with courtesy and respect? • In the last 6 months, how often were the forms for your health plan easy to fill out?
CMS Framework Area: Person- and caregiver- centered experience and outcomes
NQF #: 0006
Data Time Frame: 02/15/2014 - 05/31/2014
General Trend: Higher is better
Statistical Method: Relative Distribution and Significance Testing
Improvement Measure: Included
Weighting Category: Patients’ Experience and Complaints Measure
Weighting Value: 1.5
Data Display: Percentage with no decimal point
Reporting Requirements: 1876 Cost Demo
Local, E-Local & Regional CCP w/o SNP
Local, E-Local & Regional CCP with SNP MSA
E-PDP & PDP
E-PFFS & PFFS
Yes Yes Yes Yes Yes No Yes
4-Star Threshold: ≥ 88%
Cut Points: 1 Star 2 Star 3 Star 4 Star 5 Star
< 84% ≥ 84% to < 86% ≥ 86% to < 88% ≥ 88% to < 91% ≥ 91%

(Last Updated 10/03/2014) Page 37
Measure: C26 - Rating of Health Care Quality
Label for Stars: Member's Rating of Health Care Quality
Label for Data: Member's Rating of Health Care Quality
Description: Percent of the best possible score the plan earned from members who rated the quality of the health care they received.
Metric: This case-mix adjusted measure is used to assess the members' view of the quality of care received from the health plan. The Consumer Assessment of Healthcare Providers and Systems (CAHPS) score uses the mean of the distribution of responses converted to a scale from 0 to 100. The score shown is the percentage of the best possible score each contract earned.
General Notes: CAHPS Survey results were sent to each contract's Medicare Compliance Officer in early August 2014. These reports provide further explanation of the CAHPS scoring methodology and provide detailed information on why a specific rating was assigned.
Data Source: CAHPS
Data Source Description: CAHPS Survey Question (question numbers vary depending on survey type): • Using any number from 0 to 10, where 0 is the worst health care possible and 10 is the best health care possible, what number would you use to rate all your health care in the last 6 months?
CMS Framework Area: Person- and caregiver- centered experience and outcomes
NQF #: 0006
Data Time Frame: 02/15/2014 - 05/31/2014
General Trend: Higher is better
Statistical Method: Relative Distribution and Significance Testing
Improvement Measure: Included
Weighting Category: Patients’ Experience and Complaints Measure
Weighting Value: 1.5
Data Display: Percentage with no decimal point
Reporting Requirements: 1876 Cost Demo
Local, E-Local & Regional CCP w/o SNP
Local, E-Local & Regional CCP with SNP MSA
E-PDP & PDP
E-PFFS & PFFS
Yes Yes Yes Yes Yes No Yes
4-Star Threshold: ≥ 85%
Cut Points: 1 Star 2 Star 3 Star 4 Star 5 Star
< 84% ≥ 84% to < 85% * ≥ 85% to < 88% ≥ 88%
* Due to rounding and the placement of the predetermined 4-star cutoff, no contracts were assigned 3 base stars; all contracts meeting the cutoff for 3 base stars also met the cutoff for 4 base stars. However after application of the further criteria of significance and reliability, some plans with fewer than 3 base stars may have been assigned 3 final stars.

(Last Updated 10/03/2014) Page 38
Measure: C27 - Rating of Health Plan
Label for Stars: Member's Rating of Health Plan
Label for Data: Member's Rating of Health Plan
Description: Percent of the best possible score the plan earned from members who rated the health plan.
Metric: This case-mix adjusted measure is used to assess the overall view members have of their health plan. The Consumer Assessment of Healthcare Providers and Systems (CAHPS) score uses the mean of the distribution of responses converted to a scale from 0 to 100. The score shown is the percentage of the best possible score each contract earned.
General Notes: CAHPS Survey results were sent to each contract's Medicare Compliance Officer in early August 2014. These reports provide further explanation of the CAHPS scoring methodology and provide detailed information on why a specific rating was assigned.
Data Source: CAHPS
Data Source Description: CAHPS Survey Question (question numbers vary depending on survey type): • Using any number from 0 to 10, where 0 is the worst health plan possible and 10 is the best health plan possible, what number would you use to rate your health plan?
CMS Framework Area: Person- and caregiver- centered experience and outcomes
NQF #: 0006
Data Time Frame: 02/15/2014 - 05/31/2014
General Trend: Higher is better
Statistical Method: Relative Distribution and Significance Testing
Improvement Measure: Included
Weighting Category: Patients’ Experience and Complaints Measure
Weighting Value: 1.5
Data Display: Percentage with no decimal point
Reporting Requirements: 1876 Cost Demo
Local, E-Local & Regional CCP w/o SNP
Local, E-Local & Regional CCP with SNP MSA
E-PDP & PDP
E-PFFS & PFFS
Yes Yes Yes Yes Yes No Yes
4-Star Threshold: ≥ 85%
Cut Points: 1 Star 2 Star 3 Star 4 Star 5 Star
< 82% ≥ 82% to < 84% ≥ 84% to < 85% ≥ 85% to < 88% ≥ 88%

(Last Updated 10/03/2014) Page 39
Measure: C28 - Care Coordination
Label for Stars: Coordination of Members' Health Care Services
Label for Data: Coordination of Members' Health Care Services
Description: Percent of the best possible score the plan earned on how well the plan coordinates members’ care. (This includes whether doctors had the records and information they need about members’ care and how quickly members got their test results.)
Metric: This case-mix adjusted composite measure is used to assess Care Coordination. The Consumer Assessment of Healthcare Providers and Systems (CAHPS) score uses the mean of the distribution of responses converted to a scale of 0 to 100. The score shown is the percentage of the best possible score each contract earned.
General Notes: CAHPS Survey results were sent to each contract's Medicare Compliance Officer in early August 2014. These reports provide further explanation of the CAHPS scoring methodology and provide detailed information on why a specific rating was assigned.
Data Source: CAHPS
Data Source Description: CAHPS Survey Questions (question numbers vary depending on survey type): • Whether doctor had medical records and other information about the enrollee’s care, • Whether there was follow up with the patient to provide test results, • How quickly the enrollee got the test results, • Whether the doctor spoke to the enrollee about prescription medicines, • Whether the enrollee received help managing care, and • Whether the personal doctor is informed and up-to-date about specialist care.
CMS Framework Area: Care coordination
NQF #: None
Data Time Frame: 02/15/2014 - 05/31/2014
General Trend: Higher is better
Statistical Method: Relative Distribution and Significance Testing
Improvement Measure: Included
Weighting Category: Patients’ Experience and Complaints Measure
Weighting Value: 1.5
Data Display: Percentage with no decimal point
Reporting Requirements: 1876 Cost Demo
Local, E-Local & Regional CCP w/o SNP
Local, E-Local & Regional CCP with SNP MSA
E-PDP & PDP
E-PFFS & PFFS
Yes Yes Yes Yes Yes No Yes
4-Star Threshold: Not predetermined
Cut Points: 1 Star 2 Star 3 Star 4 Star 5 Star
< 83% ≥ 83% to < 84% ≥ 84% to < 86% ≥ 86% to < 87% ≥ 87%

(Last Updated 10/03/2014) Page 40
Domain: 4 - Member Complaints and Changes in the Health Plan's Performance
Measure: C29 - Complaints about the Health Plan
Label for Stars: Complaints about the Health Plan (more stars are better because it means fewer complaints)
Label for Data: Complaints about the Health Plan (number of complaints for every 1,000 members) (lower numbers are better because it means fewer complaints)
Description: How many complaints Medicare received about the health plan.
Metric: Rate of complaints about the health plan per 1,000 members. For each contract, this rate is calculated as: [(Total number of all complaints logged into the Complaint Tracking Module (CTM)) / (Average Contract enrollment)] * 1,000 * 30 / (Number of Days in Period). • Complaints data are pulled after the end of the measurement timeframe to serve as a snapshot of CTM data. • Enrollment numbers used to calculate the complaint rate were based on the average enrollment for the time period measured for each contract. • A contract’s failure to follow CMS’ CTM Standard Operating Procedures will not result in CMS’ adjustment of the data used for these measures.
Exclusions: Some complaints that cannot be clearly attributed to the plan are excluded, please see Attachment B: Complaints Tracking Module Exclusion List. Complaint rates are not calculated for contracts with an average enrollment during the measurement period of less than 800 beneficiaries.
Data Source: CTM
Data Source Description: Data were obtained from the CTM based on the contract entry date (the date that complaints are assigned or re-assigned to contracts; also known as the contract assignment/reassignment date) for the reporting period specified. The status of any specific complaint at the time the data are pulled stands for use in the reports. Any changes to the complaints data subsequent to the data pull cannot be excluded retroactively. Complaint rates per 1,000 enrollees are adjusted to a 30-day basis.
CMS Framework Area: Person- and caregiver- centered experience and outcomes
NQF #: None
Data Time Frame: 01/01/2014 - 06/30/2014
General Trend: Lower is better
Statistical Method: Relative Distribution and Clustering
Improvement Measure: Included
Weighting Category: Patients’ Experience and Complaints Measure
Weighting Value: 1.5
Data Display: Rate with 2 decimal points
Reporting Requirements: 1876 Cost Demo
Local, E-Local & Regional CCP w/o SNP
Local, E-Local & Regional CCP with SNP MSA
E-PDP & PDP
E-PFFS & PFFS
Yes Yes Yes Yes Yes No Yes
4-Star Threshold: Not predetermined
Cut Points: 1 Star 2 Star 3 Star 4 Star 5 Star
> 1.80 > 0.86 to ≤ 1.80 > 0.32 to ≤ 0.86 > 0.17 to ≤ 0.32 ≤ 0.17

(Last Updated 10/03/2014) Page 41
Measure: C30 - Members Choosing to Leave the Plan
Label for Stars: Members Choosing to Leave the Plan (more stars are better because it means fewer members are choosing to leave the plan)
Label for Data: Members Choosing to Leave the Plan (lower percentages are better because it means fewer members choose to leave the plan)
Description: The percent of plan members who chose to leave the plan in 2013. (This does not include members who did not choose to leave the plan, such as members who moved out of the service area.)
Metric: The percent of members who chose to leave the plan come from disenrollment reason codes in Medicare’s enrollment system. The percent is calculated as the number of members who chose to leave the plan between January 1, 2013–December 31, 2013 (numerator) divided by all members enrolled in the plan at any time during 2013 (denominator).
Exclusions: Members who involuntarily left their plan due to circumstances beyond their control are removed from the final numerator, specifically: • Members who moved out of the service area • Members affected by a contract service area reduction • Members affected by PBP termination • Members affected by LIS reassignments • Members who are enrolled in employer group plans • Members in PBPs that were granted special enrollment exceptions • Members who were passively enrolled into a Demonstration (Medicare-Medicaid Plan) • SNPs disproportionate share members who do not meet the SNP criteria Contracts with less than 1,000 enrollees
General Notes: This measure includes members who disenrolled from the contract with the following disenrollment reason codes: 11 - Voluntary Disenrollment through plan, 13 - Disenrollment because of enrollment in another Plan, 14 - Retroactive or 99 - Other (not supplied by beneficiary).
Data Source: Medicare Beneficiary Database Suite of Systems
CMS Framework Area: Person- and caregiver- centered experience and outcomes
NQF #: None
Data Time Frame: 01/01/2013 - 12/31/2013
General Trend: Lower is better
Statistical Method: Relative Distribution and Clustering
Improvement Measure: Included
Weighting Category: Patients’ Experience and Complaints Measure
Weighting Value: 1.5
Data Display: Percentage with no decimal point
Reporting Requirements: 1876 Cost Demo
Local, E-Local & Regional CCP w/o SNP
Local, E-Local & Regional CCP with SNP MSA
E-PDP & PDP
E-PFFS & PFFS
Yes Yes Yes Yes Yes No Yes
4-Star Threshold: Not predetermined
Cut Points: 1 Star 2 Star 3 Star 4 Star 5 Star
> 46% > 29% to ≤ 46% > 16% to ≤ 29% > 9% to ≤ 16% ≤ 9%

(Last Updated 10/03/2014) Page 42
Measure: C31 - Health Plan Quality Improvement
Label for Stars: Improvement (if any) in the Health Plan’s Performance
Label for Data: Improvement (if any) in the Health Plan’s Performance
Description: This shows how much the health plan’s performance has improved or declined from one year to the next year. To calculate the plan’s improvement rating, Medicare compares the plan’s previous scores to its current scores for all of the topics shown on this website. Then Medicare averages the results to give the plan its improvement rating. If a plan receives 1 or 2 stars, it means, on average, the plan’s scores have declined (gotten worse). If a plan receives 3 stars, it means, on average, the plan’s scores have stayed about the same. If a plan receives 4 or 5 stars, it means, on average, the plan’s scores have improved. Keep in mind that a plan that is already doing well in most areas may not show much improvement. It is also possible that a plan can start with low ratings, show a lot of improvement, and still not be performing very well.
Metric: The numerator is the net improvement, which is a sum of the number of significantly improved measures minus the number of significantly declined measures. The denominator is the number of measures eligible for the improvement measure (i.e., the measures that were included in the 2014 and 2015 Star Ratings for this contract and had no specification changes).
Exclusions: Contracts must have data in at least half of the measures used to calculate improvement to be rated in this measure.
General Notes: Attachment I contains the formulas used to calculate the improvement measure and lists indicating which measures were used.
Data Source: Star Ratings
Data Source Description: 2014 and 2015 Star Ratings
CMS Framework Area: Population / community health
NQF #: None
Data Time Frame: Not Applicable
General Trend: Higher is better
Statistical Method: Relative Distribution and Clustering
Improvement Measure: Not Included
Weighting Category: Improvement Measure
Weighting Value: 5
Data Display: Not Applicable
Reporting Requirements: 1876 Cost Demo
Local, E-Local & Regional CCP w/o SNP
Local, E-Local & Regional CCP with SNP MSA
E-PDP & PDP
E-PFFS & PFFS
Yes Yes Yes Yes Yes No Yes
4-Star Threshold: Not predetermined
Cut Points: 1 Star 2 Star 3 Star 4 Star 5 Star
< -0.176 ≥ -0.176 to < 0.000 ≥ 0.000 to < 0.164 ≥ 0.164 to < 0.408 ≥ 0.408

(Last Updated 10/03/2014) Page 43
Domain: 5 - Health Plan Customer Service
Measure: C32 - Plan Makes Timely Decisions about Appeals
Label for Stars: Health Plan Makes Timely Decisions about Appeals
Label for Data: Health Plan Makes Timely Decisions about Appeals
Description: Percent of plan members who got a timely response when they made an appeal request to the health plan about a decision to refuse payment or coverage.
Metric: Percent of appeals timely processed by the plan (numerator) out of all the plan‘s appeals decided by the Independent Review Entity (IRE) (includes upheld, overturned, partially overturned and dismissed appeals) (denominator). This is calculated as: ([Number of Timely Appeals] / ([Appeals Upheld] + [Appeals Overturned] + [Appeals Partially Overturned] + [Appeals Dismissed]) * 100. If the denominator is ≤ 10, the result is ―”Not enough data available”.
Exclusions: Withdrawn appeals are excluded from this measure.
General Notes: This measure includes all Standard Coverage, Standard Claim, and Expedited appeals (including Dismissals) received by the IRE, regardless of the appellant. This includes appeals requested by a beneficiary, appeals requested by a party on behalf of a beneficiary, and appeals requested by non-contract providers.
Data Source: IRE
Data Source Description: Data were obtained from the IRE contracted by CMS for Part C appeals. The appeals used in this measure are based on the date appeals (including dismissals) were received by the IRE, not the date a decision was reached by the IRE.
CMS Framework Area: Population / community health
NQF #: None
Data Time Frame: 01/01/2013 - 12/31/2013
General Trend: Higher is better
Statistical Method: Relative Distribution and Clustering
Improvement Measure: Included
Weighting Category: Measures Capturing Access
Weighting Value: 1.5
Data Display: Percentage with no decimal point
Reporting Requirements: 1876 Cost Demo
Local, E-Local & Regional CCP w/o SNP
Local, E-Local & Regional CCP with SNP MSA
E-PDP & PDP
E-PFFS & PFFS
Yes Yes Yes Yes Yes No Yes
4-Star Threshold: ≥ 85%
Cut Points: 1 Star 2 Star 3 Star 4 Star 5 Star
< 47% ≥ 47% to < 66% ≥ 66% to < 85% ≥ 85% to < 95% ≥ 95%

(Last Updated 10/03/2014) Page 44
Measure: C33 - Reviewing Appeals Decisions
Label for Stars: Fairness of the Health Plan’s Appeal Decisions, Based on an Independent Reviewer
Label for Data: Fairness of the Health Plan’s Appeal Decisions, Based on an Independent Reviewer
Description: This measure/rating shows how often an Independent Reviewer thought the health plan’s decision to deny an appeal was fair. This includes appeals made by plan members and out-of-network providers. (This rating is not based on how often the plan denies appeals, but rather how fair the plan is when they do deny an appeal.)
Metric: Percent of appeals where a plan‘s decision was “upheld” by the Independent Review Entity (IRE) (numerator) out of all the plan‘s appeals (upheld, overturned, and partially overturned appeals only) that the IRE reviewed (denominator). This is calculated as: ([Appeals Upheld] / ([Appeals Upheld] + [Appeals Overturned] + [Appeals Partially Overturned]))* 100. If the minimum number of appeals (upheld + overturned + partially overturned) is ≤ 10, the result is “Not enough data available”.
Exclusions: Dismissed and Withdrawn appeals are excluded from this measure.
General Notes: This measure includes all Standard Coverage, Standard Claim, and Expedited appeals received by the IRE, regardless of the appellant. This includes appeals requested by a beneficiary, appeals requested by a party on behalf of a beneficiary, and appeals requested by non-contract providers.
Data Source: IRE
Data Source Description: Data were obtained from the IRE contracted by CMS for Part C appeals. The appeals used in this measure are based on the date in the calendar year they were received by the IRE not the date a decision was reached. If a Reopening occurs and is decided prior to April 1, 2014, the Reopened decision is used in place of the Reconsideration decision. Reopenings decided on or after April 1, 2014 will not be reflected in this data. Appeals that occur beyond Level 2 (i.e., Administrative Law Judge or Medicare Appeals Council appeals) are not included in the data.
CMS Framework Area: Population / community health
NQF #: None
Data Time Frame: 01/01/2013 - 12/31/2013
General Trend: Higher is better
Statistical Method: Relative Distribution and Clustering
Improvement Measure: Included
Weighting Category: Measures Capturing Access
Weighting Value: 1.5
Data Display: Percentage with no decimal point
Reporting Requirements: 1876 Cost Demo
Local, E-Local & Regional CCP w/o SNP
Local, E-Local & Regional CCP with SNP MSA
E-PDP & PDP
E-PFFS & PFFS
Yes Yes Yes Yes Yes No Yes
4-Star Threshold: ≥ 87%
Cut Points: 1 Star 2 Star 3 Star 4 Star 5 Star
< 67% ≥ 67% to < 77% ≥ 77% to < 87% ≥ 87% to < 95% ≥ 95%

(Last Updated 10/03/2014) Page 45
Part D Domain and Measure Details
See Attachment C for the national averages of individual Part D measures.
Domain: 1 - Drug Plan Customer Service
Measure: D01 - Appeals Auto–Forward
Label for Stars: Drug Plan Makes Timely Decisions about Appeals
Label for Data: Drug Plan Makes Timely Decisions about Appeals (for every 10,000 members)
Description: Percent of plan members who got a timely response when they made an appeal request to the drug plan about a decision to refuse payment or coverage.
Metric: This measure is defined as the rate of cases auto-forwarded to the Independent Review Entity (IRE) because decision timeframes for coverage determinations or redeterminations were exceeded by the plan. This is calculated as: [(Total number of cases auto-forwarded to the IRE) / (Average Medicare Part D enrollment)] * 10,000. There is no minimum number of cases required to receive a rating.
Exclusions: Rates are not calculated for contracts with less than 800 average enrollment during the measurement period.
Data Source: IRE
Data Source Description: Data were obtained from the IRE contracted by CMS.
CMS Framework Area: Population / community health
NQF #: None
Data Time Frame: 01/01/2013 - 12/31/2013
General Trend: Lower is better
Statistical Method: Relative Distribution and Clustering
Improvement Measure: Included
Weighting Category: Measures Capturing Access
Weighting Value: 1.5
Data Display: Rate with 1 decimal point
Reporting Requirements: 1876 Cost Demo
Local, E-Local & Regional CCP w/o SNP
Local, E-Local & Regional CCP with SNP MSA
E-PDP & PDP
E-PFFS & PFFS
Yes Yes Yes Yes No Yes Yes
4-Star Threshold: MA-PD: ≤ 1.3, PDP: ≤ 1.0
Cut Points: Type 1 Star 2 Star 3 Star 4 Star 5 Star
MA-PD > 36.7 > 8.3 to ≤ 36.7 > 1.3 to ≤ 8.3 > 0.7 to ≤ 1.3 ≤ 0.7
PDP > 38.2 > 11.5 to ≤ 38.2 > 1.0 to ≤ 11.5 > 0.1 to ≤ 1.0 ≤ 0.1

(Last Updated 10/03/2014) Page 46
Measure: D02 - Appeals Upheld
Label for Stars: Fairness of Drug Plan’s Appeal Decisions, Based on an Independent Reviewer
Label for Data: Fairness of Drug Plan’s Appeal Decisions, Based on an Independent Reviewer
Description: This measure/rating shows how often an Independent Reviewer thought the drug plan’s decision to deny an appeal was fair. This includes appeals made by plan members and out-of-network providers. (This rating is not based on how often the plan denies appeals, but rather how fair the plan is when they do deny an appeal.)
Metric: This measure is defined as the percent of IRE confirmations of upholding the plans’ decisions. This is calculated as: [(Number of cases upheld) / (Total number of cases reviewed)] * 100. Total number of cases reviewed is defined all cases received by the IRE during the timeframe and receiving a decision within 20 days after the last day of the timeframe. The denominator is equal to the number of cases upheld, fully reversed, and partially reversed. Dismissed, remanded and withdrawn cases are not included in the denominator. Auto-forward cases are included, as these are considered to be adverse decisions per Subpart M rules. Contracts with no IRE cases reviewed will not receive a score in this measure.
Exclusions: Contracts with fewer than 5 cases reviewed by the IRE.
Data Source: IRE
Data Source Description: Data were obtained from the IRE contracted by CMS for Part D reconsiderations. The appeals used in this measure are based on the date they were received by the IRE.
CMS Framework Area: Population / community health
NQF #: None
Data Time Frame: 01/01/2014 - 06/30/2014
General Trend: Higher is better
Statistical Method: Relative Distribution and Clustering
Improvement Measure: Included
Weighting Category: Measures Capturing Access
Weighting Value: 1.5
Data Display: Percentage with no decimal point
Reporting Requirements: 1876 Cost Demo
Local, E-Local & Regional CCP w/o SNP
Local, E-Local & Regional CCP with SNP MSA
E-PDP & PDP
E-PFFS & PFFS
Yes Yes Yes Yes No Yes Yes
4-Star Threshold: MA-PD: ≥ 72%, PDP: ≥ 68%
Cut Points: Type 1 Star 2 Star 3 Star 4 Star 5 Star
MA-PD < 50% ≥ 50% to < 60% ≥ 60% to < 72% ≥ 72% to < 84% ≥ 84%
PDP < 48% ≥ 48% to < 58% ≥ 58% to < 68% ≥ 68% to < 78% ≥ 78%

(Last Updated 10/03/2014) Page 47
Domain: 2 - Member Complaints and Changes in the Drug Plan’s Performance
Measure: D03 - Complaints about the Drug Plan
Label for Stars: Complaints about the Drug Plan (more stars are better because it means fewer complaints)
Label for Data: Complaints about the Drug Plan (for every 1,000 members) (lower numbers are better because it means fewer complaints)
Description: How many complaints Medicare received about the drug plan.
Metric: Rate of complaints about the health plan per 1,000 members. For each contract, this rate is calculated as: [(Total number of all complaints logged into the Complaint Tracking Module (CTM)) / (Average Contract enrollment)] * 1,000 * 30 / (Number of Days in Period). • Complaints data are pulled after the end of the measurement timeframe to serve as a snapshot of CTM data. • Enrollment numbers used to calculate the complaint rate were based on the average enrollment for the time period measured for each contract. • A contract’s failure to follow CMS’ CTM Standard Operating Procedures will not result in CMS’ adjustment of the data used for these measures.
Exclusions: Some complaints that cannot be clearly attributed to the plan are excluded, please see Attachment B: Complaints Tracking Module Exclusion List. Complaint rates are not calculated for contracts with less than 800 average enrollment during the measurement period.
Data Source: CTM
Data Source Description: Data were obtained from the CTM based on the contract entry date (the date that complaints are assigned or re-assigned to contracts; also known as the contract assignment/reassignment date) for the reporting period specified. The status of any specific complaint at the time the data are pulled stands for use in the reports. Any changes to the complaints data subsequent to the data pull cannot be excluded retroactively. Complaint rates per 1,000 enrollees are adjusted to a 30-day basis.
CMS Framework Area: Person- and caregiver- centered experience and outcomes
NQF #: None
Data Time Frame: 01/01/2014 - 06/30/2014
General Trend: Lower is better
Statistical Method: Relative Distribution and Clustering
Improvement Measure: Included
Weighting Category: Patients’ Experience and Complaints Measure
Weighting Value: 1.5
Data Display: Rate with 2 decimal points
Reporting Requirements: 1876 Cost Demo
Local, E-Local & Regional CCP w/o SNP
Local, E-Local & Regional CCP with SNP MSA
E-PDP & PDP
E-PFFS & PFFS
Yes Yes Yes Yes No Yes Yes
4-Star Threshold: MA-PD: Not predetermined, PDP: Not predetermined
Cut Points: Type 1 Star 2 Star 3 Star 4 Star 5 Star
MA-PD > 1.80 > 0.86 to ≤ 1.80 > 0.32 to ≤ 0.86 > 0.17 to ≤ 0.32 ≤ 0.17
PDP > 0.55 > 0.36 to ≤ 0.55 > 0.17 to ≤ 0.36 > 0.08 to ≤ 0.17 ≤ 0.08

(Last Updated 10/03/2014) Page 48
Measure: D04 - Members Choosing to Leave the Plan
Label for Stars: Members Choosing to Leave the Plan (more stars are better because it means fewer members are choosing to leave the plan)
Label for Data: Members Choosing to Leave the Plan (lower percentages are better because it means fewer members choose to leave the plan)
Description: The percent of plan members who chose to leave the plan in 2013. (This does not include members who did not choose to leave the plan, such as members who moved out of the service area.)
Metric: The percent of members who chose to leave the plan come from disenrollment reason codes in Medicare’s enrollment system. The percent is calculated as the number of members who chose to leave the plan between January 1, 2013–December 31, 2013 (numerator) divided by all members enrolled in the plan at any time during 2013 (denominator).
Exclusions: Members who involuntarily left their plan due to circumstances beyond their control are removed from the final numerator, specifically: • Members who moved out of the service area • Members affected by a contract service area reduction • Members affected by PBP termination • Members affected by LIS reassignments • Members who are enrolled in employer group plans • Members in PBPs that were granted special enrollment exceptions • Members who were passively enrolled into a Demonstration (Medicare-Medicaid Plan) • SNPs disproportionate share members who do not meet the SNP criteria Contracts with less than 1,000 enrollees
General Notes: This measure includes members who disenrolled from the contract with the following disenrollment reason codes: 11 - Voluntary Disenrollment through plan, 13 - Disenrollment because of enrollment in another Plan, 14 - Retroactive or 99 - Other (not supplied by beneficiary).
Data Source: Medicare Beneficiary Database Suite of Systems
CMS Framework Area: Person- and caregiver- centered experience and outcomes
NQF #: None
Data Time Frame: 01/01/2013 - 12/31/2013
General Trend: Lower is better
Statistical Method: Relative Distribution and Clustering
Improvement Measure: Included
Weighting Category: Patients’ Experience and Complaints Measure
Weighting Value: 1.5
Data Display: Percentage with no decimal point
Reporting Requirements: 1876 Cost Demo
Local, E-Local & Regional CCP w/o SNP
Local, E-Local & Regional CCP with SNP MSA
E-PDP & PDP
E-PFFS & PFFS
Yes Yes Yes Yes No Yes Yes
4-Star Threshold: MA-PD: Not predetermined, PDP: Not predetermined
Cut Points: Type 1 Star 2 Star 3 Star 4 Star 5 Star
MA-PD > 46% > 29% to ≤ 46% > 16% to ≤ 29% > 9% to ≤ 16% ≤ 9%
PDP > 20% > 15% to ≤ 20% > 8% to ≤ 15% > 4% to ≤ 8% ≤ 4%

(Last Updated 10/03/2014) Page 49
Measure: D05 - Drug Plan Quality Improvement
Label for Stars: Improvement (if any) in the Drug Plan’s Performance
Label for Data: Improvement (If any) in the Drug Plan’s Performance
Description: This shows how much the drug plan’s performance has improved or declined from one year to the next year. To calculate the plan’s improvement rating, Medicare compares the plan’s previous scores to its current scores for all of the topics shown on this website. Then Medicare averages the results to give the plan its improvement rating. If a plan receives 1 or 2 stars, it means, on average, the plan’s scores have declined (gotten worse). If a plan receives 3 stars, it means, on average, the plan’s scores have stayed about the same. If a plan receives 4 or 5 stars, it means, on average, the plan’s scores have improved. Keep in mind that a plan that is already doing well in most areas may not show much improvement. It is also possible that a plan can start with low ratings, show a lot of improvement, and still not be performing very well.
Metric: The numerator is the net improvement, which is a sum of the number of significantly improved measures minus the number of significantly declined measures. The denominator is the number of measures eligible for the improvement measure (i.e., the measures that were included in the 2014 and 2015 Star Ratings for this contract and had no specification changes).
Exclusions: Contracts must have data in at least half of the measures used to calculate improvement to be rated in this measure.
General Notes: Attachment I contains the formulas used to calculate the improvement measure and lists indicating which measures were used.
Data Source: Star Ratings
Data Source Description: 2014 and 2015 Star Ratings
CMS Framework Area: Population / community health
NQF #: None
Data Time Frame: Not Applicable
General Trend: Higher is better
Statistical Method: Relative Distribution and Clustering
Improvement Measure: Not Included
Weighting Category: Improvement Measure
Weighting Value: 5
Data Display: Not Applicable
Reporting Requirements: 1876 Cost Demo
Local, E-Local & Regional CCP w/o SNP
Local, E-Local & Regional CCP with SNP MSA
E-PDP & PDP
E-PFFS & PFFS
Yes Yes Yes Yes No Yes Yes
4-Star Threshold: MA-PD: Not predetermined, PDP: Not predetermined
Cut Points: Type 1 Star 2 Star 3 Star 4 Star 5 Star
MA-PD < -0.231 ≥ -0.231 to < 0.000 ≥ 0.000 to < 0.357 ≥ 0.357 to < 0.500 ≥ 0.500
PDP < -0.154 ≥ -0.154 to < 0.000 ≥ 0.000 to < 0.357 ≥ 0.357 to < 0.500 ≥ 0.500

(Last Updated 10/03/2014) Page 50
Domain: 3 - Member Experience with the Drug Plan
Measure: D06 - Rating of Drug Plan
Label for Stars: Members’ Rating of Drug Plan
Label for Data: Members’ Rating of Drug Plan
Description: Percent of the best possible score the plan earned from members who rated the prescription drug plan.
Metric: This case-mix adjusted measure is used to assess the overall view members have of their prescription drug plan. The Consumer Assessment of Healthcare Providers and Systems (CAHPS) score uses the mean of the distribution of responses converted to a scale from 0 to 100. The score shown is the percentage of the best possible score each contract earned.
General Notes: CAHPS Survey results were sent to each contract's Medicare Compliance Officer in early August 2014. These reports provide further explanation of the CAHPS scoring methodology and provide detailed information on why a specific rating was assigned.
Data Source: CAHPS
Data Source Description: CAHPS Survey Questions (question numbers vary depending on survey type): • Using any number from 0 to 10, where 0 is the worst prescription drug plan possible and 10 is the best prescription drug plan possible, what number would you use to rate your prescription drug plan?
CMS Framework Area: Person- and caregiver- centered experience and outcomes
NQF #: None
Data Time Frame: 02/15/2014 - 05/31/2014
General Trend: Higher is better
Statistical Method: Relative Distribution and Significance Testing
Improvement Measure: Included
Weighting Category: Patients’ Experience and Complaints Measure
Weighting Value: 1.5
Data Display: Percentage with no decimal point
Reporting Requirements: 1876 Cost Demo
Local, E-Local & Regional CCP w/o SNP
Local, E-Local & Regional CCP with SNP MSA
E-PDP & PDP
E-PFFS & PFFS
Yes Yes Yes Yes No Yes Yes
4-Star Threshold: MA-PD: ≥ 84%, PDP: ≥ 81%
Cut Points: Type 1 Star 2 Star 3 Star 4 Star 5 Star
MA-PD < 82% ≥ 82% to < 83% ≥ 83% to < 84% ≥ 84% to < 87% ≥ 87%
PDP < 80% ≥ 80% to < 81% * ≥ 81% to < 86% ≥ 86%
* Due to rounding and the placement of the predetermined 4-star cutoff, no contracts were assigned 3 base stars; all contracts meeting the cutoff for 3 base stars also met the cutoff for 4 base stars. However after application of the further criteria of significance and reliability, some plans with fewer than 3 base stars may have been assigned 3 final stars.
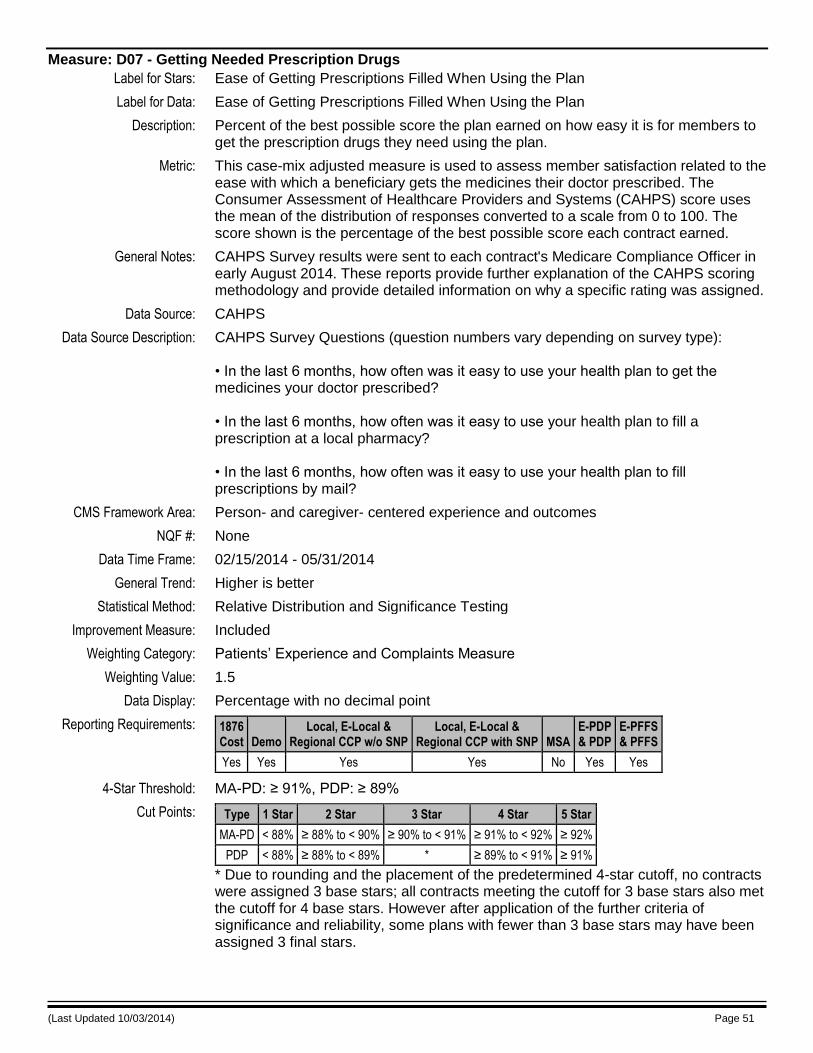
(Last Updated 10/03/2014) Page 51
Measure: D07 - Getting Needed Prescription Drugs
Label for Stars: Ease of Getting Prescriptions Filled When Using the Plan
Label for Data: Ease of Getting Prescriptions Filled When Using the Plan
Description: Percent of the best possible score the plan earned on how easy it is for members to get the prescription drugs they need using the plan.
Metric: This case-mix adjusted measure is used to assess member satisfaction related to the ease with which a beneficiary gets the medicines their doctor prescribed. The Consumer Assessment of Healthcare Providers and Systems (CAHPS) score uses the mean of the distribution of responses converted to a scale from 0 to 100. The score shown is the percentage of the best possible score each contract earned.
General Notes: CAHPS Survey results were sent to each contract's Medicare Compliance Officer in early August 2014. These reports provide further explanation of the CAHPS scoring methodology and provide detailed information on why a specific rating was assigned.
Data Source: CAHPS
Data Source Description: CAHPS Survey Questions (question numbers vary depending on survey type): • In the last 6 months, how often was it easy to use your health plan to get the medicines your doctor prescribed? • In the last 6 months, how often was it easy to use your health plan to fill a prescription at a local pharmacy? • In the last 6 months, how often was it easy to use your health plan to fill prescriptions by mail?
CMS Framework Area: Person- and caregiver- centered experience and outcomes
NQF #: None
Data Time Frame: 02/15/2014 - 05/31/2014
General Trend: Higher is better
Statistical Method: Relative Distribution and Significance Testing
Improvement Measure: Included
Weighting Category: Patients’ Experience and Complaints Measure
Weighting Value: 1.5
Data Display: Percentage with no decimal point
Reporting Requirements: 1876 Cost Demo
Local, E-Local & Regional CCP w/o SNP
Local, E-Local & Regional CCP with SNP MSA
E-PDP & PDP
E-PFFS & PFFS
Yes Yes Yes Yes No Yes Yes
4-Star Threshold: MA-PD: ≥ 91%, PDP: ≥ 89%
Cut Points: Type 1 Star 2 Star 3 Star 4 Star 5 Star
MA-PD < 88% ≥ 88% to < 90% ≥ 90% to < 91% ≥ 91% to < 92% ≥ 92%
PDP < 88% ≥ 88% to < 89% * ≥ 89% to < 91% ≥ 91%
* Due to rounding and the placement of the predetermined 4-star cutoff, no contracts were assigned 3 base stars; all contracts meeting the cutoff for 3 base stars also met the cutoff for 4 base stars. However after application of the further criteria of significance and reliability, some plans with fewer than 3 base stars may have been assigned 3 final stars.

(Last Updated 10/03/2014) Page 52
Domain: 4 - Drug Safety and Accuracy of Drug Pricing
Measure: D08 - MPF Price Accuracy
Label for Stars: Plan Provides Accurate Drug Pricing Information for This Website
Label for Data: Plan Provides Accurate Drug Pricing Information for This Website (higher scores are better because they mean more accurate prices)
Description: A score comparing the prices members actually pay for their drugs to the drug prices the plan provided for this Website (Medicare’s Plan Finder Website). (Higher scores are better because they mean the plan provided more accurate prices.)
Metric: This measure evaluates the accuracy of drug prices posted on the MPF tool. A contract’s score is based on the accuracy index. The accuracy price index compares point-of-sale PDE prices to plan-reported MPF prices and determines the magnitude of differences found. Using each PDE’s date of service, the price displayed on MPF is compared to the PDE price. The accuracy index considers both ingredient cost and dispensing fee and measures the amount that the PDE price is higher than the MPF price. Therefore, prices that are overstated on MPF—that is, the reported price is higher than the actual price—will not count against a plan’s accuracy score. The index is computed as: (Total amount that PDE is higher than PF + Total PDE cost)/(Total PDE cost). The best possible accuracy index is 1. An index of 1 indicates that a plan did not have PDE prices greater than MPF prices. A contract’s score is computed using its accuracy index as: 100 – ((accuracy index - 1) x 100).
Exclusions: A contract with less than 30 claims over the measurement period. PDEs must also meet the following criteria: • Pharmacy number on PDE must appear in MPF pharmacy cost file as either a retail-only pharmacy or a retail and limited access-only pharmacy (PDE with pharmacy numbers reported as non-retail pharmacy types or both retail and mail order/HI/LTC are excluded) • Drug must appear in formulary file and in MPF pricing file • PDE must be a 30 day supply • Date of service must occur at a time that data are not suppressed for the plan on MPF • PDE must not be a compound claim • PDE must not be a non-covered drug
General Notes: Please see Attachment M: Methodology for Price Accuracy Measure for more information about this measure.
Data Source: PDE data, MPF Pricing Files, HPMS approved formulary extracts, and data from First DataBank and Medi-span
Data Source Description: Data were obtained from a number of sources: PDE data, MPF Pricing Files, HPMS approved formulary extracts. Post-reconciliation PDE adjustments are not reflected in this measure.
CMS Framework Area: Efficiency and cost reduction
NQF #: None

(Last Updated 10/03/2014) Page 53
Data Time Frame: 01/01/2013 - 09/30/2013
General Trend: Higher is better
Statistical Method: Relative Distribution and Clustering
Improvement Measure: Not Included
Weighting Category: Process Measure
Weighting Value: 1
Data Display: Rate with no decimal point
Reporting Requirements: 1876 Cost Demo
Local, E-Local & Regional CCP w/o SNP
Local, E-Local & Regional CCP with SNP MSA
E-PDP & PDP
E-PFFS & PFFS
Yes Yes Yes Yes No Yes Yes
4-Star Threshold: MA-PD: Not predetermined, PDP: Not predetermined
Cut Points: Type 1 Star 2 Star 3 Star 4 Star 5 Star
MA-PD < 79 ≥ 79 to < 90 ≥ 90 to < 95 ≥ 95 to < 99 ≥ 99
PDP NA NA ≥ 97 to < 98 ≥ 98 to < 99 ≥ 99
Measure: D09 - High Risk Medication
Label for Stars: Plan Members 65 and Older Who Received Prescriptions for Certain Drugs with a High Risk of Side Effects, When There May Be Safer Drug Choices
Label for Data: Plan Members 65 and Older Who Received Prescriptions for Certain Drugs with a High Risk of Side Effects, When There May Be Safer Drug Choices
Description: The percent of plan members who got prescriptions for certain drugs with a high risk of serious side effects, when there may be safer drug choices.
Metric: This measure is defined as the percentage of Medicare Part D beneficiaries 65 years or older who received two or more prescription fills for the same HRM drug with a high risk of serious side effects in the elderly. This percentage is calculated as the number of member-years of enrolled beneficiaries 65 years or older who received two or more prescription fills for the same HRM during the period measured (numerator) divided by the number of member-years of enrolled beneficiaries 65 years and older during the period measured (denominator). This measure, also named the High Risk Medication measure (HRM), was first developed by the National Committee for Quality Assurance (NCQA), through its Healthcare Effectiveness Data and Information Set (HEDIS), and then adapted and endorsed by the Pharmacy Quality Alliance (PQA). This measure is also endorsed by the National Quality Forum (NQF). See the medication list for this measure. The HRM rate is calculated using the NDC list and obsolete NDC date methodology maintained by the PQA. The complete National Drug Code (NDC) list will be posted along with these technical notes. For the 2015 Star Ratings, NDCs with obsolete dates will be included in the measure calculation if its obsolete dates as reported by PQA are within the period of measurement (measurement year). The same HRM is defined at the active ingredient level. The active ingredient is identified using the active ingredient flags in the PQA’s NDC list. The updated PQA HRM measure drug list based upon the American Geriatrics Society (AGS) recommendations is used to calculate the 2015 Star Rating.
Exclusions: Contracts with 30 or fewer enrolled beneficiary member years (in the denominator)
General Notes: Part D drugs do not include drugs or classes of drugs, or their medical uses, which may be excluded from coverage or otherwise restricted under section 1927(d)(2) of the Act, except for smoking cessation agents. As such, these drugs, which may be

(Last Updated 10/03/2014) Page 54
included in the medication or NDC lists, are excluded from CMS analyses. Beneficiaries must be enrolled and age 65 or older in at least one month of the period measured. Also, member-years of enrollment is the adjustment made by CMS to account for partial enrollment within the benefit year. For instance, if a beneficiary is enrolled for six out of twelve months of the year, they will count as only 0.5 member-years in the rate calculation.
Data Source: Prescription Drug Event (PDE) data
Data Source Description: The data for this measure come from PDE data files submitted by drug plans to Medicare for January 1, 2013-December 31, 2013 by June 30, 2014. Only final action PDE claims are used to calculate the patient safety measures. PDE claims are limited to members over 65 years of age, and for those Part D covered drugs identified to have high risk of serious side effects in patients 65 years of age or older. PDE adjustments made post-reconciliation were not reflected in this measure.
CMS Framework Area: Safety
NQF #: 0022
Data Time Frame: 01/01/2013 - 12/31/2013
General Trend: Lower is better
Statistical Method: Relative Distribution and Clustering
Improvement Measure: Not Included
Weighting Category: Intermediate Outcome Measure
Weighting Value: 3
Data Display: Percentage with no decimal point
Reporting Requirements: 1876 Cost Demo
Local, E-Local & Regional CCP w/o SNP
Local, E-Local & Regional CCP with SNP MSA
E-PDP & PDP
E-PFFS & PFFS
Yes Yes Yes Yes No Yes Yes
4-Star Threshold: MA-PD: Not predetermined, PDP: Not predetermined
Cut Points: Type 1 Star 2 Star 3 Star 4 Star 5 Star
MA-PD > 17% > 13% to ≤ 17% > 9% to ≤ 13% > 7% to ≤ 9% ≤ 7%
PDP > 16% > 14% to ≤ 16% > 11% to ≤ 14% > 6% to ≤ 11% ≤ 6%
Measure: D10 - Diabetes Treatment
Label for Stars: Using the Kind of Blood Pressure Medication That Is Recommended for People with Diabetes
Label for Data: Using the Kind of Blood Pressure Medication That Is Recommended for People with Diabetes
Description: When people with diabetes also have high blood pressure, there are certain types of blood pressure medication recommended. This tells what percent got one of the recommended types of blood pressure medicine.
Metric: This is defined as the percentage of Medicare Part D beneficiaries 18 years or older who were dispensed a medication for diabetes and a medication for hypertension whose treatment included a renin angiotensin system (RAS) antagonist [an angiotensin converting enzyme inhibitor (ACEI), angiotensin receptor blocker (ARB), or direct renin inhibitor] medication that is recommended for people with diabetes. This percentage is calculated as the number of member-years of enrolled beneficiaries 18 years or older from the eligible population who received a RAS antagonist medication during the period measured (numerator) divided by the number of member-years of enrolled beneficiaries 18 years or older in the period measured

(Last Updated 10/03/2014) Page 55
who were dispensed at least one prescription for an oral hypoglycemic agent or insulin and at least one prescription for an antihypertensive agent during the measurement period (denominator). This measure is adapted from one endorsed by the Pharmacy Quality Alliance (PQA) - Diabetes: Appropriate Treatment for Hypertension. This measure is also endorsed by the National Quality Forum (NQF). See the medication list for this measure. The Diabetes Treatment rate is calculated using the National Drug Code (NDC) lists and obsolete NDC date methodology maintained by the PQA. The complete NDC lists will be posted along with these technical notes. For the 2015 Star Ratings, NDCs with obsolete dates will be included in the measure calculation if their obsolete dates as reported by PQA are within the period of measurement (measurement year).
Exclusions: Contracts with 30 or fewer beneficiary member years (in the denominator).
General Notes: Part D drugs do not include drugs or classes of drugs, or their medical uses, which may be excluded from coverage or otherwise restricted under section 1927(d)(2) of the Act, except for smoking cessation agents. As such, these drugs, which may be included in the medication or NDC lists, are excluded from CMS analyses. Also, member-years of enrollment is the adjustment made by CMS to account for partial enrollment within the benefit year. For instance, if a beneficiary is enrolled for six out of twelve months of the year, they will count as only 0.5 member-years in the rate calculation.
Data Source: Prescription Drug Event (PDE) data
Data Source Description: The data for this measure come from PDE data files submitted by drug plans to Medicare for January 1, 2013-December 31, 2013 by June 30, 2014. Only final action PDE claims are used to calculate the patient safety measures. PDE claims were limited to members who received at least one prescription for an oral diabetes drug or insulin and at least one prescription for a high blood pressure drug. Members who received a RAS antagonist medication were identified. PDE adjustments made post-reconciliation were not reflected in this measure.
CMS Framework Area: Clinical care
NQF #: 0546
Data Time Frame: 01/01/2013 - 12/31/2013
General Trend: Higher is better
Statistical Method: Relative Distribution and Clustering
Improvement Measure: Included
Weighting Category: Intermediate Outcome Measure
Weighting Value: 3
Data Display: Percentage with no decimal point
Reporting Requirements: 1876 Cost Demo
Local, E-Local & Regional CCP w/o SNP
Local, E-Local & Regional CCP with SNP MSA
E-PDP & PDP
E-PFFS & PFFS
Yes Yes Yes Yes No Yes Yes
4-Star Threshold: MA-PD: ≥ 86%, PDP: ≥ 83%
Cut Points: Type 1 Star 2 Star 3 Star 4 Star 5 Star
MA-PD < 79% ≥ 79% to < 83% ≥ 83% to < 86% ≥ 86% to < 90% ≥ 90%
PDP < 80% ≥ 80% to < 82% ≥ 82% to < 83% ≥ 83% to < 90% ≥ 90%

(Last Updated 10/03/2014) Page 56
Measure: D11 - Medication Adherence for Diabetes Medications
Label for Stars: Taking Diabetes Medication as Directed
Label for Data: Taking Diabetes Medication as Directed
Description: One of the most important ways you can manage your health is by taking your medication as directed. The plan, the doctor, and the member can work together to find ways to help the member take their medication as directed. Percent of plan members with a prescription for diabetes medication who fill their prescription often enough to cover 80% or more of the time they are supposed to be taking the medication. (“Diabetes medication” means a biguanide drug, a sulfonylurea drug, a thiazolidinedione drug, a DPP-IV inhibitor, an incretin mimetic drug, or a meglitinide drug. Plan members who take insulin are not included.)
Metric: This measure is defined as the percent of Medicare Part D beneficiaries 18 years or older that adhere to their prescribed drug therapy across classes of diabetes medications: biguanides, sulfonylureas, thiazolidinediones, and DiPeptidyl Peptidase (DPP)-IV Inhibitors, incretin mimetics, and meglitinides. This percentage is calculated as the number of member-years of enrolled beneficiaries 18 years or older with a proportion of days covered (PDC) at 80 percent or over across the classes of diabetes medications during the measurement period (numerator) divided by the number of member-years of enrolled beneficiaries 18 years or older with at least two fills of medication(s) across any of the drug classes during the measurement period (denominator). The PDC is the percent of days in the measurement period “covered” by prescription claims for the same medication or medications in its therapeutic category. Beneficiaries with one of more fills for insulin in the measurement period are excluded. Patients are only included in the measure calculation if the first fill of their medication occurs at least 91 days before the end of the enrollment period. The Medication Adherence measure is adapted from the Medication Adherence-Proportion of Days Covered measure that was developed and endorsed by the Pharmacy Quality Alliance (PQA). The PDC Adherence measures are also endorsed by the National Quality Forum (NQF). See the medication list for this measure. The Medication Adherence rate is calculated using the National Drug Code (NDC) list and obsolete NDC date methodology maintained by the PQA. The complete NDC list will be posted along with these technical notes. For the 2015 Star Ratings, NDCs with obsolete dates will be included in the measure calculation if their obsolete dates as reported by PQA are within the period of measurement (measurement year).
Exclusions: Contracts with 30 or fewer beneficiary member years (in the denominator).
General Notes: Part D drugs do not include drugs or classes of drugs, or their medical uses, which may be excluded from coverage or otherwise restricted under section 1927(d)(2) of the Act, except for smoking cessation agents. As such, these drugs, which may be included in the medication or NDC lists, are excluded from CMS analyses. Also, member-years of enrollment is the adjustment made by CMS to account for partial enrollment within the benefit year. Enrollment is measured at the spell level, and inclusion in the measure is determined separately for each spell – i.e., to be included for a given spell, the beneficiary must meet the initial inclusion criteria for the measure during that spell. The measure is weighted based on the total number of member years for each spell in which the beneficiary meets the measure criteria. For instance, if a beneficiary is enrolled for a three month spell, disenrolled for a six month spell, reenrolled for a three month spell, and meets the measure criteria during each enrollment spell , s/he will count as 0.5 member years in the rate calculation

(Last Updated 10/03/2014) Page 57
(3/12 + 3/12 = 6/12). The PDC calculation is adjusted for overlapping prescriptions for the same drug which is defined by active ingredient at the generic name level using the Medi-Span generic ingredient name. The calculation also adjusts for Part D beneficiaries’ stays in inpatient (IP) settings, hospice enrollments, and stays in skilled nursing facilities (SNFs). The SNF adjustment only applies to PDPs because SNF data are not currently available for MA-PDs. Please see Attachment L: Medication Adherence Measure Calculations for more information about these calculations.
Data Source: Prescription Drug Event (PDE) data; Medicare Enrollment Database (EDB) File; Common Working File (CWF)
Data Source Description: The data for this measure come from PDE data files submitted by drug plans to Medicare for January 1, 2013-December 31, 2013 by June 30, 2014. Only final action PDE claims are used to calculate the patient safety measures. PDE claims are limited to members who received at least two prescriptions for diabetes medication(s). PDE adjustments made post-reconciliation were not reflected in this measure.
CMS Framework Area: Clinical care
NQF #: 0541
Data Time Frame: 01/01/2013 - 12/31/2013
General Trend: Higher is better
Statistical Method: Relative Distribution and Clustering
Improvement Measure: Included
Weighting Category: Intermediate Outcome Measure
Weighting Value: 3
Data Display: Percentage with no decimal point
Reporting Requirements: 1876 Cost Demo
Local, E-Local & Regional CCP w/o SNP
Local, E-Local & Regional CCP with SNP MSA
E-PDP & PDP
E-PFFS & PFFS
Yes Yes Yes Yes No Yes Yes
4-Star Threshold: MA-PD: Not predetermined, PDP: Not predetermined
Cut Points: Type 1 Star 2 Star 3 Star 4 Star 5 Star
MA-PD < 69% ≥ 69% to < 73% ≥ 73% to < 77% ≥ 77% to < 81% ≥ 81%
PDP < 74% ≥ 74% to < 79% ≥ 79% to < 82% ≥ 82% to < 85% ≥ 85%
Measure: D12 - Medication Adherence for Hypertension (RAS antagonists)
Label for Stars: Taking Blood Pressure Medication as Directed
Label for Data: Taking Blood Pressure Medication as Directed
Description: One of the most important ways you can manage your health is by taking your medication as directed. The plan, the doctor, and the member can work together to find ways to help the member take their medication as directed. Percent of plan members with a prescription for a blood pressure medication who fill their prescription often enough to cover 80% or more of the time they are supposed to be taking the medication. (“Blood pressure medication” means an ACE (angiotensin converting enzyme) inhibitor, an ARB (angiotensin receptor blocker), or a direct renin inhibitor drug.)
Metric: This measure is defined as the percent of Medicare Part D beneficiaries 18 years or older that adhere to their prescribed drug therapy for renin angiotensin system (RAS) antagonists [angiotensin converting enzyme inhibitor (ACEI), angiotensin receptor

(Last Updated 10/03/2014) Page 58
blocker (ARB), or direct renin inhibitor medications]. This percentage is calculated as the number of member-years of enrolled beneficiaries 18 years and older with a proportion of days covered (PDC) at 80 percent or over for RAS antagonist medications during the measurement period (numerator) divided by the number of member-years of enrolled beneficiaries 18 years or older with at least two fills of either the same medication or medications in the drug class during the measurement period (denominator). The PDC is the percent of days in the measurement period “covered” by prescription claims for the same medication or another in its therapeutic category. Patients are only included in the measure calculation if the first fill of their medication occurs at least 91 days before the end of the enrollment period. The Part D Medication Adherence measure is adapted from the Medication Adherence-Proportion of Days Covered measure that was developed and endorsed by the Pharmacy Quality Alliance (PQA). The PDC Adherence measures are also endorsed by the National Quality Forum (NQF). See the medication list for this measure. The Part D Medication Adherence rate is calculated using the National Drug Code (NDC) list and obsolete NDC date methodology maintained by the PQA. The complete NDC list will be posted along with these technical notes. For the 2015 Star Ratings, NDCs with obsolete dates will be included in the measure calculation if their obsolete dates as reported by PQA are within the period of measurement (measurement year).
Exclusions: A percentage is not calculated for contracts with 30 or fewer beneficiary member years (in the denominator).
General Notes: Part D drugs do not include drugs or classes of drugs, or their medical uses, which may be excluded from coverage or otherwise restricted under section 1927(d)(2) of the Act, except for smoking cessation agents. As such, these drugs, which may be included in the medication or NDC lists, are excluded from CMS analyses. Also, member-years of enrollment is the adjustment made by CMS to account for partial enrollment within the benefit year. Enrollment is measured at the spell level, and inclusion in the measure is determined separately for each spell – i.e., to be included for a given spell, the beneficiary must meet the initial inclusion criteria for the measure during that spell. The measure is weighted based on the total number of member years for each spell in which the beneficiary meets the measure criteria. For instance, if a beneficiary is enrolled for a three month spell, disenrolled for a six month spell, reenrolled for a three month spell, and meets the measure criteria during each enrollment spell , s/he will count as 0.5 member years in the rate calculation (3/12 + 3/12 = 6/12). The PDC calculation is adjusted for overlapping prescriptions for the same drug which is defined by active ingredient at the generic name level using the Medi-Span generic ingredient name. The calculation also adjusts for Part D beneficiaries’ stays in inpatient (IP) settings, hospice enrollments, and stays in skilled nursing facilities (SNFs). The SNF adjustment only applies to PDPs because SNF data are not currently available for MA-PDs. Please see Attachment L: Medication Adherence Measure Calculations for more information about these calculations.
Data Source: Prescription Drug Event (PDE) data; Medicare Enrollment Database (EDB) File; Common Working File (CWF)
Data Source Description: The data for this measure come from PDE data files submitted by drug plans to Medicare for January 1, 2013-December 31, 2013 by June 30, 2014. Only final action PDE claims are used to calculate the patient safety measures. PDE claims are limited to members who received at least two prescriptions for RAS antagonist medication(s).

(Last Updated 10/03/2014) Page 59
PDE adjustments made post-reconciliation were not reflected in this measure.
CMS Framework Area: Clinical care
NQF #: 0541
Data Time Frame: 01/01/2013 - 12/31/2013
General Trend: Higher is better
Statistical Method: Relative Distribution and Clustering
Improvement Measure: Included
Weighting Category: Intermediate Outcome Measure
Weighting Value: 3
Data Display: Percentage with no decimal point
Reporting Requirements: 1876 Cost Demo
Local, E-Local & Regional CCP w/o SNP
Local, E-Local & Regional CCP with SNP MSA
E-PDP & PDP
E-PFFS & PFFS
Yes Yes Yes Yes No Yes Yes
4-Star Threshold: MA-PD: Not predetermined, PDP: Not predetermined
Cut Points: Type 1 Star 2 Star 3 Star 4 Star 5 Star
MA-PD < 72% ≥ 72% to < 76% ≥ 76% to < 81% ≥ 81% to < 85% ≥ 85%
PDP < 72% ≥ 72% to < 76% ≥ 76% to < 81% ≥ 81% to < 84% ≥ 84%
Measure: D13 - Medication Adherence for Cholesterol (Statins)
Label for Stars: Taking Cholesterol Medication as Directed
Label for Data: Taking Cholesterol Medication as Directed
Description: One of the most important ways you can manage your health is by taking your medication as directed. The plan, the doctor, and the member can work together to find ways to help the member take their medication as directed. Percent of plan members with a prescription for a cholesterol medication (a statin drug) who fill their prescription often enough to cover 80% or more of the time they are supposed to be taking the medication.
Metric: This measure is defined as the percent of Medicare Part D beneficiaries 18 years or older that adhere to their prescribed drug therapy for statin cholesterol medications. This percentage is calculated as the number of member-years of enrolled beneficiaries 18 years of older with a proportion of days covered (PDC) at 80 percent or over for statin cholesterol medication(s) during the measurement period (numerator) divided by the number of member-years of enrolled beneficiaries 18 years or older with at least two fills of either the same medication or medication in the drug class during the measurement period (denominator). The PDC is the percent of days in the measurement period “covered” by prescription claims for the same medication or another in the therapeutic category. Patients are only included in the measure calculation if the first fill of their medication occurs at least 91 days before the end of the enrollment period. The Medication Adherence measure is adapted from the Medication Adherence-Proportion of Days Covered measure that was developed and endorsed by the Pharmacy Quality Alliance (PQA). The PDC Adherence measures are also endorsed by the National Quality Forum (NQF). See the medication list for this measure. The Medication Adherence rate is calculated using the National Drug Code (NDC) list and obsolete NDC date methodology

(Last Updated 10/03/2014) Page 60
maintained by the PQA. The complete NDC list will be posted along with these technical notes. For the 2015 Star Ratings, NDCs with obsolete dates will be included in the measure calculation if their obsolete dates as reported by PQA are within the period of measurement (measurement year).
Exclusions: Contracts with 30 or fewer beneficiary member years (in the denominator).
General Notes: Part D drugs do not include drugs or classes of drugs, or their medical uses, which may be excluded from coverage or otherwise restricted under section 1927(d)(2) of the Act, except for smoking cessation agents. As such, these drugs, which may be included in the medication or NDC lists, are excluded from CMS analyses. Also, member-years of enrollment is the adjustment made by CMS to account for partial enrollment within the benefit year. Enrollment is measured at the spell level, and inclusion in the measure is determined separately for each spell – i.e., to be included for a given spell, the beneficiary must meet the initial inclusion criteria for the measure during that spell. The measure is weighted based on the total number of member years for each spell in which the beneficiary meets the measure criteria. For instance, if a beneficiary is enrolled for a three month spell, disenrolled for a six month spell, reenrolled for a three month spell, and meets the measure criteria during each enrollment spell , s/he will count as 0.5 member years in the rate calculation (3/12 + 3/12 = 6/12). The PDC calculation is adjusted for overlapping prescriptions for the same drug which is defined by active ingredient at the generic name level using the Medi-Span generic ingredient name. The calculation also adjusts for Part D beneficiaries’ stays in inpatient (IP) settings, hospice enrollments, and stays in skilled nursing facilities (SNFs). The SNF adjustment only applies to PDPs because SNF data are not currently available for MA-PDs.
Data Source: Prescription Drug Event (PDE) data; Medicare Enrollment Database (EDB) File; Common Working File (CWF)
Data Source Description: The data for this measure come from PDE data files submitted by drug plans to Medicare for January 1, 2013-December 31, 2013 by June 30, 2014. PDE claims are limited to members who received at least two prescriptions for a statin drug(s). PDE adjustments made post-reconciliation were not reflected in this measure.
CMS Framework Area: Clinical care
NQF #: 0541
Data Time Frame: 01/01/2013 - 12/31/2013
General Trend: Higher is better
Statistical Method: Relative Distribution and Clustering
Improvement Measure: Included
Weighting Category: Intermediate Outcome Measure
Weighting Value: 3
Data Display: Percentage with no decimal point
Reporting Requirements: 1876 Cost Demo
Local, E-Local & Regional CCP w/o SNP
Local, E-Local & Regional CCP with SNP MSA
E-PDP & PDP
E-PFFS & PFFS
Yes Yes Yes Yes No Yes Yes
4-Star Threshold: MA-PD: Not predetermined, PDP: Not predetermined
Cut Points: Type 1 Star 2 Star 3 Star 4 Star 5 Star
MA-PD < 59% ≥ 59% to < 68% ≥ 68% to < 76% ≥ 76% to < 83% ≥ 83%
PDP < 62% ≥ 62% to < 69% ≥ 69% to < 75% ≥ 75% to < 78% ≥ 78%

(Last Updated 10/03/2014) Page 61
Attachment A: CAHPS Case-Mix Adjustment
The CAHPS measures are case-mix adjusted to take into account the mix of enrollees. Case-mix variables include dual eligibility and education among other variables. The table below includes the case-mix variables and shows the case-mix coefficients for each of the CAHPS measures included in the MPF tool. The coefficients indicate how much higher or lower people with a given characteristic tend to respond compared to others with the baseline value for that characteristic, on the 0-100 scale used in consumer reports.
For example, for the measure "Get Needed Care", the coefficient for "age 80-84" is +0.015, indicating that respondents in that age range tend to score their plans 0.015 point higher than otherwise similar people in the 70-74 age range (the baseline or reference category). Similarly, dual eligibles tend to respond -0.022 points lower on this item than otherwise similar non-duals. Contracts with higher proportions of beneficiaries who are in the 80-84 age range will be adjusted downwards to compensate for the positive response tendency of their respondents. Similarly, contracts with higher proportions of respondents who are dual eligibles will be adjusted upwards to compensate for their respondents’ negative response tendency. The case-mix patterns are not always consistent across measures.
The composites consist of multiple items, each of which is adjusted separately before combining the adjusted scores into a composite score. In the tables we report the average of the coefficients for these several items, for each of the categories (rows) of the table, as a summary of the adjustment for the composite.
Table A-1: Part C CAHPS Measures
Predictor C23: Getting Needed Care
(Comp)
C24: Getting Appointments and
Care Quickly (Comp)
C25: Customer Service (Comp)
C26: Rating of Health
Care Quality
C27: Rating of Health
Plan
C28: Care Coordination
(Comp)
Age: 64 or under -0.038 -0.033 -0.019 -0.204 -0.221 -0.021
Age: 65 - 69 -0.004 -0.004 0.005 -0.064 -0.093 0.011
Age: 75 - 79 0.004 0.001 -0.004 0.017 0.061 -0.012
Age: 80 - 84 0.015 0.025 0.018 0.067 0.159 -0.010
Age: 85 and older 0.014 -0.002 0.034 0.086 0.171 -0.040
Less than an 8th grade education -0.033 -0.002 -0.027 -0.012 0.150 -0.004
Some high school 0.005 -0.049 -0.005 -0.043 0.143 0.007
Some college -0.046 -0.010 -0.042 -0.083 -0.180 -0.037
College graduate -0.049 0.000 -0.065 -0.155 -0.291 -0.044
More than a bachelor's degree -0.109 -0.022 -0.091 -0.217 -0.351 -0.064
General health rating: excellent 0.093 0.080 0.031 0.387 0.317 0.034
General health rating: very good 0.041 0.046 0.047 0.216 0.189 0.023
General health rating: fair -0.067 -0.046 -0.034 -0.235 -0.130 -0.040
General health rating: poor -0.105 -0.040 -0.091 -0.436 -0.246 -0.048
Mental health rating: excellent 0.164 0.142 0.119 0.480 0.399 0.125
Mental health rating: very good 0.066 0.065 0.051 0.230 0.179 0.061
Mental health rating: fair -0.056 0.003 0.014 -0.161 -0.076 -0.033
Mental health rating: poor -0.167 -0.059 -0.057 -0.424 -0.359 -0.110
Proxy helped -0.014 -0.044 -0.039 -0.169 -0.163 0.018
Proxy answered 0.003 -0.022 -0.039 -0.006 -0.135 -0.016
Medicaid dual eligible -0.022 -0.017 0.027 -0.045 0.301 -0.010
Low-income subsidy (LIS) -0.032 -0.028 0.029 -0.071 0.065 -0.007
Chinese language survey -0.127 -0.072 -0.331 0.175 -0.424 0.013

(Last Updated 10/03/2014) Page 62
Table A-2: Part D CAHPS Measures
Predictor MA-PD PDP
D06: Rating of Drug Plan
D07: Getting Needed Prescription Drugs (Comp)
D06: Rating of Drug Plan
D07: Getting Needed Prescription Drugs (Comp)
Age: 64 or under -0.228 -0.034 -0.174 -0.056
Age: 65 - 69 -0.127 -0.011 -0.107 -0.017
Age: 75 - 79 0.125 0.023 0.320 0.028
Age: 80 - 84 0.267 0.033 0.404 0.032
Age: 85 and older 0.389 0.032 0.431 0.032
Less than an 8th grade education 0.077 -0.045 0.100 -0.041
Some high school 0.086 0.000 0.136 -0.017
Some college -0.207 -0.011 -0.271 -0.064
College graduate -0.339 -0.027 -0.330 -0.069
More than a bachelor's degree -0.450 -0.055 -0.551 -0.072
General health rating: excellent 0.287 0.009 0.108 -0.049
General health rating: very good 0.214 0.027 0.155 -0.009
General health rating: fair -0.151 -0.044 -0.113 -0.044
General health rating: poor -0.339 -0.082 -0.366 -0.053
Mental health rating: excellent 0.356 0.100 0.228 0.102
Mental health rating: very good 0.128 0.048 0.162 0.062
Mental health rating: fair -0.044 -0.018 -0.069 -0.018
Mental health rating: poor -0.278 -0.066 -0.189 -0.063
Proxy helped -0.219 -0.004 -0.311 -0.028
Proxy answered -0.179 0.001 -0.200 -0.010
Medicaid dual eligible 0.583 0.037 0.764 0.038
Low-income subsidy (LIS) 0.462 0.037 0.572 0.055
Chinese language survey -0.453 -0.046 N/A N/A

(Last Updated 10/03/2014) Page 63
Attachment B: Complaints Tracking Module Exclusion List
Table B-1 contains the current exclusions applied to the CTM based on the revised categories and subcategories that have been applied since September 25, 2010.
Table B-1: Exclusions since September 25, 2010
Category ID Category Description
Subcategory ID Subcategory Description
Effective Date
11 Enrollment/Disenrollment 16 Facilitated/Auto Enrollment issues September 25, 2010 18 Enrollment Exceptions (EE)
13 Pricing/Co-Insurance 06 Beneficiary has lost LIS Status/Eligibility or was denied LIS
16 Part D IRMAA
30 Beneficiary Needs Assistance with Acquiring Medicaid Eligibility Information
01 Beneficiary Needs Assistance with Acquiring Medicaid Eligibility Information
90 Other Beneficiary Needs Assistance with Acquiring Medicaid Eligibility Information Issue
38 Contractor/Partner Performance 90 Other Contractor/Partner Performance
26 Contractor/Partner Performance 90 Other Contractor/Partner Performance December 16, 2011 44 Equitable Relief/Good Cause Requests 01 Good Cause - Disenrollment for Failure to Pay Premiums
90 Other Equitable Relief/Good Cause Request
45 Equitable Relief/Good Cause Requests 01 Good Cause - Disenrollment for Failure to Pay Premiums
02 Refund/Non-Receipt Part D IRMAA
03 Good Cause Part D IRMAA
04 Equitable Relief Part D IRMAA
90 Other Equitable Relief/Good Cause Request
49 Contractor/Partner Performance 90 Other Contractor/Partner Performance
50 Contractor/Partner Performance 90 Other Contractor/Partner Performance
03 Enrollment/ Disenrollment 11 Disenrollment Due to Loss of Entitlement June 1, 2013
11 Enrollment/ Disenrollment 24 Disenrollment Due to Loss of Entitlement
Note: Program Integrity complaints, which are in the CTM but not viewable by plans, are excluded as well.
Table B-2 contains the categories and subcategories that are excluded if they were entered into the CTM prior to current exclusion criteria.

(Last Updated 10/03/2014) Page 64
Table B-2: Exclusions prior to September 25, 2010 Category
ID Category Description Subcategory
ID Subcategory Description
03 Enrollment/Disenrollment 06 Enrollment Exceptions (EE)
07 Retroactive Disenrollment (RD)
09 Enrollment Reconciliation - Dissatisfied with Decision
10 Retroactive Enrollment (RE)
12 Missing Medicaid/ Medicare Eligibility in MBD
05 Program Integrity Issues/Potential Fraud, Waste and Abuse 01 Program Integrity Issues/Potential Fraud, Waste and Abuse
10 Customer Service 12 Plan Website
11 Enrollment/ Disenrollment 16 Facilitated/Auto Enrollment Issues
17 Missing Medicaid/ Medicare Eligibility in MBD
18 Enrollment Exceptions (EE)
13 Pricing/Co-Insurance 06 Beneficiary has lost LIS Status/Eligibility or was denied LIS
08 Overcharged Premium Fees
14 Program Integrity Issues/Potential Fraud, Waste and Abuse 01 Program Integrity Issues/Potential Fraud, Waste and Abuse
24 Program Integrity Issues/Potential Fraud, Waste and Abuse 01 Program Integrity Issues/Potential Fraud, Waste and Abuse
32 Program Integrity Issues/Potential Fraud, Waste and Abuse 01 Program Integrity Issues/Potential Fraud, Waste and Abuse
34 Plan Administration 02 Plan Terminating Contract
38 Contractor/ Partner Performance 01 Quality Improvement Organization (QIO)
02 State Health Insurance Plans (SHIPs)
03 Social Security Administration (SSA)
04 1-800-Medicare
90 Other Contractor/ Partner Performance
41 Pricing/Co-Insurance 01 Premium Reconciliation - Refund or Billing Issue
03 Beneficiary Double Billed (both premium withhold and direct pay)
04 Premium Withhold Amount not going to Plan
05 Part B Premium Reduction Issue
90 Other Premium Withhold Issue
Note: Program Integrity Complaints, which are in the CTM but not viewable by plans, are excluded as well.

(Last Updated 10/03/2014) Page 65
Attachment C: National Averages for Part C and D Measures
The tables below contain the average of the numeric and star values for each measure reported in the 2015 Star Ratings.
Table C-1: National Averages for Part C Measures
Measure ID Measure Name Numeric Average Star Average
C01 Colorectal Cancer Screening 65% 4.2
C02 Cardiovascular Care – Cholesterol Screening 89% 4.4
C03 Diabetes Care – Cholesterol Screening 89% 4.1
C04 Annual Flu Vaccine 73% 3.3
C05 Improving or Maintaining Physical Health 69% 4.6
C06 Improving or Maintaining Mental Health 79% 2.5
C07 Monitoring Physical Activity 50% 2.2
C08 Adult BMI Assessment 89% 3.8
C09 Special Needs Plan (SNP) Care Management 59.0% 2.7
C10 Care for Older Adults – Medication Review 83% 3.9
C11 Care for Older Adults – Functional Status Assessment 71% 3.4
C12 Care for Older Adults – Pain Assessment 82% 4.0
C13 Osteoporosis Management in Women who had a Fracture 27% 2.1
C14 Diabetes Care – Eye Exam 69% 3.7
C15 Diabetes Care – Kidney Disease Monitoring 91% 4.2
C16 Diabetes Care – Blood Sugar Controlled 76% 3.3
C17 Diabetes Care – Cholesterol Controlled 55% 3.5
C18 Controlling Blood Pressure 65% 3.7
C19 Rheumatoid Arthritis Management 78% 3.5
C20 Improving Bladder Control 35% 1.9
C21 Reducing the Risk of Falling 60% 3.3
C22 Plan All-Cause Readmissions 10% 3.0
C23 Getting Needed Care 84% 3.4
C24 Getting Appointments and Care Quickly 76% 3.5
C25 Customer Service 88% 3.5
C26 Rating of Health Care Quality 86% 3.7
C27 Rating of Health Plan 86% 3.4
C28 Care Coordination 85% 3.4
C29 Complaints about the Health Plan 0.12 4.2
C30 Members Choosing to Leave the Plan 11% 4.3
C31 Health Plan Quality Improvement Medicare shows only a Star Rating for this topic 3.5
C32 Plan Makes Timely Decisions about Appeals 90% 4.2
C33 Reviewing Appeals Decisions 88% 3.7
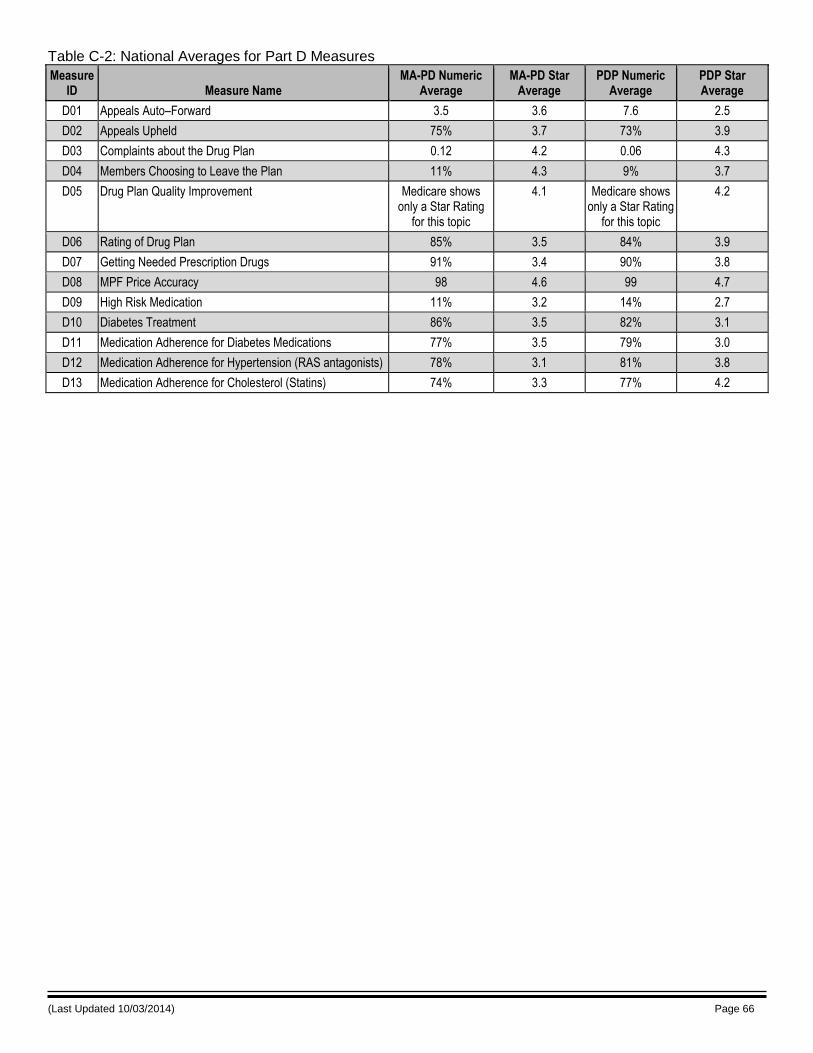
(Last Updated 10/03/2014) Page 66
Table C-2: National Averages for Part D Measures
Measure ID Measure Name
MA-PD Numeric Average
MA-PD Star Average
PDP Numeric Average
PDP Star Average
D01 Appeals Auto–Forward 3.5 3.6 7.6 2.5
D02 Appeals Upheld 75% 3.7 73% 3.9
D03 Complaints about the Drug Plan 0.12 4.2 0.06 4.3
D04 Members Choosing to Leave the Plan 11% 4.3 9% 3.7
D05 Drug Plan Quality Improvement Medicare shows only a Star Rating
for this topic
4.1 Medicare shows only a Star Rating
for this topic
4.2
D06 Rating of Drug Plan 85% 3.5 84% 3.9
D07 Getting Needed Prescription Drugs 91% 3.4 90% 3.8
D08 MPF Price Accuracy 98 4.6 99 4.7
D09 High Risk Medication 11% 3.2 14% 2.7
D10 Diabetes Treatment 86% 3.5 82% 3.1
D11 Medication Adherence for Diabetes Medications 77% 3.5 79% 3.0
D12 Medication Adherence for Hypertension (RAS antagonists) 78% 3.1 81% 3.8
D13 Medication Adherence for Cholesterol (Statins) 74% 3.3 77% 4.2
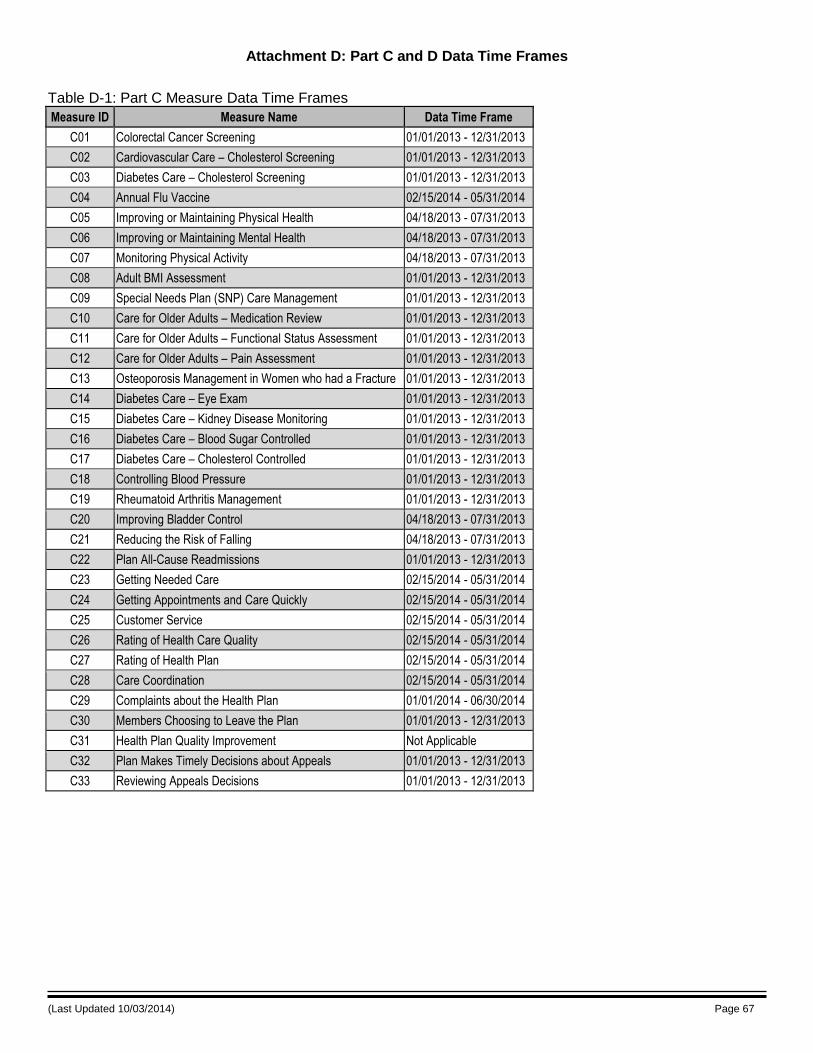
(Last Updated 10/03/2014) Page 67
Attachment D: Part C and D Data Time Frames
Table D-1: Part C Measure Data Time Frames
Measure ID Measure Name Data Time Frame
C01 Colorectal Cancer Screening 01/01/2013 - 12/31/2013
C02 Cardiovascular Care – Cholesterol Screening 01/01/2013 - 12/31/2013
C03 Diabetes Care – Cholesterol Screening 01/01/2013 - 12/31/2013
C04 Annual Flu Vaccine 02/15/2014 - 05/31/2014
C05 Improving or Maintaining Physical Health 04/18/2013 - 07/31/2013
C06 Improving or Maintaining Mental Health 04/18/2013 - 07/31/2013
C07 Monitoring Physical Activity 04/18/2013 - 07/31/2013
C08 Adult BMI Assessment 01/01/2013 - 12/31/2013
C09 Special Needs Plan (SNP) Care Management 01/01/2013 - 12/31/2013
C10 Care for Older Adults – Medication Review 01/01/2013 - 12/31/2013
C11 Care for Older Adults – Functional Status Assessment 01/01/2013 - 12/31/2013
C12 Care for Older Adults – Pain Assessment 01/01/2013 - 12/31/2013
C13 Osteoporosis Management in Women who had a Fracture 01/01/2013 - 12/31/2013
C14 Diabetes Care – Eye Exam 01/01/2013 - 12/31/2013
C15 Diabetes Care – Kidney Disease Monitoring 01/01/2013 - 12/31/2013
C16 Diabetes Care – Blood Sugar Controlled 01/01/2013 - 12/31/2013
C17 Diabetes Care – Cholesterol Controlled 01/01/2013 - 12/31/2013
C18 Controlling Blood Pressure 01/01/2013 - 12/31/2013
C19 Rheumatoid Arthritis Management 01/01/2013 - 12/31/2013
C20 Improving Bladder Control 04/18/2013 - 07/31/2013
C21 Reducing the Risk of Falling 04/18/2013 - 07/31/2013
C22 Plan All-Cause Readmissions 01/01/2013 - 12/31/2013
C23 Getting Needed Care 02/15/2014 - 05/31/2014
C24 Getting Appointments and Care Quickly 02/15/2014 - 05/31/2014
C25 Customer Service 02/15/2014 - 05/31/2014
C26 Rating of Health Care Quality 02/15/2014 - 05/31/2014
C27 Rating of Health Plan 02/15/2014 - 05/31/2014
C28 Care Coordination 02/15/2014 - 05/31/2014
C29 Complaints about the Health Plan 01/01/2014 - 06/30/2014
C30 Members Choosing to Leave the Plan 01/01/2013 - 12/31/2013
C31 Health Plan Quality Improvement Not Applicable
C32 Plan Makes Timely Decisions about Appeals 01/01/2013 - 12/31/2013
C33 Reviewing Appeals Decisions 01/01/2013 - 12/31/2013

(Last Updated 10/03/2014) Page 68
Table D-2: Part D Measure Data Time Frames
Measure ID Measure Name Data Time Frame
D01 Appeals Auto–Forward 01/01/2013 - 12/31/2013
D02 Appeals Upheld 01/01/2014 - 06/30/2014
D03 Complaints about the Drug Plan 01/01/2014 - 06/30/2014
D04 Members Choosing to Leave the Plan 01/01/2013 - 12/31/2013
D05 Drug Plan Quality Improvement Not Applicable
D06 Rating of Drug Plan 02/15/2014 - 05/31/2014
D07 Getting Needed Prescription Drugs 02/15/2014 - 05/31/2014
D08 MPF Price Accuracy 01/01/2013 - 09/30/2013
D09 High Risk Medication 01/01/2013 - 12/31/2013
D10 Diabetes Treatment 01/01/2013 - 12/31/2013
D11 Medication Adherence for Diabetes Medications 01/01/2013 - 12/31/2013
D12 Medication Adherence for Hypertension (RAS antagonists) 01/01/2013 - 12/31/2013
D13 Medication Adherence for Cholesterol (Statins) 01/01/2013 - 12/31/2013

(Last Updated 10/03/2014) Page 69
Attachment E: SNP Measure Scoring Methodologies
A. Medicare Part C Reporting Requirements Measure (C09: SNP Care Management)
Step 1: Start with all contracts that offer at least one SNP plan that was active at any point during contract year 2013.
Step 2: Exclude any PBP that is not required to report data for the contract year 2013 Part C SNP Care Reporting Requirements, based on terminations on or before the end of the contract year. This exclusion is consistent with the statement from page 4 of the CY 2013 Medicare Part C Plan Reporting Requirements Technical Specifications Document: “If a plan terminates before or at the end of its contract year (CY), it is not required to report and/or have its data validated for that CY.” This excludes:
PBPs that terminate between CY 2013 and CY 2014 according to the plan crosswalk
Contracts that terminate on or before 12/31/2013 according to the Contract Info extract
We then also exclude those that are not required to undergo data validation (DV) for the contract year 2013 Part C SNP Care Reporting Requirements, based on terminations on or before the deadline for submission of DV results to CMS. This exclusion is consistent with the following statement from page 2 of Version 3.0 of the Medicare Part C and Part D Reporting Requirements Data Validation Procedure Manual: “An sponsoring organizations that terminates its contract(s) to offer Medicare Part C and/or Part D benefits, or that is subject to a CMS termination of its contract(s), is not required to undergo a DV review for the final contract year’s reported data. Similarly, for reporting sections that are reported at the plan benefit package (PBP) level, PBPs that terminate are not required to undergo a DV review for the final year’s reported data.” This excludes: Contracts and PBP with an effective termination data that occurs between 1/1/2014 and 6/30/2014 according to the Contract Info extract
Step 3: After removing contract/PBP data excluded above, suppress contract rates based on the following rules:
Section-level DV failure: Contracts that score less than 95% in DV for their CY 2013 SNP Care Reporting Requirements data are listed as “Data Issues Found”.
Element-level DV failure: Contracts that score 95% or higher in DV for their CY 2013 SNP Care Reporting Requirements data but that failed at least one of the four data elements are listed as “Data Issues Found”.
Small size: Contracts that have not yet been suppressed and have a SNP Care Assessment rate denominator [Number of New Enrollees (Element 13.1) + Number of enrollees eligible for an annual HRA (Element 13.2)] of fewer than 30 are listed as “No Data Available”.
Step 4: Calculate the rate for the remaining contract/PBPs using the formula:
[ Number of initial HRAs performed on new enrollees (Element 13.3) + Number of annual reassessments performed (Element 13.4) ] / [ Number of new enrollees (Element 13.1) + Number of enrollees eligible for an annual HRA (Element 13.2) ]

(Last Updated 10/03/2014) Page 70
B. NCQA HEDIS Measures - (C10 - C12: Care for Older Adults)
The example NCQA measure combining methodology specifications below is written for two Plan Benefit Package (PBP) submissions, which we distinguish as 1 and 2, but the methodology easily extends to any number of submissions.
Rates are produced for any contract offering a SNP in the ratings year which provided SNP HEDIS data in the measurement year.
Definitions
Let N1 = The Total Number of Members Eligible for the HEDIS measure in the first PBP ("fixed" and auditable)
Let N2 = The Total Number of Members Eligible for the HEDIS measure in the second PBP ("fixed" and auditable)
Let P1 = The estimated rate (mean) for the HEDIS measure in the first PBP (auditable)
Let P2 = The estimated rate (mean) for the same HEDIS measure in the second PBP (auditable)
Setup Calculations
Based on the above definitions, there are two additional calculations:
Let W1 = The weight assigned to the first PBP results (estimated, auditable). This is estimated from the formula W1 = N1/( N1+N2)
Let W2 = The weight assigned to the second PBP results (estimated, auditable). This is estimated from the formula W2 = N2/( N1+N2)
Pooled Analysis
The pooled result from the two rates (means) is calculated as: Ppooled = W1*P1 + W2*P2
NOTES: Weights are based on the eligible member population. While it may be more accurate to remove all excluded members before weighting, NCQA and CMS have chosen not do this (to simplify the method) for two reasons: 1) the number of exclusions relative to the size of the population should be small, and 2) exclusion rates (as a percentage of the eligible population) should be similar for each PBP and negligibly affect the weights.
If one or more of the submissions has an audit designation of NA, those submissions are dropped and not included in the weighted rate (mean) calculations. If one or more of the submissions has a designation of NR, which has been determined to be biased or is not reported by choice of the contract, the rate is set to zero as detailed in the section titled “Handling of Biased, Erroneous and/or Not Reportable (NR) Data”.
Numeric Example Using an Effectiveness of Care Rate
# of Total Members Eligible for the HEDIS measure in PBP 1, N1 = 1500
# of Total Members Eligible for the HEDIS measure in PBP 2, N2 = 2500
HEDIS Result for PBP 1, Enter as a Proportion between 0 and 1, P1 = 0.75
HEDIS Result for PBP 2, Enter as a Proportion between 0 and 1, P2 = 0.5
Setup Calculations - Initialize Some Intermediate Results
The weight for PBP 1 product estimated by W1 = N1/( N1+N2) 0.375
The weight for PBP 2 product estimated by W2 = N2/( N1+N2) 0.625
Pooled Results
Ppooled = W1*P1 + W2*P2 0.59375

(Last Updated 10/03/2014) Page 71
Attachment F: Calculating Measure C22: Plan All-Cause Readmissions
All data come from the HEDIS 2014 M14_PCRb data file. The CMS MA HEDIS Public Use File (PUF) data can be found on this page: http://www.cms.gov/Research-Statistics-Data-and-Systems/Statistics-Trends-and-Reports/MCRAdvPartDEnrolData/index.html
Formula Value PCRb Field Field Description PUF Field
A ist6574 Count of Index Stays (Denominator) Total 65-74 UOS524-0010
D rt6574 Count of 30-Day readmissions (numerator) Total 65-74 UOS524-0020
G apt6574 Average Adjusted Probability Total 65-74 UOS524-0030
B ist7584 Count of Index Stays (Denominator) Total 75-84 UOS524-0040
E rt7584 Count of 30-Day readmissions (numerator) Total 75-84 UOS524-0050
H apt7584 Average Adjusted Probability Total 75-84 UOS524-0060
C ist85 Count of Index Stays (Denominator) Total 85+ UOS524-0070
F rt85 Count of 30-Day readmissions (numerator) Total 85+ UOS524-0080
I apt85 Average Adjusted Probability Total 85+ UOS524-0090
NatAvgObs = Average((D1 E1 F1A1 B1 C1
) (Dn En Fn
An Bn Cn)) Where 1 through n are all contracts with numeric data.
Observed = D E F
A B C
Expected = ((A
A B C) G) ((
B
A B C) H) ((
C
A B C) I)
Final Rate = ((Observed
Expected) NatAvgObs) 100
Example: Calculating the final rate for Contract 1
Formula Value PCR Field Contract 1 Contract 2 Contract 3 Contract 4
A ist6574 2,217 1,196 4,157 221
D rt6574 287 135 496 30
G apt6574 0.126216947 0.141087156 0.122390927 0.129711036
B ist7584 1,229 2,483 3,201 180
E rt7584 151 333 434 27
H apt7584 0.143395345 0.141574415 0.168403941 0.165909069
C ist85 1,346 1,082 1,271 132
F rt85 203 220 196 22
I apt85 0.165292297 0.175702614 0.182608065 0.145632638
NatAvgObs = Average ((287 151 203
2217 1229 1346) (
135 333 220
1196 2438 1082) (
496 434 196
4157 3201 1271) (
30 27 22
221 180 132))
NatAvgObs = Average ((0.13376) (0.14451) (0.13049) (0.14822))
NatAvgObs = 0.13924
Observed Contract 1 = 287 151 203
2217 1229 1346 = 0.13376
Expected Contract 1 =
(((
) ) ((
) ) ((
) ))
Expected Contract 1 = (0.058 + 0.037 + 0.046) = 0.142
Final Rate Contract 1 = (( 0.13376
0.142) 0.13924) 100 =13.1160158
Final Rate reported in the Star Ratings for Contract 1 = 13%
The actual calculated NatAvgObs value used in the 2015 Star Ratings was 0.128457540473156
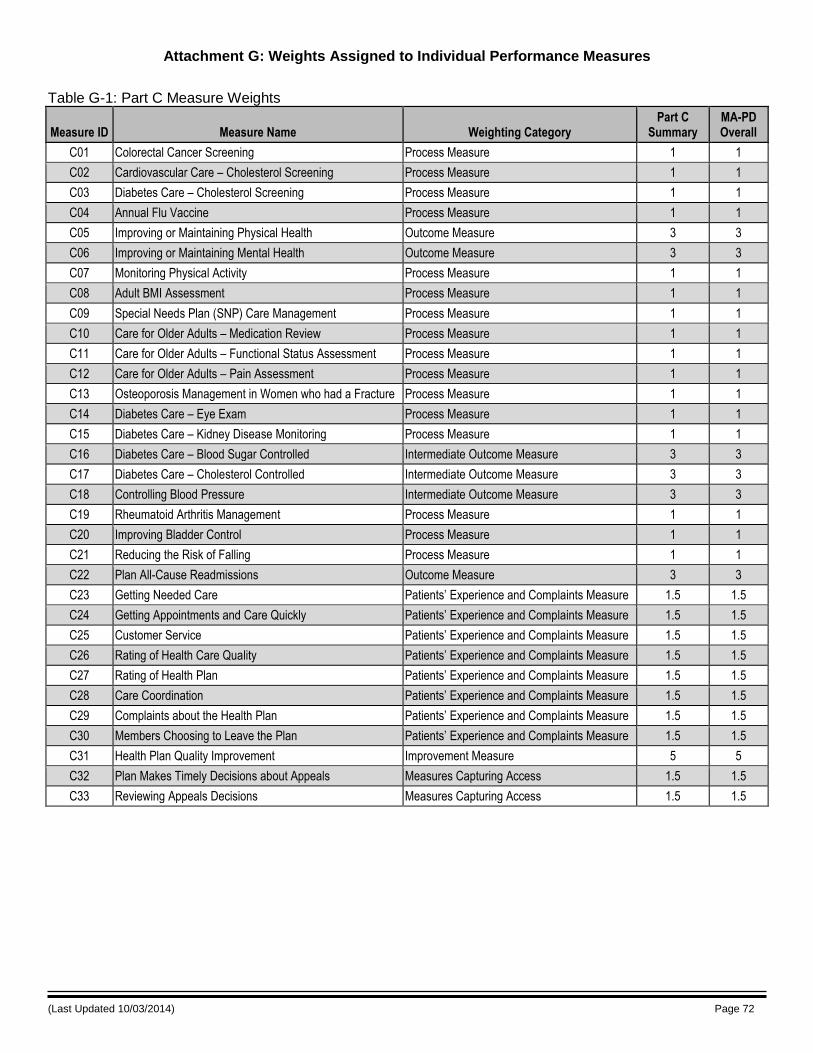
(Last Updated 10/03/2014) Page 72
Attachment G: Weights Assigned to Individual Performance Measures
Table G-1: Part C Measure Weights
Measure ID Measure Name Weighting Category Part C
Summary MA-PD Overall
C01 Colorectal Cancer Screening Process Measure 1 1
C02 Cardiovascular Care – Cholesterol Screening Process Measure 1 1
C03 Diabetes Care – Cholesterol Screening Process Measure 1 1
C04 Annual Flu Vaccine Process Measure 1 1
C05 Improving or Maintaining Physical Health Outcome Measure 3 3
C06 Improving or Maintaining Mental Health Outcome Measure 3 3
C07 Monitoring Physical Activity Process Measure 1 1
C08 Adult BMI Assessment Process Measure 1 1
C09 Special Needs Plan (SNP) Care Management Process Measure 1 1
C10 Care for Older Adults – Medication Review Process Measure 1 1
C11 Care for Older Adults – Functional Status Assessment Process Measure 1 1
C12 Care for Older Adults – Pain Assessment Process Measure 1 1
C13 Osteoporosis Management in Women who had a Fracture Process Measure 1 1
C14 Diabetes Care – Eye Exam Process Measure 1 1
C15 Diabetes Care – Kidney Disease Monitoring Process Measure 1 1
C16 Diabetes Care – Blood Sugar Controlled Intermediate Outcome Measure 3 3
C17 Diabetes Care – Cholesterol Controlled Intermediate Outcome Measure 3 3
C18 Controlling Blood Pressure Intermediate Outcome Measure 3 3
C19 Rheumatoid Arthritis Management Process Measure 1 1
C20 Improving Bladder Control Process Measure 1 1
C21 Reducing the Risk of Falling Process Measure 1 1
C22 Plan All-Cause Readmissions Outcome Measure 3 3
C23 Getting Needed Care Patients’ Experience and Complaints Measure 1.5 1.5
C24 Getting Appointments and Care Quickly Patients’ Experience and Complaints Measure 1.5 1.5
C25 Customer Service Patients’ Experience and Complaints Measure 1.5 1.5
C26 Rating of Health Care Quality Patients’ Experience and Complaints Measure 1.5 1.5
C27 Rating of Health Plan Patients’ Experience and Complaints Measure 1.5 1.5
C28 Care Coordination Patients’ Experience and Complaints Measure 1.5 1.5
C29 Complaints about the Health Plan Patients’ Experience and Complaints Measure 1.5 1.5
C30 Members Choosing to Leave the Plan Patients’ Experience and Complaints Measure 1.5 1.5
C31 Health Plan Quality Improvement Improvement Measure 5 5
C32 Plan Makes Timely Decisions about Appeals Measures Capturing Access 1.5 1.5
C33 Reviewing Appeals Decisions Measures Capturing Access 1.5 1.5

(Last Updated 10/03/2014) Page 73
Table G-2: Part D Measure Weights
Measure ID Measure Name Weighting Category Part D
Summary MA-PD Overall
D01 Appeals Auto–Forward Measures Capturing Access 1.5 1.5
D02 Appeals Upheld Measures Capturing Access 1.5 1.5
D03 Complaints about the Drug Plan Patients’ Experience and Complaints Measure 1.5 1.5
D04 Members Choosing to Leave the Plan Patients’ Experience and Complaints Measure 1.5 1.5
D05 Drug Plan Quality Improvement Improvement Measure 5 5
D06 Rating of Drug Plan Patients’ Experience and Complaints Measure 1.5 1.5
D07 Getting Needed Prescription Drugs Patients’ Experience and Complaints Measure 1.5 1.5
D08 MPF Price Accuracy Process Measure 1 1
D09 High Risk Medication Intermediate Outcome Measure 3 3
D10 Diabetes Treatment Intermediate Outcome Measure 3 3
D11 Medication Adherence for Diabetes Medications Intermediate Outcome Measure 3 3
D12 Medication Adherence for Hypertension (RAS antagonists) Intermediate Outcome Measure 3 3
D13 Medication Adherence for Cholesterol (Statins) Intermediate Outcome Measure 3 3

(Last Updated 10/03/2014) Page 74
Attachment H: Calculation of Weighted Star Rating and Variance Estimates
The weighted summary (or overall) Star Rating for contract j is estimated as:
∑
∑
where nj is the number of performance measures for which contract j is eligible; wij is the weight assigned to performance measure i for contract j; and xij is the measure star for performance measure i for contract j. The
variance of the Star Ratings for each contract j, 2
js , must also be computed in order to estimate the integration
factor (i-Factor):
( )(∑ )
[∑
( )
]
Thus, the ’s are the new summary (or overall) Star Ratings for the contracts. The variance estimate, ,
simply replaces the non-weighted variance estimate that was previously used for the i-Factor calculation. For all contracts j, wij = wi (i.e., the performance measure weights are the same for all contracts when estimating a given Star Rating (Part C or Part D summary or MA-PD overall ratings).

(Last Updated 10/03/2014) Page 75
Attachment I: Calculating the Improvement Measure and the Measures Used
Calculating the Improvement Measure
1. Contracts must have data for at least half of the attainment measures used to calculate the Part C or Part D improvement measure to be eligible to receive a rating in that improvement measure.
2. The improvement change score was determined for each measure for which a contract was eligible by calculating the difference in measure scores between Star Rating years 2014 and 2015:
Improvement Change Score = Score in 2015 - Score in 2014.
An eligible measure was defined as a measure for which a contract was scored in both the 2014 and 2015 Star Ratings and there were no significant specification changes.
3. For each measure, significant improvement or decline between Star Ratings years 2014 and 2015 was determined by a t-test at the 95% significance level:
If Improvement Change Score
Standard Error of Improvement Change Score 1.96, then YES = significant improvement
If Improvement Change Score
Standard Error of Improvement Change Score < 1.96, then YES = significant decline
4. Hold Harmless Provision for Individual Measures: If a contract demonstrated statistically significant decline (at the 0.05 significance level) on an attainment measure for which they received five stars during both the current contract year and the prior contract year, then this measure will not be included in the improvement measure calculation. Measures that are held harmless as described here will be included in the count of attainment measures used to determine improvement measure eligibility.
5. Net improvement was calculated for each class of measures (e.g., outcome, access, and process) by subtracting the total number of significantly declined measures from the total number of significantly improved measures.
Net Improvement = of significantly improved measures of significantly declined measures
6. The improvement measure score was calculated for Parts C and D separately by taking a weighted sum of net improvement divided by the weighted sum of the number of eligible measures.
Measures were weighted as follows:
a. Outcome or intermediate outcome measure: Weight of 3
b. Access or patient experience measure: Weight of 1.5
c. Process measure: Weight of 1
d. When the weight of an individual measure changes over the two years of data used, the lower weight value will be used in the improvement calculation.
Improvement Measure Score = Net Imp Process 1.5 Net Imp PtExp 3 Net Imp Outcome
Elig Process 1.5 Elig PtExp 3 Elig Outcome
Net_Imp_Process = Net improvement for process measures
Net_Imp_PtExp = Net improvement for patient experience and access measures
Net_Imp_Outcome = Net improvement for outcome and intermediate outcome measures
Elig_Process = Number of eligible process measures
Elig_PtExp = Number of eligible patient experience and access measures
Elig_Outcome = Number of eligible outcome and intermediate outcome measures

(Last Updated 10/03/2014) Page 76
7. The improvement measure score is converted into a Star Rating using the relative distribution method. Improvement scores of 0 (equivalent to no net change on the attainment measures included in the improvement measure calculation) will be centered at 3 stars when assigning the improvement measure Star Rating.
8. Contracts with 2 or fewer stars for their highest rating when calculated without improvement will not have their data calculated with the improvement measure included.
9. Hold Harmless Provision: Contracts with 4 or more stars for their highest rating that would have had their overall rating decreased with the addition of the improvement measures were held harmless. That is, the highest Star Rating would not be decreased from 4 or more stars when the improvement measures were added to the overall Star Rating calculation. In addition, the i-Factor is recalculated without the improvement measures included.
General Standard Error Formula
Because a contract’s score in one year is not independent of the score in the next year, the standard error is calculated using the standard estimation of the variance of the difference between two variables that are not necessarily independent. The standard error of the improvement change score is calculated using the formula
√ ( ) ( )
( )
Using measure C01 as an example, the change score standard error is:
( ) Represents the 2015 standard error for contract i on measure C01
( ) Represents the 2014 standard error for contract i on measure C01
Represents the 2015 rate for contract i on measure C01
Represents the 2014 rate for contract i on measure C01
Represents the covariance between and computed using the correlation across all contracts observed at both time points (2015 and 2014). In other words: ( ) ( ) ( ) ( ) where the correlation ( ) is assumed to be the same for all contracts and is computed using data for all contracts. This assumption was needed because only one score is observed for each contract in each year; therefore, it is not possible to compute the contract specific correlation.
Standard Error Numerical Example.
For measure C04, contract A:
( ) = 2.805
( ) = 3.000
( ) = 0.901
Standard error for measure C04 for contract A = sqrt (2.805^2 + 3.000^2 – 2 * 0.901 * 2.805 * 3.000) = 1.305

(Last Updated 10/03/2014) Page 77
Standard Error Formulas for Specific Measures
The following formulas are used for calculating the standard error for specific measures in the 2015 Star Ratings. These are modifications to the general standard error formula provide above to account for the specific type of data in the measure.
1. Standard Error Formula for Measures C01 - C03, C07, C08, C13 – C21, C30, C32 - C33, D02, D04, D10 – D13
√ ( )
for y = 2014, 2015 Denominatory is as defined in the Measure Details section for each measure
2. Standard Error Formula for Measures C10 – C12
These measures are rolled up from the plan level to the contract level following the formula outlined in “Attachment E: NCQA HEDIS Measures”. The standard error at the contract level is calculated as shown below. The specifications are written for two PBP submissions, which we distinguish as 1 and 2, but the methodology easily extends to any number of submissions.
The plan level standard error is calculated as:
√ ( )
for y = 2014, 2015 and j = Plan 1, Plan 2
The contract level standard error is then calculated as:
Let Wy1 = The weight assigned to the first PBP results (estimated, auditable) for year y, where y = 2014, 2015. This result is estimated by the formula Wy1 = Ny1 / (Ny1 + Ny2)
Let Wy2 = The weight assigned to the second PBP results (estimated, auditable) for year y, where y = 2014, 2015. This result is estimated by the formula Wy2 = Ny2 / (Ny1 + Ny2)
√( ) ( )
( ) ( )
for y = Contract Year 2014, Contract Year 2015 and i = Contract i
3. Standard Error Formula for C22
√
( )
for y = 2014, 2015
The formulas for the Observed Count of Readmissions, Expected Count of Readmissions, and the NatAvgObs are explained in “Attachment F: Calculating Measure C22: Plan All-Cause Readmissions”.
4. Standard Error Formula for Measures C04, C23 – C28, and D06 – D07
The CAHPS measure standard errors for 2014 and 2015 were provided by the CAHPS contractor. The actual values used for each contract can be requested from the Part C and Part D rating or CAHPS mailboxes.

(Last Updated 10/03/2014) Page 78
5. Standard Error Formulas for Measures C29 and D03
√
( )
√
( )
6. Standard Error Formula for Measure D01
√
( )

(Last Updated 10/03/2014) Page 79
Table I-1: Part C Measures Used in the Improvement Measure
Measure ID Measure Name Measure Usage Correlation
C01 Colorectal Cancer Screening Included 0.89456
C02 Cardiovascular Care – Cholesterol Screening Included 0.803247
C03 Diabetes Care – Cholesterol Screening Included 0.794436
C04 Annual Flu Vaccine Included 0.910568
C05 Improving or Maintaining Physical Health Not Included -
C06 Improving or Maintaining Mental Health Not Included -
C07 Monitoring Physical Activity Included 0.813248
C08 Adult BMI Assessment Included 0.718029
C09 Special Needs Plan (SNP) Care Management Not Included -
C10 Care for Older Adults – Medication Review Included 0.57711
C11 Care for Older Adults – Functional Status Assessment Included 0.730832
C12 Care for Older Adults – Pain Assessment Included 0.566504
C13 Osteoporosis Management in Women who had a Fracture Included 0.836272
C14 Diabetes Care – Eye Exam Included 0.833519
C15 Diabetes Care – Kidney Disease Monitoring Included 0.76241
C16 Diabetes Care – Blood Sugar Controlled Included 0.72397
C17 Diabetes Care – Cholesterol Controlled Included 0.802521
C18 Controlling Blood Pressure Included 0.729126
C19 Rheumatoid Arthritis Management Included 0.789119
C20 Improving Bladder Control Included 0.330941
C21 Reducing the Risk of Falling Included 0.813272
C22 Plan All-Cause Readmissions Included 0.600547
C23 Getting Needed Care Included 0.743376
C24 Getting Appointments and Care Quickly Included 0.867657
C25 Customer Service Included 0.719825
C26 Rating of Health Care Quality Included 0.767699
C27 Rating of Health Plan Included 0.837379
C28 Care Coordination Included 0.802015
C29 Complaints about the Health Plan Included 0.610724
C30 Members Choosing to Leave the Plan Included 0.656196
C31 Health Plan Quality Improvement Not Included -
C32 Plan Makes Timely Decisions about Appeals Included 0.412414
C33 Reviewing Appeals Decisions Included 0.538753

(Last Updated 10/03/2014) Page 80
Table I-2: Part D Measures Used in the Improvement Measure
Measure ID Measure Name Measure Usage Correlation
D01 Appeals Auto–Forward Included 0.241484
D02 Appeals Upheld Included 0.366197
D03 Complaints about the Drug Plan Included 0.626331
D04 Members Choosing to Leave the Plan Included 0.643768
D05 Drug Plan Quality Improvement Not Included -
D06 Rating of Drug Plan Included 0.769787
D07 Getting Needed Prescription Drugs Included 0.70406
D08 MPF Price Accuracy Not Included -
D09 High Risk Medication Not Included -
D10 Diabetes Treatment Included 0.88755
D11 Medication Adherence for Diabetes Medications Included 0.869493
D12 Medication Adherence for Hypertension (RAS antagonists) Included 0.917907
D13 Medication Adherence for Cholesterol (Statins) Included 0.951522

(Last Updated 10/03/2014) Page 81
Attachment J: Star Ratings Measure History
The tables below cross reference the measures code in each of the Star Ratings releases over the past eight years. Measure codes that begin with
DM are display measures which are posted on CMS.gov on this page: http://go.cms.gov/partcanddstarratings.
Table J-1: Part C Measure History
Part Measure Name Data Source 2015 2014 2013 2012 2011 2010 2009 2008 Notes
C Access to Primary Care Doctor Visits HEDIS DMC10 DMC12 DMC12 C11 C13 C12 C13 C09
C Adult BMI Assessment HEDIS C08 C10 C10 C12 DMC05
C Annual Flu Vaccine CAHPS C04 C06 C06 C06 C07 C06 C07 C07
C Antidepressant Medication Management (6 months) HEDIS DMC03 DMC03 DMC03 DMC03 DMC03 DMC04 C28 C23
C Appropriate Monitoring of Patients Taking Long-term Medications HEDIS DMC05 DMC05 DMC05 DMC05 C06 C05 C06 C06
C Beneficiary Access and Performance Problems Administrative Data DME08 C31 C31 C32 C33 C30
C Breast Cancer Screening HEDIS DMC22 C01 C01 C01 C01 C01 C01 C01
C Call Answer Timeliness HEDIS DMC02 DMC02 DMC02 DMC02 DMC02 DMC01 C20 C16
C Calls Disconnected - Beneficiary Call Center DMC15 DMC15
C Cardiovascular Care – Cholesterol Screening HEDIS C02 C03 C03 C03 C03 C03 C03 A
C Care Coordination CAHPS C28 C29 C29
C Care for Older Adults – Functional Status Assessment HEDIS C11 C12 C12 C14
C Care for Older Adults – Medication Review HEDIS C10 C11 C11 C13
C Care for Older Adults – Pain Assessment HEDIS C12 C13 C13 C15
C Cholesterol Screening HEDIS C03 B
C Colorectal Cancer Screening HEDIS C01 C02 C02 C02 C02 C02 C02 C02
C Complaints about the Health Plan CTM C29 C30 C30 C31 C30 C26
C Continuous Beta Blocker Treatment HEDIS DMC04 DMC04 DMC04 DMC04 DMC04 DMC05 C32 C27
C Controlling Blood Pressure HEDIS C18 C19 C19 C21 C19 C15 C29 C24
C CSR Understandability Call Center DMC02
C Customer Service CAHPS C25 C26 C26 C28 C27 C23 C22
C Diabetes Care HEDIS C14 C
C Diabetes Care – Blood Sugar Controlled HEDIS C16 C17 C17 C19 C17 C26 C21 D
C Diabetes Care – Cholesterol Controlled HEDIS C17 C18 C18 C20 C18 C27 C22 D
C Diabetes Care – Cholesterol Screening HEDIS C03 C04 C04 C04 C04 C04 C04 A
C Diabetes Care – Eye Exam HEDIS C14 C15 C15 C17 C15 C24 C19 D
C Diabetes Care – Kidney Disease Monitoring HEDIS C15 C16 C16 C18 C16 C25 C20 D
C Doctor Follow up for Depression HEDIS C15 C11
C Doctors who Communicate Well CAHPS DMC08 DMC08 DMC08 DMC08 C25 C21 C21 C17
C Engagement of Alcohol or other Drug Treatment HEDIS DMC15 DMC19

(Last Updated 10/03/2014) Page 82
Part Measure Name Data Source 2015 2014 2013 2012 2011 2010 2009 2008 Notes
C Enrollment Timeliness MARx DME01 DME01 C37
C Follow-up visit after Hospital Stay for Mental Illness (within 30 days of Discharge) HEDIS DMC01 DMC01 DMC01 DMC01 DMC01 DMC03 C14 C10
C Getting Appointments and Care Quickly CAHPS C24 C25 C25 C27 C26 C22 C17 C13
C Getting Needed Care CAHPS C23 C24 C24 C26 C24 C20 C16 C12
C Glaucoma Testing HEDIS C05 C05 C05 C05 C04 C05 C05
C Grievance Rate Plan Reporting DME02 DMC13 DMC13
C Health Plan Quality Improvement Star Ratings C31 C33 C33
C Hold Time - Beneficiary Call Center DMC09 DMC09 DMC09 C34 C31
C Improving Bladder Control HEDIS / HOS C20 C21 C21 C23 C22 C18 C33
C Improving or Maintaining Mental Health HOS C06 C08 C08 C09 C10 C09 C10
C Improving or Maintaining Physical Health HOS C05 C07 C07 C08 C09 C08 C09
C Information Accuracy - Beneficiary Call Center DMC10 DMC10 DMC10 C35 C32
C Initiation of Alcohol or other Drug Treatment HEDIS DMC14 DMC18
C Members Choosing to Leave the Plan MBDSS C30 C32 C32 C33 DMC06 C29
C Monitoring Physical Activity HEDIS / HOS C07 C09 C09 C10 C12 C11 C12
C Osteoporosis Management in Women who had a Fracture HEDIS C13 C14 C14 C16 C14 C13 C23 C18
C Osteoporosis Testing HEDIS / HOS DMC06 DMC06 DMC06 DMC06 C11 C10 C11
C Pharmacotherapy Management of COPD Exacerbation – Bronchodilator HEDIS DMC13 DMC17
C Pharmacotherapy Management of COPD Exacerbation – Systemic Corticosteroid HEDIS DMC12 DMC16
C Plan All-Cause Readmissions HEDIS C22 C23 C23 C25
C Plan Makes Timely Decisions about Appeals IRE / Maximus C32 C34 C34 C34 C31 C27 C35 C28
C Pneumonia Vaccine CAHPS DMC09 DMC11 DMC11 C07 C08 C07 C08 C08
C Rating of Health Care Quality CAHPS C26 C27 C27 C29 C28 C24 C18 C14
C Rating of Health Plan CAHPS C27 C28 C28 C30 C29 C25 C19 C15
C Reducing the Risk of Falling HEDIS / HOS C21 C22 C22 C24 C23 C19 C34
C Reviewing Appeals Decisions IRE / Maximus C33 C35 C35 C35 C32 C28 C36 C29
C Rheumatoid Arthritis Management HEDIS C19 C20 C20 C22 C20 C16 C30 C25
C Special Needs Plan (SNP) Care Management Plan Reporting C09 / DMC11 DMC14 DMC14
C Testing to Confirm Chronic Obstructive Pulmonary Disease HEDIS DMC07 DMC07 DMC07 DMC07 C21 C17 C31 C26
C TTY & Language - Beneficiary Call Center C36 C36 C36 C36 C33
Notes: A: Part of composite measure Cholesterol Screening in 2010 B: Composite Measure - combined Cardiovascular Care – Cholesterol Screening and Diabetes Care – Cholesterol Screening measures C: Composite Measure - combined Diabetes Care – Blood Sugar Controlled, Diabetes Care – Cholesterol Controlled, Diabetes Care – Eye Exam and Diabetes Care – Kidney
Disease Monitoring measures D: Part of composite measure Diabetes Care in 2010

(Last Updated 10/03/2014) Page 83
Table J-2: Part D Measure History
Part Measure Name Data Source 2015 2014 2013 2012 2011 2010 2009 2008 Notes
D 4Rx Timeliness Acumen/OIS (4Rx) DMD03 D07 D07 D09
D Adherence - Proportion of Days Covered PDE Data DMD07
D Appeals Auto–Forward IRE / Maximus D01 D02 D03 D03 D05 D05 D05 D13
D Appeals Upheld IRE / Maximus D02 D03 D04 D04 D06 D06 D06 D14
D Beneficiary Access and Performance Problems Administrative Data DME08 D05 D07 D07 D10 D11
D Calls Disconnected - Beneficiary Call Center DMD03 DMD03 DMD04 DMD04 DMD04 D02 D02
D Calls Disconnected - Pharmacist Call Center DMD05 D04 D04
D Complaint Resolution CTM DMD07
D Complaints - Benefits CTM D07 D11
D Complaints - Enrollment CTM D08 D08 D08 D12
D Complaints - Other CTM D09 D09 D10
D Complaints - Pricing CTM D09 D17
D Complaints about the Drug Plan CTM D03 D04 D06 D06 D05
D CSR Understandability Call Center DMD06
D Diabetes Medication Dosing PDE Data DMD04 DMD07 DMD07 DMD08 DMD06 DMD09
D Diabetes Treatment PDE Data D10 D12 D15 D14 D17 D19
D Drug Plan Provides Current Information on Costs and Coverage for Medicare’s Website Acumen/OIS (LIS Match Rates) DMD05 DMD08 DMD08 DMD09 D14 D15 D15 D10
D Drug Plan Quality Improvement Star Ratings D05 D07 D09
D Drug-Drug Interactions PDE Data DMD03 DMD06 DMD06 DMD07 DMD05 DMD08
D Enrollment Timeliness MARx DME01 DME01 D05 D05 DMD03 DMD03
D Getting Information From Drug Plan CAHPS DMD09 DMD14 D10 D09 D11 D12 D12 D06
D Getting Needed Prescription Drugs CAHPS D07 D09 D12 D11 D13 D14 D14 D08
D Grievances Plan Reporting DME02 DMD11 DMD11
D High Risk Medication PDE Data D09 D11 D14 D13 D16 D18 D19
D Hold Time - Beneficiary Call Center DMD04 DMD04 DMD05 D01 D01 D01 D01
D Hold Time - Pharmacist Call Center DMD15 D01 D01 D02 D02 D03 D03
D Information Accuracy - Beneficiary Call Center DMD05 DMD05 DMD06 D03 D03
D Medication Adherence for Cholesterol (Statins) PDE Data D13 D15 D18 D17
D Medication Adherence for Diabetes Medications PDE Data D11 D13 D16 D15
D Medication Adherence for Hypertension (RAS antagonists) PDE Data D12 D14 D17 D16
D MTM Program Completion Rate for Comprehensive Medication Reviews PDE Data DMD07 DMD12 DMD12
D Member Retention MBDSS D11
D Members Choosing to Leave the Plan MBDSS D04 D06 D08 D08 DMD09 D10
D MPF - Composite Plan Finder Data D12 D15 B
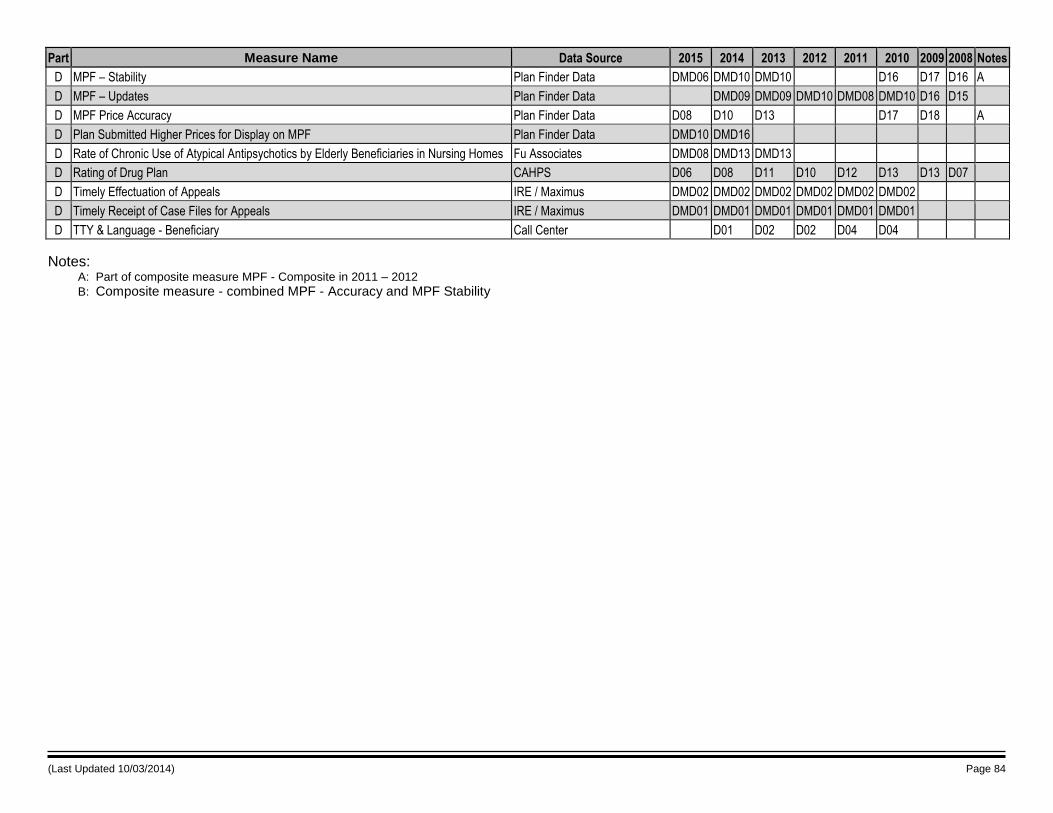
(Last Updated 10/03/2014) Page 84
Part Measure Name Data Source 2015 2014 2013 2012 2011 2010 2009 2008 Notes
D MPF – Stability Plan Finder Data DMD06 DMD10 DMD10 D16 D17 D16 A
D MPF – Updates Plan Finder Data DMD09 DMD09 DMD10 DMD08 DMD10 D16 D15
D MPF Price Accuracy Plan Finder Data D08 D10 D13 D17 D18 A
D Plan Submitted Higher Prices for Display on MPF Plan Finder Data DMD10 DMD16
D Rate of Chronic Use of Atypical Antipsychotics by Elderly Beneficiaries in Nursing Homes Fu Associates DMD08 DMD13 DMD13
D Rating of Drug Plan CAHPS D06 D08 D11 D10 D12 D13 D13 D07
D Timely Effectuation of Appeals IRE / Maximus DMD02 DMD02 DMD02 DMD02 DMD02 DMD02
D Timely Receipt of Case Files for Appeals IRE / Maximus DMD01 DMD01 DMD01 DMD01 DMD01 DMD01
D TTY & Language - Beneficiary Call Center D01 D02 D02 D04 D04
Notes: A: Part of composite measure MPF - Composite in 2011 – 2012
B: Composite measure - combined MPF - Accuracy and MPF Stability

(Last Updated 10/03/2014) Page 85
Attachment K: Individual Measure Star Assignment Process
This attachment illustrates detailed steps of the clustering method to develop individual measure stars. For each measure, the clustering method does the following:
1. Produces the individual measure distance matrix.
2. Groups the measure scores into an initial set of clusters.
3. Selects the final set of clusters.
1. Produce the individual measure distance matrix.
For each pair of contracts j and k (j>=k) among the n contracts with measure score data, compute the Euclidian distance of their measure scores (e.g., the absolute value of the difference between the two measure scores). Enter this distance in row j and column k of a distance matrix with n rows and n columns. This matrix can be produced using the DISTANCE procedure in SAS as follows: proc distance data=inclusterdat out=distancedat method=Euclid; var interval(measure_score); id contract_id; run;
In the above code, the input data set, inclusterdat, is the list of contracts without missing, flagged, or voluntary contract scores for a particular measure. Each record has a unique contract identifier, contract_id. The option method=Euclid specifies that distances between contract measure scores should be based on Euclidean distance. The input data contain a variable called measure_score that is formatted to the display criteria outlined in the Technical Notes. In the var call, the parentheses around measure_score indicate that measure_score is considered to be an interval or numeric variable. The distances computed by this code are stored to an output data set called distancedat.
2. Create a tree of cluster assignments.
The distance matrix calculated in Step 1 is the input to the clustering procedure. The stored distance algorithm is implemented to compute cluster assignments. The following process is implemented by using the CLUSTER procedure in SAS:
a. The input measure score distances are squared.
b. The clusters are initialized by assigning each contract to its own cluster.
c. In order to determine which pair of clusters to merge, Ward’s minimum variance method is used to
separate the variance of the measure scores into within-cluster and between-cluster sum of squares
components.
d. From the existing clusters, two clusters will be selected for merging to minimize the within-cluster sum
of squares over all possible sets of clusters that might result from a merge.
e. Steps b and c are repeated to reduce the number of clusters by one until a single cluster containing all
contracts results.
The result is a data set that contains a tree-like structure of cluster assignments, from which any number of clusters between 1 and the number of contract measure scores could be computed. The SAS code for implementing these steps is:
proc cluster data=distancedat method=ward outtree=treedat noprint; id contract_id; run;
(Last Updated 10/03/2014) Page 86
The distancedat data set containing the Euclidian distances was created in Step 1. The option method=ward indicates that Ward’s minimum variance method should be used to group clusters. The output data set is denoted with the outtree option and is called treedat.
3. Select the final set of clusters from the tree of cluster assignments.
The process outlined in Step 2 will produce a tree of cluster assignments, from which the final number of clusters is selected using the TREE procedure in SAS as follows: proc tree data=treedat ncl=NSTARS horizontal out=outclusterdat noprint; id contract_id; run;
The input data set, treedat, is created in Step 2 above. The syntax, ncl=NSTARS, denotes the desired final number of clusters (or star levels). For measures without a predetermined threshold, NSTARS typically equals 5. For measures with a predetermined threshold, the clustering is conducted separately for contract measure score that meet or exceed the threshold versus others. Specifically, when higher scores are better, Steps 1-3 are first applied to contract measure scores that meet or exceed the predetermined threshold, in which case NSTARS equals the number of possible star ratings among that subset of contracts. For most contracts with a predetermined threshold and for which higher scores are better, NSTARS=2 since these contracts will either receive 4- or 5-star ratings; however, for the improvement measures, NSTARS=3 given that 0 (no net improvement) is effectively treated as a predetermined threshold for this calculation. Next, Steps 1-3 are applied only to contract measure scores that are less than the predetermined threshold. For non-improvement measures for which higher scores are better, NSTARS=3 so that contracts less than the predetermined threshold can be assigned to one of three star categories; NSTARS=2 for the improvement measures in this case. The analogous approach is used when there are predetermined thresholds and lower scores imply better performance.
Final Threshold and Star Creation
The cluster assignments produced by the above approach have cluster labels that are unordered. The final step after applying the above steps to all contract measure scores is to order the cluster labels so that the 5-star category reflects the cluster with the best performance and the 1-star category reflects the cluster with the worst performance. The measure thresholds that are not predetermined are defined by examining the range of measure scores within each of the final clusters.

(Last Updated 10/03/2014) Page 87
Attachment L: Medication Adherence Measure Calculations
Part D sponsors currently have access to monthly Patient Safety Reports via the Patient Safety Analysis Website to compare their performance to overall averages and monitor their progress in improving the Part D patient safety measures over time. Sponsors are required to use the website to view and download the reports and should be engaged in performance monitoring.
Report User Guides are available on the website under Help Documents and provide detailed information about the measure calculations and reports. The following information is an excerpt from the Adherence Measures Report Guide (Appendices B and C) and illustrates the days covered calculation and the modification for inpatient stays, hospice enrollments, and skilled nursing facility stays.
Days Covered Calculation
In calculating the Proportion of Days Covered (PDC), we first count the number of days the patient was “covered” by at least one drug in the therapeutic area. This number of days is based on the prescription fill date and days of supply. The number of covered days is divided by the number of days in the measurement period. Both of these numbers may be adjusted for IP stays, as described in the ‘Days Covered Modification for Inpatient Stays, Hospice Enrollment and Skilled Nursing Facility Stays’ section that follows.
In the first example below, a beneficiary is taking Benazepril and Captopril, two drugs in the RAS antagonist hypertension therapeutic area. The covered days do not overlap, meaning the patient filled the Captopril prescription the day after the days supply for the Benazepril medication ended.
Example 1: Non-Overlapping Fills of Two Different Drugs
January February March
1/1/2013 1/16/2013 2/1/2013 2/16/2013 3/1/2013 3/16/2013
Benazepril 15 16 15 14
Captopril 15 16
Calculation
Covered Days = 90
Measurement Period = 90
PDC = 100%
If a beneficiary refills the same drug (defined at the generic level) prior to the end of the days supply of the first fill, then we adjust the days covered to account for the overlap in days covered.
Example 2: Overlapping Fills of the Same Drug
January February March
1/1/2013 1/16/2013 2/1/2013 2/16/2013 3/1/2013 3/16/2013
Lisinopril 15 16
Lisinopril 16 15
Lisinopril 15 14
Calculation
Covered Days = 91
Measurement Period = 90
PDC = 100% (PDC > 100% rounded to 100%)

(Last Updated 10/03/2014) Page 88
This adjustment is only made for fills for the same drug. A drug/medication is defined at the generic ingredient level in the overlapping fills adjustment. Thus a beneficiary who changes dosage or switches to a medication with the same active ingredient would still be considered to be taking the same medication. The adjustment is applied using the generic ingredient name variable from the Medi-Span database. This variable is consistent with the Generic Drug Name variable listed in the PQA medication list (populated with GPI generic name variable from Medi-Span), without the strength and form of the medication.
In the third example, a beneficiary is refilling both Lisinopril and Captopril. When the two Lisinopril prescriptions overlap, we make the adjustment described in Example 2. When Lisinopril overlaps with Captopril, we do not make any adjustment in the days covered.
Example 3: Overlapping Fills of the Same and Different Drugs
January February March April
1/1/2013 1/16/2013 2/1/2013 2/16/2013 3/1/2013 3/16/2013 4/1/2013 4/16/2013
Lisinopril 15 16
Lisinopril 16 15
Captopril 15 16
Lisinopril 16 15
Calculation
Covered Days = 108
Measurement Period = 120
PDC = 90%
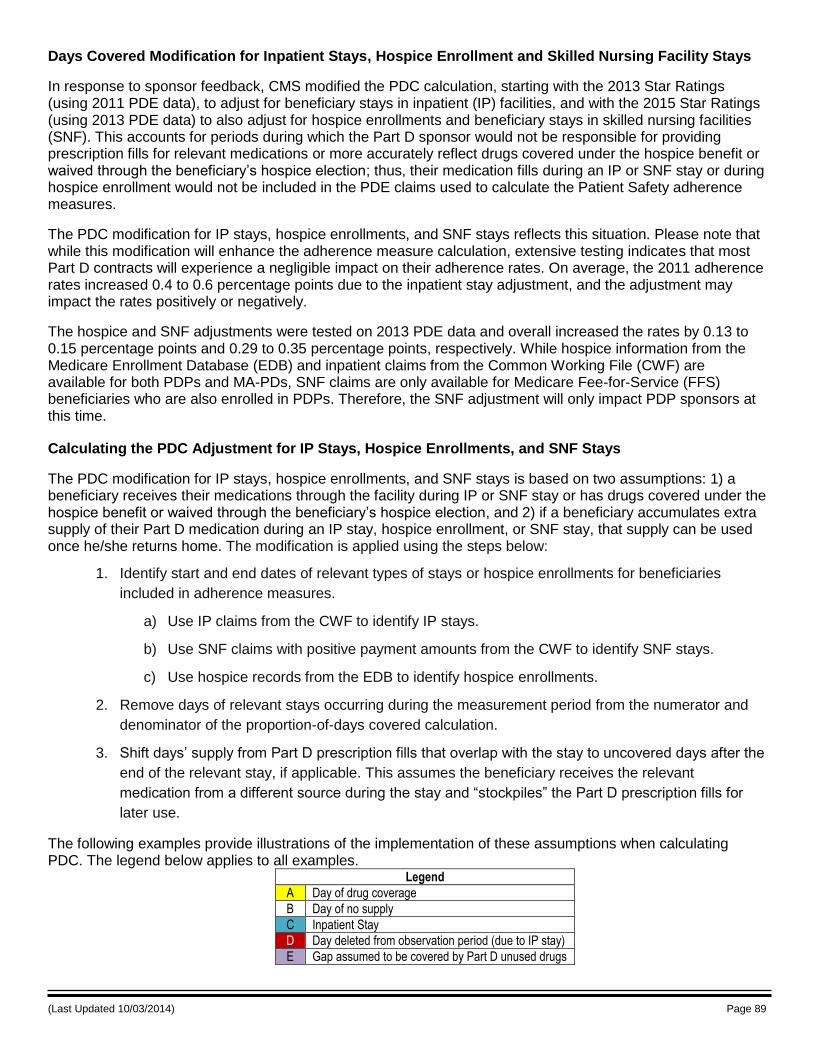
(Last Updated 10/03/2014) Page 89
Days Covered Modification for Inpatient Stays, Hospice Enrollment and Skilled Nursing Facility Stays
In response to sponsor feedback, CMS modified the PDC calculation, starting with the 2013 Star Ratings (using 2011 PDE data), to adjust for beneficiary stays in inpatient (IP) facilities, and with the 2015 Star Ratings (using 2013 PDE data) to also adjust for hospice enrollments and beneficiary stays in skilled nursing facilities (SNF). This accounts for periods during which the Part D sponsor would not be responsible for providing prescription fills for relevant medications or more accurately reflect drugs covered under the hospice benefit or waived through the beneficiary’s hospice election; thus, their medication fills during an IP or SNF stay or during hospice enrollment would not be included in the PDE claims used to calculate the Patient Safety adherence measures.
The PDC modification for IP stays, hospice enrollments, and SNF stays reflects this situation. Please note that while this modification will enhance the adherence measure calculation, extensive testing indicates that most Part D contracts will experience a negligible impact on their adherence rates. On average, the 2011 adherence rates increased 0.4 to 0.6 percentage points due to the inpatient stay adjustment, and the adjustment may impact the rates positively or negatively.
The hospice and SNF adjustments were tested on 2013 PDE data and overall increased the rates by 0.13 to 0.15 percentage points and 0.29 to 0.35 percentage points, respectively. While hospice information from the Medicare Enrollment Database (EDB) and inpatient claims from the Common Working File (CWF) are available for both PDPs and MA-PDs, SNF claims are only available for Medicare Fee-for-Service (FFS) beneficiaries who are also enrolled in PDPs. Therefore, the SNF adjustment will only impact PDP sponsors at this time.
Calculating the PDC Adjustment for IP Stays, Hospice Enrollments, and SNF Stays
The PDC modification for IP stays, hospice enrollments, and SNF stays is based on two assumptions: 1) a beneficiary receives their medications through the facility during IP or SNF stay or has drugs covered under the hospice benefit or waived through the beneficiary’s hospice election, and 2) if a beneficiary accumulates extra supply of their Part D medication during an IP stay, hospice enrollment, or SNF stay, that supply can be used once he/she returns home. The modification is applied using the steps below:
1. Identify start and end dates of relevant types of stays or hospice enrollments for beneficiaries
included in adherence measures.
a) Use IP claims from the CWF to identify IP stays.
b) Use SNF claims with positive payment amounts from the CWF to identify SNF stays.
c) Use hospice records from the EDB to identify hospice enrollments.
2. Remove days of relevant stays occurring during the measurement period from the numerator and
denominator of the proportion-of-days covered calculation.
3. Shift days’ supply from Part D prescription fills that overlap with the stay to uncovered days after the
end of the relevant stay, if applicable. This assumes the beneficiary receives the relevant
medication from a different source during the stay and “stockpiles” the Part D prescription fills for
later use.
The following examples provide illustrations of the implementation of these assumptions when calculating PDC. The legend below applies to all examples.
Legend
A Day of drug coverage
B Day of no supply
C Inpatient Stay
D Day deleted from observation period (due to IP stay)
E Gap assumed to be covered by Part D unused drugs

(Last Updated 10/03/2014) Page 90
Example 1 – IP Stay with excess post-IP coverage gap
In this simplified example, one assumes the measurement period is 15 days and the beneficiary qualifies for inclusion in the measure by receiving at least 2 fills. This beneficiary had drug coverage, according to our current assignment of days of supply based on fill dates and days of supply reported through PDE claims data, on days 1-8 and 12-15. They also had an IP stay on days 5 and 6. Before the modification, as illustrated in Figure 1 below, the beneficiary’s PDC is equivalent to 12 days covered out of 15, or 80%.
Figure 1: Drug Coverage Assigned Before Modification in Example 1 Days
1 2 3 4 5 6 7 8 9 10 11 12 13 14 15
Drug Coverage A A A A A A A A B B B A A A A
Inpatient Stays B B B B C C B B B B B B B B B
After the modification, as illustrated in Figure 2 below, the beneficiary’s PDC is equivalent to 12 days covered out of 13, or 92.3%. This change in PDC before and after the modification occurs because days 5 and 6 (the days of IP stay) are deleted from the measurement period. Additionally, the drug coverage during the IP stay is shifted to subsequent days of no supply (in this case, days 9 and 10), based on the assumption that if a beneficiary received their medication through the hospital on days 5 and 6, then they accumulated two extra days of supply during the inpatient stay. That extra supply is used to cover gaps in Part D drug coverage in days 9 and 10.
Figure 2: Drug Coverage Assigned After Modification in Example 1 Days
1 2 3 4 5 6 7 8 9 10 11 12 13 14 15
Drug Coverage A A A A D D A A E E B A A A A
Inpatient Stays B B B B D D B B B B B B B B B
Example 2 – IP stay with post-IP coverage gap < IP length of stay
In this simplified example, one assumes the measurement period is 15 days and the beneficiary qualifies for inclusion in the measure by receiving at least 2 fills. This beneficiary had drug coverage from days 1-3, 6-9, and 12-15, according to our current assignment of days of supply based on fill dates and days of supply reported through PDE claims data. They also had an IP stay on days 6-9. Before the modification, as illustrated in Figure 3 below, the beneficiary’s PDC is equivalent to 11 days covered out of 15, or 73.3%.
Figure 3: Drug Coverage Assigned Before Modification in Example 2 Days
1 2 3 4 5 6 7 8 9 10 11 12 13 14 15
Drug Coverage A A A B B A A A A B B A A A A
Inpatient Stays B B B B B C C C C B B B B B B
After the modification, as illustrated in Figure 4 below, the beneficiary’s PDC is equivalent to 9 days covered out of 11, or 81.8%. This change in PDC before and after the modification occurs because days 6-9 are deleted from the measurement period. Additionally, the drug coverage during the IP stay can be applied to any days of no supply after the IP stay, based on the assumption that the beneficiary received their medication through the hospital on days 6-9. In this case, there are only two days of no supply after the IP stay (days 10 and 11), so two days of supply are “rolled over” to days 10 and 11.
Figure 4: Drug Coverage Assigned After Modification in Example 2 Days
1 2 3 4 5 6 7 8 9 10 11 12 13 14 15
Drug Coverage A A A B B D D D D E E A A A A
Inpatient Stays B B B B B D D D D B B B B B B

(Last Updated 10/03/2014) Page 91
Example 3 – IP stay with no post-IP coverage gap
In this simplified example, one assumes the measurement period is 15 days and the beneficiary qualifies for inclusion in the measure by receiving at least 2 fills. This beneficiary had drug coverage from days 1-7 and 12-15, according to our current assignment of days of supply based on fill dates and days of supply reported through PDE claims data. They also had an IP stay from days 12-13. Before the modification, as illustrated in Figure 5 below, the beneficiary’s PDC is equivalent to 11 days covered out of 15, or 73.3%.
Figure 5: Drug Coverage Assigned Before Modification in Example 3 Days
1 2 3 4 5 6 7 8 9 10 11 12 13 14 15
Drug Coverage A A A A A A A B B B B A A A A
Inpatient Stays B B B B B B B B B B B C C B B
After the modification, as illustrated in Figure 6 below, the beneficiary’s PDC is equivalent to 9 days covered out of 13, or 69.2%. This change in PDC before and after the modification occurs because days 12-13 are deleted from the measurement period (denominator). Additionally, the two days of supply from days 12-13 cannot be applied to any days of no supply after the IP stay.
Figure 6: Drug Coverage Assigned After Modification in Example 3 Days
1 2 3 4 5 6 7 8 9 10 11 12 13 14 15
Drug Coverage A A A A A A A B B B B D D A A
Inpatient Stays B B B B B B B B B B B D D B B
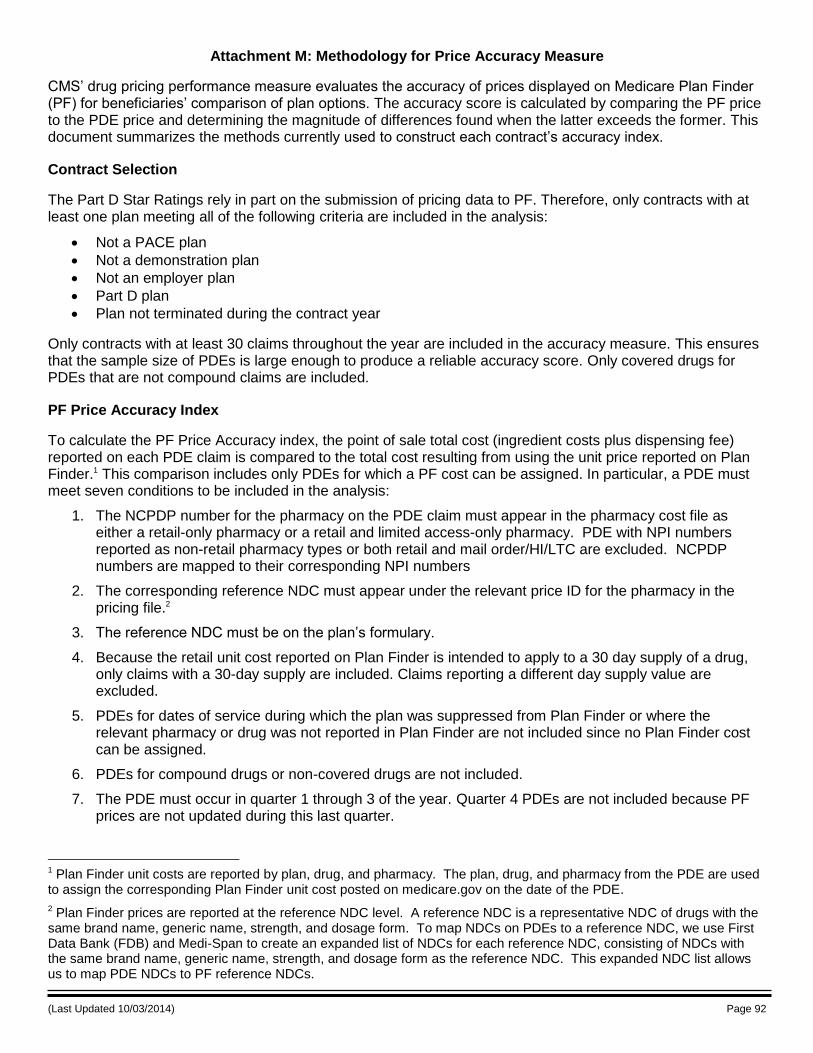
(Last Updated 10/03/2014) Page 92
Attachment M: Methodology for Price Accuracy Measure
CMS’ drug pricing performance measure evaluates the accuracy of prices displayed on Medicare Plan Finder (PF) for beneficiaries’ comparison of plan options. The accuracy score is calculated by comparing the PF price to the PDE price and determining the magnitude of differences found when the latter exceeds the former. This document summarizes the methods currently used to construct each contract’s accuracy index.
Contract Selection
The Part D Star Ratings rely in part on the submission of pricing data to PF. Therefore, only contracts with at least one plan meeting all of the following criteria are included in the analysis:
Not a PACE plan
Not a demonstration plan
Not an employer plan
Part D plan
Plan not terminated during the contract year
Only contracts with at least 30 claims throughout the year are included in the accuracy measure. This ensures that the sample size of PDEs is large enough to produce a reliable accuracy score. Only covered drugs for PDEs that are not compound claims are included.
PF Price Accuracy Index
To calculate the PF Price Accuracy index, the point of sale total cost (ingredient costs plus dispensing fee) reported on each PDE claim is compared to the total cost resulting from using the unit price reported on Plan Finder.1 This comparison includes only PDEs for which a PF cost can be assigned. In particular, a PDE must meet seven conditions to be included in the analysis:
1. The NCPDP number for the pharmacy on the PDE claim must appear in the pharmacy cost file as either a retail-only pharmacy or a retail and limited access-only pharmacy. PDE with NPI numbers reported as non-retail pharmacy types or both retail and mail order/HI/LTC are excluded. NCPDP numbers are mapped to their corresponding NPI numbers
2. The corresponding reference NDC must appear under the relevant price ID for the pharmacy in the pricing file.2
3. The reference NDC must be on the plan’s formulary.
4. Because the retail unit cost reported on Plan Finder is intended to apply to a 30 day supply of a drug, only claims with a 30-day supply are included. Claims reporting a different day supply value are excluded.
5. PDEs for dates of service during which the plan was suppressed from Plan Finder or where the relevant pharmacy or drug was not reported in Plan Finder are not included since no Plan Finder cost can be assigned.
6. PDEs for compound drugs or non-covered drugs are not included.
7. The PDE must occur in quarter 1 through 3 of the year. Quarter 4 PDEs are not included because PF prices are not updated during this last quarter.
1 Plan Finder unit costs are reported by plan, drug, and pharmacy. The plan, drug, and pharmacy from the PDE are used to assign the corresponding Plan Finder unit cost posted on medicare.gov on the date of the PDE.
2 Plan Finder prices are reported at the reference NDC level. A reference NDC is a representative NDC of drugs with the same brand name, generic name, strength, and dosage form. To map NDCs on PDEs to a reference NDC, we use First Data Bank (FDB) and Medi-Span to create an expanded list of NDCs for each reference NDC, consisting of NDCs with the same brand name, generic name, strength, and dosage form as the reference NDC. This expanded NDC list allows us to map PDE NDCs to PF reference NDCs.
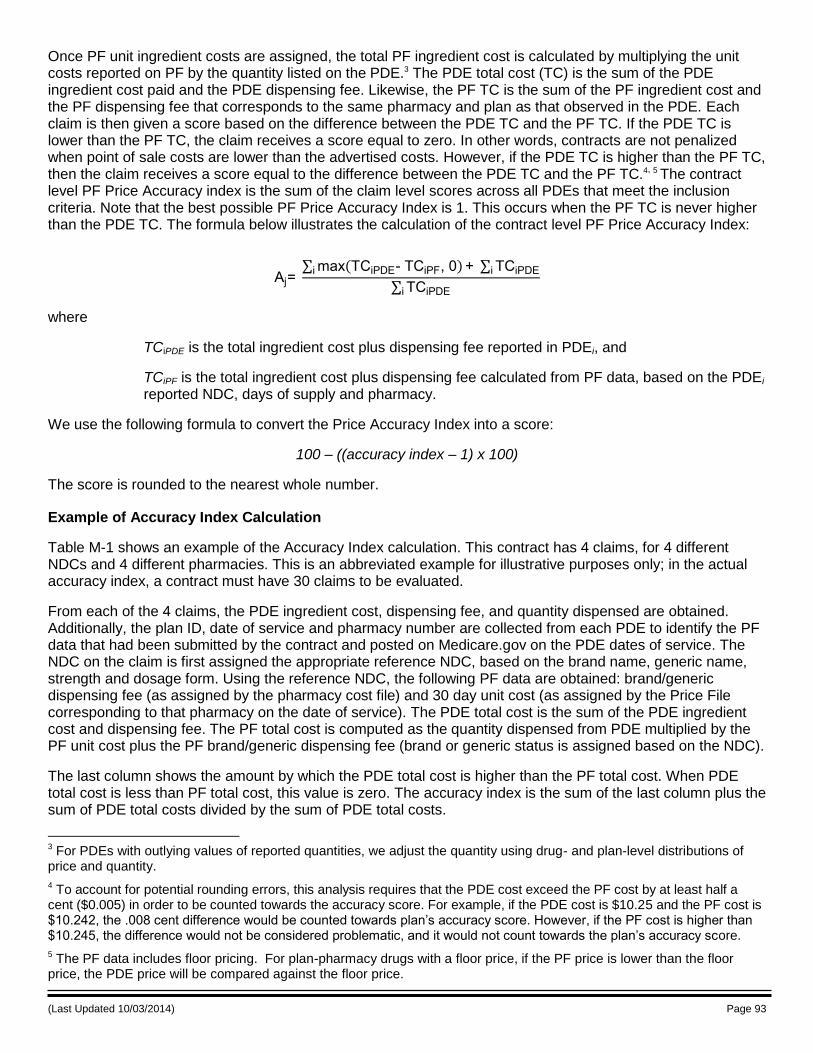
(Last Updated 10/03/2014) Page 93
Once PF unit ingredient costs are assigned, the total PF ingredient cost is calculated by multiplying the unit costs reported on PF by the quantity listed on the PDE.3 The PDE total cost (TC) is the sum of the PDE ingredient cost paid and the PDE dispensing fee. Likewise, the PF TC is the sum of the PF ingredient cost and the PF dispensing fee that corresponds to the same pharmacy and plan as that observed in the PDE. Each claim is then given a score based on the difference between the PDE TC and the PF TC. If the PDE TC is lower than the PF TC, the claim receives a score equal to zero. In other words, contracts are not penalized when point of sale costs are lower than the advertised costs. However, if the PDE TC is higher than the PF TC, then the claim receives a score equal to the difference between the PDE TC and the PF TC.4, 5 The contract level PF Price Accuracy index is the sum of the claim level scores across all PDEs that meet the inclusion criteria. Note that the best possible PF Price Accuracy Index is 1. This occurs when the PF TC is never higher than the PDE TC. The formula below illustrates the calculation of the contract level PF Price Accuracy Index:
Aj= ∑ max(TCiPDE TCiPF, 0) ∑ TCiPDEii
∑ TCiPDEi
where
TCiPDE is the total ingredient cost plus dispensing fee reported in PDEi, and
TCiPF is the total ingredient cost plus dispensing fee calculated from PF data, based on the PDEi reported NDC, days of supply and pharmacy.
We use the following formula to convert the Price Accuracy Index into a score:
100 – ((accuracy index – 1) x 100)
The score is rounded to the nearest whole number.
Example of Accuracy Index Calculation
Table M-1 shows an example of the Accuracy Index calculation. This contract has 4 claims, for 4 different NDCs and 4 different pharmacies. This is an abbreviated example for illustrative purposes only; in the actual accuracy index, a contract must have 30 claims to be evaluated.
From each of the 4 claims, the PDE ingredient cost, dispensing fee, and quantity dispensed are obtained. Additionally, the plan ID, date of service and pharmacy number are collected from each PDE to identify the PF data that had been submitted by the contract and posted on Medicare.gov on the PDE dates of service. The NDC on the claim is first assigned the appropriate reference NDC, based on the brand name, generic name, strength and dosage form. Using the reference NDC, the following PF data are obtained: brand/generic dispensing fee (as assigned by the pharmacy cost file) and 30 day unit cost (as assigned by the Price File corresponding to that pharmacy on the date of service). The PDE total cost is the sum of the PDE ingredient cost and dispensing fee. The PF total cost is computed as the quantity dispensed from PDE multiplied by the PF unit cost plus the PF brand/generic dispensing fee (brand or generic status is assigned based on the NDC).
The last column shows the amount by which the PDE total cost is higher than the PF total cost. When PDE total cost is less than PF total cost, this value is zero. The accuracy index is the sum of the last column plus the sum of PDE total costs divided by the sum of PDE total costs.
3 For PDEs with outlying values of reported quantities, we adjust the quantity using drug- and plan-level distributions of price and quantity.
4 To account for potential rounding errors, this analysis requires that the PDE cost exceed the PF cost by at least half a cent ($0.005) in order to be counted towards the accuracy score. For example, if the PDE cost is $10.25 and the PF cost is $10.242, the .008 cent difference would be counted towards plan’s accuracy score. However, if the PF cost is higher than $10.245, the difference would not be considered problematic, and it would not count towards the plan’s accuracy score.
5 The PF data includes floor pricing. For plan-pharmacy drugs with a floor price, if the PF price is lower than the floor price, the PDE price will be compared against the floor price.
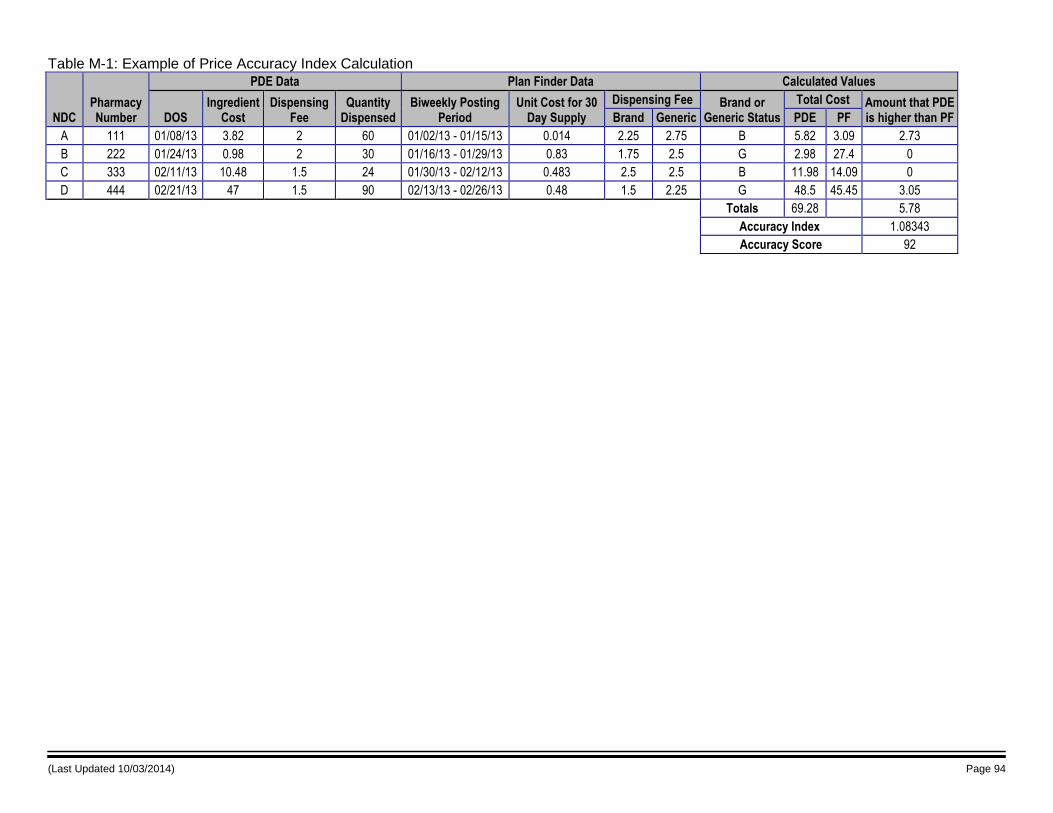
(Last Updated 10/03/2014) Page 94
Table M-1: Example of Price Accuracy Index Calculation
NDC Pharmacy Number
PDE Data Plan Finder Data Calculated Values
DOS Ingredient
Cost Dispensing
Fee Quantity
Dispensed Biweekly Posting
Period Unit Cost for 30
Day Supply
Dispensing Fee Brand or Generic Status
Total Cost Amount that PDE is higher than PF Brand Generic PDE PF
A 111 01/08/13 3.82 2 60 01/02/13 - 01/15/13 0.014 2.25 2.75 B 5.82 3.09 2.73
B 222 01/24/13 0.98 2 30 01/16/13 - 01/29/13 0.83 1.75 2.5 G 2.98 27.4 0
C 333 02/11/13 10.48 1.5 24 01/30/13 - 02/12/13 0.483 2.5 2.5 B 11.98 14.09 0
D 444 02/21/13 47 1.5 90 02/13/13 - 02/26/13 0.48 1.5 2.25 G 48.5 45.45 3.05
Totals 69.28 5.78
Accuracy Index 1.08343
Accuracy Score 92

(Last Updated 10/03/2014) Page 95
Attachment N: Missing Data Messages
CMS uses a standard set of messages in the Star Ratings when there are no data available for a contract. This section provides the rules and messages assigned at each level of the Star Ratings.
Measure level messages
Table N-1 contains all of the possible messages that could be assigned to missing data at the measure level.
Table N-1: Measure level missing data messages
Message Measure Level
Coming Soon Used for all measures in MPF between Oct 1 and when the actual data go live
Medicare shows only a Star Rating for this topic Used in the numeric data for the Part C & D improvement measures in MPF and Plan Preview 2
Not enough data available There were data for the contract, but not enough to pass the measure exclusion rules
CMS identified issues with this plan’s data Data were materially biased, erroneous and/or not reported by a contract required to report
Not Applicable Used in the numeric data for the Part C & Part D improvement measures in Plan Preview 1
Benefit not offered by plan The contract was required to report this measure in HEDIS but doesn’t offer the benefit to members
Plan too new to be measured The contract is too new to have submitted measure data
No data available There were no data for the contract included in the source data for the measure
Plan too small to be measured The contract had data but did not have enough enrollment to pass the measure exclusion rules
Plan not required to report measure The contract was not required to report the measure
1. Assignment rules for Part C measure messages
Part C uses a set of rules for assigning the missing data message that varies by the data source. The rules for each data source are defined below.
Appeals (IRE) measures (C32 & C33):
Has CMS identified issues with the contract’s data? Yes: Display message: CMS identified issues with this plan’s data No: Is there a valid numeric measure rate? Yes: Display the numeric measure rate No: Is the contract effective date > 01/01/2013? Yes: Display message: Plan too new to be measured No: Display message: Not enough data available
CAHPS measures (C04, C23, C24, C25, C26, C27, & C28):
Is there a valid numeric CAHPS measure rate? Yes: Display the numeric CAHPS measure rate No: Is the contract effective date > 01/01/2013? Yes: Display message: Plan too new to be measured No: Is the CAHPS measure rate NR? Yes: Display message: Not enough data available No: Is the CAHPS measure rate NA? Yes: Display message: No data available No: Display message: Plan too small to be measured

(Last Updated 10/03/2014) Page 96
Complaints (CTM) measure (C29):
Is the contract effective date > 06/30/2014? Yes: Display message: Plan too new to be measured No: Was the average contract enrollment < 800 in 2014? Yes: Display message: Not enough data available No: Is there a valid numeric CTM rate? Yes: Display the numeric CTM rate No: Display message: No data available
HEDIS measures (C01 - C03, C08, C13 – C19):
Was the contract enrollment < 1,000 in July 2013? Yes: Display message: Plan too small to be measured No: Is there a valid HEDIS numeric rate? Yes: Display the HEDIS numeric rate No: Is the HEDIS rate a code? Yes: Assign message according to value below: NA: Display message: Not enough data available NB: Display message: Benefit not offered by plan NR: Assign message according to audit designation NR Display message: CMS identified issues with this plan’s data BR Display message: CMS identified issues with this plan’s data OS Display message: Plan not required to report measure ER Display message: Plan not required to report measure No: Is the contract effective date > 01/01/2013? Yes: Display message: Plan too new to be measured No: Was the contract required to report HEDIS? Yes: Display message: No data available No: Display message: Plan not required to report measure
HEDIS PCR measure (C22)
Is there a valid HEDIS numeric rate? Yes: Display the HEDIS numeric rate No: Is the HEDIS rate a code? Yes: Assign message according to value below: NA: Display message: Not enough data available NB: Display message: Benefit not offered by plan NR: Assign message according to audit designation NR Display message: CMS identified issues with this plan’s data BR Display message: CMS identified issues with this plan’s data OS Display message: Plan not required to report measure ER Display message: Plan not required to report measure Else: Display message: Not enough data available No: Is the contract effective date > 01/01/2013? Yes: Display message: Plan too new to be measured No: Display message: No data available
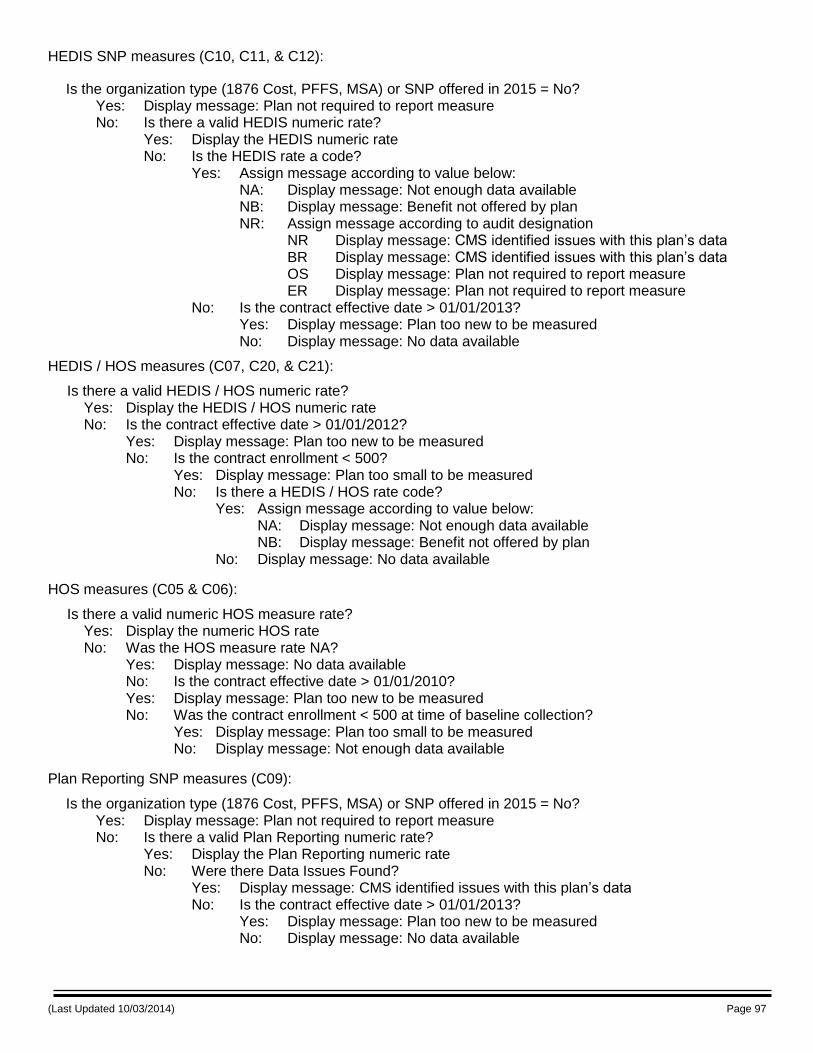
(Last Updated 10/03/2014) Page 97
HEDIS SNP measures (C10, C11, & C12):
Is the organization type (1876 Cost, PFFS, MSA) or SNP offered in 2015 = No? Yes: Display message: Plan not required to report measure No: Is there a valid HEDIS numeric rate? Yes: Display the HEDIS numeric rate No: Is the HEDIS rate a code? Yes: Assign message according to value below: NA: Display message: Not enough data available NB: Display message: Benefit not offered by plan NR: Assign message according to audit designation NR Display message: CMS identified issues with this plan’s data BR Display message: CMS identified issues with this plan’s data OS Display message: Plan not required to report measure ER Display message: Plan not required to report measure No: Is the contract effective date > 01/01/2013? Yes: Display message: Plan too new to be measured No: Display message: No data available
HEDIS / HOS measures (C07, C20, & C21):
Is there a valid HEDIS / HOS numeric rate? Yes: Display the HEDIS / HOS numeric rate No: Is the contract effective date > 01/01/2012? Yes: Display message: Plan too new to be measured No: Is the contract enrollment < 500? Yes: Display message: Plan too small to be measured No: Is there a HEDIS / HOS rate code? Yes: Assign message according to value below: NA: Display message: Not enough data available NB: Display message: Benefit not offered by plan No: Display message: No data available
HOS measures (C05 & C06):
Is there a valid numeric HOS measure rate? Yes: Display the numeric HOS rate No: Was the HOS measure rate NA? Yes: Display message: No data available No: Is the contract effective date > 01/01/2010? Yes: Display message: Plan too new to be measured No: Was the contract enrollment < 500 at time of baseline collection? Yes: Display message: Plan too small to be measured No: Display message: Not enough data available
Plan Reporting SNP measures (C09):
Is the organization type (1876 Cost, PFFS, MSA) or SNP offered in 2015 = No? Yes: Display message: Plan not required to report measure No: Is there a valid Plan Reporting numeric rate? Yes: Display the Plan Reporting numeric rate No: Were there Data Issues Found? Yes: Display message: CMS identified issues with this plan’s data No: Is the contract effective date > 01/01/2013? Yes: Display message: Plan too new to be measured No: Display message: No data available

(Last Updated 10/03/2014) Page 98
Improvement (Star Ratings) measure (C31):
Is there a valid improvement measure rate? Yes: Display message: Medicare shows only a Star Rating for this topic No: Is the contract effective date > 01/01/2013? Yes: Display message: Plan too new to be measured No: Display message: Not enough data available
Voluntary Disenrollment (MBDSS) measure (C30):
Is there a valid numeric voluntary disenrollment rate? Yes: Display the numeric voluntary disenrollment rate No: Is the contract effective date ≥ 01/01/2014? Yes: Display message: Plan too new to be measured No: Display message: Not enough data available
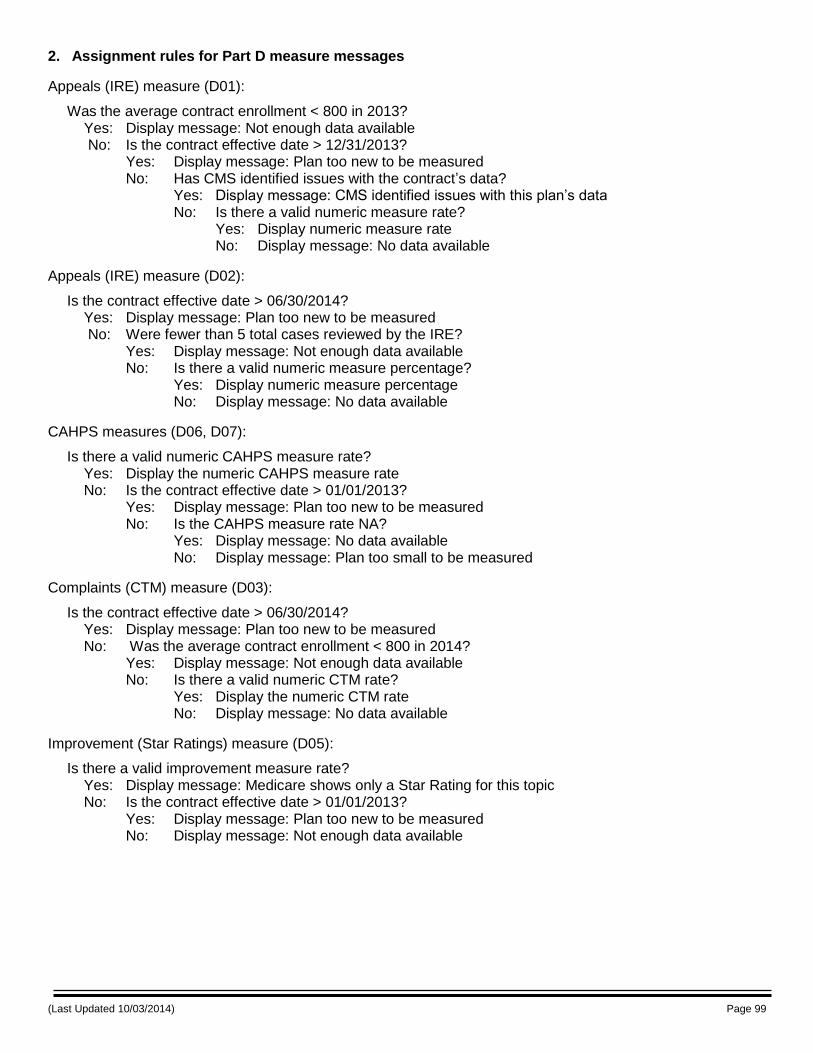
(Last Updated 10/03/2014) Page 99
2. Assignment rules for Part D measure messages
Appeals (IRE) measure (D01):
Was the average contract enrollment < 800 in 2013? Yes: Display message: Not enough data available No: Is the contract effective date > 12/31/2013? Yes: Display message: Plan too new to be measured No: Has CMS identified issues with the contract’s data? Yes: Display message: CMS identified issues with this plan’s data No: Is there a valid numeric measure rate? Yes: Display numeric measure rate No: Display message: No data available
Appeals (IRE) measure (D02):
Is the contract effective date > 06/30/2014? Yes: Display message: Plan too new to be measured No: Were fewer than 5 total cases reviewed by the IRE? Yes: Display message: Not enough data available No: Is there a valid numeric measure percentage? Yes: Display numeric measure percentage No: Display message: No data available
CAHPS measures (D06, D07):
Is there a valid numeric CAHPS measure rate? Yes: Display the numeric CAHPS measure rate No: Is the contract effective date > 01/01/2013? Yes: Display message: Plan too new to be measured No: Is the CAHPS measure rate NA? Yes: Display message: No data available No: Display message: Plan too small to be measured
Complaints (CTM) measure (D03):
Is the contract effective date > 06/30/2014? Yes: Display message: Plan too new to be measured No: Was the average contract enrollment < 800 in 2014? Yes: Display message: Not enough data available No: Is there a valid numeric CTM rate? Yes: Display the numeric CTM rate No: Display message: No data available
Improvement (Star Ratings) measure (D05):
Is there a valid improvement measure rate? Yes: Display message: Medicare shows only a Star Rating for this topic No: Is the contract effective date > 01/01/2013? Yes: Display message: Plan too new to be measured No: Display message: Not enough data available
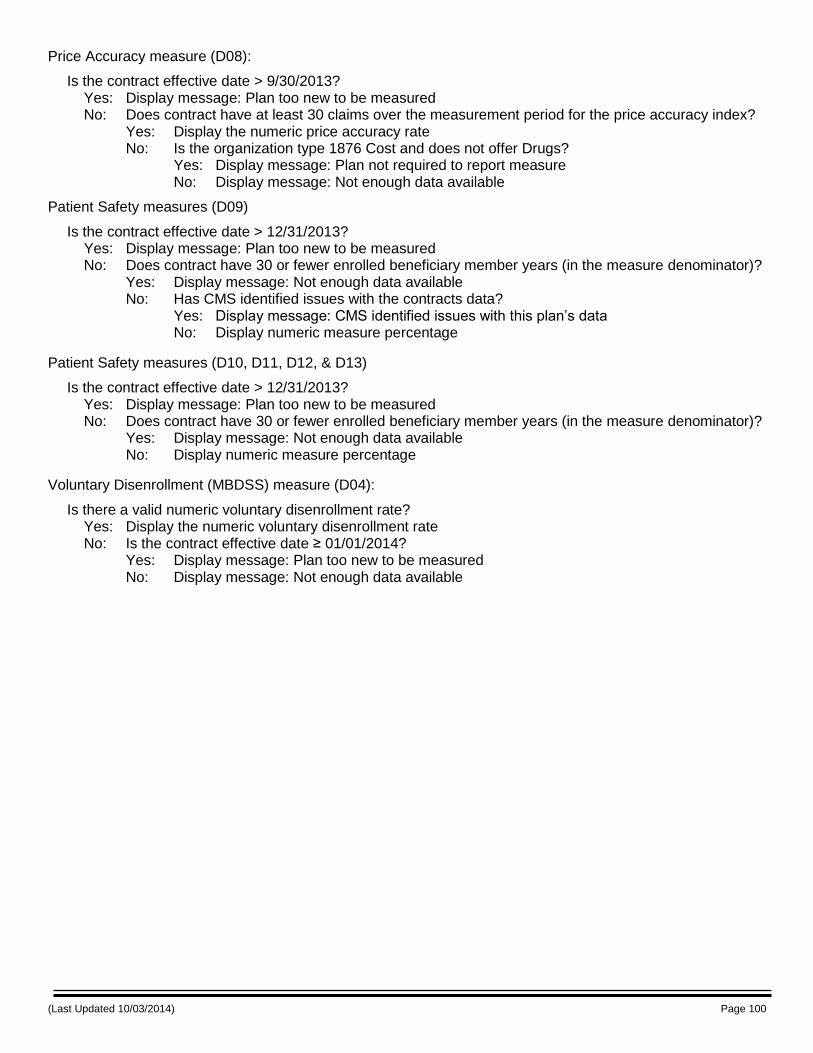
(Last Updated 10/03/2014) Page 100
Price Accuracy measure (D08):
Is the contract effective date > 9/30/2013? Yes: Display message: Plan too new to be measured No: Does contract have at least 30 claims over the measurement period for the price accuracy index? Yes: Display the numeric price accuracy rate No: Is the organization type 1876 Cost and does not offer Drugs? Yes: Display message: Plan not required to report measure No: Display message: Not enough data available
Patient Safety measures (D09)
Is the contract effective date > 12/31/2013? Yes: Display message: Plan too new to be measured No: Does contract have 30 or fewer enrolled beneficiary member years (in the measure denominator)? Yes: Display message: Not enough data available No: Has CMS identified issues with the contracts data? Yes: Display message: CMS identified issues with this plan’s data No: Display numeric measure percentage
Patient Safety measures (D10, D11, D12, & D13)
Is the contract effective date > 12/31/2013? Yes: Display message: Plan too new to be measured No: Does contract have 30 or fewer enrolled beneficiary member years (in the measure denominator)? Yes: Display message: Not enough data available No: Display numeric measure percentage
Voluntary Disenrollment (MBDSS) measure (D04):
Is there a valid numeric voluntary disenrollment rate? Yes: Display the numeric voluntary disenrollment rate No: Is the contract effective date ≥ 01/01/2014? Yes: Display message: Plan too new to be measured No: Display message: Not enough data available

(Last Updated 10/03/2014) Page 101
Domain, Summary and Overall level messages
Table N-2 contains all of the possible messages that could be assigned to missing data at the domain, summary and overall levels.
Table N-2: Domain, Summary and Overall level missing data messages
Message Domain Level Summary & Overall Level
Coming Soon Used for all domain ratings in MPF between Oct 1 and when the actual data go live
Used for all summary and overall ratings in MPF between Oct 1 and when the actual data go live
Not enough data available The contract did not have enough rated measures to calculate the domain rating
The contract did not have enough rated measures to calculate the summary or overall rating
Plan too new to be measured The contract is too new to have submitted measure data for a domain rating to be calculated
The contract is too new to have submitted data to be rated in the summary or overall levels
1. Assignment rules for Part C & Part D domain rating level messages
Part C domain message assignment rules:
Is there a numeric domain star? Yes: Display the numeric domain star No: Is the contract effective date > 01/01/2013? Yes: Display message: Plan too new to be measured No: Display message: Not enough data available
Part D domain message assignment rules:
Is there a numeric domain star? Yes: Display the numeric domain star No: Is the contract effective date > 01/01/2014? Yes: Display message: Plan too new to be measured No: Display message: Not enough data available
2. Assignment rules for Part C & Part D summary rating level messages
Part C summary rating message assignment rules:
Is there a numeric Part C summary rating star? Yes: Is the contract currently under sanction? Yes: Is this the contract’s highest rating? Yes: Is the contract’s Part C Summary rating greater than 2.5 stars? Yes: Set contract’s Part C Summary rating to 2.5 stars No: Subtract 1 from the contract’s Part C Summary rating No: Display the numeric Part C summary rating star No: Display the numeric Part C summary rating star No: Is the contract effective date > 01/01/2013? Yes: Display message: Plan too new to be measured No: Display message: Not enough data available

(Last Updated 10/03/2014) Page 102
Part D summary rating message assignment rules:
Is there a numeric Part D summary rating star? Yes: Is the contract currently under sanction? Yes: Is this the contract’s highest rating? Yes: Is the contract’s Part D Summary rating greater than 2.5 stars? Yes: Set contract’s Part D Summary rating to 2.5 stars No: Subtract 1 from the contract’s Part D Summary rating No: Display the numeric Part D summary rating star No: Display the numeric Part D summary rating star No: Is the contract effective date > 01/01/2014? Yes: Display message: Plan too new to be measured No: Display message: Not enough data available
3. Assignment rules for overall rating level messages
Overall rating message assignment rules:
Is there a numeric overall rating star?
Yes: Is the contract currently under sanction?
Yes: Is this the contract’s highest rating?
Yes: Is the contract’s overall rating greater than 2.5 stars?
Yes: Set contract’s overall rating to 2.5 stars
No: Subtract 1 from the contract’s overall rating
No: Display the numeric overall rating star
No: Display the numeric overall rating star
No: Is the contract effective date > 01/01/2013?
Yes: Display message: Plan too new to be measured
No: Display message: Not enough data available

(Last Updated 10/03/2014) Page 103
Attachment O: Glossary of Terms
AEP The annual period from October 15 until December 7 when a Medicare beneficiary can enroll into a Medicare Part D plan or re-enroll into their existing Medicare Part D Plan or change into another Medicare Part D plan is known as the Annual Election Period (AEP). Beneficiaries can also switch to a Medicare Advantage Plan that has a Prescription Drug Plan (MA-PD). The chosen Medicare Part D plan coverage begins on January 1st.
CAHPS The term CAHPS refers to a comprehensive and evolving family of surveys that ask consumers and patients to evaluate the interpersonal aspects of health care. CAHPS surveys probe those aspects of care for which consumers and patients are the best and/or only source of information, as well as those that consumers and patients have identified as being important. CAHPS initially stood for the Consumer Assessment of Health Plans Study, but as the products have evolved beyond health plans, the acronym now stands for Consumer Assessment of Healthcare Providers and Systems.
CCP A Coordinated Care Plan (CCP) is a health plan that includes a network of providers that are under contract or arrangement with the organization to deliver the benefit package approved by CMS. The CCP network is approved by CMS to ensure that all applicable requirements are met, including access and availability, service area, and quality requirements. CCPs may use mechanisms to control utilization, such as referrals from a gatekeeper for an enrollee to receive services within the plan, and financial arrangements that offer incentives to providers to furnish high quality and cost-effective care. CCPs include HMOs, PSOs, local and regional PPOs, and senior housing facility plans. SNPs can be offered under any type of CCP that meets CMS’ requirements.
Cost Plan A plan operated by a Health Maintenance Organization (HMO) or Competitive Medical Plan (CMP) in accordance with a cost reimbursement contract under §1876(h) of the Act. In the Star Ratings, CMS classifies a Cost Plan not offering Part D as MA-only and a Cost Plan offering Part D as MA-PD.
Euclidean distance The absolute value of the difference between two points, x-y.
HEDIS The Healthcare Effectiveness Data and Information Set (HEDIS) is a widely used set of performance measures in the managed care industry, developed and maintained by the National Committee for Quality Assurance (NCQA).
HOS The Medicare Health Outcomes Survey (HOS) is the first patient reported outcomes measure used in Medicare managed care. The goal of the Medicare HOS program is to gather valid, reliable, and clinically meaningful health status data in the Medicare Advantage (MA) program for use in quality improvement activities, pay for performance, program oversight, public reporting, and improving health. All managed care organizations with MA contracts must participate.
ICEP The 3 months immediately before beneficiaries are entitled to Medicare Part A and enrolled in Part B are known as the Initial Coverage Election Period (ICEP). Beneficiaries may choose a Medicare health plan during their ICEP and the plan must accept them unless it has reached its limit in the number of members. This limit is approved by CMS.
IRE The Independent Review Entity (IRE) is an independent entity contracted by CMS to review Medicare health plans’ adverse reconsiderations of organization determinations.

(Last Updated 10/03/2014) Page 104
IVR Interactive voice response (IVR) is a technology that allows a computer to interact with humans through the use of voice and dual-tone multi-frequency keypad inputs.
LIS The Low Income Subsidy (LIS) from Medicare provides financial assistance for beneficiaries who have limited income and resources. Those who are eligible for the LIS will get help paying for their monthly premium, yearly deductible, prescription coinsurance, and copayments and they will have no gap in coverage.
MA A Medicare Advantage (MA) organization is a public or private entity organized and licensed by a State as a risk-bearing entity (with the exception of provider-sponsored organizations receiving waivers) that is certified by CMS as meeting the MA contract requirements.
MA-only An MA organization that does not offer Medicare prescription drug coverage.
MA-PD An MA organization that offers Medicare prescription drug coverage and Part A and Part B benefits in one plan.
MSA Medicare Medical Savings Account (MSA) plans combine a high deductible MA plan and a medical savings account (which is an account established for the purpose of paying the qualified medical expenses of the account holder).
Percentage A part of a whole expressed in hundredths. For example, a score of 45 out of 100 possible points is the same as 45%.
Percentile The value below which a certain percent of observations fall. For example, a score equal to or greater than 97 percent of other scores attained on the same measure is said to be in the 97th percentile.
PDP A Prescription Drug Plan (PDP) is a stand-alone drug plan, offered by insurers and other private companies to beneficiaries that receive their Medicare Part A and/or B benefits either through the Original Medicare Plan, Medicare Private Fee-for-Service Plans that do not offer prescription drug coverage or Medicare Cost Plans that do not offer Medicare prescription drug coverage.
PFFS Private Fee-for-Service (PFFS) is defined as an MA plan that pays providers of services at a rate determined by the plan on a fee-for-service basis without placing the provider at financial risk; does not vary the rates for a provider based on the utilization of that provider's services; and does not restrict enrollees' choices among providers that are lawfully authorized to provide services and agree to accept the plan's terms and conditions of payment. The Medicare Improvements for Patients and Providers Act (MIPPA) added that although payment rates cannot vary based solely on utilization of services by a provider, a PFFS plan is permitted to vary the payment rates for a provider based on the specialty of the provider, the location of the provider, or other factors related to the provider that are not related to utilization. Furthermore, MIPPA also allows PFFS plans to increase payment rates to a provider based on increased utilization of specified preventive or screening services. See section 30.4 of the Medicare Managed Care Manual Chapter 1 for further details on PFFS plans.
Reliability A measure of the fraction of the variation among the observed measure values that is due to real differences in quality (“signal”) rather than random variation (“noise”). On a scale from 0 (all differences among plans are due to randomness of sampling) to 1 (every plan's quality is measured with perfect accuracy).

(Last Updated 10/03/2014) Page 105
SNP A Special Needs Plan (SNP) is an MA coordinated care plan that limits enrollment to special needs individuals, i.e., those who are dual-eligible, institutionalized, or have one or more severe or disabling chronic conditions.
Sponsor An entity that sponsors a health or drug plan.
Statistical Significance Statistical significance assesses how unlikely differences as big as those observed are to appear due to chance when plans are actually the same. CMS uses statistical tests (e.g., t-test) to determine if a contract’s measure value is statistically significantly greater or less than the national average for that measure, or whether conversely the observed differences from the national average could have arisen by chance.
Sum of Squares The sum of the square of a measure.
TTY A Teletypewriter (TTY) is an electronic device for text communication via a telephone line, used when one or more of the parties has hearing or speech difficulties.
Very Low Reliability For CAHPS, an indication that reliability is less than 0.6, indicating that 40% or more of observed variation is due to random noise.

(Last Updated 10/03/2014) Page 106
Attachment P: Health Plan Management System Module Reference
This attachment is designed to assist reviewers of the data displayed in HPMS to understand the various pages and fields shown in the Part C Report Card Master Table and the Part D Report Card Master Table modules. These modules employ standard HPMS user access rights so that users can only see contracts associated with their user id.
Part C Report Card Master Table
The Part C Report Card Master Table contains the Part C data and stars which will be displayed in MPF along with much of the detailed data that went into various calculations. To access the Part C Report Card Master Table, on the HPMS home page, select Quality and Performance. From the Quality and Performance Fly-out menu choose Part C Performance Metrics. The Part C Performance Metrics home page will be displayed.
On the Part C Performance Metrics home page, select Part C Report Card Master Table from the left hand menu. You will be presented with a screen that allows you to select a report period. The information below describes the year 2015.
A. Measure Data page
The Measure Data page displays the numeric data for each Part C measure. This page is available during the first plan preview.
The first four columns contain contract identifying information. The remaining columns contain the measure data which will display in MPF. There is one column for each of the Part C measures. The measure columns are identified by measure id and measure name. The row immediately above this measure information contains the domain name. The row immediately below the measure information contains the data time frame. All subsequent rows contain the data associated with an individual contract.
B. Measure Detail page
The Measure Detail page contains the underlying data used for the Part C Complaints (C29) and Appeals measures (C32 & C33). This page is available during the first plan preview. Table P-1 below explains each of the columns displayed on this page.
Table P-1: Measure Detail page fields
HPMS Field Label Field Description
Contract Number The contract number associated with the data
Organization Marketing Name The name the contract markets to members
Contract Name The name the contract is known by in HPMS
Parent Organization The name of the parent organization for the contract
Total Number of Complaints The total number of non-excluded complaints for the contract
Complaint Average Enrollment The average enrollment used in the final calculation
Complaints Less than 800 Enrolled Yes / No, Yes = average enrollment < 800, No = average enrollment ≥ 800
Total Appeals Cases Total number of Part C appeals cases processed by the IRE (Maximus)
Number of Appeals Upheld The number of Part C appeals which were upheld
Number of Appeals Overturned The number of Part C appeals which were overturned
Number of Appeals Partly Overturned The number of Part C appeals which were partially overturned
Number of Appeals Dismissed The number of Part C appeals which were dismissed
Number of Appeals Withdrawn The number of Part C appeals which were withdrawn
Number of Late Appeals The number of Part C appeals which Maximus considered to be late
Percent of Timely Appeals The percent of Part C appeals which were processed in a timely manner

(Last Updated 10/03/2014) Page 107
C. Measure Detail – SNP page
The Measure Detail – SNP page contains the underlying data used in calculating the Part C HEDIS SNP Care for Older Adult measures (C10, C11 & C12). The formulas used to calculate the SNP measures are detailed in Attachment E. This page is available during the first plan preview. Table P-2 below explains each of the columns displayed on this page.
Table P-2: Measure Detail – SNP page fields
HPMS Field Label Field Description
Contract Number The contract number associated with the data
Organization Marketing Name The name the contract markets to members
Contract Name The name the contract is known by in HPMS
Parent Organization The name of the parent organization for the contract
PBP ID The Plan Benefit Package number associated with the data
Eligible Population The eligible population, as entered into the NCQA data submission tool (field eligpop)
Average Plan Enrollment The average enrollment in the PBP during 2013 (see section Contract Enrollment Data)
COA - MR Rate The contract entered COA Medication Review Rate as entered into the NCQA data submission tool (Field: ratemr) for the associated contract/PBP
COA – FSA Rate The contract entered COA Functional Status Assessment Rate as entered into the NCQA data submission tool (Field: ratefsa) for the associated contract/PBP
COA – PA Rate The contract entered COA Pain Assessment Rate as entered into the NCQA data submission tool (Field: rateps) for the associated contract/PBP
COA - MR Audit Designation The audit designation for the COA Medication Review Rate for the associated contract/PBP (the codes are defined in Table P-3: HEDIS 2014 Audit Designations and 2015 Star Ratings below)
COA – FSA Audit Designation The audit designation for the COA Functional Status Assessment Rate for the associated contract/ PBP the codes are defined in Table P-3: HEDIS 2014 Audit Designations and 2015 Star Ratings below)
COA – PA Audit Designation The audit designation for the COA Pain Assessment Rate for the associated contract/ PBP the codes are defined in Table P-3: HEDIS 2014 Audit Designations and 2015 Star Ratings below)
Table P-3: HEDIS 2014 Audit Designations and 2015 Star Ratings
Audit Designation Description Resultant Rating
R Reportable 1 to 5 stars depending on reported value
NB Required benefit not offered Benefit not offered by plan
NA Denominator fewer than 30 Not enough data available
BR Calculated rate was materially biased 1 star, numeric data set to “CMS identified issues with this plan’s data”
NR Plan chose not to report 1 star, numeric data set to “CMS identified issues with this plan’s data”
OS Plan not required to report Plan not required to report measure
Error Measure Unselected Plan not required to report measure
D. Measure Detail – CTM page
The Measure Detail – CTM page contains the case level data of the non-excluded cases used in producing the Part C Complaints measure (C29). This page is available during the first plan preview. Table P-4 below explains each of the columns displayed on this page.
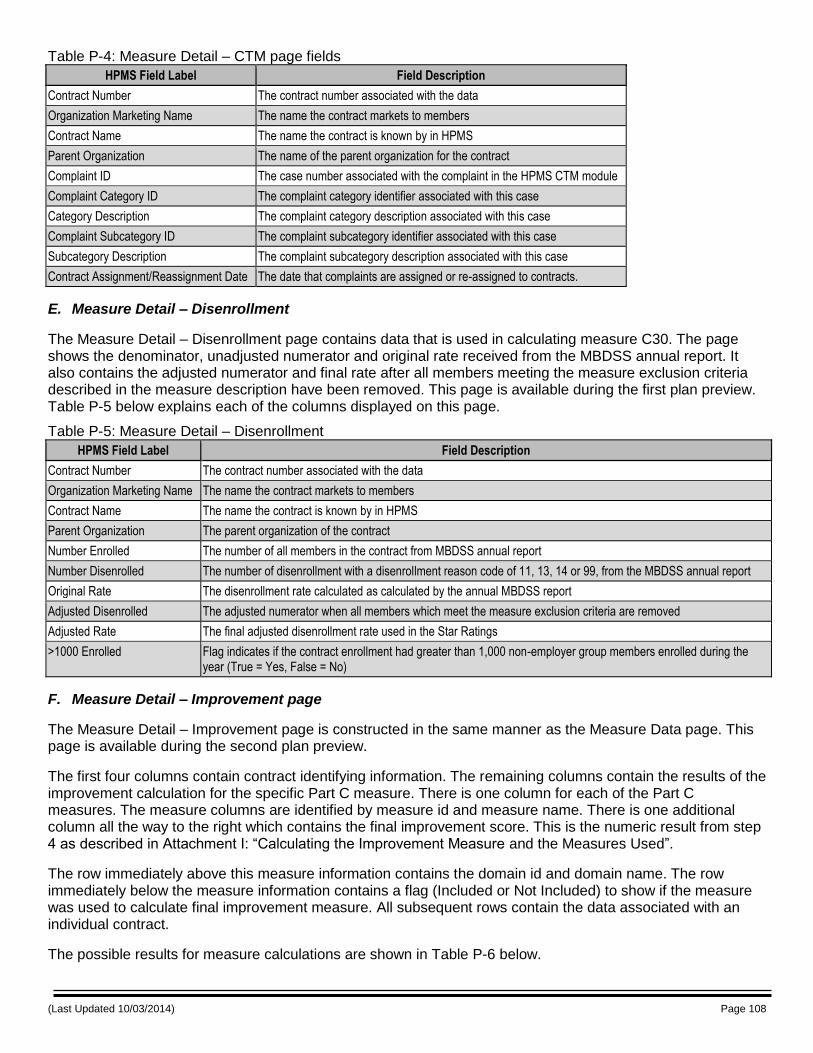
(Last Updated 10/03/2014) Page 108
Table P-4: Measure Detail – CTM page fields
HPMS Field Label Field Description
Contract Number The contract number associated with the data
Organization Marketing Name The name the contract markets to members
Contract Name The name the contract is known by in HPMS
Parent Organization The name of the parent organization for the contract
Complaint ID The case number associated with the complaint in the HPMS CTM module
Complaint Category ID The complaint category identifier associated with this case
Category Description The complaint category description associated with this case
Complaint Subcategory ID The complaint subcategory identifier associated with this case
Subcategory Description The complaint subcategory description associated with this case
Contract Assignment/Reassignment Date The date that complaints are assigned or re-assigned to contracts.
E. Measure Detail – Disenrollment
The Measure Detail – Disenrollment page contains data that is used in calculating measure C30. The page shows the denominator, unadjusted numerator and original rate received from the MBDSS annual report. It also contains the adjusted numerator and final rate after all members meeting the measure exclusion criteria described in the measure description have been removed. This page is available during the first plan preview. Table P-5 below explains each of the columns displayed on this page.
Table P-5: Measure Detail – Disenrollment
HPMS Field Label Field Description
Contract Number The contract number associated with the data
Organization Marketing Name The name the contract markets to members
Contract Name The name the contract is known by in HPMS
Parent Organization The parent organization of the contract
Number Enrolled The number of all members in the contract from MBDSS annual report
Number Disenrolled The number of disenrollment with a disenrollment reason code of 11, 13, 14 or 99, from the MBDSS annual report
Original Rate The disenrollment rate calculated as calculated by the annual MBDSS report
Adjusted Disenrolled The adjusted numerator when all members which meet the measure exclusion criteria are removed
Adjusted Rate The final adjusted disenrollment rate used in the Star Ratings
>1000 Enrolled Flag indicates if the contract enrollment had greater than 1,000 non-employer group members enrolled during the year (True = Yes, False = No)
F. Measure Detail – Improvement page
The Measure Detail – Improvement page is constructed in the same manner as the Measure Data page. This page is available during the second plan preview.
The first four columns contain contract identifying information. The remaining columns contain the results of the improvement calculation for the specific Part C measure. There is one column for each of the Part C measures. The measure columns are identified by measure id and measure name. There is one additional column all the way to the right which contains the final improvement score. This is the numeric result from step 4 as described in Attachment I: “Calculating the Improvement Measure and the Measures Used”.
The row immediately above this measure information contains the domain id and domain name. The row immediately below the measure information contains a flag (Included or Not Included) to show if the measure was used to calculate final improvement measure. All subsequent rows contain the data associated with an individual contract.
The possible results for measure calculations are shown in Table P-6 below.

(Last Updated 10/03/2014) Page 109
Table P-6: Measure Improvement Results
Improvement Measure Result Description
No significant change There was no significant change in the values between the two years
Significant improvement There was a significant improvement from last year to this year
Significant decline There was a significant decline from last year to this year
Not included in calculation There was only one year of data available so the calculation could not be completed
Not Applicable The measure is not an improvement measure
Not Eligible The contract did not have data in more than half of the improvement measures or was too new
Held Harmless The contract had 5 stars in this measure last year and this year
G. Measure Stars page
The Measure Stars page displays the Star Rating for each Part C measure. This page is available during the second plan preview.
The first four columns contain contract identifying information. The remaining columns contain the measure stars which will display in MPF. There is one column for each of the Part C measures. The measure columns are identified by measure id and measure name. The row immediately above this measure information contains the domain id and domain name. The row immediately below the measure information contains the data time frame. All subsequent rows contain the stars associated with an individual contract.
H. Domain Stars page
The Domain Stars page displays the Star Rating for each Part C domain. This page is available during the second plan preview.
The first four columns contain contract identifying information. The remaining columns contain the domain stars which will display in MPF. There is one column for each of the Part C domains. The domain columns are identified by the domain id and domain name. All subsequent rows contain the stars associated with an individual contract.
I. Summary Rating page
The Summary Rating page displays the Part C rating and data associated with calculating the final summary rating. This page is available during the second plan preview. Table P-7 below explains each of the columns contained on this page.
Table P-7: Part C Summary Rating View
HPMS Field Label Field Description
Contract Number The contract number associated with the data
Organization Marketing Name The name the contract markets to members
Contract Name The name the contract is known by in HPMS
Parent Organization The name of the parent organization for the contract
Contract Type The contract plan type used to compute the ratings
SNP Plans Does the contract offer a SNP (Yes/No)
Number Measures Required The minimum number of measures required to calculate a final rating out of the total number of measures required for this contract type.
Number Missing Measures The number of measures that were missing stars
Number Rated Measures The number of measures that were assigned stars
Calculated Summary Mean Contains the mean of the stars for rated measures
Calculated Variance The variance of the calculated summary mean
Variance Category The integration factor variance category for the contract
Integration Factor The integration factor for the contract
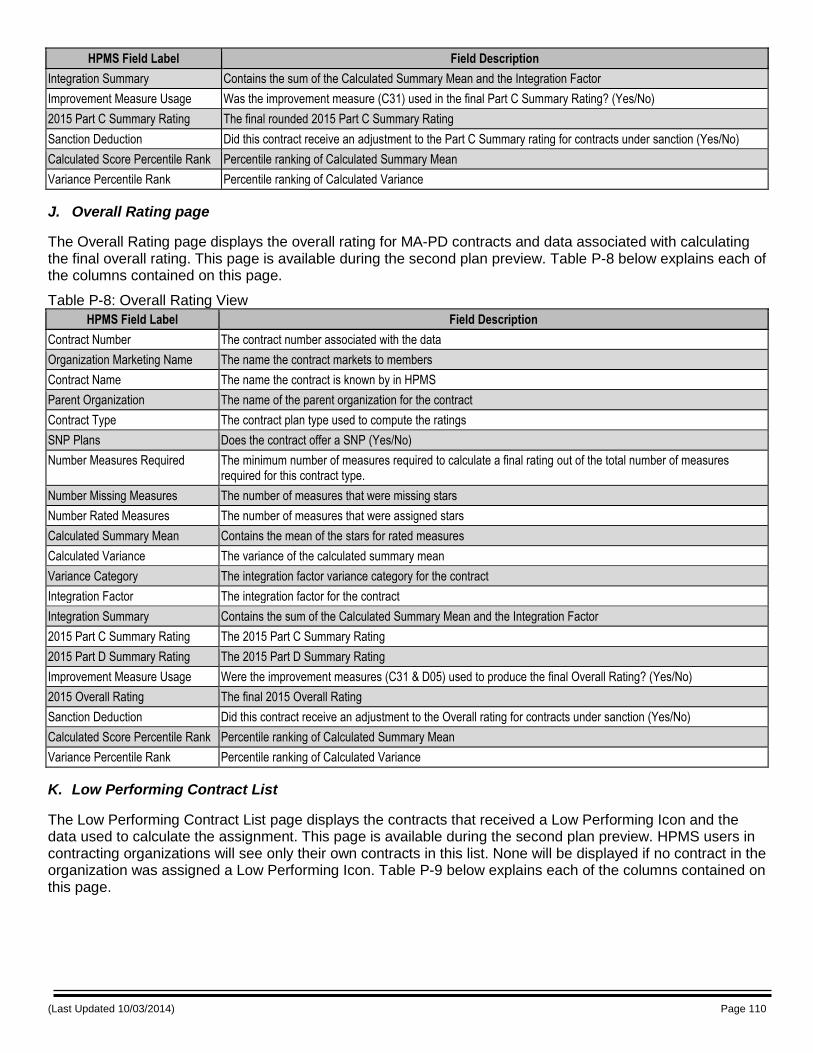
(Last Updated 10/03/2014) Page 110
HPMS Field Label Field Description
Integration Summary Contains the sum of the Calculated Summary Mean and the Integration Factor
Improvement Measure Usage Was the improvement measure (C31) used in the final Part C Summary Rating? (Yes/No)
2015 Part C Summary Rating The final rounded 2015 Part C Summary Rating
Sanction Deduction Did this contract receive an adjustment to the Part C Summary rating for contracts under sanction (Yes/No)
Calculated Score Percentile Rank Percentile ranking of Calculated Summary Mean
Variance Percentile Rank Percentile ranking of Calculated Variance
J. Overall Rating page
The Overall Rating page displays the overall rating for MA-PD contracts and data associated with calculating the final overall rating. This page is available during the second plan preview. Table P-8 below explains each of the columns contained on this page.
Table P-8: Overall Rating View
HPMS Field Label Field Description
Contract Number The contract number associated with the data
Organization Marketing Name The name the contract markets to members
Contract Name The name the contract is known by in HPMS
Parent Organization The name of the parent organization for the contract
Contract Type The contract plan type used to compute the ratings
SNP Plans Does the contract offer a SNP (Yes/No)
Number Measures Required The minimum number of measures required to calculate a final rating out of the total number of measures required for this contract type.
Number Missing Measures The number of measures that were missing stars
Number Rated Measures The number of measures that were assigned stars
Calculated Summary Mean Contains the mean of the stars for rated measures
Calculated Variance The variance of the calculated summary mean
Variance Category The integration factor variance category for the contract
Integration Factor The integration factor for the contract
Integration Summary Contains the sum of the Calculated Summary Mean and the Integration Factor
2015 Part C Summary Rating The 2015 Part C Summary Rating
2015 Part D Summary Rating The 2015 Part D Summary Rating
Improvement Measure Usage Were the improvement measures (C31 & D05) used to produce the final Overall Rating? (Yes/No)
2015 Overall Rating The final 2015 Overall Rating
Sanction Deduction Did this contract receive an adjustment to the Overall rating for contracts under sanction (Yes/No)
Calculated Score Percentile Rank Percentile ranking of Calculated Summary Mean
Variance Percentile Rank Percentile ranking of Calculated Variance
K. Low Performing Contract List
The Low Performing Contract List page displays the contracts that received a Low Performing Icon and the data used to calculate the assignment. This page is available during the second plan preview. HPMS users in contracting organizations will see only their own contracts in this list. None will be displayed if no contract in the organization was assigned a Low Performing Icon. Table P-9 below explains each of the columns contained on this page.

(Last Updated 10/03/2014) Page 111
Table P-9: Low Performing Contract List
HPMS Field Label Field Description
Contract Number The contract number associated with the data
Organization Marketing Name The name the contract markets to members
Contract Name The name the contract is known by in HPMS
Parent Organization The name of the parent organization for the contract
Rated As The type of rating for this contract, valid values are “MA-only”, “MA-PD” and “PDP”
2013 C Summary The 2013 Part C Summary Rating earned by the contract
2013 D Summary The 2013 Part D Summary Rating earned by the contract
2014 C Summary The 2014 Part C Summary Rating earned by the contract
2014 D Summary The 2014 Part D Summary Rating earned by the contract
2015 C Summary The 2015 Part C Summary Rating earned by the contract
2015 D Summary The 2015 Part D Summary Rating earned by the contract
Reason for LPI The combination of ratings that met the Low Performing Icon rules. Valid values are “Part C”, “Part D”, “Part C and D” & “Part C or D”. See the section titled “Methodology for Calculating the Low Performing Icon for details”.
L. High Performing Contract List
The High Performing Contract List page displays the contracts that received a High Performing Icon. This page is available during the second plan preview. HPMS users in contracting organizations will see only their own contracts in this list. None will be displayed if no contract in the organization was assigned a High Performing Icon. Table P-10 below explains each of the columns contained on this page.
Table P-10: High Performing Contract List
HPMS Field Label Field Description
Contract Number The contract number associated with the data
Organization Marketing Name The name the contract markets to members
Contract Name The name the contract is known by in HPMS
Parent Organization The name of the parent organization for the contract
Rated As The type of rating for this contract, valid values are “MA-only”, “MA-PD” and “PDP”
Highest Rating The highest level of rating that can be achieved for this organization, valid values are “Part C Summary”, “Part D Summary”, “Overall Rating”
Rating The star value attained in the highest rating for the organization type
M. Technical Notes link
The Technical Notes link provides the user with a copy of the 2015 Star Ratings Technical Notes. A draft version of these technical notes is available during the first plan preview. The draft is then updated for the second plan preview, and then finalized when the ratings data have been posted to MPF. Other updates may occur to the technical if errors are identified outside of the plan preview periods and after MPF data release.
Left clicking on the Technical Notes link will open a new browser window which will display a PDF (portable document format) copy of the 2015 Star Ratings Technical Notes. Right clicking on the Technical Notes link will pop up a context menu which contains Save Target As ; clicking on this will allow the user to download and save a copy of the PDF document.
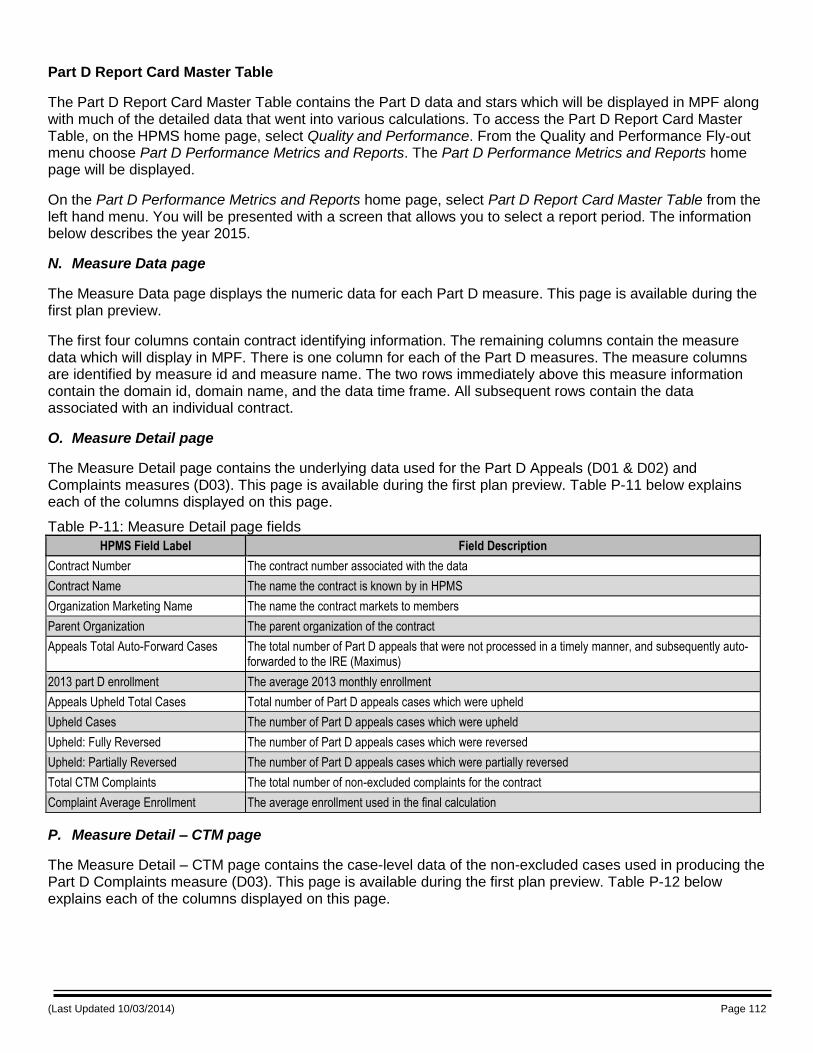
(Last Updated 10/03/2014) Page 112
Part D Report Card Master Table
The Part D Report Card Master Table contains the Part D data and stars which will be displayed in MPF along with much of the detailed data that went into various calculations. To access the Part D Report Card Master Table, on the HPMS home page, select Quality and Performance. From the Quality and Performance Fly-out menu choose Part D Performance Metrics and Reports. The Part D Performance Metrics and Reports home page will be displayed.
On the Part D Performance Metrics and Reports home page, select Part D Report Card Master Table from the left hand menu. You will be presented with a screen that allows you to select a report period. The information below describes the year 2015.
N. Measure Data page
The Measure Data page displays the numeric data for each Part D measure. This page is available during the first plan preview.
The first four columns contain contract identifying information. The remaining columns contain the measure data which will display in MPF. There is one column for each of the Part D measures. The measure columns are identified by measure id and measure name. The two rows immediately above this measure information contain the domain id, domain name, and the data time frame. All subsequent rows contain the data associated with an individual contract.
O. Measure Detail page
The Measure Detail page contains the underlying data used for the Part D Appeals (D01 & D02) and Complaints measures (D03). This page is available during the first plan preview. Table P-11 below explains each of the columns displayed on this page.
Table P-11: Measure Detail page fields
HPMS Field Label Field Description
Contract Number The contract number associated with the data
Contract Name The name the contract is known by in HPMS
Organization Marketing Name The name the contract markets to members
Parent Organization The parent organization of the contract
Appeals Total Auto-Forward Cases The total number of Part D appeals that were not processed in a timely manner, and subsequently auto-forwarded to the IRE (Maximus)
2013 part D enrollment The average 2013 monthly enrollment
Appeals Upheld Total Cases Total number of Part D appeals cases which were upheld
Upheld Cases The number of Part D appeals cases which were upheld
Upheld: Fully Reversed The number of Part D appeals cases which were reversed
Upheld: Partially Reversed The number of Part D appeals cases which were partially reversed
Total CTM Complaints The total number of non-excluded complaints for the contract
Complaint Average Enrollment The average enrollment used in the final calculation
P. Measure Detail – CTM page
The Measure Detail – CTM page contains the case-level data of the non-excluded cases used in producing the Part D Complaints measure (D03). This page is available during the first plan preview. Table P-12 below explains each of the columns displayed on this page.

(Last Updated 10/03/2014) Page 113
Table P-12: Measure Detail – CTM page fields
HPMS Field Label Field Description
Contract Number The contract number associated with the data
Organization Marketing Name The name the contract markets to members
Contract Name The name the contract is known by in HPMS
Parent Organization The parent organization of the contract
Complaint ID The case number associated with the complaint in the HPMS CTM module
Complaint Category ID The complaint category identifier associated with this case
Category Description The complaint category description associated with this case
Complaint Subcategory ID The complaint subcategory identifier associated with this case
Subcategory Description The complaint subcategory description associated with this case
Contract Assignment/Reassignment Date The date that complaints are assigned or re-assigned to contracts.
Q. Measure Detail – Auto-Forward page
The Measure Detail – Auto-Forward page contains the case-level data of the non-excluded cases used in producing the Part D Appeals Auto-Forward measure (D01). This page is available during the first plan preview. Table P-13 below explains each of the columns displayed on this page.
Table P-13: Measure Detail – Auto-Forward page fields
HPMS Field Label Field Description
Contract Number The contract number associated with the data
Organization Marketing Name The name the contract markets to members
Contract Name The name the contract is known by in HPMS
Parent Organization The parent organization of the contract
Appeal Number The case ID assigned to the appeal request
Request Received Date The date the appeal was received by the IRE
Request Type The type of appeal (auto-forward)
Appeal Priority The priority of the appeal (standard or expedited)
Appeal Disposition The disposition of the IRE (Maximus)
Appeal End Date The end date of the appeal
R. Measure Detail – Upheld page
The Measure Detail – Upheld page contains the case-level data of the non-excluded cases used in producing the Part D Appeals Upheld measure (D02). This page is available during the first plan preview. Table P-14 below explains each of the columns displayed on this page.
Table P-14: Measure Detail – Upheld page fields
HPMS Field Label Field Description
Contract Number The contract number associated with the data
Organization Marketing Name The name the contract markets to members
Contract Name The name the contract is known by in HPMS
Parent Organization The parent organization of the contract
Appeal Number The case ID assigned to the appeal request
Request Received Date The date the appeal was received by the IRE
Deadline The deadline for the decision
Appeal Priority The priority of the appeal (standard or expedited)
Appeal Disposition The disposition of the IRE (Maximus)
Appeal End Date The end date of the appeal

(Last Updated 10/03/2014) Page 114
HPMS Field Label Field Description
Status The status of the appeal
S. Measure Detail – Disenrollment
The Measure Detail – Disenrollment page contains data that is used in calculating measure D04. The page shows the denominator, unadjusted numerator and original rate received from the MBDSS annual report. It also contains the adjusted numerator and final rate after all members meeting the measure exclusion criteria described in the measure description have been removed. This page is available during the first plan preview. Table P-15 below explains each of the columns displayed on this page.
Table P-15: Measure Detail – Disenrollment
HPMS Field Label Field Description
Contract Number The contract number associated with the data
Organization Marketing Name The name the contract markets to members
Contract Name The name the contract is known by in HPMS
Parent Organization The parent organization of the contract
Number Enrolled The number of all members in the contract from MBDSS annual report
Number Disenrolled The number of disenrollment with a disenrollment reason code of 11, 13, 14 or 99, from the MBDSS annual report
Original Rate The disenrollment rate calculated as calculated by the annual MBDSS report
Adjusted Disenrolled The adjusted numerator when all members which meet the measure exclusion criteria are removed
Adjusted Rate The final adjusted disenrollment rate used in the Star Ratings
>1000 Enrolled Flag indicates if the contract enrollment had greater than 1,000 non-employer group members enrolled during the year (True = Yes, False = No)
T. Measure Detail – Improvement page
The Measure Detail – Improvement page is constructed in the same manner as the Measure Data page. This page is available during the second plan preview.
The first four columns contain contract identifying information. The remaining columns contain the results of the improvement calculation for the specific Part D measure. There is one column for each of the Part D measures. The measure columns are identified by measure id and measure name. There is one additional column all the way to the right which contains the final improvement score. This is the numeric result from step 4 as described in Attachment I: “Calculating the Improvement Measure and the Measures Used”.
The two rows immediately above this measure information contain the domain id, domain name, and the data time frame of the measure. The row below the measure information contains a flag (Included or Not Included) to show if the measure was used to calculate final improvement measure. All subsequent rows contain the data associated with an individual contract.
The possible results for measure calculations are shown in Table P-16 below.
Table P-16: Measure Improvement Results
Improvement Measure Result Description
No significant change There was no significant change in the values between the two years
Significant improvement There was a significant improvement from last year to this year
Significant decline There was a significant decline from last year to this year
Not included in calculation There was only one year of data available so the calculation could not be completed
Not Applicable The measure is not an improvement measure
Not Eligible The contract did not have data in more than half of the improvement measures or was too new
Held Harmless The contract had 5 stars in this measure last year and this year

(Last Updated 10/03/2014) Page 115
U. Measure Star page
The Measure Star page displays the numeric data for each Part D measure. This page is available during the second plan preview.
The first four columns contain contract identifying information. The remaining columns contain the measure data which will display in MPF. There is one column for each of the Part D measures. The measure columns are identified by measure id and measure name. The two rows immediately above this measure information contain the domain id, domain name, and the data time frame. All subsequent rows contain the stars associated with an individual contract.
V. Domain Star page
The Domain Star page displays the Star Rating for each Part D domain. This page is available during the second plan preview.
The first four columns contain contract identifying information. The remaining columns contain the domain stars which will display in MPF. There is one column for each of the Part D domains. The domain columns are identified by the domain name. All subsequent rows contain the stars associated with an individual contract.
W. Summary Rating page
The Summary Rating page displays the Part D rating and data associated with calculating the final summary rating. This page is available during the second plan preview. Table P-17 below explains each of the columns contained on this page.
Table P-17: Part D Summary Rating View
HPMS Field Label Field Description
Contract Number The contract number associated with the data
Contract Name The name the contract is known by in HPMS
Organization Marketing Name The name the contract markets to members
Contract Name The name the contract is known by in HPMS
Contract Type The contract plan type used to compute the ratings
Number Measures Required The minimum number of measures required to calculate a final rating out of the total number of measures required for this contract type.
Number Missing Measures The number of measures that were missing stars
Number Rated Measures The number of measures that were assigned stars
Calculated Summary Mean Contains the mean of the stars for rated measures
Calculated Variance The variance of the calculated summary mean
Variance Category The integration factor variance category for the contract
Integration Factor The integration factor for the contract
Integration Summary Contains the sum of the Calculated Summary Mean and the Integration Factor
Improvement Measure Usage Was the improvement measure (D05) used in the final Part D Summary Rating? (Yes/No)
2015 Part D Summary Rating The final rounded 2015 Part D Summary Rating
Sanction Deduction Did this contract receive an adjustment to the Part D Summary rating for contracts under sanction (Yes/No)
Calculated Score Percentile Rank Percentile ranking of Calculated Summary Mean
Variance Percentile Rank Percentile ranking of Calculated Variance
X. Low Performing Contract List
The Low Performing Contract List page displays the contracts that received a Low Performing Icon and the data used to calculate the assignment. This page is available during the second plan preview. HPMS users in contracting organizations will see only their own contracts in this list. None will be displayed if no contract in the
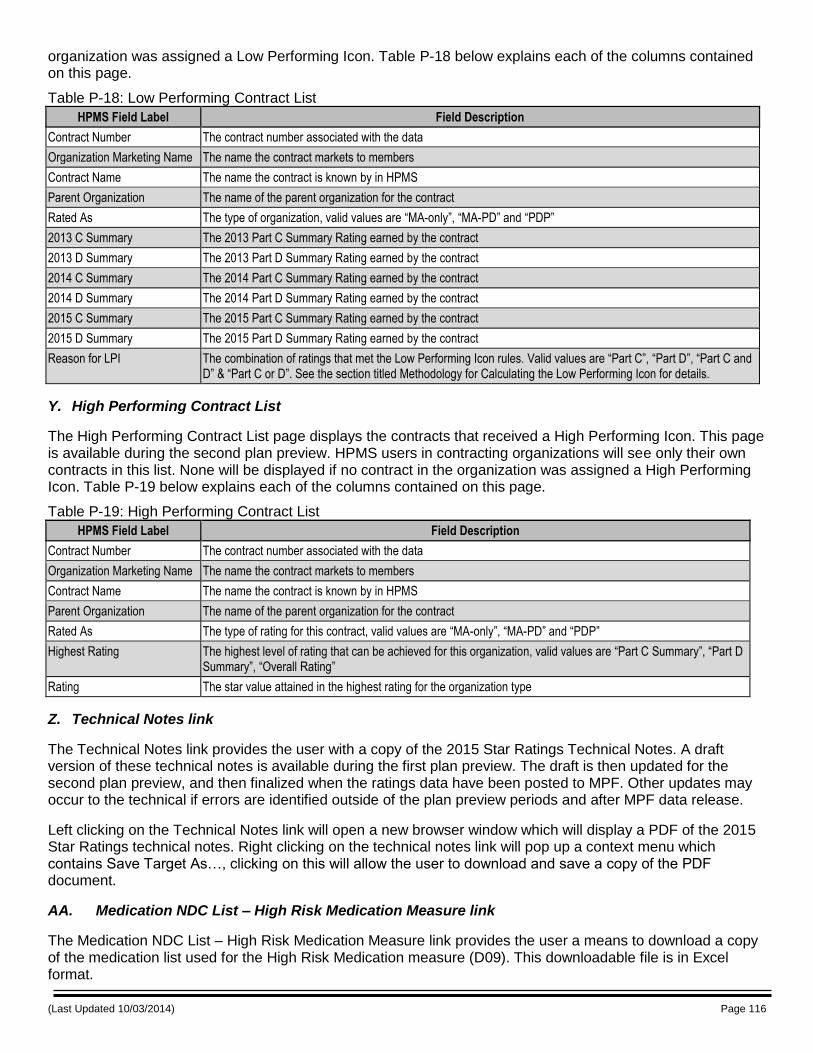
(Last Updated 10/03/2014) Page 116
organization was assigned a Low Performing Icon. Table P-18 below explains each of the columns contained on this page.
Table P-18: Low Performing Contract List
HPMS Field Label Field Description
Contract Number The contract number associated with the data
Organization Marketing Name The name the contract markets to members
Contract Name The name the contract is known by in HPMS
Parent Organization The name of the parent organization for the contract
Rated As The type of organization, valid values are “MA-only”, “MA-PD” and “PDP”
2013 C Summary The 2013 Part C Summary Rating earned by the contract
2013 D Summary The 2013 Part D Summary Rating earned by the contract
2014 C Summary The 2014 Part C Summary Rating earned by the contract
2014 D Summary The 2014 Part D Summary Rating earned by the contract
2015 C Summary The 2015 Part C Summary Rating earned by the contract
2015 D Summary The 2015 Part D Summary Rating earned by the contract
Reason for LPI The combination of ratings that met the Low Performing Icon rules. Valid values are “Part C”, “Part D”, “Part C and D” & “Part C or D”. See the section titled Methodology for Calculating the Low Performing Icon for details.
Y. High Performing Contract List
The High Performing Contract List page displays the contracts that received a High Performing Icon. This page is available during the second plan preview. HPMS users in contracting organizations will see only their own contracts in this list. None will be displayed if no contract in the organization was assigned a High Performing Icon. Table P-19 below explains each of the columns contained on this page.
Table P-19: High Performing Contract List
HPMS Field Label Field Description
Contract Number The contract number associated with the data
Organization Marketing Name The name the contract markets to members
Contract Name The name the contract is known by in HPMS
Parent Organization The name of the parent organization for the contract
Rated As The type of rating for this contract, valid values are “MA-only”, “MA-PD” and “PDP”
Highest Rating The highest level of rating that can be achieved for this organization, valid values are “Part C Summary”, “Part D Summary”, “Overall Rating”
Rating The star value attained in the highest rating for the organization type
Z. Technical Notes link
The Technical Notes link provides the user with a copy of the 2015 Star Ratings Technical Notes. A draft version of these technical notes is available during the first plan preview. The draft is then updated for the second plan preview, and then finalized when the ratings data have been posted to MPF. Other updates may occur to the technical if errors are identified outside of the plan preview periods and after MPF data release.
Left clicking on the Technical Notes link will open a new browser window which will display a PDF of the 2015 Star Ratings technical notes. Right clicking on the technical notes link will pop up a context menu which contains Save Target As , clicking on this will allow the user to download and save a copy of the PDF document.
AA. Medication NDC List – High Risk Medication Measure link
The Medication NDC List – High Risk Medication Measure link provides the user a means to download a copy of the medication list used for the High Risk Medication measure (D09). This downloadable file is in Excel format.

(Last Updated 10/03/2014) Page 117
BB. Medication NDC List – Diabetes Treatment Measure link
The Medication NDC List – Diabetes Treatment Measure link provides the user a means to download a copy of the medication list used for the Diabetes Treatment measure (D10). This downloadable file is in Excel format.
CC. Medication NDC List – Medication Adherence Measure link
The Medication NDC List – Medication Adherence Measure link provides the user a means to download a copy of the medication lists used for the Medication Adherence measures (D11, D12 & D13). This downloadable file is in Excel format.