Medicare 2022 Part C & D Star Ratings Technical Notes
177
Medicare 2022 Part C & D Star Ratings Technical Notes
Transcript of Medicare 2022 Part C & D Star Ratings Technical Notes
Medicare 2022 Part C & D
Star Ratings Technical Notes
(Last Updated 10/3/2021) DRAFT Page 2
Updated – 10/04/2021
(Last Updated 10/3/2021) Page i
Document Change Log
Previous Version Description of Change
Revision Date
OMB Approved Data Sources
The data collected for the Part C & D Star Ratings come from a variety of different data sources approved under the following Office of Management and Budget (OMB) Paperwork Reduction Act numbers:
Data Source OMB Number
Consumer Assessment of Healthcare Providers and Systems (CAHPS) Surveys 0938-0732
Health Outcomes Survey (HOS) 0938-0701
Healthcare Effectiveness Data and Information Set (HEDIS) 0938-1028
Part C Reporting Requirements 0938-1054
Part D Reporting Requirements 0938-0992
Data Validation of Part C/D Reporting Requirements data 0938-1115
(Last Updated 10/3/2021) Page ii
Table of Contents
DOCUMENT CHANGE LOG .............................................................................................................................. I
INTRODUCTION ............................................................................................................................................... 1
DIFFERENCES BETWEEN THE 2021 STAR RATINGS AND 2022 STAR RATINGS ..................................... 1
HEALTH/DRUG ORGANIZATION TYPES INCLUDED IN THE STAR RATINGS ............................................ 2 Table 1: Contract Year 2022 Organization Types Reported in the 2022 Star Ratings .................................................... 2
THE STAR RATINGS FRAMEWORK ............................................................................................................... 2 Figure 1: The Four Levels of Star Ratings ..................................................................................................................... 3 Table 2: 5-Star Scale .................................................................................................................................................... 3 Table 3: Relation of 2022 Organization Types to Contract Types and Highest Rating in the 2022 Star Ratings ............. 4
SOURCES OF THE STAR RATINGS MEASURE DATA .................................................................................. 4 Figure 2: The Four Categories of Data Sources ............................................................................................................ 5
IMPROVEMENT MEASURES ........................................................................................................................... 5 Table 4: Minimum Number of Measure Scores Required for an Improvement Measure Rating by Contract Type .......... 5
CONTRACT ENROLLMENT DATA .................................................................................................................. 5
HANDLING OF BIASED, ERRONEOUS, AND/OR NOT REPORTABLE (NR) DATA ...................................... 5
SCALED REDUCTIONS FOR THE APPEALS MEASURES ............................................................................ 6
DATA HANDLING OF MEASURES FOR CONTRACTS AFFECTED BY A MAJOR DISASTER..................... 7
METHODOLOGY FOR ASSIGNING STARS TO THE PART C AND PART D MEASURES ............................ 9
A. Clustering ............................................................................................................................................................... 9
B. Relative Distribution and Significance Testing (CAHPS)...................................................................................... 9
METHODOLOGY FOR CALCULATING STARS AT THE DOMAIN LEVEL ..................................................... 9 Table 5: Minimum Number of Rated Measures Required for a Domain Rating by Contract Type ..................................10
SUMMARY AND OVERALL RATINGS: WEIGHTING OF MEASURES ......................................................... 10
METHODOLOGY FOR CALCULATING PART C AND PART D SUMMARY RATINGS ................................ 11 Table 6: Minimum Number of Rated Measures Required for Part C and Part D Ratings by Contract Type....................11
METHODOLOGY FOR CALCULATING THE OVERALL MA-PD RATING .................................................... 11 Table 7: Minimum Number of Rated Measures Required for an Overall Rating by Contract Type .................................12
COMPLETING THE SUMMARY AND OVERALL RATING CALCULATIONS................................................ 12
APPLYING THE IMPROVEMENT MEASURE(S) ........................................................................................... 12
APPLYING THE REWARD FACTOR ............................................................................................................. 13 Table 8: Performance Summary Thresholds ................................................................................................................14 Table 9: Variance Thresholds ......................................................................................................................................14
CATEGORICAL ADJUSTMENT INDEX (CAI) ................................................................................................ 14 Table 10: Categorization of Contract’s Members into LIS/DE Initial Groups for the Overall Rating ................................16 Table 11: Categorization of Contract’s Members into Disability Quintiles for the Overall Rating ....................................16 Table 12: Final Adjustment Categories and CAI Values for the Overall Rating .............................................................16 Table 13: Categorization of Contract’s Members into LIS/DE Initial Groups for the Part C Summary ............................17 Table 14: Categorization of Contract’s Members into Disability Quintiles for the Part C Summary ................................17 Table 15: Final Adjustment Categories and CAI Values for the Part C Summary ..........................................................17 Table 16: Categorization of Contract’s Members into LIS/DE Initial Groups for the MA-PD Part D Summary ................18 Table 17: Categorization of Contract’s Members into Disability Quintiles for the MA-PD Part D Summary ....................18 Table 18: Final Adjustment Categories and CAI Values for the MA-PD Part D Summary ..............................................18 Table 19: Categorization of Contract’s Members into Quartiles of LIS/DE for the PDP Part D Summary .......................18 Table 20: Categorization of Contract’s Members into Quartiles of Disability for the PDP Part D Summary ....................19 Table 21: Final Adjustment Categories and CAI Values for the PDP Part D Summary ..................................................19
(Last Updated 10/3/2021) Page iii
CALCULATION PRECISION .......................................................................................................................... 19
ROUNDING RULES FOR MEASURE SCORES ............................................................................................. 19
ROUNDING RULES FOR SUMMARY AND OVERALL RATINGS ................................................................. 20 Table 22: Rounding Rules for Summary and Overall Ratings .......................................................................................20
METHODOLOGY FOR CALCULATING THE HIGH PERFORMING ICON ..................................................... 20 Figure 3: The High Performing Icon .............................................................................................................................20
METHODOLOGY FOR CALCULATING THE LOW PERFORMING ICON ..................................................... 20 Figure 4: The Low Performing Icon ..............................................................................................................................20 Table 23: Example LPI Contracts ................................................................................................................................21
MERGERS, NOVATIONS, AND CONSOLIDATIONS ..................................................................................... 21
RELIABILITY REQUIREMENT FOR LOW-ENROLLMENT CONTRACTS ..................................................... 21
SPECIAL NEEDS PLAN (SNP) DATA ............................................................................................................ 21
STAR RATINGS AND MARKETING ............................................................................................................... 22
CONTACT INFORMATION ............................................................................................................................. 22
FRAMEWORK AND DEFINITIONS FOR THE DOMAIN AND MEASURE DETAILS SECTION ..................... 24
PART C DOMAIN AND MEASURE DETAILS ................................................................................................ 25
Domain: 1 - Staying Healthy: Screenings, Tests and Vaccines ............................................................................... 25 Measure: C01 - Breast Cancer Screening ............................................................................................................ 25 Measure: C02 - Colorectal Cancer Screening ....................................................................................................... 26 Measure: C03 - Annual Flu Vaccine ..................................................................................................................... 27 Measure: C04 - Monitoring Physical Activity ......................................................................................................... 28
Domain: 2 - Managing Chronic (Long Term) Conditions ......................................................................................... 30 Measure: C05 - Special Needs Plan (SNP) Care Management ............................................................................. 30 Measure: C06 - Care for Older Adults – Medication Review.................................................................................. 32 Measure: C07 - Care for Older Adults – Pain Assessment .................................................................................... 33 Measure: C08 - Osteoporosis Management in Women who had a Fracture .......................................................... 34 Measure: C09 - Diabetes Care – Eye Exam ......................................................................................................... 35 Measure: C10 - Diabetes Care – Kidney Disease Monitoring ................................................................................ 36 Measure: C11 - Diabetes Care – Blood Sugar Controlled ..................................................................................... 37 Measure: C12 - Rheumatoid Arthritis Management .............................................................................................. 39 Measure: C13 - Reducing the Risk of Falling ........................................................................................................ 40 Measure: C14 - Improving Bladder Control ........................................................................................................... 41 Measure: C15 - Medication Reconciliation Post-Discharge ................................................................................... 42 Measure: C16 - Statin Therapy for Patients with Cardiovascular Disease ............................................................. 43
Domain: 3 - Member Experience with Health Plan ................................................................................................... 46 Measure: C17 - Getting Needed Care .................................................................................................................. 46 Measure: C18 - Getting Appointments and Care Quickly ...................................................................................... 47 Measure: C19 - Customer Service........................................................................................................................ 48 Measure: C20 - Rating of Health Care Quality ...................................................................................................... 49 Measure: C21 - Rating of Health Plan .................................................................................................................. 50 Measure: C22 - Care Coordination ....................................................................................................................... 50
Domain: 4 - Member Complaints and Changes in the Health Plan's Performance ................................................. 52 Measure: C23 - Complaints about the Health Plan ............................................................................................... 52 Measure: C24 - Members Choosing to Leave the Plan ......................................................................................... 53 Measure: C25 - Health Plan Quality Improvement ................................................................................................ 54
Domain: 5 - Health Plan Customer Service .............................................................................................................. 56 Measure: C26 - Plan Makes Timely Decisions about Appeals ............................................................................... 56 Measure: C27 - Reviewing Appeals Decisions ...................................................................................................... 57 Measure: C28 - Call Center – Foreign Language Interpreter and TTY Availability ................................................. 58
PART D DOMAIN AND MEASURE DETAILS ................................................................................................ 60
Domain: 1 - Drug Plan Customer Service ................................................................................................................. 60 Measure: D01 - Call Center – Foreign Language Interpreter and TTY Availability ................................................. 60
(Last Updated 10/3/2021) Page iv
Domain: 2 - Member Complaints and Changes in the Drug Plan’s Performance ................................................... 62 Measure: D02 - Complaints about the Drug Plan .................................................................................................. 62 Measure: D03 - Members Choosing to Leave the Plan ......................................................................................... 63 Measure: D04 - Drug Plan Quality Improvement ................................................................................................... 64
Domain: 3 - Member Experience with the Drug Plan ............................................................................................... 66 Measure: D05 - Rating of Drug Plan ..................................................................................................................... 66 Measure: D06 - Getting Needed Prescription Drugs ............................................................................................. 67
Domain: 4 - Drug Safety and Accuracy of Drug Pricing .......................................................................................... 68 Measure: D07 - MPF Price Accuracy .................................................................................................................... 68 Measure: D08 - Medication Adherence for Diabetes Medications ......................................................................... 69 Measure: D09 - Medication Adherence for Hypertension (RAS antagonists) ......................................................... 72 Measure: D10 - Medication Adherence for Cholesterol (Statins) ........................................................................... 74 Measure: D11 - MTM Program Completion Rate for CMR .................................................................................... 76 Measure: D12 - Statin Use in Persons with Diabetes (SUPD) ............................................................................... 79
ATTACHMENT A: CAHPS CASE-MIX ADJUSTMENT .................................................................................. 81
CAHPS Case-Mix Adjustment ................................................................................................................................... 81 Table A-1: Coefficients of Part C CAHPS Measures ....................................................................................................81 Table A-2: Coefficients of Part D CAHPS Measures ....................................................................................................83
ATTACHMENT B: CALCULATING MEASURE DATA FOR THE SURVIVING CONTRACT OF A CONSOLIDATION .......................................................................................................................................... 84
ATTACHMENT C: NATIONAL AVERAGES FOR PART C AND D MEASURES ........................................... 85 Table C-1: National Averages for Part C Measures ......................................................................................................85 Table C-2: National Averages for Part D Measures ......................................................................................................86
ATTACHMENT D: PART C AND D DATA TIME FRAMES ............................................................................. 87 Table D-1: Part C Measure Data Time Frames ............................................................................................................87 Table D-2: Part D Measure Data Time Frames ............................................................................................................88
ATTACHMENT E: SNP MEASURE SCORING METHODOLOGIES .............................................................. 89 1. Medicare Part C Reporting Requirements Measure (C05: SNP Care Management) ...............................................89 2. NCQA HEDIS Measures - (C06 – C07: Care for Older Adults) ...............................................................................90
ATTACHMENT F: WEIGHTS ASSIGNED TO INDIVIDUAL PERFORMANCE MEASURES .......................... 91 Table F-1: Part C Measure Weights .............................................................................................................................91 Table F-2: Part D Measure Weights .............................................................................................................................92
ATTACHMENT G: CALCULATION OF WEIGHTED STAR RATING AND VARIANCE ESTIMATES ............ 93
ATTACHMENT H: CALCULATING THE IMPROVEMENT MEASURE AND THE MEASURES USED .......... 94
Calculating the Improvement Measure ..................................................................................................................... 94
General Standard Error Formula .............................................................................................................................. 95
Improvement Change Score Standard Error Numerical Example ........................................................................... 95
Standard Error Formulas (SEF) for Specific Measures ............................................................................................ 95 1. SEF for Measures: C01, C02, C04, C05, C08 – C15, C16, C24, C26 – C28, D01, D03, D08 – D12........................97 2. SEF for Measures: C06, C07 .................................................................................................................................97 3. SEF for Measures: C03, C17 – C22, and D05, D06 ...............................................................................................97 4. SEF for Measures C23, D02 ..................................................................................................................................97
Star Ratings Measures Used in the Improvement Measures ................................................................................... 98 Table H-1: Part C Measures Used in the Improvement Measure ..................................................................................98 Table H-2: Part D Measures Used in the Improvement Measure ..................................................................................99
ATTACHMENT I: STAR RATINGS MEASURE HISTORY ............................................................................ 100 Table I-1: Part C Measure History ..............................................................................................................................100 Table I-2: Part D Measure History ..............................................................................................................................104 Table I-3: Common Part C & Part D Measure History ................................................................................................108
ATTACHMENT J: INDIVIDUAL MEASURE STAR ASSIGNMENT PROCESS ............................................ 109
Clustering Methodology Introduction ..................................................................................................................... 109 Figure J-1: Diagram showing gaps in data where cut points are assigned ..................................................................109
Example 1 – Clustering Methodology for a Higher is Better measure .................................................................. 109
(Last Updated 10/3/2021) Page v
Table J-1: Medication Adherence for Diabetes Medications cut points example .........................................................110
Example 2 – Clustering Methodology for a Lower is Better measure ................................................................... 110 Table J-2: Members Choosing to Leave the Plan cut points example .........................................................................110
Clustering Methodology Detail ............................................................................................................................... 110 1. Produce the individual measure distance matrix. ..................................................................................................111 2. Create a tree of cluster assignments. ...................................................................................................................111 3. Select the final set of clusters from the tree of cluster assignments. .....................................................................112 4. Final Thresholds ..................................................................................................................................................112 Table J-3: 2022 Star Ratings Part C non-CAHPS Measure Mean Resampling Estimated Thresholds ........................113 Table J-4: 2022 Star Ratings Part D non-CAHPS Measure Mean Resampling Estimated Thresholds ........................113
Relative Distribution and Significance Testing (CAHPS) Methodology ................................................................ 113 Table J-5: CAHPS Star Assignment Rules .................................................................................................................114 Table J-6: CAHPS Star Assignment Alternate Representation ...................................................................................114
ATTACHMENT K: MEDICATION ADHERENCE MEASURE CALCULATIONS ........................................... 116
Proportion of Days Covered Calculation ................................................................................................................ 116
Example 1: Non-Overlapping Fills of Two Different Drugs .................................................................................... 116 Table K-1: No Adjustment..........................................................................................................................................116
Example 2: Overlapping Fills of the Same Generic Ingredient across Single and Combination Products ......... 116 Table K-2: Before Overlap Adjustment .......................................................................................................................116 Table K-3: After Overlap Adjustment..........................................................................................................................117
Example 3: Overlapping Fills of the Same and Different Target Drugs................................................................. 117 Table K-4: Before Overlap Adjustment .......................................................................................................................117 Table K-5: After Overlap Adjustment..........................................................................................................................117
PDC Adjustment for Inpatient, Hospice, and Skilled Nursing Facility Stays Examples ....................................... 118
Calculating the PDC Adjustment for IP Stays and SNF Stays ............................................................................... 118
Example 1: Gap in Coverage after IP Stay .............................................................................................................. 119 Table K-6: Before Adjustment ....................................................................................................................................119 Table K-7: After Adjustment .......................................................................................................................................119
Example 2: Gap in Coverage before IP Stay........................................................................................................... 119 Table K-8: Before Adjustment ....................................................................................................................................119 Table K-9: After Adjustment .......................................................................................................................................120
Example 3: Gap in Coverage Before and After IP Stay .......................................................................................... 120 Table K-10: Before Adjustment ..................................................................................................................................120 Table K-11: After Adjustment .....................................................................................................................................120
Example 4: Gap in Coverage After IP Stay and Overlap with Subsequent Fill of the Same Drug Class ............. 120 Table K-12: Before Adjustment ..................................................................................................................................120 Table K-13: After Adjustment .....................................................................................................................................121
ATTACHMENT L: METHODOLOGY FOR PRICE ACCURACY MEASURE ................................................ 122
Example of Accuracy Index Calculation ................................................................................................................. 125 Table L-1: Example of Price Accuracy Index Calculation ............................................................................................125
ATTACHMENT M: MTM CMR COMPLETION RATE MEASURE SCORING METHODOLOGIES ............... 126
Medicare Part D Reporting Requirements Measure (D11: MTM CMR Completion Rate Measure) ....................... 126
ATTACHMENT N: METHODOLOGY FOR THE PUERTO RICO MODEL .................................................... 128
ATTACHMENT O: SCALED REDUCTIONS FOR APPEALS IRE DATA ..................................................... 131
Part C Scaled Reduction Methodology ................................................................................................................... 131
Stage 1: Determine Whether the Contract is Subject to a Potential Reduction for the Part C Appeals Measures Due to an IRE Data Completeness Issue ................................................................................................................ 131 Table O-1: Multiplying Factor to calculate the 3-month Projected Number of Cases Not Forwarded to the IRE ...........132 Table O-2: Identification of a Contract that is Subject to a Possible Scaled Reduction ................................................132
Stage 2: Estimated Error Rate................................................................................................................................. 132
Stage 3: Scaled Reduction ...................................................................................................................................... 133 Table O-3: Thresholds and Associated Reductions ....................................................................................................133
ATTACHMENT P: IDENTIFICATION OF CONTRACTS AFFECTED BY DISASTERS ................................ 135
(Last Updated 10/3/2021) Page vi
Operational Steps to Calculating Enrollment Impacted in Affected Contracts..................................................... 135 Table P-1: List of Section 1135 waivers issued in relation to the FEMA major disaster declarations ...........................135 Table P-2: List of FEMA disaster declarations issued as a result of the COVID-19 outbreak .......................................135 Table P-3: Individual Assistance counties in FEMA Major Disaster Declared States Other than from the COVID-19 Pandemic ..................................................................................................................................................................137 Table P-4: Organization type service areas and necessary transformations ...............................................................137 Table P-5: Major disasters with associated enrollment months...................................................................................137 Table P-6: How enrollment periods were combined for contracts experiencing multiple disasters ...............................138
Example: .................................................................................................................................................................. 138 Table P-7: Example contract HAAAA’s service areas and enrollment during relevant disasters ..................................139
ATTACHMENT Q: MISSING DATA MESSAGES ......................................................................................... 141
Measure level messages ......................................................................................................................................... 141 Table Q-1: Measure level missing data messages .....................................................................................................141
Assignment rules for Part C measure messages ................................................................................................... 141
Assignment rules for Part D measure messages ................................................................................................... 145 Table Q-2: MTM CMR reason(s) for display message conversion ..............................................................................146
Domain, Summary, and Overall level messages .................................................................................................... 147 Table Q-3: Domain, summary, and overall level missing data messages....................................................................147
Assignment rules for Part C & Part D domain rating level messages ................................................................... 147
Assignment rules for Part C & Part D summary rating level messages................................................................ 147
Assignment rules for overall rating level messages .............................................................................................. 147
Disenrollment Reasons messages ......................................................................................................................... 148 Table Q-4: Disenrollment reason missing data messages ..........................................................................................148
ATTACHMENT R: GLOSSARY OF TERMS ................................................................................................. 149
ATTACHMENT S: HEALTH PLAN MANAGEMENT SYSTEM MODULE REFERENCE .............................. 152
HPMS Star Ratings Module ..................................................................................................................................... 152 1. Measure Data page .............................................................................................................................................152 Table S-1: Measure Data page sample ......................................................................................................................152 2. Measure Detail page............................................................................................................................................152 Table S-2: Measure Detail page fields .......................................................................................................................154 3. Measure Detail – Part C Appeals page ................................................................................................................154 Table S-3: Measure Detail – Part C Appeals page fields ............................................................................................154 4. Measure Detail – SNP CM page ..........................................................................................................................154 Table S-4: Measure Detail – SNP CM page fields ......................................................................................................155 5. Measure Detail – SNP COA page ........................................................................................................................155 Table S-5: Measure Detail – SNP COA page fields ....................................................................................................155 Table S-6: HEDIS 2020 Audit Designations and 2022 Star Ratings ............................................................................155 6. Measure Detail – CTM page ................................................................................................................................156 Table S-7: Measure Detail – CTM page fields ............................................................................................................156 7. Measure Detail – Disenrollment ...........................................................................................................................156 Table S-8: Measure Detail – Disenrollment page fields ..............................................................................................156 8. Measure Detail – DR (Disenrollment Reasons) ....................................................................................................156 Table S-9: Measure Detail – Disenrollment Reasons page fields ...............................................................................156 9. Measure Detail – MTM page ................................................................................................................................157 Table S-10: Measure Detail – MTM page fields..........................................................................................................157 10. Measure Detail – CAHPS page ............................................................................................................................157 Table S-11: Measure Detail – CAHPS page fields .....................................................................................................158 11. Calculation Detail – CSR .....................................................................................................................................158 Table S-12: Measure Detail – Part C Scaled Reductions page fields ..........................................................................158 12. Calculation Detail – MD .......................................................................................................................................158 Table S-13: Calculation Detail – MD page fields ........................................................................................................159 13. Calculation Detail – CAI .......................................................................................................................................159 Table S-14: Measure Detail – CAI page fields ............................................................................................................160 14. Measure Detail – HEDIS LE page ........................................................................................................................160 Table S-15: Measure Detail – HEDIS LE page fields ..................................................................................................161 15. Measure Detail – C Disaster Results ....................................................................................................................161 Table S-16: Measure Detail – C Disaster Results ......................................................................................................161
(Last Updated 10/3/2021) Page vii
16. Measure Detail – D Disaster Results ....................................................................................................................161 Table S-17: Measure Detail – D Disaster Results ......................................................................................................162 17. Measure Detail – C Improvement page ................................................................................................................162 Table S-18: Part C Measure Improvement Results ....................................................................................................162 18. Measure Detail – D Improvement page ................................................................................................................162 Table S-19: Part D Measure Improvement Results ....................................................................................................163 19. Measure Stars page ............................................................................................................................................163 Table S-20: Measure Star page sample .....................................................................................................................163 20. Domain Stars page ..............................................................................................................................................163 Table S-21: Domain Star page sample ......................................................................................................................164 21. Part C Summary Rating page ..............................................................................................................................164 Table S-22: Part C Summary Rating page fields ........................................................................................................164 22. Part D Summary Rating page ..............................................................................................................................164 Table S-23: Part D Summary Rating View .................................................................................................................165 23. Overall Rating page .............................................................................................................................................165 Table S-24: Overall Rating View ................................................................................................................................165 24. Highest Rating page ............................................................................................................................................166 Table S-25: Highest Rating View ...............................................................................................................................166 25. Low Performing Contract List ...............................................................................................................................166 Table S-26: Low Performing Contract List ..................................................................................................................167 26. High Performing Contract List ..............................................................................................................................167 Table S-27: High Performing Contract List .................................................................................................................167 27. Technical Notes link ............................................................................................................................................167 28. Medication NDC List ............................................................................................................................................167 29. Part C and Part D Example Measure Data ...........................................................................................................168
(Last Updated 10/3/2021) Page 1
Introduction
CMS created the Part C & D Star Ratings to provide quality and performance information to Medicare beneficiaries to assist them in choosing their health and drug services during the annual fall open enrollment period. We refer to them as the ‘2022 Medicare Part C & D Star Ratings’ because they are posted prior to the 2022 open enrollment period.
This document describes the methodology for creating the Part C & D Star Ratings displayed on the Medicare Plan Finder (MPF) at http://www.medicare.gov/ and posted on the CMS website at http://go.cms.gov/partcanddstarratings. A Glossary of Terms used in this document can be found in Attachment R.
The Star Ratings data are also displayed in the Health Plan Management System (HPMS). In the HPMS the data can be found by selecting: “Quality and Performance,” then “Performance Metrics,” then “Reports,” then “Star Ratings and Display Measures,” then “Star Ratings” for the report type, and “2022” for the report period. See Attachment S: Health Plan Management System Module Reference for descriptions of the HPMS pages.
The Star Ratings Program is consistent with the “Meaningful Measures” framework which focuses on the highest priority areas for quality measurement and improvement, including promote effective communication and coordination of care; promote effective prevention and treatment of chronic disease; work with communities to promote best practices of healthy living; make care affordable; make care safer by reducing harm caused by the delivery of care; and strengthen person and family engagement as partners in their care. The Star Ratings include measures applying to the following five broad categories:
Outcomes: Outcome measures reflect improvements in a beneficiary’s health and are central to assessing quality of care.
Intermediate outcomes: Intermediate outcome measures reflect actions taken which can assist in improving a beneficiary’s health status. Diabetes Care – Blood Sugar Controlled is an example of an intermediate outcome measure where the related outcome of interest would be better health status for beneficiaries with diabetes.
Patient experience: Patient experience measures reflect beneficiaries’ perspectives of the care they received.
Access: Access measures reflect processes and issues that could create barriers to receiving needed care. Plan Makes Timely Decisions about Appeals is an example of an access measure.
Process: Process measures capture the health care services provided to beneficiaries which can assist in maintaining, monitoring, or improving their health status.
Differences between the 2021 Star Ratings and 2022 Star Ratings
There have been several changes between the 2021 Star Ratings and the 2022 Star Ratings. This section provides a synopsis of the notable differences; the reader should examine the entire document for full details about the 2022 Star Ratings. A table with the complete history of measures used in the Star Ratings can be found in Attachment I.
Changes
a. For 2022 Star Ratings, the underlying data for HEDIS and CAHPS measures will resume use of the
most recent data.
b. Mean resampling was added to the hierarchical clustering methodology that is used to set cut points for non-CAHPS measures.
c. Re-specified MPF Price Accuracy measure moved into the 2022 Star Ratings as a new measure.
d. For 2022 Star Ratings only, expanded the existing improvement measure hold harmless provision to all contracts at the overall and summary rating levels.
(Last Updated 10/3/2021) Page 2
e. For 2022 Star Ratings only, modify the disaster policy to remove application of the 60% rule and avoid the exclusion of contracts with 60% or more of their enrollees living in FEMA-designated Individual Assistance areas from calculation of the non-CAHPS measure-level cut points and calculation of the Reward Factor.
Transitioned measures (Moved to the display page on the CMS website:
http://go.cms.gov/partcanddstarratings)
1) Part C measure – Care of Older Adults – Functional Status Assessment was temporarily moved to the display page for the 2022 and 2023 Star Ratings because NCQA made substantive changes to the measure specification.
2) For the 2022 and 2023 Star Ratings, Improving or Maintaining Physical Health and Improving or Maintaining Mental Health will be moved to the display page on CMS.gov due to validity concerns related to the COVID-19 public health emergency.
Retired measures
Part C measure – Adult BMI Assessment
Part D measure – Appeals Auto-Forward
Part D measure – Appeals Upheld
Health/Drug Organization Types Included in the Star Ratings
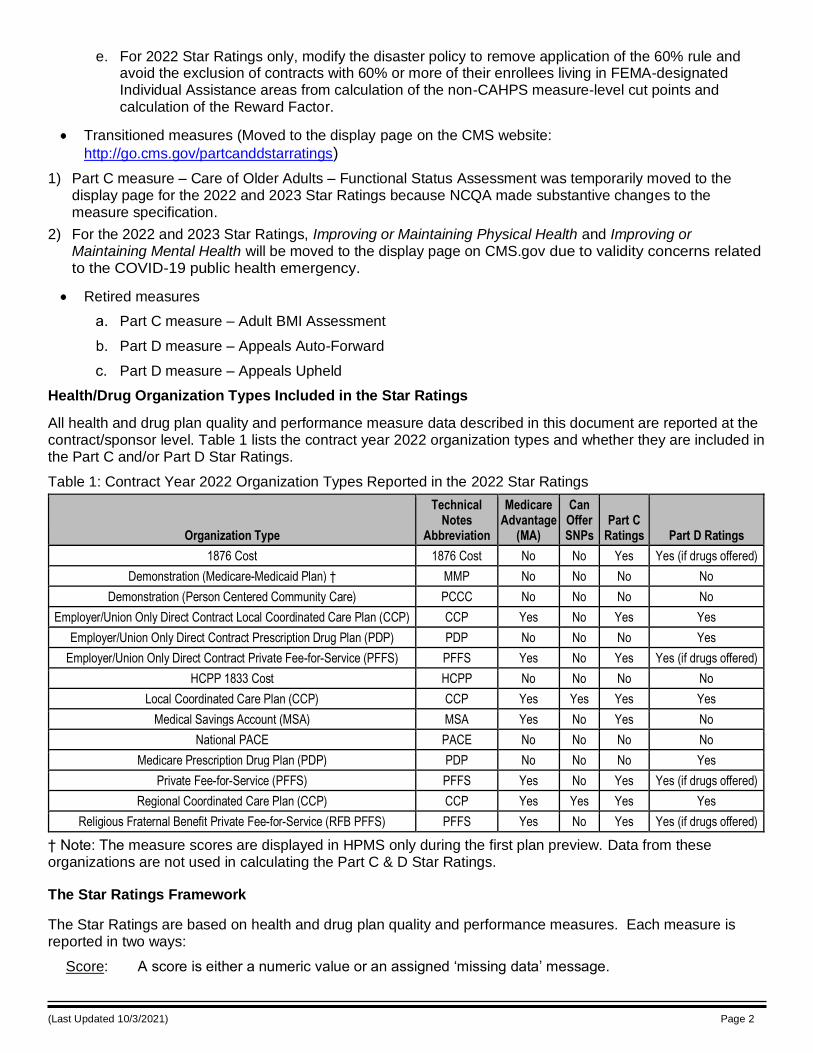
All health and drug plan quality and performance measure data described in this document are reported at the contract/sponsor level. Table 1 lists the contract year 2022 organization types and whether they are included in the Part C and/or Part D Star Ratings.
Table 1: Contract Year 2022 Organization Types Reported in the 2022 Star Ratings
Organization Type
Technical Notes
Abbreviation
Medicare Advantage
(MA)
Can Offer SNPs
Part C Ratings Part D Ratings
1876 Cost 1876 Cost No No Yes Yes (if drugs offered)
Demonstration (Medicare-Medicaid Plan) † MMP No No No No
Demonstration (Person Centered Community Care) PCCC No No No No
Employer/Union Only Direct Contract Local Coordinated Care Plan (CCP) CCP Yes No Yes Yes
Employer/Union Only Direct Contract Prescription Drug Plan (PDP) PDP No No No Yes
Employer/Union Only Direct Contract Private Fee-for-Service (PFFS) PFFS Yes No Yes Yes (if drugs offered)
HCPP 1833 Cost HCPP No No No No
Local Coordinated Care Plan (CCP) CCP Yes Yes Yes Yes
Medical Savings Account (MSA) MSA Yes No Yes No
National PACE PACE No No No No
Medicare Prescription Drug Plan (PDP) PDP No No No Yes
Private Fee-for-Service (PFFS) PFFS Yes No Yes Yes (if drugs offered)
Regional Coordinated Care Plan (CCP) CCP Yes Yes Yes Yes
Religious Fraternal Benefit Private Fee-for-Service (RFB PFFS) PFFS Yes No Yes Yes (if drugs offered)
† Note: The measure scores are displayed in HPMS only during the first plan preview. Data from these organizations are not used in calculating the Part C & D Star Ratings.
The Star Ratings Framework
The Star Ratings are based on health and drug plan quality and performance measures. Each measure is reported in two ways:
Score: A score is either a numeric value or an assigned ‘missing data’ message.
(Last Updated 10/3/2021) Page 3
Star: The measure numeric value is converted to a Star Rating.
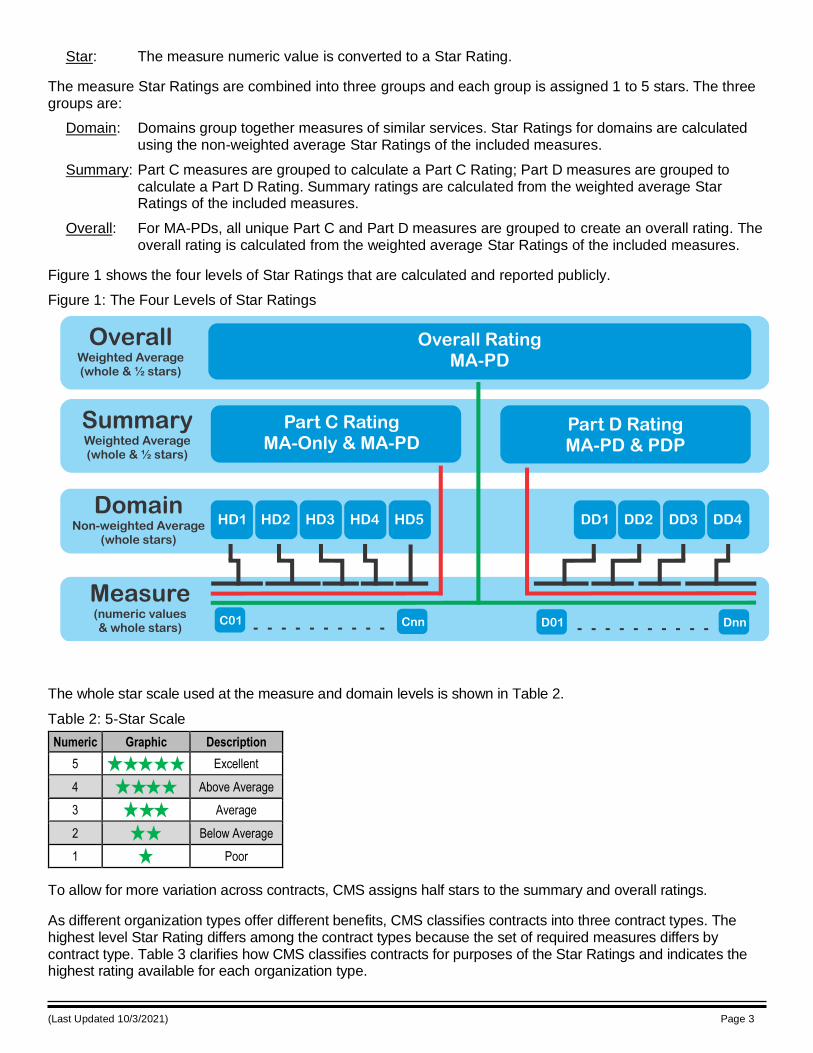
The measure Star Ratings are combined into three groups and each group is assigned 1 to 5 stars. The three groups are:
Domain: Domains group together measures of similar services. Star Ratings for domains are calculated using the non-weighted average Star Ratings of the included measures.
Summary: Part C measures are grouped to calculate a Part C Rating; Part D measures are grouped to calculate a Part D Rating. Summary ratings are calculated from the weighted average Star Ratings of the included measures.
Overall: For MA-PDs, all unique Part C and Part D measures are grouped to create an overall rating. The overall rating is calculated from the weighted average Star Ratings of the included measures.
Figure 1 shows the four levels of Star Ratings that are calculated and reported publicly.
Figure 1: The Four Levels of Star Ratings
The whole star scale used at the measure and domain levels is shown in Table 2.
Table 2: 5-Star Scale
Numeric Graphic Description
5 Excellent
4 Above Average
3 Average
2 Below Average
1 Poor
To allow for more variation across contracts, CMS assigns half stars to the summary and overall ratings.
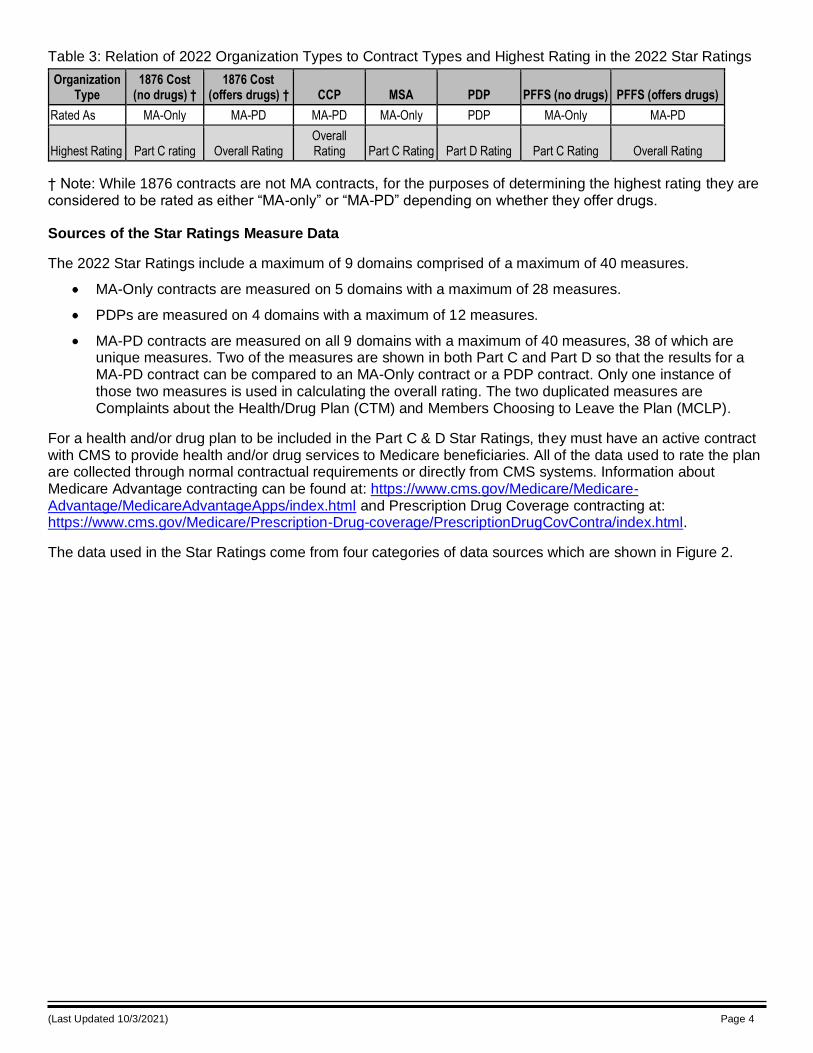
As different organization types offer different benefits, CMS classifies contracts into three contract types. The highest level Star Rating differs among the contract types because the set of required measures differs by contract type. Table 3 clarifies how CMS classifies contracts for purposes of the Star Ratings and indicates the highest rating available for each organization type.
(Last Updated 10/3/2021) Page 4
Table 3: Relation of 2022 Organization Types to Contract Types and Highest Rating in the 2022 Star Ratings
Organization Type
1876 Cost (no drugs) †
1876 Cost (offers drugs) † CCP MSA PDP PFFS (no drugs) PFFS (offers drugs)
Rated As MA-Only MA-PD MA-PD MA-Only PDP MA-Only MA-PD
Highest Rating Part C rating Overall Rating Overall Rating Part C Rating Part D Rating Part C Rating Overall Rating
† Note: While 1876 contracts are not MA contracts, for the purposes of determining the highest rating they are considered to be rated as either “MA-only” or “MA-PD” depending on whether they offer drugs.
Sources of the Star Ratings Measure Data
The 2022 Star Ratings include a maximum of 9 domains comprised of a maximum of 40 measures.
MA-Only contracts are measured on 5 domains with a maximum of 28 measures.
PDPs are measured on 4 domains with a maximum of 12 measures.
MA-PD contracts are measured on all 9 domains with a maximum of 40 measures, 38 of which are unique measures. Two of the measures are shown in both Part C and Part D so that the results for a MA-PD contract can be compared to an MA-Only contract or a PDP contract. Only one instance of those two measures is used in calculating the overall rating. The two duplicated measures are Complaints about the Health/Drug Plan (CTM) and Members Choosing to Leave the Plan (MCLP).
For a health and/or drug plan to be included in the Part C & D Star Ratings, they must have an active contract with CMS to provide health and/or drug services to Medicare beneficiaries. All of the data used to rate the plan are collected through normal contractual requirements or directly from CMS systems. Information about Medicare Advantage contracting can be found at: https://www.cms.gov/Medicare/Medicare-Advantage/MedicareAdvantageApps/index.html and Prescription Drug Coverage contracting at: https://www.cms.gov/Medicare/Prescription-Drug-coverage/PrescriptionDrugCovContra/index.html.
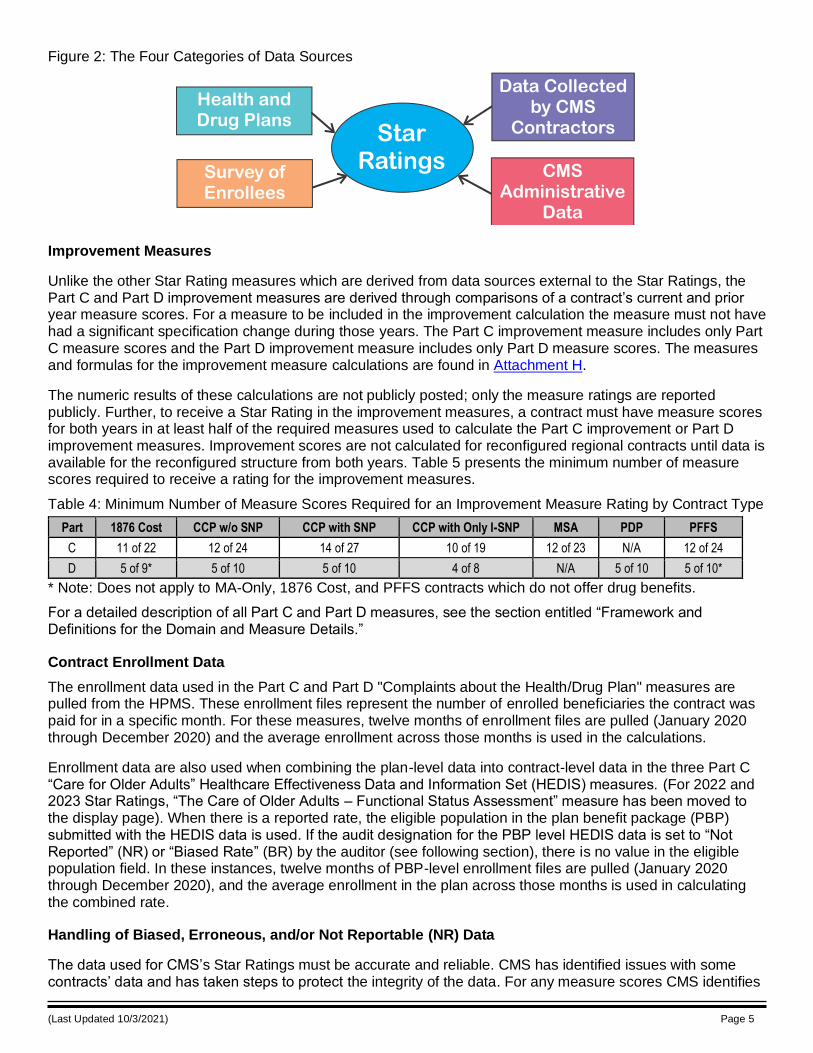
The data used in the Star Ratings come from four categories of data sources which are shown in Figure 2.
(Last Updated 10/3/2021) Page 5
Figure 2: The Four Categories of Data Sources
Improvement Measures
Unlike the other Star Rating measures which are derived from data sources external to the Star Ratings, the Part C and Part D improvement measures are derived through comparisons of a contract’s current and prior year measure scores. For a measure to be included in the improvement calculation the measure must not have had a significant specification change during those years. The Part C improvement measure includes only Part C measure scores and the Part D improvement measure includes only Part D measure scores. The measures and formulas for the improvement measure calculations are found in Attachment H.
The numeric results of these calculations are not publicly posted; only the measure ratings are reported publicly. Further, to receive a Star Rating in the improvement measures, a contract must have measure scores for both years in at least half of the required measures used to calculate the Part C improvement or Part D improvement measures. Improvement scores are not calculated for reconfigured regional contracts until data is available for the reconfigured structure from both years. Table 5 presents the minimum number of measure scores required to receive a rating for the improvement measures.
Table 4: Minimum Number of Measure Scores Required for an Improvement Measure Rating by Contract Type
Part 1876 Cost CCP w/o SNP CCP with SNP CCP with Only I-SNP MSA PDP PFFS
C 11 of 22 12 of 24 14 of 27 10 of 19 12 of 23 N/A 12 of 24
D 5 of 9* 5 of 10 5 of 10 4 of 8 N/A 5 of 10 5 of 10*
* Note: Does not apply to MA-Only, 1876 Cost, and PFFS contracts which do not offer drug benefits.
For a detailed description of all Part C and Part D measures, see the section entitled “Framework and Definitions for the Domain and Measure Details.”
Contract Enrollment Data
The enrollment data used in the Part C and Part D "Complaints about the Health/Drug Plan" measures are pulled from the HPMS. These enrollment files represent the number of enrolled beneficiaries the contract was paid for in a specific month. For these measures, twelve months of enrollment files are pulled (January 2020 through December 2020) and the average enrollment across those months is used in the calculations.
Enrollment data are also used when combining the plan-level data into contract-level data in the three Part C “Care for Older Adults” Healthcare Effectiveness Data and Information Set (HEDIS) measures. (For 2022 and 2023 Star Ratings, “The Care of Older Adults – Functional Status Assessment” measure has been moved to the display page). When there is a reported rate, the eligible population in the plan benefit package (PBP) submitted with the HEDIS data is used. If the audit designation for the PBP level HEDIS data is set to “Not Reported” (NR) or “Biased Rate” (BR) by the auditor (see following section), there is no value in the eligible population field. In these instances, twelve months of PBP-level enrollment files are pulled (January 2020 through December 2020), and the average enrollment in the plan across those months is used in calculating the combined rate.
Handling of Biased, Erroneous, and/or Not Reportable (NR) Data
The data used for CMS’s Star Ratings must be accurate and reliable. CMS has identified issues with some contracts’ data and has taken steps to protect the integrity of the data. For any measure scores CMS identifies
(Last Updated 10/3/2021) Page 6
to be based on inaccurate or biased data, CMS’s policy is to reduce a contract’s measure rating to 1 star and set the measure score to “CMS identified issues with this plan’s data.”
Inaccurate or biased data result from the mishandling of data, inappropriate processing, or implementation of incorrect practices. Examples include, but are not limited to: a contract’s failure to adhere to HEDIS, Health Outcomes Survey (HOS), or CAHPS reporting requirements; a contract’s failure to adhere to Medicare Plan Finder data requirements; a contract’s errors in processing organization determinations, and appeals; a contract’s failure to adhere to CMS-approved point-of-sale edits; compliance actions taken against the contract due to errors in operational areas that impact the data reported or processed for specific measures; or a contract’s failure to pass validation of the data reported for specific measures. Note there is no minimum number of cases required for a contract’s data to be subject to data integrity reviews.
For HEDIS data, CMS uses the audit designation information assigned by the HEDIS auditor. An audit designation of ‘NR’ (Not reported) is assigned when the contract chooses not to report the measure. An audit designation of ‘BR’ (Biased rate) is assigned when the individual measure score is materially biased (e.g., the auditor informs the contract the data cannot be reported to the National Committee for Quality Assurance (NCQA) or to CMS). When either a ‘BR’ or ‘NR’ designation is assigned to a HEDIS measure audit designation, the contract receives 1 star for the measure and the measure score is set to “CMS identified issues with this plan’s data.” In addition, CMS reduces contracts’ HEDIS measure ratings to 1 star if the patient-level data files are not successfully submitted and validated by the submission deadline. Also, if the HEDIS summary-level data value varies substantially from the value in the patient-level data, the measure is reduced to a rating of 1 star. If an approved CAHPS or HOS vendor does not submit a contract’s CAHPS or HOS data by the data submission deadline, the contract automatically receives a rating of 1 star for the CAHPS or HOS measures and the measure scores are set to “CMS identified issues with this plan’s data.”
Scaled Reductions for the Appeals Measures
At present, there are two Star Ratings appeals measures that rely on data submitted to the IRE: Part C measures Plan Makes Timely Decisions about Appeals and Reviewing Appeals Decisions. The completeness of the IRE data is critical to allow accurate measurement of each of the appeals measures. All contracts are responsible and held accountable for ensuring high quality and complete data to maintain the validity and reliability of the measures. CMS conducts an industry wide monitoring project to collect data to evaluate the timeliness of processing of Medicare Advantage (Part C) organization determinations and reconsiderations. Through this Timeliness Monitoring Project’s data collection (TMP data), CMS can assess all sponsors’ timeliness, as well as sponsor compliance with forwarding cases to the IRE.
CMS uses statistical criteria to reduce a contract's appeals measure-level Star Ratings for data that are not complete or lack integrity using TMP or audit data. The reduction is applied to the measure-level Star Ratings of the applicable appeals measures. Because there are varying degrees of data accuracy and integrity issues, the methodology for reductions reflects the degree of the data accuracy issue for a contract instead of a one-size-fits-all approach. The methodology employs scaled reductions (one-star, two-star, three-star, or four-star reduction) based on the degree of severity of missing or compromised IRE data. Contracts with the highest IRE data quality issues (i.e., largest percentage of missing or compromised data) receive the largest reductions, while contracts with a lower degree of missing IRE data receive a smaller reduction. The most severe reduction for IRE data completeness issues is a four-star reduction, thus resulting in measure-level Star Ratings of one star for the associated appeals measures. If a contract receives a reduction due to missing Part C IRE data, the reduction is applied to both of the contract’s Part C appeals measures. If a contract fails to submit TMP data for CMS’s review to ensure the completeness of their IRE data, the contract receives one-star for the associated appeals measures. (This is similar to how CMS treats measures that are dependent on contracts’ completion of data validation of plan-reported data.)
CMS’s scaled reduction methodology is a three-stage process using the TMP data or audit to determine: first, whether a contract may be subject to a potential reduction for the Part C appeals measures; second, as the basis for the determination of the estimated error rate; and finally, whether the estimated value is statistically significantly greater than the cut points for the scaled reductions of 1, 2, 3, or 4 stars. Details of the methodology are available in Attachment O.
(Last Updated 10/3/2021) Page 7
Once the scaled reduction for a contract is identified using the methodology, the reduction is applied to a contract’s associated appeals measure-level Star Ratings. Since the minimum measure-level Star Rating is one star, if the difference between the associated appeals measure-level Star Rating (before the application of the reduction) and the identified scaled reduction is less than one, the contract will receive a measure-level Star Rating of one star for the appeals measure. If a contract does not qualify for the Part C measures due to number of eligible cases (the denominator is less than or equal to 10), but is found to qualify for a reduction, the contract will receive the reduction.
If a scaled reduction is applied to the Part C appeals measure in either the current or the previous year, the associated appeals measures will not be included in the respective improvement measure.
Data Handling of Measures for Contracts Affected by a Major Disaster
CMS has a policy for making adjustments in the Star Ratings to take into account major disasters. That policy was published in the 2022 Rate Announcement (https://www.cms.gov/Medicare/Health-Plans/MedicareAdvtgSpecRateStats/Announcements-and-Documents.html.)
This section describes how the policy is implemented for measures from each of the different data sources in
the 2022 Star Ratings. The methodology used by CMS to identify the major disaster geographic areas, determine which contracts were affected, and how much of their geographic service area and percent of enrollment resided in an affected area can be found in Attachment P.
The disaster policy specified two distinct thresholds of “25% or more” and “60% or more” of the contract’s membership at the time of the disaster resided in a FEMA designated Individual Assistance area. CMS calculated the percentage of membership affected for every contract being rated and will apply the following rules to the data from those contracts that meet or exceed either of the two thresholds.
• CAHPS adjustments:
o All contracts were required to administer the 2021 CAHPS survey unless the contract requested and CMS approved an exemption.
o All affected contracts with at least 25% of beneficiaries in Individual Assistance areas at the time of the disaster receive the higher of the 2021 or the 2022 Star Rating (and corresponding measure score) for each CAHPS measure (including the annual flu vaccine measure).
o As outlined in the COVID-19 interim final rule (CMS-1744-IFC) and 2021 Star Ratings Technical Notes, the final 2020 Star Ratings for CAHPS measures were carried forward for the 2021 Star Ratings. The final 2020 Star Ratings, which applied the disaster policy, were considered the ‘baseline’ or pre-adjustment stars within the 2021 Star Ratings. As such, when applying the disaster policy for CAHPS measures for the 2022 Star Ratings for doubly affected contracts, the baseline stars from 2021 and 2022 were compared and the higher star of the two was taken.
HEDIS-HOS adjustments:
o The HEDIS-HOS data used in the 2022 Star Ratings are adjusted for 2019 disasters (see
Attachment P of the 2021 Star Ratings Technical Notes for the identification of contracts affected by 2019 disasters).
o All affected contracts (i.e., contracts affected by 2019 disasters) with at least 25% of beneficiaries in Individual Assistance areas at the time of the disaster received the higher of the 2021 or the 2022 Star Rating (and corresponding measure score) for each HEDIS-HOS measure.
o In some cases, contracts with at least 25% of enrollees residing in FEMA-designated Individual Assistance areas affected by disasters that began in 2019 were also affected by disasters in 2018. These doubly-affected contracts receive the higher of the 2022 Star Rating or what the 2021 Star Rating would have been in the absence of any adjustments that took into account the effects of the 2018 disaster for each measure (we use the corresponding measure score for the Star Ratings year selected).
(Last Updated 10/3/2021) Page 8
• HEDIS adjustments:
o All contracts were required to report HEDIS 2021 unless the contract requested and CMS approved an exemption. Contracts were able to work with NCQA to adjust samples if necessary.
o Contracts with 25% or more affected members received the higher of the 2021 or 2022 Star Ratings measure stars (and corresponding measure scores).
o As outlined in the COVID-19 interim final rule (CMS-1744-IFC) and 2021 Star Ratings Technical Notes, the final 2020 Star Ratings for HEDIS measures were carried forward for the 2021 Star Ratings. The final 2020 Star Ratings, which applied the disaster policy, were considered the ‘baseline’ or pre-adjustment stars within the 2021 Star Ratings. As such, when applying the disaster policy for HEDIS measures for the 2022 Star Ratings for doubly affected contracts, the baseline stars from 2021 and 2022 were compared and the higher star of the two was taken.
• Part C and D Call Center:
o For all contracts, no adjustments were made.
New measure
o Contracts with 25% or more affected members have a hold harmless provision applied which compares the result of a contract’s overall rating “with” and “without” including the new MPF Price Accuracy measure. If the “with” result is lower than the “without” result, then we use the “without” result as the final highest level rating.
o A similar hold harmless provision is applied for the Part D summary ratings. If a contract has 25% or more affected members, the Part D summary rating is calculated “with” and “without” the new MPF Price Accuracy, and if the “with” result is lower than the “without” result, then we use the “without” result for the final summary rating.
• All other measures:
o Contracts with 25% or more affected members receive the higher of the 2021 or 2022 measure stars (and corresponding measure scores).
o In some cases, contracts with at least 25% of enrollees residing in FEMA-designated Individual Assistance areas affected by disasters that began in 2020 were also affected by disasters in 2019. These doubly-affected contracts receive the higher of the 2022 Star Rating or what the 2021 Star Rating would have been in the absence of any adjustments that took into account the effects of the 2019 disaster for each measure (we use the corresponding measure score for the Star Ratings year selected).
• All Adjustments:
o For all adjustments, if the Star Rating is the same in both years, the Star Rating and the measure score from the most recent year are used.
• Improvement measures:
o For affected contracts that reverted back to the data underlying the previous year’s Star Rating for a particular measure for either 2021 or 2022 Star Ratings, that measure is excluded from both the count of measures (used to determine whether the contract has at least half of the measures needed to calculate the relevant improvement measure) and the improvement measures calculation. Affected contracts do not have the option of reverting to the prior year’s improvement rating.
• Affected contracts with missing data:
o If an affected contract has missing data in either the current or previous year (e.g., because of a data integrity issue, it is too new, or it is too small), the final measure rating comes from the current year.
(Last Updated 10/3/2021) Page 9
• Reward Factor:
o For the 2022 Star Ratings only, we will not exclude contracts with 60% or more of their enrollees living in FEMA-designated Individual Assistance areas from calculation of the Reward Factor.
• Cut points
o For the 2022 Star Ratings only, we will not exclude contracts with 60% or more of their enrollees living in FEMA-designated Individual Assistance areas from calculation of cut points for measures that use clustering methodology.
Methodology for Assigning Stars to the Part C and Part D Measures
CMS assigns stars for each numeric measure score by applying one of two methods: clustering, or relative distribution and significance testing. Each method is described below. Attachment J explains the clustering and relative distribution and significance testing (used for CAHPS measures) methods in greater detail.
The Cut Point Trend document is posted on the website at http://go.cms.gov/partcanddstarratings and is updated after each rating cycle is released.
A. Clustering
This method is applied to the majority of the Star Ratings measures, ranging from operational and process-based measures, to HEDIS and other clinical care measures. Using this method, the Star Rating for each measure is determined by applying a clustering algorithm to the measure’s numeric value scores from all contracts. Conceptually, the clustering algorithm identifies the “gaps” among the scores and creates four cut points resulting in the creation of five levels (one for each Star Rating). The scores in the same Star Rating level are as similar as possible; the scores in different Star Rating levels are as different as possible. Star Rating levels 1 through 5 are assigned with 1 being the worst and 5 being the best.
Technically, the variance in measure scores is separated into within-cluster and between-cluster sum of squares components. The clusters reflect the groupings of numeric value scores that minimize the variance of scores within the clusters. The Star Ratings levels are assigned to the clusters that minimize the within-cluster sum of squares. The cut points for star assignments are derived from the range of measure scores per cluster, and the star levels associated with each cluster are determined by ordering the means of the clusters.
Mean resampling is used to determine the cut points for all non-CAHPS measures. With mean resampling, measure-specific scores for the current year’s Star Ratings are randomly separated into 10 equal-sized groups. The hierarchal clustering algorithm is then applied 10 times, each time leaving one of the 10 groups out of the clustered data. The method results in 10 sets of measure-specific cut points. The mean for each 1 through 5 star level cut point is taken across the 10 sets for each measure to produce the final cut points used for assigning measure stars.
B. Relative Distribution and Significance Testing (CAHPS)
This method is applied to determine valid star cut points for CAHPS measures. In order to account for the reliability of scores produced from the CAHPS survey, the method combines evaluating the relative percentile distribution with significance testing. For example, to obtain 5 stars, a contract’s CAHPS measure score needs to be ranked at least at the 80th percentile and be statistically significantly higher than the national average CAHPS measure score, as well as either have not low reliability or have a measure score more than one standard error above the 80th percentile. To obtain 1 star, a contract’s CAHPS measure score needs to be ranked below the 15th percentile and be statistically significantly lower than the national average CAHPS measure score, as well as either have not low reliability or have a measure score more than one standard error below the 15th percentile.
Methodology for Calculating Stars at the Domain Level
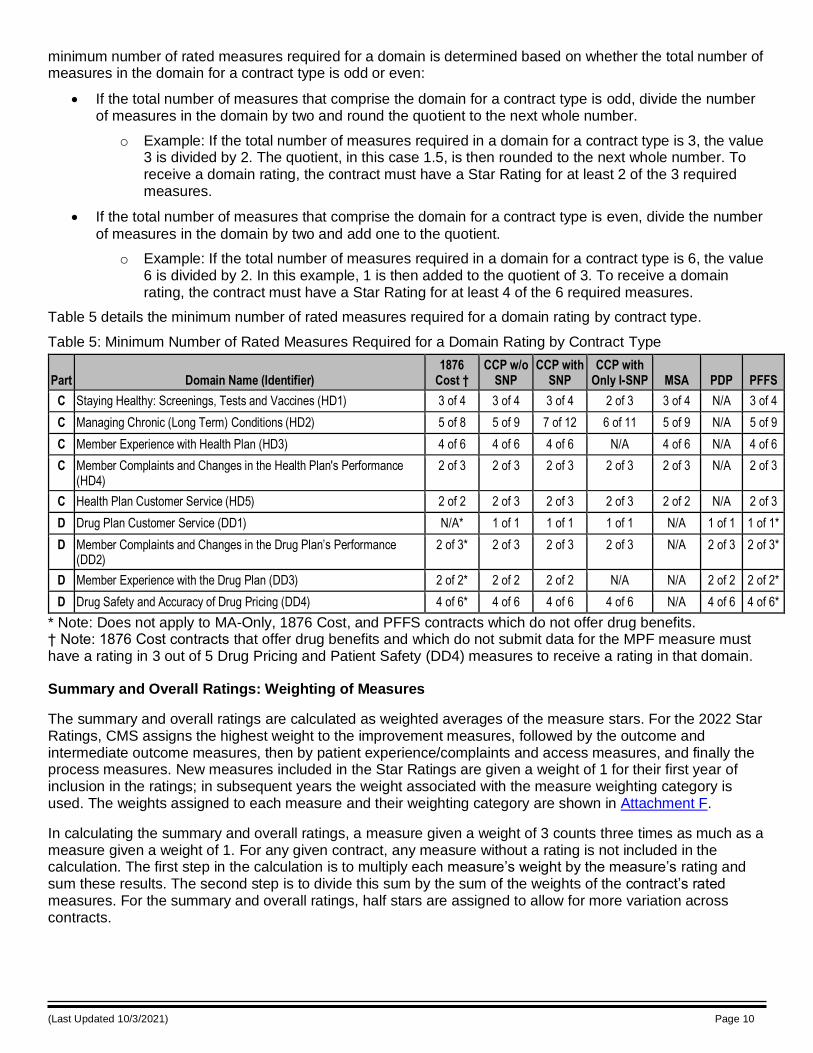
A domain rating is the average, unweighted mean, of the domain’s measure stars. To receive a domain rating, a contract must meet or exceed the minimum number of rated measures required for the domain. The
(Last Updated 10/3/2021) Page 10
minimum number of rated measures required for a domain is determined based on whether the total number of measures in the domain for a contract type is odd or even:
• If the total number of measures that comprise the domain for a contract type is odd, divide the number of measures in the domain by two and round the quotient to the next whole number.
o Example: If the total number of measures required in a domain for a contract type is 3, the value 3 is divided by 2. The quotient, in this case 1.5, is then rounded to the next whole number. To receive a domain rating, the contract must have a Star Rating for at least 2 of the 3 required measures.
• If the total number of measures that comprise the domain for a contract type is even, divide the number
of measures in the domain by two and add one to the quotient.
o Example: If the total number of measures required in a domain for a contract type is 6, the value 6 is divided by 2. In this example, 1 is then added to the quotient of 3. To receive a domain rating, the contract must have a Star Rating for at least 4 of the 6 required measures.
Table 5 details the minimum number of rated measures required for a domain rating by contract type.
Table 5: Minimum Number of Rated Measures Required for a Domain Rating by Contract Type
Part Domain Name (Identifier) 1876
Cost † CCP w/o
SNP CCP with
SNP CCP with
Only I-SNP MSA PDP PFFS
C Staying Healthy: Screenings, Tests and Vaccines (HD1) 3 of 4 3 of 4 3 of 4 2 of 3 3 of 4 N/A 3 of 4
C Managing Chronic (Long Term) Conditions (HD2) 5 of 8 5 of 9 7 of 12 6 of 11 5 of 9 N/A 5 of 9
C Member Experience with Health Plan (HD3) 4 of 6 4 of 6 4 of 6 N/A 4 of 6 N/A 4 of 6
C Member Complaints and Changes in the Health Plan's Performance (HD4)
2 of 3 2 of 3 2 of 3 2 of 3 2 of 3 N/A 2 of 3
C Health Plan Customer Service (HD5) 2 of 2 2 of 3 2 of 3 2 of 3 2 of 2 N/A 2 of 3
D Drug Plan Customer Service (DD1) N/A* 1 of 1 1 of 1 1 of 1 N/A 1 of 1 1 of 1*
D Member Complaints and Changes in the Drug Plan’s Performance (DD2)
2 of 3* 2 of 3 2 of 3 2 of 3 N/A 2 of 3 2 of 3*
D Member Experience with the Drug Plan (DD3) 2 of 2* 2 of 2 2 of 2 N/A N/A 2 of 2 2 of 2*
D Drug Safety and Accuracy of Drug Pricing (DD4) 4 of 6* 4 of 6 4 of 6 4 of 6 N/A 4 of 6 4 of 6*
* Note: Does not apply to MA-Only, 1876 Cost, and PFFS contracts which do not offer drug benefits. † Note: 1876 Cost contracts that offer drug benefits and which do not submit data for the MPF measure must have a rating in 3 out of 5 Drug Pricing and Patient Safety (DD4) measures to receive a rating in that domain.
Summary and Overall Ratings: Weighting of Measures
The summary and overall ratings are calculated as weighted averages of the measure stars. For the 2022 Star Ratings, CMS assigns the highest weight to the improvement measures, followed by the outcome and intermediate outcome measures, then by patient experience/complaints and access measures, and finally the process measures. New measures included in the Star Ratings are given a weight of 1 for their first year of inclusion in the ratings; in subsequent years the weight associated with the measure weighting category is used. The weights assigned to each measure and their weighting category are shown in Attachment F.
In calculating the summary and overall ratings, a measure given a weight of 3 counts three times as much as a measure given a weight of 1. For any given contract, any measure without a rating is not included in the calculation. The first step in the calculation is to multiply each measure’s weight by the measure’s rating and sum these results. The second step is to divide this sum by the sum of the weights of the contract’s rated measures. For the summary and overall ratings, half stars are assigned to allow for more variation across contracts.
(Last Updated 10/3/2021) Page 11
Methodology for Calculating Part C and Part D Summary Ratings
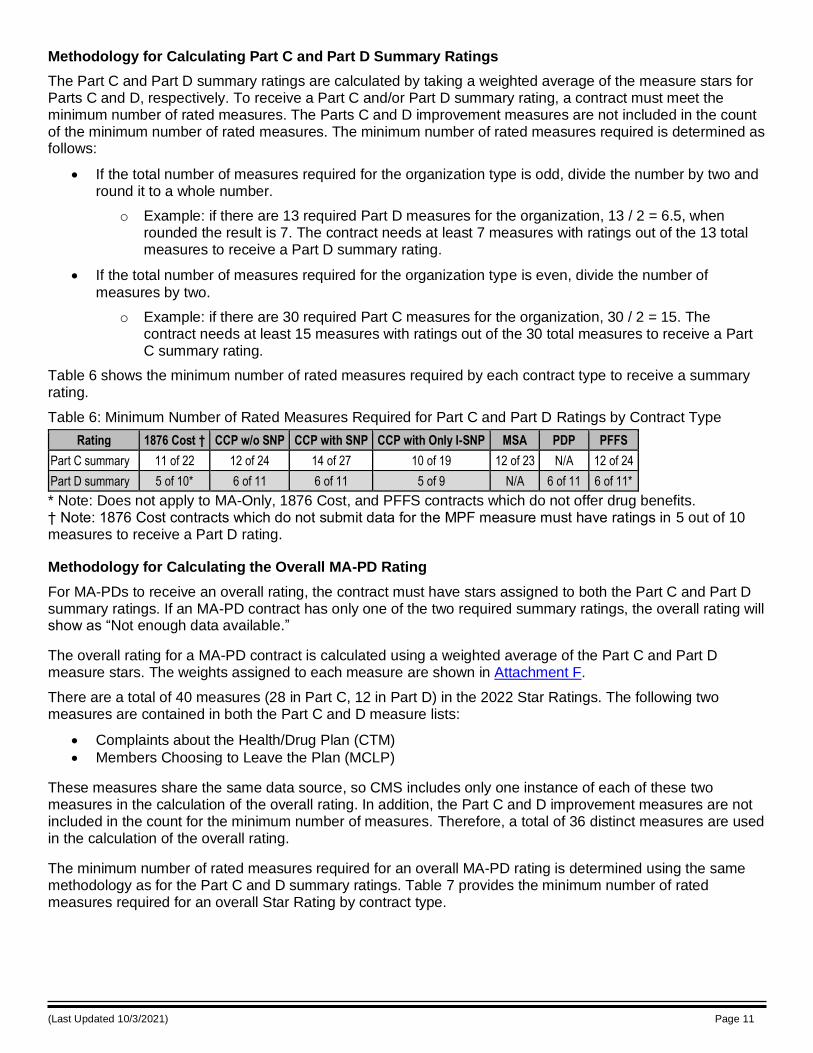
The Part C and Part D summary ratings are calculated by taking a weighted average of the measure stars for Parts C and D, respectively. To receive a Part C and/or Part D summary rating, a contract must meet the minimum number of rated measures. The Parts C and D improvement measures are not included in the count of the minimum number of rated measures. The minimum number of rated measures required is determined as follows:
• If the total number of measures required for the organization type is odd, divide the number by two and round it to a whole number.
o Example: if there are 13 required Part D measures for the organization, 13 / 2 = 6.5, when rounded the result is 7. The contract needs at least 7 measures with ratings out of the 13 total measures to receive a Part D summary rating.
• If the total number of measures required for the organization type is even, divide the number of
measures by two.
o Example: if there are 30 required Part C measures for the organization, 30 / 2 = 15. The contract needs at least 15 measures with ratings out of the 30 total measures to receive a Part C summary rating.
Table 6 shows the minimum number of rated measures required by each contract type to receive a summary rating.
Table 6: Minimum Number of Rated Measures Required for Part C and Part D Ratings by Contract Type
Rating 1876 Cost † CCP w/o SNP CCP with SNP CCP with Only I-SNP MSA PDP PFFS
Part C summary 11 of 22 12 of 24 14 of 27 10 of 19 12 of 23 N/A 12 of 24
Part D summary 5 of 10* 6 of 11 6 of 11 5 of 9 N/A 6 of 11 6 of 11*
* Note: Does not apply to MA-Only, 1876 Cost, and PFFS contracts which do not offer drug benefits. † Note: 1876 Cost contracts which do not submit data for the MPF measure must have ratings in 5 out of 10 measures to receive a Part D rating.
Methodology for Calculating the Overall MA-PD Rating
For MA-PDs to receive an overall rating, the contract must have stars assigned to both the Part C and Part D summary ratings. If an MA-PD contract has only one of the two required summary ratings, the overall rating will show as “Not enough data available.”
The overall rating for a MA-PD contract is calculated using a weighted average of the Part C and Part D measure stars. The weights assigned to each measure are shown in Attachment F.
There are a total of 40 measures (28 in Part C, 12 in Part D) in the 2022 Star Ratings. The following two measures are contained in both the Part C and D measure lists:
• Complaints about the Health/Drug Plan (CTM)
• Members Choosing to Leave the Plan (MCLP)
These measures share the same data source, so CMS includes only one instance of each of these two measures in the calculation of the overall rating. In addition, the Part C and D improvement measures are not included in the count for the minimum number of measures. Therefore, a total of 36 distinct measures are used in the calculation of the overall rating.
The minimum number of rated measures required for an overall MA-PD rating is determined using the same methodology as for the Part C and D summary ratings. Table 7 provides the minimum number of rated measures required for an overall Star Rating by contract type.
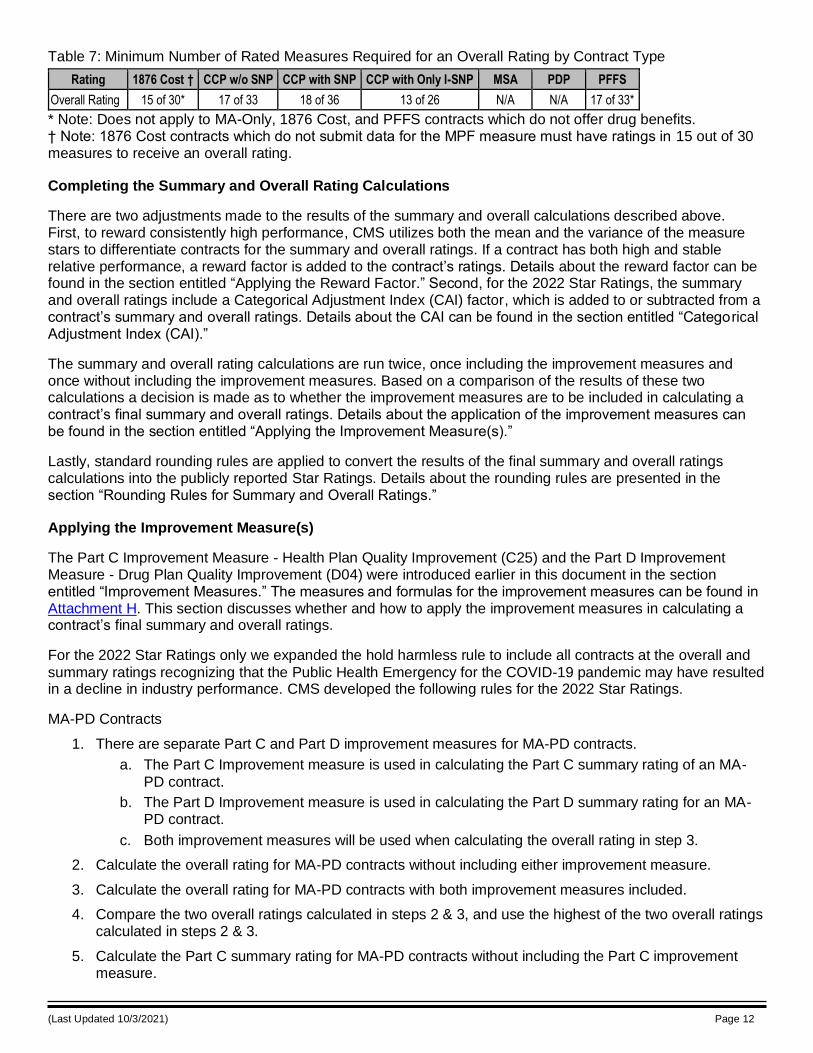
(Last Updated 10/3/2021) Page 12
Table 7: Minimum Number of Rated Measures Required for an Overall Rating by Contract Type
Rating 1876 Cost † CCP w/o SNP CCP with SNP CCP with Only I-SNP MSA PDP PFFS
Overall Rating 15 of 30* 17 of 33 18 of 36 13 of 26 N/A N/A 17 of 33*
* Note: Does not apply to MA-Only, 1876 Cost, and PFFS contracts which do not offer drug benefits. † Note: 1876 Cost contracts which do not submit data for the MPF measure must have ratings in 15 out of 30 measures to receive an overall rating.
Completing the Summary and Overall Rating Calculations
There are two adjustments made to the results of the summary and overall calculations described above. First, to reward consistently high performance, CMS utilizes both the mean and the variance of the measure stars to differentiate contracts for the summary and overall ratings. If a contract has both high and stable relative performance, a reward factor is added to the contract’s ratings. Details about the reward factor can be found in the section entitled “Applying the Reward Factor.” Second, for the 2022 Star Ratings, the summary and overall ratings include a Categorical Adjustment Index (CAI) factor, which is added to or subtracted from a contract’s summary and overall ratings. Details about the CAI can be found in the section entitled “Categorical Adjustment Index (CAI).”
The summary and overall rating calculations are run twice, once including the improvement measures and once without including the improvement measures. Based on a comparison of the results of these two calculations a decision is made as to whether the improvement measures are to be included in calculating a contract’s final summary and overall ratings. Details about the application of the improvement measures can be found in the section entitled “Applying the Improvement Measure(s).”
Lastly, standard rounding rules are applied to convert the results of the final summary and overall ratings calculations into the publicly reported Star Ratings. Details about the rounding rules are presented in the section “Rounding Rules for Summary and Overall Ratings.”
Applying the Improvement Measure(s)
The Part C Improvement Measure - Health Plan Quality Improvement (C25) and the Part D Improvement Measure - Drug Plan Quality Improvement (D04) were introduced earlier in this document in the section entitled “Improvement Measures.” The measures and formulas for the improvement measures can be found in Attachment H. This section discusses whether and how to apply the improvement measures in calculating a contract’s final summary and overall ratings.
For the 2022 Star Ratings only we expanded the hold harmless rule to include all contracts at the overall and
summary ratings recognizing that the Public Health Emergency for the COVID-19 pandemic may have resulted in a decline in industry performance. CMS developed the following rules for the 2022 Star Ratings.
MA-PD Contracts
1. There are separate Part C and Part D improvement measures for MA-PD contracts.
a. The Part C Improvement measure is used in calculating the Part C summary rating of an MA-
PD contract.
b. The Part D Improvement measure is used in calculating the Part D summary rating for an MA-PD contract.
c. Both improvement measures will be used when calculating the overall rating in step 3.
2. Calculate the overall rating for MA-PD contracts without including either improvement measure.
3. Calculate the overall rating for MA-PD contracts with both improvement measures included.
4. Compare the two overall ratings calculated in steps 2 & 3, and use the highest of the two overall ratings calculated in steps 2 & 3.
5. Calculate the Part C summary rating for MA-PD contracts without including the Part C improvement measure.
(Last Updated 10/3/2021) Page 13
6. Calculate the Part C summary rating for MA-PD contracts including the Part C improvement measure.
7. Compare the two Part C summary ratings calculated in steps 5 & 6, and use the highest of the two Part C summary ratings calculated in steps 5 & 6.
8. Calculate the Part D summary rating for MA-PD contracts without including the Part D improvement measure.
9. Calculate the Part D summary rating for MA-PD contracts including the Part D improvement measure.
10. Compare the two Part D summary ratings calculated in steps 8 & 9, and use the highest of the two Part D summary ratings calculated in steps 8 & 9.
MA-Only Contracts
Only the Part C improvement measure is used for MA-Only contracts.
Calculate the Part C summary rating for MA-Only contracts without including the Part C improvement measure.
Calculate the Part C summary rating for MA-Only contracts with the Part C improvement measure.
Compare the two Part C summary ratings. If the rating in step 3 is less than the value in step 2, use the Part C summary rating from step 2; otherwise use the result from step 3.
PDP Contracts
Only the Part D improvement measure is used for PDP contracts.
Calculate the Part D summary rating for PDP contracts without including the Part D improvement measure.
Calculate the Part D summary rating for PDP contracts with the Part D improvement measure.
Compare the two Part D summary ratings. If the rating in step 3 is less than the value in step 2, use the Part D summary rating from step 2; otherwise use the result from step 3.
Applying the Reward Factor
The following represents the steps taken to calculate and include the reward factor (r-Factor) in the Star Ratings summary and overall ratings. These calculations are performed both with and without the improvement measures included.
• Calculate the mean and the variance of all of the individual quality and performance measure stars at the contract level.
o The mean is equal to the summary or overall rating before the reward factor is applied, which is calculated as described in the section entitled “Weighting of Measures.”
o Using weights in the variance calculation accounts for the relative importance of measures in the reward factor calculation. To incorporate the weights shown in Attachment F into the variance calculation of the available individual performance measures for a given contract, the steps are as follows:
▪ Subtract the summary or overall star from each performance measure’s star; square the results; and multiply each squared result by the corresponding individual performance measure weight.
▪ Sum these results; call this ‘SUMWX.’
▪ Set n equal to the number of individual performance measures available for the given contract.
▪ Set W equal to the sum of the weights assigned to the n individual performance measures available for the given contract.
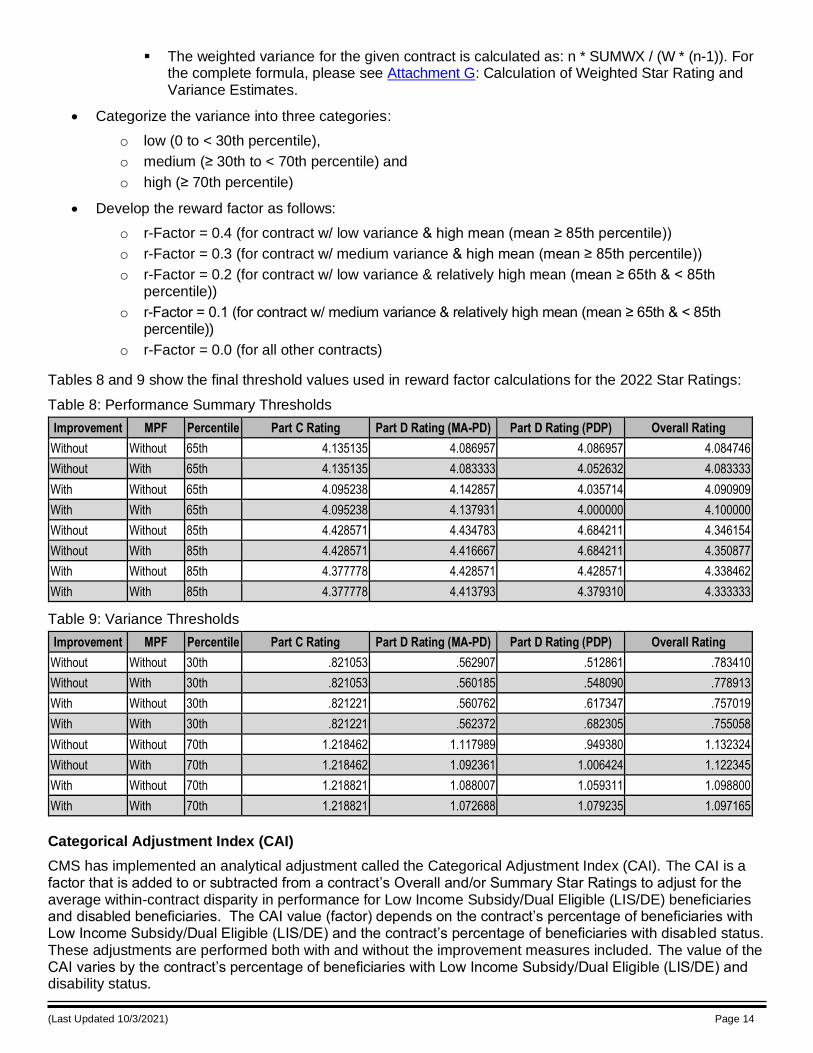
(Last Updated 10/3/2021) Page 14
▪ The weighted variance for the given contract is calculated as: n * SUMWX / (W * (n-1)). For the complete formula, please see Attachment G: Calculation of Weighted Star Rating and Variance Estimates.
• Categorize the variance into three categories:
o low (0 to < 30th percentile),
o medium (≥ 30th to < 70th percentile) and
o high (≥ 70th percentile)
• Develop the reward factor as follows:
o r-Factor = 0.4 (for contract w/ low variance & high mean (mean ≥ 85th percentile))
o r-Factor = 0.3 (for contract w/ medium variance & high mean (mean ≥ 85th percentile))
o r-Factor = 0.2 (for contract w/ low variance & relatively high mean (mean ≥ 65th & < 85th percentile))
o r-Factor = 0.1 (for contract w/ medium variance & relatively high mean (mean ≥ 65th & < 85th percentile))
o r-Factor = 0.0 (for all other contracts)
Tables 8 and 9 show the final threshold values used in reward factor calculations for the 2022 Star Ratings:
Table 8: Performance Summary Thresholds
Improvement MPF Percentile Part C Rating Part D Rating (MA-PD) Part D Rating (PDP) Overall Rating
Without Without 65th 4.135135 4.086957 4.086957 4.084746
Without With 65th 4.135135 4.083333 4.052632 4.083333
With Without 65th 4.095238 4.142857 4.035714 4.090909
With With 65th 4.095238 4.137931 4.000000 4.100000
Without Without 85th 4.428571 4.434783 4.684211 4.346154
Without With 85th 4.428571 4.416667 4.684211 4.350877
With Without 85th 4.377778 4.428571 4.428571 4.338462
With With 85th 4.377778 4.413793 4.379310 4.333333
Table 9: Variance Thresholds
Improvement MPF Percentile Part C Rating Part D Rating (MA-PD) Part D Rating (PDP) Overall Rating
Without Without 30th .821053 .562907 .512861 .783410
Without With 30th .821053 .560185 .548090 .778913
With Without 30th .821221 .560762 .617347 .757019
With With 30th .821221 .562372 .682305 .755058
Without Without 70th 1.218462 1.117989 .949380 1.132324
Without With 70th 1.218462 1.092361 1.006424 1.122345
With Without 70th 1.218821 1.088007 1.059311 1.098800
With With 70th 1.218821 1.072688 1.079235 1.097165
Categorical Adjustment Index (CAI)
CMS has implemented an analytical adjustment called the Categorical Adjustment Index (CAI). The CAI is a factor that is added to or subtracted from a contract’s Overall and/or Summary Star Ratings to adjust for the average within-contract disparity in performance for Low Income Subsidy/Dual Eligible (LIS/DE) beneficiaries and disabled beneficiaries. The CAI value (factor) depends on the contract’s percentage of beneficiaries with Low Income Subsidy/Dual Eligible (LIS/DE) and the contract’s percentage of beneficiaries with disabled status. These adjustments are performed both with and without the improvement measures included. The value of the CAI varies by the contract’s percentage of beneficiaries with Low Income Subsidy/Dual Eligible (LIS/DE) and disability status.
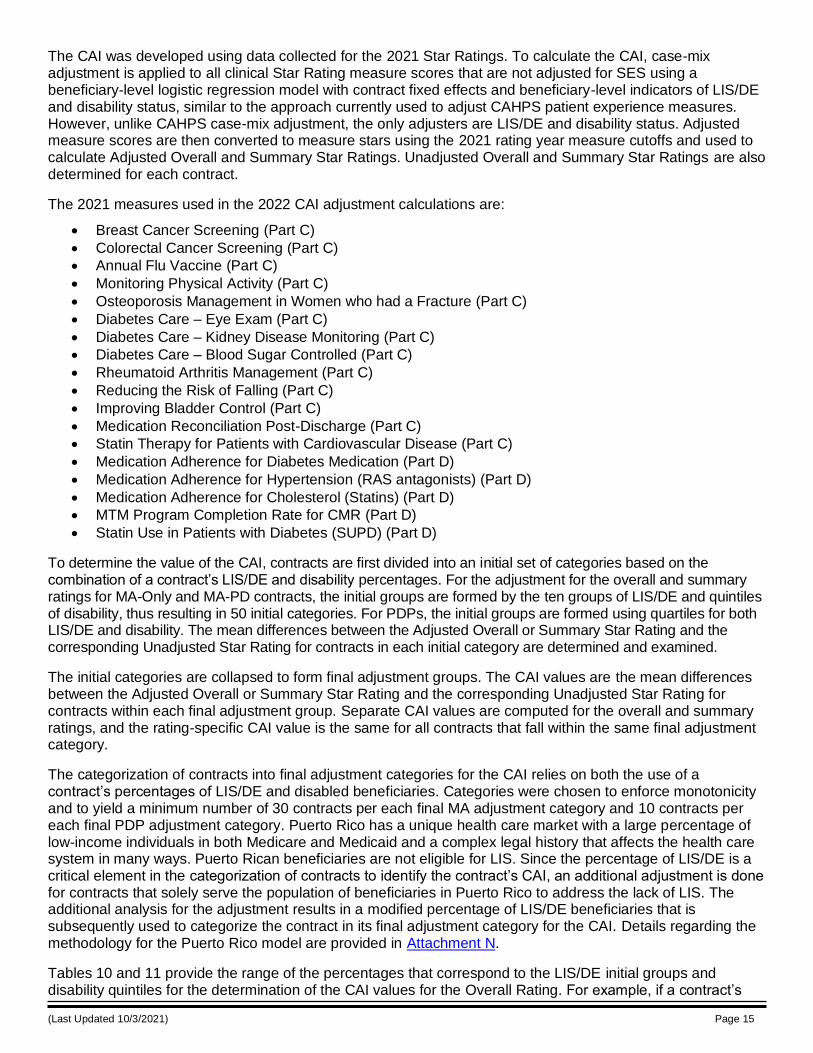
(Last Updated 10/3/2021) Page 15
The CAI was developed using data collected for the 2021 Star Ratings. To calculate the CAI, case-mix adjustment is applied to all clinical Star Rating measure scores that are not adjusted for SES using a beneficiary-level logistic regression model with contract fixed effects and beneficiary-level indicators of LIS/DE and disability status, similar to the approach currently used to adjust CAHPS patient experience measures. However, unlike CAHPS case-mix adjustment, the only adjusters are LIS/DE and disability status. Adjusted measure scores are then converted to measure stars using the 2021 rating year measure cutoffs and used to calculate Adjusted Overall and Summary Star Ratings. Unadjusted Overall and Summary Star Ratings are also determined for each contract.
The 2021 measures used in the 2022 CAI adjustment calculations are:
• Breast Cancer Screening (Part C)
• Colorectal Cancer Screening (Part C)
• Annual Flu Vaccine (Part C)
• Monitoring Physical Activity (Part C)
• Osteoporosis Management in Women who had a Fracture (Part C)
• Diabetes Care – Eye Exam (Part C)
• Diabetes Care – Kidney Disease Monitoring (Part C)
• Diabetes Care – Blood Sugar Controlled (Part C)
• Rheumatoid Arthritis Management (Part C)
• Reducing the Risk of Falling (Part C)
• Improving Bladder Control (Part C)
• Medication Reconciliation Post-Discharge (Part C)
• Statin Therapy for Patients with Cardiovascular Disease (Part C)
• Medication Adherence for Diabetes Medication (Part D)
• Medication Adherence for Hypertension (RAS antagonists) (Part D)
• Medication Adherence for Cholesterol (Statins) (Part D)
• MTM Program Completion Rate for CMR (Part D)
• Statin Use in Patients with Diabetes (SUPD) (Part D)
To determine the value of the CAI, contracts are first divided into an initial set of categories based on the combination of a contract’s LIS/DE and disability percentages. For the adjustment for the overall and summary ratings for MA-Only and MA-PD contracts, the initial groups are formed by the ten groups of LIS/DE and quintiles of disability, thus resulting in 50 initial categories. For PDPs, the initial groups are formed using quartiles for both LIS/DE and disability. The mean differences between the Adjusted Overall or Summary Star Rating and the corresponding Unadjusted Star Rating for contracts in each initial category are determined and examined.
The initial categories are collapsed to form final adjustment groups. The CAI values are the mean differences between the Adjusted Overall or Summary Star Rating and the corresponding Unadjusted Star Rating for contracts within each final adjustment group. Separate CAI values are computed for the overall and summary ratings, and the rating-specific CAI value is the same for all contracts that fall within the same final adjustment category.
The categorization of contracts into final adjustment categories for the CAI relies on both the use of a contract’s percentages of LIS/DE and disabled beneficiaries. Categories were chosen to enforce monotonicity and to yield a minimum number of 30 contracts per each final MA adjustment category and 10 contracts per each final PDP adjustment category. Puerto Rico has a unique health care market with a large percentage of low-income individuals in both Medicare and Medicaid and a complex legal history that affects the health care system in many ways. Puerto Rican beneficiaries are not eligible for LIS. Since the percentage of LIS/DE is a critical element in the categorization of contracts to identify the contract’s CAI, an additional adjustment is done for contracts that solely serve the population of beneficiaries in Puerto Rico to address the lack of LIS. The additional analysis for the adjustment results in a modified percentage of LIS/DE beneficiaries that is subsequently used to categorize the contract in its final adjustment category for the CAI. Details regarding the methodology for the Puerto Rico model are provided in Attachment N.
Tables 10 and 11 provide the range of the percentages that correspond to the LIS/DE initial groups and disability quintiles for the determination of the CAI values for the Overall Rating. For example, if a contract’s
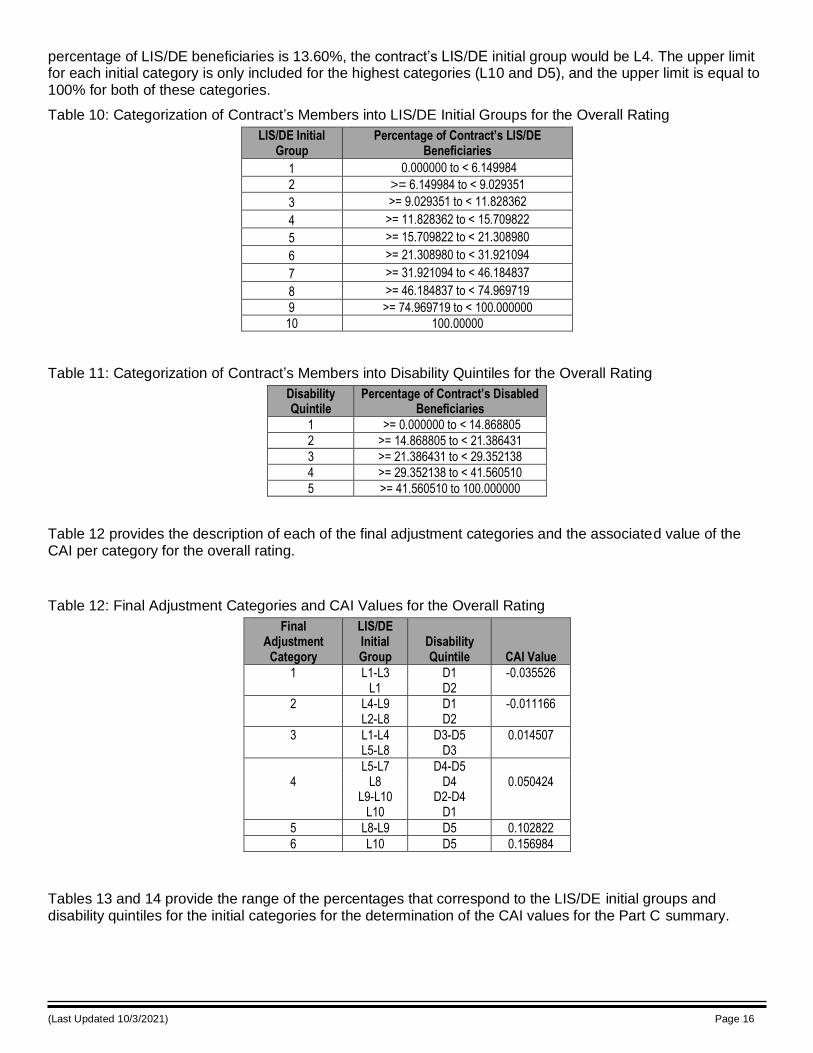
(Last Updated 10/3/2021) Page 16
percentage of LIS/DE beneficiaries is 13.60%, the contract’s LIS/DE initial group would be L4. The upper limit for each initial category is only included for the highest categories (L10 and D5), and the upper limit is equal to 100% for both of these categories.
Table 10: Categorization of Contract’s Members into LIS/DE Initial Groups for the Overall Rating
LIS/DE Initial Group
Percentage of Contract’s LIS/DE Beneficiaries
1 0.000000 to < 6.149984
2 >= 6.149984 to < 9.029351
3 >= 9.029351 to < 11.828362
4 >= 11.828362 to < 15.709822
5 >= 15.709822 to < 21.308980
6 >= 21.308980 to < 31.921094
7 >= 31.921094 to < 46.184837
8 >= 46.184837 to < 74.969719
9 >= 74.969719 to < 100.000000
10 100.00000
Table 11: Categorization of Contract’s Members into Disability Quintiles for the Overall Rating
Disability Quintile
Percentage of Contract’s Disabled Beneficiaries
1 >= 0.000000 to < 14.868805
2 >= 14.868805 to < 21.386431
3 >= 21.386431 to < 29.352138
4 >= 29.352138 to < 41.560510
5 >= 41.560510 to 100.000000
Table 12 provides the description of each of the final adjustment categories and the associated value of the CAI per category for the overall rating.
Table 12: Final Adjustment Categories and CAI Values for the Overall Rating
Final Adjustment
Category
LIS/DE Initial Group
Disability Quintile CAI Value
1
L1-L3 L1
D1 D2
-0.035526
2
L4-L9 L2-L8
D1 D2
-0.011166
3
L1-L4 L5-L8
D3-D5 D3
0.014507
4
L5-L7 L8
L9-L10 L10
D4-D5 D4
D2-D4 D1
0.050424
5 L8-L9 D5 0.102822
6 L10 D5 0.156984
Tables 13 and 14 provide the range of the percentages that correspond to the LIS/DE initial groups and disability quintiles for the initial categories for the determination of the CAI values for the Part C summary.
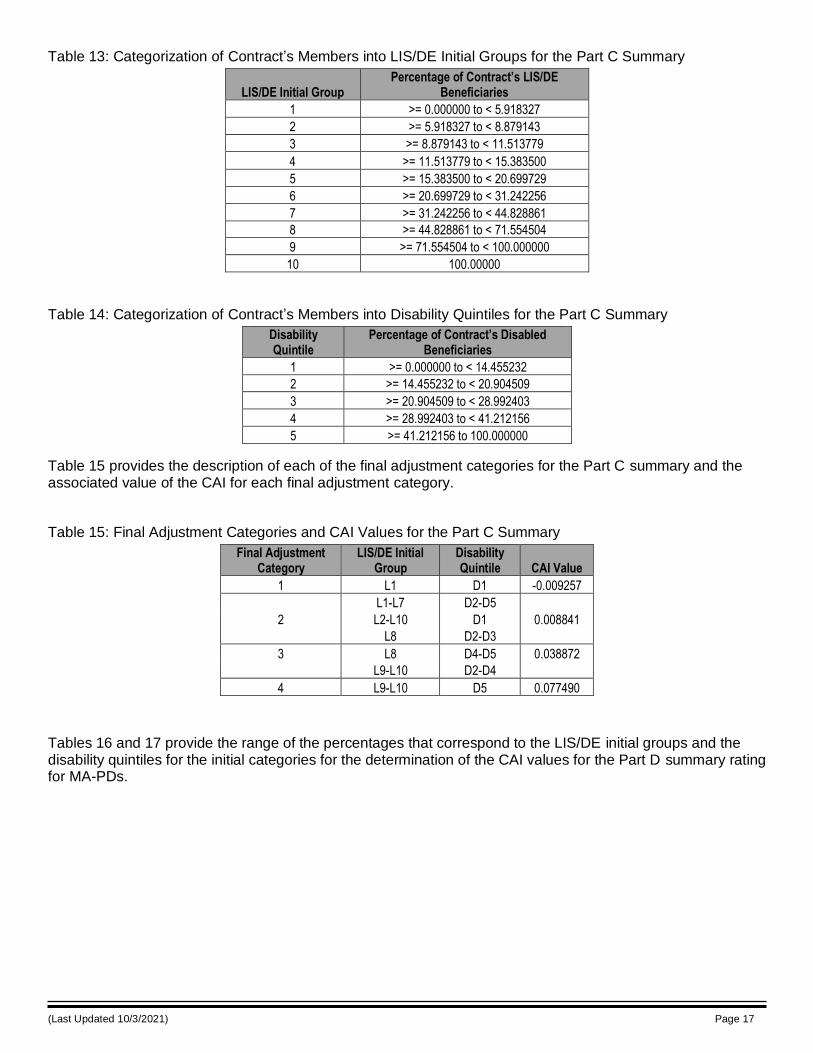
(Last Updated 10/3/2021) Page 17
Table 13: Categorization of Contract’s Members into LIS/DE Initial Groups for the Part C Summary
LIS/DE Initial Group Percentage of Contract’s LIS/DE
Beneficiaries
1 >= 0.000000 to < 5.918327
2 >= 5.918327 to < 8.879143
3 >= 8.879143 to < 11.513779
4 >= 11.513779 to < 15.383500
5 >= 15.383500 to < 20.699729
6 >= 20.699729 to < 31.242256
7 >= 31.242256 to < 44.828861
8 >= 44.828861 to < 71.554504
9 >= 71.554504 to < 100.000000
10 100.00000
Table 14: Categorization of Contract’s Members into Disability Quintiles for the Part C Summary
Disability Quintile
Percentage of Contract’s Disabled Beneficiaries
1 >= 0.000000 to < 14.455232
2 >= 14.455232 to < 20.904509
3 >= 20.904509 to < 28.992403
4 >= 28.992403 to < 41.212156
5 >= 41.212156 to 100.000000
Table 15 provides the description of each of the final adjustment categories for the Part C summary and the associated value of the CAI for each final adjustment category.
Table 15: Final Adjustment Categories and CAI Values for the Part C Summary
Final Adjustment Category
LIS/DE Initial Group
Disability Quintile CAI Value
1 L1 D1 -0.009257
2
L1-L7
L2-L10
L8
D2-D5
D1
D2-D3
0.008841
3
L8
L9-L10
D4-D5
D2-D4
0.038872
4 L9-L10 D5 0.077490
Tables 16 and 17 provide the range of the percentages that correspond to the LIS/DE initial groups and the disability quintiles for the initial categories for the determination of the CAI values for the Part D summary rating for MA-PDs.
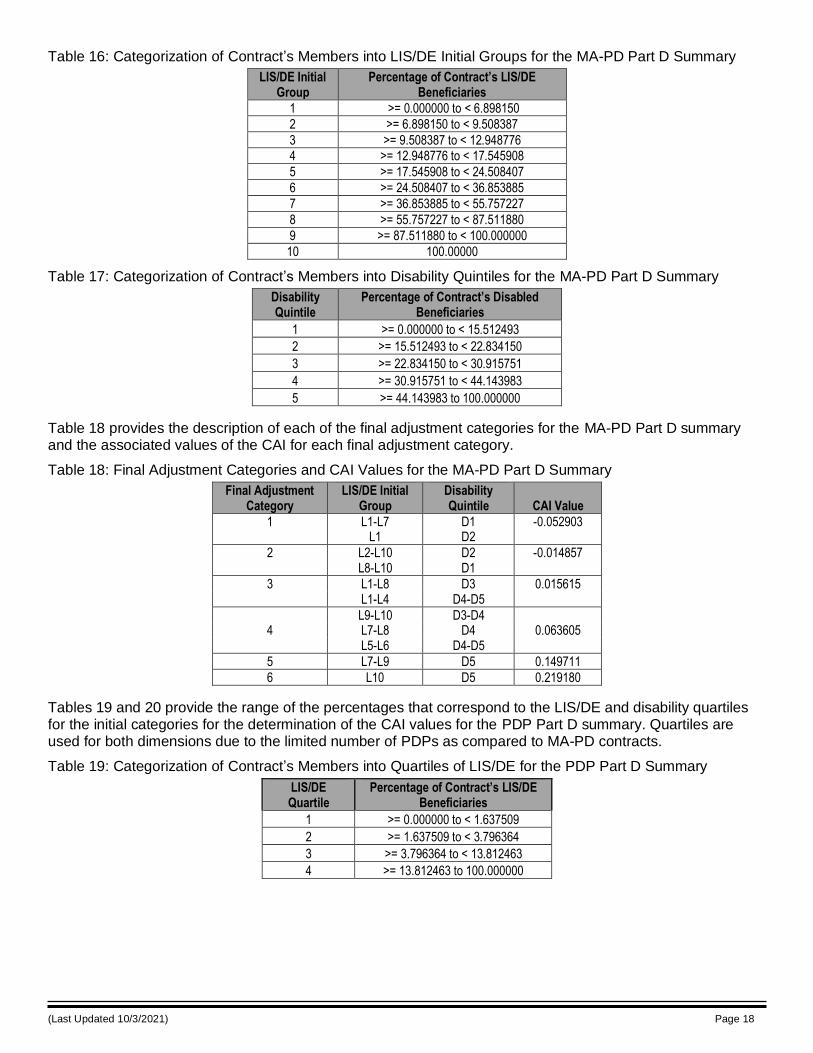
(Last Updated 10/3/2021) Page 18
Table 16: Categorization of Contract’s Members into LIS/DE Initial Groups for the MA-PD Part D Summary
LIS/DE Initial Group
Percentage of Contract’s LIS/DE Beneficiaries
1 >= 0.000000 to < 6.898150
2 >= 6.898150 to < 9.508387
3 >= 9.508387 to < 12.948776 4 >= 12.948776 to < 17.545908
5 >= 17.545908 to < 24.508407
6 >= 24.508407 to < 36.853885
7 >= 36.853885 to < 55.757227
8 >= 55.757227 to < 87.511880
9 >= 87.511880 to < 100.000000
10 100.00000
Table 17: Categorization of Contract’s Members into Disability Quintiles for the MA-PD Part D Summary
Disability Quintile
Percentage of Contract’s Disabled Beneficiaries
1 >= 0.000000 to < 15.512493
2 >= 15.512493 to < 22.834150
3 >= 22.834150 to < 30.915751
4 >= 30.915751 to < 44.143983
5 >= 44.143983 to 100.000000
Table 18 provides the description of each of the final adjustment categories for the MA-PD Part D summary and the associated values of the CAI for each final adjustment category.
Table 18: Final Adjustment Categories and CAI Values for the MA-PD Part D Summary
Final Adjustment Category
LIS/DE Initial Group
Disability Quintile CAI Value
1
L1-L7 L1
D1 D2
-0.052903
2
L2-L10 L8-L10
D2 D1
-0.014857
3
L1-L8 L1-L4
D3 D4-D5
0.015615
4
L9-L10 L7-L8 L5-L6
D3-D4 D4
D4-D5
0.063605
5 L7-L9 D5 0.149711
6 L10 D5 0.219180
Tables 19 and 20 provide the range of the percentages that correspond to the LIS/DE and disability quartiles for the initial categories for the determination of the CAI values for the PDP Part D summary. Quartiles are used for both dimensions due to the limited number of PDPs as compared to MA-PD contracts.
Table 19: Categorization of Contract’s Members into Quartiles of LIS/DE for the PDP Part D Summary
LIS/DE Quartile
Percentage of Contract’s LIS/DE Beneficiaries
1 >= 0.000000 to < 1.637509
2 >= 1.637509 to < 3.796364
3 >= 3.796364 to < 13.812463
4 >= 13.812463 to 100.000000
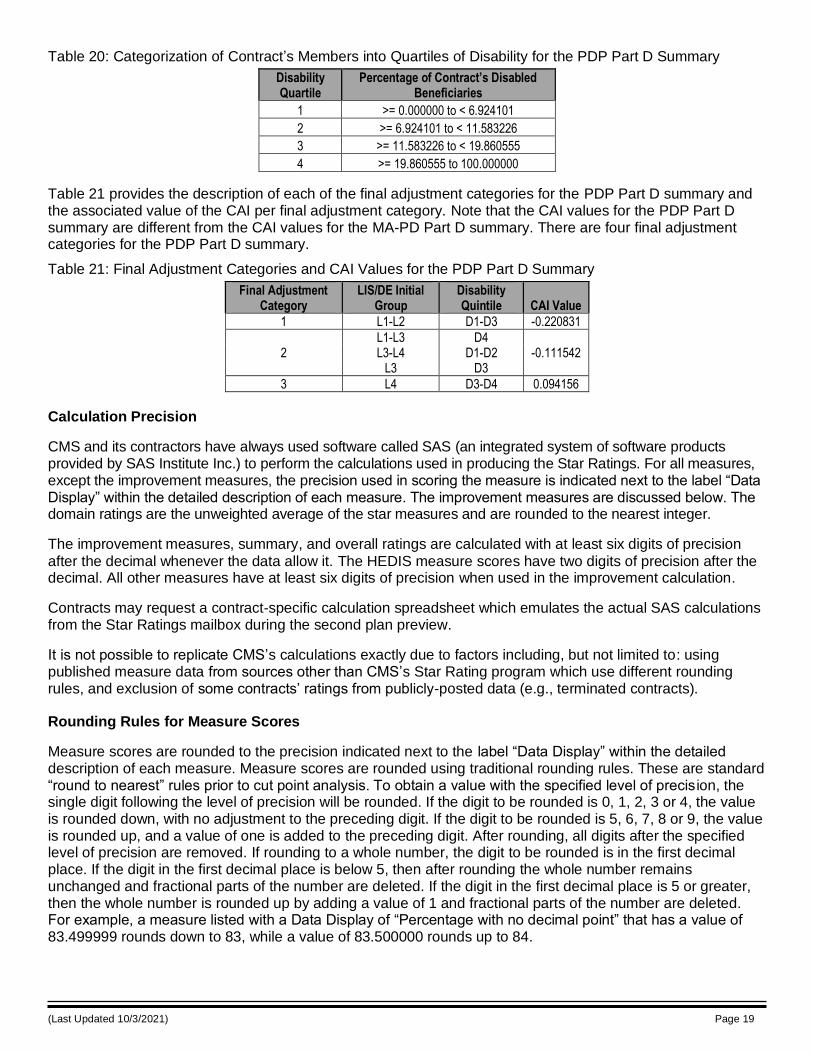
(Last Updated 10/3/2021) Page 19
Table 20: Categorization of Contract’s Members into Quartiles of Disability for the PDP Part D Summary
Disability Quartile
Percentage of Contract’s Disabled Beneficiaries
1 >= 0.000000 to < 6.924101
2 >= 6.924101 to < 11.583226
3 >= 11.583226 to < 19.860555
4 >= 19.860555 to 100.000000
Table 21 provides the description of each of the final adjustment categories for the PDP Part D summary and the associated value of the CAI per final adjustment category. Note that the CAI values for the PDP Part D summary are different from the CAI values for the MA-PD Part D summary. There are four final adjustment categories for the PDP Part D summary.
Table 21: Final Adjustment Categories and CAI Values for the PDP Part D Summary
Final Adjustment Category
LIS/DE Initial Group
Disability Quintile CAI Value
1 L1-L2 D1-D3 -0.220831
2
L1-L3 L3-L4
L3
D4 D1-D2
D3
-0.111542
3 L4 D3-D4 0.094156
Calculation Precision
CMS and its contractors have always used software called SAS (an integrated system of software products provided by SAS Institute Inc.) to perform the calculations used in producing the Star Ratings. For all measures, except the improvement measures, the precision used in scoring the measure is indicated next to the label “Data Display” within the detailed description of each measure. The improvement measures are discussed below. The domain ratings are the unweighted average of the star measures and are rounded to the nearest integer.
The improvement measures, summary, and overall ratings are calculated with at least six digits of precision
after the decimal whenever the data allow it. The HEDIS measure scores have two digits of precision after the decimal. All other measures have at least six digits of precision when used in the improvement calculation.
Contracts may request a contract-specific calculation spreadsheet which emulates the actual SAS calculations from the Star Ratings mailbox during the second plan preview.
It is not possible to replicate CMS’s calculations exactly due to factors including, but not limited to: using published measure data from sources other than CMS’s Star Rating program which use different rounding rules, and exclusion of some contracts’ ratings from publicly-posted data (e.g., terminated contracts).
Rounding Rules for Measure Scores
Measure scores are rounded to the precision indicated next to the label “Data Display” within the detailed description of each measure. Measure scores are rounded using traditional rounding rules. These are standard “round to nearest” rules prior to cut point analysis. To obtain a value with the specified level of precis ion, the single digit following the level of precision will be rounded. If the digit to be rounded is 0, 1, 2, 3 or 4, the value is rounded down, with no adjustment to the preceding digit. If the digit to be rounded is 5, 6, 7, 8 or 9, the value is rounded up, and a value of one is added to the preceding digit. After rounding, all digits after the specified level of precision are removed. If rounding to a whole number, the digit to be rounded is in the first decimal place. If the digit in the first decimal place is below 5, then after rounding the whole number remains unchanged and fractional parts of the number are deleted. If the digit in the first decimal place is 5 or greater, then the whole number is rounded up by adding a value of 1 and fractional parts of the number are deleted. For example, a measure listed with a Data Display of “Percentage with no decimal point” that has a value of 83.499999 rounds down to 83, while a value of 83.500000 rounds up to 84.
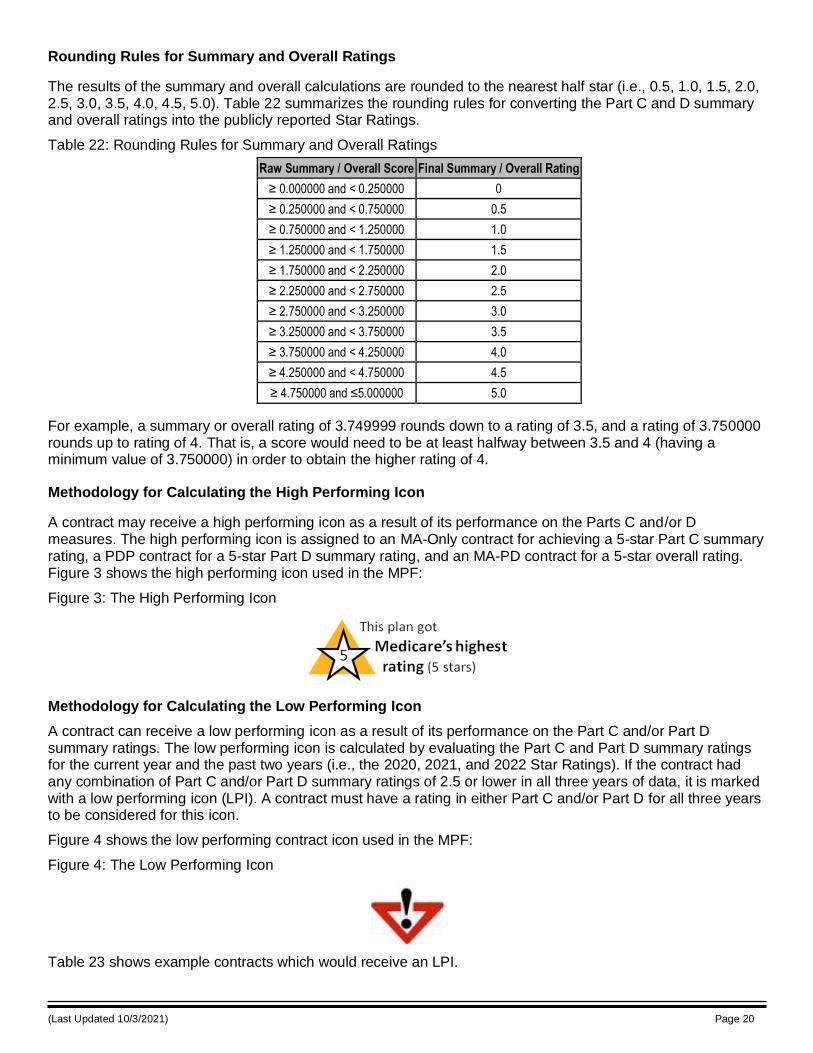
(Last Updated 10/3/2021) Page 20
Rounding Rules for Summary and Overall Ratings
The results of the summary and overall calculations are rounded to the nearest half star (i.e., 0.5, 1.0, 1.5, 2.0, 2.5, 3.0, 3.5, 4.0, 4.5, 5.0). Table 22 summarizes the rounding rules for converting the Part C and D summary and overall ratings into the publicly reported Star Ratings.
Table 22: Rounding Rules for Summary and Overall Ratings
Raw Summary / Overall Score Final Summary / Overall Rating
≥ 0.000000 and < 0.250000 0
≥ 0.250000 and < 0.750000 0.5
≥ 0.750000 and < 1.250000 1.0
≥ 1.250000 and < 1.750000 1.5
≥ 1.750000 and < 2.250000 2.0
≥ 2.250000 and < 2.750000 2.5
≥ 2.750000 and < 3.250000 3.0
≥ 3.250000 and < 3.750000 3.5
≥ 3.750000 and < 4.250000 4.0
≥ 4.250000 and < 4.750000 4.5
≥ 4.750000 and ≤5.000000 5.0
For example, a summary or overall rating of 3.749999 rounds down to a rating of 3.5, and a rating of 3.750000 rounds up to rating of 4. That is, a score would need to be at least halfway between 3.5 and 4 (having a minimum value of 3.750000) in order to obtain the higher rating of 4.
Methodology for Calculating the High Performing Icon
A contract may receive a high performing icon as a result of its performance on the Parts C and/or D measures. The high performing icon is assigned to an MA-Only contract for achieving a 5-star Part C summary rating, a PDP contract for a 5-star Part D summary rating, and an MA-PD contract for a 5-star overall rating. Figure 3 shows the high performing icon used in the MPF:
Figure 3: The High Performing Icon
Methodology for Calculating the Low Performing Icon
A contract can receive a low performing icon as a result of its performance on the Part C and/or Part D summary ratings. The low performing icon is calculated by evaluating the Part C and Part D summary ratings for the current year and the past two years (i.e., the 2020, 2021, and 2022 Star Ratings). If the contract had any combination of Part C and/or Part D summary ratings of 2.5 or lower in all three years of data, it is marked with a low performing icon (LPI). A contract must have a rating in either Part C and/or Part D for all three years to be considered for this icon.
Figure 4 shows the low performing contract icon used in the MPF:
Figure 4: The Low Performing Icon
Table 23 shows example contracts which would receive an LPI.
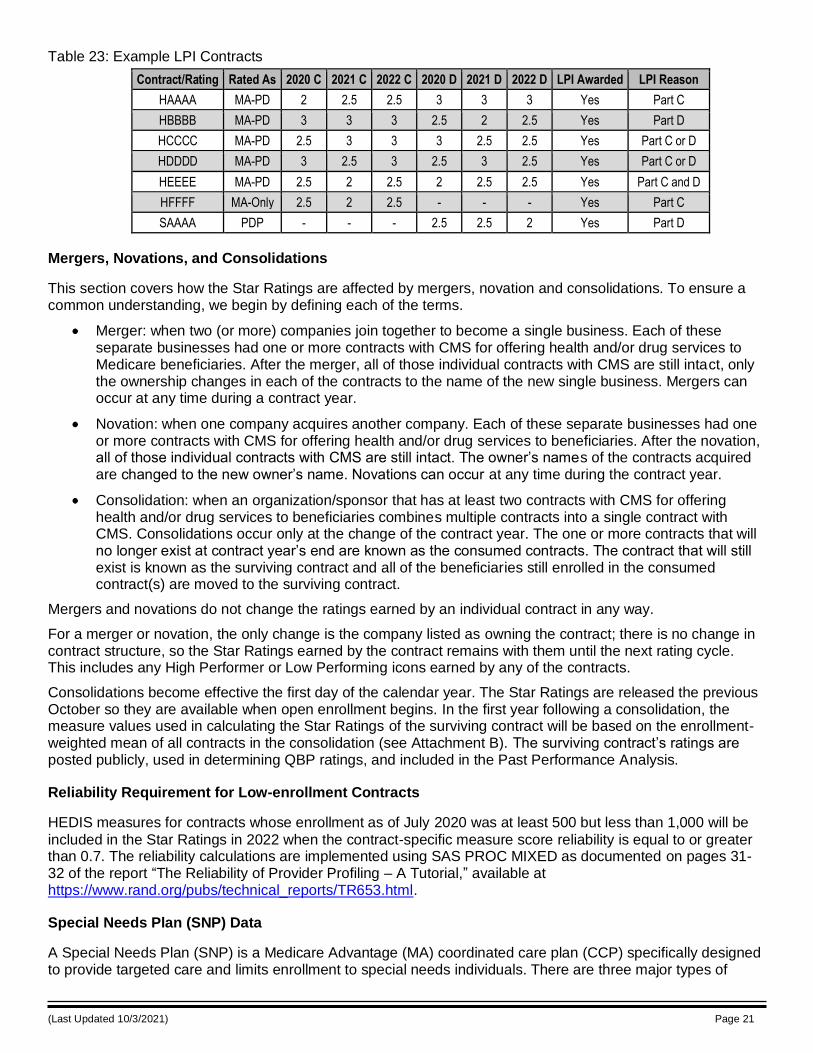
(Last Updated 10/3/2021) Page 21
Table 23: Example LPI Contracts
Contract/Rating Rated As 2020 C 2021 C 2022 C 2020 D 2021 D 2022 D LPI Awarded LPI Reason
HAAAA MA-PD 2 2.5 2.5 3 3 3 Yes Part C
HBBBB MA-PD 3 3 3 2.5 2 2.5 Yes Part D
HCCCC MA-PD 2.5 3 3 3 2.5 2.5 Yes Part C or D
HDDDD MA-PD 3 2.5 3 2.5 3 2.5 Yes Part C or D
HEEEE MA-PD 2.5 2 2.5 2 2.5 2.5 Yes Part C and D
HFFFF MA-Only 2.5 2 2.5 - - - Yes Part C
SAAAA PDP - - - 2.5 2.5 2 Yes Part D
Mergers, Novations, and Consolidations
This section covers how the Star Ratings are affected by mergers, novation and consolidations. To ensure a common understanding, we begin by defining each of the terms.
Merger: when two (or more) companies join together to become a single business. Each of these separate businesses had one or more contracts with CMS for offering health and/or drug services to Medicare beneficiaries. After the merger, all of those individual contracts with CMS are still intact, only the ownership changes in each of the contracts to the name of the new single business. Mergers can occur at any time during a contract year.
Novation: when one company acquires another company. Each of these separate businesses had one or more contracts with CMS for offering health and/or drug services to beneficiaries. After the novation, all of those individual contracts with CMS are still intact. The owner’s names of the contracts acquired are changed to the new owner’s name. Novations can occur at any time during the contract year.
Consolidation: when an organization/sponsor that has at least two contracts with CMS for offering health and/or drug services to beneficiaries combines multiple contracts into a single contract with CMS. Consolidations occur only at the change of the contract year. The one or more contracts that will no longer exist at contract year’s end are known as the consumed contracts. The contract that will still exist is known as the surviving contract and all of the beneficiaries still enrolled in the consumed contract(s) are moved to the surviving contract.
Mergers and novations do not change the ratings earned by an individual contract in any way.
For a merger or novation, the only change is the company listed as owning the contract; there is no change in contract structure, so the Star Ratings earned by the contract remains with them until the next rating cycle. This includes any High Performer or Low Performing icons earned by any of the contracts.
Consolidations become effective the first day of the calendar year. The Star Ratings are released the previous October so they are available when open enrollment begins. In the first year following a consolidation, the measure values used in calculating the Star Ratings of the surviving contract will be based on the enrollment-weighted mean of all contracts in the consolidation (see Attachment B). The surviving contract’s ratings are posted publicly, used in determining QBP ratings, and included in the Past Performance Analysis.
Reliability Requirement for Low-enrollment Contracts
HEDIS measures for contracts whose enrollment as of July 2020 was at least 500 but less than 1,000 will be
included in the Star Ratings in 2022 when the contract-specific measure score reliability is equal to or greater than 0.7. The reliability calculations are implemented using SAS PROC MIXED as documented on pages 31-32 of the report “The Reliability of Provider Profiling – A Tutorial,” available at https://www.rand.org/pubs/technical_reports/TR653.html.
Special Needs Plan (SNP) Data
A Special Needs Plan (SNP) is a Medicare Advantage (MA) coordinated care plan (CCP) specifically designed to provide targeted care and limits enrollment to special needs individuals. There are three major types of
(Last Updated 10/3/2021) Page 22
SNPs: 1) Chronic Condition SNP (C-SNP), 2) Dual Eligible SNP (D-SNP), and 3) Institutional SNP (I-SNP). Further details on SNP plans can be found in the glossary, Attachment R.
CMS has included three SNP-specific measures in the 2022 Star Ratings. The Part C ‘Special Needs Plan Care Management’ measure is based on data reported by contracts through the Medicare Part C Reporting Requirements. The two Part C ‘Care for Older Adults’ measures are based on HEDIS data. The data for all of these measures are reported at the plan benefit package (PBP) level, while the Star Ratings are reported at the contract level.
The methodology used to combine the PBP data to the contract level is different between the two data sources. The Part C Reporting Requirements data are summed into a contract-level rate after excluding PBPs that do not map to any PBP offered by the contract in the calendar year for which the Reporting Requirements data underwent data validation. The HEDIS data are summed into a contract-level rate as long as the contract will be offering a SNP PBP in the Star Ratings year.
The two methodologies used to combine the PBP data within a contract for these measures are described further in Attachment E.
Star Ratings and Marketing
Plan sponsors must ensure the Star Ratings document and all marketing of Star Ratings information is compliant with CMS’s Medicare Marketing Guidelines. Failure to follow CMS’ guidance may result in compliance action against the contract. The Medicare Marketing Guidelines were issued as Chapters 2 and 3 of the Prescription Drug Benefit Manual and the Medicare Managed Care Manual, respectively. Please direct questions about marketing Star Ratings information to your Account Manager.
Contact Information
The contact below can assist you with various aspects of the Star Ratings.
• Part C & D Star Ratings: [email protected]
If you have questions or require information about the specific subject areas associated with the Star Ratings please write to those contacts directly and cc the Part C & D Star Ratings mailbox.
• CAHPS (MA & Part D): [email protected]
• Call Center Monitoring: [email protected]
• Compliance Activity Module issues (Part C): [email protected]
• Compliance Activity Module issues (Part D): [email protected]
• Data Integrity: [email protected]
• Demonstration (Medicare-Medicaid Plan) Ratings: [email protected]
• Disenrollment Reasons Survey: [email protected]
• HEDIS: [email protected]
• HOS: [email protected]
• HPMS Access issues: [email protected]
• HPMS Help Desk (all other HPMS issues): [email protected]
• Marketing: [email protected]
• Part C Compliance Activity issues: [email protected]
• Part D Compliance Activity issues: [email protected]
• Plan Reporting (Part C): [email protected]
(Last Updated 10/3/2021) Page 23
• Plan Reporting (Part D): [email protected]
• Plan Reporting Data Validation (Part C & D): [email protected]
• QBP Ratings and Appeals questions: [email protected]
• QBP Payment or Risk Analysis questions: [email protected]
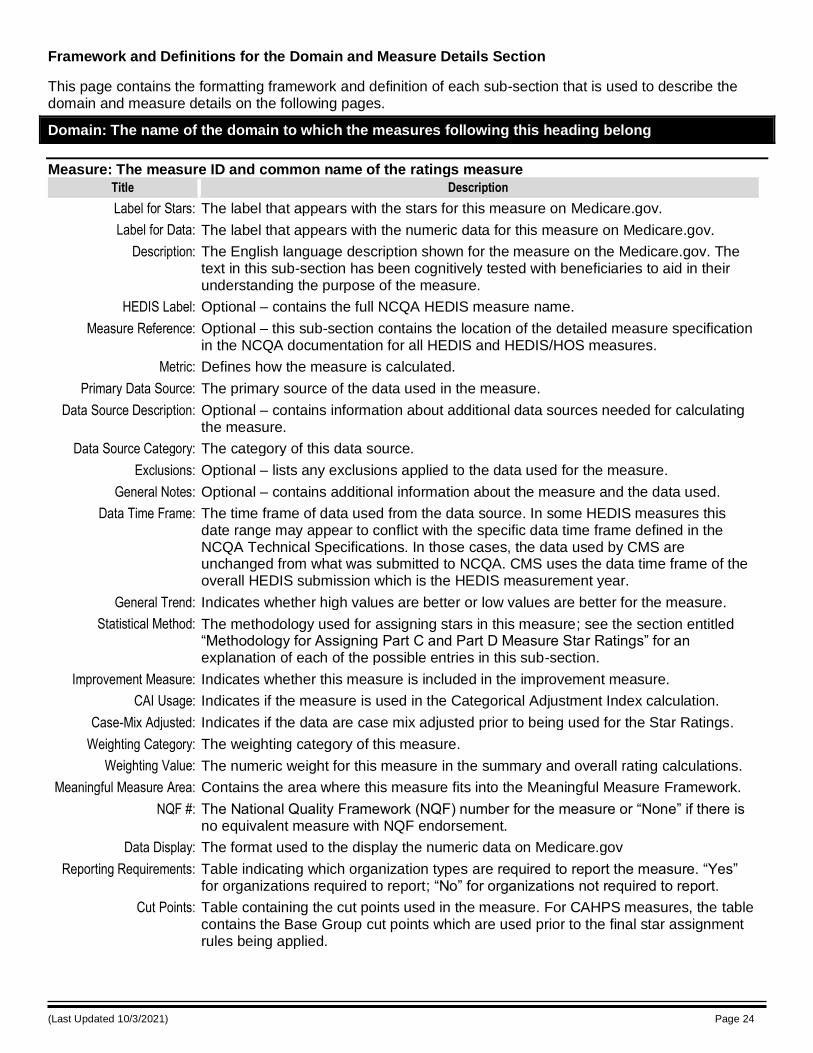
(Last Updated 10/3/2021) Page 24
Framework and Definitions for the Domain and Measure Details Section
This page contains the formatting framework and definition of each sub-section that is used to describe the domain and measure details on the following pages.
Domain: The name of the domain to which the measures following this heading belong
Measure: The measure ID and common name of the ratings measure
Title Description
Label for Stars: The label that appears with the stars for this measure on Medicare.gov.
Label for Data: The label that appears with the numeric data for this measure on Medicare.gov.
Description: The English language description shown for the measure on the Medicare.gov. The text in this sub-section has been cognitively tested with beneficiaries to aid in their understanding the purpose of the measure.
HEDIS Label: Optional – contains the full NCQA HEDIS measure name.
Measure Reference: Optional – this sub-section contains the location of the detailed measure specification in the NCQA documentation for all HEDIS and HEDIS/HOS measures.
Metric: Defines how the measure is calculated.
Primary Data Source: The primary source of the data used in the measure.
Data Source Description: Optional – contains information about additional data sources needed for calculating the measure.
Data Source Category: The category of this data source.
Exclusions: Optional – lists any exclusions applied to the data used for the measure.
General Notes: Optional – contains additional information about the measure and the data used.
Data Time Frame: The time frame of data used from the data source. In some HEDIS measures this date range may appear to conflict with the specific data time frame defined in the NCQA Technical Specifications. In those cases, the data used by CMS are unchanged from what was submitted to NCQA. CMS uses the data time frame of the overall HEDIS submission which is the HEDIS measurement year.
General Trend: Indicates whether high values are better or low values are better for the measure.
Statistical Method: The methodology used for assigning stars in this measure; see the section entitled “Methodology for Assigning Part C and Part D Measure Star Ratings” for an explanation of each of the possible entries in this sub-section.
Improvement Measure: Indicates whether this measure is included in the improvement measure.
CAI Usage: Indicates if the measure is used in the Categorical Adjustment Index calculation.
Case-Mix Adjusted: Indicates if the data are case mix adjusted prior to being used for the Star Ratings.
Weighting Category: The weighting category of this measure.
Weighting Value: The numeric weight for this measure in the summary and overall rating calculations.
Meaningful Measure Area: Contains the area where this measure fits into the Meaningful Measure Framework.
NQF #: The National Quality Framework (NQF) number for the measure or “None” if there is no equivalent measure with NQF endorsement.
Data Display: The format used to the display the numeric data on Medicare.gov
Reporting Requirements: Table indicating which organization types are required to report the measure. “Yes” for organizations required to report; “No” for organizations not required to report.
Cut Points: Table containing the cut points used in the measure. For CAHPS measures, the table contains the Base Group cut points which are used prior to the final star assignment rules being applied.
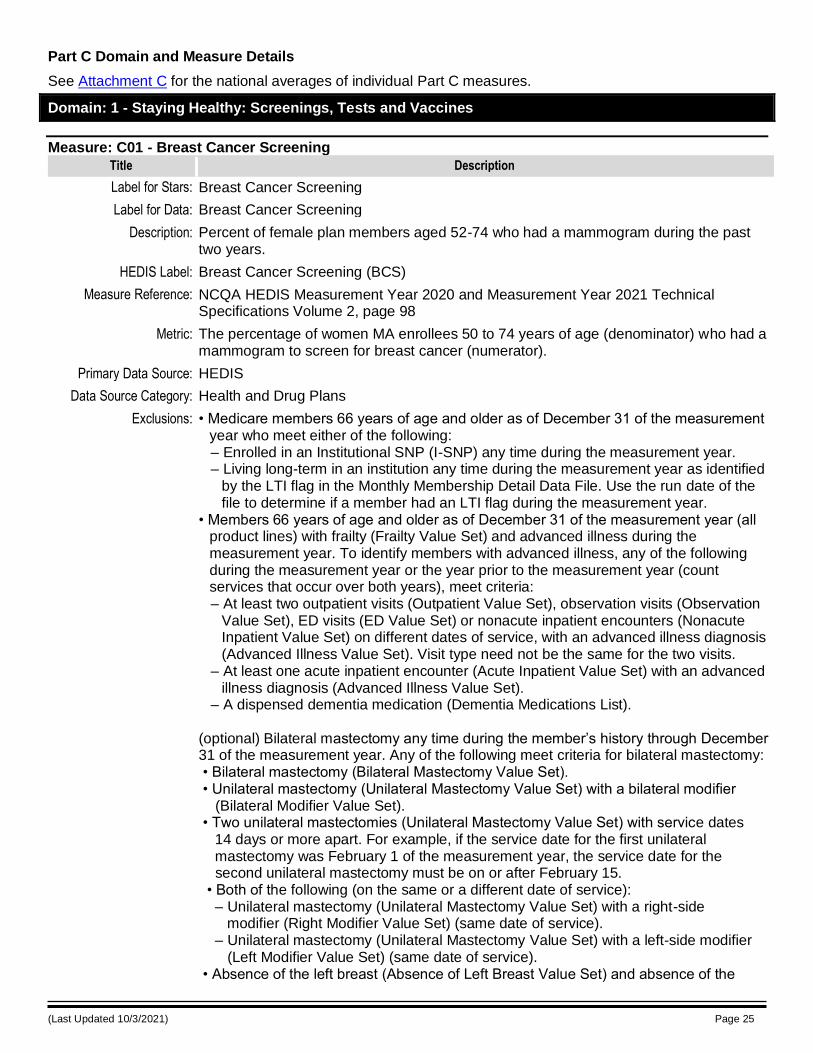
(Last Updated 10/3/2021) Page 25
Part C Domain and Measure Details
See Attachment C for the national averages of individual Part C measures.
Domain: 1 - Staying Healthy: Screenings, Tests and Vaccines
Measure: C01 - Breast Cancer Screening
Title Description
Label for Stars: Breast Cancer Screening
Label for Data: Breast Cancer Screening
Description: Percent of female plan members aged 52-74 who had a mammogram during the past two years.
HEDIS Label: Breast Cancer Screening (BCS)
Measure Reference: NCQA HEDIS Measurement Year 2020 and Measurement Year 2021 Technical Specifications Volume 2, page 98
Metric: The percentage of women MA enrollees 50 to 74 years of age (denominator) who had a mammogram to screen for breast cancer (numerator).
Primary Data Source: HEDIS
Data Source Category: Health and Drug Plans
Exclusions: • Medicare members 66 years of age and older as of December 31 of the measurement year who meet either of the following: – Enrolled in an Institutional SNP (I-SNP) any time during the measurement year. – Living long-term in an institution any time during the measurement year as identified
by the LTI flag in the Monthly Membership Detail Data File. Use the run date of the file to determine if a member had an LTI flag during the measurement year.
• Members 66 years of age and older as of December 31 of the measurement year (all product lines) with frailty (Frailty Value Set) and advanced illness during the measurement year. To identify members with advanced illness, any of the following during the measurement year or the year prior to the measurement year (count services that occur over both years), meet criteria: – At least two outpatient visits (Outpatient Value Set), observation visits (Observation
Value Set), ED visits (ED Value Set) or nonacute inpatient encounters (Nonacute Inpatient Value Set) on different dates of service, with an advanced illness diagnosis (Advanced Illness Value Set). Visit type need not be the same for the two visits.
– At least one acute inpatient encounter (Acute Inpatient Value Set) with an advanced illness diagnosis (Advanced Illness Value Set).
– A dispensed dementia medication (Dementia Medications List). (optional) Bilateral mastectomy any time during the member’s history through December 31 of the measurement year. Any of the following meet criteria for bilateral mastectomy: • Bilateral mastectomy (Bilateral Mastectomy Value Set). • Unilateral mastectomy (Unilateral Mastectomy Value Set) with a bilateral modifier (Bilateral Modifier Value Set). • Two unilateral mastectomies (Unilateral Mastectomy Value Set) with service dates 14 days or more apart. For example, if the service date for the first unilateral mastectomy was February 1 of the measurement year, the service date for the second unilateral mastectomy must be on or after February 15. • Both of the following (on the same or a different date of service): – Unilateral mastectomy (Unilateral Mastectomy Value Set) with a right-side modifier (Right Modifier Value Set) (same date of service). – Unilateral mastectomy (Unilateral Mastectomy Value Set) with a left-side modifier (Left Modifier Value Set) (same date of service). • Absence of the left breast (Absence of Left Breast Value Set) and absence of the
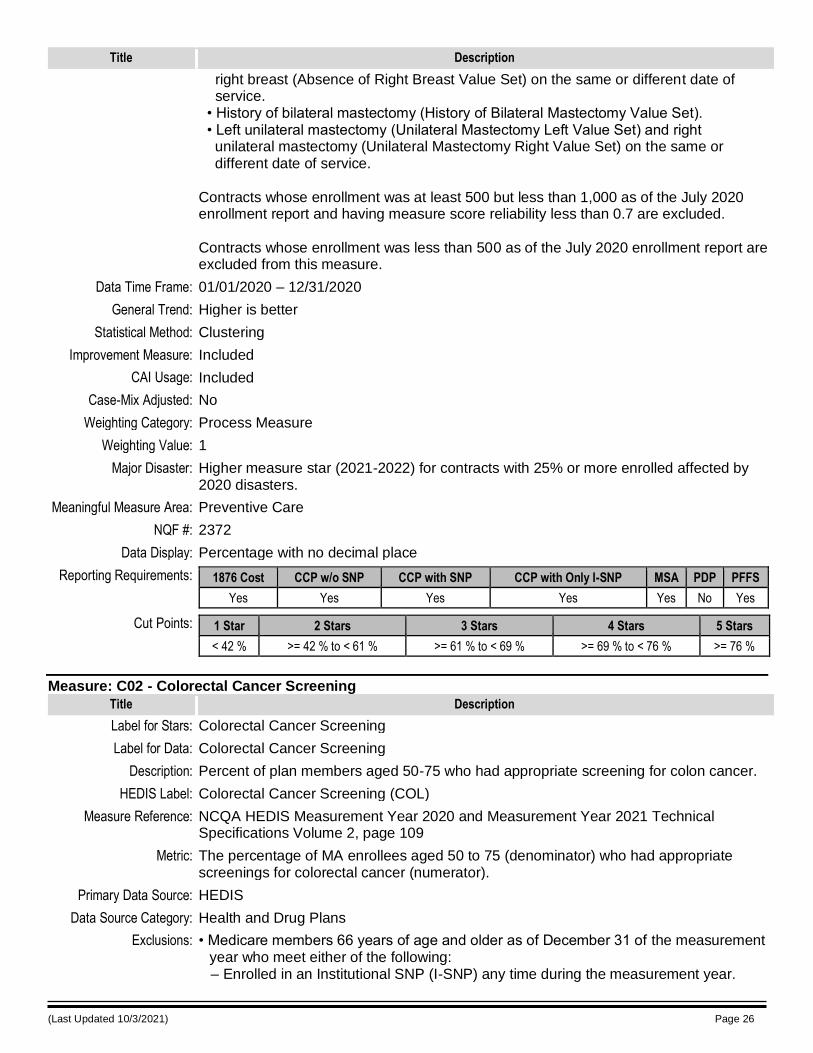
(Last Updated 10/3/2021) Page 26
Title Description
right breast (Absence of Right Breast Value Set) on the same or different date of service. • History of bilateral mastectomy (History of Bilateral Mastectomy Value Set). • Left unilateral mastectomy (Unilateral Mastectomy Left Value Set) and right unilateral mastectomy (Unilateral Mastectomy Right Value Set) on the same or different date of service. Contracts whose enrollment was at least 500 but less than 1,000 as of the July 2020 enrollment report and having measure score reliability less than 0.7 are excluded. Contracts whose enrollment was less than 500 as of the July 2020 enrollment report are excluded from this measure.
Data Time Frame: 01/01/2020 – 12/31/2020
General Trend: Higher is better
Statistical Method: Clustering
Improvement Measure: Included
CAI Usage: Included
Case-Mix Adjusted: No
Weighting Category: Process Measure
Weighting Value: 1
Major Disaster: Higher measure star (2021-2022) for contracts with 25% or more enrolled affected by 2020 disasters.
Meaningful Measure Area: Preventive Care
NQF #: 2372
Data Display: Percentage with no decimal place
Reporting Requirements: 1876 Cost CCP w/o SNP CCP with SNP CCP with Only I-SNP MSA PDP PFFS
Yes Yes Yes Yes Yes No Yes
Cut Points: 1 Star 2 Stars 3 Stars 4 Stars 5 Stars
< 42 % >= 42 % to < 61 % >= 61 % to < 69 % >= 69 % to < 76 % >= 76 %
Measure: C02 - Colorectal Cancer Screening
Title Description
Label for Stars: Colorectal Cancer Screening
Label for Data: Colorectal Cancer Screening
Description: Percent of plan members aged 50-75 who had appropriate screening for colon cancer.
HEDIS Label: Colorectal Cancer Screening (COL)
Measure Reference: NCQA HEDIS Measurement Year 2020 and Measurement Year 2021 Technical Specifications Volume 2, page 109
Metric: The percentage of MA enrollees aged 50 to 75 (denominator) who had appropriate screenings for colorectal cancer (numerator).
Primary Data Source: HEDIS
Data Source Category: Health and Drug Plans
Exclusions: • Medicare members 66 years of age and older as of December 31 of the measurement year who meet either of the following: – Enrolled in an Institutional SNP (I-SNP) any time during the measurement year.
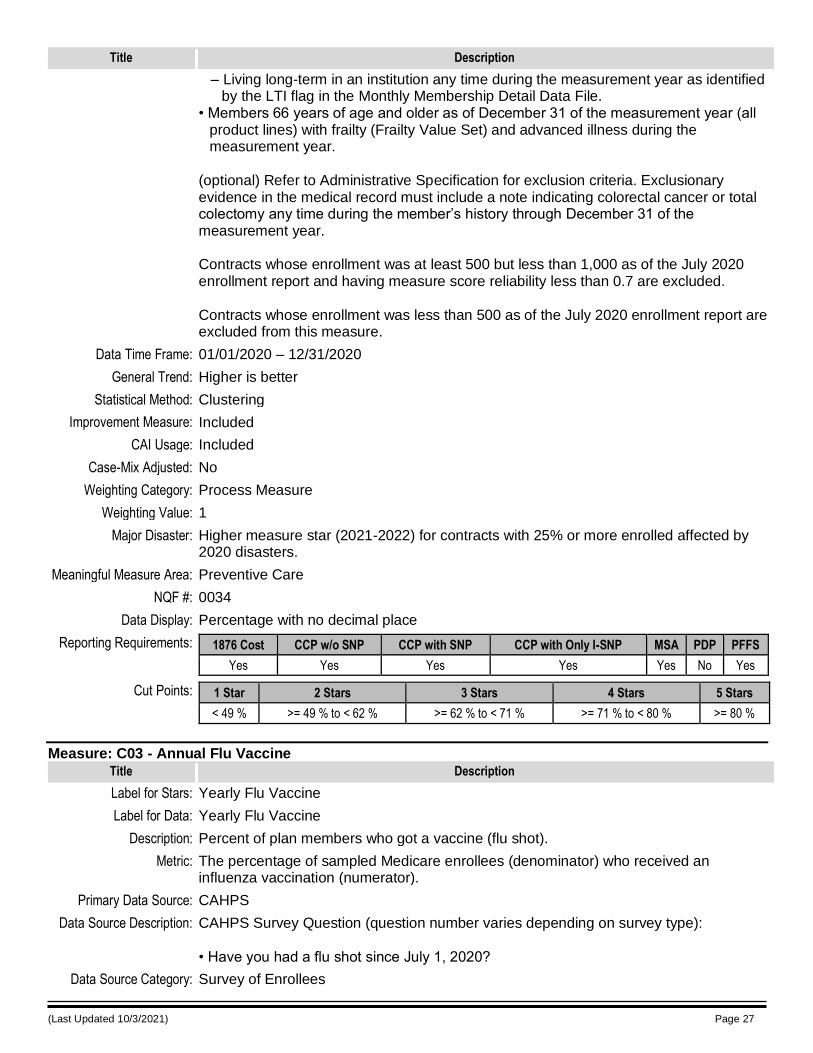
(Last Updated 10/3/2021) Page 27
Title Description
– Living long-term in an institution any time during the measurement year as identified by the LTI flag in the Monthly Membership Detail Data File.
• Members 66 years of age and older as of December 31 of the measurement year (all product lines) with frailty (Frailty Value Set) and advanced illness during the measurement year.
(optional) Refer to Administrative Specification for exclusion criteria. Exclusionary evidence in the medical record must include a note indicating colorectal cancer or total colectomy any time during the member’s history through December 31 of the measurement year. Contracts whose enrollment was at least 500 but less than 1,000 as of the July 2020 enrollment report and having measure score reliability less than 0.7 are excluded. Contracts whose enrollment was less than 500 as of the July 2020 enrollment report are excluded from this measure.
Data Time Frame: 01/01/2020 – 12/31/2020
General Trend: Higher is better
Statistical Method: Clustering
Improvement Measure: Included
CAI Usage: Included
Case-Mix Adjusted: No
Weighting Category: Process Measure
Weighting Value: 1
Major Disaster: Higher measure star (2021-2022) for contracts with 25% or more enrolled affected by 2020 disasters.
Meaningful Measure Area: Preventive Care
NQF #: 0034
Data Display: Percentage with no decimal place
Reporting Requirements: 1876 Cost CCP w/o SNP CCP with SNP CCP with Only I-SNP MSA PDP PFFS
Yes Yes Yes Yes Yes No Yes
Cut Points: 1 Star 2 Stars 3 Stars 4 Stars 5 Stars
< 49 % >= 49 % to < 62 % >= 62 % to < 71 % >= 71 % to < 80 % >= 80 %
Measure: C03 - Annual Flu Vaccine
Title Description
Label for Stars: Yearly Flu Vaccine
Label for Data: Yearly Flu Vaccine
Description: Percent of plan members who got a vaccine (flu shot).
Metric: The percentage of sampled Medicare enrollees (denominator) who received an influenza vaccination (numerator).
Primary Data Source: CAHPS
Data Source Description: CAHPS Survey Question (question number varies depending on survey type): • Have you had a flu shot since July 1, 2020?
Data Source Category: Survey of Enrollees
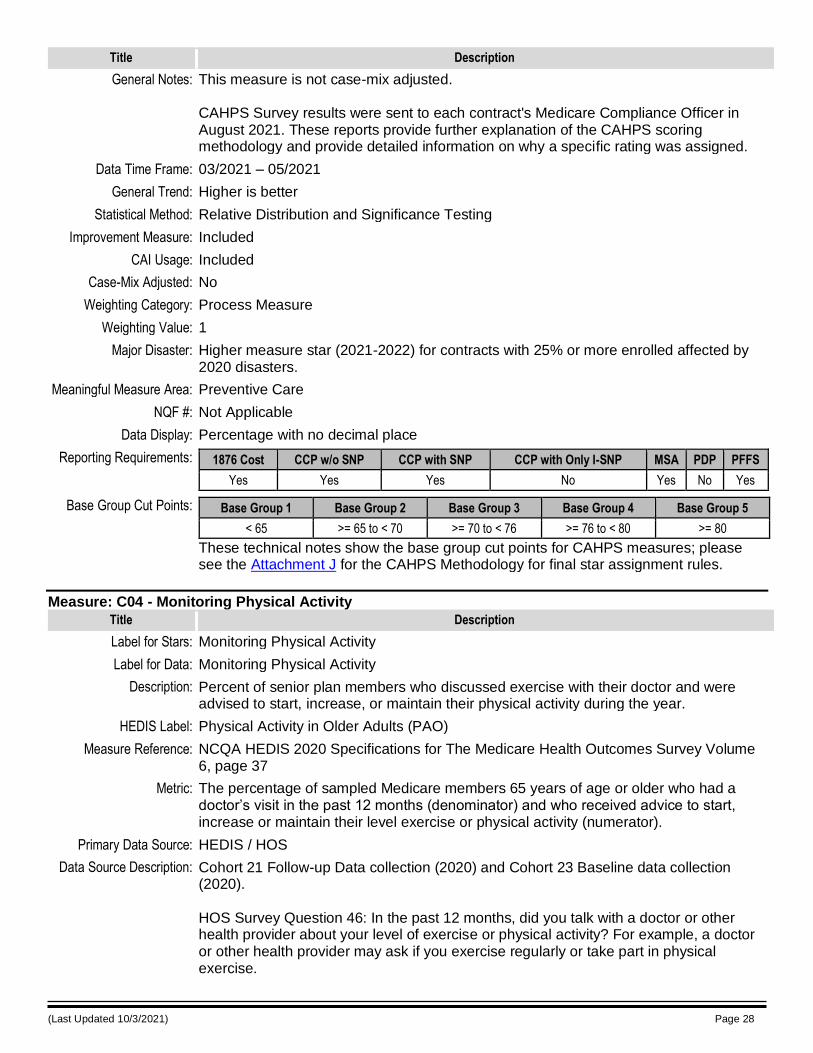
(Last Updated 10/3/2021) Page 28
Title Description
General Notes: This measure is not case-mix adjusted. CAHPS Survey results were sent to each contract's Medicare Compliance Officer in August 2021. These reports provide further explanation of the CAHPS scoring methodology and provide detailed information on why a specific rating was assigned.
Data Time Frame: 03/2021 – 05/2021
General Trend: Higher is better
Statistical Method: Relative Distribution and Significance Testing
Improvement Measure: Included
CAI Usage: Included
Case-Mix Adjusted: No
Weighting Category: Process Measure
Weighting Value: 1
Major Disaster: Higher measure star (2021-2022) for contracts with 25% or more enrolled affected by 2020 disasters.
Meaningful Measure Area: Preventive Care
NQF #: Not Applicable
Data Display: Percentage with no decimal place
Reporting Requirements: 1876 Cost CCP w/o SNP CCP with SNP CCP with Only I-SNP MSA PDP PFFS
Yes Yes Yes No Yes No Yes
Base Group Cut Points: Base Group 1 Base Group 2 Base Group 3 Base Group 4 Base Group 5
< 65 >= 65 to < 70 >= 70 to < 76 >= 76 to < 80 >= 80
These technical notes show the base group cut points for CAHPS measures; please see the Attachment J for the CAHPS Methodology for final star assignment rules.
Measure: C04 - Monitoring Physical Activity
Title Description
Label for Stars: Monitoring Physical Activity
Label for Data: Monitoring Physical Activity
Description: Percent of senior plan members who discussed exercise with their doctor and were advised to start, increase, or maintain their physical activity during the year.
HEDIS Label: Physical Activity in Older Adults (PAO)
Measure Reference: NCQA HEDIS 2020 Specifications for The Medicare Health Outcomes Survey Volume 6, page 37
Metric: The percentage of sampled Medicare members 65 years of age or older who had a doctor’s visit in the past 12 months (denominator) and who received advice to start, increase or maintain their level exercise or physical activity (numerator).
Primary Data Source: HEDIS / HOS
Data Source Description: Cohort 21 Follow-up Data collection (2020) and Cohort 23 Baseline data collection (2020). HOS Survey Question 46: In the past 12 months, did you talk with a doctor or other health provider about your level of exercise or physical activity? For example, a doctor or other health provider may ask if you exercise regularly or take part in physical exercise.
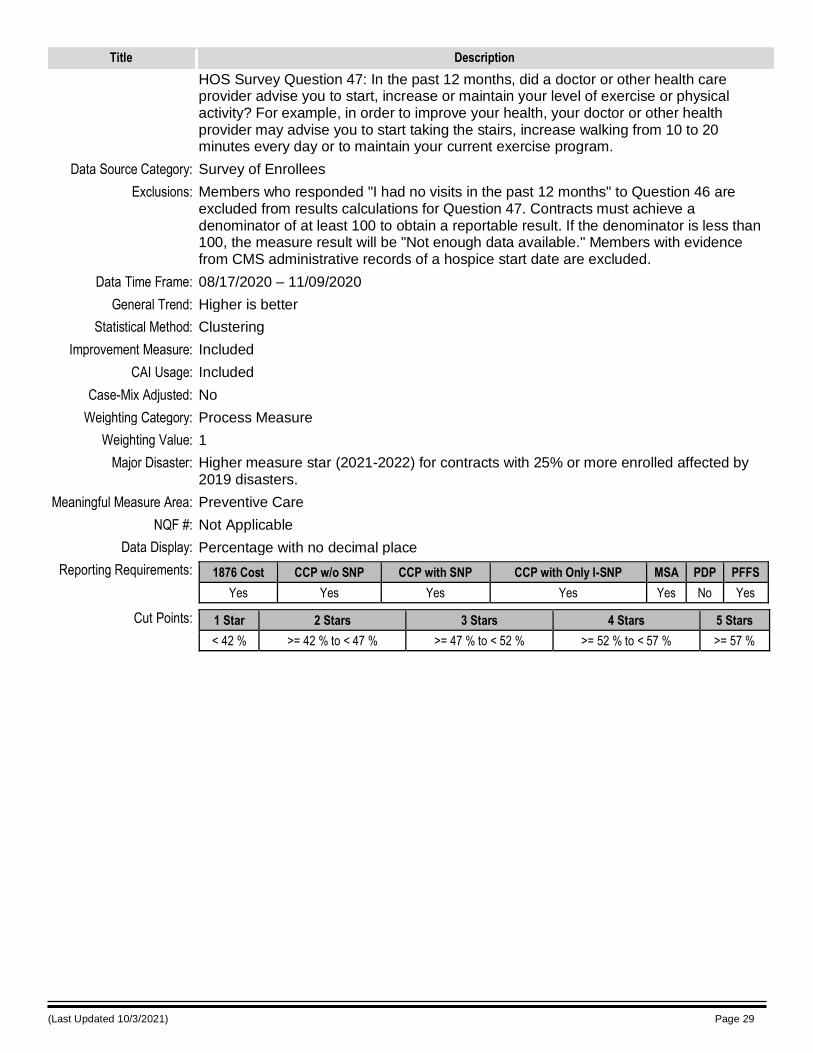
(Last Updated 10/3/2021) Page 29
Title Description
HOS Survey Question 47: In the past 12 months, did a doctor or other health care provider advise you to start, increase or maintain your level of exercise or physical activity? For example, in order to improve your health, your doctor or other health provider may advise you to start taking the stairs, increase walking from 10 to 20 minutes every day or to maintain your current exercise program.
Data Source Category: Survey of Enrollees
Exclusions: Members who responded "I had no visits in the past 12 months" to Question 46 are excluded from results calculations for Question 47. Contracts must achieve a denominator of at least 100 to obtain a reportable result. If the denominator is less than 100, the measure result will be "Not enough data available." Members with evidence from CMS administrative records of a hospice start date are excluded.
Data Time Frame: 08/17/2020 – 11/09/2020
General Trend: Higher is better
Statistical Method: Clustering
Improvement Measure: Included
CAI Usage: Included
Case-Mix Adjusted: No
Weighting Category: Process Measure
Weighting Value: 1
Major Disaster: Higher measure star (2021-2022) for contracts with 25% or more enrolled affected by 2019 disasters.
Meaningful Measure Area: Preventive Care
NQF #: Not Applicable
Data Display: Percentage with no decimal place
Reporting Requirements: 1876 Cost CCP w/o SNP CCP with SNP CCP with Only I-SNP MSA PDP PFFS
Yes Yes Yes Yes Yes No Yes
Cut Points: 1 Star 2 Stars 3 Stars 4 Stars 5 Stars
< 42 % >= 42 % to < 47 % >= 47 % to < 52 % >= 52 % to < 57 % >= 57 %
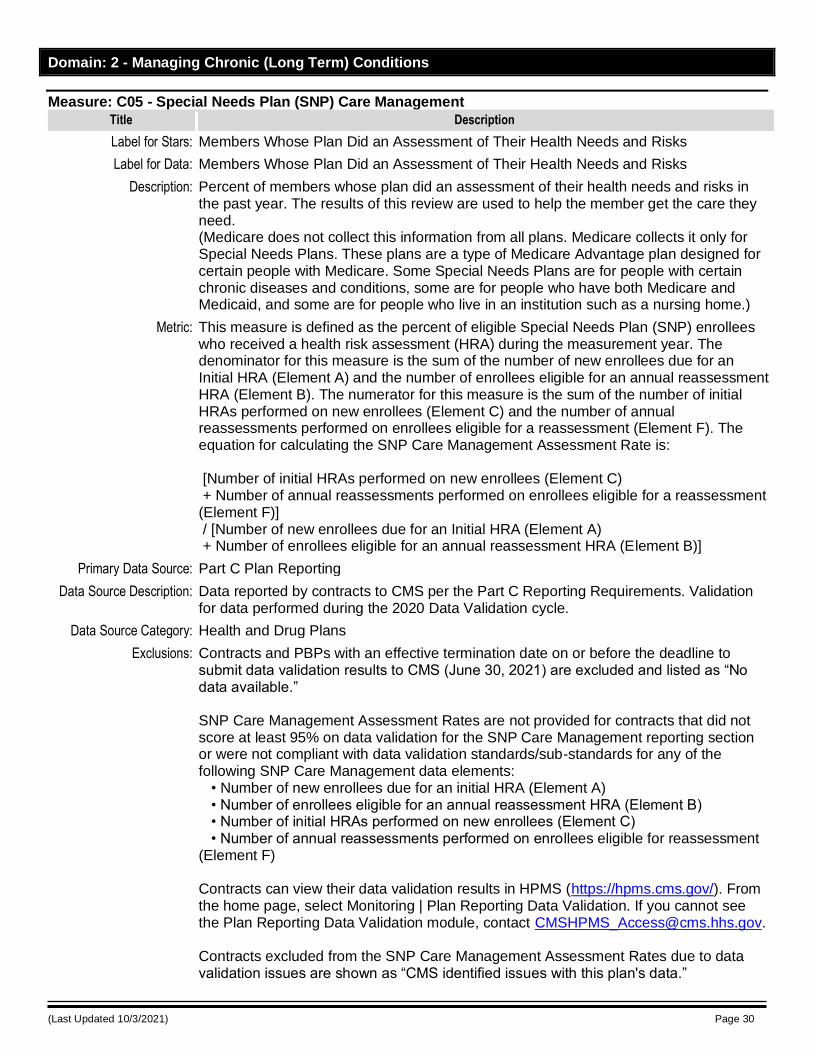
(Last Updated 10/3/2021) Page 30
Domain: 2 - Managing Chronic (Long Term) Conditions
Measure: C05 - Special Needs Plan (SNP) Care Management
Title Description
Label for Stars: Members Whose Plan Did an Assessment of Their Health Needs and Risks
Label for Data: Members Whose Plan Did an Assessment of Their Health Needs and Risks
Description: Percent of members whose plan did an assessment of their health needs and risks in the past year. The results of this review are used to help the member get the care they need. (Medicare does not collect this information from all plans. Medicare collects it only for Special Needs Plans. These plans are a type of Medicare Advantage plan designed for certain people with Medicare. Some Special Needs Plans are for people with certain chronic diseases and conditions, some are for people who have both Medicare and Medicaid, and some are for people who live in an institution such as a nursing home.)
Metric: This measure is defined as the percent of eligible Special Needs Plan (SNP) enrollees who received a health risk assessment (HRA) during the measurement year. The denominator for this measure is the sum of the number of new enrollees due for an Initial HRA (Element A) and the number of enrollees eligible for an annual reassessment HRA (Element B). The numerator for this measure is the sum of the number of initial HRAs performed on new enrollees (Element C) and the number of annual reassessments performed on enrollees eligible for a reassessment (Element F). The equation for calculating the SNP Care Management Assessment Rate is: [Number of initial HRAs performed on new enrollees (Element C) + Number of annual reassessments performed on enrollees eligible for a reassessment (Element F)] / [Number of new enrollees due for an Initial HRA (Element A) + Number of enrollees eligible for an annual reassessment HRA (Element B)]
Primary Data Source: Part C Plan Reporting
Data Source Description: Data reported by contracts to CMS per the Part C Reporting Requirements. Validation for data performed during the 2020 Data Validation cycle.
Data Source Category: Health and Drug Plans
Exclusions: Contracts and PBPs with an effective termination date on or before the deadline to submit data validation results to CMS (June 30, 2021) are excluded and listed as “No data available.” SNP Care Management Assessment Rates are not provided for contracts that did not score at least 95% on data validation for the SNP Care Management reporting section or were not compliant with data validation standards/sub-standards for any of the following SNP Care Management data elements: • Number of new enrollees due for an initial HRA (Element A) • Number of enrollees eligible for an annual reassessment HRA (Element B) • Number of initial HRAs performed on new enrollees (Element C) • Number of annual reassessments performed on enrollees eligible for reassessment (Element F) Contracts can view their data validation results in HPMS (https://hpms.cms.gov/). From the home page, select Monitoring | Plan Reporting Data Validation. If you cannot see the Plan Reporting Data Validation module, contact [email protected]. Contracts excluded from the SNP Care Management Assessment Rates due to data validation issues are shown as “CMS identified issues with this plan's data.”

(Last Updated 10/3/2021) Page 31
Title Description
Contracts can view their data validation results in HPMS (https://hpms.cms.gov/). To access this page, from the top menu select “Monitoring,” then “Plan Reporting Data Validation.” Select the appropriate contract year. Select the PRDVM Reports. Select “Score Detail Report.” Select the applicable reporting section. If you cannot see the Plan Reporting Data Validation module, contact [email protected]. Additionally, contracts must have 30 or more enrollees in the denominator [Number of new enrollees due for an Initial HRA (Element A) + Number of enrollees eligible for an annual HRA (Element B) ≥ 30] in order to have a calculated rate. Contracts with fewer than 30 eligible enrollees are listed as "No data available.”
General Notes: More information about the data used to calculate this measure can be found in Attachment E. The Part C reporting requirement fields listed below are not used in calculating this measure: • Data Element D Number of initial HRA refusals • Data Element E Number of initial HRAs where SNP is unable to reach new enrollees • Data Element G Number of annual reassessment refusals • Data Element H Number of annual reassessments where SNP is unable to reach enrollee
Data Time Frame: 01/01/2020 – 12/31/2020
General Trend: Higher is better
Statistical Method: Clustering
Improvement Measure: Included
CAI Usage: Not Included
Case-Mix Adjusted: No
Weighting Category: Process Measure
Weighting Value: 1
Major Disaster: Higher measure star (2021-2022) for contracts with 25% or more enrolled affected by 2020 disasters.
Meaningful Measure Area: Management of Chronic Conditions
NQF #: Not Applicable
Data Display: Percentage with no decimal place
Reporting Requirements: 1876 Cost CCP w/o SNP CCP with SNP CCP with Only I-SNP MSA PDP PFFS
No No Yes Yes No No No
Cut Points: 1 Star 2 Stars 3 Stars 4 Stars 5 Stars
< 45 % >= 45 % to < 59 % >= 59 % to < 73 % >= 73 % to < 87 % >= 87 %
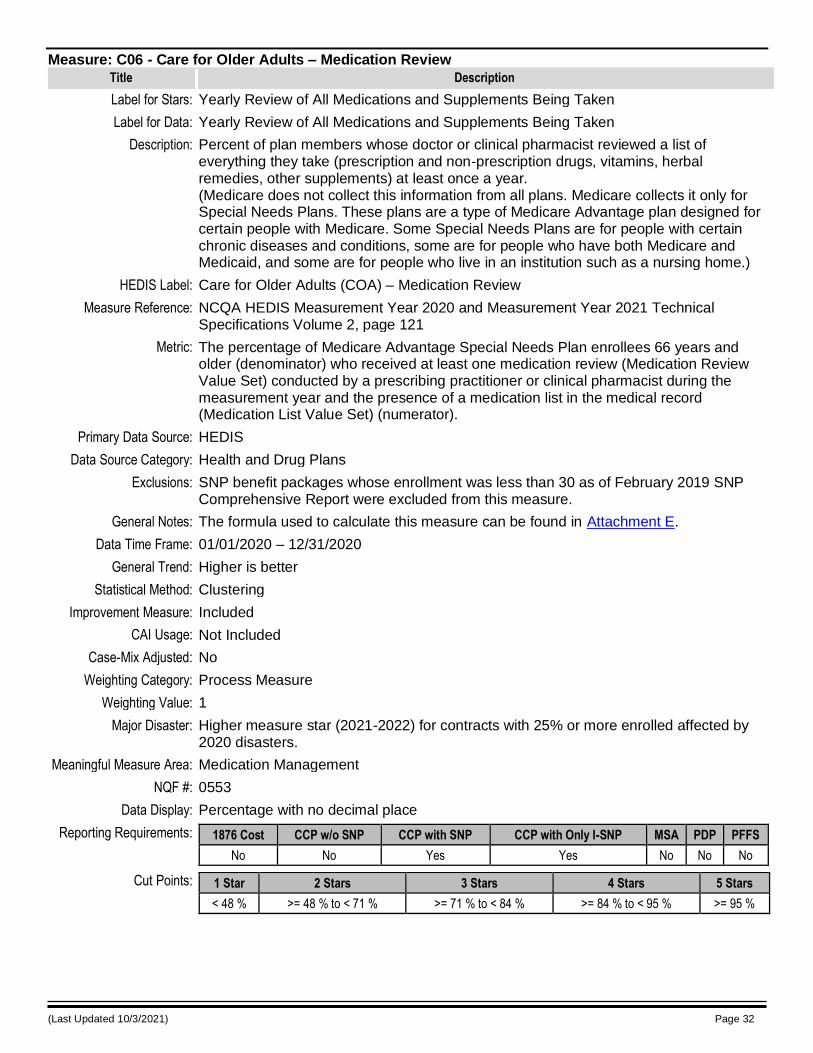
(Last Updated 10/3/2021) Page 32
Measure: C06 - Care for Older Adults – Medication Review
Title Description
Label for Stars: Yearly Review of All Medications and Supplements Being Taken
Label for Data: Yearly Review of All Medications and Supplements Being Taken
Description: Percent of plan members whose doctor or clinical pharmacist reviewed a list of everything they take (prescription and non-prescription drugs, vitamins, herbal remedies, other supplements) at least once a year. (Medicare does not collect this information from all plans. Medicare collects it only for Special Needs Plans. These plans are a type of Medicare Advantage plan designed for certain people with Medicare. Some Special Needs Plans are for people with certain chronic diseases and conditions, some are for people who have both Medicare and Medicaid, and some are for people who live in an institution such as a nursing home.)
HEDIS Label: Care for Older Adults (COA) – Medication Review
Measure Reference: NCQA HEDIS Measurement Year 2020 and Measurement Year 2021 Technical Specifications Volume 2, page 121
Metric: The percentage of Medicare Advantage Special Needs Plan enrollees 66 years and older (denominator) who received at least one medication review (Medication Review Value Set) conducted by a prescribing practitioner or clinical pharmacist during the measurement year and the presence of a medication list in the medical record (Medication List Value Set) (numerator).
Primary Data Source: HEDIS
Data Source Category: Health and Drug Plans
Exclusions: SNP benefit packages whose enrollment was less than 30 as of February 2019 SNP Comprehensive Report were excluded from this measure.
General Notes: The formula used to calculate this measure can be found in Attachment E.
Data Time Frame: 01/01/2020 – 12/31/2020
General Trend: Higher is better
Statistical Method: Clustering
Improvement Measure: Included
CAI Usage: Not Included
Case-Mix Adjusted: No
Weighting Category: Process Measure
Weighting Value: 1
Major Disaster: Higher measure star (2021-2022) for contracts with 25% or more enrolled affected by 2020 disasters.
Meaningful Measure Area: Medication Management
NQF #: 0553
Data Display: Percentage with no decimal place
Reporting Requirements: 1876 Cost CCP w/o SNP CCP with SNP CCP with Only I-SNP MSA PDP PFFS
No No Yes Yes No No No
Cut Points: 1 Star 2 Stars 3 Stars 4 Stars 5 Stars
< 48 % >= 48 % to < 71 % >= 71 % to < 84 % >= 84 % to < 95 % >= 95 %
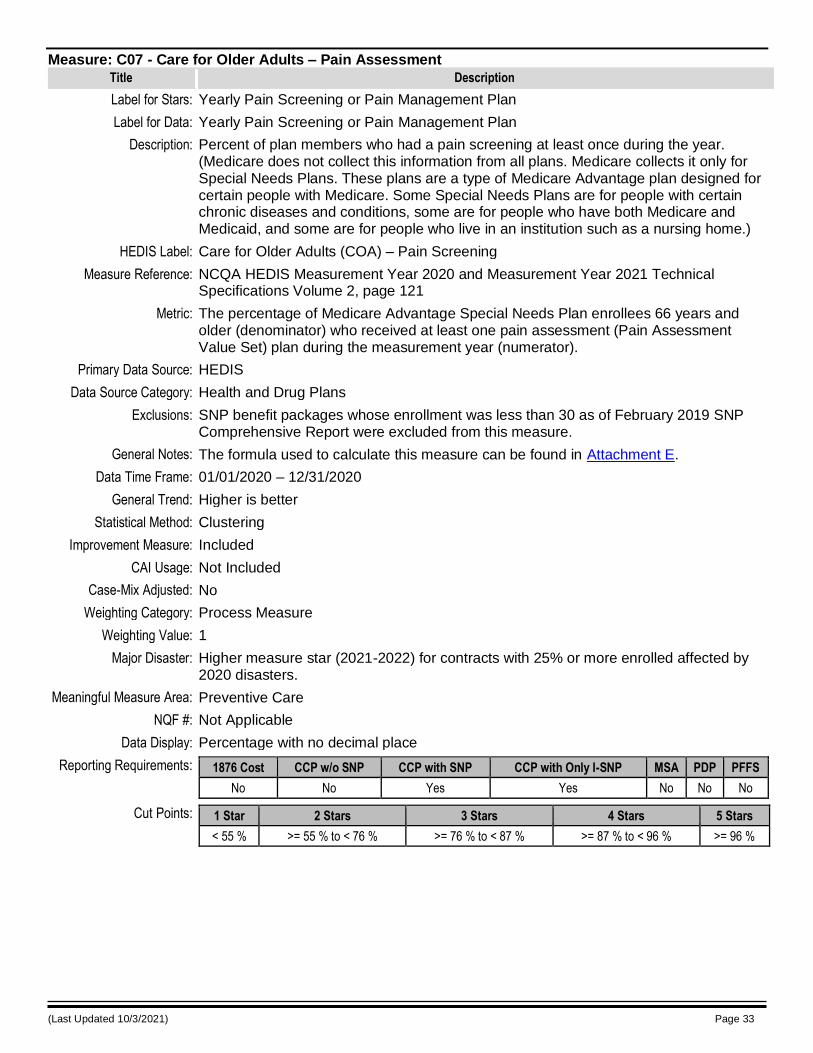
(Last Updated 10/3/2021) Page 33
Measure: C07 - Care for Older Adults – Pain Assessment
Title Description
Label for Stars: Yearly Pain Screening or Pain Management Plan
Label for Data: Yearly Pain Screening or Pain Management Plan
Description: Percent of plan members who had a pain screening at least once during the year. (Medicare does not collect this information from all plans. Medicare collects it only for Special Needs Plans. These plans are a type of Medicare Advantage plan designed for certain people with Medicare. Some Special Needs Plans are for people with certain chronic diseases and conditions, some are for people who have both Medicare and Medicaid, and some are for people who live in an institution such as a nursing home.)
HEDIS Label: Care for Older Adults (COA) – Pain Screening
Measure Reference: NCQA HEDIS Measurement Year 2020 and Measurement Year 2021 Technical Specifications Volume 2, page 121
Metric: The percentage of Medicare Advantage Special Needs Plan enrollees 66 years and older (denominator) who received at least one pain assessment (Pain Assessment Value Set) plan during the measurement year (numerator).
Primary Data Source: HEDIS
Data Source Category: Health and Drug Plans
Exclusions: SNP benefit packages whose enrollment was less than 30 as of February 2019 SNP Comprehensive Report were excluded from this measure.
General Notes: The formula used to calculate this measure can be found in Attachment E.
Data Time Frame: 01/01/2020 – 12/31/2020
General Trend: Higher is better
Statistical Method: Clustering
Improvement Measure: Included
CAI Usage: Not Included
Case-Mix Adjusted: No
Weighting Category: Process Measure
Weighting Value: 1
Major Disaster: Higher measure star (2021-2022) for contracts with 25% or more enrolled affected by 2020 disasters.
Meaningful Measure Area: Preventive Care
NQF #: Not Applicable
Data Display: Percentage with no decimal place
Reporting Requirements: 1876 Cost CCP w/o SNP CCP with SNP CCP with Only I-SNP MSA PDP PFFS
No No Yes Yes No No No
Cut Points: 1 Star 2 Stars 3 Stars 4 Stars 5 Stars
< 55 % >= 55 % to < 76 % >= 76 % to < 87 % >= 87 % to < 96 % >= 96 %
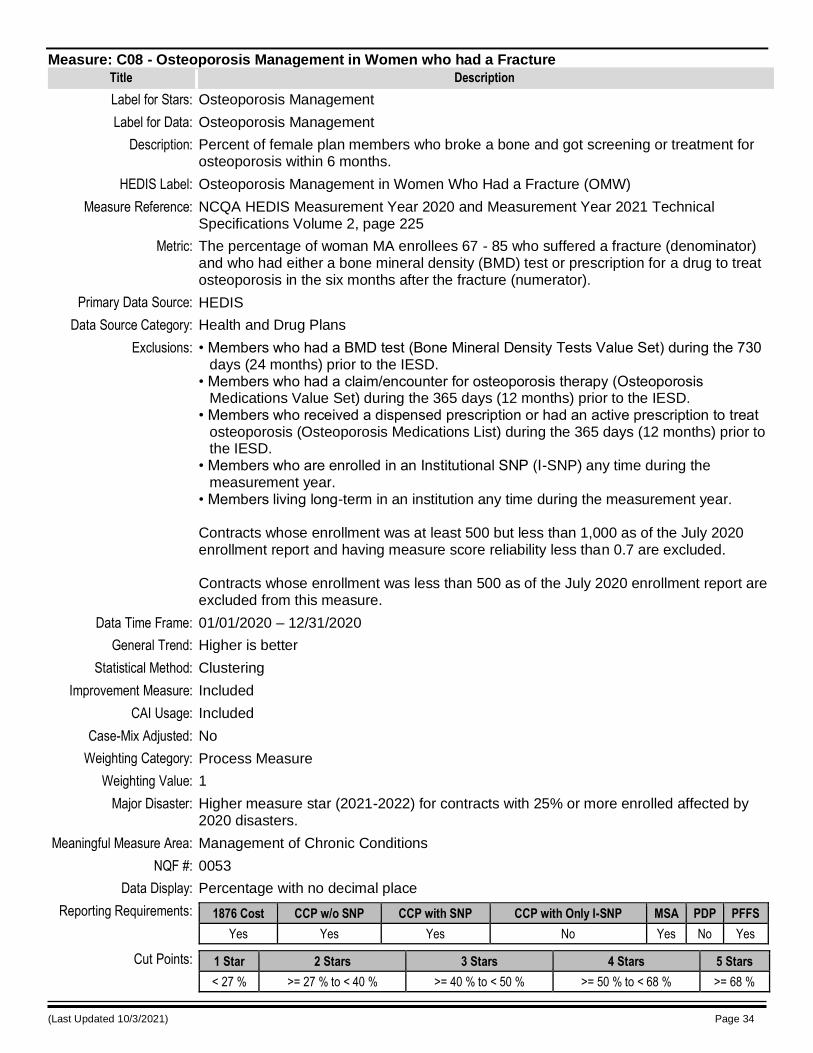
(Last Updated 10/3/2021) Page 34
Measure: C08 - Osteoporosis Management in Women who had a Fracture
Title Description
Label for Stars: Osteoporosis Management
Label for Data: Osteoporosis Management
Description: Percent of female plan members who broke a bone and got screening or treatment for osteoporosis within 6 months.
HEDIS Label: Osteoporosis Management in Women Who Had a Fracture (OMW)
Measure Reference: NCQA HEDIS Measurement Year 2020 and Measurement Year 2021 Technical Specifications Volume 2, page 225
Metric: The percentage of woman MA enrollees 67 - 85 who suffered a fracture (denominator) and who had either a bone mineral density (BMD) test or prescription for a drug to treat osteoporosis in the six months after the fracture (numerator).
Primary Data Source: HEDIS
Data Source Category: Health and Drug Plans
Exclusions: • Members who had a BMD test (Bone Mineral Density Tests Value Set) during the 730 days (24 months) prior to the IESD.
• Members who had a claim/encounter for osteoporosis therapy (Osteoporosis Medications Value Set) during the 365 days (12 months) prior to the IESD.
• Members who received a dispensed prescription or had an active prescription to treat osteoporosis (Osteoporosis Medications List) during the 365 days (12 months) prior to the IESD.
• Members who are enrolled in an Institutional SNP (I-SNP) any time during the measurement year.
• Members living long-term in an institution any time during the measurement year. Contracts whose enrollment was at least 500 but less than 1,000 as of the July 2020 enrollment report and having measure score reliability less than 0.7 are excluded. Contracts whose enrollment was less than 500 as of the July 2020 enrollment report are excluded from this measure.
Data Time Frame: 01/01/2020 – 12/31/2020
General Trend: Higher is better
Statistical Method: Clustering
Improvement Measure: Included
CAI Usage: Included
Case-Mix Adjusted: No
Weighting Category: Process Measure
Weighting Value: 1
Major Disaster: Higher measure star (2021-2022) for contracts with 25% or more enrolled affected by 2020 disasters.
Meaningful Measure Area: Management of Chronic Conditions
NQF #: 0053
Data Display: Percentage with no decimal place
Reporting Requirements: 1876 Cost CCP w/o SNP CCP with SNP CCP with Only I-SNP MSA PDP PFFS
Yes Yes Yes No Yes No Yes
Cut Points: 1 Star 2 Stars 3 Stars 4 Stars 5 Stars
< 27 % >= 27 % to < 40 % >= 40 % to < 50 % >= 50 % to < 68 % >= 68 %
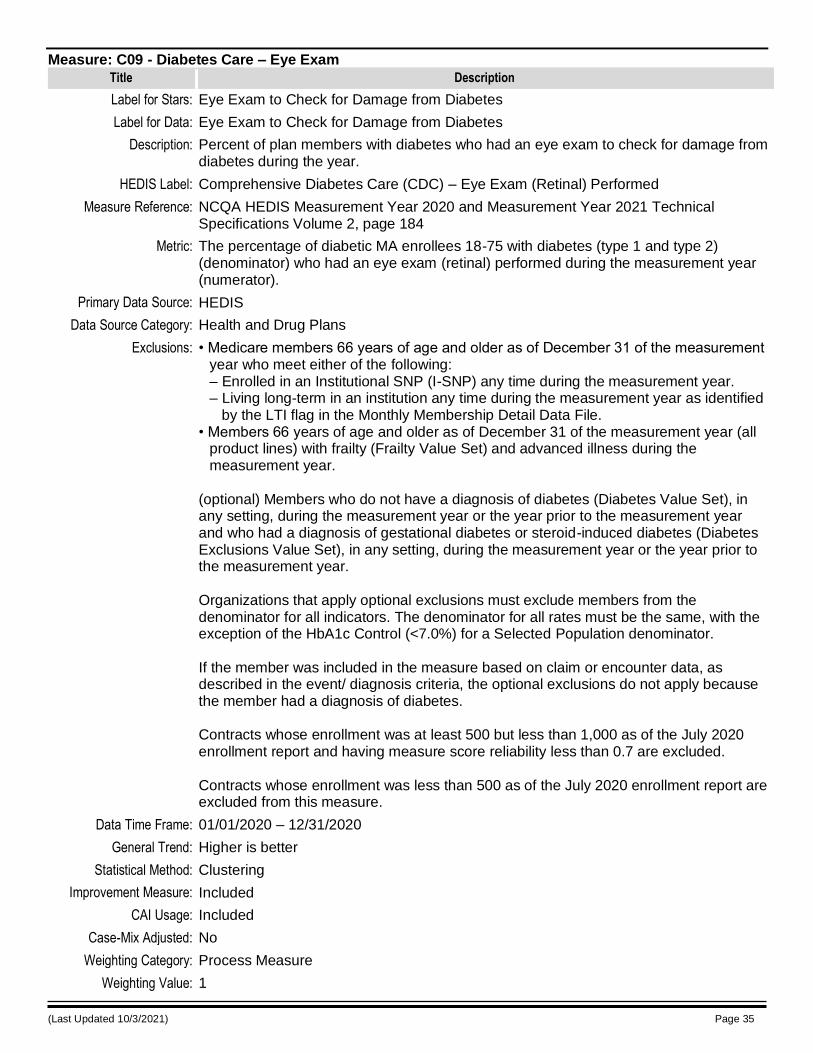
(Last Updated 10/3/2021) Page 35
Measure: C09 - Diabetes Care – Eye Exam
Title Description
Label for Stars: Eye Exam to Check for Damage from Diabetes
Label for Data: Eye Exam to Check for Damage from Diabetes
Description: Percent of plan members with diabetes who had an eye exam to check for damage from diabetes during the year.
HEDIS Label: Comprehensive Diabetes Care (CDC) – Eye Exam (Retinal) Performed
Measure Reference: NCQA HEDIS Measurement Year 2020 and Measurement Year 2021 Technical Specifications Volume 2, page 184
Metric: The percentage of diabetic MA enrollees 18-75 with diabetes (type 1 and type 2) (denominator) who had an eye exam (retinal) performed during the measurement year (numerator).
Primary Data Source: HEDIS
Data Source Category: Health and Drug Plans
Exclusions: • Medicare members 66 years of age and older as of December 31 of the measurement year who meet either of the following: – Enrolled in an Institutional SNP (I-SNP) any time during the measurement year. – Living long-term in an institution any time during the measurement year as identified
by the LTI flag in the Monthly Membership Detail Data File. • Members 66 years of age and older as of December 31 of the measurement year (all
product lines) with frailty (Frailty Value Set) and advanced illness during the measurement year.
(optional) Members who do not have a diagnosis of diabetes (Diabetes Value Set), in any setting, during the measurement year or the year prior to the measurement year and who had a diagnosis of gestational diabetes or steroid-induced diabetes (Diabetes Exclusions Value Set), in any setting, during the measurement year or the year prior to the measurement year. Organizations that apply optional exclusions must exclude members from the denominator for all indicators. The denominator for all rates must be the same, with the exception of the HbA1c Control (<7.0%) for a Selected Population denominator. If the member was included in the measure based on claim or encounter data, as described in the event/ diagnosis criteria, the optional exclusions do not apply because the member had a diagnosis of diabetes. Contracts whose enrollment was at least 500 but less than 1,000 as of the July 2020 enrollment report and having measure score reliability less than 0.7 are excluded. Contracts whose enrollment was less than 500 as of the July 2020 enrollment report are excluded from this measure.
Data Time Frame: 01/01/2020 – 12/31/2020
General Trend: Higher is better
Statistical Method: Clustering
Improvement Measure: Included
CAI Usage: Included
Case-Mix Adjusted: No
Weighting Category: Process Measure
Weighting Value: 1
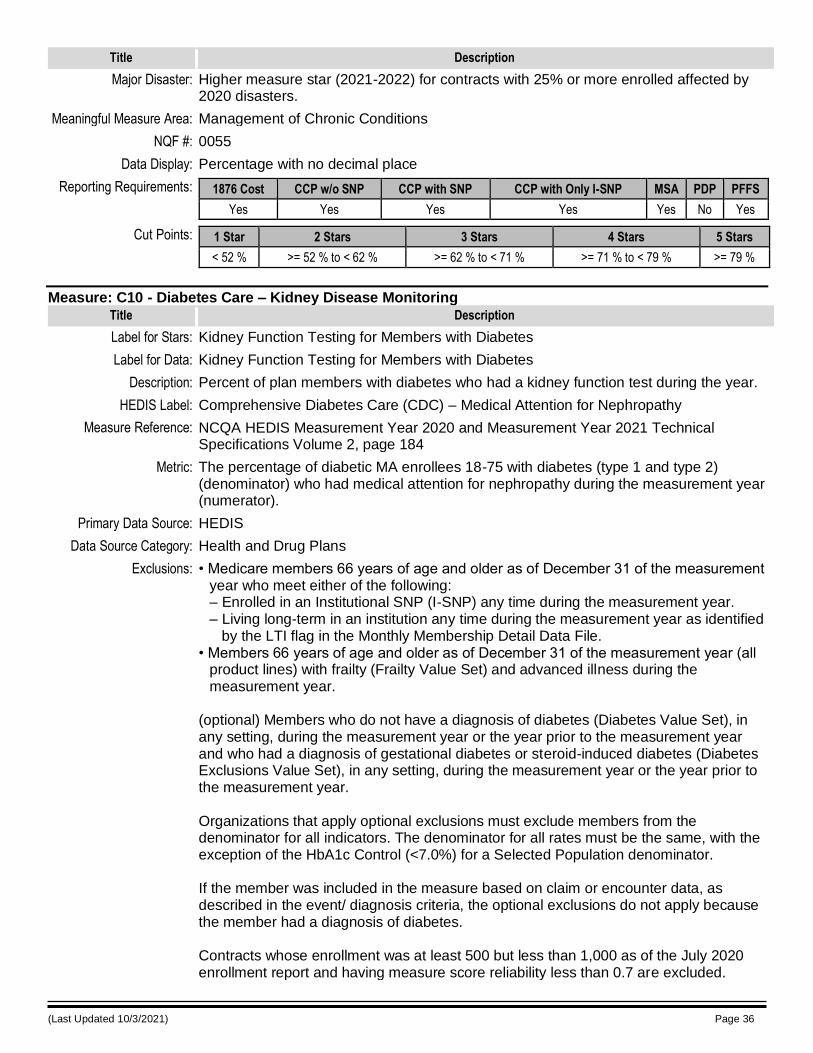
(Last Updated 10/3/2021) Page 36
Title Description
Major Disaster: Higher measure star (2021-2022) for contracts with 25% or more enrolled affected by 2020 disasters.
Meaningful Measure Area: Management of Chronic Conditions
NQF #: 0055
Data Display: Percentage with no decimal place
Reporting Requirements: 1876 Cost CCP w/o SNP CCP with SNP CCP with Only I-SNP MSA PDP PFFS
Yes Yes Yes Yes Yes No Yes
Cut Points: 1 Star 2 Stars 3 Stars 4 Stars 5 Stars
< 52 % >= 52 % to < 62 % >= 62 % to < 71 % >= 71 % to < 79 % >= 79 %
Measure: C10 - Diabetes Care – Kidney Disease Monitoring
Title Description
Label for Stars: Kidney Function Testing for Members with Diabetes
Label for Data: Kidney Function Testing for Members with Diabetes
Description: Percent of plan members with diabetes who had a kidney function test during the year.
HEDIS Label: Comprehensive Diabetes Care (CDC) – Medical Attention for Nephropathy
Measure Reference: NCQA HEDIS Measurement Year 2020 and Measurement Year 2021 Technical Specifications Volume 2, page 184
Metric: The percentage of diabetic MA enrollees 18-75 with diabetes (type 1 and type 2) (denominator) who had medical attention for nephropathy during the measurement year (numerator).
Primary Data Source: HEDIS
Data Source Category: Health and Drug Plans
Exclusions: • Medicare members 66 years of age and older as of December 31 of the measurement year who meet either of the following: – Enrolled in an Institutional SNP (I-SNP) any time during the measurement year. – Living long-term in an institution any time during the measurement year as identified
by the LTI flag in the Monthly Membership Detail Data File. • Members 66 years of age and older as of December 31 of the measurement year (all
product lines) with frailty (Frailty Value Set) and advanced illness during the measurement year.
(optional) Members who do not have a diagnosis of diabetes (Diabetes Value Set), in any setting, during the measurement year or the year prior to the measurement year and who had a diagnosis of gestational diabetes or steroid-induced diabetes (Diabetes Exclusions Value Set), in any setting, during the measurement year or the year prior to the measurement year. Organizations that apply optional exclusions must exclude members from the denominator for all indicators. The denominator for all rates must be the same, with the exception of the HbA1c Control (<7.0%) for a Selected Population denominator. If the member was included in the measure based on claim or encounter data, as described in the event/ diagnosis criteria, the optional exclusions do not apply because the member had a diagnosis of diabetes. Contracts whose enrollment was at least 500 but less than 1,000 as of the July 2020 enrollment report and having measure score reliability less than 0.7 are excluded.
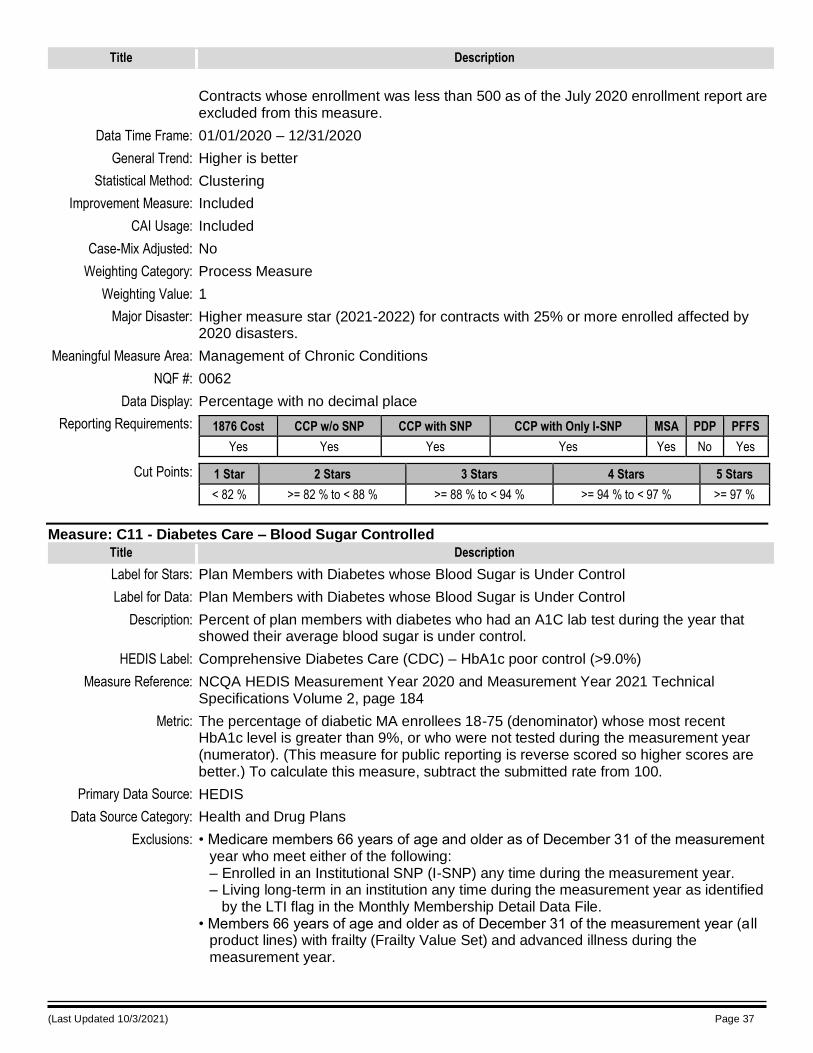
(Last Updated 10/3/2021) Page 37
Title Description
Contracts whose enrollment was less than 500 as of the July 2020 enrollment report are excluded from this measure.
Data Time Frame: 01/01/2020 – 12/31/2020
General Trend: Higher is better
Statistical Method: Clustering
Improvement Measure: Included
CAI Usage: Included
Case-Mix Adjusted: No
Weighting Category: Process Measure
Weighting Value: 1
Major Disaster: Higher measure star (2021-2022) for contracts with 25% or more enrolled affected by 2020 disasters.
Meaningful Measure Area: Management of Chronic Conditions
NQF #: 0062
Data Display: Percentage with no decimal place
Reporting Requirements: 1876 Cost CCP w/o SNP CCP with SNP CCP with Only I-SNP MSA PDP PFFS
Yes Yes Yes Yes Yes No Yes
Cut Points: 1 Star 2 Stars 3 Stars 4 Stars 5 Stars
< 82 % >= 82 % to < 88 % >= 88 % to < 94 % >= 94 % to < 97 % >= 97 %
Measure: C11 - Diabetes Care – Blood Sugar Controlled
Title Description
Label for Stars: Plan Members with Diabetes whose Blood Sugar is Under Control
Label for Data: Plan Members with Diabetes whose Blood Sugar is Under Control
Description: Percent of plan members with diabetes who had an A1C lab test during the year that showed their average blood sugar is under control.
HEDIS Label: Comprehensive Diabetes Care (CDC) – HbA1c poor control (>9.0%)
Measure Reference: NCQA HEDIS Measurement Year 2020 and Measurement Year 2021 Technical Specifications Volume 2, page 184
Metric: The percentage of diabetic MA enrollees 18-75 (denominator) whose most recent HbA1c level is greater than 9%, or who were not tested during the measurement year (numerator). (This measure for public reporting is reverse scored so higher scores are better.) To calculate this measure, subtract the submitted rate from 100.
Primary Data Source: HEDIS
Data Source Category: Health and Drug Plans
Exclusions: • Medicare members 66 years of age and older as of December 31 of the measurement year who meet either of the following: – Enrolled in an Institutional SNP (I-SNP) any time during the measurement year. – Living long-term in an institution any time during the measurement year as identified
by the LTI flag in the Monthly Membership Detail Data File. • Members 66 years of age and older as of December 31 of the measurement year (a ll
product lines) with frailty (Frailty Value Set) and advanced illness during the measurement year.
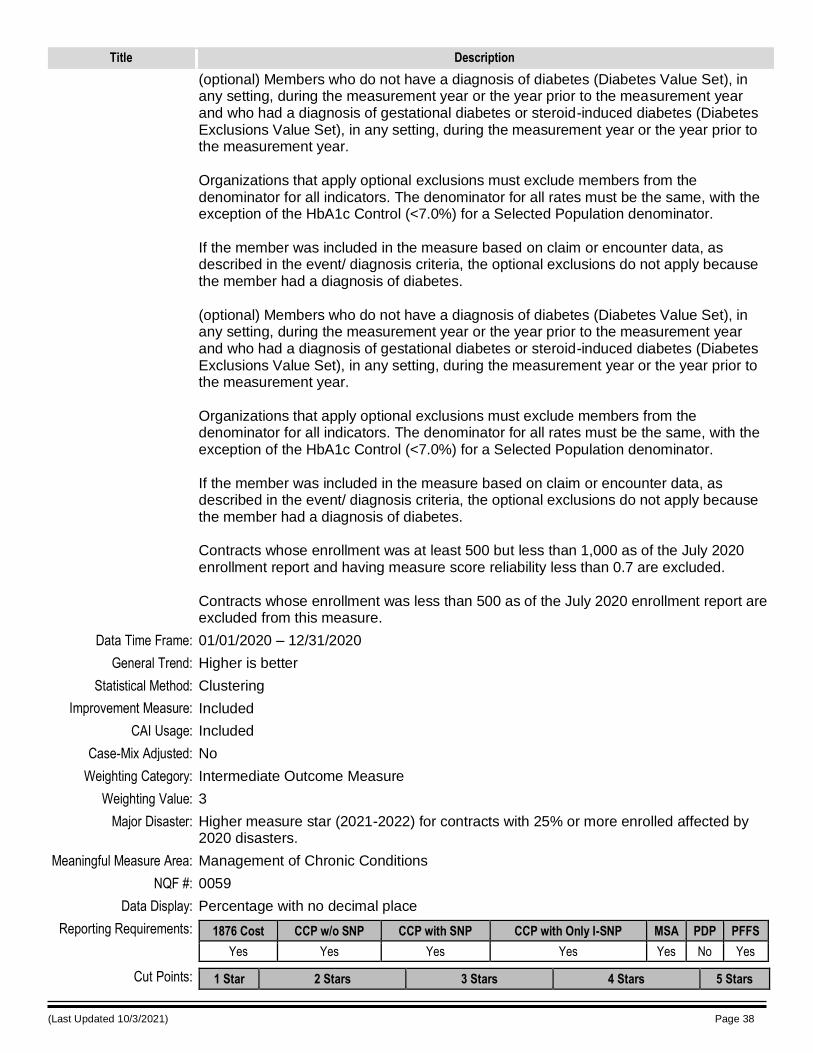
(Last Updated 10/3/2021) Page 38
Title Description
(optional) Members who do not have a diagnosis of diabetes (Diabetes Value Set), in any setting, during the measurement year or the year prior to the measurement year and who had a diagnosis of gestational diabetes or steroid-induced diabetes (Diabetes Exclusions Value Set), in any setting, during the measurement year or the year prior to the measurement year. Organizations that apply optional exclusions must exclude members from the denominator for all indicators. The denominator for all rates must be the same, with the exception of the HbA1c Control (<7.0%) for a Selected Population denominator. If the member was included in the measure based on claim or encounter data, as described in the event/ diagnosis criteria, the optional exclusions do not apply because the member had a diagnosis of diabetes. (optional) Members who do not have a diagnosis of diabetes (Diabetes Value Set), in any setting, during the measurement year or the year prior to the measurement year and who had a diagnosis of gestational diabetes or steroid-induced diabetes (Diabetes Exclusions Value Set), in any setting, during the measurement year or the year prior to the measurement year. Organizations that apply optional exclusions must exclude members from the denominator for all indicators. The denominator for all rates must be the same, with the exception of the HbA1c Control (<7.0%) for a Selected Population denominator. If the member was included in the measure based on claim or encounter data, as described in the event/ diagnosis criteria, the optional exclusions do not apply because the member had a diagnosis of diabetes. Contracts whose enrollment was at least 500 but less than 1,000 as of the July 2020 enrollment report and having measure score reliability less than 0.7 are excluded. Contracts whose enrollment was less than 500 as of the July 2020 enrollment report are excluded from this measure.
Data Time Frame: 01/01/2020 – 12/31/2020
General Trend: Higher is better
Statistical Method: Clustering
Improvement Measure: Included
CAI Usage: Included
Case-Mix Adjusted: No
Weighting Category: Intermediate Outcome Measure
Weighting Value: 3
Major Disaster: Higher measure star (2021-2022) for contracts with 25% or more enrolled affected by 2020 disasters.
Meaningful Measure Area: Management of Chronic Conditions
NQF #: 0059
Data Display: Percentage with no decimal place
Reporting Requirements: 1876 Cost CCP w/o SNP CCP with SNP CCP with Only I-SNP MSA PDP PFFS
Yes Yes Yes Yes Yes No Yes
Cut Points: 1 Star 2 Stars 3 Stars 4 Stars 5 Stars
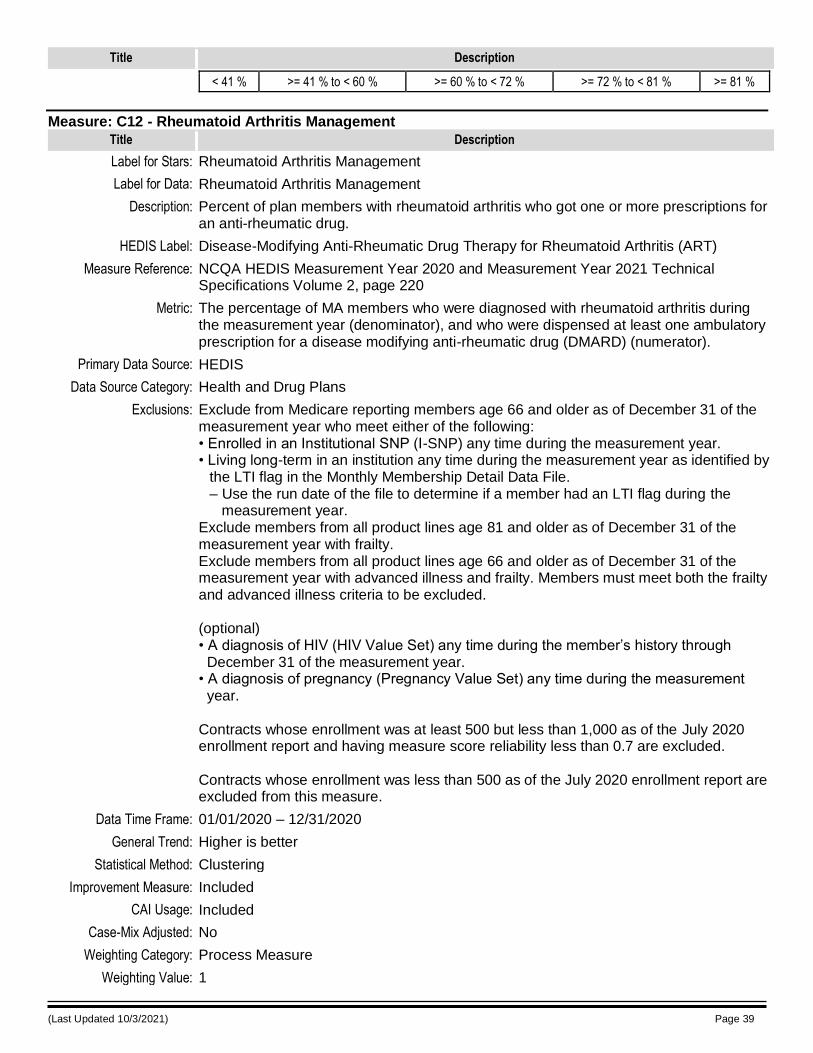
(Last Updated 10/3/2021) Page 39
Title Description
< 41 % >= 41 % to < 60 % >= 60 % to < 72 % >= 72 % to < 81 % >= 81 %
Measure: C12 - Rheumatoid Arthritis Management
Title Description
Label for Stars: Rheumatoid Arthritis Management
Label for Data: Rheumatoid Arthritis Management
Description: Percent of plan members with rheumatoid arthritis who got one or more prescriptions for an anti-rheumatic drug.
HEDIS Label: Disease-Modifying Anti-Rheumatic Drug Therapy for Rheumatoid Arthritis (ART)
Measure Reference: NCQA HEDIS Measurement Year 2020 and Measurement Year 2021 Technical Specifications Volume 2, page 220
Metric: The percentage of MA members who were diagnosed with rheumatoid arthritis during the measurement year (denominator), and who were dispensed at least one ambulatory prescription for a disease modifying anti-rheumatic drug (DMARD) (numerator).
Primary Data Source: HEDIS
Data Source Category: Health and Drug Plans
Exclusions: Exclude from Medicare reporting members age 66 and older as of December 31 of the measurement year who meet either of the following: • Enrolled in an Institutional SNP (I-SNP) any time during the measurement year. • Living long-term in an institution any time during the measurement year as identified by
the LTI flag in the Monthly Membership Detail Data File. – Use the run date of the file to determine if a member had an LTI flag during the
measurement year. Exclude members from all product lines age 81 and older as of December 31 of the measurement year with frailty. Exclude members from all product lines age 66 and older as of December 31 of the measurement year with advanced illness and frailty. Members must meet both the frailty and advanced illness criteria to be excluded. (optional) • A diagnosis of HIV (HIV Value Set) any time during the member’s history through December 31 of the measurement year. • A diagnosis of pregnancy (Pregnancy Value Set) any time during the measurement year. Contracts whose enrollment was at least 500 but less than 1,000 as of the July 2020 enrollment report and having measure score reliability less than 0.7 are excluded. Contracts whose enrollment was less than 500 as of the July 2020 enrollment report are excluded from this measure.
Data Time Frame: 01/01/2020 – 12/31/2020
General Trend: Higher is better
Statistical Method: Clustering
Improvement Measure: Included
CAI Usage: Included
Case-Mix Adjusted: No
Weighting Category: Process Measure
Weighting Value: 1
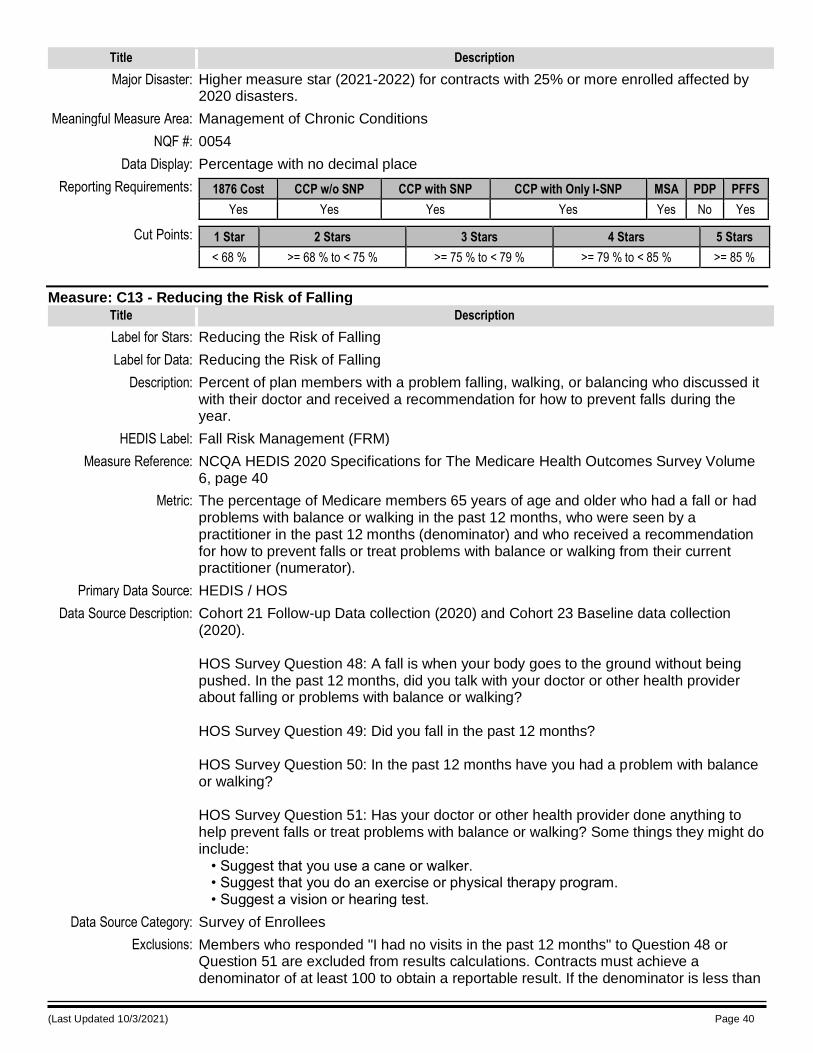
(Last Updated 10/3/2021) Page 40
Title Description
Major Disaster: Higher measure star (2021-2022) for contracts with 25% or more enrolled affected by 2020 disasters.
Meaningful Measure Area: Management of Chronic Conditions
NQF #: 0054
Data Display: Percentage with no decimal place
Reporting Requirements: 1876 Cost CCP w/o SNP CCP with SNP CCP with Only I-SNP MSA PDP PFFS
Yes Yes Yes Yes Yes No Yes
Cut Points: 1 Star 2 Stars 3 Stars 4 Stars 5 Stars
< 68 % >= 68 % to < 75 % >= 75 % to < 79 % >= 79 % to < 85 % >= 85 %
Measure: C13 - Reducing the Risk of Falling
Title Description
Label for Stars: Reducing the Risk of Falling
Label for Data: Reducing the Risk of Falling
Description: Percent of plan members with a problem falling, walking, or balancing who discussed it with their doctor and received a recommendation for how to prevent falls during the year.
HEDIS Label: Fall Risk Management (FRM)
Measure Reference: NCQA HEDIS 2020 Specifications for The Medicare Health Outcomes Survey Volume 6, page 40
Metric: The percentage of Medicare members 65 years of age and older who had a fall or had problems with balance or walking in the past 12 months, who were seen by a practitioner in the past 12 months (denominator) and who received a recommendation for how to prevent falls or treat problems with balance or walking from their current practitioner (numerator).
Primary Data Source: HEDIS / HOS
Data Source Description: Cohort 21 Follow-up Data collection (2020) and Cohort 23 Baseline data collection (2020). HOS Survey Question 48: A fall is when your body goes to the ground without being pushed. In the past 12 months, did you talk with your doctor or other health provider about falling or problems with balance or walking? HOS Survey Question 49: Did you fall in the past 12 months? HOS Survey Question 50: In the past 12 months have you had a problem with balance or walking? HOS Survey Question 51: Has your doctor or other health provider done anything to help prevent falls or treat problems with balance or walking? Some things they might do include: • Suggest that you use a cane or walker. • Suggest that you do an exercise or physical therapy program. • Suggest a vision or hearing test.
Data Source Category: Survey of Enrollees
Exclusions: Members who responded "I had no visits in the past 12 months" to Question 48 or Question 51 are excluded from results calculations. Contracts must achieve a denominator of at least 100 to obtain a reportable result. If the denominator is less than
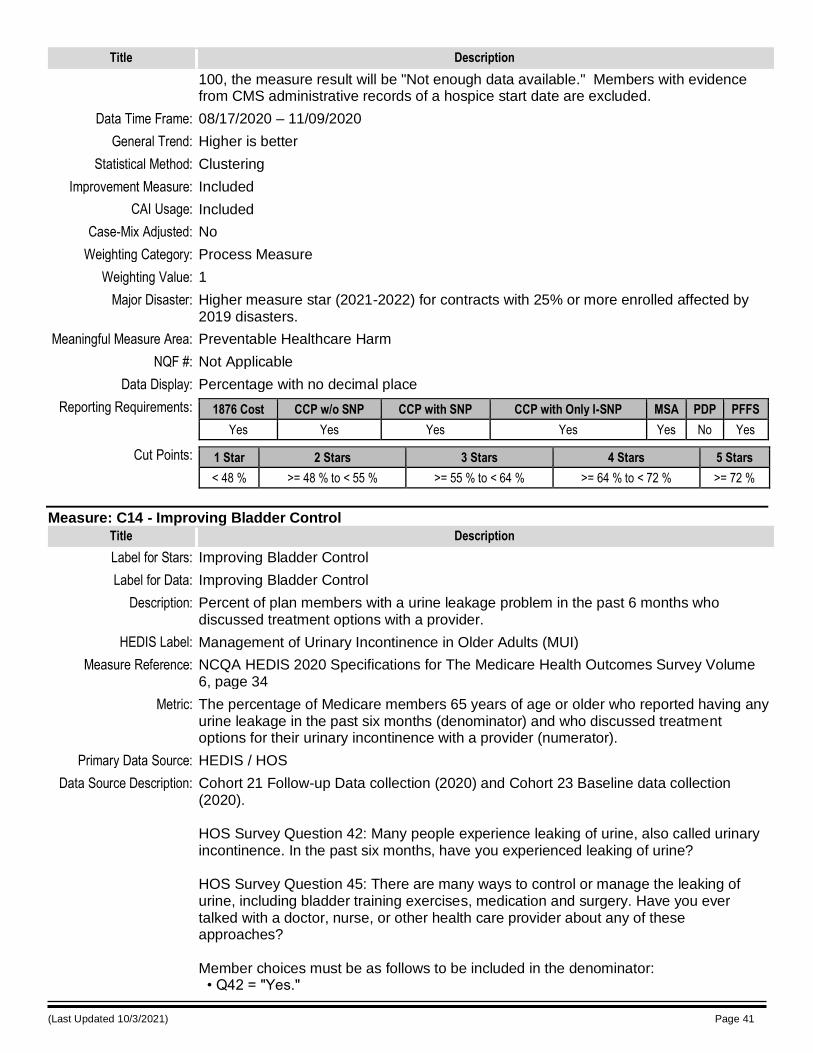
(Last Updated 10/3/2021) Page 41
Title Description
100, the measure result will be "Not enough data available." Members with evidence from CMS administrative records of a hospice start date are excluded.
Data Time Frame: 08/17/2020 – 11/09/2020
General Trend: Higher is better
Statistical Method: Clustering
Improvement Measure: Included
CAI Usage: Included
Case-Mix Adjusted: No
Weighting Category: Process Measure
Weighting Value: 1
Major Disaster: Higher measure star (2021-2022) for contracts with 25% or more enrolled affected by 2019 disasters.
Meaningful Measure Area: Preventable Healthcare Harm
NQF #: Not Applicable
Data Display: Percentage with no decimal place
Reporting Requirements: 1876 Cost CCP w/o SNP CCP with SNP CCP with Only I-SNP MSA PDP PFFS
Yes Yes Yes Yes Yes No Yes
Cut Points: 1 Star 2 Stars 3 Stars 4 Stars 5 Stars
< 48 % >= 48 % to < 55 % >= 55 % to < 64 % >= 64 % to < 72 % >= 72 %
Measure: C14 - Improving Bladder Control
Title Description
Label for Stars: Improving Bladder Control
Label for Data: Improving Bladder Control
Description: Percent of plan members with a urine leakage problem in the past 6 months who discussed treatment options with a provider.
HEDIS Label: Management of Urinary Incontinence in Older Adults (MUI)
Measure Reference: NCQA HEDIS 2020 Specifications for The Medicare Health Outcomes Survey Volume 6, page 34
Metric: The percentage of Medicare members 65 years of age or older who reported having any urine leakage in the past six months (denominator) and who discussed treatment options for their urinary incontinence with a provider (numerator).
Primary Data Source: HEDIS / HOS
Data Source Description: Cohort 21 Follow-up Data collection (2020) and Cohort 23 Baseline data collection (2020). HOS Survey Question 42: Many people experience leaking of urine, also called urinary incontinence. In the past six months, have you experienced leaking of urine? HOS Survey Question 45: There are many ways to control or manage the leaking of urine, including bladder training exercises, medication and surgery. Have you ever talked with a doctor, nurse, or other health care provider about any of these approaches? Member choices must be as follows to be included in the denominator: • Q42 = "Yes."
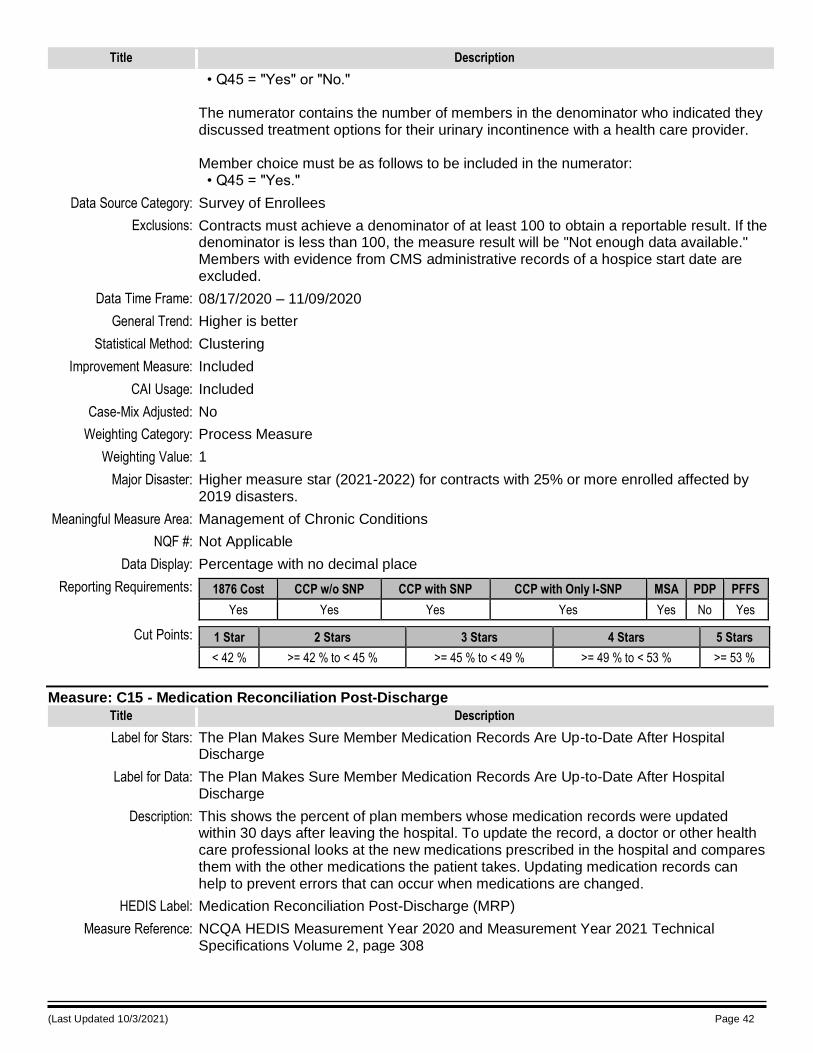
(Last Updated 10/3/2021) Page 42
Title Description
• Q45 = "Yes" or "No." The numerator contains the number of members in the denominator who indicated they discussed treatment options for their urinary incontinence with a health care provider. Member choice must be as follows to be included in the numerator: • Q45 = "Yes."
Data Source Category: Survey of Enrollees
Exclusions: Contracts must achieve a denominator of at least 100 to obtain a reportable result. If the denominator is less than 100, the measure result will be "Not enough data available." Members with evidence from CMS administrative records of a hospice start date are excluded.
Data Time Frame: 08/17/2020 – 11/09/2020
General Trend: Higher is better
Statistical Method: Clustering
Improvement Measure: Included
CAI Usage: Included
Case-Mix Adjusted: No
Weighting Category: Process Measure
Weighting Value: 1
Major Disaster: Higher measure star (2021-2022) for contracts with 25% or more enrolled affected by 2019 disasters.
Meaningful Measure Area: Management of Chronic Conditions
NQF #: Not Applicable
Data Display: Percentage with no decimal place
Reporting Requirements: 1876 Cost CCP w/o SNP CCP with SNP CCP with Only I-SNP MSA PDP PFFS
Yes Yes Yes Yes Yes No Yes
Cut Points: 1 Star 2 Stars 3 Stars 4 Stars 5 Stars
< 42 % >= 42 % to < 45 % >= 45 % to < 49 % >= 49 % to < 53 % >= 53 %
Measure: C15 - Medication Reconciliation Post-Discharge
Title Description
Label for Stars: The Plan Makes Sure Member Medication Records Are Up-to-Date After Hospital Discharge
Label for Data: The Plan Makes Sure Member Medication Records Are Up-to-Date After Hospital Discharge
Description: This shows the percent of plan members whose medication records were updated within 30 days after leaving the hospital. To update the record, a doctor or other health care professional looks at the new medications prescribed in the hospital and compares them with the other medications the patient takes. Updating medication records can help to prevent errors that can occur when medications are changed.
HEDIS Label: Medication Reconciliation Post-Discharge (MRP)
Measure Reference: NCQA HEDIS Measurement Year 2020 and Measurement Year 2021 Technical Specifications Volume 2, page 308
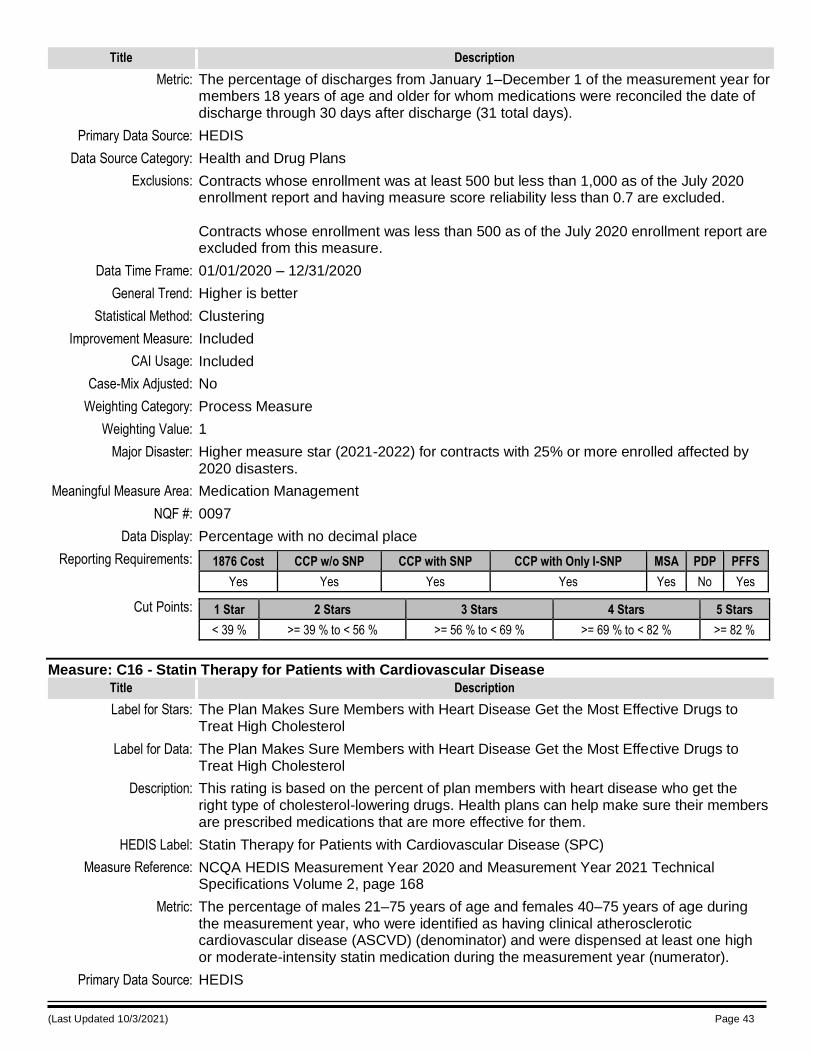
(Last Updated 10/3/2021) Page 43
Title Description
Metric: The percentage of discharges from January 1–December 1 of the measurement year for members 18 years of age and older for whom medications were reconciled the date of discharge through 30 days after discharge (31 total days).
Primary Data Source: HEDIS
Data Source Category: Health and Drug Plans
Exclusions: Contracts whose enrollment was at least 500 but less than 1,000 as of the July 2020 enrollment report and having measure score reliability less than 0.7 are excluded. Contracts whose enrollment was less than 500 as of the July 2020 enrollment report are excluded from this measure.
Data Time Frame: 01/01/2020 – 12/31/2020
General Trend: Higher is better
Statistical Method: Clustering
Improvement Measure: Included
CAI Usage: Included
Case-Mix Adjusted: No
Weighting Category: Process Measure
Weighting Value: 1
Major Disaster: Higher measure star (2021-2022) for contracts with 25% or more enrolled affected by 2020 disasters.
Meaningful Measure Area: Medication Management
NQF #: 0097
Data Display: Percentage with no decimal place
Reporting Requirements: 1876 Cost CCP w/o SNP CCP with SNP CCP with Only I-SNP MSA PDP PFFS
Yes Yes Yes Yes Yes No Yes
Cut Points: 1 Star 2 Stars 3 Stars 4 Stars 5 Stars
< 39 % >= 39 % to < 56 % >= 56 % to < 69 % >= 69 % to < 82 % >= 82 %
Measure: C16 - Statin Therapy for Patients with Cardiovascular Disease
Title Description
Label for Stars: The Plan Makes Sure Members with Heart Disease Get the Most Effective Drugs to Treat High Cholesterol
Label for Data: The Plan Makes Sure Members with Heart Disease Get the Most Effective Drugs to Treat High Cholesterol
Description: This rating is based on the percent of plan members with heart disease who get the right type of cholesterol-lowering drugs. Health plans can help make sure their members are prescribed medications that are more effective for them.
HEDIS Label: Statin Therapy for Patients with Cardiovascular Disease (SPC)
Measure Reference: NCQA HEDIS Measurement Year 2020 and Measurement Year 2021 Technical Specifications Volume 2, page 168
Metric: The percentage of males 21–75 years of age and females 40–75 years of age during the measurement year, who were identified as having clinical atherosclerotic cardiovascular disease (ASCVD) (denominator) and were dispensed at least one high or moderate-intensity statin medication during the measurement year (numerator).
Primary Data Source: HEDIS
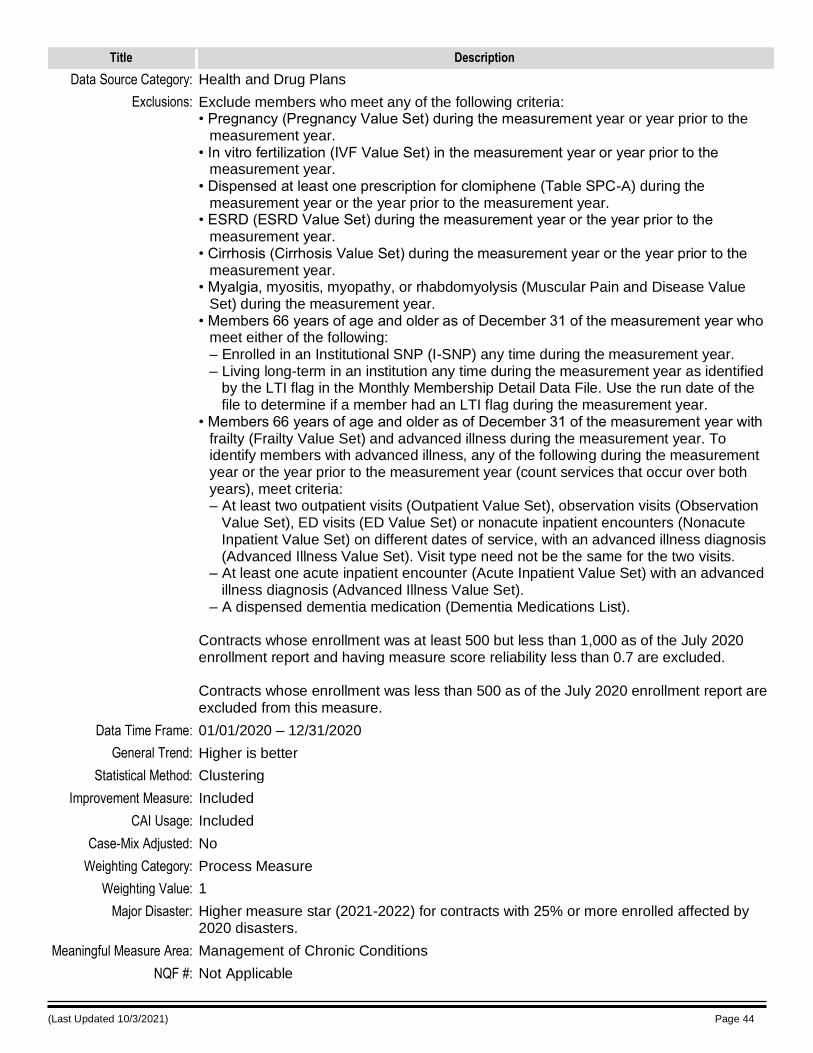
(Last Updated 10/3/2021) Page 44
Title Description
Data Source Category: Health and Drug Plans
Exclusions: Exclude members who meet any of the following criteria: • Pregnancy (Pregnancy Value Set) during the measurement year or year prior to the
measurement year. • In vitro fertilization (IVF Value Set) in the measurement year or year prior to the
measurement year. • Dispensed at least one prescription for clomiphene (Table SPC-A) during the
measurement year or the year prior to the measurement year. • ESRD (ESRD Value Set) during the measurement year or the year prior to the
measurement year. • Cirrhosis (Cirrhosis Value Set) during the measurement year or the year prior to the
measurement year. • Myalgia, myositis, myopathy, or rhabdomyolysis (Muscular Pain and Disease Value
Set) during the measurement year. • Members 66 years of age and older as of December 31 of the measurement year who
meet either of the following: – Enrolled in an Institutional SNP (I-SNP) any time during the measurement year. – Living long-term in an institution any time during the measurement year as identified
by the LTI flag in the Monthly Membership Detail Data File. Use the run date of the file to determine if a member had an LTI flag during the measurement year.
• Members 66 years of age and older as of December 31 of the measurement year with frailty (Frailty Value Set) and advanced illness during the measurement year. To identify members with advanced illness, any of the following during the measurement year or the year prior to the measurement year (count services that occur over both years), meet criteria: – At least two outpatient visits (Outpatient Value Set), observation visits (Observation
Value Set), ED visits (ED Value Set) or nonacute inpatient encounters (Nonacute Inpatient Value Set) on different dates of service, with an advanced illness diagnosis (Advanced Illness Value Set). Visit type need not be the same for the two visits.
– At least one acute inpatient encounter (Acute Inpatient Value Set) with an advanced illness diagnosis (Advanced Illness Value Set).
– A dispensed dementia medication (Dementia Medications List). Contracts whose enrollment was at least 500 but less than 1,000 as of the July 2020 enrollment report and having measure score reliability less than 0.7 are excluded. Contracts whose enrollment was less than 500 as of the July 2020 enrollment report are excluded from this measure.
Data Time Frame: 01/01/2020 – 12/31/2020
General Trend: Higher is better
Statistical Method: Clustering
Improvement Measure: Included
CAI Usage: Included
Case-Mix Adjusted: No
Weighting Category: Process Measure
Weighting Value: 1
Major Disaster: Higher measure star (2021-2022) for contracts with 25% or more enrolled affected by 2020 disasters.
Meaningful Measure Area: Management of Chronic Conditions
NQF #: Not Applicable
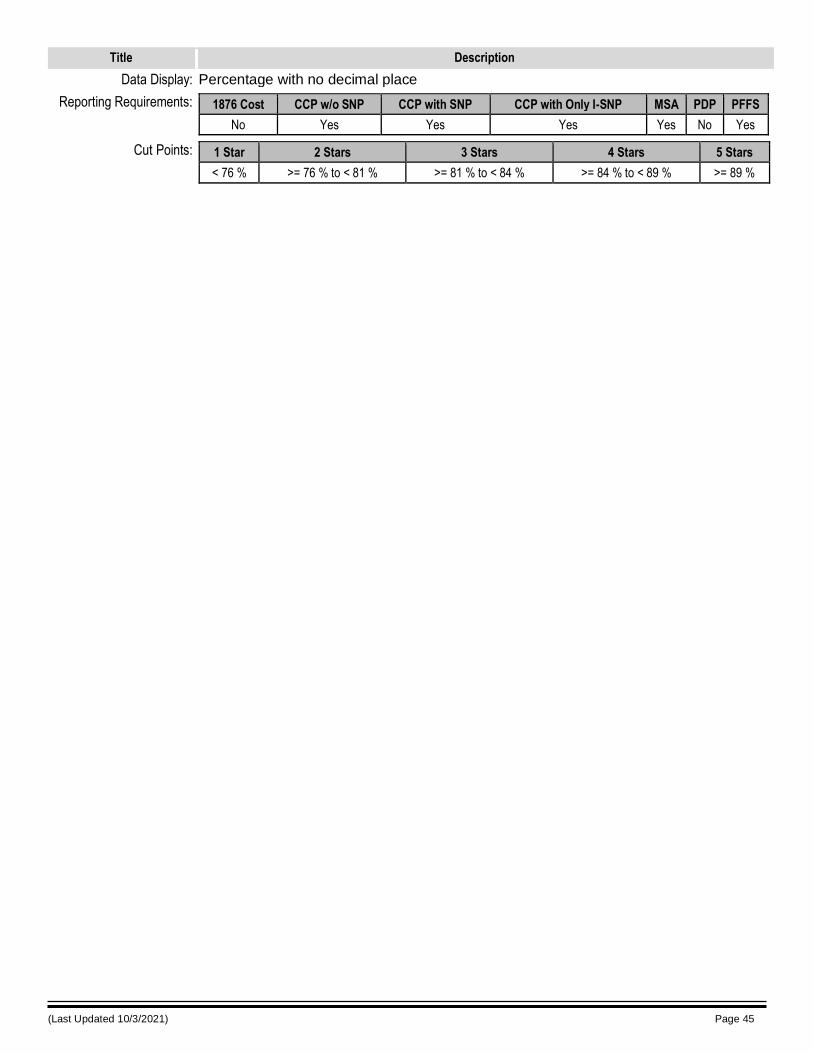
(Last Updated 10/3/2021) Page 45
Title Description
Data Display: Percentage with no decimal place
Reporting Requirements: 1876 Cost CCP w/o SNP CCP with SNP CCP with Only I-SNP MSA PDP PFFS
No Yes Yes Yes Yes No Yes
Cut Points: 1 Star 2 Stars 3 Stars 4 Stars 5 Stars
< 76 % >= 76 % to < 81 % >= 81 % to < 84 % >= 84 % to < 89 % >= 89 %
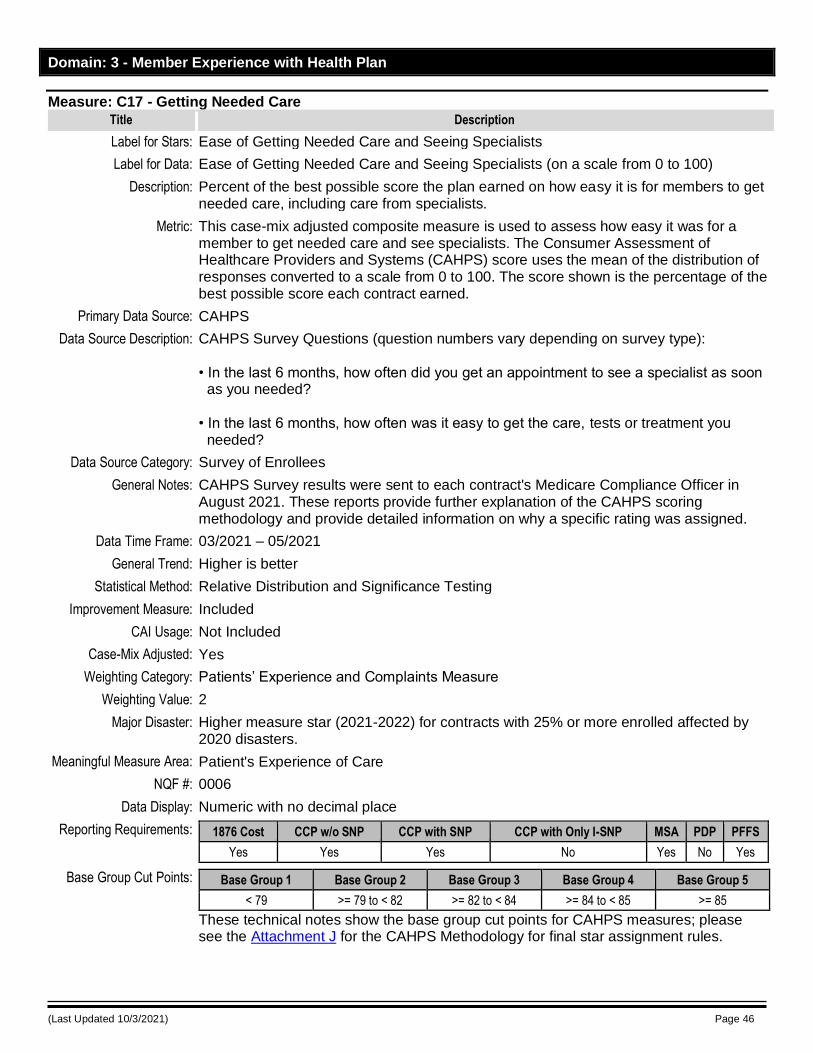
(Last Updated 10/3/2021) Page 46
Domain: 3 - Member Experience with Health Plan
Measure: C17 - Getting Needed Care
Title Description
Label for Stars: Ease of Getting Needed Care and Seeing Specialists
Label for Data: Ease of Getting Needed Care and Seeing Specialists (on a scale from 0 to 100)
Description: Percent of the best possible score the plan earned on how easy it is for members to get needed care, including care from specialists.
Metric: This case-mix adjusted composite measure is used to assess how easy it was for a member to get needed care and see specialists. The Consumer Assessment of Healthcare Providers and Systems (CAHPS) score uses the mean of the distribution of responses converted to a scale from 0 to 100. The score shown is the percentage of the best possible score each contract earned.
Primary Data Source: CAHPS
Data Source Description: CAHPS Survey Questions (question numbers vary depending on survey type): • In the last 6 months, how often did you get an appointment to see a specialist as soon as you needed? • In the last 6 months, how often was it easy to get the care, tests or treatment you needed?
Data Source Category: Survey of Enrollees
General Notes: CAHPS Survey results were sent to each contract's Medicare Compliance Officer in August 2021. These reports provide further explanation of the CAHPS scoring methodology and provide detailed information on why a specific rating was assigned.
Data Time Frame: 03/2021 – 05/2021
General Trend: Higher is better
Statistical Method: Relative Distribution and Significance Testing
Improvement Measure: Included
CAI Usage: Not Included
Case-Mix Adjusted: Yes
Weighting Category: Patients’ Experience and Complaints Measure
Weighting Value: 2
Major Disaster: Higher measure star (2021-2022) for contracts with 25% or more enrolled affected by 2020 disasters.
Meaningful Measure Area: Patient's Experience of Care
NQF #: 0006
Data Display: Numeric with no decimal place
Reporting Requirements: 1876 Cost CCP w/o SNP CCP with SNP CCP with Only I-SNP MSA PDP PFFS
Yes Yes Yes No Yes No Yes
Base Group Cut Points: Base Group 1 Base Group 2 Base Group 3 Base Group 4 Base Group 5
< 79 >= 79 to < 82 >= 82 to < 84 >= 84 to < 85 >= 85
These technical notes show the base group cut points for CAHPS measures; please see the Attachment J for the CAHPS Methodology for final star assignment rules.
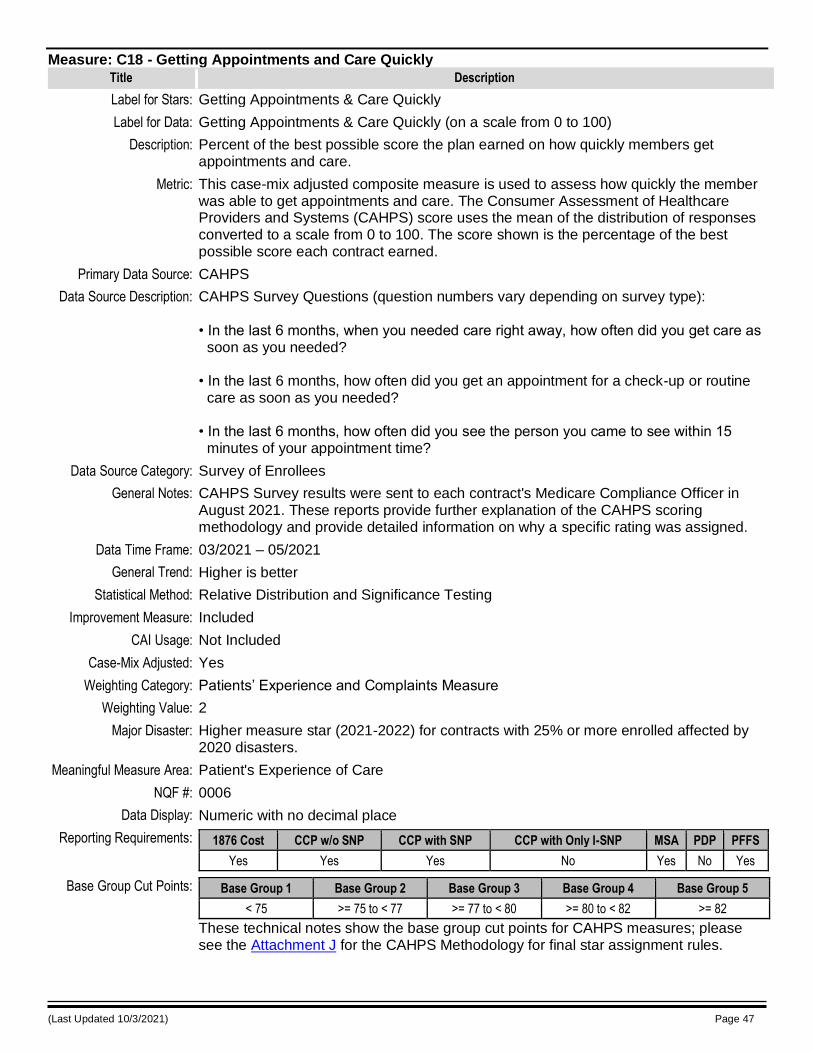
(Last Updated 10/3/2021) Page 47
Measure: C18 - Getting Appointments and Care Quickly
Title Description
Label for Stars: Getting Appointments & Care Quickly
Label for Data: Getting Appointments & Care Quickly (on a scale from 0 to 100)
Description: Percent of the best possible score the plan earned on how quickly members get appointments and care.
Metric: This case-mix adjusted composite measure is used to assess how quickly the member was able to get appointments and care. The Consumer Assessment of Healthcare Providers and Systems (CAHPS) score uses the mean of the distribution of responses converted to a scale from 0 to 100. The score shown is the percentage of the best possible score each contract earned.
Primary Data Source: CAHPS
Data Source Description: CAHPS Survey Questions (question numbers vary depending on survey type): • In the last 6 months, when you needed care right away, how often did you get care as soon as you needed? • In the last 6 months, how often did you get an appointment for a check-up or routine care as soon as you needed? • In the last 6 months, how often did you see the person you came to see within 15 minutes of your appointment time?
Data Source Category: Survey of Enrollees
General Notes: CAHPS Survey results were sent to each contract's Medicare Compliance Officer in August 2021. These reports provide further explanation of the CAHPS scoring methodology and provide detailed information on why a specific rating was assigned.
Data Time Frame: 03/2021 – 05/2021
General Trend: Higher is better
Statistical Method: Relative Distribution and Significance Testing
Improvement Measure: Included
CAI Usage: Not Included
Case-Mix Adjusted: Yes
Weighting Category: Patients’ Experience and Complaints Measure
Weighting Value: 2
Major Disaster: Higher measure star (2021-2022) for contracts with 25% or more enrolled affected by 2020 disasters.
Meaningful Measure Area: Patient's Experience of Care
NQF #: 0006
Data Display: Numeric with no decimal place
Reporting Requirements: 1876 Cost CCP w/o SNP CCP with SNP CCP with Only I-SNP MSA PDP PFFS
Yes Yes Yes No Yes No Yes
Base Group Cut Points: Base Group 1 Base Group 2 Base Group 3 Base Group 4 Base Group 5
< 75 >= 75 to < 77 >= 77 to < 80 >= 80 to < 82 >= 82
These technical notes show the base group cut points for CAHPS measures; please see the Attachment J for the CAHPS Methodology for final star assignment rules.
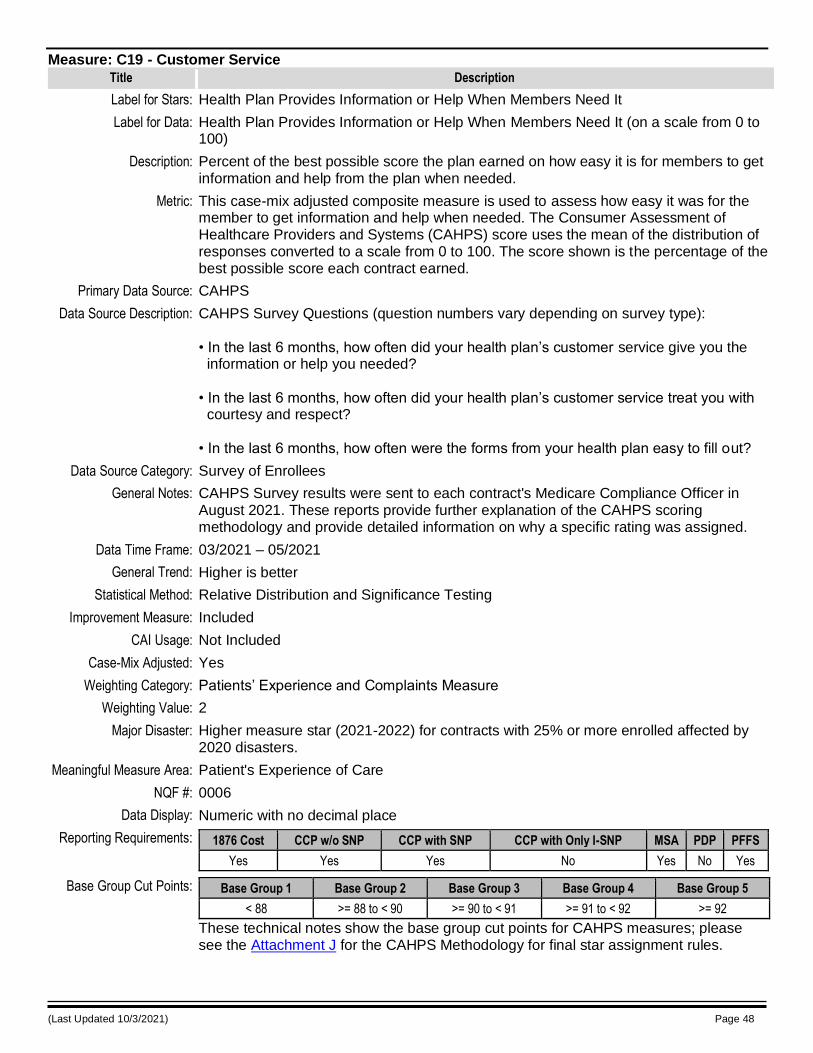
(Last Updated 10/3/2021) Page 48
Measure: C19 - Customer Service
Title Description
Label for Stars: Health Plan Provides Information or Help When Members Need It
Label for Data: Health Plan Provides Information or Help When Members Need It (on a scale from 0 to 100)
Description: Percent of the best possible score the plan earned on how easy it is for members to get information and help from the plan when needed.
Metric: This case-mix adjusted composite measure is used to assess how easy it was for the member to get information and help when needed. The Consumer Assessment of Healthcare Providers and Systems (CAHPS) score uses the mean of the distribution of responses converted to a scale from 0 to 100. The score shown is the percentage of the best possible score each contract earned.
Primary Data Source: CAHPS
Data Source Description: CAHPS Survey Questions (question numbers vary depending on survey type): • In the last 6 months, how often did your health plan’s customer service give you the information or help you needed? • In the last 6 months, how often did your health plan’s customer service treat you with courtesy and respect? • In the last 6 months, how often were the forms from your health plan easy to fill out?
Data Source Category: Survey of Enrollees
General Notes: CAHPS Survey results were sent to each contract's Medicare Compliance Officer in August 2021. These reports provide further explanation of the CAHPS scoring methodology and provide detailed information on why a specific rating was assigned.
Data Time Frame: 03/2021 – 05/2021
General Trend: Higher is better
Statistical Method: Relative Distribution and Significance Testing
Improvement Measure: Included
CAI Usage: Not Included
Case-Mix Adjusted: Yes
Weighting Category: Patients’ Experience and Complaints Measure
Weighting Value: 2
Major Disaster: Higher measure star (2021-2022) for contracts with 25% or more enrolled affected by 2020 disasters.
Meaningful Measure Area: Patient's Experience of Care
NQF #: 0006
Data Display: Numeric with no decimal place
Reporting Requirements: 1876 Cost CCP w/o SNP CCP with SNP CCP with Only I-SNP MSA PDP PFFS
Yes Yes Yes No Yes No Yes
Base Group Cut Points: Base Group 1 Base Group 2 Base Group 3 Base Group 4 Base Group 5
< 88 >= 88 to < 90 >= 90 to < 91 >= 91 to < 92 >= 92
These technical notes show the base group cut points for CAHPS measures; please see the Attachment J for the CAHPS Methodology for final star assignment rules.
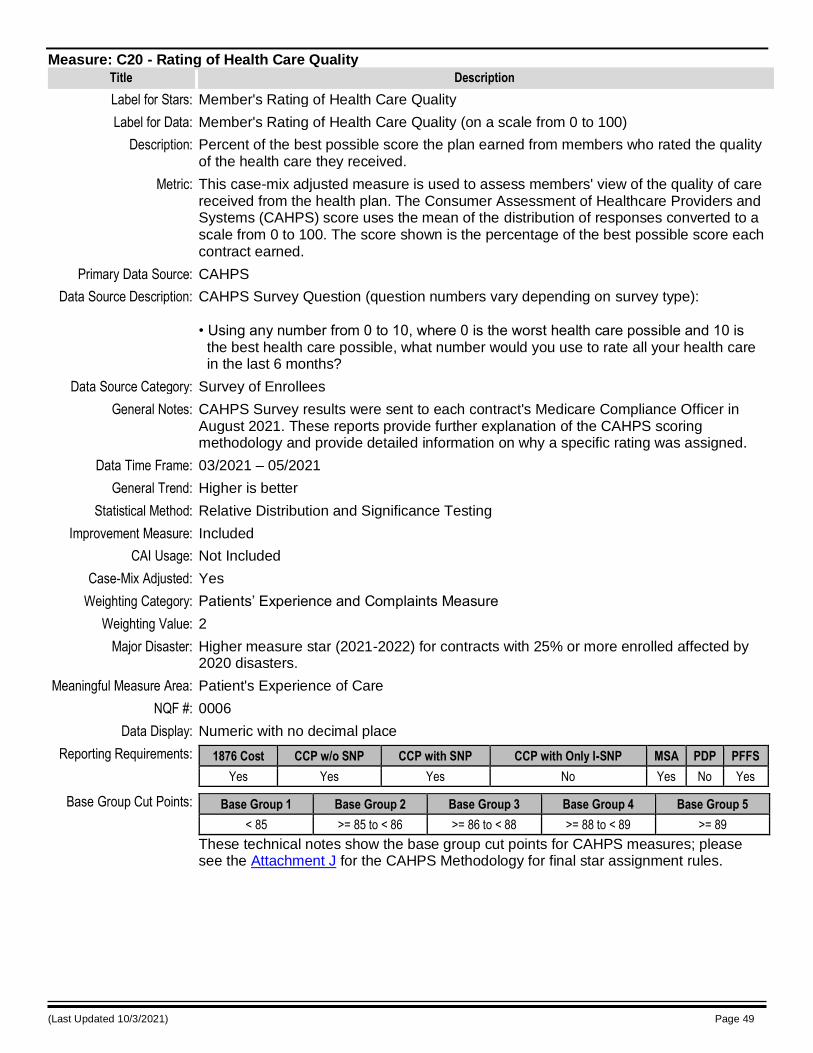
(Last Updated 10/3/2021) Page 49
Measure: C20 - Rating of Health Care Quality
Title Description
Label for Stars: Member's Rating of Health Care Quality
Label for Data: Member's Rating of Health Care Quality (on a scale from 0 to 100)
Description: Percent of the best possible score the plan earned from members who rated the quality of the health care they received.
Metric: This case-mix adjusted measure is used to assess members' view of the quality of care received from the health plan. The Consumer Assessment of Healthcare Providers and Systems (CAHPS) score uses the mean of the distribution of responses converted to a scale from 0 to 100. The score shown is the percentage of the best possible score each contract earned.
Primary Data Source: CAHPS
Data Source Description: CAHPS Survey Question (question numbers vary depending on survey type): • Using any number from 0 to 10, where 0 is the worst health care possible and 10 is the best health care possible, what number would you use to rate all your health care in the last 6 months?
Data Source Category: Survey of Enrollees
General Notes: CAHPS Survey results were sent to each contract's Medicare Compliance Officer in August 2021. These reports provide further explanation of the CAHPS scoring methodology and provide detailed information on why a specific rating was assigned.
Data Time Frame: 03/2021 – 05/2021
General Trend: Higher is better
Statistical Method: Relative Distribution and Significance Testing
Improvement Measure: Included
CAI Usage: Not Included
Case-Mix Adjusted: Yes
Weighting Category: Patients’ Experience and Complaints Measure
Weighting Value: 2
Major Disaster: Higher measure star (2021-2022) for contracts with 25% or more enrolled affected by 2020 disasters.
Meaningful Measure Area: Patient's Experience of Care
NQF #: 0006
Data Display: Numeric with no decimal place
Reporting Requirements: 1876 Cost CCP w/o SNP CCP with SNP CCP with Only I-SNP MSA PDP PFFS
Yes Yes Yes No Yes No Yes
Base Group Cut Points: Base Group 1 Base Group 2 Base Group 3 Base Group 4 Base Group 5
< 85 >= 85 to < 86 >= 86 to < 88 >= 88 to < 89 >= 89
These technical notes show the base group cut points for CAHPS measures; please see the Attachment J for the CAHPS Methodology for final star assignment rules.
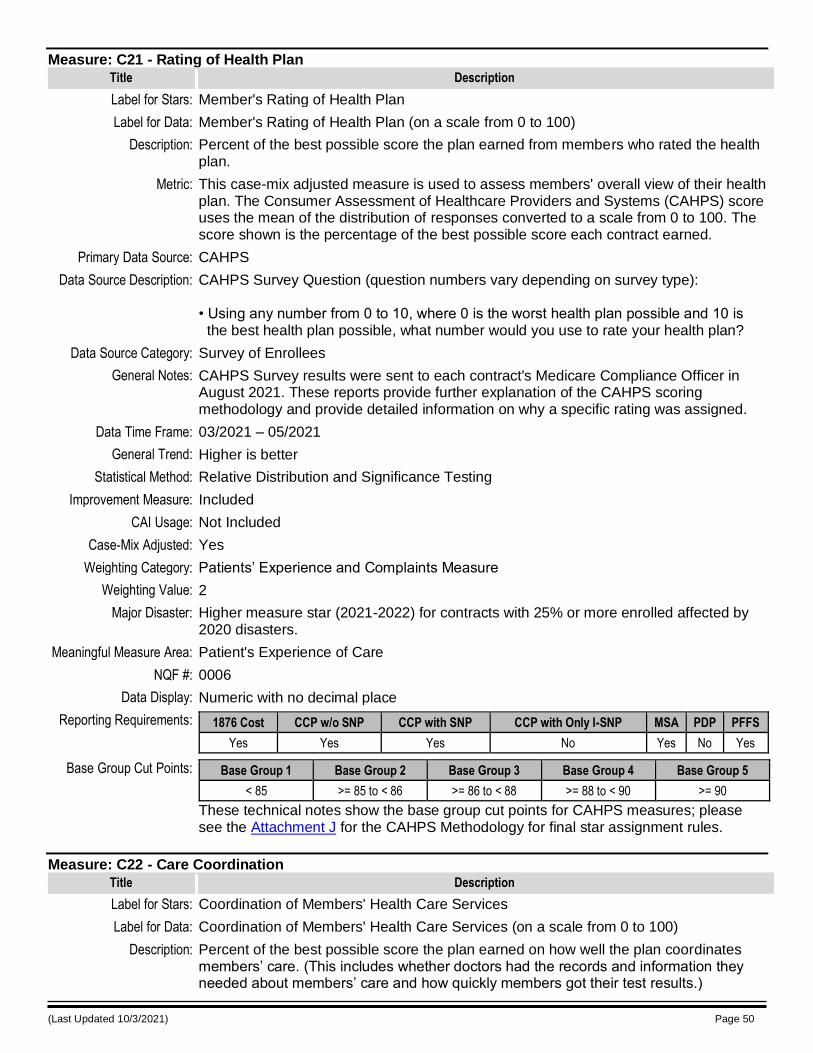
(Last Updated 10/3/2021) Page 50
Measure: C21 - Rating of Health Plan
Title Description
Label for Stars: Member's Rating of Health Plan
Label for Data: Member's Rating of Health Plan (on a scale from 0 to 100)
Description: Percent of the best possible score the plan earned from members who rated the health plan.
Metric: This case-mix adjusted measure is used to assess members' overall view of their health plan. The Consumer Assessment of Healthcare Providers and Systems (CAHPS) score uses the mean of the distribution of responses converted to a scale from 0 to 100. The score shown is the percentage of the best possible score each contract earned.
Primary Data Source: CAHPS
Data Source Description: CAHPS Survey Question (question numbers vary depending on survey type): • Using any number from 0 to 10, where 0 is the worst health plan possible and 10 is the best health plan possible, what number would you use to rate your health plan?
Data Source Category: Survey of Enrollees
General Notes: CAHPS Survey results were sent to each contract's Medicare Compliance Officer in August 2021. These reports provide further explanation of the CAHPS scoring methodology and provide detailed information on why a specific rating was assigned.
Data Time Frame: 03/2021 – 05/2021
General Trend: Higher is better
Statistical Method: Relative Distribution and Significance Testing
Improvement Measure: Included
CAI Usage: Not Included
Case-Mix Adjusted: Yes
Weighting Category: Patients’ Experience and Complaints Measure
Weighting Value: 2
Major Disaster: Higher measure star (2021-2022) for contracts with 25% or more enrolled affected by 2020 disasters.
Meaningful Measure Area: Patient's Experience of Care
NQF #: 0006
Data Display: Numeric with no decimal place
Reporting Requirements: 1876 Cost CCP w/o SNP CCP with SNP CCP with Only I-SNP MSA PDP PFFS
Yes Yes Yes No Yes No Yes
Base Group Cut Points: Base Group 1 Base Group 2 Base Group 3 Base Group 4 Base Group 5
< 85 >= 85 to < 86 >= 86 to < 88 >= 88 to < 90 >= 90
These technical notes show the base group cut points for CAHPS measures; please see the Attachment J for the CAHPS Methodology for final star assignment rules.
Measure: C22 - Care Coordination
Title Description
Label for Stars: Coordination of Members' Health Care Services
Label for Data: Coordination of Members' Health Care Services (on a scale from 0 to 100)
Description: Percent of the best possible score the plan earned on how well the plan coordinates members’ care. (This includes whether doctors had the records and information they needed about members’ care and how quickly members got their test results.)
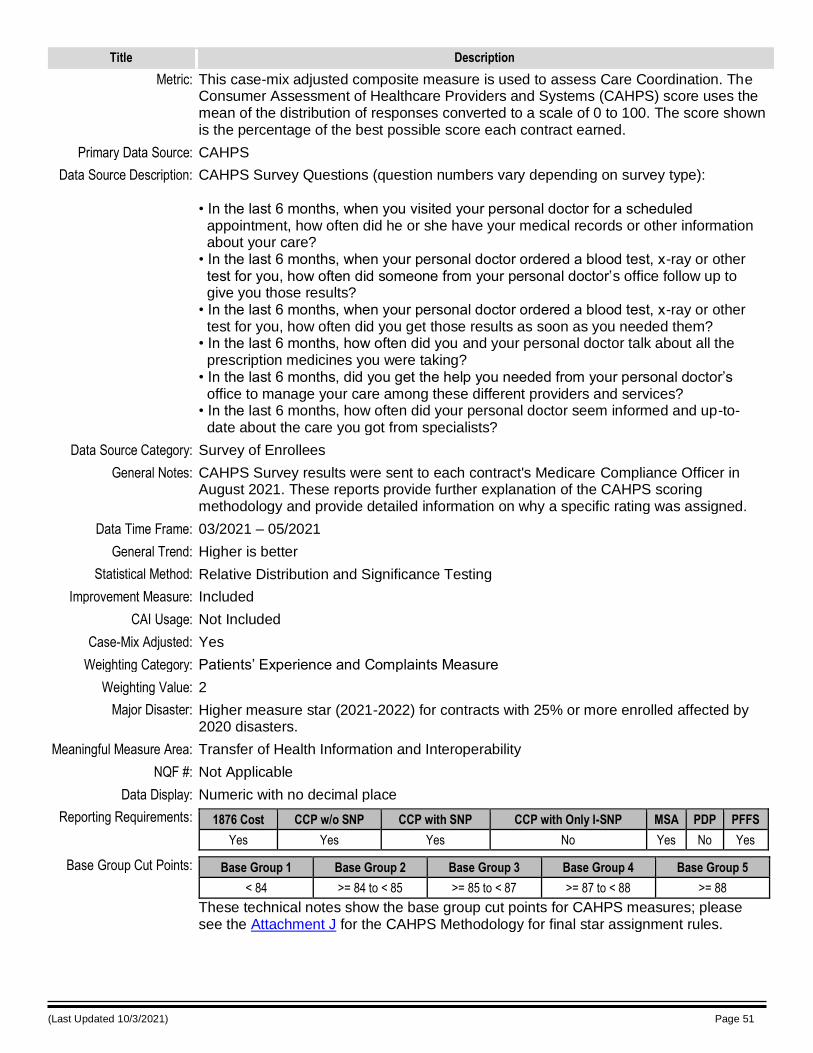
(Last Updated 10/3/2021) Page 51
Title Description
Metric: This case-mix adjusted composite measure is used to assess Care Coordination. The Consumer Assessment of Healthcare Providers and Systems (CAHPS) score uses the mean of the distribution of responses converted to a scale of 0 to 100. The score shown is the percentage of the best possible score each contract earned.
Primary Data Source: CAHPS
Data Source Description: CAHPS Survey Questions (question numbers vary depending on survey type): • In the last 6 months, when you visited your personal doctor for a scheduled appointment, how often did he or she have your medical records or other information about your care? • In the last 6 months, when your personal doctor ordered a blood test, x-ray or other test for you, how often did someone from your personal doctor’s office follow up to give you those results? • In the last 6 months, when your personal doctor ordered a blood test, x-ray or other test for you, how often did you get those results as soon as you needed them? • In the last 6 months, how often did you and your personal doctor talk about all the prescription medicines you were taking? • In the last 6 months, did you get the help you needed from your personal doctor’s office to manage your care among these different providers and services? • In the last 6 months, how often did your personal doctor seem informed and up-to- date about the care you got from specialists?
Data Source Category: Survey of Enrollees
General Notes: CAHPS Survey results were sent to each contract's Medicare Compliance Officer in August 2021. These reports provide further explanation of the CAHPS scoring methodology and provide detailed information on why a specific rating was assigned.
Data Time Frame: 03/2021 – 05/2021
General Trend: Higher is better
Statistical Method: Relative Distribution and Significance Testing
Improvement Measure: Included
CAI Usage: Not Included
Case-Mix Adjusted: Yes
Weighting Category: Patients’ Experience and Complaints Measure
Weighting Value: 2
Major Disaster: Higher measure star (2021-2022) for contracts with 25% or more enrolled affected by 2020 disasters.
Meaningful Measure Area: Transfer of Health Information and Interoperability
NQF #: Not Applicable
Data Display: Numeric with no decimal place
Reporting Requirements: 1876 Cost CCP w/o SNP CCP with SNP CCP with Only I-SNP MSA PDP PFFS
Yes Yes Yes No Yes No Yes
Base Group Cut Points: Base Group 1 Base Group 2 Base Group 3 Base Group 4 Base Group 5
< 84 >= 84 to < 85 >= 85 to < 87 >= 87 to < 88 >= 88
These technical notes show the base group cut points for CAHPS measures; please see the Attachment J for the CAHPS Methodology for final star assignment rules.
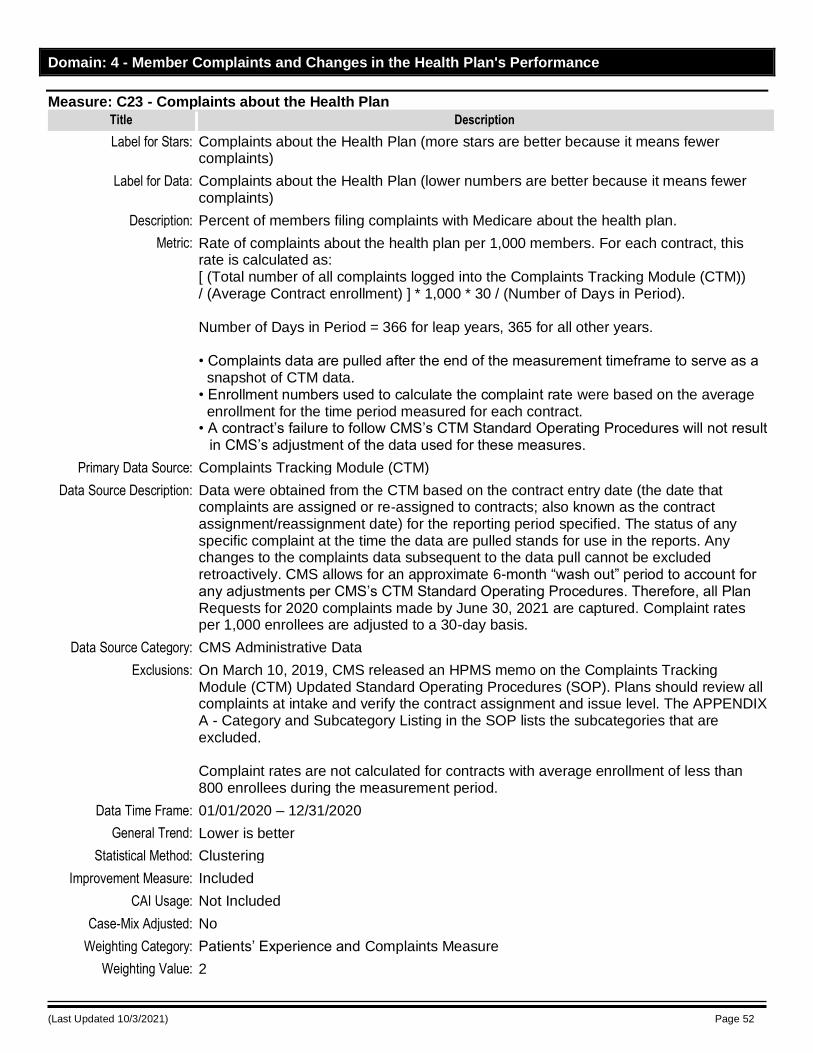
(Last Updated 10/3/2021) Page 52
Domain: 4 - Member Complaints and Changes in the Health Plan's Performance
Measure: C23 - Complaints about the Health Plan
Title Description
Label for Stars: Complaints about the Health Plan (more stars are better because it means fewer complaints)
Label for Data: Complaints about the Health Plan (lower numbers are better because it means fewer complaints)
Description: Percent of members filing complaints with Medicare about the health plan.
Metric: Rate of complaints about the health plan per 1,000 members. For each contract, this rate is calculated as: [ (Total number of all complaints logged into the Complaints Tracking Module (CTM)) / (Average Contract enrollment) ] * 1,000 * 30 / (Number of Days in Period). Number of Days in Period = 366 for leap years, 365 for all other years. • Complaints data are pulled after the end of the measurement timeframe to serve as a snapshot of CTM data. • Enrollment numbers used to calculate the complaint rate were based on the average enrollment for the time period measured for each contract. • A contract’s failure to follow CMS’s CTM Standard Operating Procedures will not result
in CMS’s adjustment of the data used for these measures.
Primary Data Source: Complaints Tracking Module (CTM)
Data Source Description: Data were obtained from the CTM based on the contract entry date (the date that complaints are assigned or re-assigned to contracts; also known as the contract assignment/reassignment date) for the reporting period specified. The status of any specific complaint at the time the data are pulled stands for use in the reports. Any changes to the complaints data subsequent to the data pull cannot be excluded retroactively. CMS allows for an approximate 6-month “wash out” period to account for any adjustments per CMS’s CTM Standard Operating Procedures. Therefore, all Plan Requests for 2020 complaints made by June 30, 2021 are captured. Complaint rates per 1,000 enrollees are adjusted to a 30-day basis.
Data Source Category: CMS Administrative Data
Exclusions: On March 10, 2019, CMS released an HPMS memo on the Complaints Tracking Module (CTM) Updated Standard Operating Procedures (SOP). Plans should review all complaints at intake and verify the contract assignment and issue level. The APPENDIX A - Category and Subcategory Listing in the SOP lists the subcategories that are excluded. Complaint rates are not calculated for contracts with average enrollment of less than 800 enrollees during the measurement period.
Data Time Frame: 01/01/2020 – 12/31/2020
General Trend: Lower is better
Statistical Method: Clustering
Improvement Measure: Included
CAI Usage: Not Included
Case-Mix Adjusted: No
Weighting Category: Patients’ Experience and Complaints Measure
Weighting Value: 2
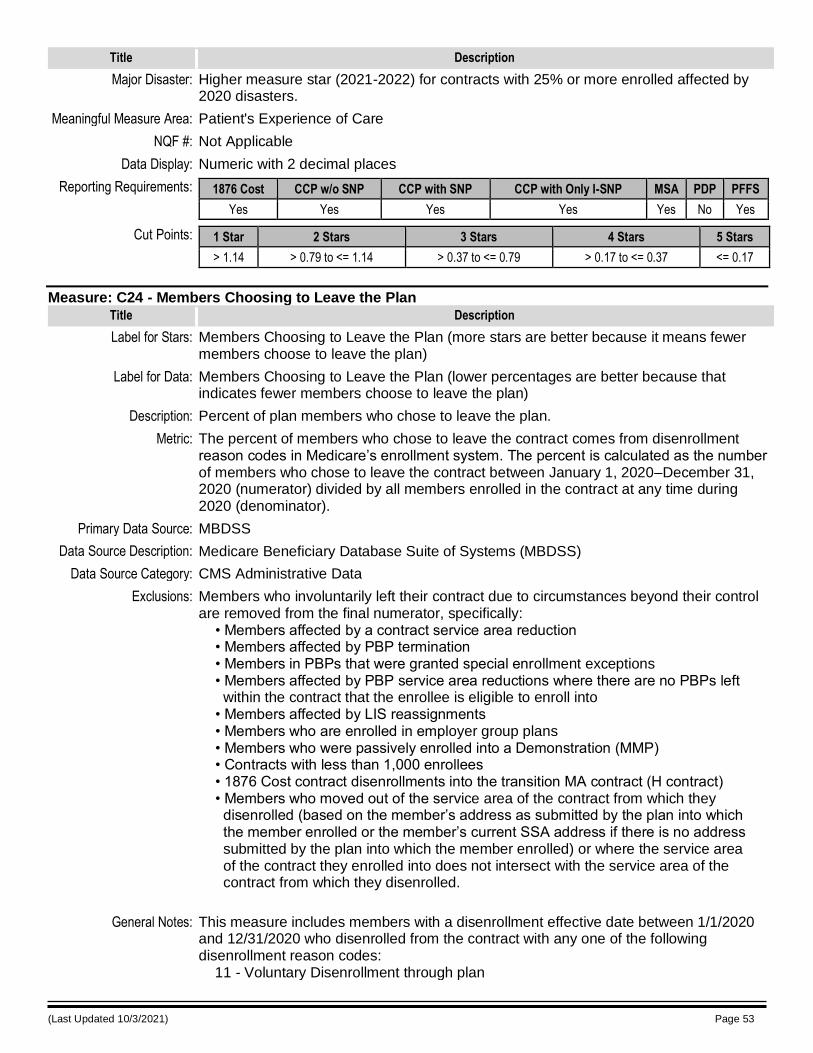
(Last Updated 10/3/2021) Page 53
Title Description
Major Disaster: Higher measure star (2021-2022) for contracts with 25% or more enrolled affected by 2020 disasters.
Meaningful Measure Area: Patient's Experience of Care
NQF #: Not Applicable
Data Display: Numeric with 2 decimal places
Reporting Requirements: 1876 Cost CCP w/o SNP CCP with SNP CCP with Only I-SNP MSA PDP PFFS
Yes Yes Yes Yes Yes No Yes
Cut Points: 1 Star 2 Stars 3 Stars 4 Stars 5 Stars
> 1.14 > 0.79 to <= 1.14 > 0.37 to <= 0.79 > 0.17 to <= 0.37 <= 0.17
Measure: C24 - Members Choosing to Leave the Plan
Title Description
Label for Stars: Members Choosing to Leave the Plan (more stars are better because it means fewer members choose to leave the plan)
Label for Data: Members Choosing to Leave the Plan (lower percentages are better because that indicates fewer members choose to leave the plan)
Description: Percent of plan members who chose to leave the plan.
Metric: The percent of members who chose to leave the contract comes from disenrollment reason codes in Medicare’s enrollment system. The percent is calculated as the number of members who chose to leave the contract between January 1, 2020–December 31, 2020 (numerator) divided by all members enrolled in the contract at any time during 2020 (denominator).
Primary Data Source: MBDSS
Data Source Description: Medicare Beneficiary Database Suite of Systems (MBDSS)
Data Source Category: CMS Administrative Data
Exclusions: Members who involuntarily left their contract due to circumstances beyond their control are removed from the final numerator, specifically: • Members affected by a contract service area reduction • Members affected by PBP termination • Members in PBPs that were granted special enrollment exceptions • Members affected by PBP service area reductions where there are no PBPs left within the contract that the enrollee is eligible to enroll into • Members affected by LIS reassignments • Members who are enrolled in employer group plans • Members who were passively enrolled into a Demonstration (MMP) • Contracts with less than 1,000 enrollees • 1876 Cost contract disenrollments into the transition MA contract (H contract) • Members who moved out of the service area of the contract from which they disenrolled (based on the member’s address as submitted by the plan into which the member enrolled or the member’s current SSA address if there is no address submitted by the plan into which the member enrolled) or where the service area of the contract they enrolled into does not intersect with the service area of the contract from which they disenrolled.
General Notes: This measure includes members with a disenrollment effective date between 1/1/2020 and 12/31/2020 who disenrolled from the contract with any one of the following disenrollment reason codes: 11 - Voluntary Disenrollment through plan
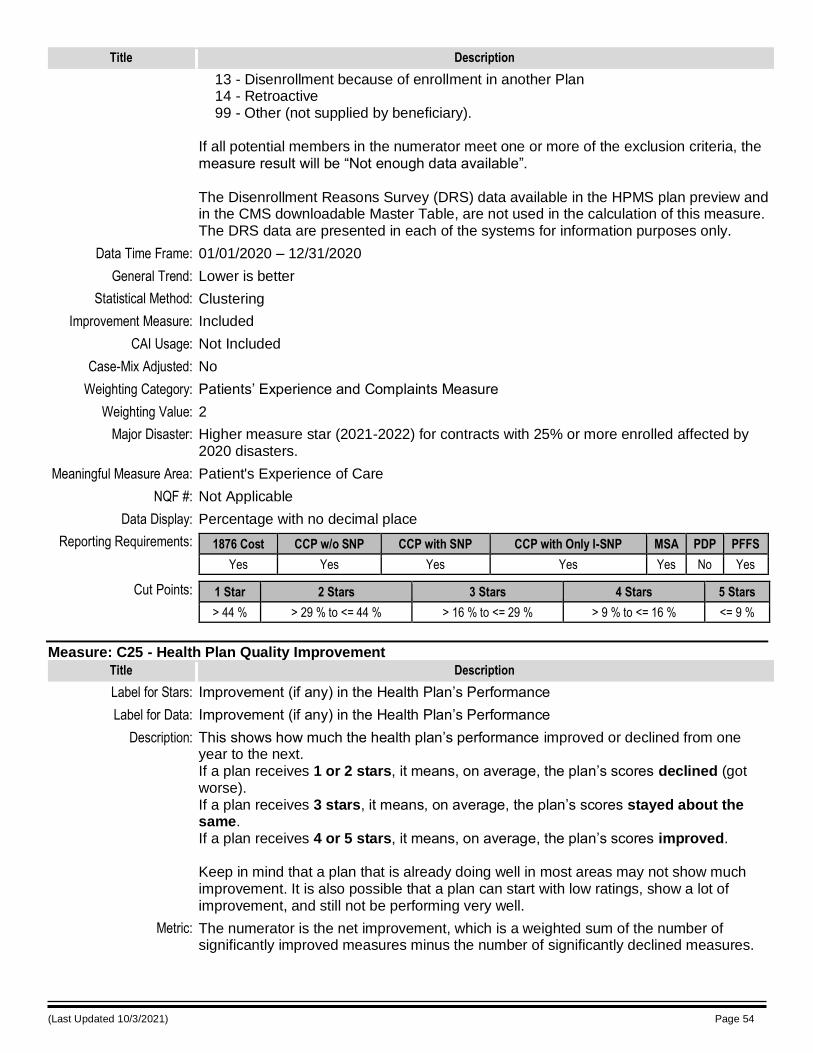
(Last Updated 10/3/2021) Page 54
Title Description
13 - Disenrollment because of enrollment in another Plan 14 - Retroactive 99 - Other (not supplied by beneficiary). If all potential members in the numerator meet one or more of the exclusion criteria, the measure result will be “Not enough data available”. The Disenrollment Reasons Survey (DRS) data available in the HPMS plan preview and in the CMS downloadable Master Table, are not used in the calculation of this measure. The DRS data are presented in each of the systems for information purposes only.
Data Time Frame: 01/01/2020 – 12/31/2020
General Trend: Lower is better
Statistical Method: Clustering
Improvement Measure: Included
CAI Usage: Not Included
Case-Mix Adjusted: No
Weighting Category: Patients’ Experience and Complaints Measure
Weighting Value: 2
Major Disaster: Higher measure star (2021-2022) for contracts with 25% or more enrolled affected by 2020 disasters.
Meaningful Measure Area: Patient's Experience of Care
NQF #: Not Applicable
Data Display: Percentage with no decimal place
Reporting Requirements: 1876 Cost CCP w/o SNP CCP with SNP CCP with Only I-SNP MSA PDP PFFS
Yes Yes Yes Yes Yes No Yes
Cut Points: 1 Star 2 Stars 3 Stars 4 Stars 5 Stars
> 44 % > 29 % to <= 44 % > 16 % to <= 29 % > 9 % to <= 16 % <= 9 %
Measure: C25 - Health Plan Quality Improvement
Title Description
Label for Stars: Improvement (if any) in the Health Plan’s Performance
Label for Data: Improvement (if any) in the Health Plan’s Performance
Description: This shows how much the health plan’s performance improved or declined from one year to the next. If a plan receives 1 or 2 stars, it means, on average, the plan’s scores declined (got worse). If a plan receives 3 stars, it means, on average, the plan’s scores stayed about the same. If a plan receives 4 or 5 stars, it means, on average, the plan’s scores improved. Keep in mind that a plan that is already doing well in most areas may not show much improvement. It is also possible that a plan can start with low ratings, show a lot of improvement, and still not be performing very well.
Metric: The numerator is the net improvement, which is a weighted sum of the number of significantly improved measures minus the number of significantly declined measures.
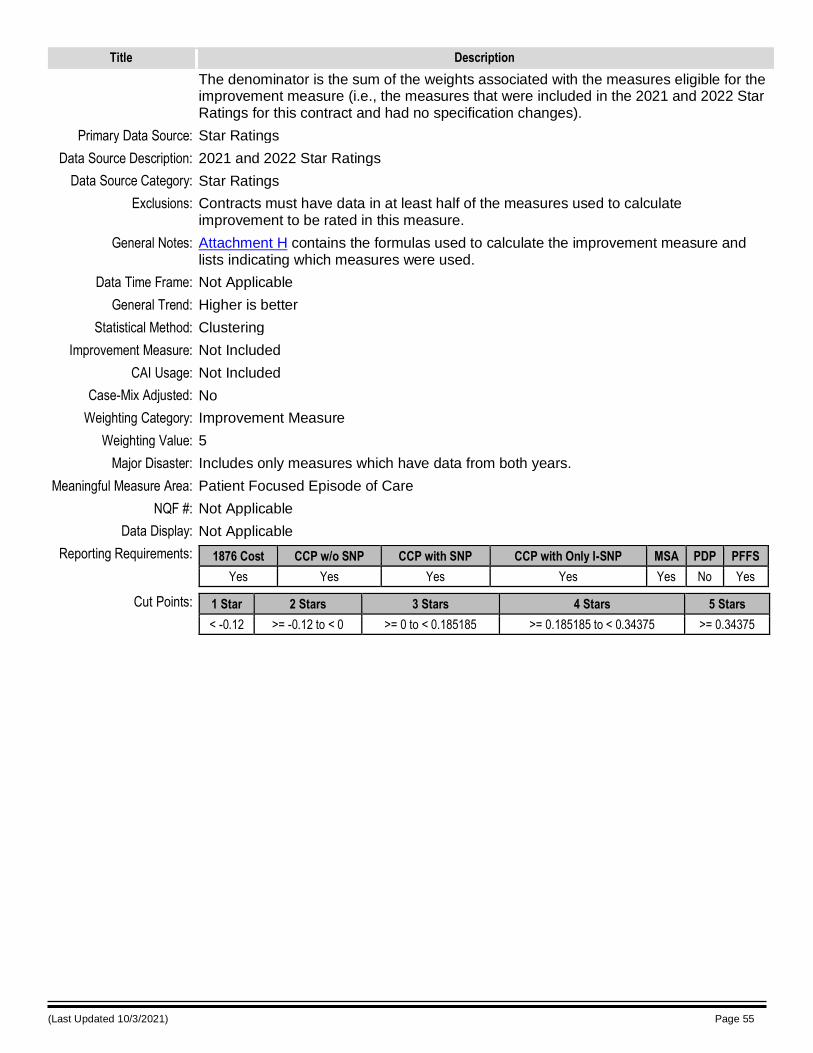
(Last Updated 10/3/2021) Page 55
Title Description
The denominator is the sum of the weights associated with the measures eligible for the improvement measure (i.e., the measures that were included in the 2021 and 2022 Star Ratings for this contract and had no specification changes).
Primary Data Source: Star Ratings
Data Source Description: 2021 and 2022 Star Ratings
Data Source Category: Star Ratings
Exclusions: Contracts must have data in at least half of the measures used to calculate improvement to be rated in this measure.
General Notes: Attachment H contains the formulas used to calculate the improvement measure and lists indicating which measures were used.
Data Time Frame: Not Applicable
General Trend: Higher is better
Statistical Method: Clustering
Improvement Measure: Not Included
CAI Usage: Not Included
Case-Mix Adjusted: No
Weighting Category: Improvement Measure
Weighting Value: 5
Major Disaster: Includes only measures which have data from both years.
Meaningful Measure Area: Patient Focused Episode of Care
NQF #: Not Applicable
Data Display: Not Applicable
Reporting Requirements: 1876 Cost CCP w/o SNP CCP with SNP CCP with Only I-SNP MSA PDP PFFS
Yes Yes Yes Yes Yes No Yes
Cut Points: 1 Star 2 Stars 3 Stars 4 Stars 5 Stars
< -0.12 >= -0.12 to < 0 >= 0 to < 0.185185 >= 0.185185 to < 0.34375 >= 0.34375
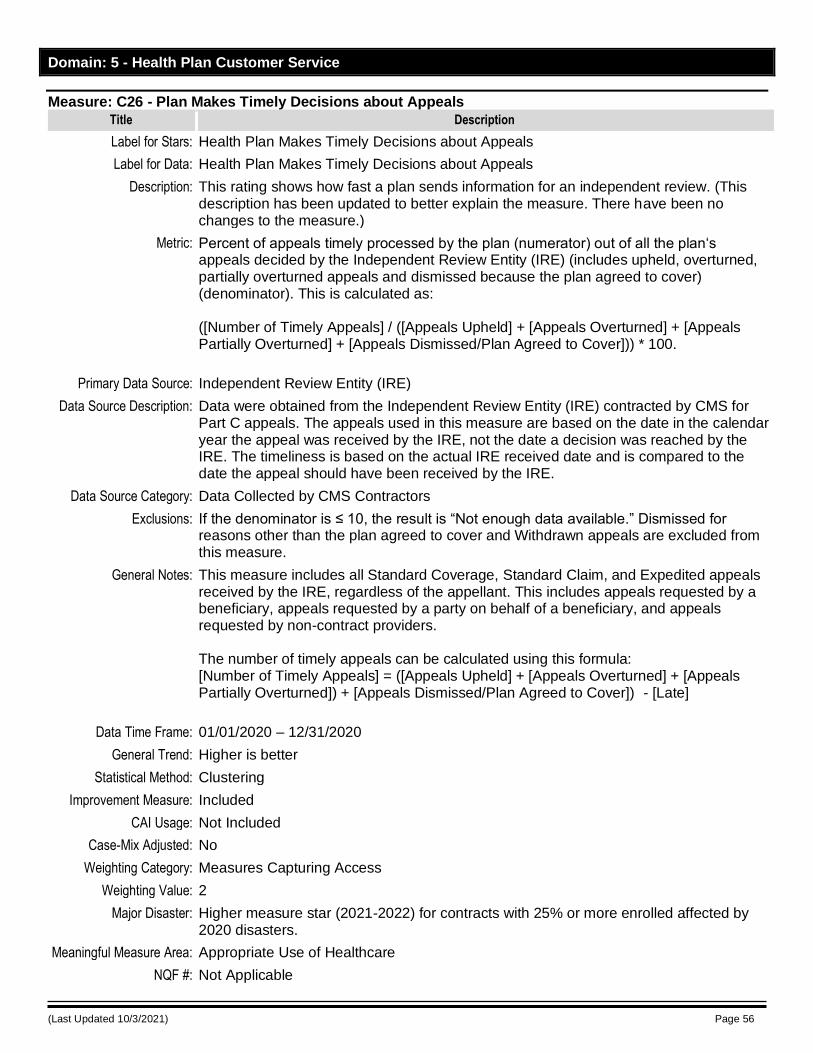
(Last Updated 10/3/2021) Page 56
Domain: 5 - Health Plan Customer Service
Measure: C26 - Plan Makes Timely Decisions about Appeals
Title Description
Label for Stars: Health Plan Makes Timely Decisions about Appeals
Label for Data: Health Plan Makes Timely Decisions about Appeals
Description: This rating shows how fast a plan sends information for an independent review. (This description has been updated to better explain the measure. There have been no changes to the measure.)
Metric: Percent of appeals timely processed by the plan (numerator) out of all the plan‘s appeals decided by the Independent Review Entity (IRE) (includes upheld, overturned, partially overturned appeals and dismissed because the plan agreed to cover) (denominator). This is calculated as: ([Number of Timely Appeals] / ([Appeals Upheld] + [Appeals Overturned] + [Appeals Partially Overturned] + [Appeals Dismissed/Plan Agreed to Cover])) * 100.
Primary Data Source: Independent Review Entity (IRE)
Data Source Description: Data were obtained from the Independent Review Entity (IRE) contracted by CMS for Part C appeals. The appeals used in this measure are based on the date in the calendar year the appeal was received by the IRE, not the date a decision was reached by the IRE. The timeliness is based on the actual IRE received date and is compared to the date the appeal should have been received by the IRE.
Data Source Category: Data Collected by CMS Contractors
Exclusions: If the denominator is ≤ 10, the result is “Not enough data available.” Dismissed for reasons other than the plan agreed to cover and Withdrawn appeals are excluded from this measure.
General Notes: This measure includes all Standard Coverage, Standard Claim, and Expedited appeals received by the IRE, regardless of the appellant. This includes appeals requested by a beneficiary, appeals requested by a party on behalf of a beneficiary, and appeals requested by non-contract providers. The number of timely appeals can be calculated using this formula: [Number of Timely Appeals] = ([Appeals Upheld] + [Appeals Overturned] + [Appeals Partially Overturned]) + [Appeals Dismissed/Plan Agreed to Cover]) - [Late]
Data Time Frame: 01/01/2020 – 12/31/2020
General Trend: Higher is better
Statistical Method: Clustering
Improvement Measure: Included
CAI Usage: Not Included
Case-Mix Adjusted: No
Weighting Category: Measures Capturing Access
Weighting Value: 2
Major Disaster: Higher measure star (2021-2022) for contracts with 25% or more enrolled affected by 2020 disasters.
Meaningful Measure Area: Appropriate Use of Healthcare
NQF #: Not Applicable
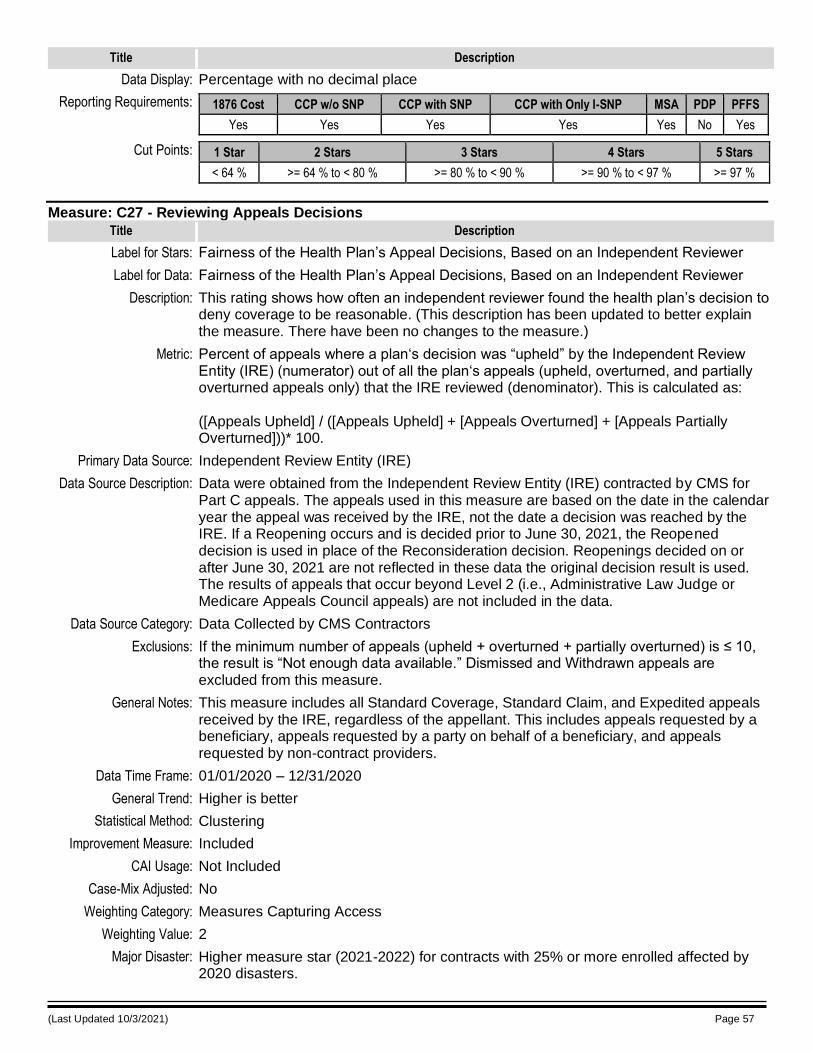
(Last Updated 10/3/2021) Page 57
Title Description
Data Display: Percentage with no decimal place
Reporting Requirements: 1876 Cost CCP w/o SNP CCP with SNP CCP with Only I-SNP MSA PDP PFFS
Yes Yes Yes Yes Yes No Yes
Cut Points: 1 Star 2 Stars 3 Stars 4 Stars 5 Stars
< 64 % >= 64 % to < 80 % >= 80 % to < 90 % >= 90 % to < 97 % >= 97 %
Measure: C27 - Reviewing Appeals Decisions
Title Description
Label for Stars: Fairness of the Health Plan’s Appeal Decisions, Based on an Independent Reviewer
Label for Data: Fairness of the Health Plan’s Appeal Decisions, Based on an Independent Reviewer
Description: This rating shows how often an independent reviewer found the health plan’s decision to deny coverage to be reasonable. (This description has been updated to better explain the measure. There have been no changes to the measure.)
Metric: Percent of appeals where a plan‘s decision was “upheld” by the Independent Review Entity (IRE) (numerator) out of all the plan‘s appeals (upheld, overturned, and partially overturned appeals only) that the IRE reviewed (denominator). This is calculated as: ([Appeals Upheld] / ([Appeals Upheld] + [Appeals Overturned] + [Appeals Partially Overturned]))* 100.
Primary Data Source: Independent Review Entity (IRE)
Data Source Description: Data were obtained from the Independent Review Entity (IRE) contracted by CMS for Part C appeals. The appeals used in this measure are based on the date in the calendar year the appeal was received by the IRE, not the date a decision was reached by the IRE. If a Reopening occurs and is decided prior to June 30, 2021, the Reopened decision is used in place of the Reconsideration decision. Reopenings decided on or after June 30, 2021 are not reflected in these data the original decision result is used. The results of appeals that occur beyond Level 2 (i.e., Administrative Law Judge or Medicare Appeals Council appeals) are not included in the data.
Data Source Category: Data Collected by CMS Contractors
Exclusions: If the minimum number of appeals (upheld + overturned + partially overturned) is ≤ 10, the result is “Not enough data available.” Dismissed and Withdrawn appeals are excluded from this measure.
General Notes: This measure includes all Standard Coverage, Standard Claim, and Expedited appeals received by the IRE, regardless of the appellant. This includes appeals requested by a beneficiary, appeals requested by a party on behalf of a beneficiary, and appeals requested by non-contract providers.
Data Time Frame: 01/01/2020 – 12/31/2020
General Trend: Higher is better
Statistical Method: Clustering
Improvement Measure: Included
CAI Usage: Not Included
Case-Mix Adjusted: No
Weighting Category: Measures Capturing Access
Weighting Value: 2
Major Disaster: Higher measure star (2021-2022) for contracts with 25% or more enrolled affected by 2020 disasters.
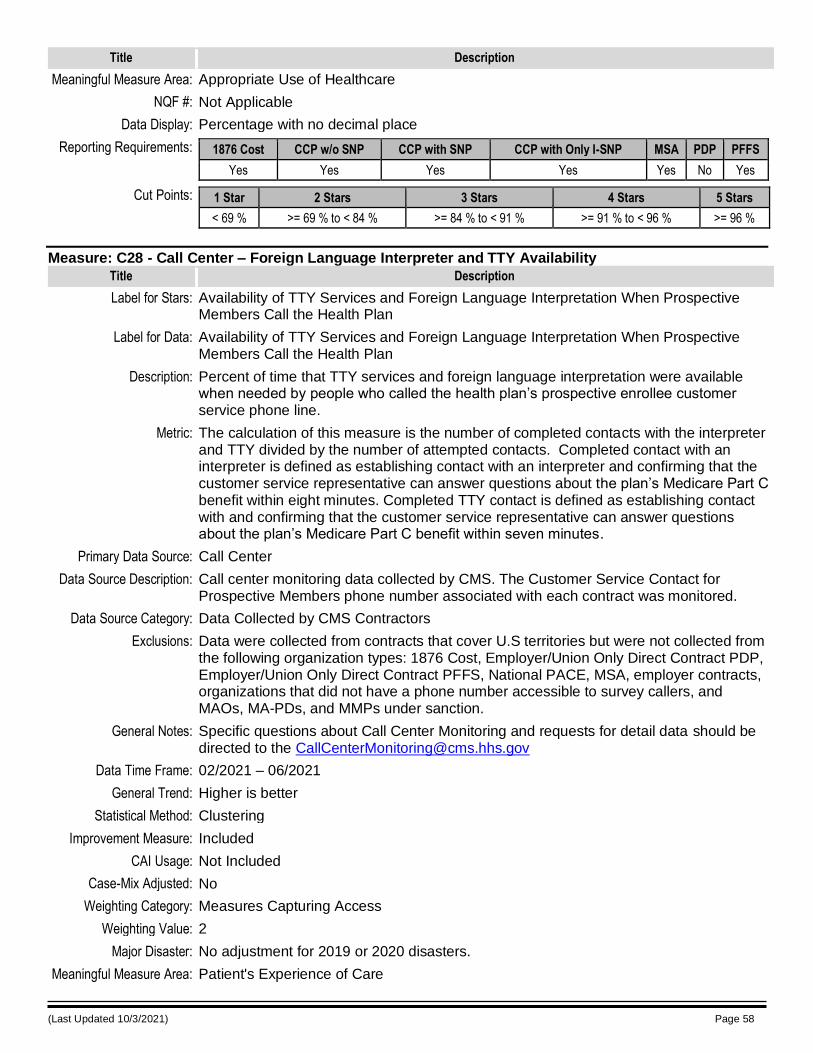
(Last Updated 10/3/2021) Page 58
Title Description
Meaningful Measure Area: Appropriate Use of Healthcare
NQF #: Not Applicable
Data Display: Percentage with no decimal place
Reporting Requirements: 1876 Cost CCP w/o SNP CCP with SNP CCP with Only I-SNP MSA PDP PFFS
Yes Yes Yes Yes Yes No Yes
Cut Points: 1 Star 2 Stars 3 Stars 4 Stars 5 Stars
< 69 % >= 69 % to < 84 % >= 84 % to < 91 % >= 91 % to < 96 % >= 96 %
Measure: C28 - Call Center – Foreign Language Interpreter and TTY Availability
Title Description
Label for Stars: Availability of TTY Services and Foreign Language Interpretation When Prospective Members Call the Health Plan
Label for Data: Availability of TTY Services and Foreign Language Interpretation When Prospective Members Call the Health Plan
Description: Percent of time that TTY services and foreign language interpretation were available when needed by people who called the health plan’s prospective enrollee customer service phone line.
Metric: The calculation of this measure is the number of completed contacts with the interpreter and TTY divided by the number of attempted contacts. Completed contact with an interpreter is defined as establishing contact with an interpreter and confirming that the customer service representative can answer questions about the plan’s Medicare Part C benefit within eight minutes. Completed TTY contact is defined as establishing contact with and confirming that the customer service representative can answer questions about the plan’s Medicare Part C benefit within seven minutes.
Primary Data Source: Call Center
Data Source Description: Call center monitoring data collected by CMS. The Customer Service Contact for Prospective Members phone number associated with each contract was monitored.
Data Source Category: Data Collected by CMS Contractors
Exclusions: Data were collected from contracts that cover U.S territories but were not collected from the following organization types: 1876 Cost, Employer/Union Only Direct Contract PDP, Employer/Union Only Direct Contract PFFS, National PACE, MSA, employer contracts, organizations that did not have a phone number accessible to survey callers, and MAOs, MA-PDs, and MMPs under sanction.
General Notes: Specific questions about Call Center Monitoring and requests for detail data should be directed to the [email protected]
Data Time Frame: 02/2021 – 06/2021
General Trend: Higher is better
Statistical Method: Clustering
Improvement Measure: Included
CAI Usage: Not Included
Case-Mix Adjusted: No
Weighting Category: Measures Capturing Access
Weighting Value: 2
Major Disaster: No adjustment for 2019 or 2020 disasters.
Meaningful Measure Area: Patient's Experience of Care
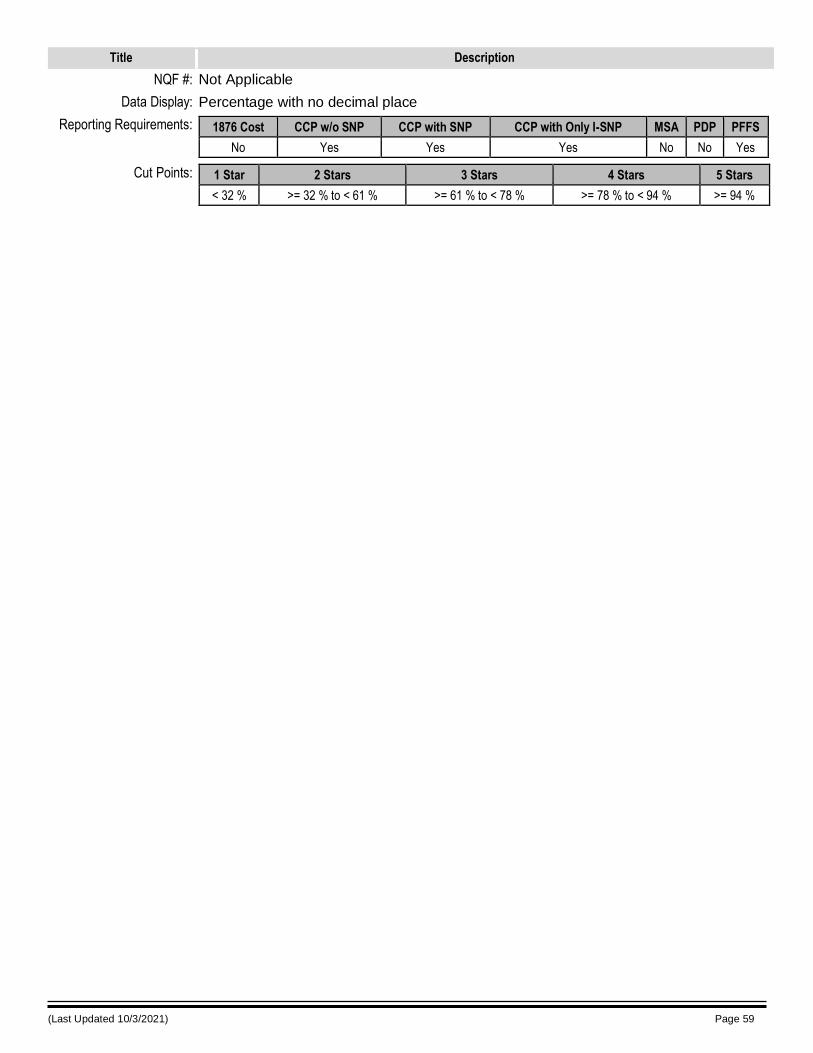
(Last Updated 10/3/2021) Page 59
Title Description
NQF #: Not Applicable
Data Display: Percentage with no decimal place
Reporting Requirements: 1876 Cost CCP w/o SNP CCP with SNP CCP with Only I-SNP MSA PDP PFFS
No Yes Yes Yes No No Yes
Cut Points: 1 Star 2 Stars 3 Stars 4 Stars 5 Stars
< 32 % >= 32 % to < 61 % >= 61 % to < 78 % >= 78 % to < 94 % >= 94 %
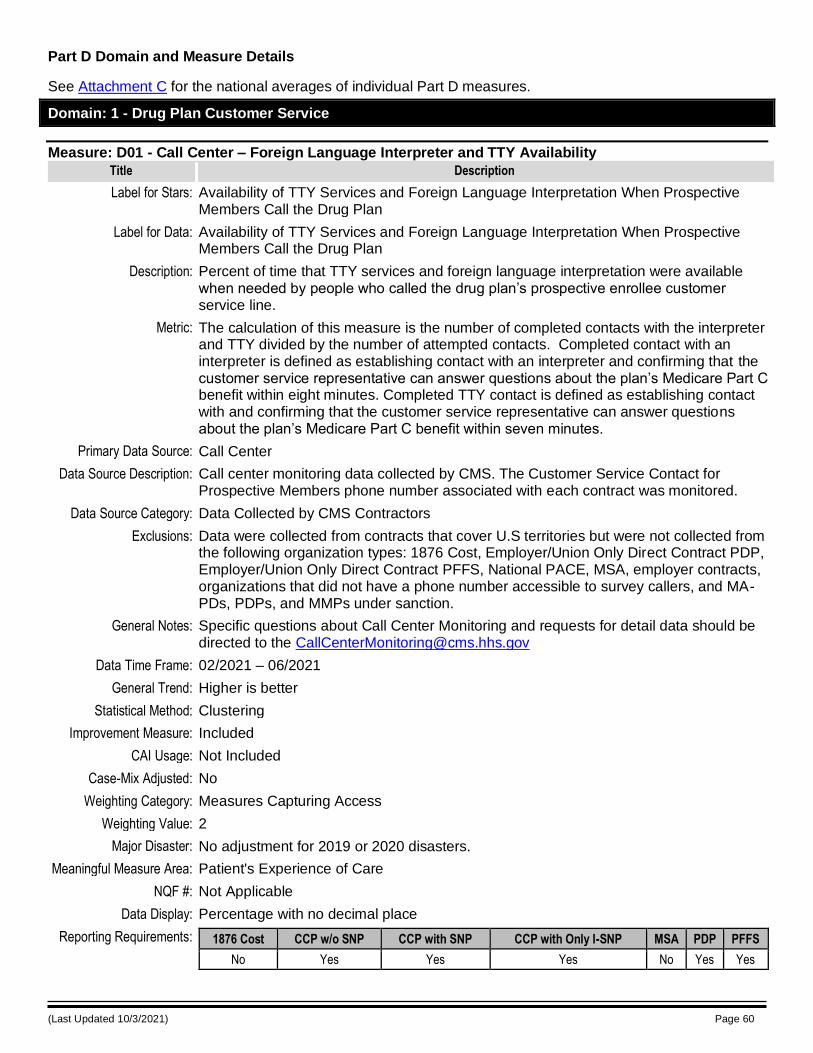
(Last Updated 10/3/2021) Page 60
Part D Domain and Measure Details
See Attachment C for the national averages of individual Part D measures.
Domain: 1 - Drug Plan Customer Service
Measure: D01 - Call Center – Foreign Language Interpreter and TTY Availability
Title Description
Label for Stars: Availability of TTY Services and Foreign Language Interpretation When Prospective Members Call the Drug Plan
Label for Data: Availability of TTY Services and Foreign Language Interpretation When Prospective Members Call the Drug Plan
Description: Percent of time that TTY services and foreign language interpretation were available when needed by people who called the drug plan’s prospective enrollee customer service line.
Metric: The calculation of this measure is the number of completed contacts with the interpreter and TTY divided by the number of attempted contacts. Completed contact with an interpreter is defined as establishing contact with an interpreter and confirming that the customer service representative can answer questions about the plan’s Medicare Part C benefit within eight minutes. Completed TTY contact is defined as establishing contact with and confirming that the customer service representative can answer questions about the plan’s Medicare Part C benefit within seven minutes.
Primary Data Source: Call Center
Data Source Description: Call center monitoring data collected by CMS. The Customer Service Contact for Prospective Members phone number associated with each contract was monitored.
Data Source Category: Data Collected by CMS Contractors
Exclusions: Data were collected from contracts that cover U.S territories but were not collected from the following organization types: 1876 Cost, Employer/Union Only Direct Contract PDP, Employer/Union Only Direct Contract PFFS, National PACE, MSA, employer contracts, organizations that did not have a phone number accessible to survey callers, and MA-PDs, PDPs, and MMPs under sanction.
General Notes: Specific questions about Call Center Monitoring and requests for detail data should be directed to the [email protected]
Data Time Frame: 02/2021 – 06/2021
General Trend: Higher is better
Statistical Method: Clustering
Improvement Measure: Included
CAI Usage: Not Included
Case-Mix Adjusted: No
Weighting Category: Measures Capturing Access
Weighting Value: 2
Major Disaster: No adjustment for 2019 or 2020 disasters.
Meaningful Measure Area: Patient's Experience of Care
NQF #: Not Applicable
Data Display: Percentage with no decimal place
Reporting Requirements: 1876 Cost CCP w/o SNP CCP with SNP CCP with Only I-SNP MSA PDP PFFS
No Yes Yes Yes No Yes Yes
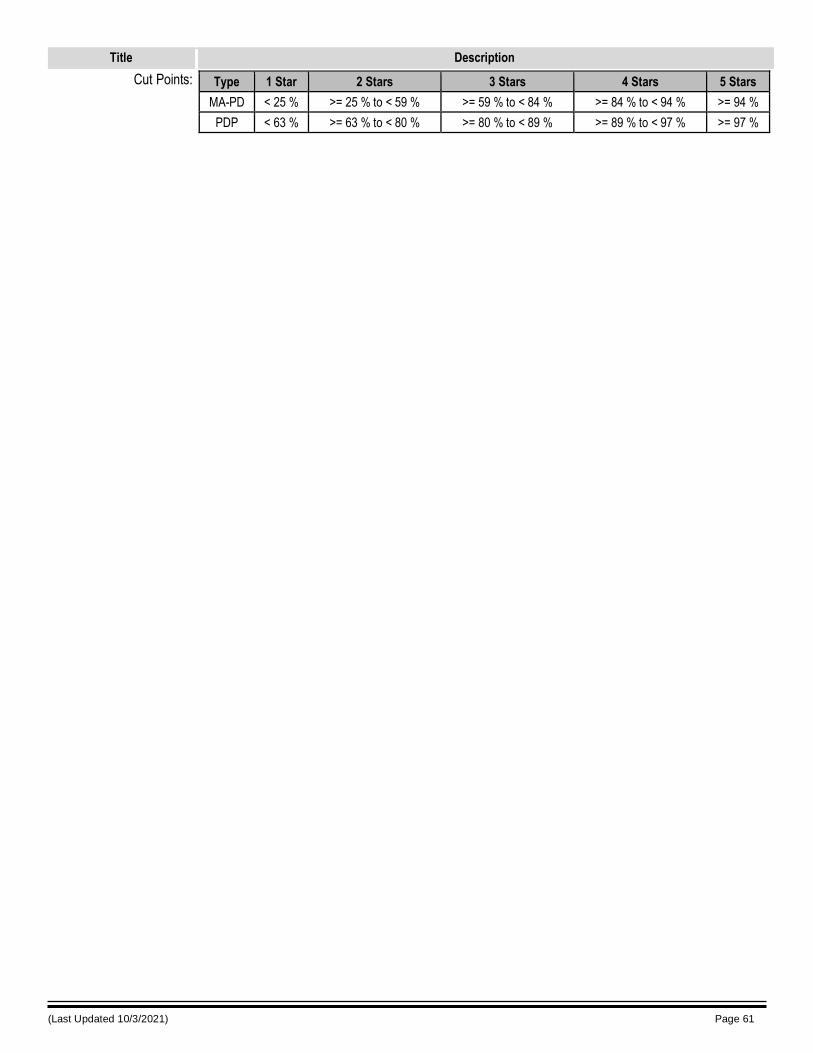
(Last Updated 10/3/2021) Page 61
Title Description
Cut Points: Type 1 Star 2 Stars 3 Stars 4 Stars 5 Stars
MA-PD < 25 % >= 25 % to < 59 % >= 59 % to < 84 % >= 84 % to < 94 % >= 94 %
PDP < 63 % >= 63 % to < 80 % >= 80 % to < 89 % >= 89 % to < 97 % >= 97 %
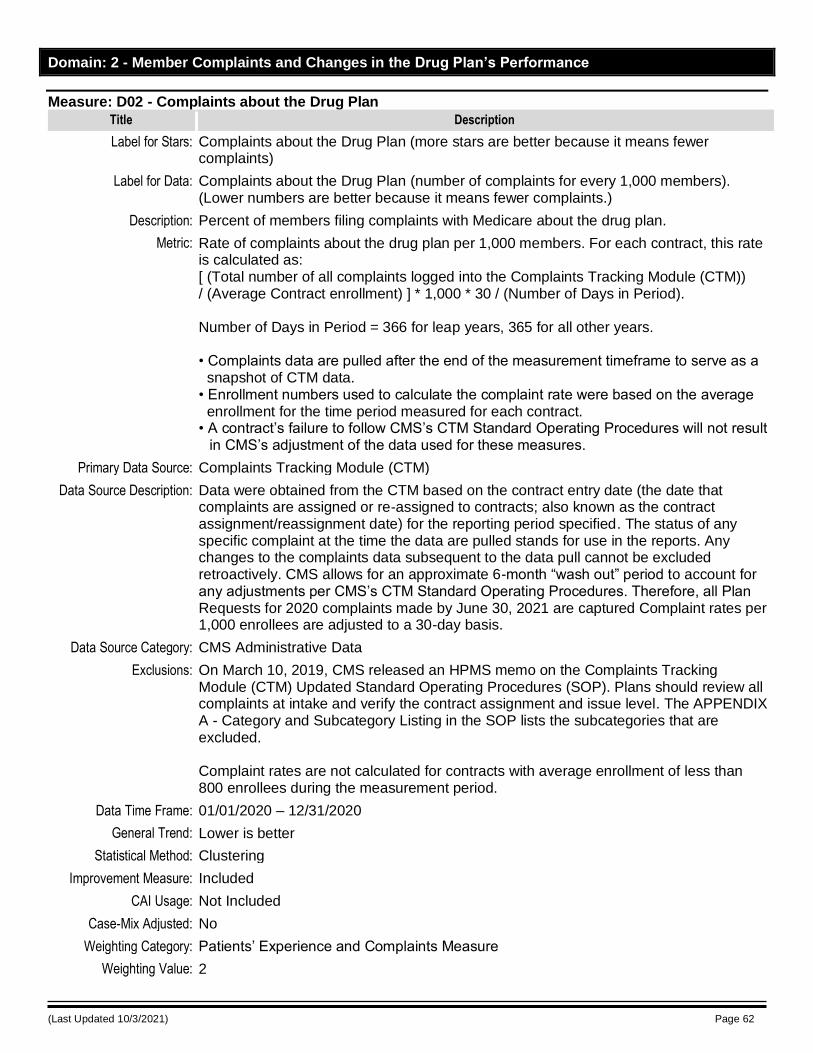
(Last Updated 10/3/2021) Page 62
Domain: 2 - Member Complaints and Changes in the Drug Plan’s Performance
Measure: D02 - Complaints about the Drug Plan
Title Description
Label for Stars: Complaints about the Drug Plan (more stars are better because it means fewer complaints)
Label for Data: Complaints about the Drug Plan (number of complaints for every 1,000 members). (Lower numbers are better because it means fewer complaints.)
Description: Percent of members filing complaints with Medicare about the drug plan.
Metric: Rate of complaints about the drug plan per 1,000 members. For each contract, this rate is calculated as: [ (Total number of all complaints logged into the Complaints Tracking Module (CTM)) / (Average Contract enrollment) ] * 1,000 * 30 / (Number of Days in Period). Number of Days in Period = 366 for leap years, 365 for all other years. • Complaints data are pulled after the end of the measurement timeframe to serve as a snapshot of CTM data. • Enrollment numbers used to calculate the complaint rate were based on the average enrollment for the time period measured for each contract. • A contract’s failure to follow CMS’s CTM Standard Operating Procedures will not result
in CMS’s adjustment of the data used for these measures.
Primary Data Source: Complaints Tracking Module (CTM)
Data Source Description: Data were obtained from the CTM based on the contract entry date (the date that complaints are assigned or re-assigned to contracts; also known as the contract assignment/reassignment date) for the reporting period specified. The status of any specific complaint at the time the data are pulled stands for use in the reports. Any changes to the complaints data subsequent to the data pull cannot be excluded retroactively. CMS allows for an approximate 6-month “wash out” period to account for any adjustments per CMS’s CTM Standard Operating Procedures. Therefore, all Plan Requests for 2020 complaints made by June 30, 2021 are captured Complaint rates per 1,000 enrollees are adjusted to a 30-day basis.
Data Source Category: CMS Administrative Data
Exclusions: On March 10, 2019, CMS released an HPMS memo on the Complaints Tracking Module (CTM) Updated Standard Operating Procedures (SOP). Plans should review all complaints at intake and verify the contract assignment and issue level. The APPENDIX A - Category and Subcategory Listing in the SOP lists the subcategories that are excluded. Complaint rates are not calculated for contracts with average enrollment of less than 800 enrollees during the measurement period.
Data Time Frame: 01/01/2020 – 12/31/2020
General Trend: Lower is better
Statistical Method: Clustering
Improvement Measure: Included
CAI Usage: Not Included
Case-Mix Adjusted: No
Weighting Category: Patients’ Experience and Complaints Measure
Weighting Value: 2
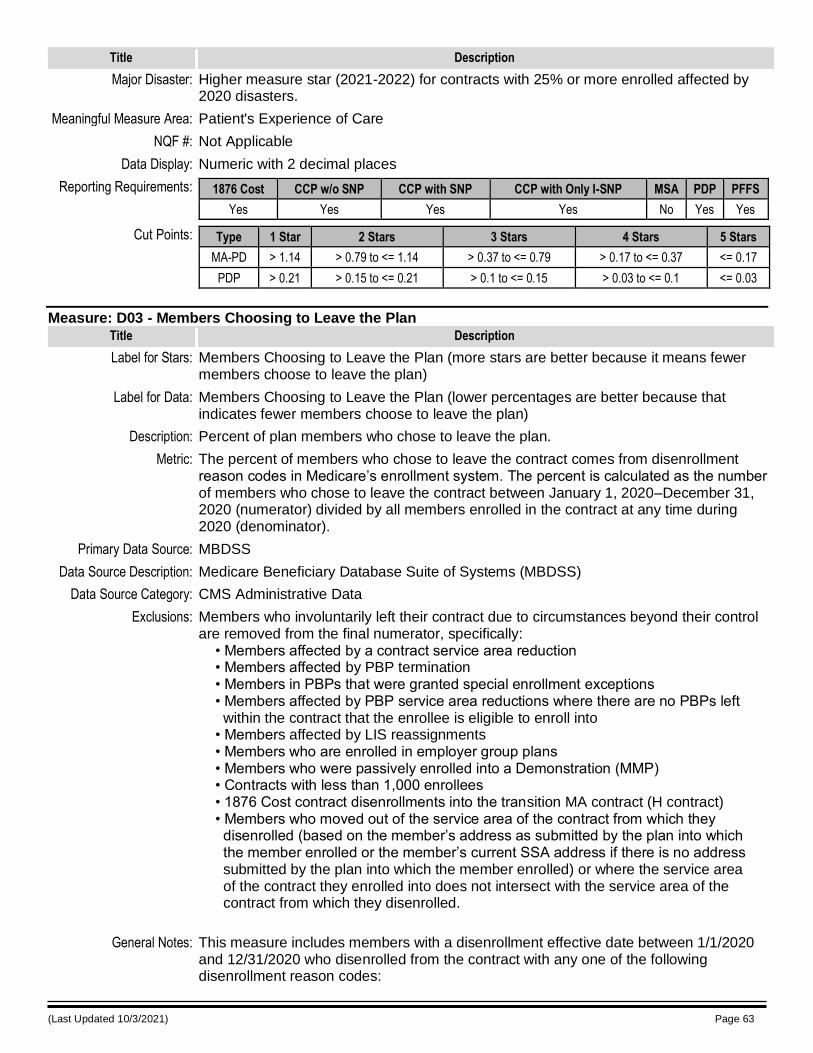
(Last Updated 10/3/2021) Page 63
Title Description
Major Disaster: Higher measure star (2021-2022) for contracts with 25% or more enrolled affected by 2020 disasters.
Meaningful Measure Area: Patient's Experience of Care
NQF #: Not Applicable
Data Display: Numeric with 2 decimal places
Reporting Requirements: 1876 Cost CCP w/o SNP CCP with SNP CCP with Only I-SNP MSA PDP PFFS
Yes Yes Yes Yes No Yes Yes
Cut Points: Type 1 Star 2 Stars 3 Stars 4 Stars 5 Stars
MA-PD > 1.14 > 0.79 to <= 1.14 > 0.37 to <= 0.79 > 0.17 to <= 0.37 <= 0.17
PDP > 0.21 > 0.15 to <= 0.21 > 0.1 to <= 0.15 > 0.03 to <= 0.1 <= 0.03
Measure: D03 - Members Choosing to Leave the Plan
Title Description
Label for Stars: Members Choosing to Leave the Plan (more stars are better because it means fewer members choose to leave the plan)
Label for Data: Members Choosing to Leave the Plan (lower percentages are better because that indicates fewer members choose to leave the plan)
Description: Percent of plan members who chose to leave the plan.
Metric: The percent of members who chose to leave the contract comes from disenrollment reason codes in Medicare’s enrollment system. The percent is calculated as the number of members who chose to leave the contract between January 1, 2020–December 31, 2020 (numerator) divided by all members enrolled in the contract at any time during 2020 (denominator).
Primary Data Source: MBDSS
Data Source Description: Medicare Beneficiary Database Suite of Systems (MBDSS)
Data Source Category: CMS Administrative Data
Exclusions: Members who involuntarily left their contract due to circumstances beyond their control are removed from the final numerator, specifically: • Members affected by a contract service area reduction • Members affected by PBP termination • Members in PBPs that were granted special enrollment exceptions • Members affected by PBP service area reductions where there are no PBPs left within the contract that the enrollee is eligible to enroll into • Members affected by LIS reassignments • Members who are enrolled in employer group plans • Members who were passively enrolled into a Demonstration (MMP) • Contracts with less than 1,000 enrollees • 1876 Cost contract disenrollments into the transition MA contract (H contract) • Members who moved out of the service area of the contract from which they disenrolled (based on the member’s address as submitted by the plan into which the member enrolled or the member’s current SSA address if there is no address submitted by the plan into which the member enrolled) or where the service area of the contract they enrolled into does not intersect with the service area of the contract from which they disenrolled.
General Notes: This measure includes members with a disenrollment effective date between 1/1/2020 and 12/31/2020 who disenrolled from the contract with any one of the following disenrollment reason codes:
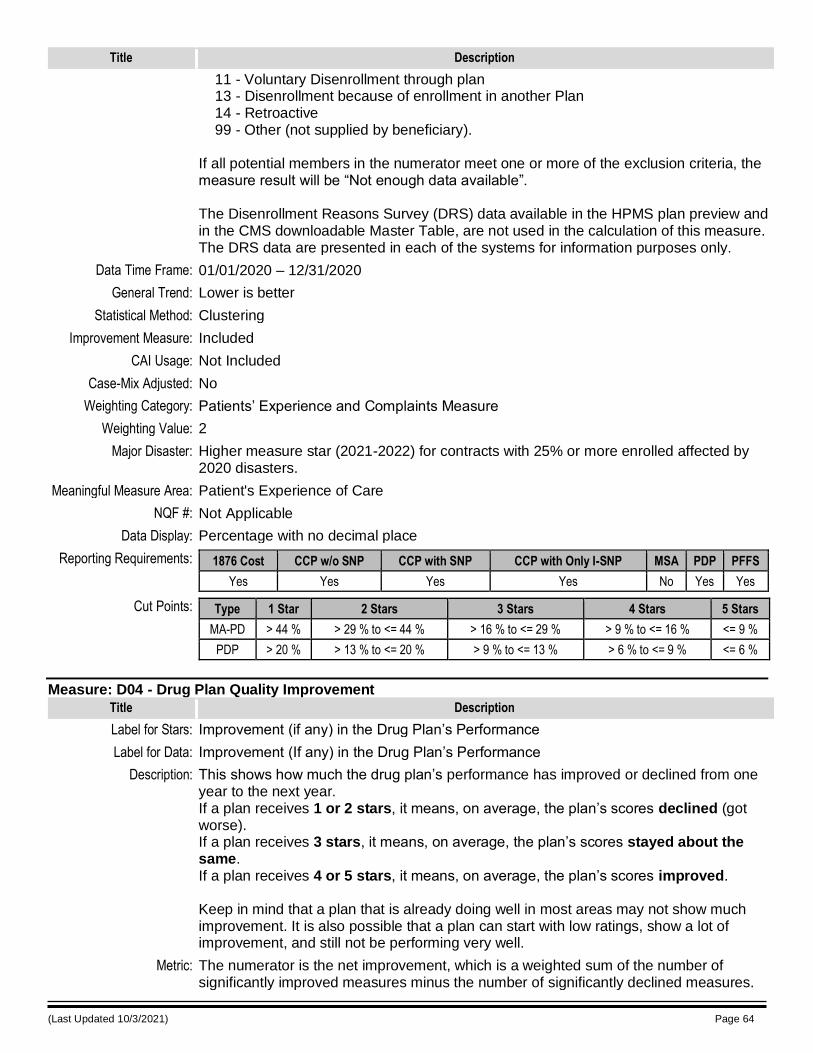
(Last Updated 10/3/2021) Page 64
Title Description
11 - Voluntary Disenrollment through plan 13 - Disenrollment because of enrollment in another Plan 14 - Retroactive 99 - Other (not supplied by beneficiary). If all potential members in the numerator meet one or more of the exclusion criteria, the measure result will be “Not enough data available”. The Disenrollment Reasons Survey (DRS) data available in the HPMS plan preview and in the CMS downloadable Master Table, are not used in the calculation of this measure. The DRS data are presented in each of the systems for information purposes only.
Data Time Frame: 01/01/2020 – 12/31/2020
General Trend: Lower is better
Statistical Method: Clustering
Improvement Measure: Included
CAI Usage: Not Included
Case-Mix Adjusted: No
Weighting Category: Patients’ Experience and Complaints Measure
Weighting Value: 2
Major Disaster: Higher measure star (2021-2022) for contracts with 25% or more enrolled affected by 2020 disasters.
Meaningful Measure Area: Patient's Experience of Care
NQF #: Not Applicable
Data Display: Percentage with no decimal place
Reporting Requirements: 1876 Cost CCP w/o SNP CCP with SNP CCP with Only I-SNP MSA PDP PFFS
Yes Yes Yes Yes No Yes Yes
Cut Points: Type 1 Star 2 Stars 3 Stars 4 Stars 5 Stars
MA-PD > 44 % > 29 % to <= 44 % > 16 % to <= 29 % > 9 % to <= 16 % <= 9 %
PDP > 20 % > 13 % to <= 20 % > 9 % to <= 13 % > 6 % to <= 9 % <= 6 %
Measure: D04 - Drug Plan Quality Improvement
Title Description
Label for Stars: Improvement (if any) in the Drug Plan’s Performance
Label for Data: Improvement (If any) in the Drug Plan’s Performance
Description: This shows how much the drug plan’s performance has improved or declined from one year to the next year. If a plan receives 1 or 2 stars, it means, on average, the plan’s scores declined (got worse). If a plan receives 3 stars, it means, on average, the plan’s scores stayed about the same. If a plan receives 4 or 5 stars, it means, on average, the plan’s scores improved. Keep in mind that a plan that is already doing well in most areas may not show much improvement. It is also possible that a plan can start with low ratings, show a lot of improvement, and still not be performing very well.
Metric: The numerator is the net improvement, which is a weighted sum of the number of significantly improved measures minus the number of significantly declined measures.
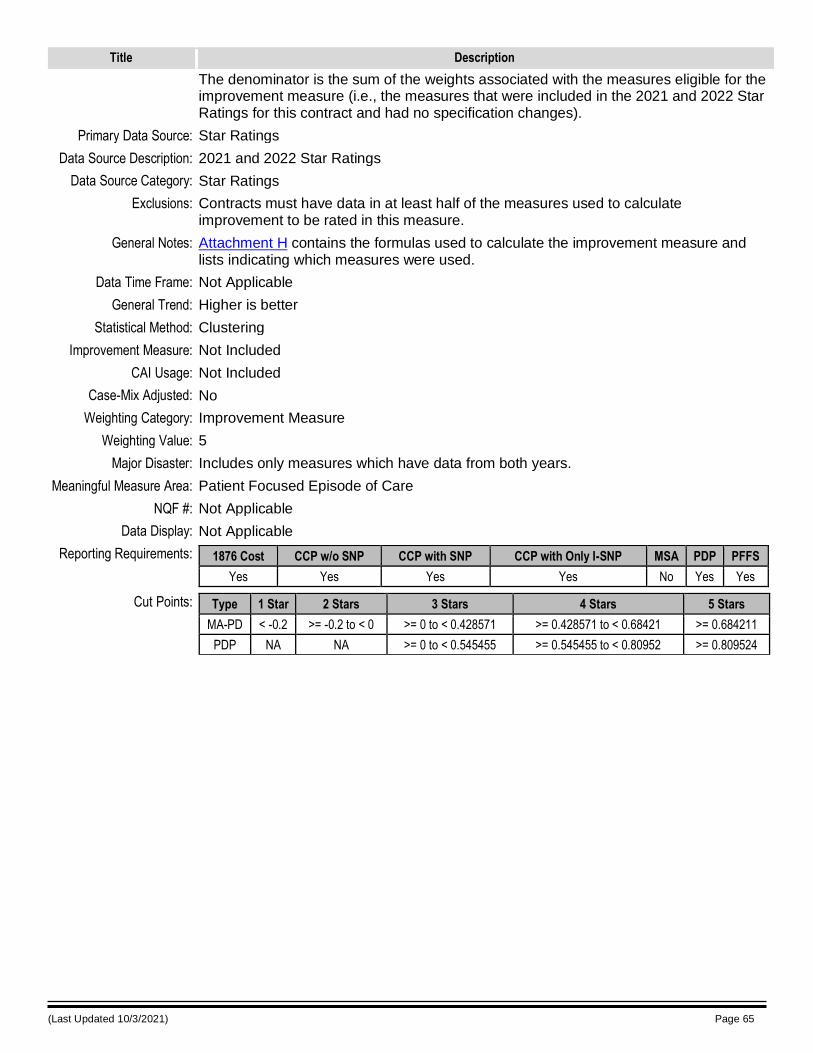
(Last Updated 10/3/2021) Page 65
Title Description
The denominator is the sum of the weights associated with the measures eligible for the improvement measure (i.e., the measures that were included in the 2021 and 2022 Star Ratings for this contract and had no specification changes).
Primary Data Source: Star Ratings
Data Source Description: 2021 and 2022 Star Ratings
Data Source Category: Star Ratings
Exclusions: Contracts must have data in at least half of the measures used to calculate improvement to be rated in this measure.
General Notes: Attachment H contains the formulas used to calculate the improvement measure and lists indicating which measures were used.
Data Time Frame: Not Applicable
General Trend: Higher is better
Statistical Method: Clustering
Improvement Measure: Not Included
CAI Usage: Not Included
Case-Mix Adjusted: No
Weighting Category: Improvement Measure
Weighting Value: 5
Major Disaster: Includes only measures which have data from both years.
Meaningful Measure Area: Patient Focused Episode of Care
NQF #: Not Applicable
Data Display: Not Applicable
Reporting Requirements: 1876 Cost CCP w/o SNP CCP with SNP CCP with Only I-SNP MSA PDP PFFS
Yes Yes Yes Yes No Yes Yes
Cut Points: Type 1 Star 2 Stars 3 Stars 4 Stars 5 Stars
MA-PD < -0.2 >= -0.2 to < 0 >= 0 to < 0.428571 >= 0.428571 to < 0.68421 >= 0.684211
PDP NA NA >= 0 to < 0.545455 >= 0.545455 to < 0.80952 >= 0.809524
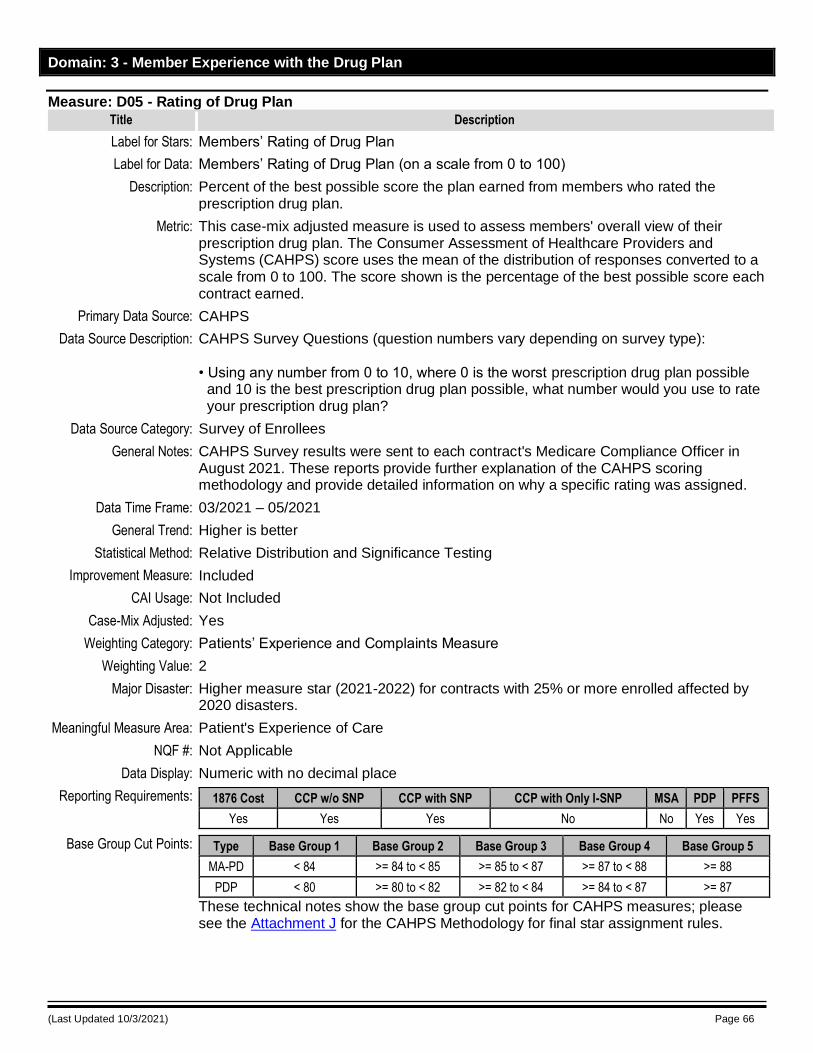
(Last Updated 10/3/2021) Page 66
Domain: 3 - Member Experience with the Drug Plan
Measure: D05 - Rating of Drug Plan
Title Description
Label for Stars: Members’ Rating of Drug Plan
Label for Data: Members’ Rating of Drug Plan (on a scale from 0 to 100)
Description: Percent of the best possible score the plan earned from members who rated the prescription drug plan.
Metric: This case-mix adjusted measure is used to assess members' overall view of their prescription drug plan. The Consumer Assessment of Healthcare Providers and Systems (CAHPS) score uses the mean of the distribution of responses converted to a scale from 0 to 100. The score shown is the percentage of the best possible score each contract earned.
Primary Data Source: CAHPS
Data Source Description: CAHPS Survey Questions (question numbers vary depending on survey type): • Using any number from 0 to 10, where 0 is the worst prescription drug plan possible and 10 is the best prescription drug plan possible, what number would you use to rate your prescription drug plan?
Data Source Category: Survey of Enrollees
General Notes: CAHPS Survey results were sent to each contract's Medicare Compliance Officer in August 2021. These reports provide further explanation of the CAHPS scoring methodology and provide detailed information on why a specific rating was assigned.
Data Time Frame: 03/2021 – 05/2021
General Trend: Higher is better
Statistical Method: Relative Distribution and Significance Testing
Improvement Measure: Included
CAI Usage: Not Included
Case-Mix Adjusted: Yes
Weighting Category: Patients’ Experience and Complaints Measure
Weighting Value: 2
Major Disaster: Higher measure star (2021-2022) for contracts with 25% or more enrolled affected by 2020 disasters.
Meaningful Measure Area: Patient's Experience of Care
NQF #: Not Applicable
Data Display: Numeric with no decimal place
Reporting Requirements: 1876 Cost CCP w/o SNP CCP with SNP CCP with Only I-SNP MSA PDP PFFS
Yes Yes Yes No No Yes Yes
Base Group Cut Points: Type Base Group 1 Base Group 2 Base Group 3 Base Group 4 Base Group 5
MA-PD < 84 >= 84 to < 85 >= 85 to < 87 >= 87 to < 88 >= 88
PDP < 80 >= 80 to < 82 >= 82 to < 84 >= 84 to < 87 >= 87
These technical notes show the base group cut points for CAHPS measures; please see the Attachment J for the CAHPS Methodology for final star assignment rules.
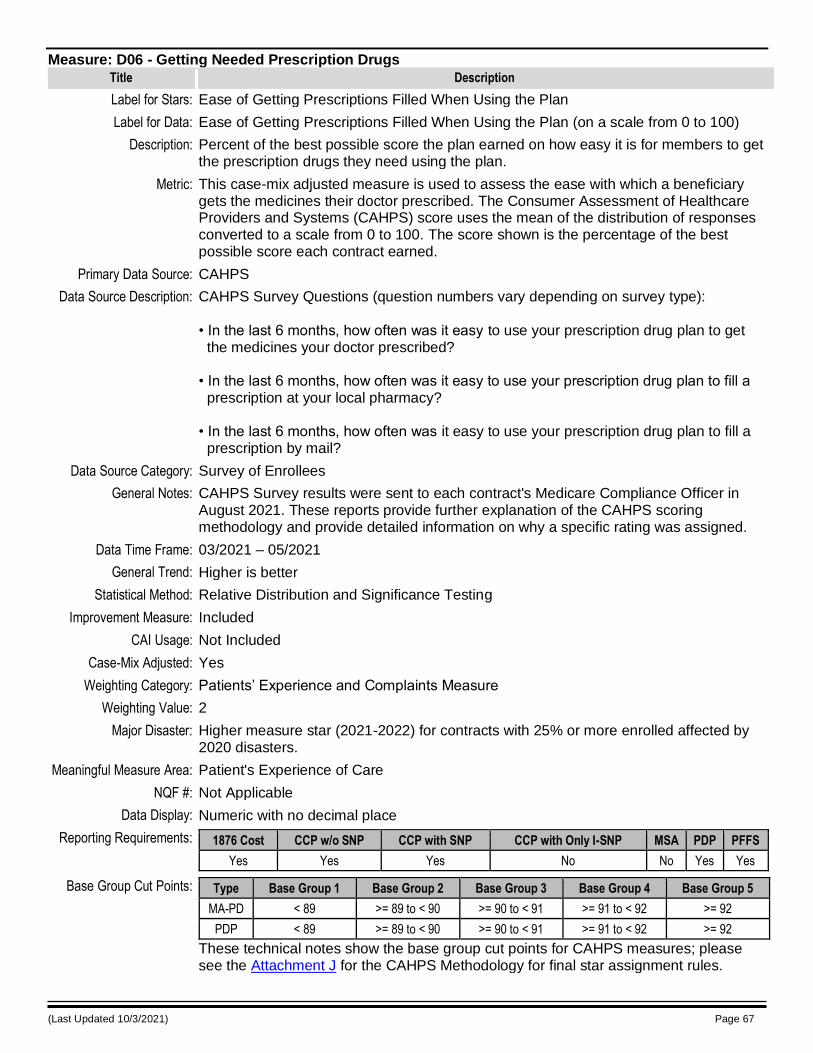
(Last Updated 10/3/2021) Page 67
Measure: D06 - Getting Needed Prescription Drugs
Title Description
Label for Stars: Ease of Getting Prescriptions Filled When Using the Plan
Label for Data: Ease of Getting Prescriptions Filled When Using the Plan (on a scale from 0 to 100)
Description: Percent of the best possible score the plan earned on how easy it is for members to get the prescription drugs they need using the plan.
Metric: This case-mix adjusted measure is used to assess the ease with which a beneficiary gets the medicines their doctor prescribed. The Consumer Assessment of Healthcare Providers and Systems (CAHPS) score uses the mean of the distribution of responses converted to a scale from 0 to 100. The score shown is the percentage of the best possible score each contract earned.
Primary Data Source: CAHPS
Data Source Description: CAHPS Survey Questions (question numbers vary depending on survey type): • In the last 6 months, how often was it easy to use your prescription drug plan to get the medicines your doctor prescribed? • In the last 6 months, how often was it easy to use your prescription drug plan to fill a prescription at your local pharmacy? • In the last 6 months, how often was it easy to use your prescription drug plan to fill a prescription by mail?
Data Source Category: Survey of Enrollees
General Notes: CAHPS Survey results were sent to each contract's Medicare Compliance Officer in August 2021. These reports provide further explanation of the CAHPS scoring methodology and provide detailed information on why a specific rating was assigned.
Data Time Frame: 03/2021 – 05/2021
General Trend: Higher is better
Statistical Method: Relative Distribution and Significance Testing
Improvement Measure: Included
CAI Usage: Not Included
Case-Mix Adjusted: Yes
Weighting Category: Patients’ Experience and Complaints Measure
Weighting Value: 2
Major Disaster: Higher measure star (2021-2022) for contracts with 25% or more enrolled affected by 2020 disasters.
Meaningful Measure Area: Patient's Experience of Care
NQF #: Not Applicable
Data Display: Numeric with no decimal place
Reporting Requirements: 1876 Cost CCP w/o SNP CCP with SNP CCP with Only I-SNP MSA PDP PFFS
Yes Yes Yes No No Yes Yes
Base Group Cut Points: Type Base Group 1 Base Group 2 Base Group 3 Base Group 4 Base Group 5
MA-PD < 89 >= 89 to < 90 >= 90 to < 91 >= 91 to < 92 >= 92
PDP < 89 >= 89 to < 90 >= 90 to < 91 >= 91 to < 92 >= 92
These technical notes show the base group cut points for CAHPS measures; please see the Attachment J for the CAHPS Methodology for final star assignment rules.
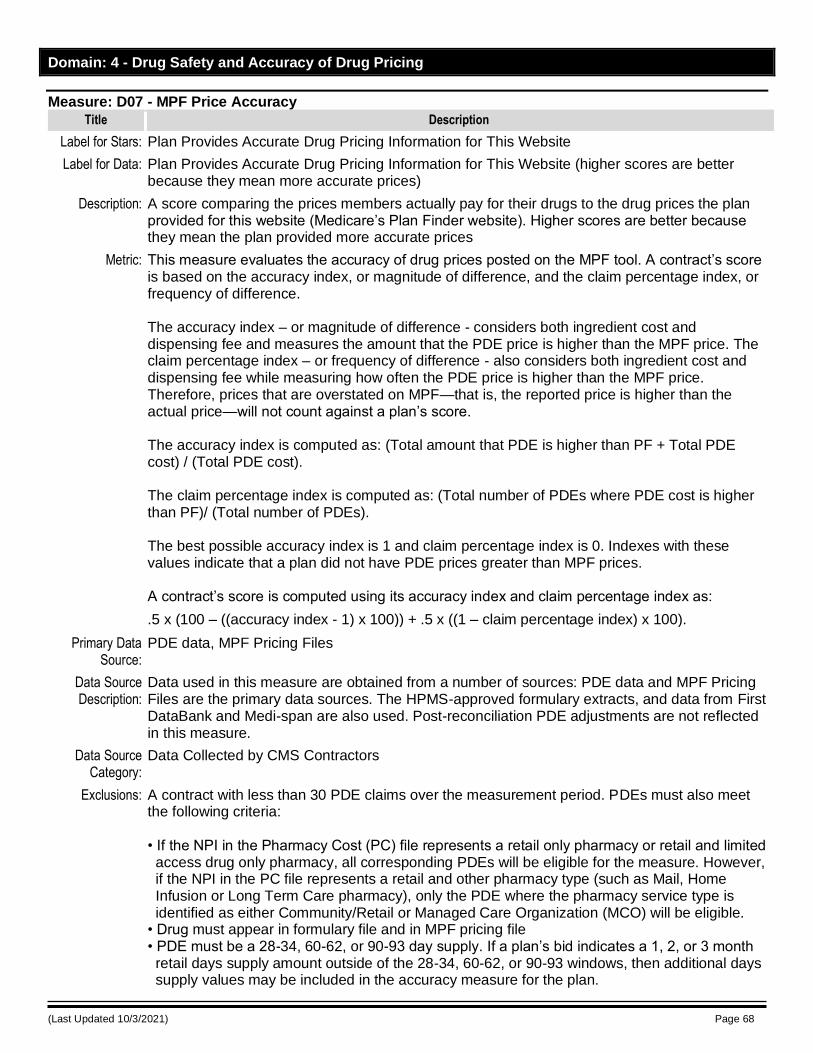
(Last Updated 10/3/2021) Page 68
Domain: 4 - Drug Safety and Accuracy of Drug Pricing
Measure: D07 - MPF Price Accuracy
Title Description
Label for Stars: Plan Provides Accurate Drug Pricing Information for This Website
Label for Data: Plan Provides Accurate Drug Pricing Information for This Website (higher scores are better because they mean more accurate prices)
Description: A score comparing the prices members actually pay for their drugs to the drug prices the plan provided for this website (Medicare’s Plan Finder website). Higher scores are better because they mean the plan provided more accurate prices
Metric: This measure evaluates the accuracy of drug prices posted on the MPF tool. A contract’s score is based on the accuracy index, or magnitude of difference, and the claim percentage index, or frequency of difference. The accuracy index – or magnitude of difference - considers both ingredient cost and dispensing fee and measures the amount that the PDE price is higher than the MPF price. The claim percentage index – or frequency of difference - also considers both ingredient cost and dispensing fee while measuring how often the PDE price is higher than the MPF price. Therefore, prices that are overstated on MPF—that is, the reported price is higher than the actual price—will not count against a plan’s score. The accuracy index is computed as: (Total amount that PDE is higher than PF + Total PDE cost) / (Total PDE cost). The claim percentage index is computed as: (Total number of PDEs where PDE cost is higher than PF)/ (Total number of PDEs). The best possible accuracy index is 1 and claim percentage index is 0. Indexes with these values indicate that a plan did not have PDE prices greater than MPF prices. A contract’s score is computed using its accuracy index and claim percentage index as:
.5 x (100 – ((accuracy index - 1) x 100)) + .5 x ((1 – claim percentage index) x 100).
Primary Data Source:
PDE data, MPF Pricing Files
Data Source Description:
Data used in this measure are obtained from a number of sources: PDE data and MPF Pricing Files are the primary data sources. The HPMS-approved formulary extracts, and data from First DataBank and Medi-span are also used. Post-reconciliation PDE adjustments are not reflected in this measure.
Data Source Category:
Data Collected by CMS Contractors
Exclusions: A contract with less than 30 PDE claims over the measurement period. PDEs must also meet the following criteria: • If the NPI in the Pharmacy Cost (PC) file represents a retail only pharmacy or retail and limited access drug only pharmacy, all corresponding PDEs will be eligible for the measure. However, if the NPI in the PC file represents a retail and other pharmacy type (such as Mail, Home Infusion or Long Term Care pharmacy), only the PDE where the pharmacy service type is identified as either Community/Retail or Managed Care Organization (MCO) will be eligible.
• Drug must appear in formulary file and in MPF pricing file • PDE must be a 28-34, 60-62, or 90-93 day supply. If a plan’s bid indicates a 1, 2, or 3 month retail days supply amount outside of the 28-34, 60-62, or 90-93 windows, then additional days supply values may be included in the accuracy measure for the plan.
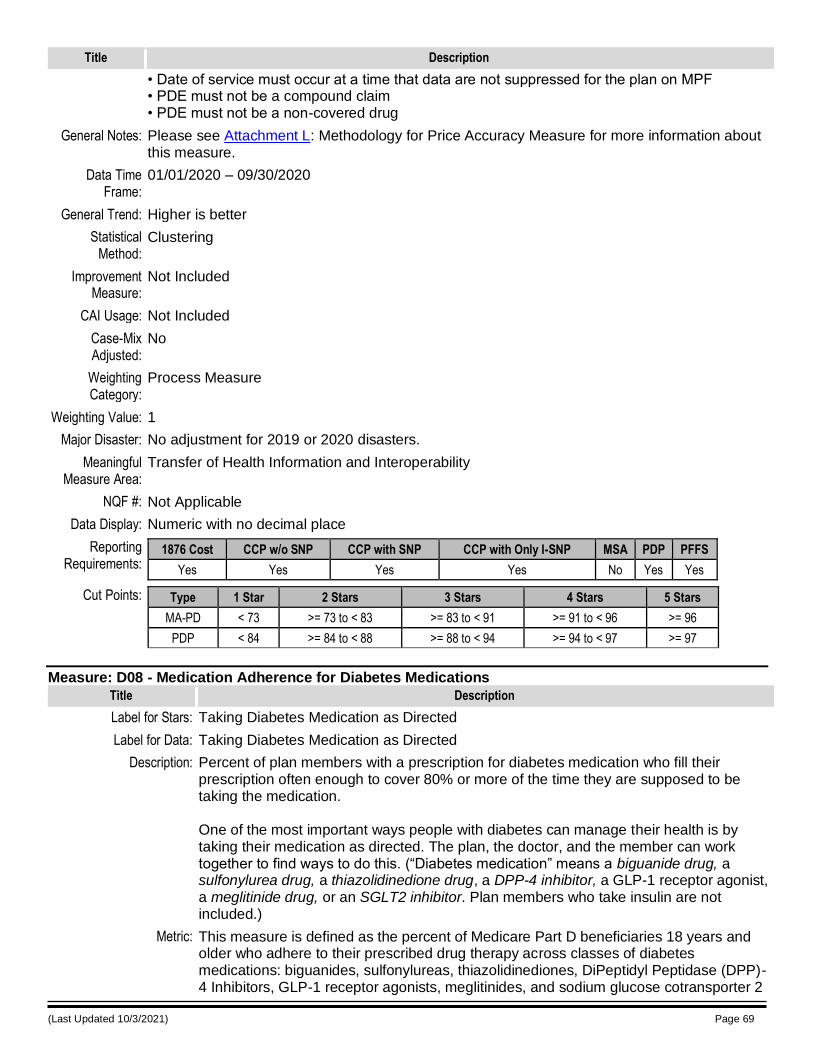
(Last Updated 10/3/2021) Page 69
Title Description
• Date of service must occur at a time that data are not suppressed for the plan on MPF • PDE must not be a compound claim • PDE must not be a non-covered drug
General Notes: Please see Attachment L: Methodology for Price Accuracy Measure for more information about this measure.
Data Time Frame:
01/01/2020 – 09/30/2020
General Trend: Higher is better
Statistical Method:
Clustering
Improvement Measure:
Not Included
CAI Usage: Not Included
Case-Mix Adjusted:
No
Weighting Category:
Process Measure
Weighting Value: 1
Major Disaster: No adjustment for 2019 or 2020 disasters.
Meaningful Measure Area:
Transfer of Health Information and Interoperability
NQF #: Not Applicable
Data Display: Numeric with no decimal place
Reporting Requirements:
1876 Cost CCP w/o SNP CCP with SNP CCP with Only I-SNP MSA PDP PFFS
Yes Yes Yes Yes No Yes Yes
Cut Points: Type 1 Star 2 Stars 3 Stars 4 Stars 5 Stars
MA-PD < 73 >= 73 to < 83 >= 83 to < 91 >= 91 to < 96 >= 96
PDP < 84 >= 84 to < 88 >= 88 to < 94 >= 94 to < 97 >= 97
Measure: D08 - Medication Adherence for Diabetes Medications
Title Description
Label for Stars: Taking Diabetes Medication as Directed
Label for Data: Taking Diabetes Medication as Directed
Description: Percent of plan members with a prescription for diabetes medication who fill their prescription often enough to cover 80% or more of the time they are supposed to be taking the medication. One of the most important ways people with diabetes can manage their health is by taking their medication as directed. The plan, the doctor, and the member can work together to find ways to do this. (“Diabetes medication” means a biguanide drug, a sulfonylurea drug, a thiazolidinedione drug, a DPP-4 inhibitor, a GLP-1 receptor agonist, a meglitinide drug, or an SGLT2 inhibitor. Plan members who take insulin are not included.)
Metric: This measure is defined as the percent of Medicare Part D beneficiaries 18 years and older who adhere to their prescribed drug therapy across classes of diabetes medications: biguanides, sulfonylureas, thiazolidinediones, DiPeptidyl Peptidase (DPP)-4 Inhibitors, GLP-1 receptor agonists, meglitinides, and sodium glucose cotransporter 2
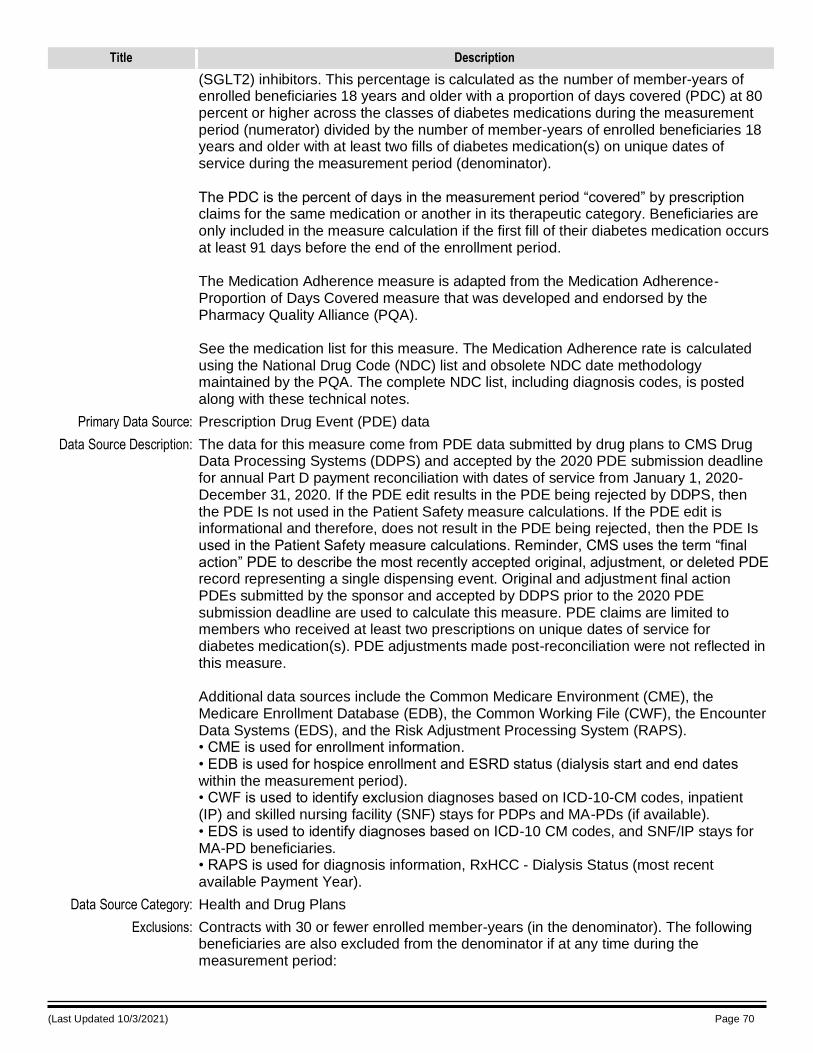
(Last Updated 10/3/2021) Page 70
Title Description
(SGLT2) inhibitors. This percentage is calculated as the number of member-years of enrolled beneficiaries 18 years and older with a proportion of days covered (PDC) at 80 percent or higher across the classes of diabetes medications during the measurement period (numerator) divided by the number of member-years of enrolled beneficiaries 18 years and older with at least two fills of diabetes medication(s) on unique dates of service during the measurement period (denominator). The PDC is the percent of days in the measurement period “covered” by prescription claims for the same medication or another in its therapeutic category. Beneficiaries are only included in the measure calculation if the first fill of their diabetes medication occurs at least 91 days before the end of the enrollment period. The Medication Adherence measure is adapted from the Medication Adherence-Proportion of Days Covered measure that was developed and endorsed by the Pharmacy Quality Alliance (PQA). See the medication list for this measure. The Medication Adherence rate is calculated using the National Drug Code (NDC) list and obsolete NDC date methodology maintained by the PQA. The complete NDC list, including diagnosis codes, is posted along with these technical notes.
Primary Data Source: Prescription Drug Event (PDE) data
Data Source Description: The data for this measure come from PDE data submitted by drug plans to CMS Drug Data Processing Systems (DDPS) and accepted by the 2020 PDE submission deadline for annual Part D payment reconciliation with dates of service from January 1, 2020-December 31, 2020. If the PDE edit results in the PDE being rejected by DDPS, then the PDE Is not used in the Patient Safety measure calculations. If the PDE edit is informational and therefore, does not result in the PDE being rejected, then the PDE Is used in the Patient Safety measure calculations. Reminder, CMS uses the term “final action” PDE to describe the most recently accepted original, adjustment, or deleted PDE record representing a single dispensing event. Original and adjustment final action PDEs submitted by the sponsor and accepted by DDPS prior to the 2020 PDE submission deadline are used to calculate this measure. PDE claims are limited to members who received at least two prescriptions on unique dates of service for diabetes medication(s). PDE adjustments made post-reconciliation were not reflected in this measure. Additional data sources include the Common Medicare Environment (CME), the Medicare Enrollment Database (EDB), the Common Working File (CWF), the Encounter Data Systems (EDS), and the Risk Adjustment Processing System (RAPS). • CME is used for enrollment information. • EDB is used for hospice enrollment and ESRD status (dialysis start and end dates within the measurement period). • CWF is used to identify exclusion diagnoses based on ICD-10-CM codes, inpatient (IP) and skilled nursing facility (SNF) stays for PDPs and MA-PDs (if available). • EDS is used to identify diagnoses based on ICD-10 CM codes, and SNF/IP stays for MA-PD beneficiaries. • RAPS is used for diagnosis information, RxHCC - Dialysis Status (most recent available Payment Year).
Data Source Category: Health and Drug Plans
Exclusions: Contracts with 30 or fewer enrolled member-years (in the denominator). The following beneficiaries are also excluded from the denominator if at any time during the measurement period:
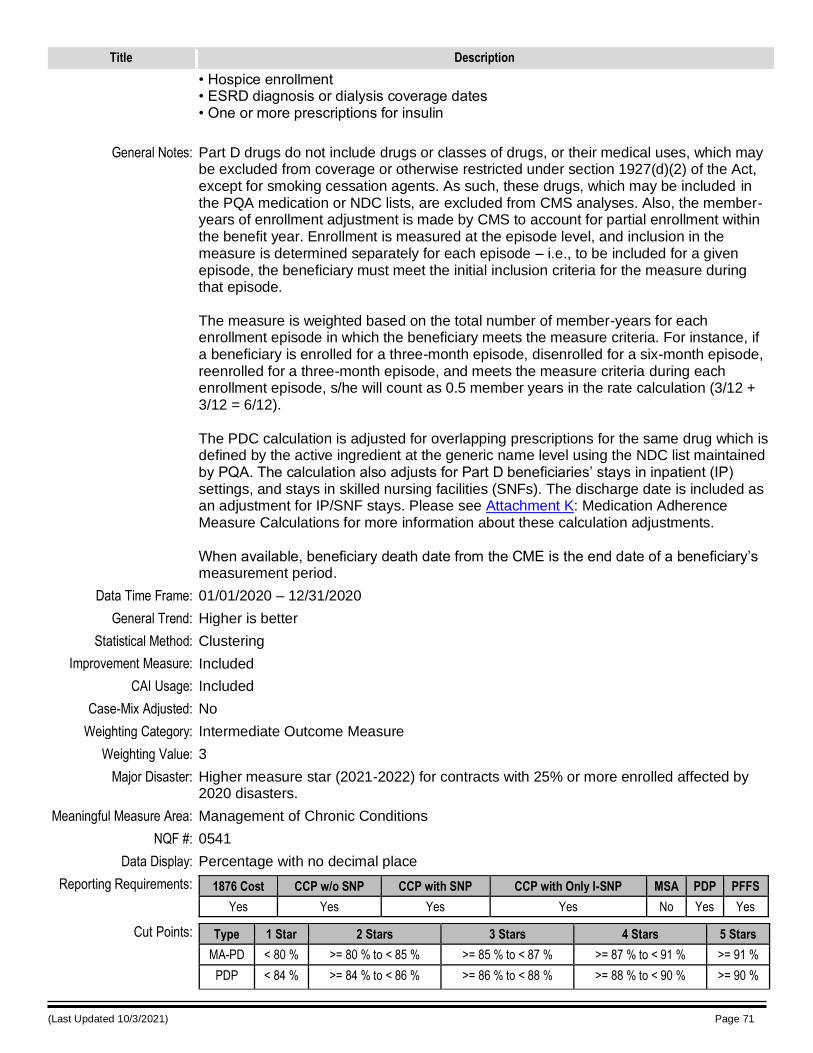
(Last Updated 10/3/2021) Page 71
Title Description
• Hospice enrollment • ESRD diagnosis or dialysis coverage dates • One or more prescriptions for insulin
General Notes: Part D drugs do not include drugs or classes of drugs, or their medical uses, which may be excluded from coverage or otherwise restricted under section 1927(d)(2) of the Act, except for smoking cessation agents. As such, these drugs, which may be included in the PQA medication or NDC lists, are excluded from CMS analyses. Also, the member-years of enrollment adjustment is made by CMS to account for partial enrollment within the benefit year. Enrollment is measured at the episode level, and inclusion in the measure is determined separately for each episode – i.e., to be included for a given episode, the beneficiary must meet the initial inclusion criteria for the measure during that episode. The measure is weighted based on the total number of member-years for each enrollment episode in which the beneficiary meets the measure criteria. For instance, if a beneficiary is enrolled for a three-month episode, disenrolled for a six-month episode, reenrolled for a three-month episode, and meets the measure criteria during each enrollment episode, s/he will count as 0.5 member years in the rate calculation (3/12 + 3/12 = 6/12). The PDC calculation is adjusted for overlapping prescriptions for the same drug which is defined by the active ingredient at the generic name level using the NDC list maintained by PQA. The calculation also adjusts for Part D beneficiaries’ stays in inpatient (IP) settings, and stays in skilled nursing facilities (SNFs). The discharge date is included as an adjustment for IP/SNF stays. Please see Attachment K: Medication Adherence Measure Calculations for more information about these calculation adjustments. When available, beneficiary death date from the CME is the end date of a beneficiary’s measurement period.
Data Time Frame: 01/01/2020 – 12/31/2020
General Trend: Higher is better
Statistical Method: Clustering
Improvement Measure: Included
CAI Usage: Included
Case-Mix Adjusted: No
Weighting Category: Intermediate Outcome Measure
Weighting Value: 3
Major Disaster: Higher measure star (2021-2022) for contracts with 25% or more enrolled affected by 2020 disasters.
Meaningful Measure Area: Management of Chronic Conditions
NQF #: 0541
Data Display: Percentage with no decimal place
Reporting Requirements: 1876 Cost CCP w/o SNP CCP with SNP CCP with Only I-SNP MSA PDP PFFS
Yes Yes Yes Yes No Yes Yes
Cut Points: Type 1 Star 2 Stars 3 Stars 4 Stars 5 Stars
MA-PD < 80 % >= 80 % to < 85 % >= 85 % to < 87 % >= 87 % to < 91 % >= 91 %
PDP < 84 % >= 84 % to < 86 % >= 86 % to < 88 % >= 88 % to < 90 % >= 90 %
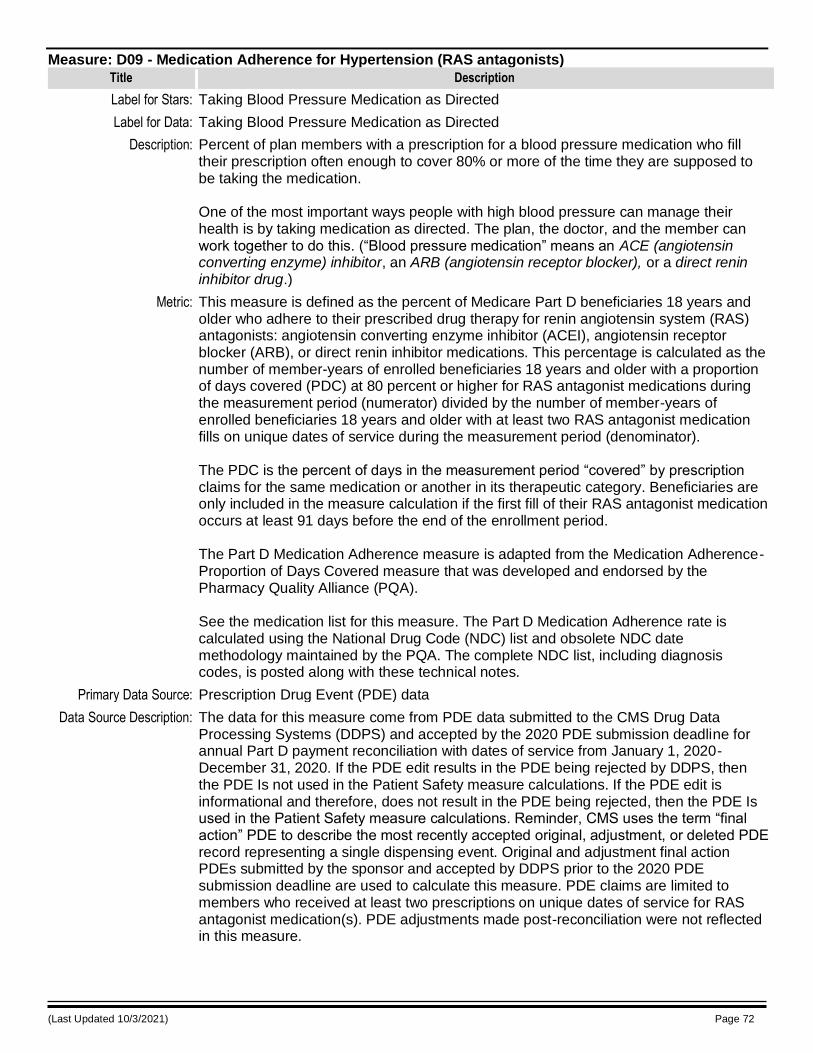
(Last Updated 10/3/2021) Page 72
Measure: D09 - Medication Adherence for Hypertension (RAS antagonists)
Title Description
Label for Stars: Taking Blood Pressure Medication as Directed
Label for Data: Taking Blood Pressure Medication as Directed
Description: Percent of plan members with a prescription for a blood pressure medication who fill their prescription often enough to cover 80% or more of the time they are supposed to be taking the medication. One of the most important ways people with high blood pressure can manage their health is by taking medication as directed. The plan, the doctor, and the member can work together to do this. (“Blood pressure medication” means an ACE (angiotensin converting enzyme) inhibitor, an ARB (angiotensin receptor blocker), or a direct renin inhibitor drug.)
Metric: This measure is defined as the percent of Medicare Part D beneficiaries 18 years and older who adhere to their prescribed drug therapy for renin angiotensin system (RAS) antagonists: angiotensin converting enzyme inhibitor (ACEI), angiotensin receptor blocker (ARB), or direct renin inhibitor medications. This percentage is calculated as the number of member-years of enrolled beneficiaries 18 years and older with a proportion of days covered (PDC) at 80 percent or higher for RAS antagonist medications during the measurement period (numerator) divided by the number of member-years of enrolled beneficiaries 18 years and older with at least two RAS antagonist medication fills on unique dates of service during the measurement period (denominator). The PDC is the percent of days in the measurement period “covered” by prescription claims for the same medication or another in its therapeutic category. Beneficiaries are only included in the measure calculation if the first fill of their RAS antagonist medication occurs at least 91 days before the end of the enrollment period. The Part D Medication Adherence measure is adapted from the Medication Adherence-Proportion of Days Covered measure that was developed and endorsed by the Pharmacy Quality Alliance (PQA). See the medication list for this measure. The Part D Medication Adherence rate is calculated using the National Drug Code (NDC) list and obsolete NDC date methodology maintained by the PQA. The complete NDC list, including diagnosis codes, is posted along with these technical notes.
Primary Data Source: Prescription Drug Event (PDE) data
Data Source Description: The data for this measure come from PDE data submitted to the CMS Drug Data Processing Systems (DDPS) and accepted by the 2020 PDE submission deadline for annual Part D payment reconciliation with dates of service from January 1, 2020-December 31, 2020. If the PDE edit results in the PDE being rejected by DDPS, then the PDE Is not used in the Patient Safety measure calculations. If the PDE edit is informational and therefore, does not result in the PDE being rejected, then the PDE Is used in the Patient Safety measure calculations. Reminder, CMS uses the term “final action” PDE to describe the most recently accepted original, adjustment, or deleted PDE record representing a single dispensing event. Original and adjustment final action PDEs submitted by the sponsor and accepted by DDPS prior to the 2020 PDE submission deadline are used to calculate this measure. PDE claims are limited to members who received at least two prescriptions on unique dates of service for RAS antagonist medication(s). PDE adjustments made post-reconciliation were not reflected in this measure.
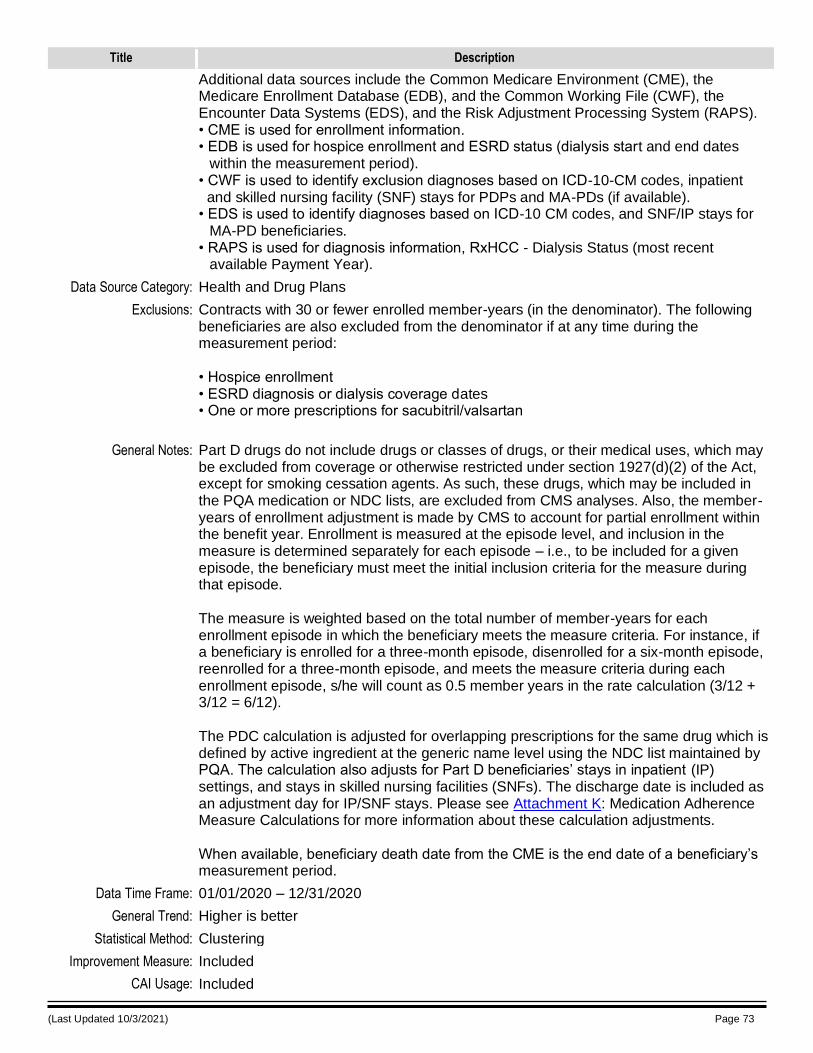
(Last Updated 10/3/2021) Page 73
Title Description
Additional data sources include the Common Medicare Environment (CME), the Medicare Enrollment Database (EDB), and the Common Working File (CWF), the Encounter Data Systems (EDS), and the Risk Adjustment Processing System (RAPS). • CME is used for enrollment information. • EDB is used for hospice enrollment and ESRD status (dialysis start and end dates
within the measurement period). • CWF is used to identify exclusion diagnoses based on ICD-10-CM codes, inpatient and skilled nursing facility (SNF) stays for PDPs and MA-PDs (if available). • EDS is used to identify diagnoses based on ICD-10 CM codes, and SNF/IP stays for
MA-PD beneficiaries. • RAPS is used for diagnosis information, RxHCC - Dialysis Status (most recent
available Payment Year).
Data Source Category: Health and Drug Plans
Exclusions: Contracts with 30 or fewer enrolled member-years (in the denominator). The following beneficiaries are also excluded from the denominator if at any time during the measurement period: • Hospice enrollment • ESRD diagnosis or dialysis coverage dates • One or more prescriptions for sacubitril/valsartan
General Notes: Part D drugs do not include drugs or classes of drugs, or their medical uses, which may be excluded from coverage or otherwise restricted under section 1927(d)(2) of the Act, except for smoking cessation agents. As such, these drugs, which may be included in the PQA medication or NDC lists, are excluded from CMS analyses. Also, the member-years of enrollment adjustment is made by CMS to account for partial enrollment within the benefit year. Enrollment is measured at the episode level, and inclusion in the measure is determined separately for each episode – i.e., to be included for a given episode, the beneficiary must meet the initial inclusion criteria for the measure during that episode. The measure is weighted based on the total number of member-years for each enrollment episode in which the beneficiary meets the measure criteria. For instance, if a beneficiary is enrolled for a three-month episode, disenrolled for a six-month episode, reenrolled for a three-month episode, and meets the measure criteria during each enrollment episode, s/he will count as 0.5 member years in the rate calculation (3/12 + 3/12 = 6/12). The PDC calculation is adjusted for overlapping prescriptions for the same drug which is defined by active ingredient at the generic name level using the NDC list maintained by PQA. The calculation also adjusts for Part D beneficiaries’ stays in inpatient (IP) settings, and stays in skilled nursing facilities (SNFs). The discharge date is included as an adjustment day for IP/SNF stays. Please see Attachment K: Medication Adherence Measure Calculations for more information about these calculation adjustments. When available, beneficiary death date from the CME is the end date of a beneficiary’s measurement period.
Data Time Frame: 01/01/2020 – 12/31/2020
General Trend: Higher is better
Statistical Method: Clustering
Improvement Measure: Included
CAI Usage: Included
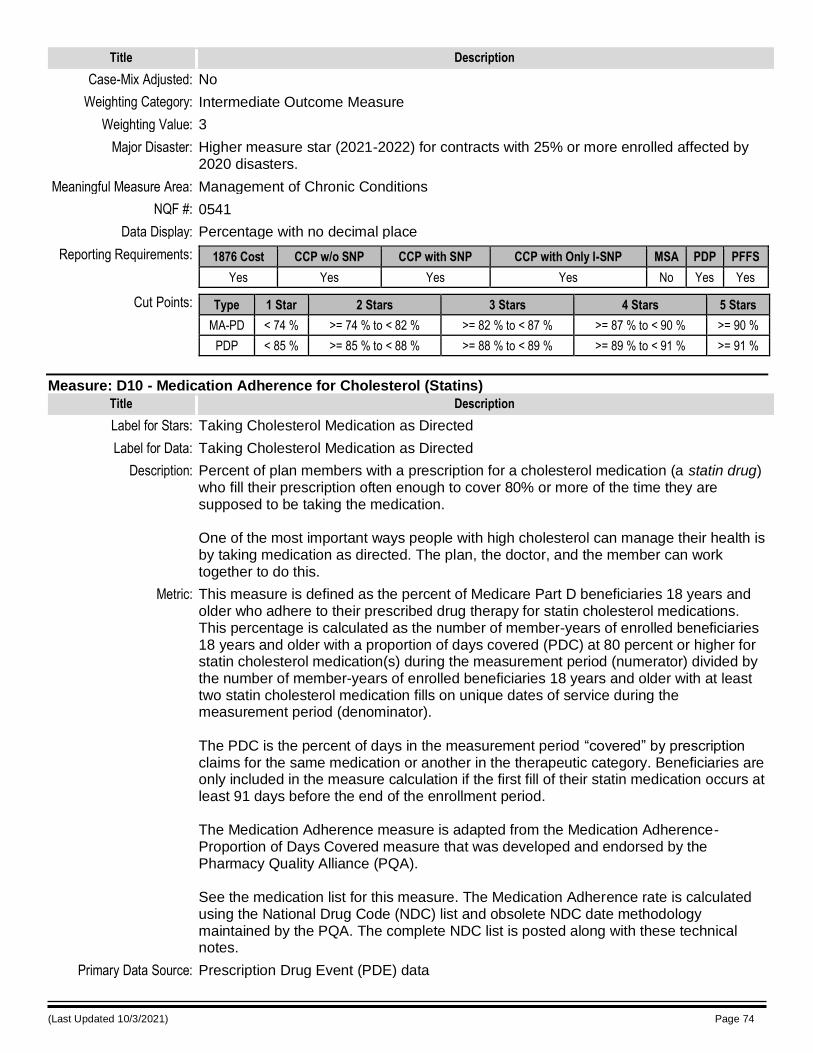
(Last Updated 10/3/2021) Page 74
Title Description
Case-Mix Adjusted: No
Weighting Category: Intermediate Outcome Measure
Weighting Value: 3
Major Disaster: Higher measure star (2021-2022) for contracts with 25% or more enrolled affected by 2020 disasters.
Meaningful Measure Area: Management of Chronic Conditions
NQF #: 0541
Data Display: Percentage with no decimal place
Reporting Requirements: 1876 Cost CCP w/o SNP CCP with SNP CCP with Only I-SNP MSA PDP PFFS
Yes Yes Yes Yes No Yes Yes
Cut Points: Type 1 Star 2 Stars 3 Stars 4 Stars 5 Stars
MA-PD < 74 % >= 74 % to < 82 % >= 82 % to < 87 % >= 87 % to < 90 % >= 90 %
PDP < 85 % >= 85 % to < 88 % >= 88 % to < 89 % >= 89 % to < 91 % >= 91 %
Measure: D10 - Medication Adherence for Cholesterol (Statins)
Title Description
Label for Stars: Taking Cholesterol Medication as Directed
Label for Data: Taking Cholesterol Medication as Directed
Description: Percent of plan members with a prescription for a cholesterol medication (a statin drug) who fill their prescription often enough to cover 80% or more of the time they are supposed to be taking the medication. One of the most important ways people with high cholesterol can manage their health is by taking medication as directed. The plan, the doctor, and the member can work together to do this.
Metric: This measure is defined as the percent of Medicare Part D beneficiaries 18 years and older who adhere to their prescribed drug therapy for statin cholesterol medications. This percentage is calculated as the number of member-years of enrolled beneficiaries 18 years and older with a proportion of days covered (PDC) at 80 percent or higher for statin cholesterol medication(s) during the measurement period (numerator) divided by the number of member-years of enrolled beneficiaries 18 years and older with at least two statin cholesterol medication fills on unique dates of service during the measurement period (denominator). The PDC is the percent of days in the measurement period “covered” by prescription claims for the same medication or another in the therapeutic category. Beneficiaries are only included in the measure calculation if the first fill of their statin medication occurs at least 91 days before the end of the enrollment period. The Medication Adherence measure is adapted from the Medication Adherence-Proportion of Days Covered measure that was developed and endorsed by the Pharmacy Quality Alliance (PQA). See the medication list for this measure. The Medication Adherence rate is calculated using the National Drug Code (NDC) list and obsolete NDC date methodology maintained by the PQA. The complete NDC list is posted along with these technical notes.
Primary Data Source: Prescription Drug Event (PDE) data
(Last Updated 10/3/2021) Page 75
Title Description
Data Source Description: The data for this measure come from PDE data submitted by drug plans to the CMS Drug Data Processing Systems (DDPS) and accepted by the 2020 PDE submission deadline for annual Part D payment reconciliation with dates of service from January 1, 2020-December 31, 2020. If the PDE edit results in the PDE being rejected by DDPS, then the PDE Is not used in the Patient Safety measure calculations. If the PDE edit is informational and therefore, does not result in the PDE being rejected, then the PDE Is used in the Patient Safety measure calculations. Reminder, CMS uses the term “final action” PDE to describe the most recently accepted original, adjustment, or deleted PDE record representing a single dispensing event. Original and adjustment final action PDEs submitted by the sponsor and accepted by DDPS prior to the 2020 PDE submission deadline are used to calculate this measure. PDE claims are limited to members who received at least two prescriptions on unique dates of service for statin medication. PDE adjustments made post-reconciliation were not reflected in this measure. Additional data sources include the Common Medicare Environment (CME), the Medicare Enrollment Database (EDB), the Common Working File (CWF), the Encounter Data Systems (EDS), and the Risk Adjustment Processing System (RAPS). • CME is used for enrollment information. • EDB is used for hospice enrollment and ESRD status (dialysis start and end dates
within the measurement period). • CWF is used to identify exclusion diagnoses based on ICD-10-CM codes, inpatient
(IP) and skilled nursing facility (SNF) stays for PDPs and MA-PDs (if available). • EDS is used to identify diagnoses based on ICD-10 CM codes, and SNF/IP stays for
MA-PD beneficiaries. • RAPS is used for diagnosis information, RxHCC - Dialysis Status (most recent
available Payment Year).
Data Source Category: Health and Drug Plans
Exclusions: Contracts with 30 or fewer enrolled member-years (in the denominator). The following beneficiaries are also excluded from the denominator if at any time during the measurement period: • Hospice enrollment • ESRD diagnosis or dialysis coverage dates
General Notes: Part D drugs do not include drugs or classes of drugs, or their medical uses, which may be excluded from coverage or otherwise restricted under section 1927(d)(2) of the Act, except for smoking cessation agents. As such, these drugs, which may be included in the PQA medication or NDC lists, are excluded from CMS analyses. Also, the member-years of enrollment adjustment is made by CMS to account for partial enrollment within the benefit year. Enrollment is measured at the episode level, and inclusion in the measure is determined separately for each episode – i.e., to be included for a given episode, the beneficiary must meet the initial inclusion criteria for the measure during that episode. The measure is weighted based on the total number of member-years for each enrollment episode in which the beneficiary meets the measure criteria. For instance, if a beneficiary is enrolled for a three-month episode, disenrolled for a six-month episode, reenrolled for a three-month episode, and meets the measure criteria during each enrollment episode, s/he will count as 0.5 member years in the rate calculation (3/12 + 3/12 = 6/12).
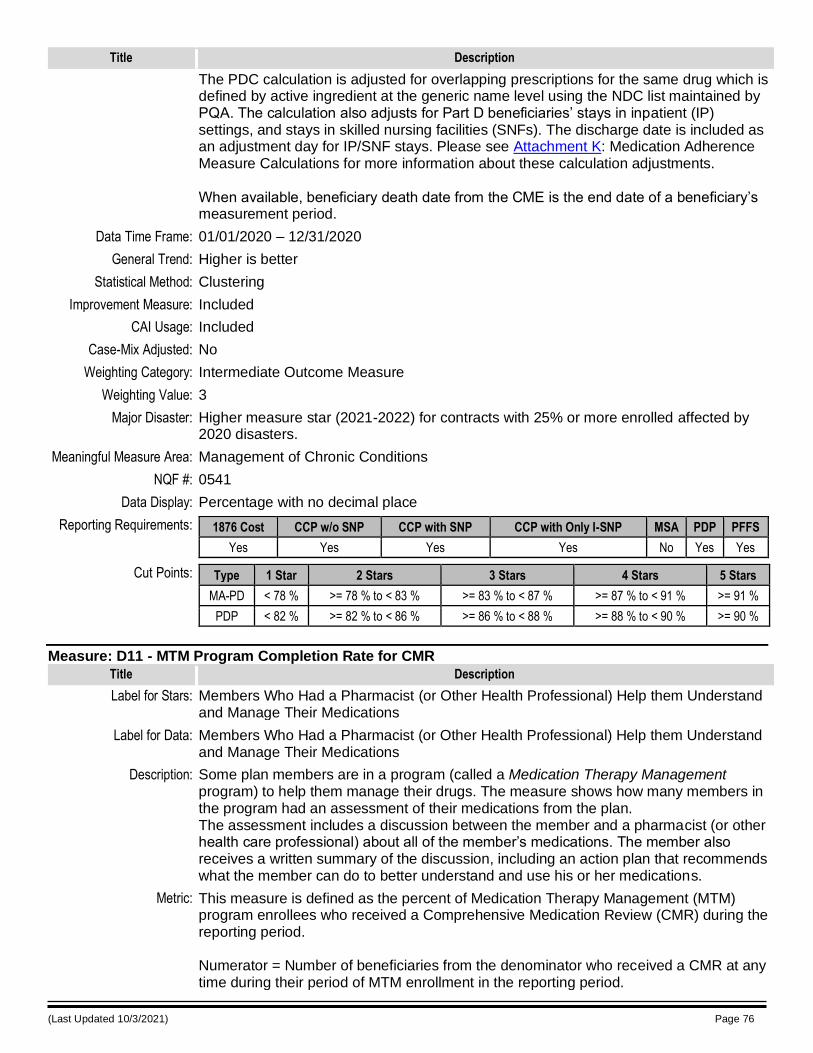
(Last Updated 10/3/2021) Page 76
Title Description
The PDC calculation is adjusted for overlapping prescriptions for the same drug which is defined by active ingredient at the generic name level using the NDC list maintained by PQA. The calculation also adjusts for Part D beneficiaries’ stays in inpatient (IP) settings, and stays in skilled nursing facilities (SNFs). The discharge date is included as an adjustment day for IP/SNF stays. Please see Attachment K: Medication Adherence Measure Calculations for more information about these calculation adjustments. When available, beneficiary death date from the CME is the end date of a beneficiary’s measurement period.
Data Time Frame: 01/01/2020 – 12/31/2020
General Trend: Higher is better
Statistical Method: Clustering
Improvement Measure: Included
CAI Usage: Included
Case-Mix Adjusted: No
Weighting Category: Intermediate Outcome Measure
Weighting Value: 3
Major Disaster: Higher measure star (2021-2022) for contracts with 25% or more enrolled affected by 2020 disasters.
Meaningful Measure Area: Management of Chronic Conditions
NQF #: 0541
Data Display: Percentage with no decimal place
Reporting Requirements: 1876 Cost CCP w/o SNP CCP with SNP CCP with Only I-SNP MSA PDP PFFS
Yes Yes Yes Yes No Yes Yes
Cut Points: Type 1 Star 2 Stars 3 Stars 4 Stars 5 Stars
MA-PD < 78 % >= 78 % to < 83 % >= 83 % to < 87 % >= 87 % to < 91 % >= 91 %
PDP < 82 % >= 82 % to < 86 % >= 86 % to < 88 % >= 88 % to < 90 % >= 90 %
Measure: D11 - MTM Program Completion Rate for CMR
Title Description
Label for Stars: Members Who Had a Pharmacist (or Other Health Professional) Help them Understand and Manage Their Medications
Label for Data: Members Who Had a Pharmacist (or Other Health Professional) Help them Understand and Manage Their Medications
Description: Some plan members are in a program (called a Medication Therapy Management program) to help them manage their drugs. The measure shows how many members in the program had an assessment of their medications from the plan. The assessment includes a discussion between the member and a pharmacist (or other health care professional) about all of the member’s medications. The member also receives a written summary of the discussion, including an action plan that recommends what the member can do to better understand and use his or her medications.
Metric: This measure is defined as the percent of Medication Therapy Management (MTM) program enrollees who received a Comprehensive Medication Review (CMR) during the reporting period. Numerator = Number of beneficiaries from the denominator who received a CMR at any time during their period of MTM enrollment in the reporting period.
(Last Updated 10/3/2021) Page 77
Title Description
Denominator = Number of beneficiaries who were at least 18 years or older as of the beginning of the reporting period and who were enrolled in the MTM program for at least 60 days during the reporting period. Only those beneficiaries who meet the contracts’ specified targeting criteria per CMS – Part D requirements pursuant to §423.153(d) of the regulations at any time in the reporting period are included in this measure. Beneficiaries who were in hospice at any point during the reporting period are excluded. Beneficiaries who were enrolled in the contract’s MTM program for less than 60 days at any time in the measurement year are included in the denominator and the numerator if they received a CMR within this timeframe. Beneficiaries are excluded from the measure calculation if they were enrolled in the contract’s MTM program for less than 60 days and did not receive a CMR within this timeframe. The date of enrollment is counted towards the 60 days but the opt-out date is not. A beneficiary’s MTM eligibility, receipt of CMRs, etc., is determined for each contract he/she was enrolled in during the measurement period. Similarly, a contract’s CMR completion rate is calculated based on each of its eligible MTM enrolled beneficiaries. For example, a beneficiary must meet the inclusion criteria for the contract to be included in the contract’s CMR rate. A beneficiary who is enrolled in two different contracts’ MTM programs for 30 days each is therefore excluded from both contracts’ CMR rates. The beneficiary is only included in the measure calculation for the contract(s) where they were enrolled at least 60 days. Beneficiaries with multiple records that contain varying information for the same contract are excluded from the measure calculation for that contract. Beneficiaries may be enrolled in MTM based on the contracts’ specified targeting criteria per CMS – Part D requirements and/or based on expanded, other plan-specific targeting criteria. Beneficiaries who were initially enrolled in MTM due to other plan-specific (expanded) criteria and then later met the contracts’ specified targeting criteria per CMS – Part D requirements at any time in the reporting period are included in this measure. In these cases, a CMR received after the date of MTM enrollment but before the date the beneficiary met the specified targeting criteria per CMS – Part D requirements are included.
Primary Data Source: Part D Plan Reporting
Data Source Description: Additional data sources used to calculate the measure: Medicare Enrollment Database (EDB) File. Data were reported by contracts to CMS per the Part D Reporting Requirements. Validation of these data was performed retrospectively during the 2021 Data Validation cycle.
Data Source Category: Health and Drug Plans
Exclusions: Contracts with an effective termination date on or before the deadline to submit data validation results to CMS (June 30, 2021) are excluded and listed as “No data available.” The current MTM requirements are waived for the PBPs approved to participate in the Enhanced MTM Model and data on participating PBPs must not be reported per the Part D Reporting Requirements under the current MTM program. This MTM data will instead be reported in accordance with model terms and conditions and not included in the measure calculation. MTM CMR rates are not provided for contracts that did not score at least 95% on data validation for the Medication Therapy Management Program reporting section or were not compliant with data validation standards/sub-standards for any of the following Medication Therapy Management Program data elements. We define a contract as
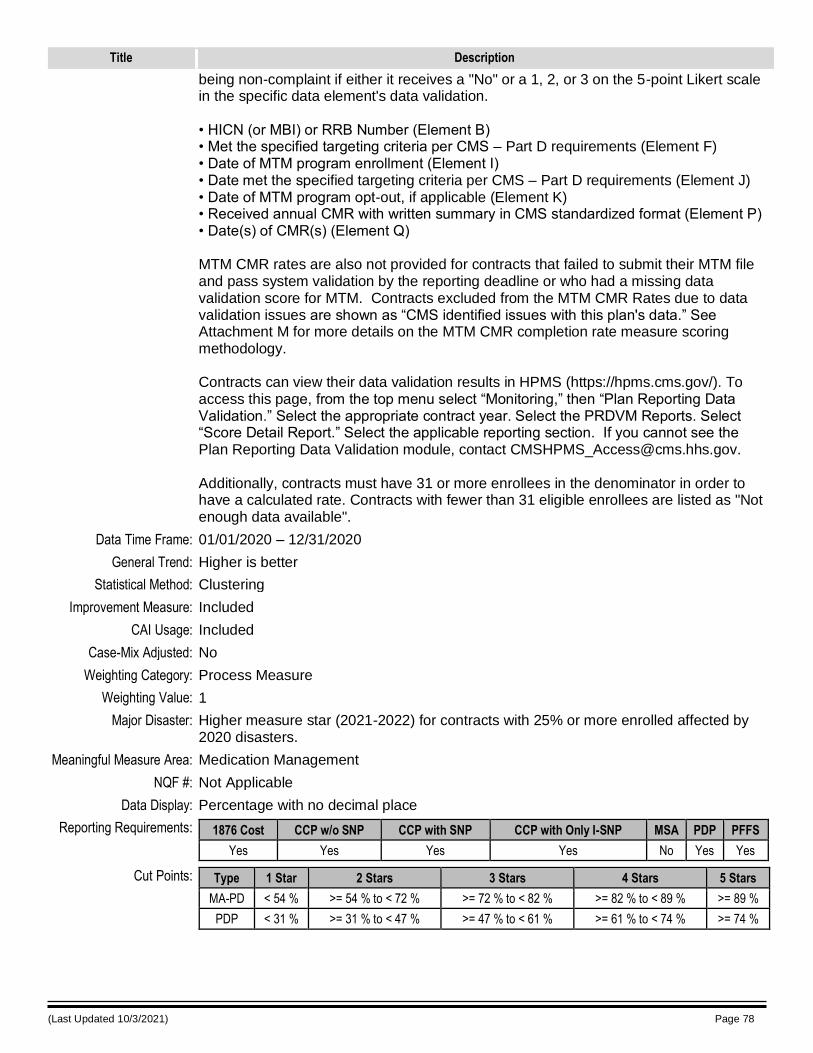
(Last Updated 10/3/2021) Page 78
Title Description
being non-complaint if either it receives a "No" or a 1, 2, or 3 on the 5-point Likert scale in the specific data element's data validation. • HICN (or MBI) or RRB Number (Element B) • Met the specified targeting criteria per CMS – Part D requirements (Element F) • Date of MTM program enrollment (Element I) • Date met the specified targeting criteria per CMS – Part D requirements (Element J) • Date of MTM program opt-out, if applicable (Element K) • Received annual CMR with written summary in CMS standardized format (Element P) • Date(s) of CMR(s) (Element Q) MTM CMR rates are also not provided for contracts that failed to submit their MTM file and pass system validation by the reporting deadline or who had a missing data validation score for MTM. Contracts excluded from the MTM CMR Rates due to data validation issues are shown as “CMS identified issues with this plan's data.” See Attachment M for more details on the MTM CMR completion rate measure scoring methodology. Contracts can view their data validation results in HPMS (https://hpms.cms.gov/). To access this page, from the top menu select “Monitoring,” then “Plan Reporting Data Validation.” Select the appropriate contract year. Select the PRDVM Reports. Select “Score Detail Report.” Select the applicable reporting section. If you cannot see the Plan Reporting Data Validation module, contact [email protected]. Additionally, contracts must have 31 or more enrollees in the denominator in order to have a calculated rate. Contracts with fewer than 31 eligible enrollees are listed as "Not enough data available".
Data Time Frame: 01/01/2020 – 12/31/2020
General Trend: Higher is better
Statistical Method: Clustering
Improvement Measure: Included
CAI Usage: Included
Case-Mix Adjusted: No
Weighting Category: Process Measure
Weighting Value: 1
Major Disaster: Higher measure star (2021-2022) for contracts with 25% or more enrolled affected by 2020 disasters.
Meaningful Measure Area: Medication Management
NQF #: Not Applicable
Data Display: Percentage with no decimal place
Reporting Requirements: 1876 Cost CCP w/o SNP CCP with SNP CCP with Only I-SNP MSA PDP PFFS
Yes Yes Yes Yes No Yes Yes
Cut Points: Type 1 Star 2 Stars 3 Stars 4 Stars 5 Stars
MA-PD < 54 % >= 54 % to < 72 % >= 72 % to < 82 % >= 82 % to < 89 % >= 89 %
PDP < 31 % >= 31 % to < 47 % >= 47 % to < 61 % >= 61 % to < 74 % >= 74 %
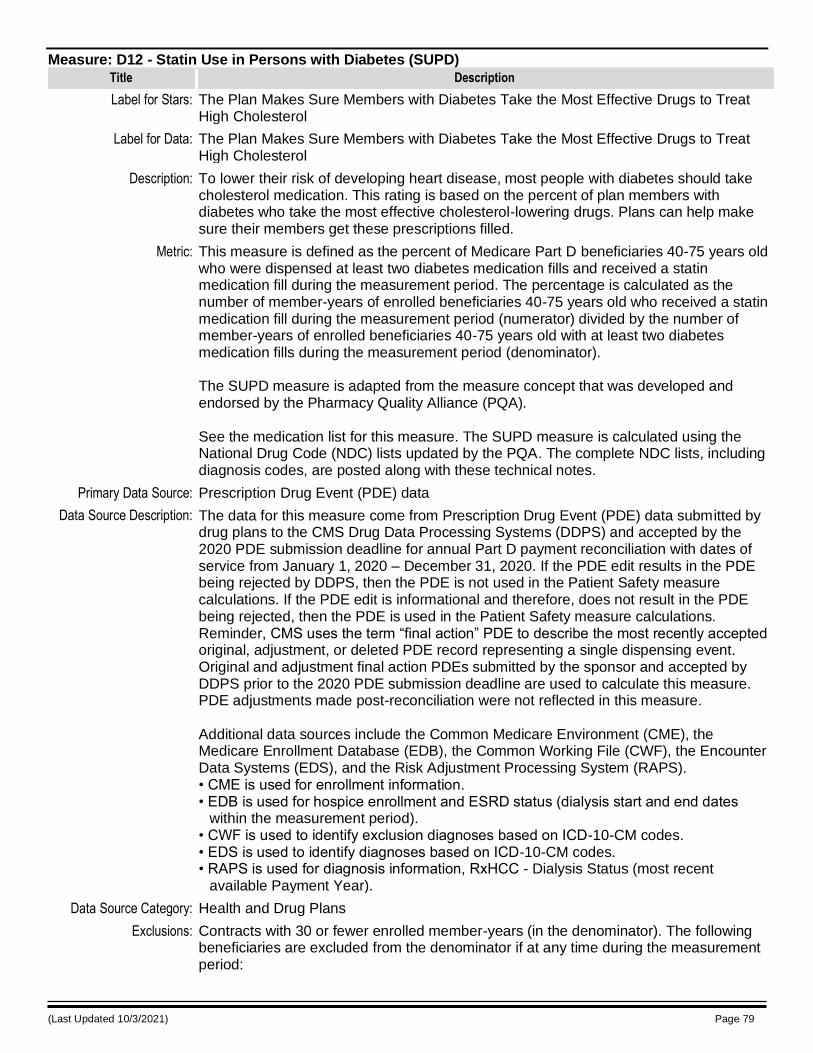
(Last Updated 10/3/2021) Page 79
Measure: D12 - Statin Use in Persons with Diabetes (SUPD)
Title Description
Label for Stars: The Plan Makes Sure Members with Diabetes Take the Most Effective Drugs to Treat High Cholesterol
Label for Data: The Plan Makes Sure Members with Diabetes Take the Most Effective Drugs to Treat High Cholesterol
Description: To lower their risk of developing heart disease, most people with diabetes should take cholesterol medication. This rating is based on the percent of plan members with diabetes who take the most effective cholesterol-lowering drugs. Plans can help make sure their members get these prescriptions filled.
Metric: This measure is defined as the percent of Medicare Part D beneficiaries 40-75 years old who were dispensed at least two diabetes medication fills and received a statin medication fill during the measurement period. The percentage is calculated as the number of member-years of enrolled beneficiaries 40-75 years old who received a statin medication fill during the measurement period (numerator) divided by the number of member-years of enrolled beneficiaries 40-75 years old with at least two diabetes medication fills during the measurement period (denominator). The SUPD measure is adapted from the measure concept that was developed and endorsed by the Pharmacy Quality Alliance (PQA). See the medication list for this measure. The SUPD measure is calculated using the National Drug Code (NDC) lists updated by the PQA. The complete NDC lists, including diagnosis codes, are posted along with these technical notes.
Primary Data Source: Prescription Drug Event (PDE) data
Data Source Description: The data for this measure come from Prescription Drug Event (PDE) data submitted by drug plans to the CMS Drug Data Processing Systems (DDPS) and accepted by the 2020 PDE submission deadline for annual Part D payment reconciliation with dates of service from January 1, 2020 – December 31, 2020. If the PDE edit results in the PDE being rejected by DDPS, then the PDE is not used in the Patient Safety measure calculations. If the PDE edit is informational and therefore, does not result in the PDE being rejected, then the PDE is used in the Patient Safety measure calculations. Reminder, CMS uses the term “final action” PDE to describe the most recently accepted original, adjustment, or deleted PDE record representing a single dispensing event. Original and adjustment final action PDEs submitted by the sponsor and accepted by DDPS prior to the 2020 PDE submission deadline are used to calculate this measure. PDE adjustments made post-reconciliation were not reflected in this measure. Additional data sources include the Common Medicare Environment (CME), the Medicare Enrollment Database (EDB), the Common Working File (CWF), the Encounter Data Systems (EDS), and the Risk Adjustment Processing System (RAPS). • CME is used for enrollment information. • EDB is used for hospice enrollment and ESRD status (dialysis start and end dates
within the measurement period). • CWF is used to identify exclusion diagnoses based on ICD-10-CM codes. • EDS is used to identify diagnoses based on ICD-10-CM codes. • RAPS is used for diagnosis information, RxHCC - Dialysis Status (most recent
available Payment Year).
Data Source Category: Health and Drug Plans
Exclusions: Contracts with 30 or fewer enrolled member-years (in the denominator). The following beneficiaries are excluded from the denominator if at any time during the measurement period:
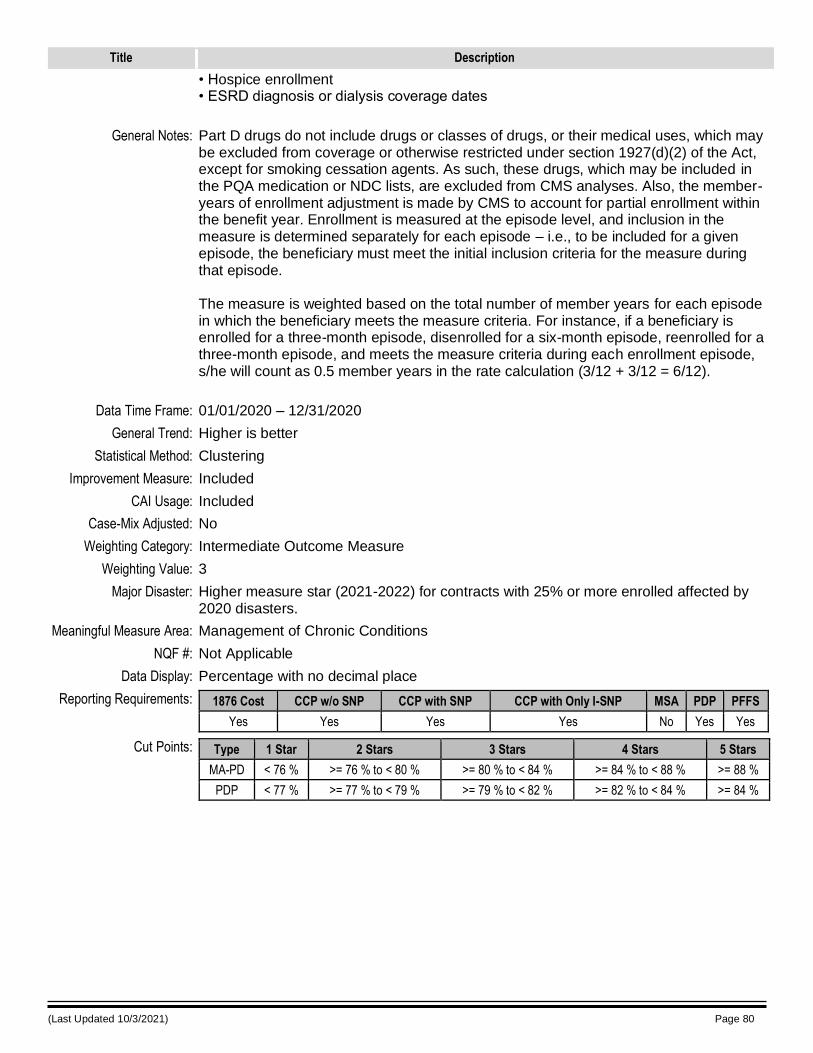
(Last Updated 10/3/2021) Page 80
Title Description
• Hospice enrollment • ESRD diagnosis or dialysis coverage dates
General Notes: Part D drugs do not include drugs or classes of drugs, or their medical uses, which may be excluded from coverage or otherwise restricted under section 1927(d)(2) of the Act, except for smoking cessation agents. As such, these drugs, which may be included in the PQA medication or NDC lists, are excluded from CMS analyses. Also, the member-years of enrollment adjustment is made by CMS to account for partial enrollment within the benefit year. Enrollment is measured at the episode level, and inclusion in the measure is determined separately for each episode – i.e., to be included for a given episode, the beneficiary must meet the initial inclusion criteria for the measure during that episode. The measure is weighted based on the total number of member years for each episode in which the beneficiary meets the measure criteria. For instance, if a beneficiary is enrolled for a three-month episode, disenrolled for a six-month episode, reenrolled for a three-month episode, and meets the measure criteria during each enrollment episode, s/he will count as 0.5 member years in the rate calculation (3/12 + 3/12 = 6/12).
Data Time Frame: 01/01/2020 – 12/31/2020
General Trend: Higher is better
Statistical Method: Clustering
Improvement Measure: Included
CAI Usage: Included
Case-Mix Adjusted: No
Weighting Category: Intermediate Outcome Measure
Weighting Value: 3
Major Disaster: Higher measure star (2021-2022) for contracts with 25% or more enrolled affected by 2020 disasters.
Meaningful Measure Area: Management of Chronic Conditions
NQF #: Not Applicable
Data Display: Percentage with no decimal place
Reporting Requirements: 1876 Cost CCP w/o SNP CCP with SNP CCP with Only I-SNP MSA PDP PFFS
Yes Yes Yes Yes No Yes Yes
Cut Points: Type 1 Star 2 Stars 3 Stars 4 Stars 5 Stars
MA-PD < 76 % >= 76 % to < 80 % >= 80 % to < 84 % >= 84 % to < 88 % >= 88 %
PDP < 77 % >= 77 % to < 79 % >= 79 % to < 82 % >= 82 % to < 84 % >= 84 %

(Last Updated 10/3/2021) Page 81
Attachment A: CAHPS Case-Mix Adjustment
CAHPS Case-Mix Adjustment
The CAHPS measures are case-mix adjusted to take into account the mix of enrollees. Case-mix variables include dual eligibility and education among other variables. The table below includes the case-mix variables and shows the case-mix coefficients for each of the CAHPS measures included in the Star Ratings. The coefficients indicate how much higher or lower people with a given characteristic tend to respond compared to otherwise similar people with the baseline value for that characteristic, on the original scale of the item or composite, as presented in plan reports.
For example, for the measure "Getting Appointments and Care Quickly," the model coefficient for "age 75-79" is 0.0165, indicating that respondents in that age range tend to score their plans 0.0165 points higher than otherwise similar people in the 70-74 age range (the baseline or reference category). Similarly, Medicaid dual eligibles tend to respond 0.0333 points lower on this item than otherwise similar non-duals. Contracts with higher proportions of beneficiaries who are in the 75-79 age range will be adjusted downward on this measure to compensate for the positive response tendency of their respondents. Similarly, contracts with higher proportions of respondents who are Medicaid dual eligibles will be adjusted upward on this measure to compensate for their respondents’ negative response tendency. The case-mix patterns are not always consistent across measures. Missing case-mix adjustors are imputed as the contract mean.
The composites consist of multiple items, each of which is adjusted separately before combining the adjusted scores into a composite score. In the tables we report the average of the model coefficients for these several items, for each of the categories (rows) of the table, as a summary of the adjustment for the composite. For more detailed information on the application of CAHPS case-mix adjustment, including item-level coefficients, please review the materials at https://ma-pdpcahps.org/en/scoring-and-star-ratings/.
Table A-1: Coefficients of Part C CAHPS Measures
Predictor C03:
Annual Flu Vaccine
C17: Getting Needed Care
(Comp)
C18: Getting Appointments and
Care Quickly (Comp)
C19: Customer Service (Comp)
C20: Rating of Health Care
Quality
C21: Rating of Health
Plan
C22: Care Coordination
(Comp)
Age: 64 or under N/A 0.0209 0.0072 0.0033 0.0399 -0.0590 0.0132
Age: 65 – 69 N/A -0.0147 -0.0137 0.0067 -0.0263 -0.0692 0.0011
Age: 75 – 79 N/A 0.0076 0.0165 0.0110 0.0592 0.0730 0.0011
Age: 80 – 84 N/A 0.0134 0.0135 -0.0050 -0.0280 0.0499 -0.0110
Age: 85 and older N/A -0.0078 0.0052 -0.0163 0.0455 0.0591 -0.0471
Less than an 8th grade education N/A -0.0716 -0.0389 -0.0255 -0.0937 0.0136 -0.0046
Some high school N/A -0.0204 -0.0222 -0.0211 -0.0177 0.0733 0.0057
Some college N/A -0.0244 -0.0073 -0.0239 -0.0923 -0.1452 -0.0044
College graduate N/A -0.0581 -0.0202 -0.0398 -0.1676 -0.2480 -0.0336
More than a bachelor's degree N/A -0.0534 -0.0124 -0.0759 -0.1926 -0.2843 -0.0246
General health rating: excellent N/A 0.0745 0.0836 0.0515 0.3707 0.2565 0.0189
General health rating: very good N/A 0.0655 0.0581 0.0117 0.1985 0.1354 0.0263
General health rating: fair N/A -0.0511 -0.0461 -0.0352 -0.2114 -0.1479 -0.0449
General health rating: poor N/A -0.0793 -0.0669 -0.0413 -0.3875 -0.2832 -0.0692
Mental health rating: excellent N/A 0.1556 0.1060 0.0756 0.4725 0.3643 0.1312
Mental health rating: very good N/A 0.0692 0.0458 0.0363 0.2282 0.1808 0.0676
Mental health rating: fair N/A -0.0537 -0.0168 -0.0234 -0.1744 -0.0721 -0.0344
Mental health rating: poor N/A -0.1263 -0.0556 -0.0526 -0.3999 -0.3171 -0.0928
Proxy helped N/A -0.0007 -0.0511 -0.0431 -0.0412 0.0037 0.0317
Proxy answered N/A 0.0327 0.0479 -0.0342 0.1098 -0.0276 0.0589
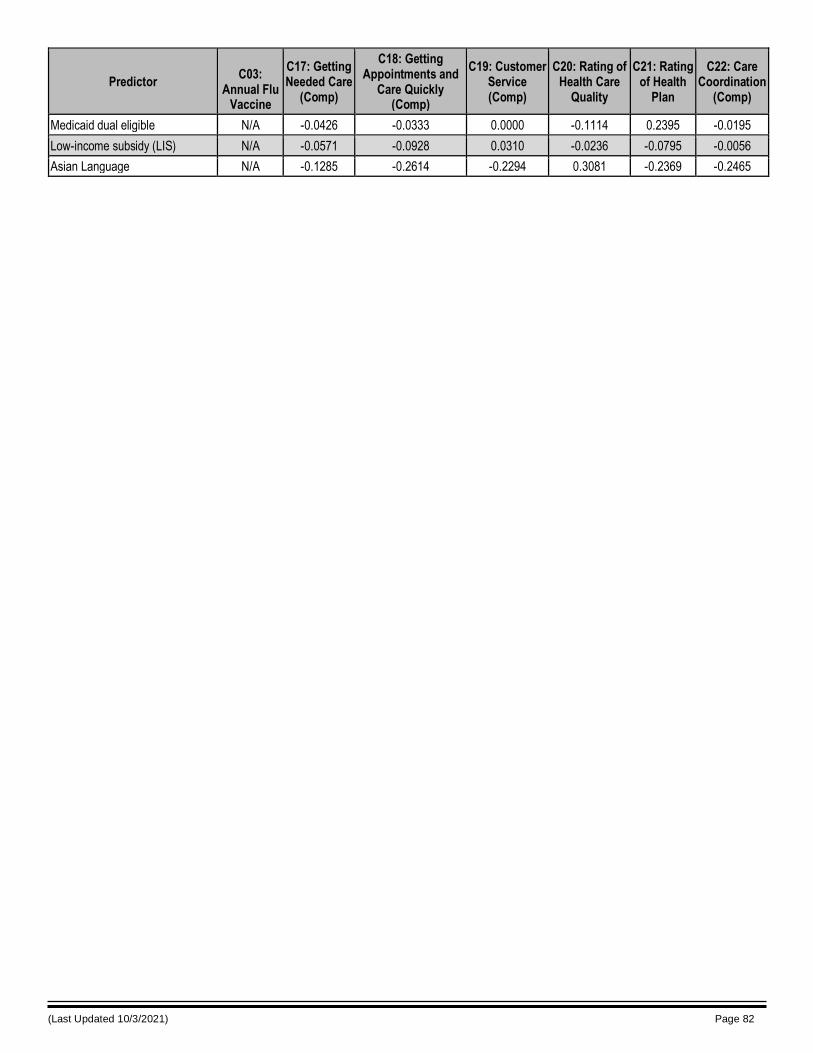
(Last Updated 10/3/2021) Page 82
Predictor C03:
Annual Flu Vaccine
C17: Getting Needed Care
(Comp)
C18: Getting Appointments and
Care Quickly (Comp)
C19: Customer Service (Comp)
C20: Rating of Health Care
Quality
C21: Rating of Health
Plan
C22: Care Coordination
(Comp)
Medicaid dual eligible N/A -0.0426 -0.0333 0.0000 -0.1114 0.2395 -0.0195
Low-income subsidy (LIS) N/A -0.0571 -0.0928 0.0310 -0.0236 -0.0795 -0.0056
Asian Language N/A -0.1285 -0.2614 -0.2294 0.3081 -0.2369 -0.2465
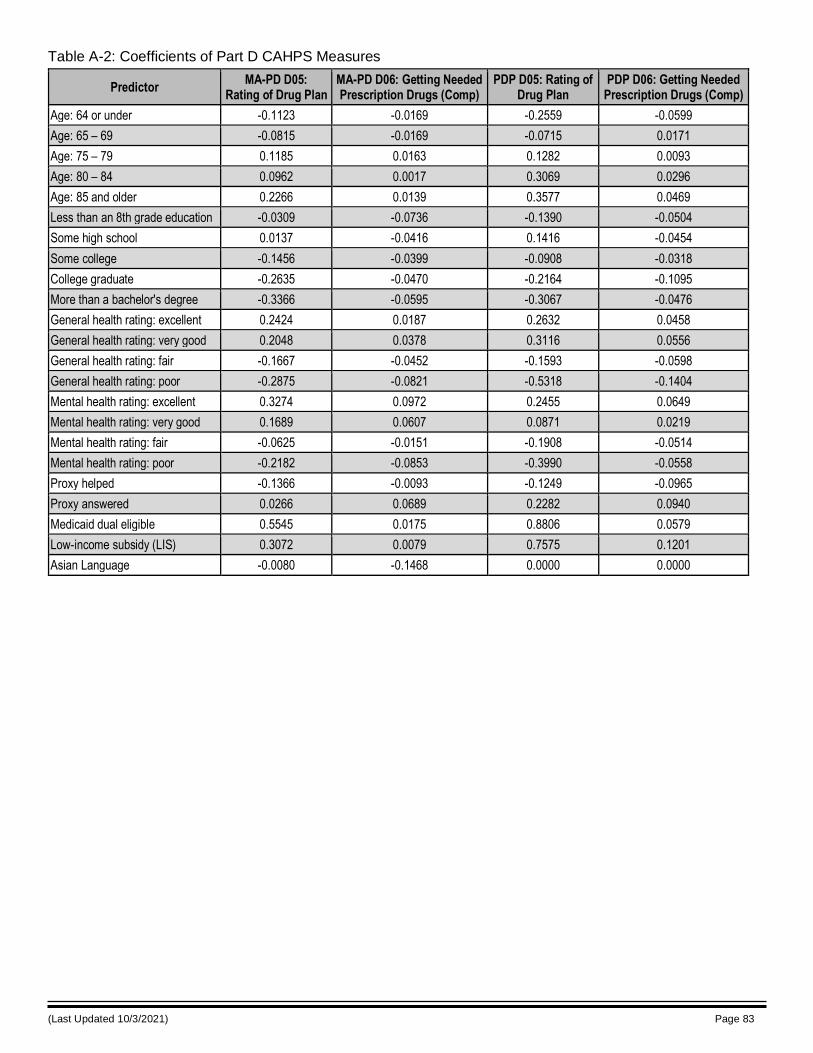
(Last Updated 10/3/2021) Page 83
Table A-2: Coefficients of Part D CAHPS Measures
Predictor MA-PD D05:
Rating of Drug Plan MA-PD D06: Getting Needed Prescription Drugs (Comp)
PDP D05: Rating of Drug Plan
PDP D06: Getting Needed Prescription Drugs (Comp)
Age: 64 or under -0.1123 -0.0169 -0.2559 -0.0599
Age: 65 – 69 -0.0815 -0.0169 -0.0715 0.0171
Age: 75 – 79 0.1185 0.0163 0.1282 0.0093
Age: 80 – 84 0.0962 0.0017 0.3069 0.0296
Age: 85 and older 0.2266 0.0139 0.3577 0.0469
Less than an 8th grade education -0.0309 -0.0736 -0.1390 -0.0504
Some high school 0.0137 -0.0416 0.1416 -0.0454
Some college -0.1456 -0.0399 -0.0908 -0.0318
College graduate -0.2635 -0.0470 -0.2164 -0.1095
More than a bachelor's degree -0.3366 -0.0595 -0.3067 -0.0476
General health rating: excellent 0.2424 0.0187 0.2632 0.0458
General health rating: very good 0.2048 0.0378 0.3116 0.0556
General health rating: fair -0.1667 -0.0452 -0.1593 -0.0598
General health rating: poor -0.2875 -0.0821 -0.5318 -0.1404
Mental health rating: excellent 0.3274 0.0972 0.2455 0.0649
Mental health rating: very good 0.1689 0.0607 0.0871 0.0219
Mental health rating: fair -0.0625 -0.0151 -0.1908 -0.0514
Mental health rating: poor -0.2182 -0.0853 -0.3990 -0.0558
Proxy helped -0.1366 -0.0093 -0.1249 -0.0965
Proxy answered 0.0266 0.0689 0.2282 0.0940
Medicaid dual eligible 0.5545 0.0175 0.8806 0.0579
Low-income subsidy (LIS) 0.3072 0.0079 0.7575 0.1201
Asian Language -0.0080 -0.1468 0.0000 0.0000
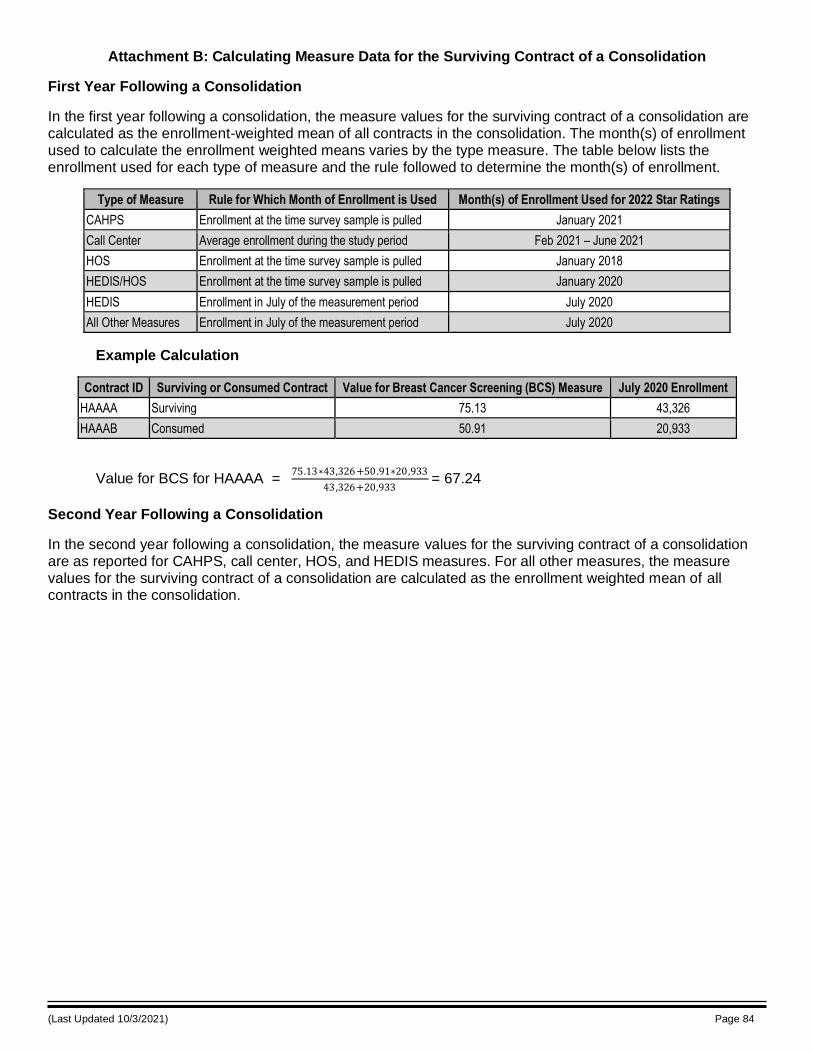
(Last Updated 10/3/2021) Page 84
Attachment B: Calculating Measure Data for the Surviving Contract of a Consolidation
First Year Following a Consolidation
In the first year following a consolidation, the measure values for the surviving contract of a consolidation are calculated as the enrollment-weighted mean of all contracts in the consolidation. The month(s) of enrollment used to calculate the enrollment weighted means varies by the type measure. The table below lists the enrollment used for each type of measure and the rule followed to determine the month(s) of enrollment.
Type of Measure Rule for Which Month of Enrollment is Used Month(s) of Enrollment Used for 2022 Star Ratings
CAHPS Enrollment at the time survey sample is pulled January 2021
Call Center Average enrollment during the study period Feb 2021 – June 2021
HOS Enrollment at the time survey sample is pulled January 2018
HEDIS/HOS Enrollment at the time survey sample is pulled January 2020
HEDIS Enrollment in July of the measurement period July 2020
All Other Measures Enrollment in July of the measurement period July 2020
Example Calculation
Contract ID Surviving or Consumed Contract Value for Breast Cancer Screening (BCS) Measure July 2020 Enrollment
HAAAA Surviving 75.13 43,326
HAAAB Consumed 50.91 20,933
Value for BCS for HAAAA =
75.13∗43,326+50.91∗20,933
43,326+20,933 = 67.24
Second Year Following a Consolidation
In the second year following a consolidation, the measure values for the surviving contract of a consolidation are as reported for CAHPS, call center, HOS, and HEDIS measures. For all other measures, the measure values for the surviving contract of a consolidation are calculated as the enrollment weighted mean of all contracts in the consolidation.
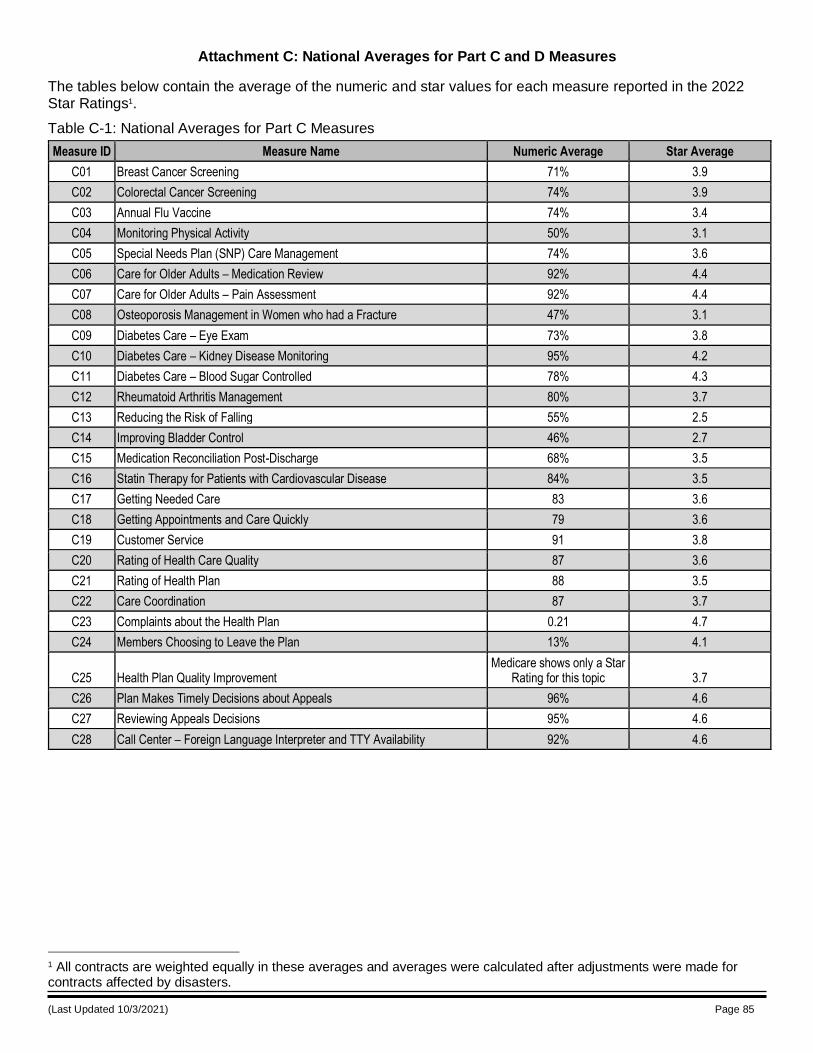
(Last Updated 10/3/2021) Page 85
Attachment C: National Averages for Part C and D Measures
The tables below contain the average of the numeric and star values for each measure reported in the 2022 Star Ratings1.
1 All contracts are weighted equally in these averages and averages were calculated after adjustments were made for contracts affected by disasters.
Table C-1: National Averages for Part C Measures
Measure ID Measure Name Numeric Average Star Average
C01 Breast Cancer Screening 71% 3.9
C02 Colorectal Cancer Screening 74% 3.9
C03 Annual Flu Vaccine 74% 3.4
C04 Monitoring Physical Activity 50% 3.1
C05 Special Needs Plan (SNP) Care Management 74% 3.6
C06 Care for Older Adults – Medication Review 92% 4.4
C07 Care for Older Adults – Pain Assessment 92% 4.4
C08 Osteoporosis Management in Women who had a Fracture 47% 3.1
C09 Diabetes Care – Eye Exam 73% 3.8
C10 Diabetes Care – Kidney Disease Monitoring 95% 4.2
C11 Diabetes Care – Blood Sugar Controlled 78% 4.3
C12 Rheumatoid Arthritis Management 80% 3.7
C13 Reducing the Risk of Falling 55% 2.5
C14 Improving Bladder Control 46% 2.7
C15 Medication Reconciliation Post-Discharge 68% 3.5
C16 Statin Therapy for Patients with Cardiovascular Disease 84% 3.5
C17 Getting Needed Care 83 3.6
C18 Getting Appointments and Care Quickly 79 3.6
C19 Customer Service 91 3.8
C20 Rating of Health Care Quality 87 3.6
C21 Rating of Health Plan 88 3.5
C22 Care Coordination 87 3.7
C23 Complaints about the Health Plan 0.21 4.7
C24 Members Choosing to Leave the Plan 13% 4.1
C25 Health Plan Quality Improvement Medicare shows only a Star
Rating for this topic 3.7
C26 Plan Makes Timely Decisions about Appeals 96% 4.6
C27 Reviewing Appeals Decisions 95% 4.6
C28 Call Center – Foreign Language Interpreter and TTY Availability 92% 4.6
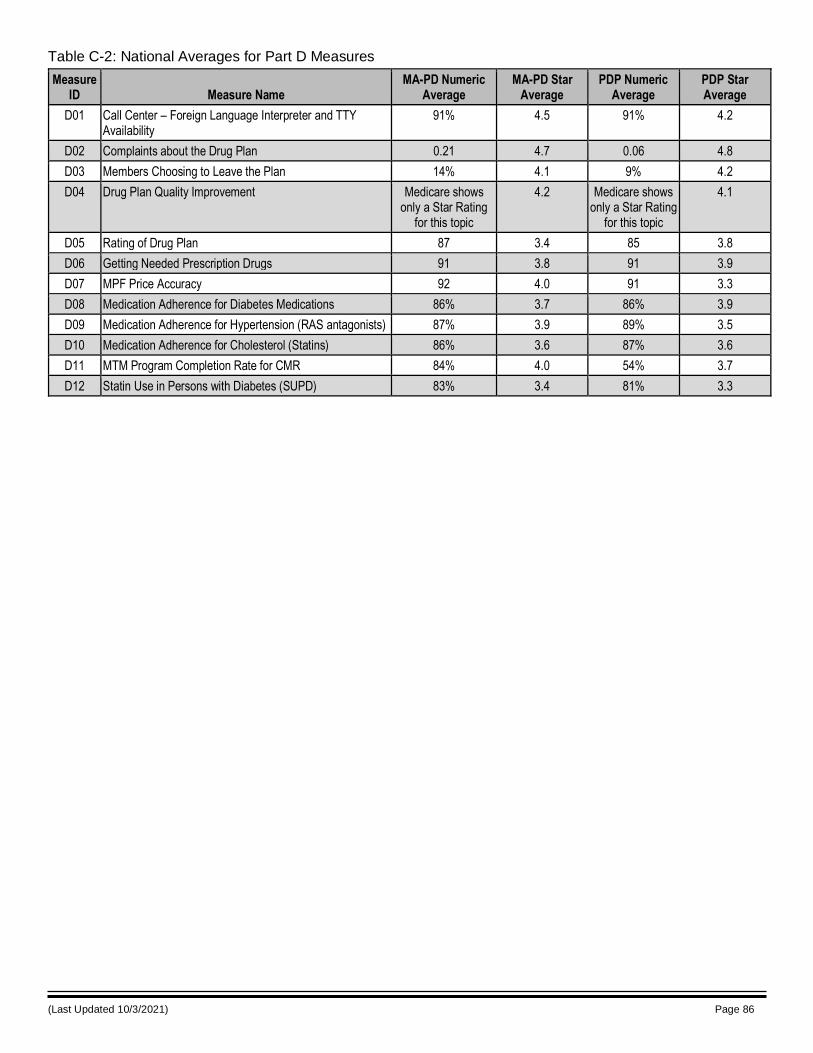
(Last Updated 10/3/2021) Page 86
Table C-2: National Averages for Part D Measures
Measure ID Measure Name
MA-PD Numeric Average
MA-PD Star Average
PDP Numeric Average
PDP Star Average
D01 Call Center – Foreign Language Interpreter and TTY Availability
91% 4.5 91% 4.2
D02 Complaints about the Drug Plan 0.21 4.7 0.06 4.8
D03 Members Choosing to Leave the Plan 14% 4.1 9% 4.2
D04 Drug Plan Quality Improvement Medicare shows only a Star Rating
for this topic
4.2 Medicare shows only a Star Rating
for this topic
4.1
D05 Rating of Drug Plan 87 3.4 85 3.8
D06 Getting Needed Prescription Drugs 91 3.8 91 3.9
D07 MPF Price Accuracy 92 4.0 91 3.3
D08 Medication Adherence for Diabetes Medications 86% 3.7 86% 3.9
D09 Medication Adherence for Hypertension (RAS antagonists) 87% 3.9 89% 3.5
D10 Medication Adherence for Cholesterol (Statins) 86% 3.6 87% 3.6
D11 MTM Program Completion Rate for CMR 84% 4.0 54% 3.7
D12 Statin Use in Persons with Diabetes (SUPD) 83% 3.4 81% 3.3
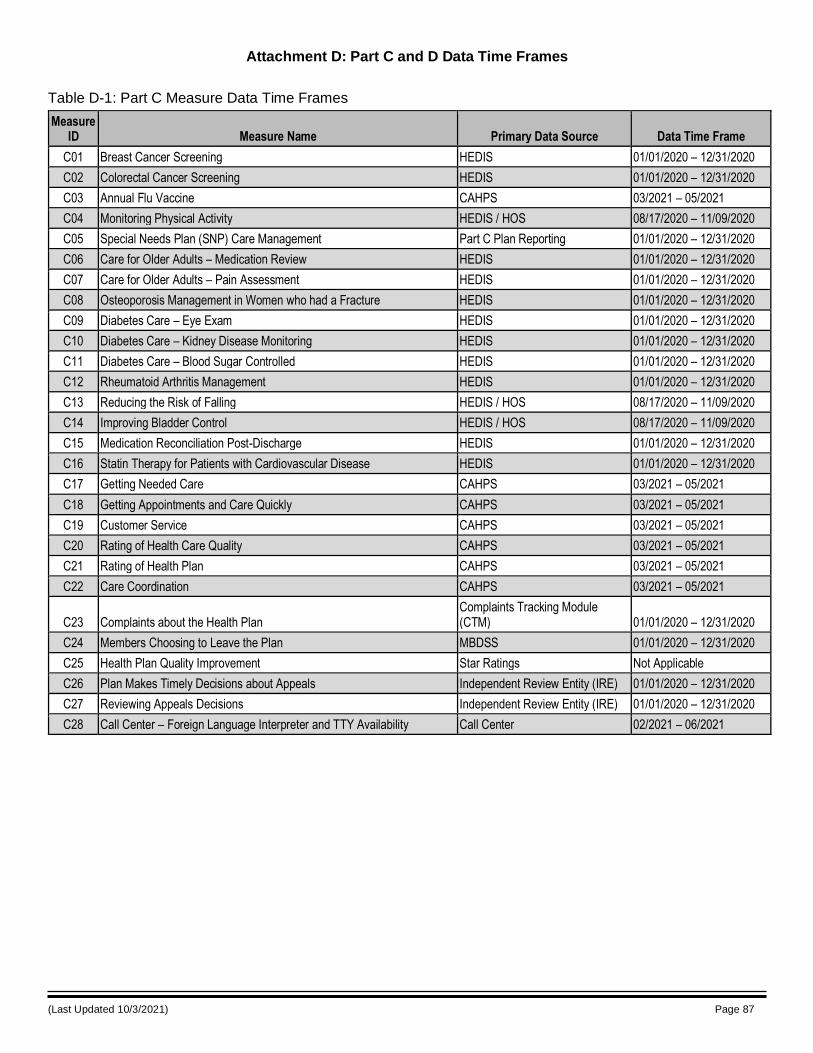
(Last Updated 10/3/2021) Page 87
Attachment D: Part C and D Data Time Frames
Table D-1: Part C Measure Data Time Frames
Measure ID Measure Name Primary Data Source Data Time Frame
C01 Breast Cancer Screening HEDIS 01/01/2020 – 12/31/2020
C02 Colorectal Cancer Screening HEDIS 01/01/2020 – 12/31/2020
C03 Annual Flu Vaccine CAHPS 03/2021 – 05/2021
C04 Monitoring Physical Activity HEDIS / HOS 08/17/2020 – 11/09/2020
C05 Special Needs Plan (SNP) Care Management Part C Plan Reporting 01/01/2020 – 12/31/2020
C06 Care for Older Adults – Medication Review HEDIS 01/01/2020 – 12/31/2020
C07 Care for Older Adults – Pain Assessment HEDIS 01/01/2020 – 12/31/2020
C08 Osteoporosis Management in Women who had a Fracture HEDIS 01/01/2020 – 12/31/2020
C09 Diabetes Care – Eye Exam HEDIS 01/01/2020 – 12/31/2020
C10 Diabetes Care – Kidney Disease Monitoring HEDIS 01/01/2020 – 12/31/2020
C11 Diabetes Care – Blood Sugar Controlled HEDIS 01/01/2020 – 12/31/2020
C12 Rheumatoid Arthritis Management HEDIS 01/01/2020 – 12/31/2020
C13 Reducing the Risk of Falling HEDIS / HOS 08/17/2020 – 11/09/2020
C14 Improving Bladder Control HEDIS / HOS 08/17/2020 – 11/09/2020
C15 Medication Reconciliation Post-Discharge HEDIS 01/01/2020 – 12/31/2020
C16 Statin Therapy for Patients with Cardiovascular Disease HEDIS 01/01/2020 – 12/31/2020
C17 Getting Needed Care CAHPS 03/2021 – 05/2021
C18 Getting Appointments and Care Quickly CAHPS 03/2021 – 05/2021
C19 Customer Service CAHPS 03/2021 – 05/2021
C20 Rating of Health Care Quality CAHPS 03/2021 – 05/2021
C21 Rating of Health Plan CAHPS 03/2021 – 05/2021
C22 Care Coordination CAHPS 03/2021 – 05/2021
C23 Complaints about the Health Plan Complaints Tracking Module (CTM) 01/01/2020 – 12/31/2020
C24 Members Choosing to Leave the Plan MBDSS 01/01/2020 – 12/31/2020
C25 Health Plan Quality Improvement Star Ratings Not Applicable
C26 Plan Makes Timely Decisions about Appeals Independent Review Entity (IRE) 01/01/2020 – 12/31/2020
C27 Reviewing Appeals Decisions Independent Review Entity (IRE) 01/01/2020 – 12/31/2020
C28 Call Center – Foreign Language Interpreter and TTY Availability Call Center 02/2021 – 06/2021
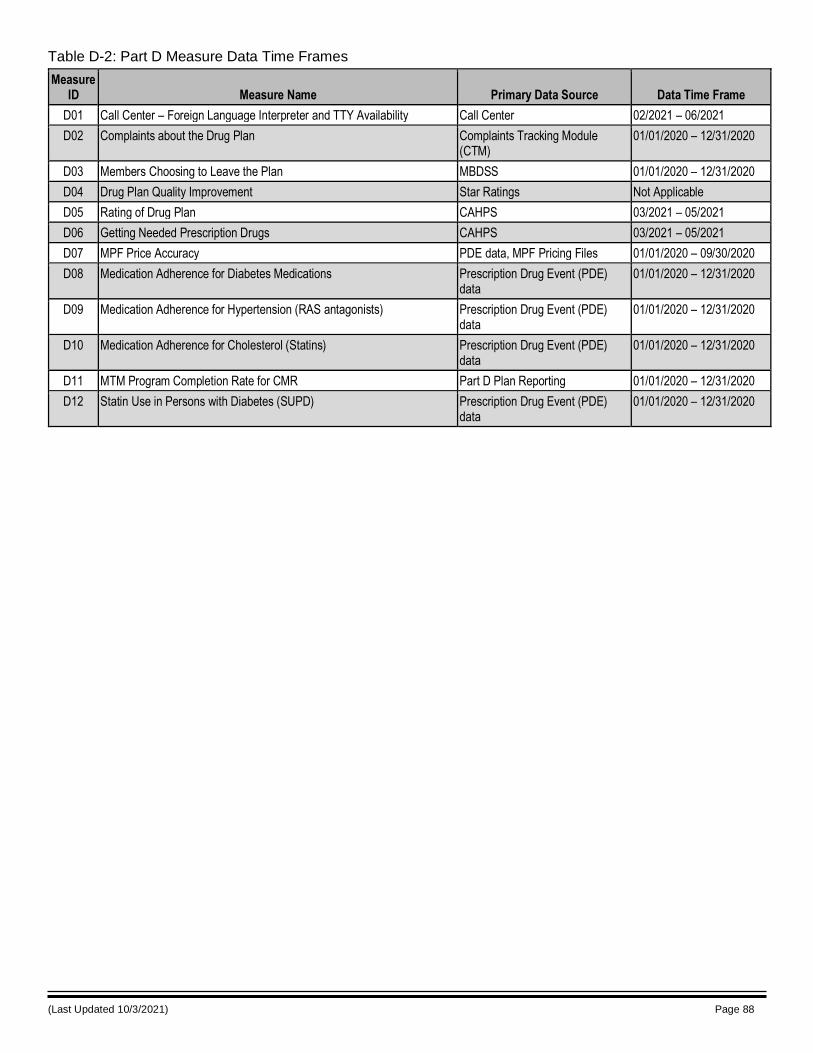
(Last Updated 10/3/2021) Page 88
Table D-2: Part D Measure Data Time Frames
Measure ID Measure Name Primary Data Source Data Time Frame
D01 Call Center – Foreign Language Interpreter and TTY Availability Call Center 02/2021 – 06/2021
D02 Complaints about the Drug Plan Complaints Tracking Module (CTM)
01/01/2020 – 12/31/2020
D03 Members Choosing to Leave the Plan MBDSS 01/01/2020 – 12/31/2020
D04 Drug Plan Quality Improvement Star Ratings Not Applicable
D05 Rating of Drug Plan CAHPS 03/2021 – 05/2021
D06 Getting Needed Prescription Drugs CAHPS 03/2021 – 05/2021
D07 MPF Price Accuracy PDE data, MPF Pricing Files 01/01/2020 – 09/30/2020
D08 Medication Adherence for Diabetes Medications Prescription Drug Event (PDE) data
01/01/2020 – 12/31/2020
D09 Medication Adherence for Hypertension (RAS antagonists) Prescription Drug Event (PDE) data
01/01/2020 – 12/31/2020
D10 Medication Adherence for Cholesterol (Statins) Prescription Drug Event (PDE) data
01/01/2020 – 12/31/2020
D11 MTM Program Completion Rate for CMR Part D Plan Reporting 01/01/2020 – 12/31/2020
D12 Statin Use in Persons with Diabetes (SUPD) Prescription Drug Event (PDE) data
01/01/2020 – 12/31/2020
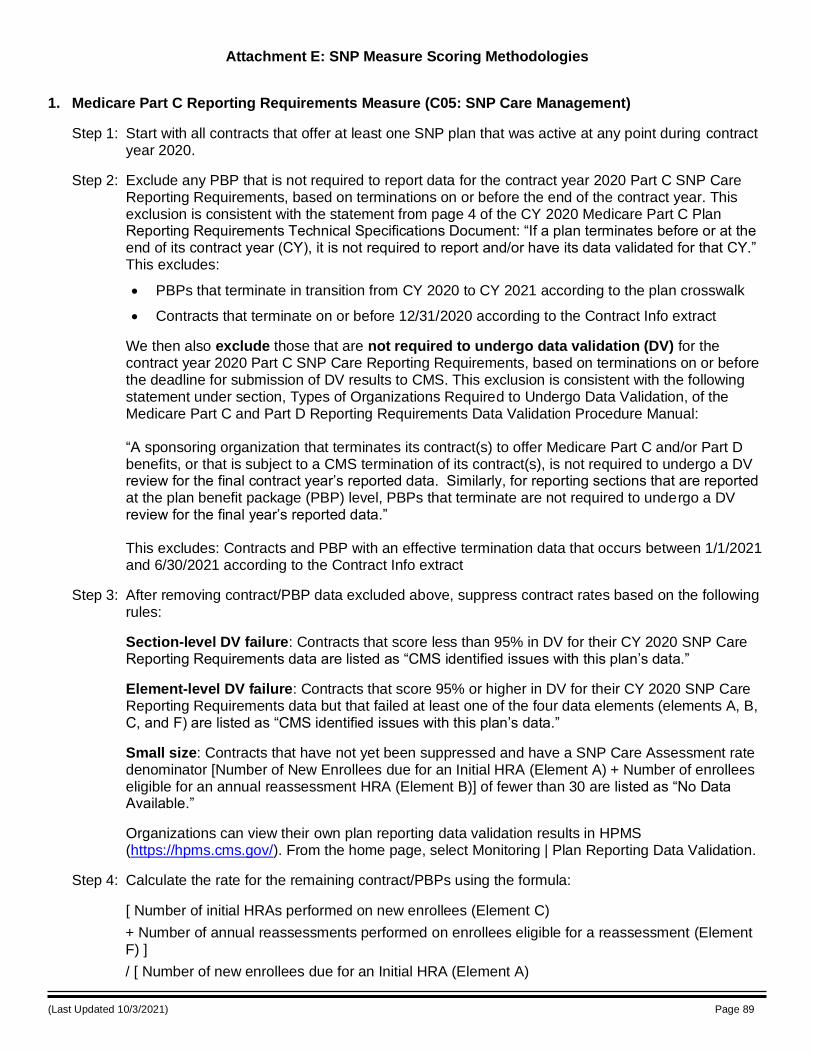
(Last Updated 10/3/2021) Page 89
Attachment E: SNP Measure Scoring Methodologies
1. Medicare Part C Reporting Requirements Measure (C05: SNP Care Management)
Step 1: Start with all contracts that offer at least one SNP plan that was active at any point during contract year 2020.
Step 2: Exclude any PBP that is not required to report data for the contract year 2020 Part C SNP Care Reporting Requirements, based on terminations on or before the end of the contract year. This exclusion is consistent with the statement from page 4 of the CY 2020 Medicare Part C Plan Reporting Requirements Technical Specifications Document: “If a plan terminates before or at the end of its contract year (CY), it is not required to report and/or have its data validated for that CY.” This excludes:
• PBPs that terminate in transition from CY 2020 to CY 2021 according to the plan crosswalk
• Contracts that terminate on or before 12/31/2020 according to the Contract Info extract
We then also exclude those that are not required to undergo data validation (DV) for the contract year 2020 Part C SNP Care Reporting Requirements, based on terminations on or before the deadline for submission of DV results to CMS. This exclusion is consistent with the following statement under section, Types of Organizations Required to Undergo Data Validation, of the Medicare Part C and Part D Reporting Requirements Data Validation Procedure Manual: “A sponsoring organization that terminates its contract(s) to offer Medicare Part C and/or Part D benefits, or that is subject to a CMS termination of its contract(s), is not required to undergo a DV review for the final contract year’s reported data. Similarly, for reporting sections that are reported at the plan benefit package (PBP) level, PBPs that terminate are not required to undergo a DV review for the final year’s reported data.” This excludes: Contracts and PBP with an effective termination data that occurs between 1/1/2021 and 6/30/2021 according to the Contract Info extract
Step 3: After removing contract/PBP data excluded above, suppress contract rates based on the following rules:
Section-level DV failure: Contracts that score less than 95% in DV for their CY 2020 SNP Care Reporting Requirements data are listed as “CMS identified issues with this plan’s data.”
Element-level DV failure: Contracts that score 95% or higher in DV for their CY 2020 SNP Care Reporting Requirements data but that failed at least one of the four data elements (elements A, B, C, and F) are listed as “CMS identified issues with this plan’s data.”
Small size: Contracts that have not yet been suppressed and have a SNP Care Assessment rate denominator [Number of New Enrollees due for an Initial HRA (Element A) + Number of enrollees eligible for an annual reassessment HRA (Element B)] of fewer than 30 are listed as “No Data Available.”
Organizations can view their own plan reporting data validation results in HPMS (https://hpms.cms.gov/). From the home page, select Monitoring | Plan Reporting Data Validation.
Step 4: Calculate the rate for the remaining contract/PBPs using the formula:
[ Number of initial HRAs performed on new enrollees (Element C)
+ Number of annual reassessments performed on enrollees eligible for a reassessment (Element F) ]
/ [ Number of new enrollees due for an Initial HRA (Element A)
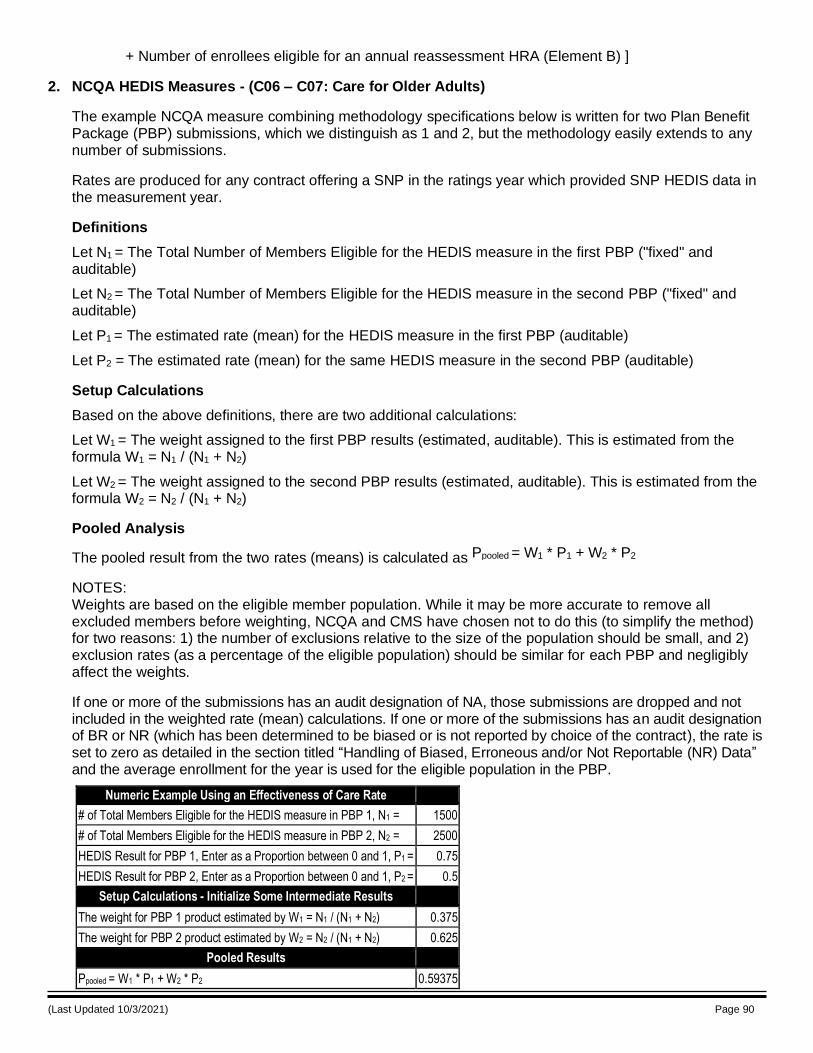
(Last Updated 10/3/2021) Page 90
+ Number of enrollees eligible for an annual reassessment HRA (Element B) ]
2. NCQA HEDIS Measures - (C06 – C07: Care for Older Adults)
The example NCQA measure combining methodology specifications below is written for two Plan Benefit Package (PBP) submissions, which we distinguish as 1 and 2, but the methodology easily extends to any number of submissions.
Rates are produced for any contract offering a SNP in the ratings year which provided SNP HEDIS data in the measurement year.
Definitions
Let N1 = The Total Number of Members Eligible for the HEDIS measure in the first PBP ("fixed" and auditable)
Let N2 = The Total Number of Members Eligible for the HEDIS measure in the second PBP ("fixed" and auditable)
Let P1 = The estimated rate (mean) for the HEDIS measure in the first PBP (auditable)
Let P2 = The estimated rate (mean) for the same HEDIS measure in the second PBP (auditable)
Setup Calculations
Based on the above definitions, there are two additional calculations:
Let W1 = The weight assigned to the first PBP results (estimated, auditable). This is estimated from the formula W1 = N1 / (N1 + N2)
Let W2 = The weight assigned to the second PBP results (estimated, auditable). This is estimated from the formula W2 = N2 / (N1 + N2)
Pooled Analysis
The pooled result from the two rates (means) is calculated as Ppooled = W1 * P1 + W2 * P2
NOTES: Weights are based on the eligible member population. While it may be more accurate to remove all excluded members before weighting, NCQA and CMS have chosen not to do this (to simplify the method) for two reasons: 1) the number of exclusions relative to the size of the population should be small, and 2) exclusion rates (as a percentage of the eligible population) should be similar for each PBP and negligibly affect the weights.
If one or more of the submissions has an audit designation of NA, those submissions are dropped and not included in the weighted rate (mean) calculations. If one or more of the submissions has an audit designation of BR or NR (which has been determined to be biased or is not reported by choice of the contract), the rate is set to zero as detailed in the section titled “Handling of Biased, Erroneous and/or Not Reportable (NR) Data” and the average enrollment for the year is used for the eligible population in the PBP.
Numeric Example Using an Effectiveness of Care Rate
# of Total Members Eligible for the HEDIS measure in PBP 1, N1 = 1500
# of Total Members Eligible for the HEDIS measure in PBP 2, N2 = 2500
HEDIS Result for PBP 1, Enter as a Proportion between 0 and 1, P1 = 0.75
HEDIS Result for PBP 2, Enter as a Proportion between 0 and 1, P2 = 0.5
Setup Calculations - Initialize Some Intermediate Results
The weight for PBP 1 product estimated by W1 = N1 / (N1 + N2) 0.375
The weight for PBP 2 product estimated by W2 = N2 / (N1 + N2) 0.625
Pooled Results
Ppooled = W1 * P1 + W2 * P2 0.59375
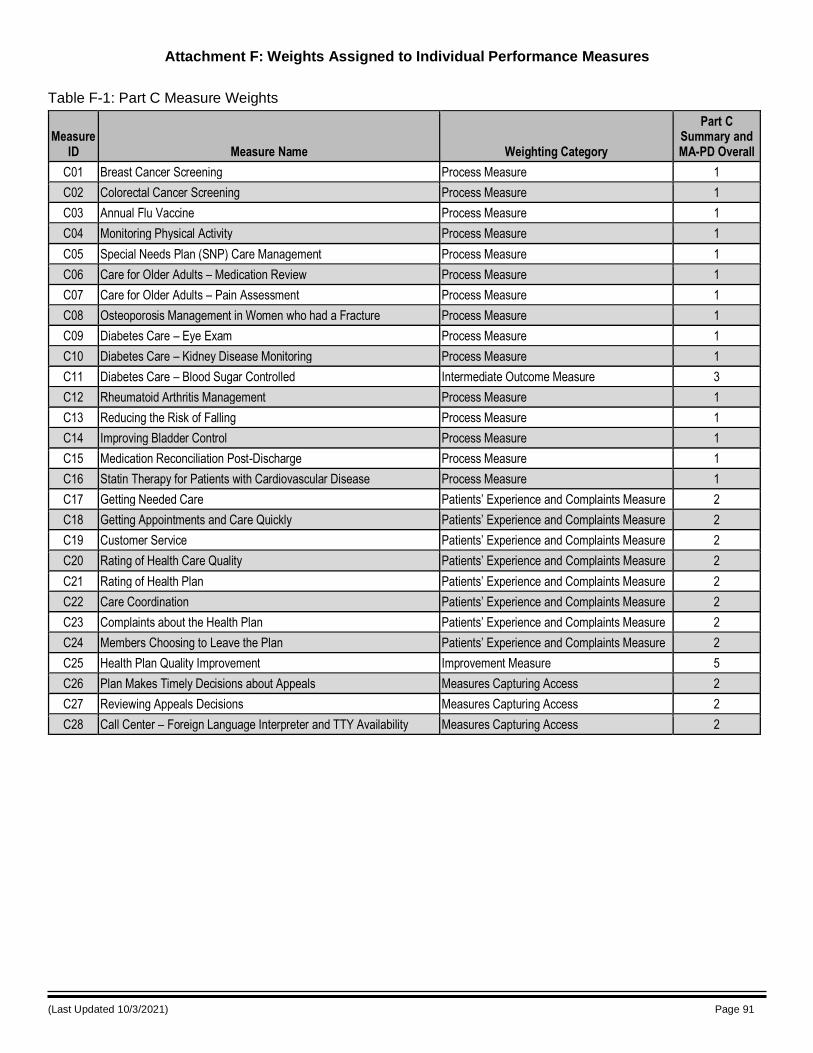
(Last Updated 10/3/2021) Page 91
Attachment F: Weights Assigned to Individual Performance Measures
Table F-1: Part C Measure Weights
Measure ID Measure Name Weighting Category
Part C Summary and MA-PD Overall
C01 Breast Cancer Screening Process Measure 1
C02 Colorectal Cancer Screening Process Measure 1
C03 Annual Flu Vaccine Process Measure 1
C04 Monitoring Physical Activity Process Measure 1
C05 Special Needs Plan (SNP) Care Management Process Measure 1
C06 Care for Older Adults – Medication Review Process Measure 1
C07 Care for Older Adults – Pain Assessment Process Measure 1
C08 Osteoporosis Management in Women who had a Fracture Process Measure 1
C09 Diabetes Care – Eye Exam Process Measure 1
C10 Diabetes Care – Kidney Disease Monitoring Process Measure 1
C11 Diabetes Care – Blood Sugar Controlled Intermediate Outcome Measure 3
C12 Rheumatoid Arthritis Management Process Measure 1
C13 Reducing the Risk of Falling Process Measure 1
C14 Improving Bladder Control Process Measure 1
C15 Medication Reconciliation Post-Discharge Process Measure 1
C16 Statin Therapy for Patients with Cardiovascular Disease Process Measure 1
C17 Getting Needed Care Patients’ Experience and Complaints Measure 2
C18 Getting Appointments and Care Quickly Patients’ Experience and Complaints Measure 2
C19 Customer Service Patients’ Experience and Complaints Measure 2
C20 Rating of Health Care Quality Patients’ Experience and Complaints Measure 2
C21 Rating of Health Plan Patients’ Experience and Complaints Measure 2
C22 Care Coordination Patients’ Experience and Complaints Measure 2
C23 Complaints about the Health Plan Patients’ Experience and Complaints Measure 2
C24 Members Choosing to Leave the Plan Patients’ Experience and Complaints Measure 2
C25 Health Plan Quality Improvement Improvement Measure 5
C26 Plan Makes Timely Decisions about Appeals Measures Capturing Access 2
C27 Reviewing Appeals Decisions Measures Capturing Access 2
C28 Call Center – Foreign Language Interpreter and TTY Availability Measures Capturing Access 2
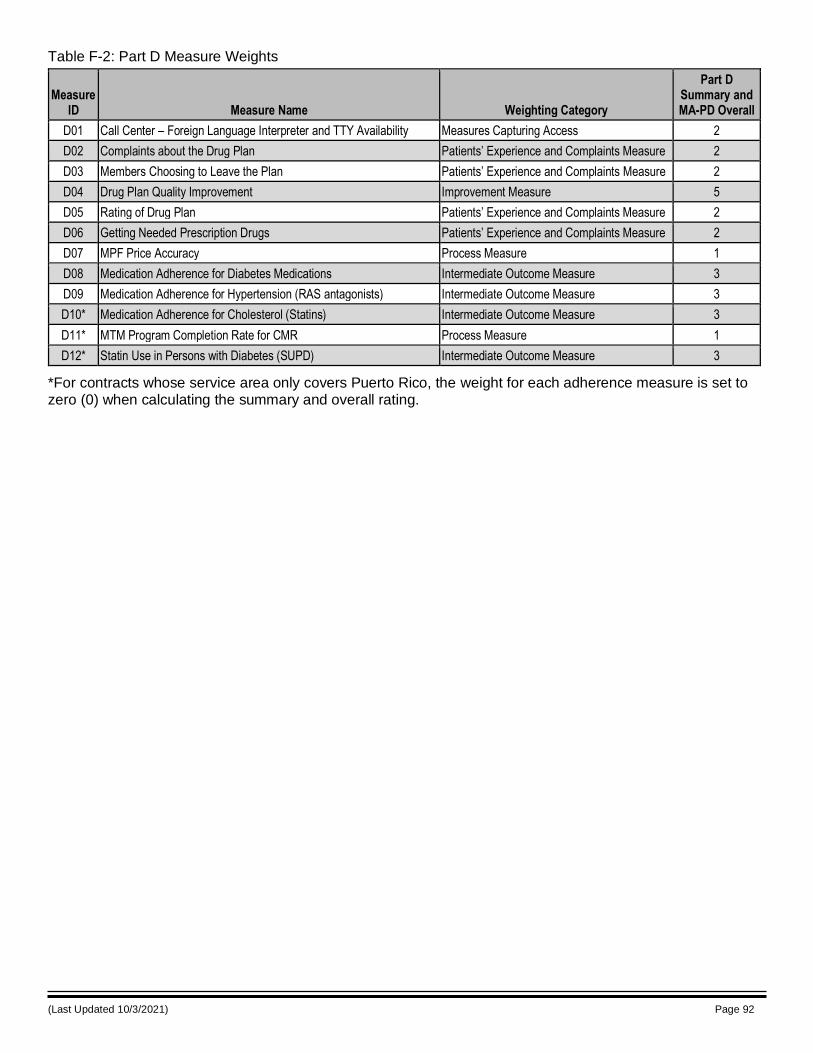
(Last Updated 10/3/2021) Page 92
Table F-2: Part D Measure Weights
Measure ID Measure Name Weighting Category
Part D Summary and MA-PD Overall
D01 Call Center – Foreign Language Interpreter and TTY Availability Measures Capturing Access 2
D02 Complaints about the Drug Plan Patients’ Experience and Complaints Measure 2
D03 Members Choosing to Leave the Plan Patients’ Experience and Complaints Measure 2
D04 Drug Plan Quality Improvement Improvement Measure 5
D05 Rating of Drug Plan Patients’ Experience and Complaints Measure 2
D06 Getting Needed Prescription Drugs Patients’ Experience and Complaints Measure 2
D07 MPF Price Accuracy Process Measure 1
D08 Medication Adherence for Diabetes Medications Intermediate Outcome Measure 3
D09 Medication Adherence for Hypertension (RAS antagonists) Intermediate Outcome Measure 3
D10* Medication Adherence for Cholesterol (Statins) Intermediate Outcome Measure 3
D11* MTM Program Completion Rate for CMR Process Measure 1
D12* Statin Use in Persons with Diabetes (SUPD) Intermediate Outcome Measure 3
*For contracts whose service area only covers Puerto Rico, the weight for each adherence measure is set to zero (0) when calculating the summary and overall rating.
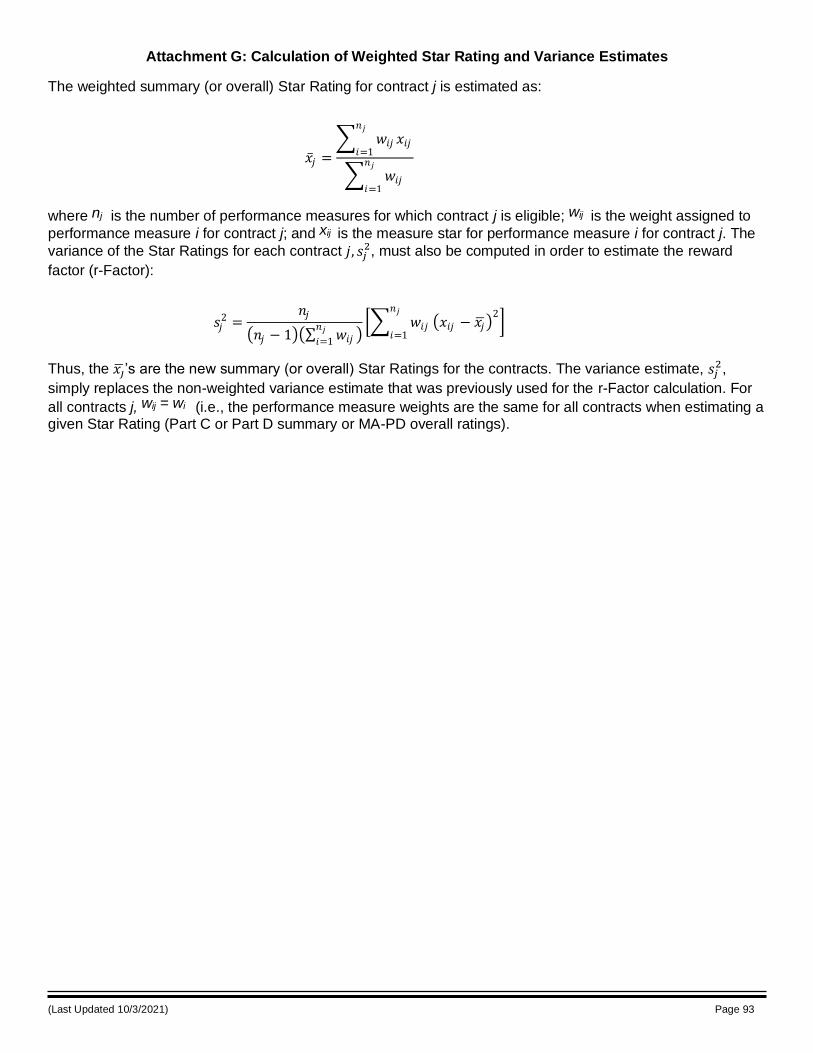
(Last Updated 10/3/2021) Page 93
Attachment G: Calculation of Weighted Star Rating and Variance Estimates
The weighted summary (or overall) Star Rating for contract j is estimated as:
𝑥 𝑗 =
𝑤𝑖𝑗 𝑥𝑖𝑗𝑛𝑗
𝑖=1
𝑤𝑖𝑗𝑛𝑗
𝑖=1
where nj is the number of performance measures for which contract j is eligible; wij is the weight assigned to
performance measure i for contract j; and xij is the measure star for performance measure i for contract j. The
variance of the Star Ratings for each contract 𝑗, 𝑠𝑗2, must also be computed in order to estimate the reward
factor (r-Factor):
𝑠𝑗2 =
𝑛𝑗
𝑛𝑗 − 1 𝑤𝑖𝑗𝑛𝑗𝑖=1 𝑤𝑖𝑗𝑛𝑗
𝑖=1 𝑥𝑖𝑗 − 𝑥�̅�
2
Thus, the 𝑥𝑗’s are the new summary (or overall) Star Ratings for the contracts. The variance estimate, 𝑠2𝑗 ,
simply replaces the non-weighted variance estimate that was previously used for the r-Factor calculation. For
all contracts j, wij = wi (i.e., the performance measure weights are the same for all contracts when estimating a given Star Rating (Part C or Part D summary or MA-PD overall ratings).
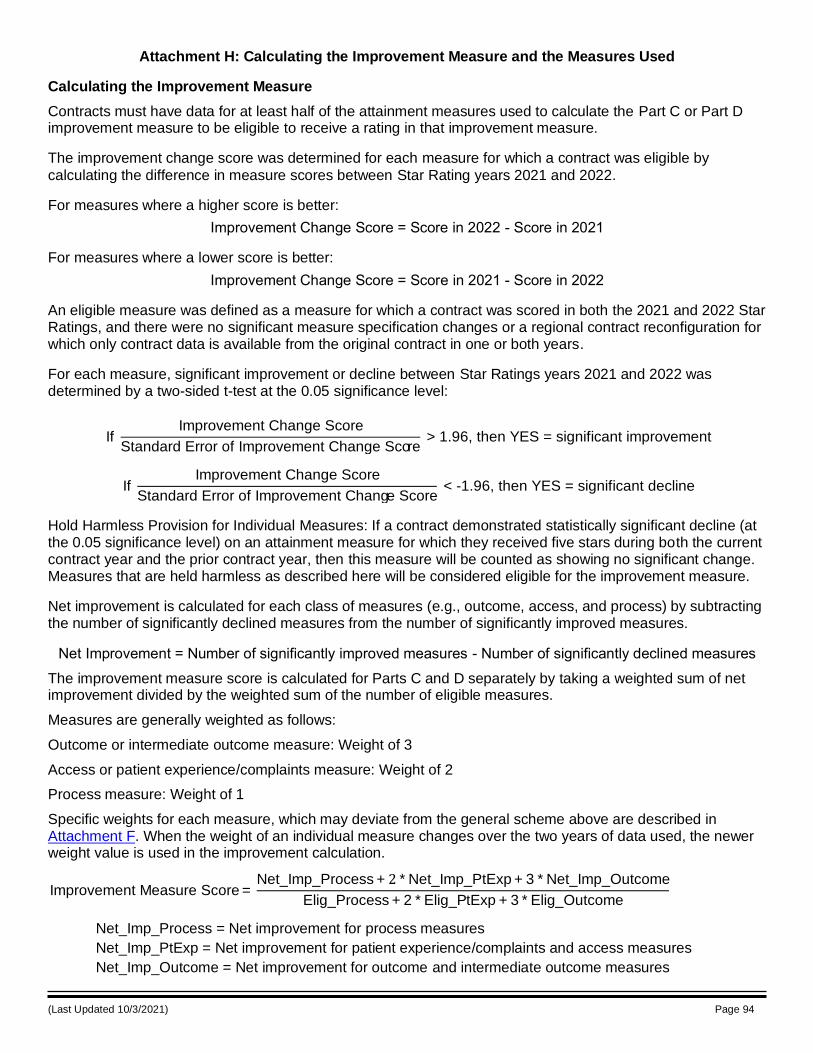
(Last Updated 10/3/2021) Page 94
Attachment H: Calculating the Improvement Measure and the Measures Used
Calculating the Improvement Measure
Contracts must have data for at least half of the attainment measures used to calculate the Part C or Part D improvement measure to be eligible to receive a rating in that improvement measure.
The improvement change score was determined for each measure for which a contract was eligible by
calculating the difference in measure scores between Star Rating years 2021 and 2022.
For measures where a higher score is better:
Improvement Change Score = Score in 2022 - Score in 2021
For measures where a lower score is better:
Improvement Change Score = Score in 2021 - Score in 2022
An eligible measure was defined as a measure for which a contract was scored in both the 2021 and 2022 Star Ratings, and there were no significant measure specification changes or a regional contract reconfiguration for which only contract data is available from the original contract in one or both years.
For each measure, significant improvement or decline between Star Ratings years 2021 and 2022 was determined by a two-sided t-test at the 0.05 significance level:
If Improvement Change Score
Standard Error of Improvement Change Score > 1.96, then YES = significant improvement
If Improvement Change Score
Standard Error of Improvement Change Score < -1.96, then YES = significant decline
Hold Harmless Provision for Individual Measures: If a contract demonstrated statistically significant decline (at the 0.05 significance level) on an attainment measure for which they received five stars during both the current contract year and the prior contract year, then this measure will be counted as showing no significant change. Measures that are held harmless as described here will be considered eligible for the improvement measure.
Net improvement is calculated for each class of measures (e.g., outcome, access, and process) by subtracting the number of significantly declined measures from the number of significantly improved measures.
Net Improvement = Number of significantly improved measures - Number of significantly declined measures
The improvement measure score is calculated for Parts C and D separately by taking a weighted sum of net improvement divided by the weighted sum of the number of eligible measures.
Measures are generally weighted as follows:
Outcome or intermediate outcome measure: Weight of 3
Access or patient experience/complaints measure: Weight of 2
Process measure: Weight of 1
Specific weights for each measure, which may deviate from the general scheme above are described in Attachment F. When the weight of an individual measure changes over the two years of data used, the newer weight value is used in the improvement calculation.
Improvement Measure Score = Net_Imp_Process + 2 * Net_Imp_PtExp + 3 * Net_Imp_Outcome
Elig_Process + 2 * Elig_PtExp + 3 * Elig_Outcome
Net_Imp_Process = Net improvement for process measures
Net_Imp_PtExp = Net improvement for patient experience/complaints and access measures
Net_Imp_Outcome = Net improvement for outcome and intermediate outcome measures
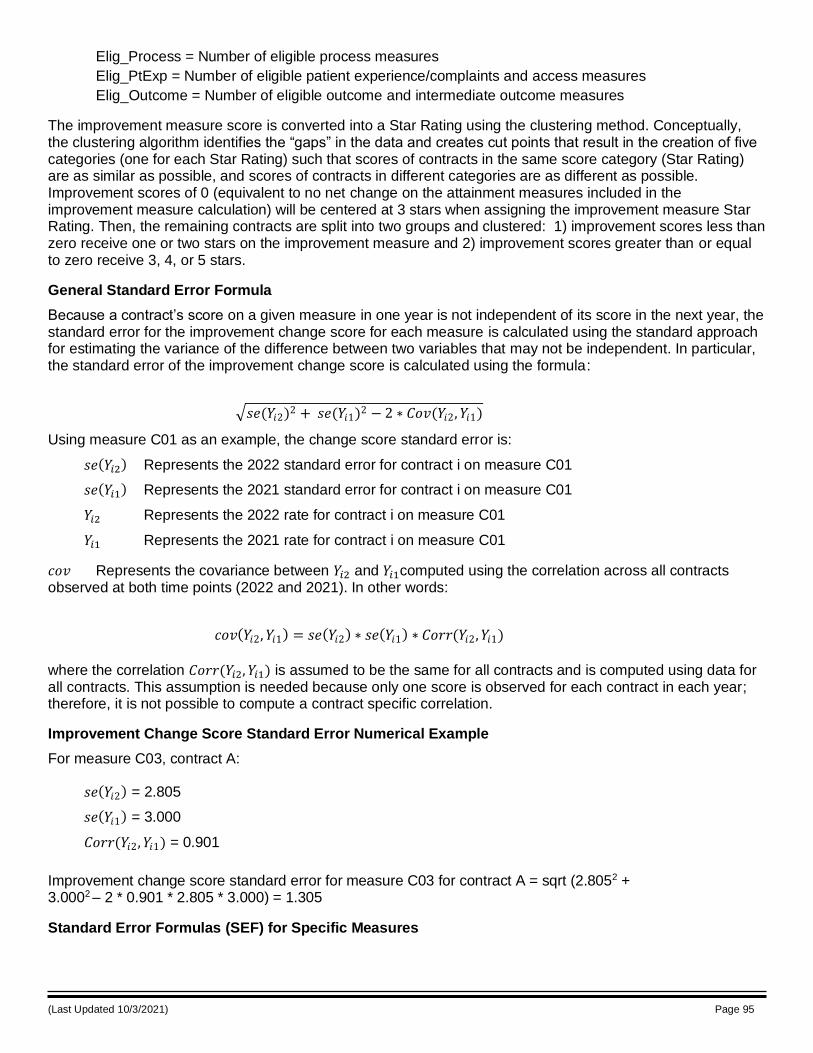
(Last Updated 10/3/2021) Page 95
Elig_Process = Number of eligible process measures
Elig_PtExp = Number of eligible patient experience/complaints and access measures
Elig_Outcome = Number of eligible outcome and intermediate outcome measures
The improvement measure score is converted into a Star Rating using the clustering method. Conceptually, the clustering algorithm identifies the “gaps” in the data and creates cut points that result in the creation of five categories (one for each Star Rating) such that scores of contracts in the same score category (Star Rating) are as similar as possible, and scores of contracts in different categories are as different as possible. Improvement scores of 0 (equivalent to no net change on the attainment measures included in the improvement measure calculation) will be centered at 3 stars when assigning the improvement measure Star Rating. Then, the remaining contracts are split into two groups and clustered: 1) improvement scores less than zero receive one or two stars on the improvement measure and 2) improvement scores greater than or equal to zero receive 3, 4, or 5 stars.
General Standard Error Formula
Because a contract’s score on a given measure in one year is not independent of its score in the next year, the standard error for the improvement change score for each measure is calculated using the standard approach for estimating the variance of the difference between two variables that may not be independent. In particular, the standard error of the improvement change score is calculated using the formula:
𝑠𝑒(𝑌𝑖2)2 + 𝑠𝑒(𝑌𝑖1)2 − 2 ∗ 𝐶𝑜𝑣(𝑌𝑖2,𝑌𝑖1)
Using measure C01 as an example, the change score standard error is:
𝑠𝑒(𝑌𝑖2) Represents the 2022 standard error for contract i on measure C01
𝑠𝑒(𝑌𝑖1) Represents the 2021 standard error for contract i on measure C01
𝑌𝑖2 Represents the 2022 rate for contract i on measure C01
𝑌𝑖1 Represents the 2021 rate for contract i on measure C01
𝑐𝑜𝑣 Represents the covariance between 𝑌𝑖2 and 𝑌𝑖1computed using the correlation across all contracts observed at both time points (2022 and 2021). In other words:
𝑐𝑜𝑣(𝑌𝑖2,𝑌𝑖1) = 𝑠𝑒(𝑌𝑖2) ∗ 𝑠𝑒(𝑌𝑖1) ∗ 𝐶𝑜𝑟𝑟(𝑌𝑖2,𝑌𝑖1)
where the correlation 𝐶𝑜𝑟𝑟(𝑌𝑖2, 𝑌𝑖1) is assumed to be the same for all contracts and is computed using data for all contracts. This assumption is needed because only one score is observed for each contract in each year; therefore, it is not possible to compute a contract specific correlation.
Improvement Change Score Standard Error Numerical Example
For measure C03, contract A:
𝑠𝑒(𝑌𝑖2) = 2.805
𝑠𝑒(𝑌𝑖1) = 3.000
𝐶𝑜𝑟𝑟(𝑌𝑖2,𝑌𝑖1) = 0.901
Improvement change score standard error for measure C03 for contract A = sqrt (2.8052 + 3.0002 – 2 * 0.901 * 2.805 * 3.000) = 1.305
Standard Error Formulas (SEF) for Specific Measures

(Last Updated 10/3/2021) Page 96
The following formulas are used for calculating the contract-specific standard errors for specific measures in the 2022 Star Ratings. These standard errors are used in calculating the improvement change score standard error.
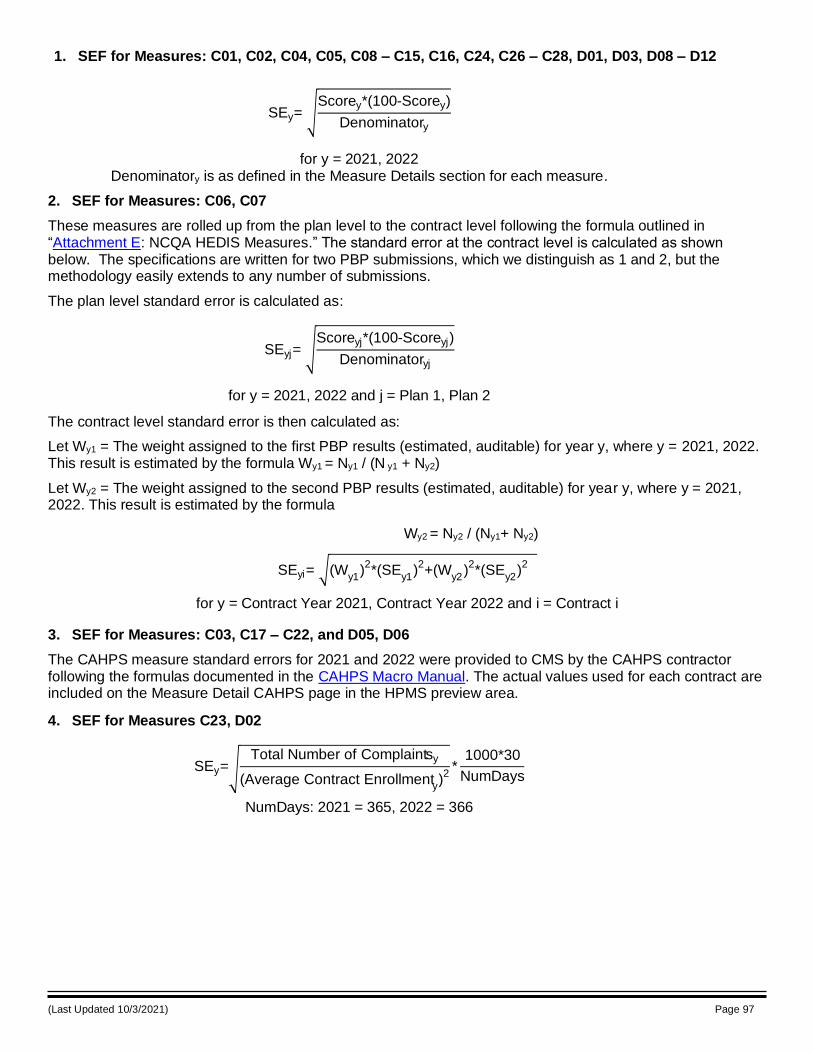
(Last Updated 10/3/2021) Page 97
1. SEF for Measures: C01, C02, C04, C05, C08 – C15, C16, C24, C26 – C28, D01, D03, D08 – D12
SEy= Scorey*(100-Scorey)
Denominatory
for y = 2021, 2022 Denominatory is as defined in the Measure Details section for each measure.
2. SEF for Measures: C06, C07
These measures are rolled up from the plan level to the contract level following the formula outlined in “Attachment E: NCQA HEDIS Measures.” The standard error at the contract level is calculated as shown below. The specifications are written for two PBP submissions, which we distinguish as 1 and 2, but the methodology easily extends to any number of submissions.
The plan level standard error is calculated as:
SEyj= Scoreyj*(100-Scoreyj)
Denominatoryj
for y = 2021, 2022 and j = Plan 1, Plan 2
The contract level standard error is then calculated as:
Let Wy1 = The weight assigned to the first PBP results (estimated, auditable) for year y, where y = 2021, 2022. This result is estimated by the formula Wy1 = Ny1 / (N y1 + Ny2)
Let Wy2 = The weight assigned to the second PBP results (estimated, auditable) for year y, where y = 2021, 2022. This result is estimated by the formula
Wy2 = Ny2 / (Ny1+ Ny2)
SEyi= (Wy1
)2*(SE
y1)2+(W
y2)2*(SE
y2)2
for y = Contract Year 2021, Contract Year 2022 and i = Contract i
3. SEF for Measures: C03, C17 – C22, and D05, D06
The CAHPS measure standard errors for 2021 and 2022 were provided to CMS by the CAHPS contractor following the formulas documented in the CAHPS Macro Manual. The actual values used for each contract are included on the Measure Detail CAHPS page in the HPMS preview area.
4. SEF for Measures C23, D02
SEy= Total Number of Complaintsy
(Average Contract Enrollmenty)2
*1000*30
NumDays
NumDays: 2021 = 365, 2022 = 366
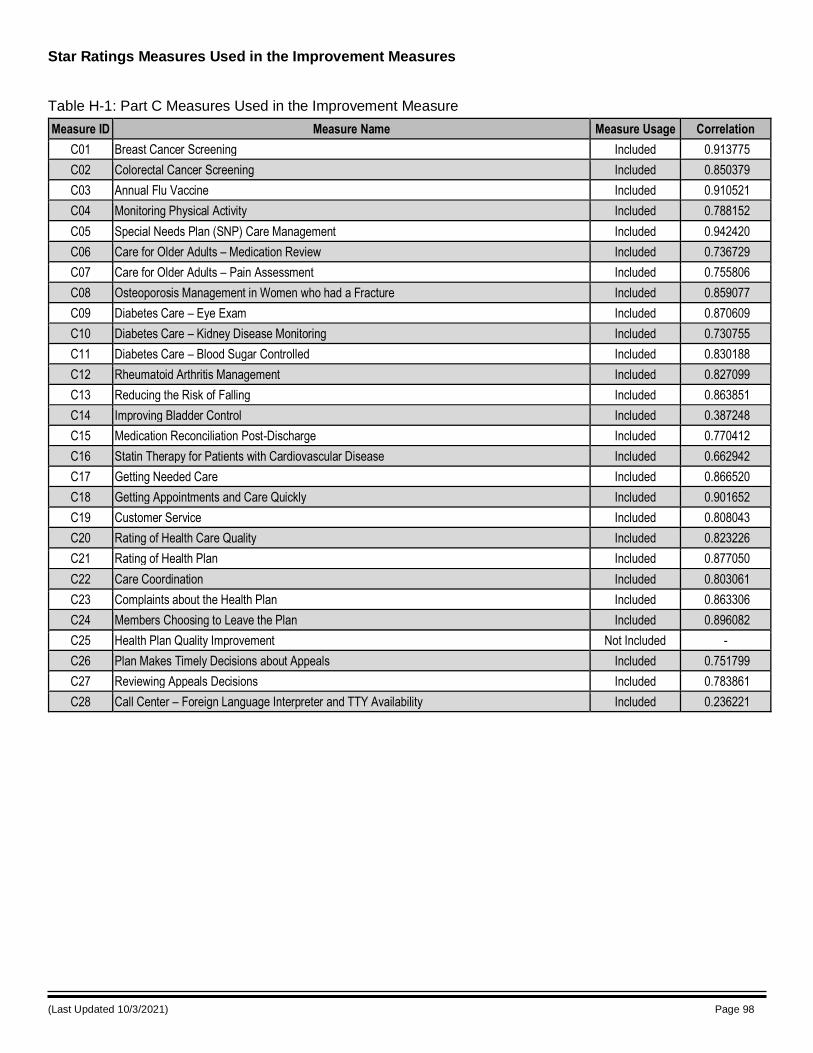
(Last Updated 10/3/2021) Page 98
Star Ratings Measures Used in the Improvement Measures
Table H-1: Part C Measures Used in the Improvement Measure
Measure ID Measure Name Measure Usage Correlation
C01 Breast Cancer Screening Included 0.913775
C02 Colorectal Cancer Screening Included 0.850379
C03 Annual Flu Vaccine Included 0.910521
C04 Monitoring Physical Activity Included 0.788152
C05 Special Needs Plan (SNP) Care Management Included 0.942420
C06 Care for Older Adults – Medication Review Included 0.736729
C07 Care for Older Adults – Pain Assessment Included 0.755806
C08 Osteoporosis Management in Women who had a Fracture Included 0.859077
C09 Diabetes Care – Eye Exam Included 0.870609
C10 Diabetes Care – Kidney Disease Monitoring Included 0.730755
C11 Diabetes Care – Blood Sugar Controlled Included 0.830188
C12 Rheumatoid Arthritis Management Included 0.827099
C13 Reducing the Risk of Falling Included 0.863851
C14 Improving Bladder Control Included 0.387248
C15 Medication Reconciliation Post-Discharge Included 0.770412
C16 Statin Therapy for Patients with Cardiovascular Disease Included 0.662942
C17 Getting Needed Care Included 0.866520
C18 Getting Appointments and Care Quickly Included 0.901652
C19 Customer Service Included 0.808043
C20 Rating of Health Care Quality Included 0.823226
C21 Rating of Health Plan Included 0.877050
C22 Care Coordination Included 0.803061
C23 Complaints about the Health Plan Included 0.863306
C24 Members Choosing to Leave the Plan Included 0.896082
C25 Health Plan Quality Improvement Not Included -
C26 Plan Makes Timely Decisions about Appeals Included 0.751799
C27 Reviewing Appeals Decisions Included 0.783861
C28 Call Center – Foreign Language Interpreter and TTY Availability Included 0.236221
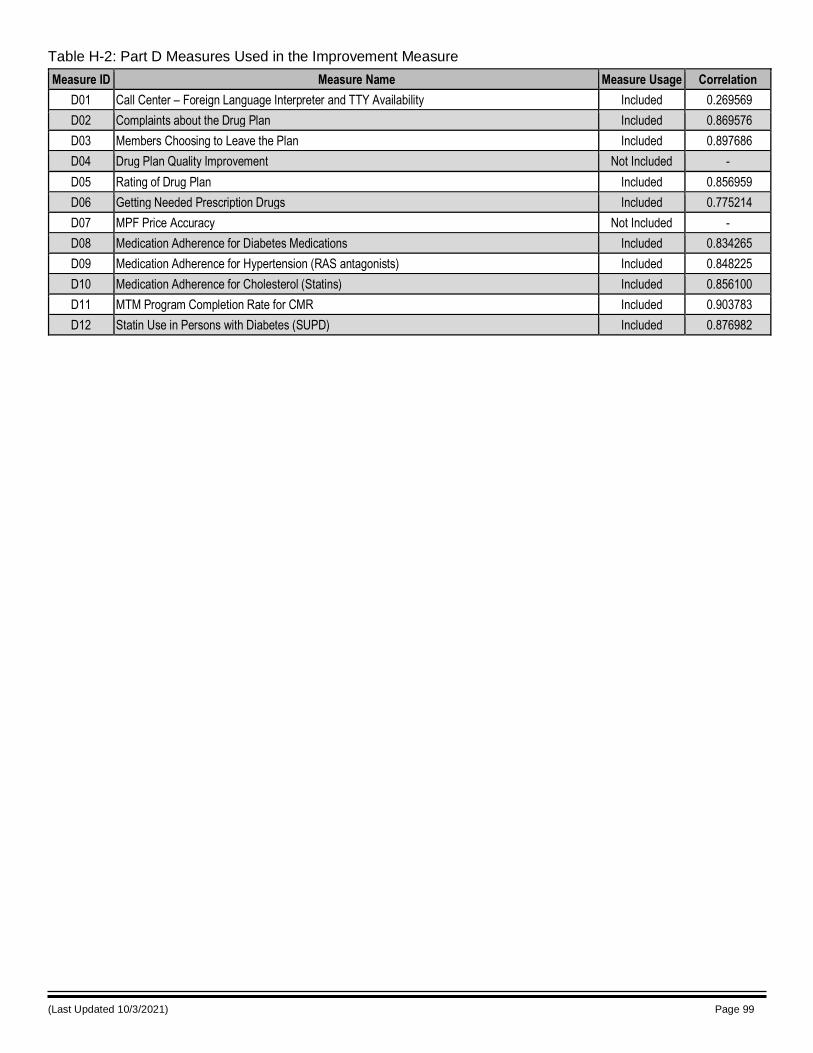
(Last Updated 10/3/2021) Page 99
Table H-2: Part D Measures Used in the Improvement Measure
Measure ID Measure Name Measure Usage Correlation
D01 Call Center – Foreign Language Interpreter and TTY Availability Included 0.269569
D02 Complaints about the Drug Plan Included 0.869576
D03 Members Choosing to Leave the Plan Included 0.897686
D04 Drug Plan Quality Improvement Not Included -
D05 Rating of Drug Plan Included 0.856959
D06 Getting Needed Prescription Drugs Included 0.775214
D07 MPF Price Accuracy Not Included -
D08 Medication Adherence for Diabetes Medications Included 0.834265
D09 Medication Adherence for Hypertension (RAS antagonists) Included 0.848225
D10 Medication Adherence for Cholesterol (Statins) Included 0.856100
D11 MTM Program Completion Rate for CMR Included 0.903783
D12 Statin Use in Persons with Diabetes (SUPD) Included 0.876982
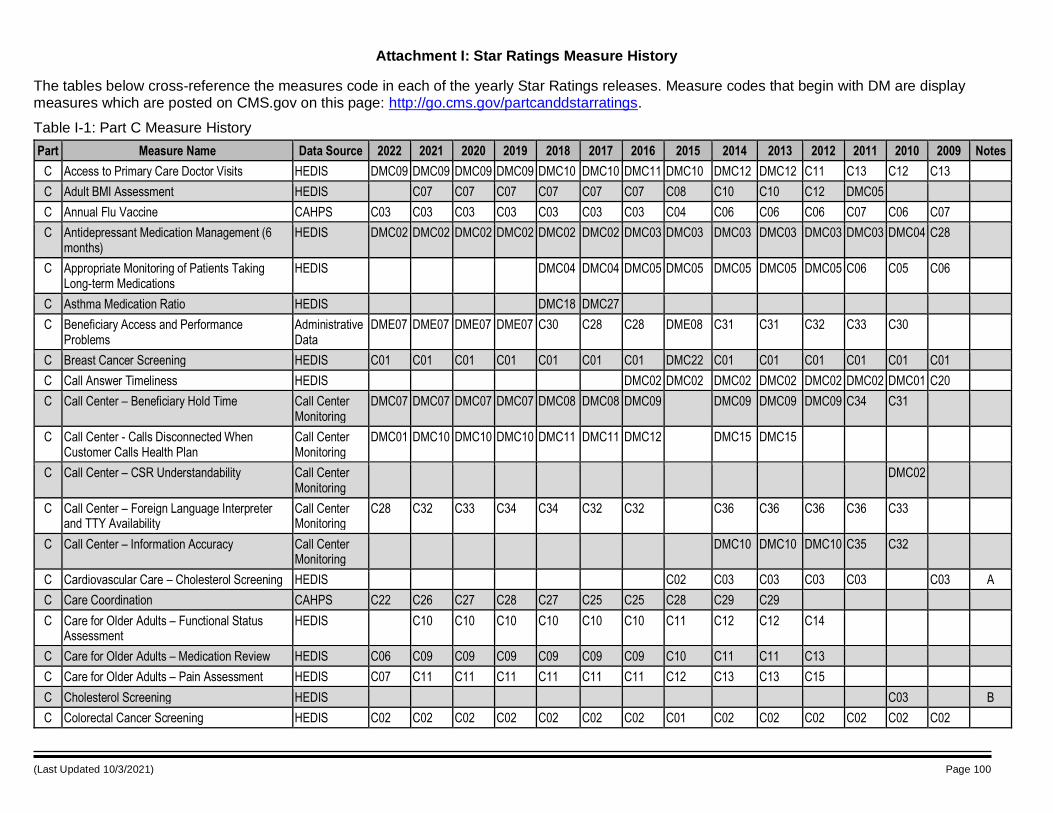
(Last Updated 10/3/2021) Page 100
Attachment I: Star Ratings Measure History
The tables below cross-reference the measures code in each of the yearly Star Ratings releases. Measure codes that begin with DM are display measures which are posted on CMS.gov on this page: http://go.cms.gov/partcanddstarratings.
Table I-1: Part C Measure History
Part Measure Name Data Source 2022 2021 2020 2019 2018 2017 2016 2015 2014 2013 2012 2011 2010 2009 Notes
C Access to Primary Care Doctor Visits HEDIS DMC09 DMC09 DMC09 DMC09 DMC10 DMC10 DMC11 DMC10 DMC12 DMC12 C11 C13 C12 C13
C Adult BMI Assessment HEDIS C07 C07 C07 C07 C07 C07 C08 C10 C10 C12 DMC05
C Annual Flu Vaccine CAHPS C03 C03 C03 C03 C03 C03 C03 C04 C06 C06 C06 C07 C06 C07
C Antidepressant Medication Management (6 months)
HEDIS DMC02 DMC02 DMC02 DMC02 DMC02 DMC02 DMC03 DMC03 DMC03 DMC03 DMC03 DMC03 DMC04 C28
C Appropriate Monitoring of Patients Taking Long-term Medications
HEDIS DMC04 DMC04 DMC05 DMC05 DMC05 DMC05 DMC05 C06 C05 C06
C Asthma Medication Ratio HEDIS DMC18 DMC27
C Beneficiary Access and Performance Problems
Administrative Data
DME07 DME07 DME07 DME07 C30 C28 C28 DME08 C31 C31 C32 C33 C30
C Breast Cancer Screening HEDIS C01 C01 C01 C01 C01 C01 C01 DMC22 C01 C01 C01 C01 C01 C01
C Call Answer Timeliness HEDIS DMC02 DMC02 DMC02 DMC02 DMC02 DMC02 DMC01 C20
C Call Center – Beneficiary Hold Time Call Center Monitoring
DMC07 DMC07 DMC07 DMC07 DMC08 DMC08 DMC09 DMC09 DMC09 DMC09 C34 C31
C Call Center - Calls Disconnected When Customer Calls Health Plan
Call Center Monitoring
DMC01 DMC10 DMC10 DMC10 DMC11 DMC11 DMC12 DMC15 DMC15
C Call Center – CSR Understandability Call Center Monitoring
DMC02
C Call Center – Foreign Language Interpreter and TTY Availability
Call Center Monitoring
C28 C32 C33 C34 C34 C32 C32 C36 C36 C36 C36 C33
C Call Center – Information Accuracy Call Center Monitoring
DMC10 DMC10 DMC10 C35 C32
C Cardiovascular Care – Cholesterol Screening HEDIS C02 C03 C03 C03 C03 C03 A
C Care Coordination CAHPS C22 C26 C27 C28 C27 C25 C25 C28 C29 C29
C Care for Older Adults – Functional Status Assessment
HEDIS C10 C10 C10 C10 C10 C10 C11 C12 C12 C14
C Care for Older Adults – Medication Review HEDIS C06 C09 C09 C09 C09 C09 C09 C10 C11 C11 C13
C Care for Older Adults – Pain Assessment HEDIS C07 C11 C11 C11 C11 C11 C11 C12 C13 C13 C15
C Cholesterol Screening HEDIS C03 B
C Colorectal Cancer Screening HEDIS C02 C02 C02 C02 C02 C02 C02 C01 C02 C02 C02 C02 C02 C02
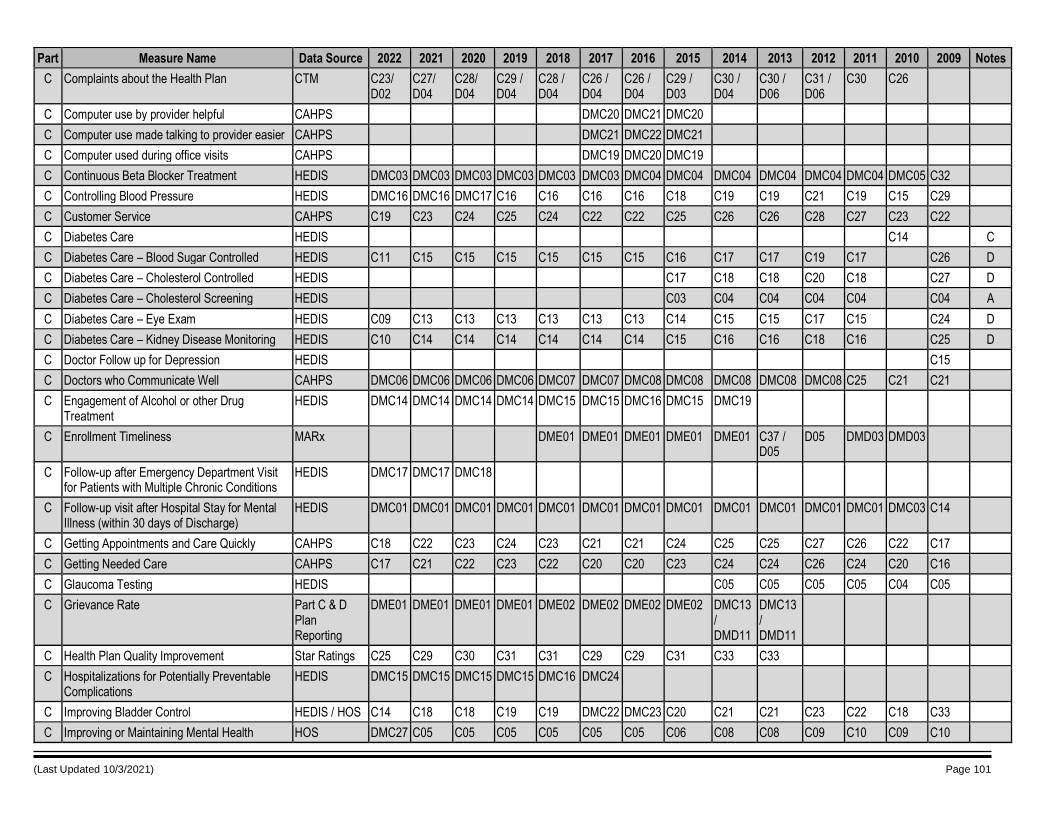
(Last Updated 10/3/2021) Page 101
Part Measure Name Data Source 2022 2021 2020 2019 2018 2017 2016 2015 2014 2013 2012 2011 2010 2009 Notes
C Complaints about the Health Plan CTM C23/ D02
C27/ D04
C28/ D04
C29 / D04
C28 / D04
C26 / D04
C26 / D04
C29 / D03
C30 / D04
C30 / D06
C31 / D06
C30 C26
C Computer use by provider helpful CAHPS DMC20 DMC21 DMC20
C Computer use made talking to provider easier CAHPS DMC21 DMC22 DMC21
C Computer used during office visits CAHPS DMC19 DMC20 DMC19
C Continuous Beta Blocker Treatment HEDIS DMC03 DMC03 DMC03 DMC03 DMC03 DMC03 DMC04 DMC04 DMC04 DMC04 DMC04 DMC04 DMC05 C32
C Controlling Blood Pressure HEDIS DMC16 DMC16 DMC17 C16 C16 C16 C16 C18 C19 C19 C21 C19 C15 C29
C Customer Service CAHPS C19 C23 C24 C25 C24 C22 C22 C25 C26 C26 C28 C27 C23 C22
C Diabetes Care HEDIS C14 C
C Diabetes Care – Blood Sugar Controlled HEDIS C11 C15 C15 C15 C15 C15 C15 C16 C17 C17 C19 C17 C26 D
C Diabetes Care – Cholesterol Controlled HEDIS C17 C18 C18 C20 C18 C27 D
C Diabetes Care – Cholesterol Screening HEDIS C03 C04 C04 C04 C04 C04 A
C Diabetes Care – Eye Exam HEDIS C09 C13 C13 C13 C13 C13 C13 C14 C15 C15 C17 C15 C24 D
C Diabetes Care – Kidney Disease Monitoring HEDIS C10 C14 C14 C14 C14 C14 C14 C15 C16 C16 C18 C16 C25 D
C Doctor Follow up for Depression HEDIS C15
C Doctors who Communicate Well CAHPS DMC06 DMC06 DMC06 DMC06 DMC07 DMC07 DMC08 DMC08 DMC08 DMC08 DMC08 C25 C21 C21
C Engagement of Alcohol or other Drug Treatment
HEDIS DMC14 DMC14 DMC14 DMC14 DMC15 DMC15 DMC16 DMC15 DMC19
C Enrollment Timeliness MARx DME01 DME01 DME01 DME01 DME01 C37 / D05
D05 DMD03 DMD03
C Follow-up after Emergency Department Visit for Patients with Multiple Chronic Conditions
HEDIS DMC17 DMC17 DMC18
C Follow-up visit after Hospital Stay for Mental Illness (within 30 days of Discharge)
HEDIS DMC01 DMC01 DMC01 DMC01 DMC01 DMC01 DMC01 DMC01 DMC01 DMC01 DMC01 DMC01 DMC03 C14
C Getting Appointments and Care Quickly CAHPS C18 C22 C23 C24 C23 C21 C21 C24 C25 C25 C27 C26 C22 C17
C Getting Needed Care CAHPS C17 C21 C22 C23 C22 C20 C20 C23 C24 C24 C26 C24 C20 C16
C Glaucoma Testing HEDIS C05 C05 C05 C05 C04 C05
C Grievance Rate Part C & D Plan Reporting
DME01 DME01 DME01 DME01 DME02 DME02 DME02 DME02 DMC13 / DMD11
DMC13 / DMD11
C Health Plan Quality Improvement Star Ratings C25 C29 C30 C31 C31 C29 C29 C31 C33 C33
C Hospitalizations for Potentially Preventable Complications
HEDIS DMC15 DMC15 DMC15 DMC15 DMC16 DMC24
C Improving Bladder Control HEDIS / HOS C14 C18 C18 C19 C19 DMC22 DMC23 C20 C21 C21 C23 C22 C18 C33
C Improving or Maintaining Mental Health HOS DMC27 C05 C05 C05 C05 C05 C05 C06 C08 C08 C09 C10 C09 C10
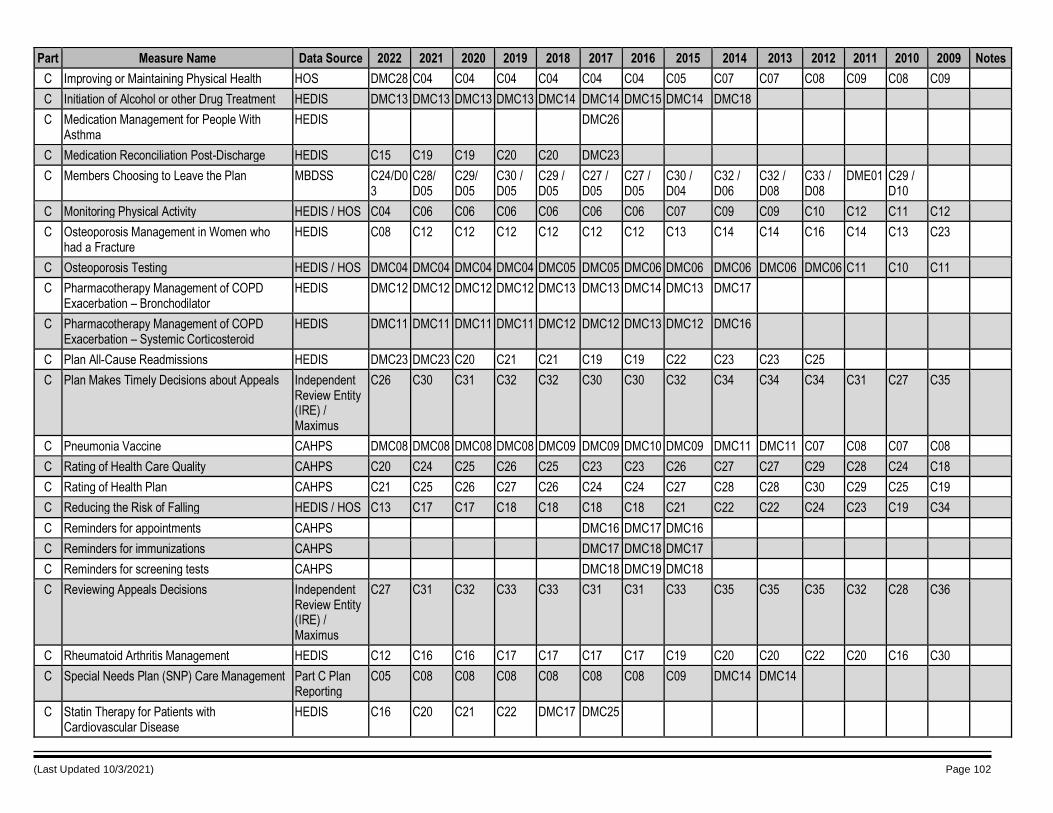
(Last Updated 10/3/2021) Page 102
Part Measure Name Data Source 2022 2021 2020 2019 2018 2017 2016 2015 2014 2013 2012 2011 2010 2009 Notes
C Improving or Maintaining Physical Health HOS DMC28 C04 C04 C04 C04 C04 C04 C05 C07 C07 C08 C09 C08 C09
C Initiation of Alcohol or other Drug Treatment HEDIS DMC13 DMC13 DMC13 DMC13 DMC14 DMC14 DMC15 DMC14 DMC18
C Medication Management for People With Asthma
HEDIS DMC26
C Medication Reconciliation Post-Discharge HEDIS C15 C19 C19 C20 C20 DMC23
C Members Choosing to Leave the Plan MBDSS C24/D03
C28/ D05
C29/ D05
C30 / D05
C29 / D05
C27 / D05
C27 / D05
C30 / D04
C32 / D06
C32 / D08
C33 / D08
DME01 C29 / D10
C Monitoring Physical Activity HEDIS / HOS C04 C06 C06 C06 C06 C06 C06 C07 C09 C09 C10 C12 C11 C12
C Osteoporosis Management in Women who had a Fracture
HEDIS C08 C12 C12 C12 C12 C12 C12 C13 C14 C14 C16 C14 C13 C23
C Osteoporosis Testing HEDIS / HOS DMC04 DMC04 DMC04 DMC04 DMC05 DMC05 DMC06 DMC06 DMC06 DMC06 DMC06 C11 C10 C11
C Pharmacotherapy Management of COPD Exacerbation – Bronchodilator
HEDIS DMC12 DMC12 DMC12 DMC12 DMC13 DMC13 DMC14 DMC13 DMC17
C Pharmacotherapy Management of COPD Exacerbation – Systemic Corticosteroid
HEDIS DMC11 DMC11 DMC11 DMC11 DMC12 DMC12 DMC13 DMC12 DMC16
C Plan All-Cause Readmissions HEDIS DMC23 DMC23 C20 C21 C21 C19 C19 C22 C23 C23 C25
C Plan Makes Timely Decisions about Appeals Independent Review Entity (IRE) / Maximus
C26 C30 C31 C32 C32 C30 C30 C32 C34 C34 C34 C31 C27 C35
C Pneumonia Vaccine CAHPS DMC08 DMC08 DMC08 DMC08 DMC09 DMC09 DMC10 DMC09 DMC11 DMC11 C07 C08 C07 C08
C Rating of Health Care Quality CAHPS C20 C24 C25 C26 C25 C23 C23 C26 C27 C27 C29 C28 C24 C18
C Rating of Health Plan CAHPS C21 C25 C26 C27 C26 C24 C24 C27 C28 C28 C30 C29 C25 C19
C Reducing the Risk of Falling HEDIS / HOS C13 C17 C17 C18 C18 C18 C18 C21 C22 C22 C24 C23 C19 C34
C Reminders for appointments CAHPS DMC16 DMC17 DMC16
C Reminders for immunizations CAHPS DMC17 DMC18 DMC17
C Reminders for screening tests CAHPS DMC18 DMC19 DMC18
C Reviewing Appeals Decisions Independent Review Entity (IRE) / Maximus
C27 C31 C32 C33 C33 C31 C31 C33 C35 C35 C35 C32 C28 C36
C Rheumatoid Arthritis Management HEDIS C12 C16 C16 C17 C17 C17 C17 C19 C20 C20 C22 C20 C16 C30
C Special Needs Plan (SNP) Care Management Part C Plan Reporting
C05 C08 C08 C08 C08 C08 C08 C09 DMC14 DMC14
C Statin Therapy for Patients with Cardiovascular Disease
HEDIS C16 C20 C21 C22 DMC17 DMC25
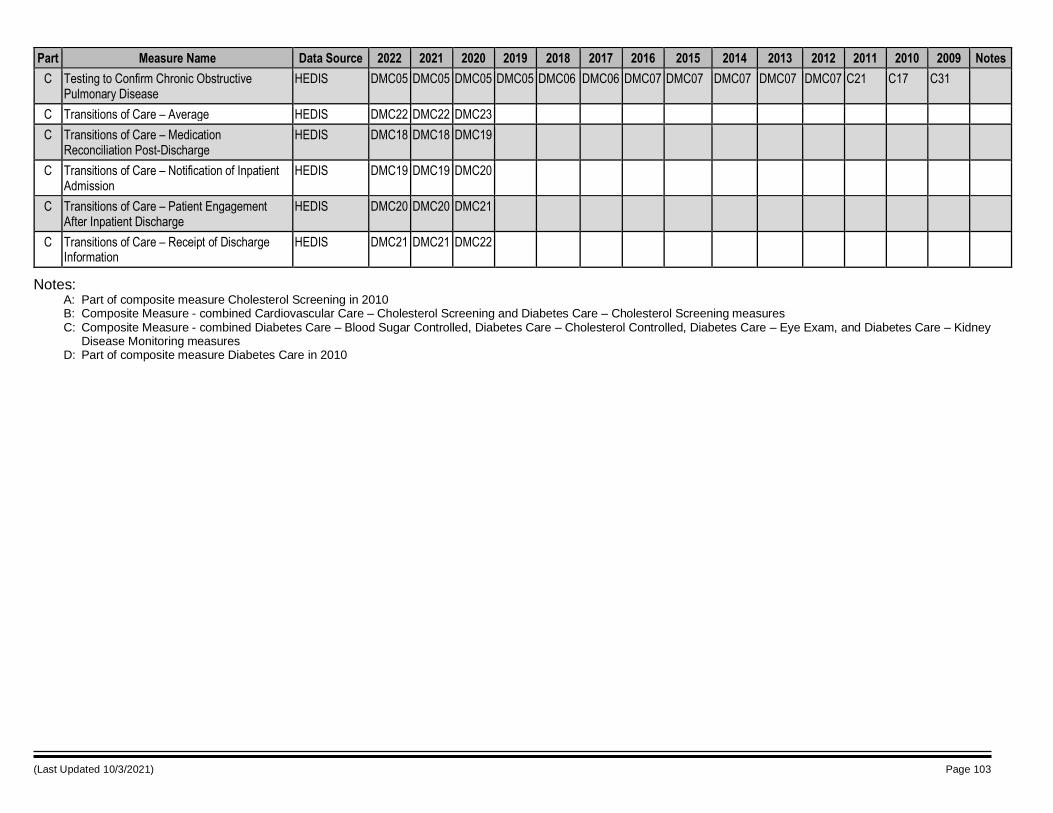
(Last Updated 10/3/2021) Page 103
Part Measure Name Data Source 2022 2021 2020 2019 2018 2017 2016 2015 2014 2013 2012 2011 2010 2009 Notes
C Testing to Confirm Chronic Obstructive Pulmonary Disease
HEDIS DMC05 DMC05 DMC05 DMC05 DMC06 DMC06 DMC07 DMC07 DMC07 DMC07 DMC07 C21 C17 C31
C Transitions of Care – Average HEDIS DMC22 DMC22 DMC23
C Transitions of Care – Medication Reconciliation Post-Discharge
HEDIS DMC18 DMC18 DMC19
C Transitions of Care – Notification of Inpatient Admission
HEDIS DMC19 DMC19 DMC20
C Transitions of Care – Patient Engagement After Inpatient Discharge
HEDIS DMC20 DMC20 DMC21
C Transitions of Care – Receipt of Discharge Information
HEDIS DMC21 DMC21 DMC22
Notes: A: Part of composite measure Cholesterol Screening in 2010 B: Composite Measure - combined Cardiovascular Care – Cholesterol Screening and Diabetes Care – Cholesterol Screening measures C: Composite Measure - combined Diabetes Care – Blood Sugar Controlled, Diabetes Care – Cholesterol Controlled, Diabetes Care – Eye Exam, and Diabetes Care – Kidney
Disease Monitoring measures D: Part of composite measure Diabetes Care in 2010
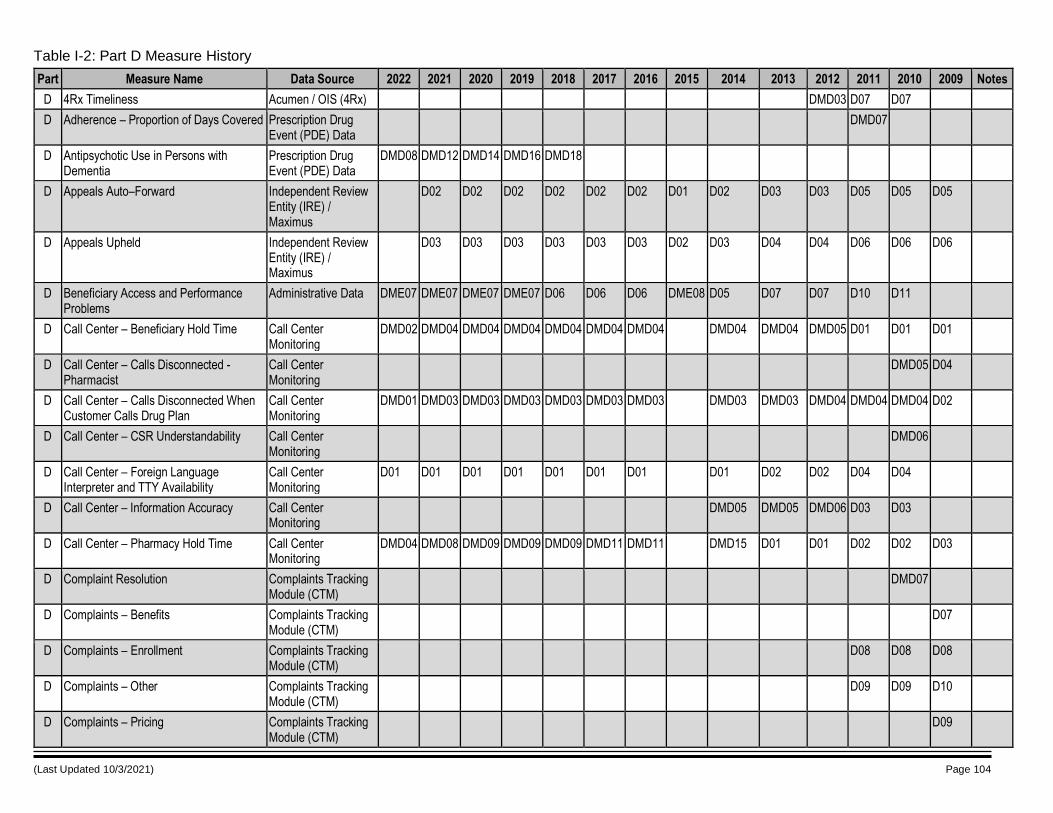
(Last Updated 10/3/2021) Page 104
Table I-2: Part D Measure History
Part Measure Name Data Source 2022 2021 2020 2019 2018 2017 2016 2015 2014 2013 2012 2011 2010 2009 Notes
D 4Rx Timeliness Acumen / OIS (4Rx) DMD03 D07 D07
D Adherence – Proportion of Days Covered Prescription Drug Event (PDE) Data
DMD07
D Antipsychotic Use in Persons with Dementia
Prescription Drug Event (PDE) Data
DMD08 DMD12 DMD14 DMD16 DMD18
D Appeals Auto–Forward Independent Review Entity (IRE) / Maximus
D02 D02 D02 D02 D02 D02 D01 D02 D03 D03 D05 D05 D05
D Appeals Upheld Independent Review Entity (IRE) / Maximus
D03 D03 D03 D03 D03 D03 D02 D03 D04 D04 D06 D06 D06
D Beneficiary Access and Performance Problems
Administrative Data DME07 DME07 DME07 DME07 D06 D06 D06 DME08 D05 D07 D07 D10 D11
D Call Center – Beneficiary Hold Time Call Center Monitoring
DMD02 DMD04 DMD04 DMD04 DMD04 DMD04 DMD04 DMD04 DMD04 DMD05 D01 D01 D01
D Call Center – Calls Disconnected - Pharmacist
Call Center Monitoring
DMD05 D04
D Call Center – Calls Disconnected When Customer Calls Drug Plan
Call Center Monitoring
DMD01 DMD03 DMD03 DMD03 DMD03 DMD03 DMD03 DMD03 DMD03 DMD04 DMD04 DMD04 D02
D Call Center – CSR Understandability Call Center Monitoring
DMD06
D Call Center – Foreign Language Interpreter and TTY Availability
Call Center Monitoring
D01 D01 D01 D01 D01 D01 D01 D01 D02 D02 D04 D04
D Call Center – Information Accuracy Call Center Monitoring
DMD05 DMD05 DMD06 D03 D03
D Call Center – Pharmacy Hold Time Call Center Monitoring
DMD04 DMD08 DMD09 DMD09 DMD09 DMD11 DMD11 DMD15 D01 D01 D02 D02 D03
D Complaint Resolution Complaints Tracking Module (CTM)
DMD07
D Complaints – Benefits Complaints Tracking Module (CTM)
D07
D Complaints – Enrollment Complaints Tracking Module (CTM)
D08 D08 D08
D Complaints – Other Complaints Tracking Module (CTM)
D09 D09 D10
D Complaints – Pricing Complaints Tracking Module (CTM)
D09
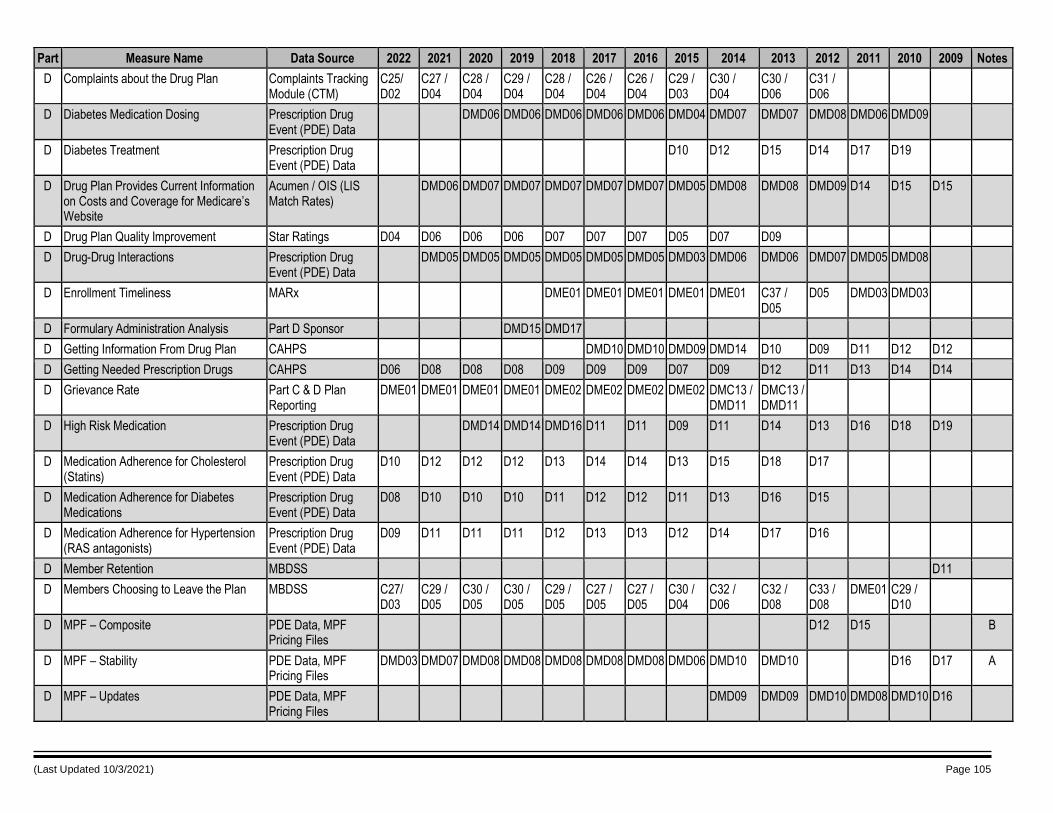
(Last Updated 10/3/2021) Page 105
Part Measure Name Data Source 2022 2021 2020 2019 2018 2017 2016 2015 2014 2013 2012 2011 2010 2009 Notes
D Complaints about the Drug Plan Complaints Tracking Module (CTM)
C25/ D02
C27 / D04
C28 / D04
C29 / D04
C28 / D04
C26 / D04
C26 / D04
C29 / D03
C30 / D04
C30 / D06
C31 / D06
D Diabetes Medication Dosing Prescription Drug Event (PDE) Data
DMD06 DMD06 DMD06 DMD06 DMD06 DMD04 DMD07 DMD07 DMD08 DMD06 DMD09
D Diabetes Treatment Prescription Drug Event (PDE) Data
D10 D12 D15 D14 D17 D19
D Drug Plan Provides Current Information on Costs and Coverage for Medicare’s Website
Acumen / OIS (LIS Match Rates)
DMD06 DMD07 DMD07 DMD07 DMD07 DMD07 DMD05 DMD08 DMD08 DMD09 D14 D15 D15
D Drug Plan Quality Improvement Star Ratings D04 D06 D06 D06 D07 D07 D07 D05 D07 D09
D Drug-Drug Interactions Prescription Drug Event (PDE) Data
DMD05 DMD05 DMD05 DMD05 DMD05 DMD05 DMD03 DMD06 DMD06 DMD07 DMD05 DMD08
D Enrollment Timeliness MARx DME01 DME01 DME01 DME01 DME01 C37 / D05
D05 DMD03 DMD03
D Formulary Administration Analysis Part D Sponsor DMD15 DMD17
D Getting Information From Drug Plan CAHPS DMD10 DMD10 DMD09 DMD14 D10 D09 D11 D12 D12
D Getting Needed Prescription Drugs CAHPS D06 D08 D08 D08 D09 D09 D09 D07 D09 D12 D11 D13 D14 D14
D Grievance Rate Part C & D Plan Reporting
DME01 DME01 DME01 DME01 DME02 DME02 DME02 DME02 DMC13 / DMD11
DMC13 / DMD11
D High Risk Medication Prescription Drug Event (PDE) Data
DMD14 DMD14 DMD16 D11 D11 D09 D11 D14 D13 D16 D18 D19
D Medication Adherence for Cholesterol (Statins)
Prescription Drug Event (PDE) Data
D10 D12 D12 D12 D13 D14 D14 D13 D15 D18 D17
D Medication Adherence for Diabetes Medications
Prescription Drug Event (PDE) Data
D08 D10 D10 D10 D11 D12 D12 D11 D13 D16 D15
D Medication Adherence for Hypertension (RAS antagonists)
Prescription Drug Event (PDE) Data
D09 D11 D11 D11 D12 D13 D13 D12 D14 D17 D16
D Member Retention MBDSS D11
D Members Choosing to Leave the Plan MBDSS C27/ D03
C29 / D05
C30 / D05
C30 / D05
C29 / D05
C27 / D05
C27 / D05
C30 / D04
C32 / D06
C32 / D08
C33 / D08
DME01 C29 / D10
D MPF – Composite PDE Data, MPF Pricing Files
D12 D15 B
D MPF – Stability PDE Data, MPF Pricing Files
DMD03 DMD07 DMD08 DMD08 DMD08 DMD08 DMD08 DMD06 DMD10 DMD10 D16 D17 A
D MPF – Updates PDE Data, MPF Pricing Files
DMD09 DMD09 DMD10 DMD08 DMD10 D16
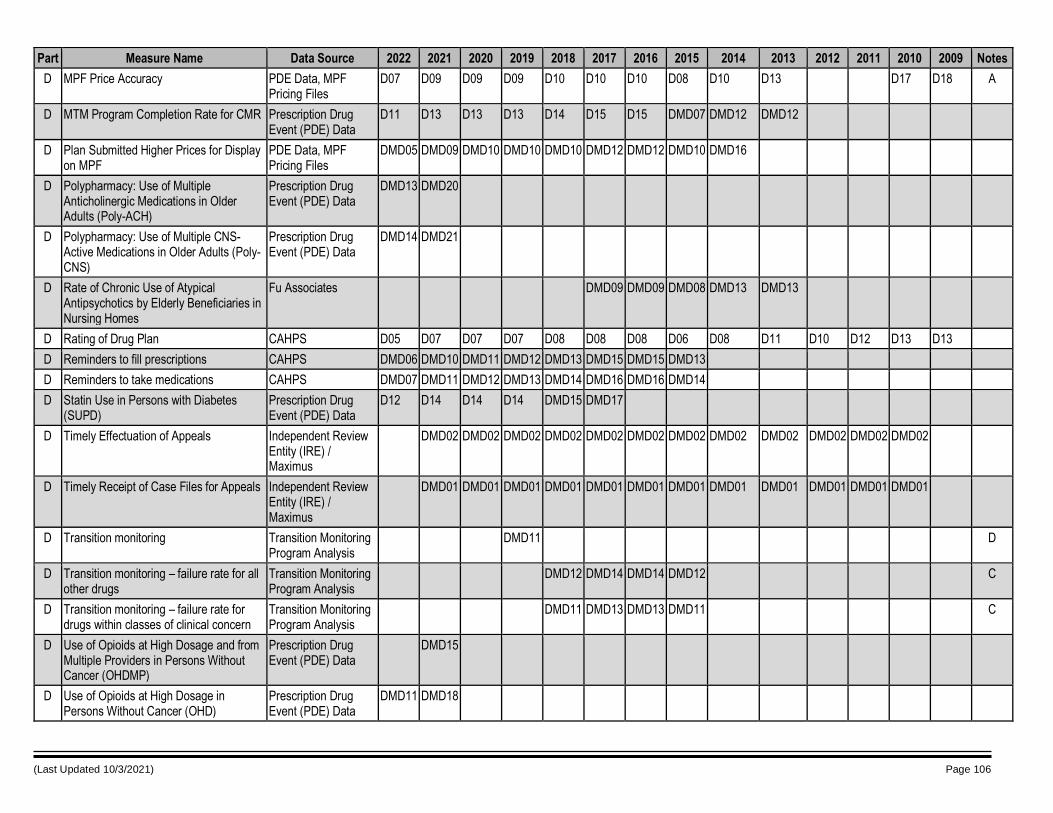
(Last Updated 10/3/2021) Page 106
Part Measure Name Data Source 2022 2021 2020 2019 2018 2017 2016 2015 2014 2013 2012 2011 2010 2009 Notes
D MPF Price Accuracy PDE Data, MPF Pricing Files
D07 D09 D09 D09 D10 D10 D10 D08 D10 D13 D17 D18 A
D MTM Program Completion Rate for CMR Prescription Drug Event (PDE) Data
D11 D13 D13 D13 D14 D15 D15 DMD07 DMD12 DMD12
D Plan Submitted Higher Prices for Display on MPF
PDE Data, MPF Pricing Files
DMD05 DMD09 DMD10 DMD10 DMD10 DMD12 DMD12 DMD10 DMD16
D Polypharmacy: Use of Multiple Anticholinergic Medications in Older Adults (Poly-ACH)
Prescription Drug Event (PDE) Data
DMD13 DMD20
D Polypharmacy: Use of Multiple CNS-Active Medications in Older Adults (Poly-CNS)
Prescription Drug Event (PDE) Data
DMD14 DMD21
D Rate of Chronic Use of Atypical Antipsychotics by Elderly Beneficiaries in Nursing Homes
Fu Associates DMD09 DMD09 DMD08 DMD13 DMD13
D Rating of Drug Plan CAHPS D05 D07 D07 D07 D08 D08 D08 D06 D08 D11 D10 D12 D13 D13
D Reminders to fill prescriptions CAHPS DMD06 DMD10 DMD11 DMD12 DMD13 DMD15 DMD15 DMD13
D Reminders to take medications CAHPS DMD07 DMD11 DMD12 DMD13 DMD14 DMD16 DMD16 DMD14
D Statin Use in Persons with Diabetes (SUPD)
Prescription Drug Event (PDE) Data
D12 D14 D14 D14 DMD15 DMD17
D Timely Effectuation of Appeals Independent Review Entity (IRE) / Maximus
DMD02 DMD02 DMD02 DMD02 DMD02 DMD02 DMD02 DMD02 DMD02 DMD02 DMD02 DMD02
D Timely Receipt of Case Files for Appeals Independent Review Entity (IRE) / Maximus
DMD01 DMD01 DMD01 DMD01 DMD01 DMD01 DMD01 DMD01 DMD01 DMD01 DMD01 DMD01
D Transition monitoring Transition Monitoring Program Analysis
DMD11 D
D Transition monitoring – failure rate for all other drugs
Transition Monitoring Program Analysis
DMD12 DMD14 DMD14 DMD12 C
D Transition monitoring – failure rate for drugs within classes of clinical concern
Transition Monitoring Program Analysis
DMD11 DMD13 DMD13 DMD11 C
D Use of Opioids at High Dosage and from Multiple Providers in Persons Without Cancer (OHDMP)
Prescription Drug Event (PDE) Data
DMD15
D Use of Opioids at High Dosage in Persons Without Cancer (OHD)
Prescription Drug Event (PDE) Data
DMD11 DMD18
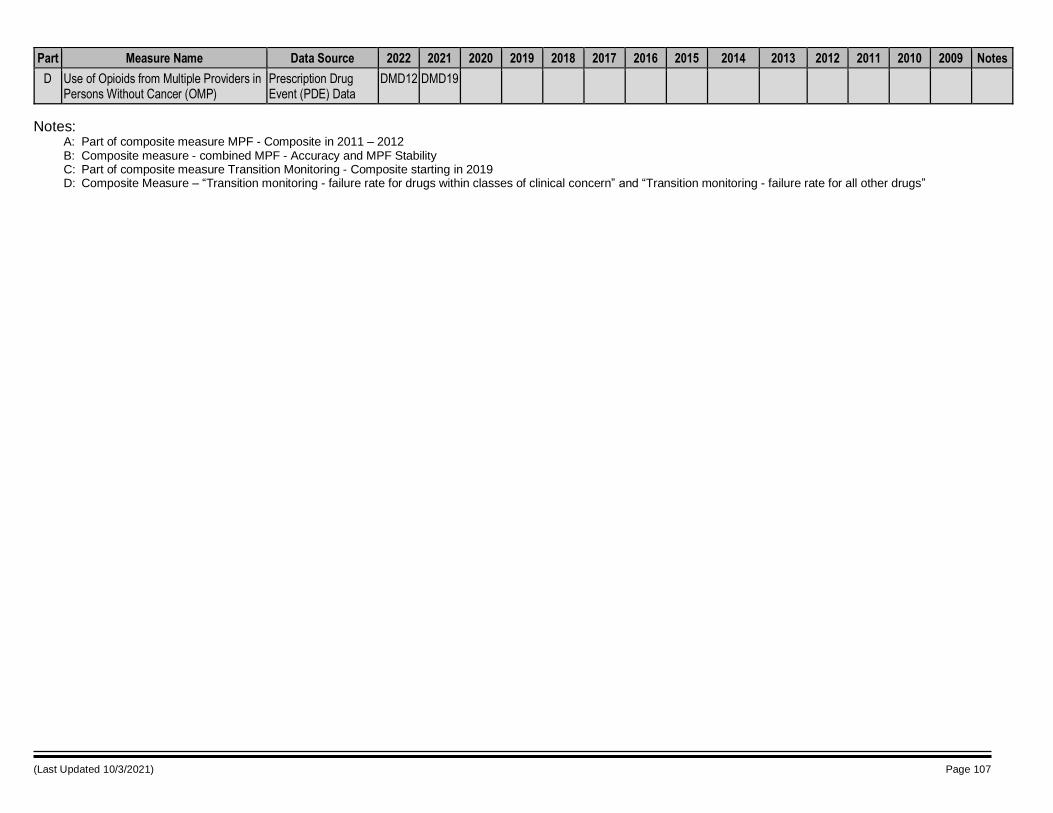
(Last Updated 10/3/2021) Page 107
Part Measure Name Data Source 2022 2021 2020 2019 2018 2017 2016 2015 2014 2013 2012 2011 2010 2009 Notes
D Use of Opioids from Multiple Providers in Persons Without Cancer (OMP)
Prescription Drug Event (PDE) Data
DMD12 DMD19
Notes: A: Part of composite measure MPF - Composite in 2011 – 2012 B: Composite measure - combined MPF - Accuracy and MPF Stability C: Part of composite measure Transition Monitoring - Composite starting in 2019 D: Composite Measure – “Transition monitoring - failure rate for drugs within classes of clinical concern” and “Transition monitoring - failure rate for all other drugs”
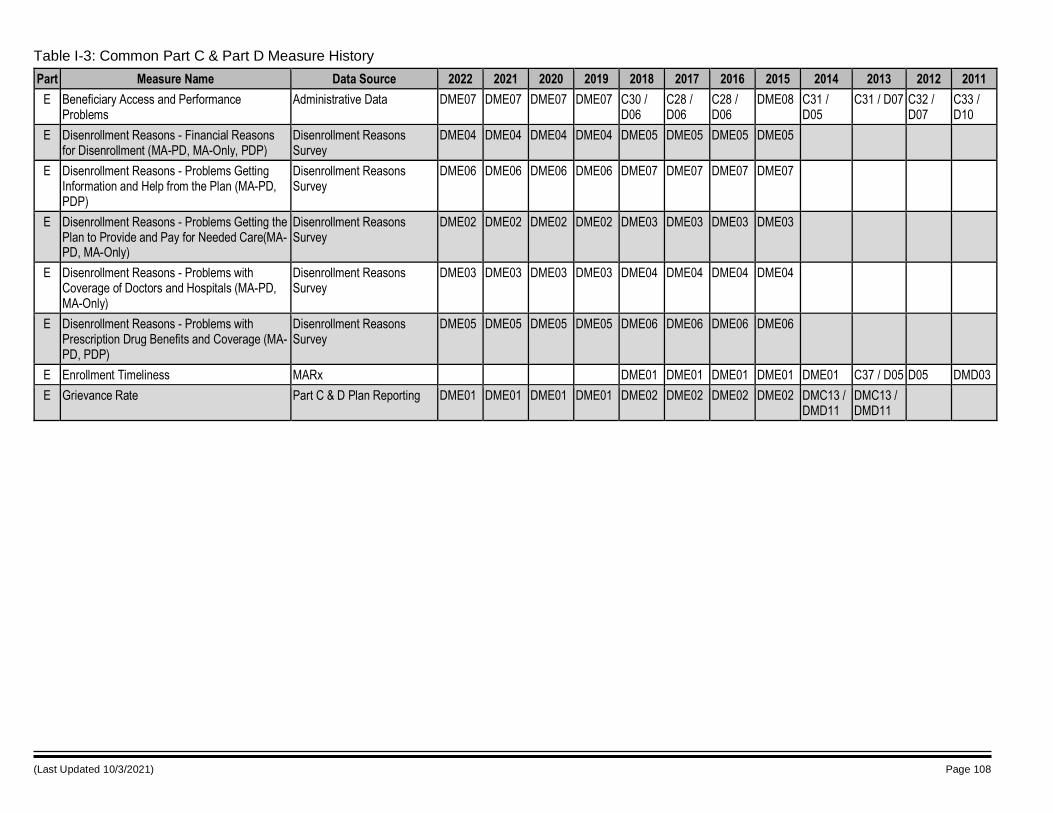
(Last Updated 10/3/2021) Page 108
Table I-3: Common Part C & Part D Measure History
Part Measure Name Data Source 2022 2021 2020 2019 2018 2017 2016 2015 2014 2013 2012 2011
E Beneficiary Access and Performance Problems
Administrative Data DME07 DME07 DME07 DME07 C30 / D06
C28 / D06
C28 / D06
DME08 C31 / D05
C31 / D07 C32 / D07
C33 / D10
E Disenrollment Reasons - Financial Reasons for Disenrollment (MA-PD, MA-Only, PDP)
Disenrollment Reasons Survey
DME04 DME04 DME04 DME04 DME05 DME05 DME05 DME05
E Disenrollment Reasons - Problems Getting Information and Help from the Plan (MA-PD, PDP)
Disenrollment Reasons Survey
DME06 DME06 DME06 DME06 DME07 DME07 DME07 DME07
E Disenrollment Reasons - Problems Getting the Plan to Provide and Pay for Needed Care(MA-PD, MA-Only)
Disenrollment Reasons Survey
DME02 DME02 DME02 DME02 DME03 DME03 DME03 DME03
E Disenrollment Reasons - Problems with Coverage of Doctors and Hospitals (MA-PD, MA-Only)
Disenrollment Reasons Survey
DME03 DME03 DME03 DME03 DME04 DME04 DME04 DME04
E Disenrollment Reasons - Problems with Prescription Drug Benefits and Coverage (MA-PD, PDP)
Disenrollment Reasons Survey
DME05 DME05 DME05 DME05 DME06 DME06 DME06 DME06
E Enrollment Timeliness MARx DME01 DME01 DME01 DME01 DME01 C37 / D05 D05 DMD03
E Grievance Rate Part C & D Plan Reporting DME01 DME01 DME01 DME01 DME02 DME02 DME02 DME02 DMC13 / DMD11
DMC13 / DMD11
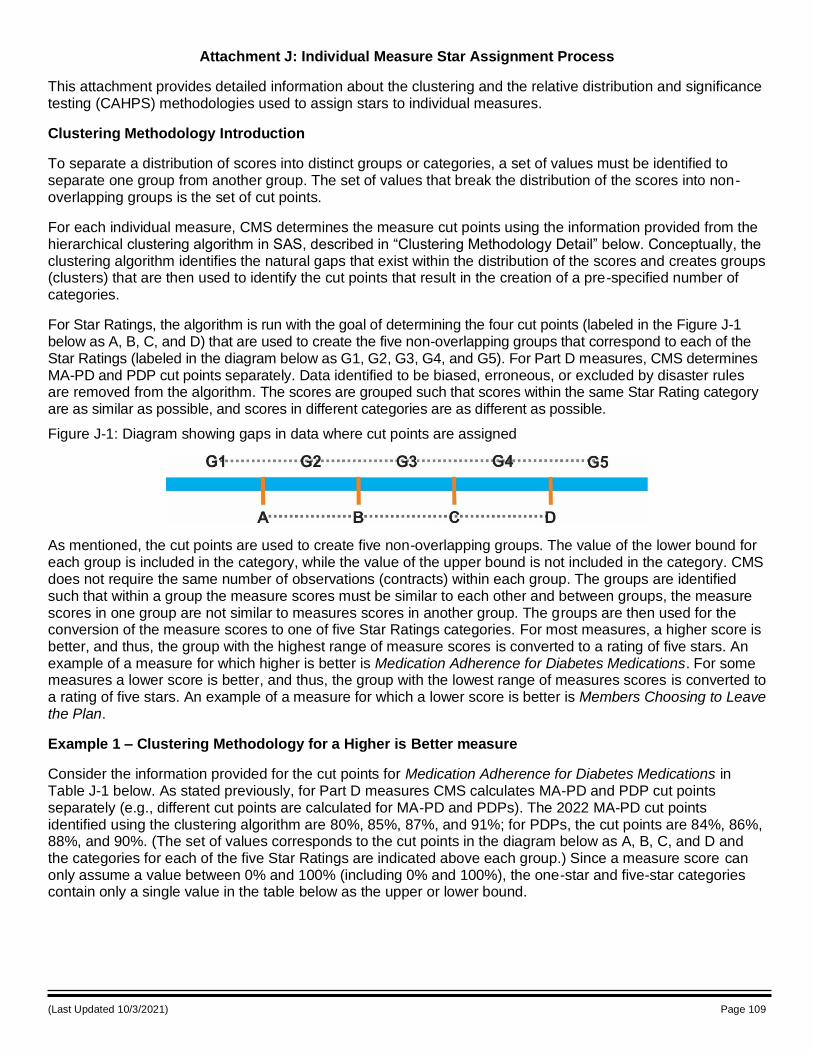
(Last Updated 10/3/2021) Page 109
Attachment J: Individual Measure Star Assignment Process
This attachment provides detailed information about the clustering and the relative distribution and significance testing (CAHPS) methodologies used to assign stars to individual measures.
Clustering Methodology Introduction
To separate a distribution of scores into distinct groups or categories, a set of values must be identified to separate one group from another group. The set of values that break the distribution of the scores into non-overlapping groups is the set of cut points.
For each individual measure, CMS determines the measure cut points using the information provided from the hierarchical clustering algorithm in SAS, described in “Clustering Methodology Detail” below. Conceptually, the clustering algorithm identifies the natural gaps that exist within the distribution of the scores and creates groups (clusters) that are then used to identify the cut points that result in the creation of a pre-specified number of categories.
For Star Ratings, the algorithm is run with the goal of determining the four cut points (labeled in the Figure J-1 below as A, B, C, and D) that are used to create the five non-overlapping groups that correspond to each of the Star Ratings (labeled in the diagram below as G1, G2, G3, G4, and G5). For Part D measures, CMS determines MA-PD and PDP cut points separately. Data identified to be biased, erroneous, or excluded by disaster rules are removed from the algorithm. The scores are grouped such that scores within the same Star Rating category are as similar as possible, and scores in different categories are as different as possible.
Figure J-1: Diagram showing gaps in data where cut points are assigned
As mentioned, the cut points are used to create five non-overlapping groups. The value of the lower bound for each group is included in the category, while the value of the upper bound is not included in the category. CMS does not require the same number of observations (contracts) within each group. The groups are identified such that within a group the measure scores must be similar to each other and between groups, the measure scores in one group are not similar to measures scores in another group. The groups are then used for the conversion of the measure scores to one of five Star Ratings categories. For most measures, a higher score is better, and thus, the group with the highest range of measure scores is converted to a rating of five stars. An example of a measure for which higher is better is Medication Adherence for Diabetes Medications. For some measures a lower score is better, and thus, the group with the lowest range of measures scores is converted to a rating of five stars. An example of a measure for which a lower score is better is Members Choosing to Leave the Plan.
Example 1 – Clustering Methodology for a Higher is Better measure
Consider the information provided for the cut points for Medication Adherence for Diabetes Medications in Table J-1 below. As stated previously, for Part D measures CMS calculates MA-PD and PDP cut points separately (e.g., different cut points are calculated for MA-PD and PDPs). The 2022 MA-PD cut points identified using the clustering algorithm are 80%, 85%, 87%, and 91%; for PDPs, the cut points are 84%, 86%, 88%, and 90%. (The set of values corresponds to the cut points in the diagram below as A, B, C, and D and the categories for each of the five Star Ratings are indicated above each group.) Since a measure score can only assume a value between 0% and 100% (including 0% and 100%), the one-star and five-star categories contain only a single value in the table below as the upper or lower bound.
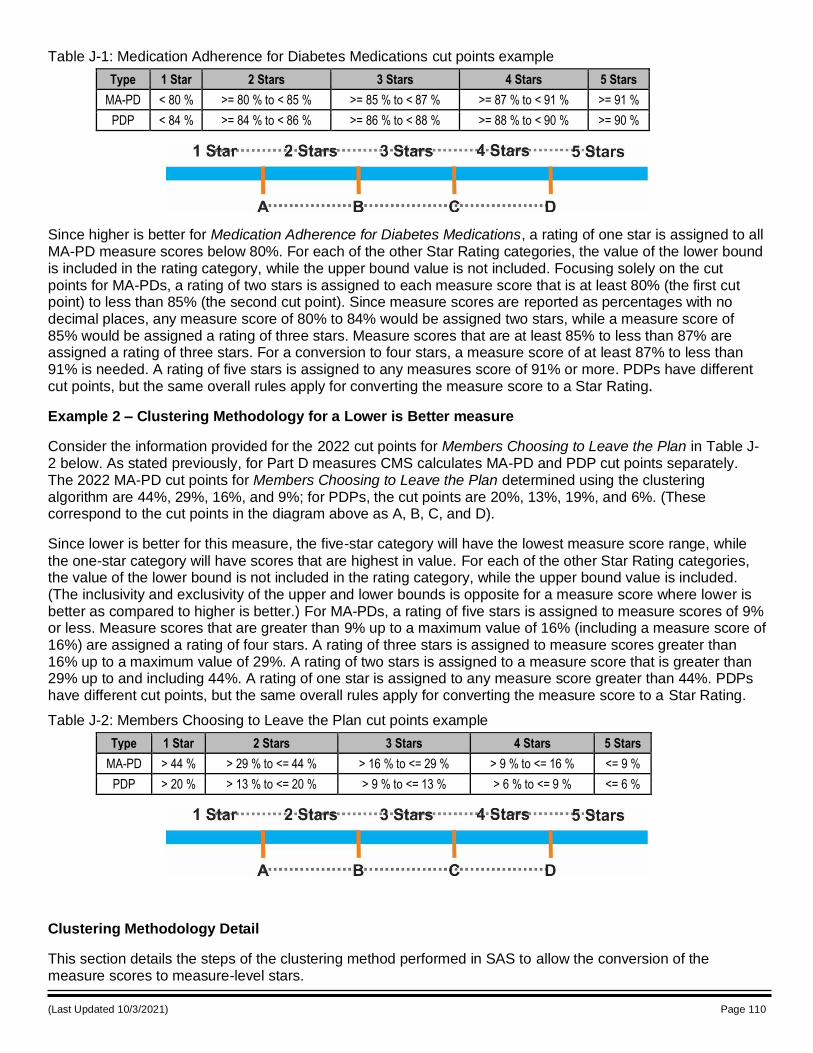
(Last Updated 10/3/2021) Page 110
Table J-1: Medication Adherence for Diabetes Medications cut points example
Type 1 Star 2 Stars 3 Stars 4 Stars 5 Stars
MA-PD < 80 % >= 80 % to < 85 % >= 85 % to < 87 % >= 87 % to < 91 % >= 91 %
PDP < 84 % >= 84 % to < 86 % >= 86 % to < 88 % >= 88 % to < 90 % >= 90 %
Since higher is better for Medication Adherence for Diabetes Medications, a rating of one star is assigned to all MA-PD measure scores below 80%. For each of the other Star Rating categories, the value of the lower bound is included in the rating category, while the upper bound value is not included. Focusing solely on the cut points for MA-PDs, a rating of two stars is assigned to each measure score that is at least 80% (the first cut point) to less than 85% (the second cut point). Since measure scores are reported as percentages with no decimal places, any measure score of 80% to 84% would be assigned two stars, while a measure score of 85% would be assigned a rating of three stars. Measure scores that are at least 85% to less than 87% are assigned a rating of three stars. For a conversion to four stars, a measure score of at least 87% to less than 91% is needed. A rating of five stars is assigned to any measures score of 91% or more. PDPs have different cut points, but the same overall rules apply for converting the measure score to a Star Rating.
Example 2 – Clustering Methodology for a Lower is Better measure
Consider the information provided for the 2022 cut points for Members Choosing to Leave the Plan in Table J-2 below. As stated previously, for Part D measures CMS calculates MA-PD and PDP cut points separately. The 2022 MA-PD cut points for Members Choosing to Leave the Plan determined using the clustering algorithm are 44%, 29%, 16%, and 9%; for PDPs, the cut points are 20%, 13%, 19%, and 6%. (These correspond to the cut points in the diagram above as A, B, C, and D).
Since lower is better for this measure, the five-star category will have the lowest measure score range, while
the one-star category will have scores that are highest in value. For each of the other Star Rating categories, the value of the lower bound is not included in the rating category, while the upper bound value is included. (The inclusivity and exclusivity of the upper and lower bounds is opposite for a measure score where lower is better as compared to higher is better.) For MA-PDs, a rating of five stars is assigned to measure scores of 9% or less. Measure scores that are greater than 9% up to a maximum value of 16% (including a measure score of 16%) are assigned a rating of four stars. A rating of three stars is assigned to measure scores greater than 16% up to a maximum value of 29%. A rating of two stars is assigned to a measure score that is greater than 29% up to and including 44%. A rating of one star is assigned to any measure score greater than 44%. PDPs have different cut points, but the same overall rules apply for converting the measure score to a Star Rating.
Table J-2: Members Choosing to Leave the Plan cut points example
Type 1 Star 2 Stars 3 Stars 4 Stars 5 Stars
MA-PD > 44 % > 29 % to <= 44 % > 16 % to <= 29 % > 9 % to <= 16 % <= 9 %
PDP > 20 % > 13 % to <= 20 % > 9 % to <= 13 % > 6 % to <= 9 % <= 6 %
Clustering Methodology Detail
This section details the steps of the clustering method performed in SAS to allow the conversion of the measure scores to measure-level stars.
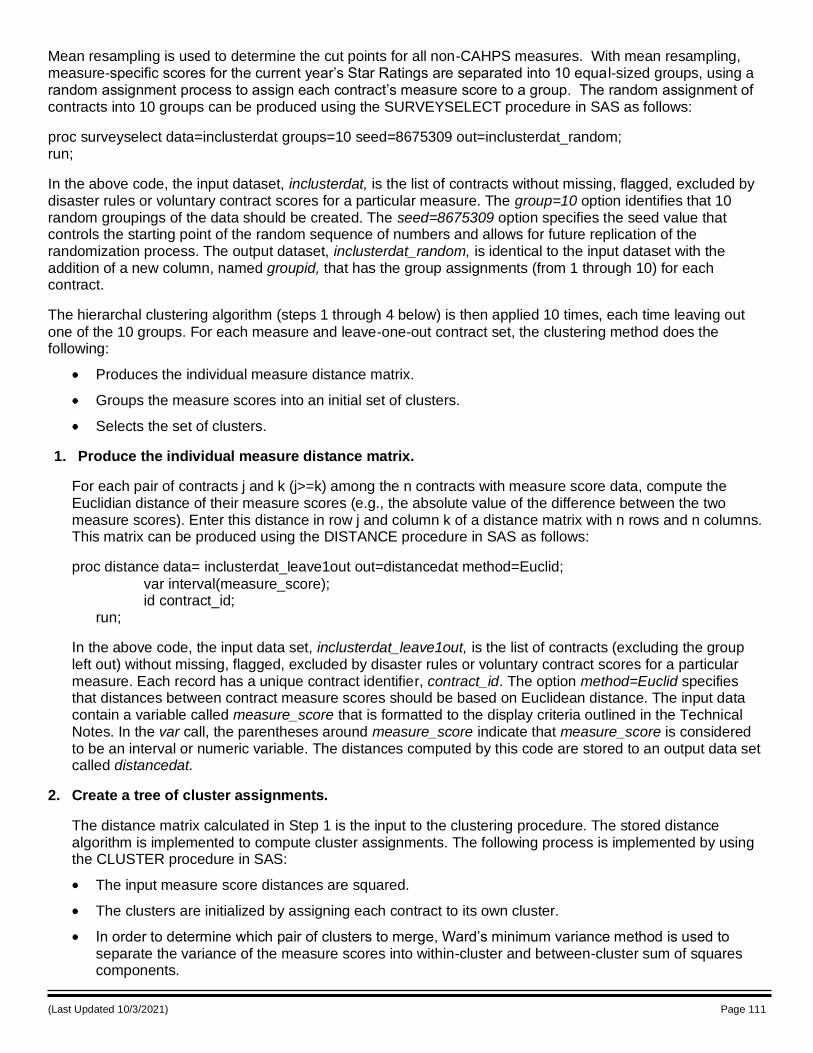
(Last Updated 10/3/2021) Page 111
Mean resampling is used to determine the cut points for all non-CAHPS measures. With mean resampling, measure-specific scores for the current year’s Star Ratings are separated into 10 equal-sized groups, using a random assignment process to assign each contract’s measure score to a group. The random assignment of contracts into 10 groups can be produced using the SURVEYSELECT procedure in SAS as follows:
proc surveyselect data=inclusterdat groups=10 seed=8675309 out=inclusterdat_random; run;
In the above code, the input dataset, inclusterdat, is the list of contracts without missing, flagged, excluded by disaster rules or voluntary contract scores for a particular measure. The group=10 option identifies that 10 random groupings of the data should be created. The seed=8675309 option specifies the seed value that controls the starting point of the random sequence of numbers and allows for future replication of the randomization process. The output dataset, inclusterdat_random, is identical to the input dataset with the addition of a new column, named groupid, that has the group assignments (from 1 through 10) for each contract.
The hierarchal clustering algorithm (steps 1 through 4 below) is then applied 10 times, each time leaving out
one of the 10 groups. For each measure and leave-one-out contract set, the clustering method does the following:
Produces the individual measure distance matrix.
Groups the measure scores into an initial set of clusters.
Selects the set of clusters.
1. Produce the individual measure distance matrix.
For each pair of contracts j and k (j>=k) among the n contracts with measure score data, compute the Euclidian distance of their measure scores (e.g., the absolute value of the difference between the two measure scores). Enter this distance in row j and column k of a distance matrix with n rows and n columns. This matrix can be produced using the DISTANCE procedure in SAS as follows:
proc distance data= inclusterdat_leave1out out=distancedat method=Euclid;
var interval(measure_score); id contract_id; run;
In the above code, the input data set, inclusterdat_leave1out, is the list of contracts (excluding the group left out) without missing, flagged, excluded by disaster rules or voluntary contract scores for a particular measure. Each record has a unique contract identifier, contract_id. The option method=Euclid specifies that distances between contract measure scores should be based on Euclidean distance. The input data contain a variable called measure_score that is formatted to the display criteria outlined in the Technical Notes. In the var call, the parentheses around measure_score indicate that measure_score is considered to be an interval or numeric variable. The distances computed by this code are stored to an output data set called distancedat.
2. Create a tree of cluster assignments.
The distance matrix calculated in Step 1 is the input to the clustering procedure. The stored distance algorithm is implemented to compute cluster assignments. The following process is implemented by using the CLUSTER procedure in SAS:
The input measure score distances are squared.
The clusters are initialized by assigning each contract to its own cluster.
In order to determine which pair of clusters to merge, Ward’s minimum variance method is used to separate the variance of the measure scores into within-cluster and between-cluster sum of squares components.
(Last Updated 10/3/2021) Page 112
From the existing clusters, two clusters are selected for merging to minimize the within-cluster sum of squares over all possible sets of clusters that might result from a merge.
Steps 3 and 4 are repeated to reduce the number of clusters by one until a single cluster containing all contracts results.
The result is a data set that contains a tree-like structure of cluster assignments, from which any number of clusters between 1 and the number of contract measure scores could be computed. The SAS code for implementing these steps is:
proc cluster data=distancedat method=ward outtree=treedat noprint; id contract_id; run;
The distancedat data set containing the Euclidian distances was created in Step 1. The option method=ward indicates that Ward’s minimum variance method should be used to group clusters. The output data set is denoted with the outtree option and is called treedat.
3. Select the final set of clusters from the tree of cluster assignments.
The process outlined in Step 2 will produce a tree of cluster assignments, from which the final number of clusters is selected using the TREE procedure in SAS as follows:
proc tree data=treedat ncl=NSTARS horizontal out=outclusterdat noprint; id contract_id; run;
The input data set, treedat, is created in Step 2 above. The syntax, ncl=NSTARS, denotes the desired final number of clusters (or star levels). For most measures, NSTARS= 5. In cases where multiple clusters have the same score value range those clusters are combined, leading to fewer than 5 clusters. Since the improvement measures have a constraint that contracts with improvement scores of zero or greater are to be assigned at least 3 stars for improvement, the clustering is conducted separately for contract measure scores that are greater than or equal to zero versus those that are less than zero. Specifically, Steps 1-3 are first applied to contracts with improvement scores that meet or exceed zero, in which case NSTARS equals three. The resulting improvement measure stars can take on values of 3, 4, or 5. For those contracts with improvement scores less than zero, Steps 1-3 are applied with NSTARS=2 and these contracts will either receive 1 or 2 stars.
4. Final Thresholds
The cluster assignments produced by the above approach have cluster labels that are unordered. The final step after applying the above steps to all contract measure scores is to order the cluster labels so that the 5-star category reflects the cluster with the best performance and the 1-star category reflects the cluster with the worst performance. With the exception of the improvement measures which are assigned lower thresholds of zero for the 3-star category, the measure thresholds are defined by examining the range of measure scores within each of the final clusters. The lower limit of each cluster becomes the cut point for the star categories.
Determining Stars from Scores and Thresholds
The mean-resampling approach results in 10 sets of measure-specific cut points, one for each of the 10 implementations of the hierarchical clustering algorithm. The final set of estimated thresholds are then calculated as the mean cut point for each threshold per measure from the 10 different cut point values. Tables J-3 and J-4 show the mean resampling estimated thresholds for the 2022 Star Ratings that are used to assign stars. The thresholds printed in measure details above use the observed scores in each star category. For higher-is-better measures, the minimum score observed in each star category defines the effective cut points for the star categories. For lower-is-better measures, the maximum score observed in each star category defines the effective cut points for the star categories.
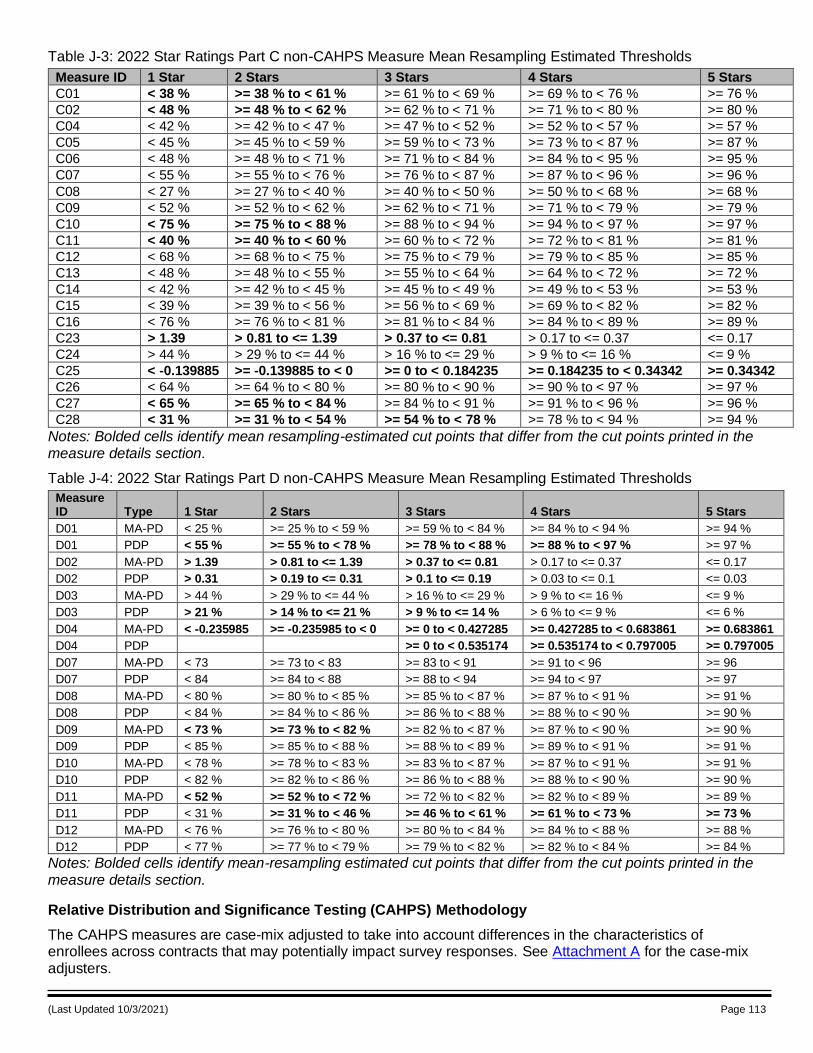
(Last Updated 10/3/2021) Page 113
Table J-3: 2022 Star Ratings Part C non-CAHPS Measure Mean Resampling Estimated Thresholds
Measure ID 1 Star 2 Stars 3 Stars 4 Stars 5 Stars
C01 < 38 % >= 38 % to < 61 % >= 61 % to < 69 % >= 69 % to < 76 % >= 76 %
C02 < 48 % >= 48 % to < 62 % >= 62 % to < 71 % >= 71 % to < 80 % >= 80 %
C04 < 42 % >= 42 % to < 47 % >= 47 % to < 52 % >= 52 % to < 57 % >= 57 %
C05 < 45 % >= 45 % to < 59 % >= 59 % to < 73 % >= 73 % to < 87 % >= 87 %
C06 < 48 % >= 48 % to < 71 % >= 71 % to < 84 % >= 84 % to < 95 % >= 95 %
C07 < 55 % >= 55 % to < 76 % >= 76 % to < 87 % >= 87 % to < 96 % >= 96 %
C08 < 27 % >= 27 % to < 40 % >= 40 % to < 50 % >= 50 % to < 68 % >= 68 %
C09 < 52 % >= 52 % to < 62 % >= 62 % to < 71 % >= 71 % to < 79 % >= 79 %
C10 < 75 % >= 75 % to < 88 % >= 88 % to < 94 % >= 94 % to < 97 % >= 97 %
C11 < 40 % >= 40 % to < 60 % >= 60 % to < 72 % >= 72 % to < 81 % >= 81 %
C12 < 68 % >= 68 % to < 75 % >= 75 % to < 79 % >= 79 % to < 85 % >= 85 %
C13 < 48 % >= 48 % to < 55 % >= 55 % to < 64 % >= 64 % to < 72 % >= 72 %
C14 < 42 % >= 42 % to < 45 % >= 45 % to < 49 % >= 49 % to < 53 % >= 53 %
C15 < 39 % >= 39 % to < 56 % >= 56 % to < 69 % >= 69 % to < 82 % >= 82 %
C16 < 76 % >= 76 % to < 81 % >= 81 % to < 84 % >= 84 % to < 89 % >= 89 %
C23 > 1.39 > 0.81 to <= 1.39 > 0.37 to <= 0.81 > 0.17 to <= 0.37 <= 0.17
C24 > 44 % > 29 % to <= 44 % > 16 % to <= 29 % > 9 % to <= 16 % <= 9 %
C25 < -0.139885 >= -0.139885 to < 0 >= 0 to < 0.184235 >= 0.184235 to < 0.34342 >= 0.34342
C26 < 64 % >= 64 % to < 80 % >= 80 % to < 90 % >= 90 % to < 97 % >= 97 %
C27 < 65 % >= 65 % to < 84 % >= 84 % to < 91 % >= 91 % to < 96 % >= 96 %
C28 < 31 % >= 31 % to < 54 % >= 54 % to < 78 % >= 78 % to < 94 % >= 94 %
Notes: Bolded cells identify mean resampling-estimated cut points that differ from the cut points printed in the measure details section.
Table J-4: 2022 Star Ratings Part D non-CAHPS Measure Mean Resampling Estimated Thresholds
Measure ID Type 1 Star 2 Stars 3 Stars 4 Stars 5 Stars
D01 MA-PD < 25 % >= 25 % to < 59 % >= 59 % to < 84 % >= 84 % to < 94 % >= 94 %
D01 PDP < 55 % >= 55 % to < 78 % >= 78 % to < 88 % >= 88 % to < 97 % >= 97 %
D02 MA-PD > 1.39 > 0.81 to <= 1.39 > 0.37 to <= 0.81 > 0.17 to <= 0.37 <= 0.17
D02 PDP > 0.31 > 0.19 to <= 0.31 > 0.1 to <= 0.19 > 0.03 to <= 0.1 <= 0.03
D03 MA-PD > 44 % > 29 % to <= 44 % > 16 % to <= 29 % > 9 % to <= 16 % <= 9 %
D03 PDP > 21 % > 14 % to <= 21 % > 9 % to <= 14 % > 6 % to <= 9 % <= 6 %
D04 MA-PD < -0.235985 >= -0.235985 to < 0 >= 0 to < 0.427285 >= 0.427285 to < 0.683861 >= 0.683861
D04 PDP >= 0 to < 0.535174 >= 0.535174 to < 0.797005 >= 0.797005
D07 MA-PD < 73 >= 73 to < 83 >= 83 to < 91 >= 91 to < 96 >= 96
D07 PDP < 84 >= 84 to < 88 >= 88 to < 94 >= 94 to < 97 >= 97
D08 MA-PD < 80 % >= 80 % to < 85 % >= 85 % to < 87 % >= 87 % to < 91 % >= 91 %
D08 PDP < 84 % >= 84 % to < 86 % >= 86 % to < 88 % >= 88 % to < 90 % >= 90 %
D09 MA-PD < 73 % >= 73 % to < 82 % >= 82 % to < 87 % >= 87 % to < 90 % >= 90 %
D09 PDP < 85 % >= 85 % to < 88 % >= 88 % to < 89 % >= 89 % to < 91 % >= 91 %
D10 MA-PD < 78 % >= 78 % to < 83 % >= 83 % to < 87 % >= 87 % to < 91 % >= 91 %
D10 PDP < 82 % >= 82 % to < 86 % >= 86 % to < 88 % >= 88 % to < 90 % >= 90 %
D11 MA-PD < 52 % >= 52 % to < 72 % >= 72 % to < 82 % >= 82 % to < 89 % >= 89 %
D11 PDP < 31 % >= 31 % to < 46 % >= 46 % to < 61 % >= 61 % to < 73 % >= 73 %
D12 MA-PD < 76 % >= 76 % to < 80 % >= 80 % to < 84 % >= 84 % to < 88 % >= 88 %
D12 PDP < 77 % >= 77 % to < 79 % >= 79 % to < 82 % >= 82 % to < 84 % >= 84 %
Notes: Bolded cells identify mean-resampling estimated cut points that differ from the cut points printed in the measure details section.
Relative Distribution and Significance Testing (CAHPS) Methodology
The CAHPS measures are case-mix adjusted to take into account differences in the characteristics of enrollees across contracts that may potentially impact survey responses. See Attachment A for the case-mix adjusters.
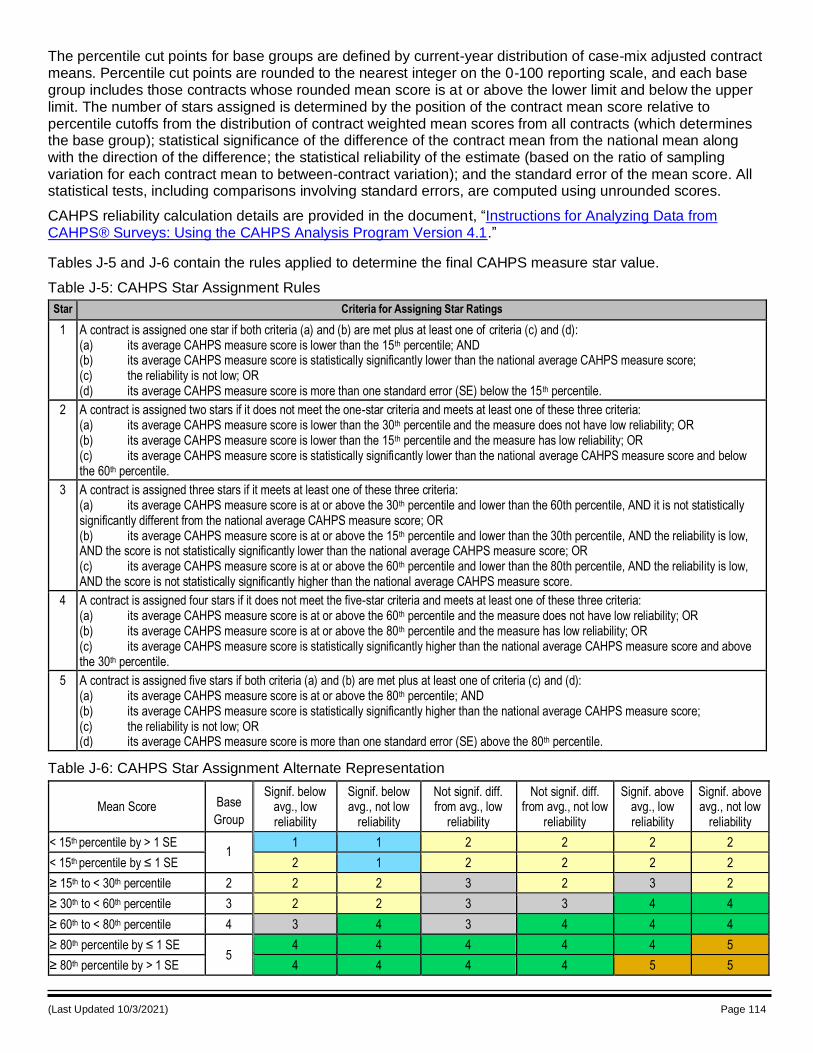
(Last Updated 10/3/2021) Page 114
The percentile cut points for base groups are defined by current-year distribution of case-mix adjusted contract means. Percentile cut points are rounded to the nearest integer on the 0-100 reporting scale, and each base group includes those contracts whose rounded mean score is at or above the lower limit and below the upper limit. The number of stars assigned is determined by the position of the contract mean score relative to percentile cutoffs from the distribution of contract weighted mean scores from all contracts (which determines the base group); statistical significance of the difference of the contract mean from the national mean along with the direction of the difference; the statistical reliability of the estimate (based on the ratio of sampling variation for each contract mean to between-contract variation); and the standard error of the mean score. All statistical tests, including comparisons involving standard errors, are computed using unrounded scores.
CAHPS reliability calculation details are provided in the document, “Instructions for Analyzing Data from CAHPS® Surveys: Using the CAHPS Analysis Program Version 4.1.”
Tables J-5 and J-6 contain the rules applied to determine the final CAHPS measure star value.
Table J-5: CAHPS Star Assignment Rules
Star Criteria for Assigning Star Ratings
1 A contract is assigned one star if both criteria (a) and (b) are met plus at least one of criteria (c) and (d): (a) its average CAHPS measure score is lower than the 15th percentile; AND (b) its average CAHPS measure score is statistically significantly lower than the national average CAHPS measure score; (c) the reliability is not low; OR (d) its average CAHPS measure score is more than one standard error (SE) below the 15th percentile.
2 A contract is assigned two stars if it does not meet the one-star criteria and meets at least one of these three criteria: (a) its average CAHPS measure score is lower than the 30th percentile and the measure does not have low reliability; OR (b) its average CAHPS measure score is lower than the 15th percentile and the measure has low reliability; OR (c) its average CAHPS measure score is statistically significantly lower than the national average CAHPS measure score and below the 60th percentile.
3 A contract is assigned three stars if it meets at least one of these three criteria: (a) its average CAHPS measure score is at or above the 30th percentile and lower than the 60th percentile, AND it is not statistically significantly different from the national average CAHPS measure score; OR (b) its average CAHPS measure score is at or above the 15th percentile and lower than the 30th percentile, AND the reliability is low, AND the score is not statistically significantly lower than the national average CAHPS measure score; OR (c) its average CAHPS measure score is at or above the 60th percentile and lower than the 80th percentile, AND the reliability is low, AND the score is not statistically significantly higher than the national average CAHPS measure score.
4 A contract is assigned four stars if it does not meet the five-star criteria and meets at least one of these three criteria: (a) its average CAHPS measure score is at or above the 60th percentile and the measure does not have low reliability; OR (b) its average CAHPS measure score is at or above the 80th percentile and the measure has low reliability; OR (c) its average CAHPS measure score is statistically significantly higher than the national average CAHPS measure score and above the 30th percentile.
5 A contract is assigned five stars if both criteria (a) and (b) are met plus at least one of criteria (c) and (d): (a) its average CAHPS measure score is at or above the 80th percentile; AND (b) its average CAHPS measure score is statistically significantly higher than the national average CAHPS measure score; (c) the reliability is not low; OR (d) its average CAHPS measure score is more than one standard error (SE) above the 80th percentile.
Table J-6: CAHPS Star Assignment Alternate Representation
Mean Score Base
Group
Signif. below avg., low reliability
Signif. below avg., not low
reliability
Not signif. diff. from avg., low
reliability
Not signif. diff. from avg., not low
reliability
Signif. above avg., low reliability
Signif. above avg., not low
reliability
< 15th percentile by > 1 SE 1
1 1 2 2 2 2
< 15th percentile by ≤ 1 SE 2 1 2 2 2 2
≥ 15th to < 30th percentile 2 2 2 3 2 3 2
≥ 30th to < 60th percentile 3 2 2 3 3 4 4
≥ 60th to < 80th percentile 4 3 4 3 4 4 4
≥ 80th percentile by ≤ 1 SE 5
4 4 4 4 4 5
≥ 80th percentile by > 1 SE 4 4 4 4 5 5
(Last Updated 10/3/2021) Page 115
Notes: If reliability is very low (<0.60), the contract does not receive a Star Rating. Low reliability scores are defined as those with at least 11 respondents and reliability ≥0.60 but <0.75 and also in the lowest 12% of contracts ordered by reliability. The SE is considered when the measure score is below the 15 th percentile (in base group 1), significantly below average, and has low reliability: in this case, 1 star is assigned if and only if the measure score is at least 1 SE below the unrounded base group 1/2 cut point. Similarly, the SE is considered when the measure score is at or above the 80th percentile (in base group 5), significantly above average, and has low reliability: in this case, 5 stars are assigned if and only if the measure score is at least 1 SE above the unrounded base group 4/5 cut point.
For example, a contract in base group 4 that was not significantly different from average and had low reliability would receive 3 final stars.
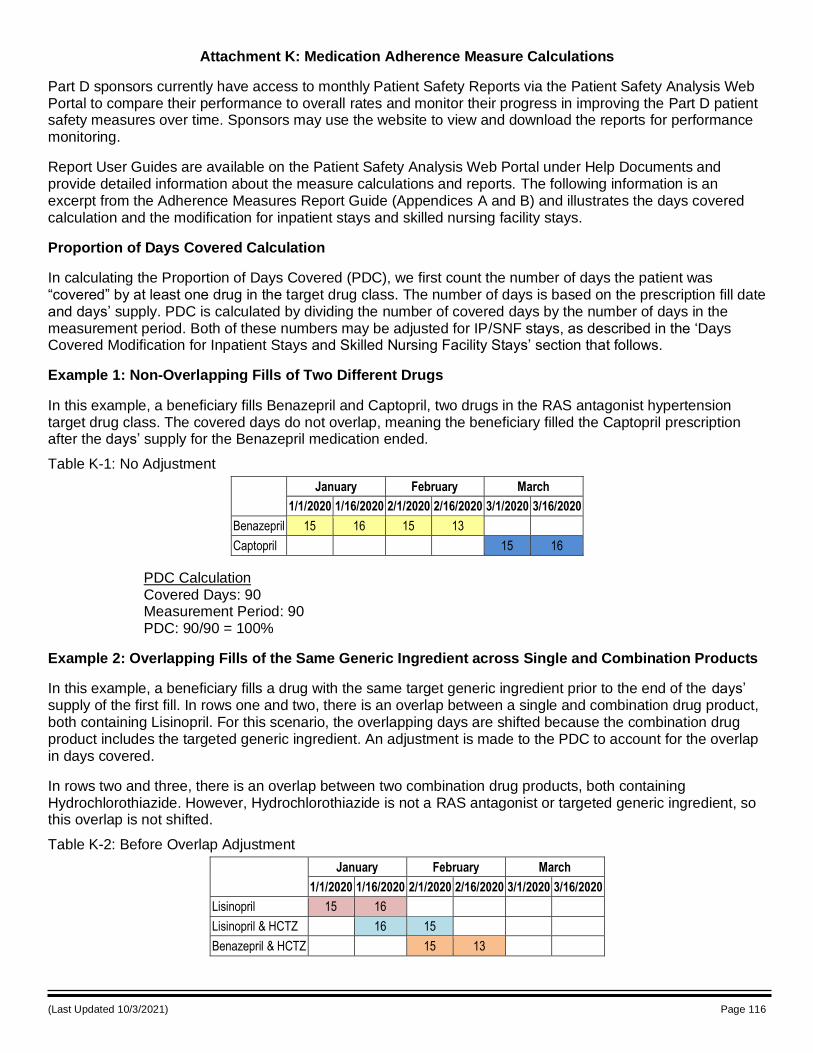
(Last Updated 10/3/2021) Page 116
Attachment K: Medication Adherence Measure Calculations
Part D sponsors currently have access to monthly Patient Safety Reports via the Patient Safety Analysis Web Portal to compare their performance to overall rates and monitor their progress in improving the Part D patient safety measures over time. Sponsors may use the website to view and download the reports for performance monitoring.
Report User Guides are available on the Patient Safety Analysis Web Portal under Help Documents and provide detailed information about the measure calculations and reports. The following information is an excerpt from the Adherence Measures Report Guide (Appendices A and B) and illustrates the days covered calculation and the modification for inpatient stays and skilled nursing facility stays.
Proportion of Days Covered Calculation
In calculating the Proportion of Days Covered (PDC), we first count the number of days the patient was “covered” by at least one drug in the target drug class. The number of days is based on the prescription fill date and days’ supply. PDC is calculated by dividing the number of covered days by the number of days in the measurement period. Both of these numbers may be adjusted for IP/SNF stays, as described in the ‘Days Covered Modification for Inpatient Stays and Skilled Nursing Facility Stays’ section that follows.
Example 1: Non-Overlapping Fills of Two Different Drugs
In this example, a beneficiary fills Benazepril and Captopril, two drugs in the RAS antagonist hypertension target drug class. The covered days do not overlap, meaning the beneficiary filled the Captopril prescription after the days’ supply for the Benazepril medication ended.
Table K-1: No Adjustment
January February March
1/1/2020 1/16/2020 2/1/2020 2/16/2020 3/1/2020 3/16/2020
Benazepril 15 16 15 13
Captopril 15 16
PDC Calculation Covered Days: 90 Measurement Period: 90 PDC: 90/90 = 100%
Example 2: Overlapping Fills of the Same Generic Ingredient across Single and Combination Products
In this example, a beneficiary fills a drug with the same target generic ingredient prior to the end of the days’ supply of the first fill. In rows one and two, there is an overlap between a single and combination drug product, both containing Lisinopril. For this scenario, the overlapping days are shifted because the combination drug product includes the targeted generic ingredient. An adjustment is made to the PDC to account for the overlap in days covered.
In rows two and three, there is an overlap between two combination drug products, both containing Hydrochlorothiazide. However, Hydrochlorothiazide is not a RAS antagonist or targeted generic ingredient, so this overlap is not shifted.
Table K-2: Before Overlap Adjustment
January February March
1/1/2020 1/16/2020 2/1/2020 2/16/2020 3/1/2020 3/16/2020
Lisinopril 15 16
Lisinopril & HCTZ 16 15
Benazepril & HCTZ 15 13
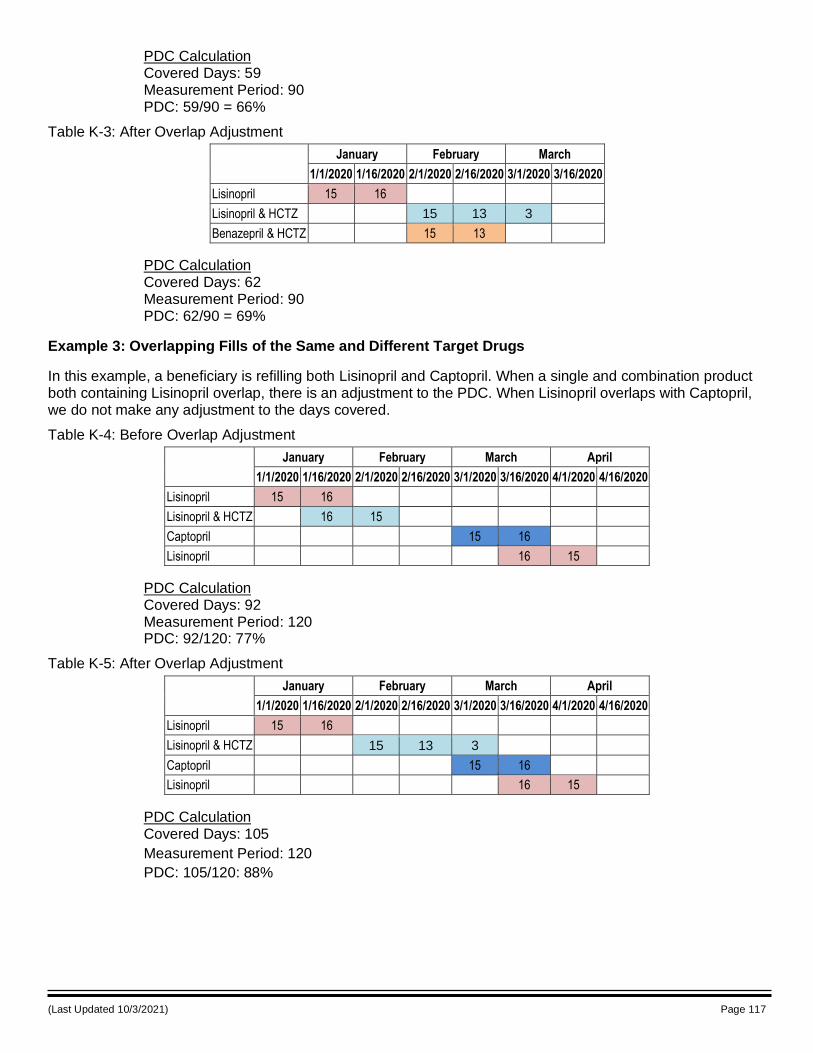
(Last Updated 10/3/2021) Page 117
PDC Calculation Covered Days: 59 Measurement Period: 90 PDC: 59/90 = 66%
Table K-3: After Overlap Adjustment
January February March
1/1/2020 1/16/2020 2/1/2020 2/16/2020 3/1/2020 3/16/2020
Lisinopril 15 16
Lisinopril & HCTZ 15 13 3
Benazepril & HCTZ 15 13
PDC Calculation Covered Days: 62 Measurement Period: 90 PDC: 62/90 = 69%
Example 3: Overlapping Fills of the Same and Different Target Drugs
In this example, a beneficiary is refilling both Lisinopril and Captopril. When a single and combination product both containing Lisinopril overlap, there is an adjustment to the PDC. When Lisinopril overlaps with Captopril, we do not make any adjustment to the days covered.
Table K-4: Before Overlap Adjustment
January February March April
1/1/2020 1/16/2020 2/1/2020 2/16/2020 3/1/2020 3/16/2020 4/1/2020 4/16/2020
Lisinopril 15 16
Lisinopril & HCTZ 16 15
Captopril 15 16
Lisinopril 16 15
PDC Calculation Covered Days: 92 Measurement Period: 120 PDC: 92/120: 77%
Table K-5: After Overlap Adjustment
January February March April
1/1/2020 1/16/2020 2/1/2020 2/16/2020 3/1/2020 3/16/2020 4/1/2020 4/16/2020
Lisinopril 15 16
Lisinopril & HCTZ 15 13 3
Captopril 15 16
Lisinopril 16 15
PDC Calculation Covered Days: 105
Measurement Period: 120
PDC: 105/120: 88%
(Last Updated 10/3/2021) Page 118
PDC Adjustment for Inpatient, Hospice, and Skilled Nursing Facility Stays Examples
In response to Part D sponsor feedback, CMS modified the PDC calculation, starting with the 2013 Star Ratings (using 2011 PDE data) to adjust for beneficiary stays in inpatient (IP) facilities, and with the 2015 Star Ratings (using 2013 PDE data) to also adjust for hospice enrollments and beneficiary stays in skilled nursing facilities (SNF). These adjustments account for periods that the Part D sponsor would not be responsible for providing prescription fills for targeted medications or more accurately reflect drugs covered under the hospice benefit or waived through the beneficiary’s hospice election; thus, their medication fills during an IP or SNF stay or during hospice enrollment would not be included in the PDE claims used to calculate the Patient Safety adherence measures.
The PDC modification for IP stays, hospice enrollments, and SNF stays reflects this situation. Please note that while this modification will enhance the adherence measure calculation, extensive testing indicates that most Part D contracts will experience a negligible impact on their adherence rates. On average, the 2011 adherence rates increased 0.4 to 0.6 percentage points due to the inpatient stay adjustment, and the adjustment may impact the rates positively or negatively.
The hospice and SNF adjustments were tested on 2013 PDE data and overall increased the rates by 0.13 to 0.15 percentage points and 0.29 to 0.35 percentage points, respectively. Hospice information from the Medicare Enrollment Database (EDB) and inpatient claims from the Common Working File (CWF) are available for both PDPs and MA-PDs. SNF claims from the CWF have been used to adjust the SNF PDC adjustments for PDPs. Starting in the 2019 measurement year, when available for MA-PDs in the CWF, adjust the SNF PDC adjustments. Additionally, starting in 2019 measurement year, when available for MA-PDs in the encounter data, adjust for SNF/IP stays for MA-PD beneficiaries. Additionally, starting in 2020 measurement year, when available for MA-PDs in the encounter data, adjust for SNF/IP stays for MA-PD beneficiaries.
Note: Hospice enrollment is no longer a PDC adjustment but rather an exclusion starting with the 2021 Star
Ratings (2020 YOS).
Calculating the PDC Adjustment for IP Stays and SNF Stays
The PDC modification for IP stays and SNF stays is based on two assumptions: 1) a beneficiary receives their medications through the facility during the IP or SNF stay, and 2) if a beneficiary accumulates an extra supply of their Part D medication during an IP stay or SNF stay, that supply can be used once he/she returns home. The modification is applied using the steps below:
Identify start and end dates of relevant types of stays for beneficiaries included in adherence measures. The discharge date is included in the PDC adjustment.
o Use IP claims from the CWF to identify IP stays, and when available for MA-PDs.
o Use SNF claims from the CWF for PDPs, and when available for MA-PD beneficiaries, for SNF PDC adjustments. (1) Use SNF claims from the CWF with either a positive or negative paid amount with Medicare utilization days to identify Medicare Part A covered SNF stays. (2) Use SNF claims from the CWF with a condition code 04 (Beneficiary enrolled in a MA-PD) not associated with a condition code 21 and/or a no payment reason code.
o Use IP and SNF stay encounter data when available for MA-PD beneficiaries. Additionally, if IP and SNF stay claims for MA-PD enrolled beneficiaries are reported in the CWF, the CWF will remain as an additional data source.
Remove days of relevant stays occurring during the measurement period from the numerator and denominator of the proportion of days covered calculation.
Shift days’ supply from Part D prescription fills that overlap with the stay or subsequent fills for the same drug class to uncovered days after the end of the relevant stay, if applicable. This assumes the beneficiary receives the relevant medication from a different source during the stay and accumulates the Part D prescription fills for later use.
If SNF and IP stays cover a beneficiary’s entire enrollment episode that meets the inclusion criteria, the associated proportion of member-years is not included in the rate calculation. Consequently, if SNF and IP
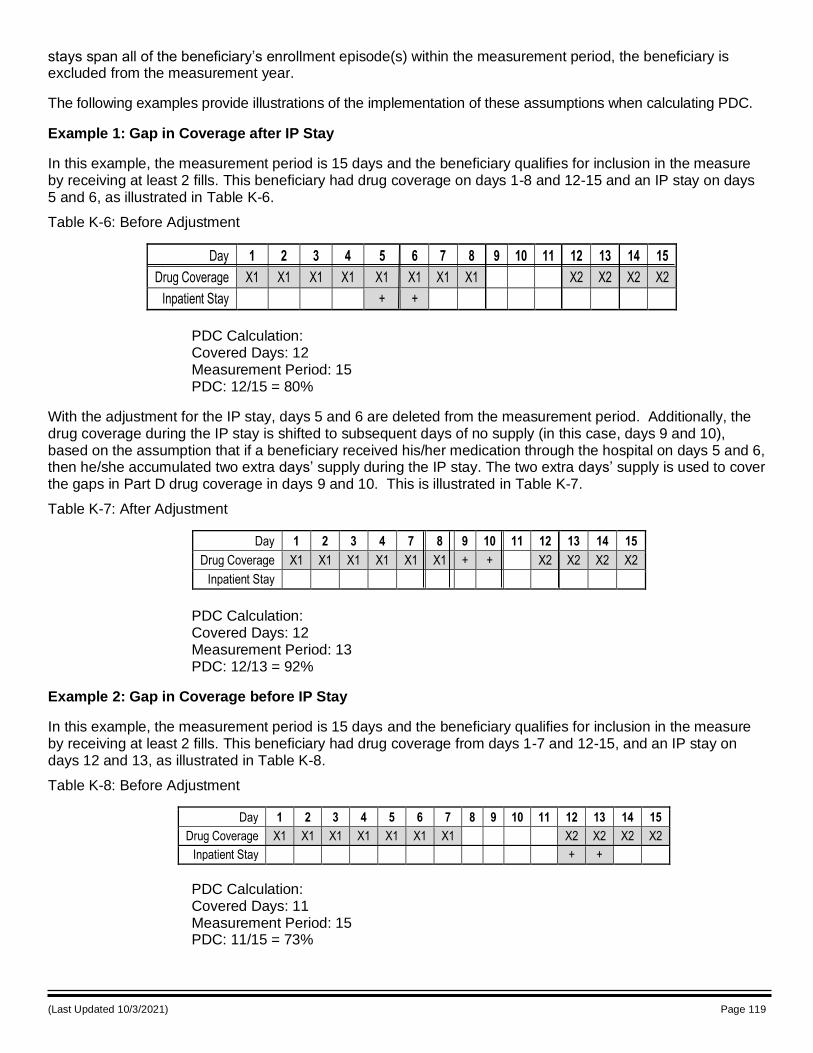
(Last Updated 10/3/2021) Page 119
stays span all of the beneficiary’s enrollment episode(s) within the measurement period, the beneficiary is excluded from the measurement year.
The following examples provide illustrations of the implementation of these assumptions when calculating PDC.
Example 1: Gap in Coverage after IP Stay
In this example, the measurement period is 15 days and the beneficiary qualifies for inclusion in the measure by receiving at least 2 fills. This beneficiary had drug coverage on days 1-8 and 12-15 and an IP stay on days 5 and 6, as illustrated in Table K-6.
Table K-6: Before Adjustment
Day 1 2 3 4 5 6 7 8 9 10 11 12 13 14 15
Drug Coverage X1 X1 X1 X1 X1 X1 X1 X1 X2 X2 X2 X2
Inpatient Stay + +
PDC Calculation: Covered Days: 12 Measurement Period: 15 PDC: 12/15 = 80%
With the adjustment for the IP stay, days 5 and 6 are deleted from the measurement period. Additionally, the drug coverage during the IP stay is shifted to subsequent days of no supply (in this case, days 9 and 10), based on the assumption that if a beneficiary received his/her medication through the hospital on days 5 and 6, then he/she accumulated two extra days’ supply during the IP stay. The two extra days’ supply is used to cover the gaps in Part D drug coverage in days 9 and 10. This is illustrated in Table K-7.
Table K-7: After Adjustment
Day 1 2 3 4 7 8 9 10 11 12 13 14 15
Drug Coverage X1 X1 X1 X1 X1 X1 + + X2 X2 X2 X2
Inpatient Stay
PDC Calculation: Covered Days: 12 Measurement Period: 13 PDC: 12/13 = 92%
Example 2: Gap in Coverage before IP Stay
In this example, the measurement period is 15 days and the beneficiary qualifies for inclusion in the measure by receiving at least 2 fills. This beneficiary had drug coverage from days 1-7 and 12-15, and an IP stay on days 12 and 13, as illustrated in Table K-8.
Table K-8: Before Adjustment
Day 1 2 3 4 5 6 7 8 9 10 11 12 13 14 15
Drug Coverage X1 X1 X1 X1 X1 X1 X1 X2 X2 X2 X2
Inpatient Stay + +
PDC Calculation: Covered Days: 11 Measurement Period: 15 PDC: 11/15 = 73%
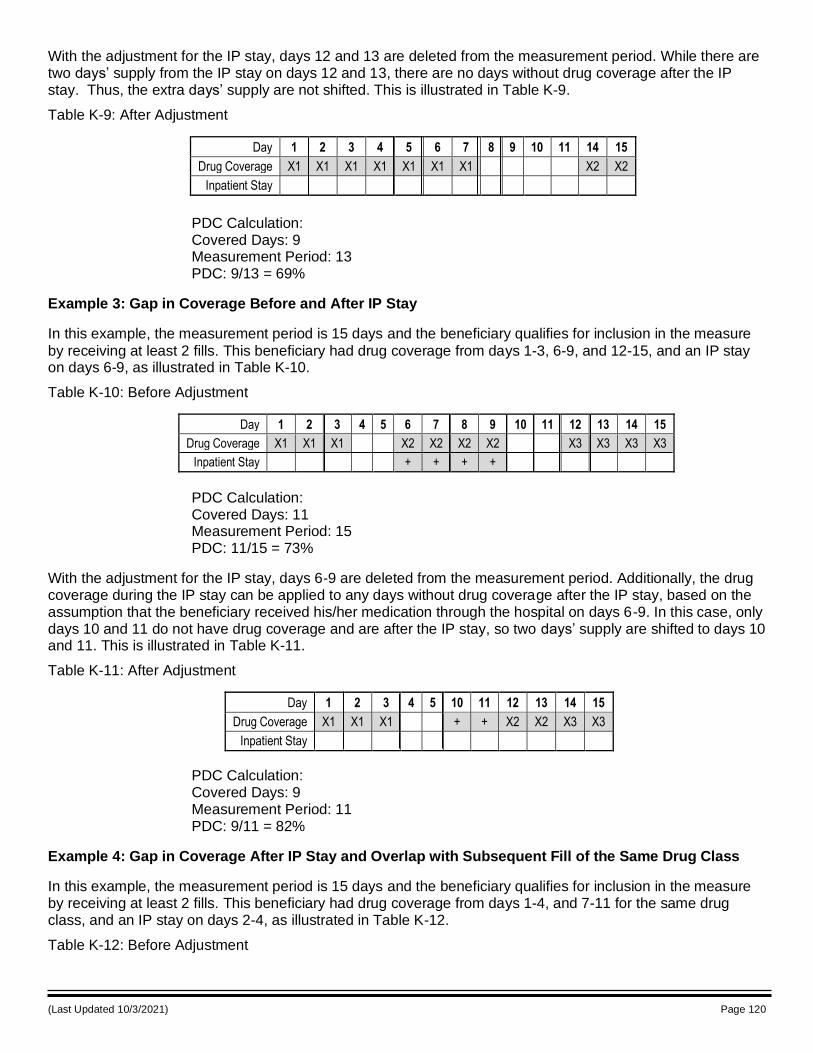
(Last Updated 10/3/2021) Page 120
With the adjustment for the IP stay, days 12 and 13 are deleted from the measurement period. While there are two days’ supply from the IP stay on days 12 and 13, there are no days without drug coverage after the IP stay. Thus, the extra days’ supply are not shifted. This is illustrated in Table K-9.
Table K-9: After Adjustment
Day 1 2 3 4 5 6 7 8 9 10 11 14 15
Drug Coverage X1 X1 X1 X1 X1 X1 X1 X2 X2
Inpatient Stay
PDC Calculation: Covered Days: 9 Measurement Period: 13 PDC: 9/13 = 69%
Example 3: Gap in Coverage Before and After IP Stay
In this example, the measurement period is 15 days and the beneficiary qualifies for inclusion in the measure
by receiving at least 2 fills. This beneficiary had drug coverage from days 1-3, 6-9, and 12-15, and an IP stay on days 6-9, as illustrated in Table K-10.
Table K-10: Before Adjustment
Day 1 2 3 4 5 6 7 8 9 10 11 12 13 14 15
Drug Coverage X1 X1 X1 X2 X2 X2 X2 X3 X3 X3 X3
Inpatient Stay + + + +
PDC Calculation: Covered Days: 11 Measurement Period: 15 PDC: 11/15 = 73%
With the adjustment for the IP stay, days 6-9 are deleted from the measurement period. Additionally, the drug coverage during the IP stay can be applied to any days without drug coverage after the IP stay, based on the assumption that the beneficiary received his/her medication through the hospital on days 6-9. In this case, only days 10 and 11 do not have drug coverage and are after the IP stay, so two days’ supply are shifted to days 10 and 11. This is illustrated in Table K-11.
Table K-11: After Adjustment
Day 1 2 3 4 5 10 11 12 13 14 15
Drug Coverage X1 X1 X1 + + X2 X2 X3 X3
Inpatient Stay
PDC Calculation: Covered Days: 9 Measurement Period: 11 PDC: 9/11 = 82%
Example 4: Gap in Coverage After IP Stay and Overlap with Subsequent Fill of the Same Drug Class
In this example, the measurement period is 15 days and the beneficiary qualifies for inclusion in the measure by receiving at least 2 fills. This beneficiary had drug coverage from days 1-4, and 7-11 for the same drug class, and an IP stay on days 2-4, as illustrated in Table K-12.
Table K-12: Before Adjustment
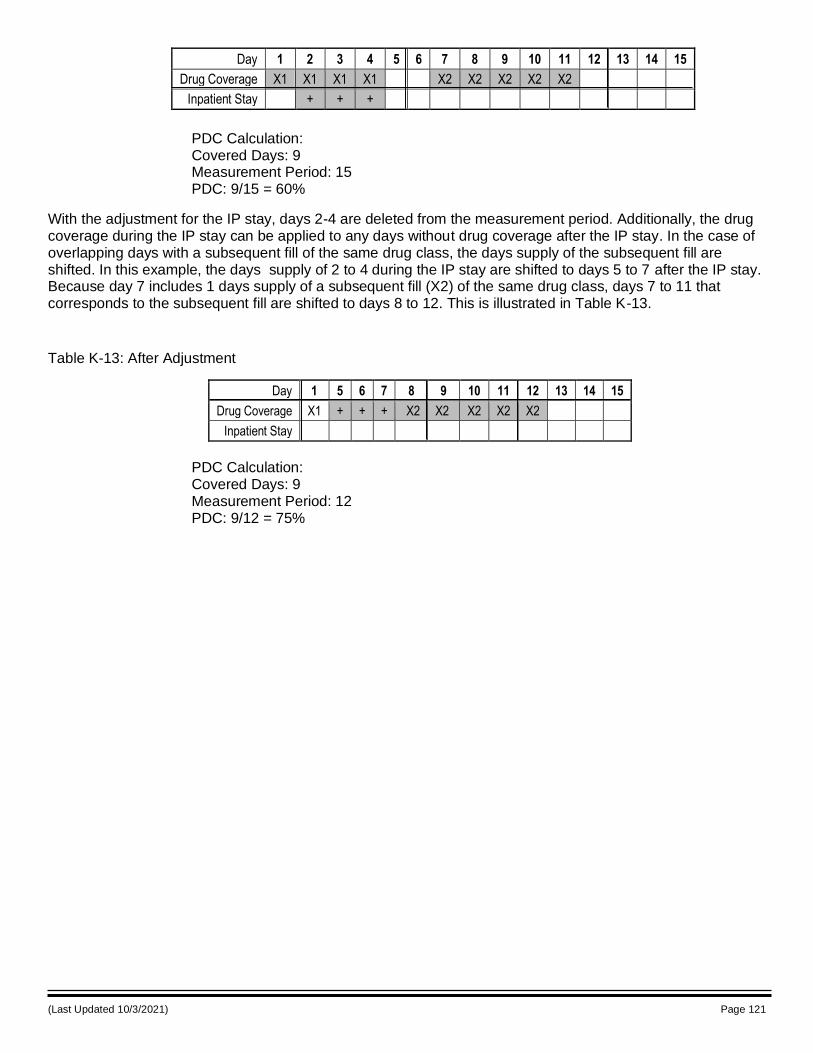
(Last Updated 10/3/2021) Page 121
Day 1 2 3 4 5 6 7 8 9 10 11 12 13 14 15
Drug Coverage X1 X1 X1 X1 X2 X2 X2 X2 X2
Inpatient Stay + + +
PDC Calculation: Covered Days: 9 Measurement Period: 15 PDC: 9/15 = 60%
With the adjustment for the IP stay, days 2-4 are deleted from the measurement period. Additionally, the drug coverage during the IP stay can be applied to any days without drug coverage after the IP stay. In the case of overlapping days with a subsequent fill of the same drug class, the days supply of the subsequent fill are shifted. In this example, the days supply of 2 to 4 during the IP stay are shifted to days 5 to 7 after the IP stay. Because day 7 includes 1 days supply of a subsequent fill (X2) of the same drug class, days 7 to 11 that corresponds to the subsequent fill are shifted to days 8 to 12. This is illustrated in Table K-13.
Table K-13: After Adjustment
Day 1 5 6 7 8 9 10 11 12 13 14 15
Drug Coverage X1 + + + X2 X2 X2 X2 X2
Inpatient Stay
PDC Calculation: Covered Days: 9 Measurement Period: 12 PDC: 9/12 = 75%
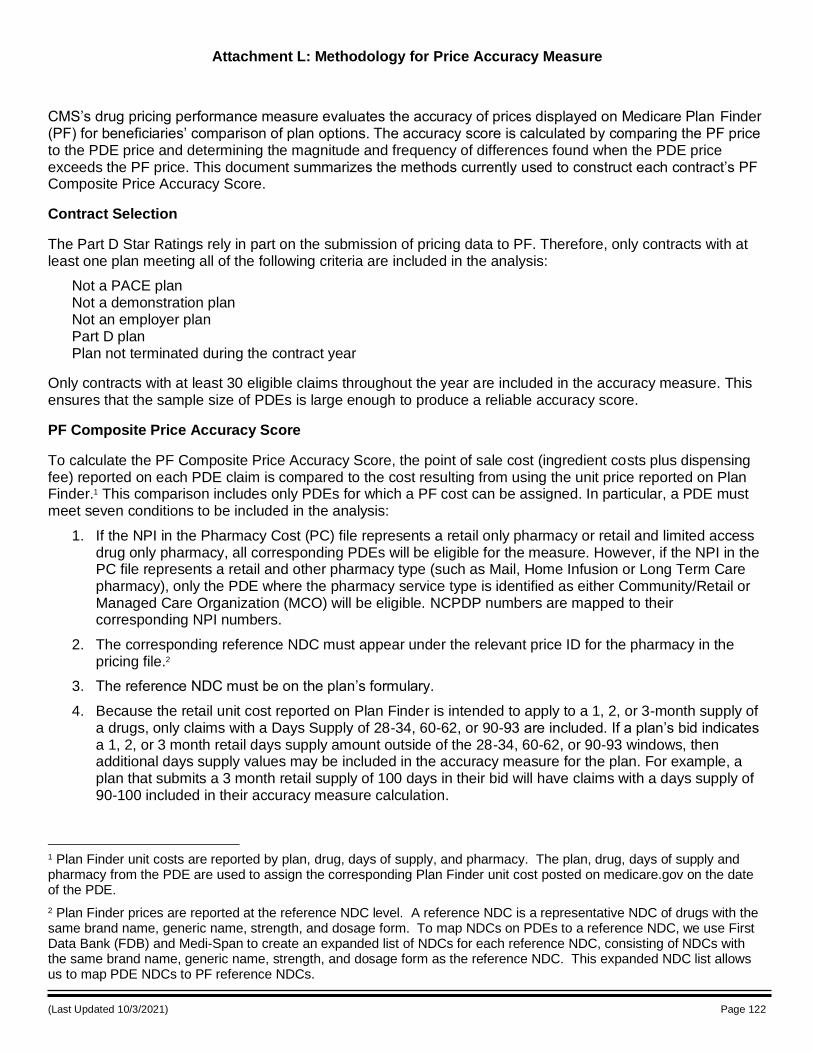
(Last Updated 10/3/2021) Page 122
Attachment L: Methodology for Price Accuracy Measure
CMS’s drug pricing performance measure evaluates the accuracy of prices displayed on Medicare Plan Finder (PF) for beneficiaries’ comparison of plan options. The accuracy score is calculated by comparing the PF price to the PDE price and determining the magnitude and frequency of differences found when the PDE price exceeds the PF price. This document summarizes the methods currently used to construct each contract’s PF Composite Price Accuracy Score.
Contract Selection
The Part D Star Ratings rely in part on the submission of pricing data to PF. Therefore, only contracts with at least one plan meeting all of the following criteria are included in the analysis:
Not a PACE plan Not a demonstration plan Not an employer plan Part D plan Plan not terminated during the contract year
Only contracts with at least 30 eligible claims throughout the year are included in the accuracy measure. This ensures that the sample size of PDEs is large enough to produce a reliable accuracy score.
PF Composite Price Accuracy Score
To calculate the PF Composite Price Accuracy Score, the point of sale cost (ingredient costs plus dispensing fee) reported on each PDE claim is compared to the cost resulting from using the unit price reported on Plan Finder.1 This comparison includes only PDEs for which a PF cost can be assigned. In particular, a PDE must meet seven conditions to be included in the analysis:
1. If the NPI in the Pharmacy Cost (PC) file represents a retail only pharmacy or retail and limited access drug only pharmacy, all corresponding PDEs will be eligible for the measure. However, if the NPI in the PC file represents a retail and other pharmacy type (such as Mail, Home Infusion or Long Term Care pharmacy), only the PDE where the pharmacy service type is identified as either Community/Retail or Managed Care Organization (MCO) will be eligible. NCPDP numbers are mapped to their corresponding NPI numbers.
2. The corresponding reference NDC must appear under the relevant price ID for the pharmacy in the pricing file.2
3. The reference NDC must be on the plan’s formulary.
4. Because the retail unit cost reported on Plan Finder is intended to apply to a 1, 2, or 3-month supply of a drugs, only claims with a Days Supply of 28-34, 60-62, or 90-93 are included. If a plan’s bid indicates a 1, 2, or 3 month retail days supply amount outside of the 28-34, 60-62, or 90-93 windows, then additional days supply values may be included in the accuracy measure for the plan. For example, a plan that submits a 3 month retail supply of 100 days in their bid will have claims with a days supply of 90-100 included in their accuracy measure calculation.
1 Plan Finder unit costs are reported by plan, drug, days of supply, and pharmacy. The plan, drug, days of supply and pharmacy from the PDE are used to assign the corresponding Plan Finder unit cost posted on medicare.gov on the date of the PDE.
2 Plan Finder prices are reported at the reference NDC level. A reference NDC is a representative NDC of drugs with the same brand name, generic name, strength, and dosage form. To map NDCs on PDEs to a reference NDC, we use First Data Bank (FDB) and Medi-Span to create an expanded list of NDCs for each reference NDC, consisting of NDCs with the same brand name, generic name, strength, and dosage form as the reference NDC. This expanded NDC list allows us to map PDE NDCs to PF reference NDCs.
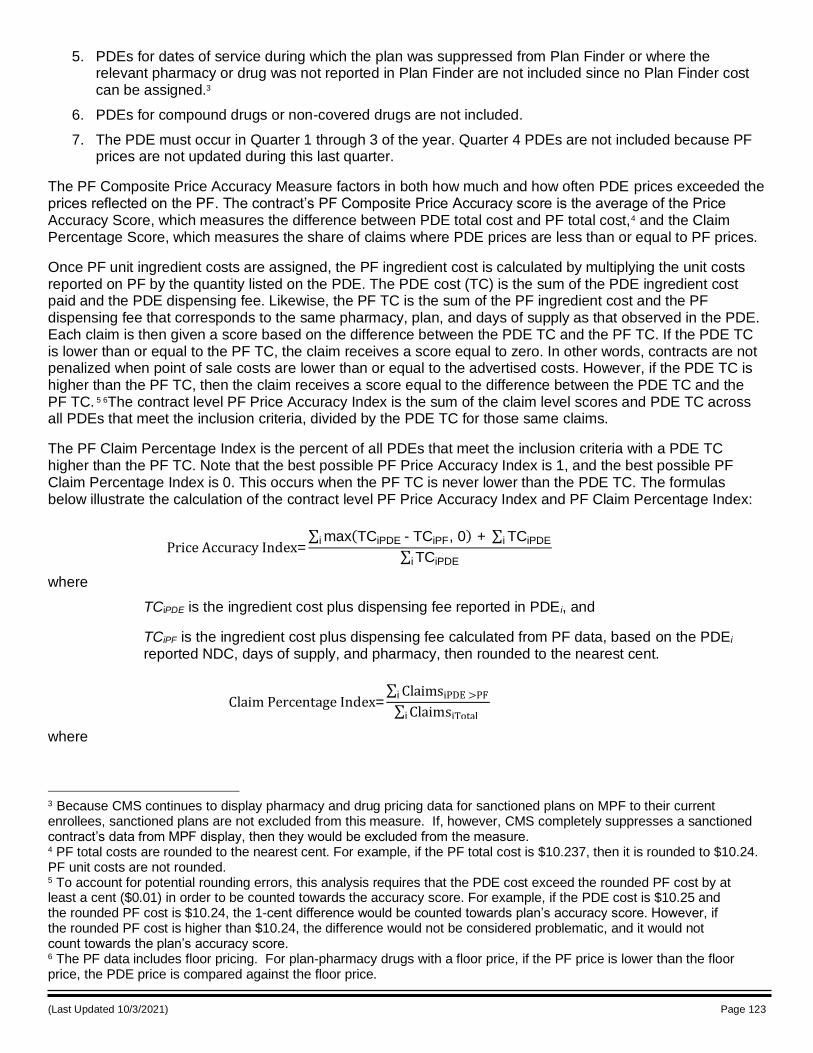
(Last Updated 10/3/2021) Page 123
5. PDEs for dates of service during which the plan was suppressed from Plan Finder or where the relevant pharmacy or drug was not reported in Plan Finder are not included since no Plan Finder cost can be assigned.3
3 Because CMS continues to display pharmacy and drug pricing data for sanctioned plans on MPF to their current enrollees, sanctioned plans are not excluded from this measure. If, however, CMS completely suppresses a sanctioned contract’s data from MPF display, then they would be excluded from the measure.
6. PDEs for compound drugs or non-covered drugs are not included.
7. The PDE must occur in Quarter 1 through 3 of the year. Quarter 4 PDEs are not included because PF prices are not updated during this last quarter.
The PF Composite Price Accuracy Measure factors in both how much and how often PDE prices exceeded the prices reflected on the PF. The contract’s PF Composite Price Accuracy score is the average of the Price Accuracy Score, which measures the difference between PDE total cost and PF total cost,4 and the Claim Percentage Score, which measures the share of claims where PDE prices are less than or equal to PF prices.
Once PF unit ingredient costs are assigned, the PF ingredient cost is calculated by multiplying the unit costs reported on PF by the quantity listed on the PDE. The PDE cost (TC) is the sum of the PDE ingredient cost paid and the PDE dispensing fee. Likewise, the PF TC is the sum of the PF ingredient cost and the PF dispensing fee that corresponds to the same pharmacy, plan, and days of supply as that observed in the PDE. Each claim is then given a score based on the difference between the PDE TC and the PF TC. If the PDE TC is lower than or equal to the PF TC, the claim receives a score equal to zero. In other words, contracts are not penalized when point of sale costs are lower than or equal to the advertised costs. However, if the PDE TC is higher than the PF TC, then the claim receives a score equal to the difference between the PDE TC and the PF TC. 5 6The contract level PF Price Accuracy Index is the sum of the claim level scores and PDE TC across all PDEs that meet the inclusion criteria, divided by the PDE TC for those same claims.
The PF Claim Percentage Index is the percent of all PDEs that meet the inclusion criteria with a PDE TC higher than the PF TC. Note that the best possible PF Price Accuracy Index is 1, and the best possible PF Claim Percentage Index is 0. This occurs when the PF TC is never lower than the PDE TC. The formulas below illustrate the calculation of the contract level PF Price Accuracy Index and PF Claim Percentage Index:
Price Accuracy Index= max(TCiPDE - TCiPF, 0) + TCiPDEii
TCiPDEi
where
TCiPDE is the ingredient cost plus dispensing fee reported in PDE i, and
TCiPF is the ingredient cost plus dispensing fee calculated from PF data, based on the PDEi reported NDC, days of supply, and pharmacy, then rounded to the nearest cent.
Claim Percentage Index= ClaimsiPDE >PFi
ClaimsiTotali
where
4 PF total costs are rounded to the nearest cent. For example, if the PF total cost is $10.237, then it is rounded to $10.24. PF unit costs are not rounded. 5 To account for potential rounding errors, this analysis requires that the PDE cost exceed the rounded PF cost by at least a cent ($0.01) in order to be counted towards the accuracy score. For example, if the PDE cost is $10.25 and the rounded PF cost is $10.24, the 1-cent difference would be counted towards plan’s accuracy score. However, if the rounded PF cost is higher than $10.24, the difference would not be considered problematic, and it would not count towards the plan’s accuracy score. 6 The PF data includes floor pricing. For plan-pharmacy drugs with a floor price, if the PF price is lower than the floor price, the PDE price is compared against the floor price.
(Last Updated 10/3/2021) Page 124
ClaimsiPDE >PF is the total number of claims where the PDE price is greater than the rounded PF price
ClaimsiTotal is the total number of claims
We use the following formulas to convert the Claim Percentage Index and Price Accuracy Index into the PF Composite Price Accuracy score:
Price Accuracy Score= 100-[(Price Accuracy Index -1) x 100]
Claim Percentage Score=(1 - Claim Percentage Index) x 100
PF Composite Price Accuracy Score=(0.5 x Price Accuracy Score)+(0.5 x Claim Percentage Score)
The PF Composite Price Accuracy Score is rounded to the nearest whole number.
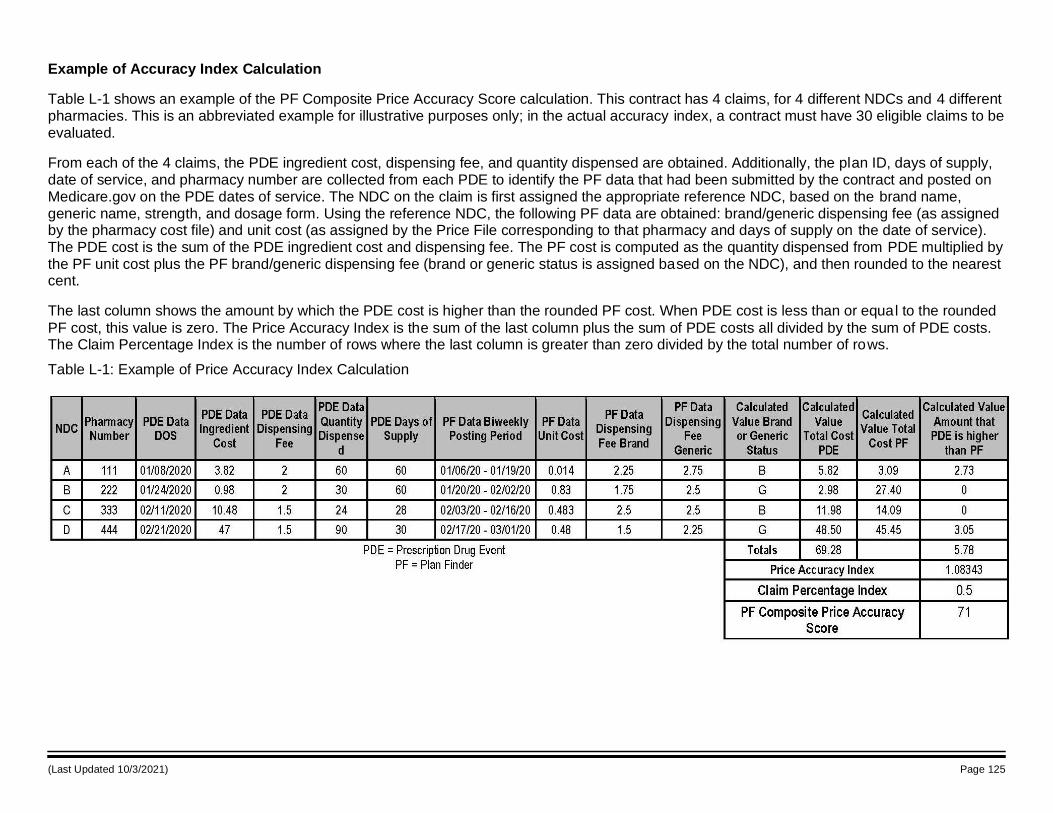
(Last Updated 10/3/2021) Page 125
Example of Accuracy Index Calculation
Table L-1 shows an example of the PF Composite Price Accuracy Score calculation. This contract has 4 claims, for 4 different NDCs and 4 different pharmacies. This is an abbreviated example for illustrative purposes only; in the actual accuracy index, a contract must have 30 eligible claims to be evaluated.
From each of the 4 claims, the PDE ingredient cost, dispensing fee, and quantity dispensed are obtained. Additionally, the plan ID, days of supply, date of service, and pharmacy number are collected from each PDE to identify the PF data that had been submitted by the contract and posted on Medicare.gov on the PDE dates of service. The NDC on the claim is first assigned the appropriate reference NDC, based on the brand name, generic name, strength, and dosage form. Using the reference NDC, the following PF data are obtained: brand/generic dispensing fee (as assigned by the pharmacy cost file) and unit cost (as assigned by the Price File corresponding to that pharmacy and days of supply on the date of service). The PDE cost is the sum of the PDE ingredient cost and dispensing fee. The PF cost is computed as the quantity dispensed from PDE multiplied by the PF unit cost plus the PF brand/generic dispensing fee (brand or generic status is assigned based on the NDC), and then rounded to the nearest cent.
The last column shows the amount by which the PDE cost is higher than the rounded PF cost. When PDE cost is less than or equal to the rounded
PF cost, this value is zero. The Price Accuracy Index is the sum of the last column plus the sum of PDE costs all divided by the sum of PDE costs. The Claim Percentage Index is the number of rows where the last column is greater than zero divided by the total number of rows.
Table L-1: Example of Price Accuracy Index Calculation
(Last Updated 10/3/2021) Page 126
Attachment M: MTM CMR Completion Rate Measure Scoring Methodologies
Medicare Part D Reporting Requirements Measure (D11: MTM CMR Completion Rate Measure)
Step 1: Start with all contracts that enrolled beneficiaries in MTM at any point during contract year 2020. Beneficiaries with multiple records that contain varying information for the same contract are excluded from the measure calculation for that contract.
Step 2: Exclude contracts that did not enroll 31 or more beneficiaries in their MTM program who met the measure denominator criteria during contract year 2020.
Next, exclude contracts with an effective termination date on or before the deadline to submit data validation results to CMS (June 30, 2021), or that were not required to participate in data validation. The current MTM requirements are waived for the PBPs approved to participate in the Enhanced MTM Model and data on participating PBPs must not be reported per the Part D Reporting Requirements under the current MTM program. This MTM data will instead be reported in accordance with model terms and conditions and not included in the measure calculation.
Additionally, exclude contracts that did not score at least 95% on data validation for their plan reporting of the MTM Program section and contracts that scored 95% or higher on data validation for the MTM Program section but that were not compliant with data validation standards/sub-standards for at least one of the following MTM data elements. We define a contract as being non-complaint if either it receives a "No" or a 1, 2, or 3 on the 5-point Likert scale in the specific data element's data validation.
• HICN (or MBI) or RRB Number (Element B)
• Met the specified targeting criteria per CMS – Part D requirements (Element F)
• Date of MTM program enrollment (Element I)
• Date met the specified targeting criteria per CMS – Part D requirements (Element J)
• Date of MTM program opt-out, if applicable (Element K)
• Received annual CMR with written summary in CMS standardized format (Element P)
• Date(s) of CMR(s) (Element Q)
Step 3: After removing contracts’ and beneficiaries’ data excluded above, suppress contract rates based on the following rules:
File DV failure: Contracts that failed to submit the CY 2020 MTM Program Reporting Requirements data file or who had a missing DV score for MTM are listed as “CMS identified issues with this plan's data.”
Section-level DV failure: Contracts that score less than 95% in DV for their CY 2020 MTM Program Reporting Requirements data are listed as “CMS identified issues with this plan's data.”
Element-level DV failure: Contracts that score 95% or higher in DV for their CY 2020 MTM Program Reporting Requirements data but that failed at least one of the seven data elements are listed as “CMS identified issues with this plan's data.”
Small size: Contracts that have not yet been suppressed and have fewer than 31 beneficiaries enrolled are listed as “Not enough data available.”
Organizations can view their own plan reporting data validation results in HPMS (https://hpms.cms.gov/). From the home page, select Monitoring | Plan Reporting Data Validation.
Step 4: Calculate the rate for the remaining contracts using the following formula:
Number of beneficiaries from the denominator who received a CMR at any time during their period of MTM enrollment in the reporting period / Number of beneficiaries who were at least 18 years or older as of the beginning of the reporting period, met the specified targeting criteria per CMS during the reporting period, weren’t in hospice at any point during the reporting period, and who were enrolled in the MTM program for at least 60 days during the reporting period. Beneficiaries who were enrolled in
(Last Updated 10/3/2021) Page 127
the contract’s MTM program for less than 60 days at any time in the measurement year are included in the denominator and the numerator if they received a CMR within this timeframe. Beneficiaries are excluded from the measure calculation if they were enrolled in the contract’s MTM program for less than 60 days and did not receive a CMR within this timeframe.
(Last Updated 10/3/2021) Page 128
Attachment N: Methodology for the Puerto Rico Model
Puerto Rico has a unique health care market with a large percentage of low-income individuals in both Medicare and Medicaid and a complex legal history that affects the health care system in many ways. Puerto Rican beneficiaries are not eligible for LIS. The categorization of contracts into final adjustment categories for the Categorical Adjustment Index (CAI) relies on both the use of a contract’s percentages of beneficiaries with Low Income Subsidy/Dual Eligible (LIS/DE) and disabled beneficiaries. Since the percentage of LIS/DE is a critical element in the categorization of contracts to identify the contract’s CAI, an additional adjustment is done for contracts that solely serve the population of beneficiaries in Puerto Rico to address the lack of LIS. The additional analysis for the adjustment results in a modified percentage of LIS/DE beneficiaries that is subsequently used to categorize the contract in its final adjustment category for the CAI.
The contract-level modified LIS/DE percentages for Puerto Rico contracts for the 2022 Star Ratings are developed using the following sources of information:
The 2019 1-year American Community Survey (ACS) estimates for the percentage of people living below the Federal Poverty Level (FPL);
The 2019 ACS 5-year estimates for the percentage of people living below 150% of the FPL;1 for Puerto Rico and for the 10 poorest US states (which may include the District of Columbia).
The Medicare enrollment data file for those enrolled during 2020 provided, for beneficiaries who were alive at least through December 2020 and in the 10 US states with the highest poverty rates, the percentage of each contract’s beneficiaries who were DE and the percentage who were LIS/DE. Beneficiary DE status was determined using a) the monthly beneficiary dual status codes, b) identification of Low Income Part D enrollees who reside in the US Territories, and c) beneficiaries with Medicaid coverage/who are Medicaid eligible by the Point of Sale contractor. Beneficiaries who were LIS were determined using the monthly beneficiary LIS status codes. Beneficiaries were classified LIS/DE by combining the beneficiaries identified as DE and beneficiaries identified as LIS.
The Puerto Rico DE percentages came from the average percentage of Medicaid beneficiaries from the HPMS monthly contract enrollment data for the 2020 measurement year.
The following steps are employed to determine the modified percentages of LIS/DE for MA contracts solely serving the population of beneficiaries in Puerto Rico. All references to contracts in Puerto Rico are limited to the contracts solely serving the population of beneficiaries in Puerto Rico.
The 10 states with the highest proportion of people living below the FPL are identified, based on 2019 1-year data from ACS ((https://www.census.gov/content/dam/Census/library/publications/2020/acs/acsbr20-04.pdf, see Table 1). The states identified are: Alabama, Arkansas, Kentucky, Louisiana, Mississippi, New Mexico, Oklahoma, South Carolina, Tennessee, and West Virginia.
Data are aggregated from Medicare Advantage contracts that had at least 90% of their beneficiaries enrolled with mailing addresses within the 10 highest poverty states identified in step (1). For the 2022 Star Ratings adjustment, the data used for the model development included a total of 87 Medicare Advantage contracts with at least 90% of their beneficiaries with mailing addresses in one of the ten poorest states listed above.
A linear regression model is developed using the known LIS/DE percentage and the corresponding DE percentage from the MA contracts in the 10 highest poverty states with at least 90% of their beneficiaries with mailing addresses in one of the ten states
The model for Puerto Rico is developed using the model in step (3) as its base. The estimated slope from the linear fit in the previous step (3) is retained to approximate the expected relationship between LIS/DE for each contract in Puerto Rico and its DE percentage. However, as
1 The most recent ACS 5-year estimates are employed for the model development. For the 2022 Star Ratings, the most
recent data are the 2019 ACS 5-year estimates.
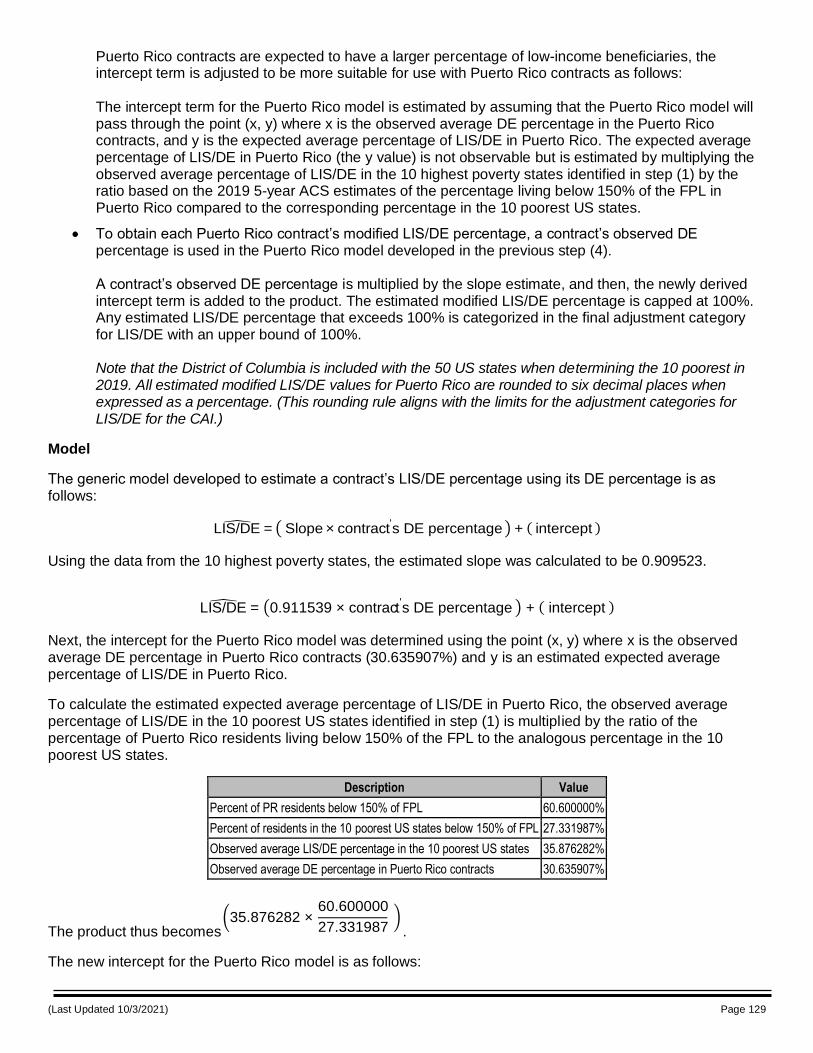
(Last Updated 10/3/2021) Page 129
Puerto Rico contracts are expected to have a larger percentage of low-income beneficiaries, the intercept term is adjusted to be more suitable for use with Puerto Rico contracts as follows: The intercept term for the Puerto Rico model is estimated by assuming that the Puerto Rico model will pass through the point (x, y) where x is the observed average DE percentage in the Puerto Rico contracts, and y is the expected average percentage of LIS/DE in Puerto Rico. The expected average percentage of LIS/DE in Puerto Rico (the y value) is not observable but is estimated by multiplying the observed average percentage of LIS/DE in the 10 highest poverty states identified in step (1) by the ratio based on the 2019 5-year ACS estimates of the percentage living below 150% of the FPL in Puerto Rico compared to the corresponding percentage in the 10 poorest US states.
To obtain each Puerto Rico contract’s modified LIS/DE percentage, a contract’s observed DE percentage is used in the Puerto Rico model developed in the previous step (4). A contract’s observed DE percentage is multiplied by the slope estimate, and then, the newly derived intercept term is added to the product. The estimated modified LIS/DE percentage is capped at 100%. Any estimated LIS/DE percentage that exceeds 100% is categorized in the final adjustment category for LIS/DE with an upper bound of 100%. Note that the District of Columbia is included with the 50 US states when determining the 10 poorest in 2019. All estimated modified LIS/DE values for Puerto Rico are rounded to six decimal places when expressed as a percentage. (This rounding rule aligns with the limits for the adjustment categories for LIS/DE for the CAI.)
Model
The generic model developed to estimate a contract’s LIS/DE percentage using its DE percentage is as follows:
LIS/DE = Slope × contract's DE percentage + ( intercept )
Using the data from the 10 highest poverty states, the estimated slope was calculated to be 0.909523.
LIS/DE = 0.911539 × contract's DE percentage + ( intercept )
Next, the intercept for the Puerto Rico model was determined using the point (x, y) where x is the observed average DE percentage in Puerto Rico contracts (30.635907%) and y is an estimated expected average percentage of LIS/DE in Puerto Rico.
To calculate the estimated expected average percentage of LIS/DE in Puerto Rico, the observed average percentage of LIS/DE in the 10 poorest US states identified in step (1) is multiplied by the ratio of the percentage of Puerto Rico residents living below 150% of the FPL to the analogous percentage in the 10 poorest US states.
Description Value
Percent of PR residents below 150% of FPL 60.600000%
Percent of residents in the 10 poorest US states below 150% of FPL 27.331987%
Observed average LIS/DE percentage in the 10 poorest US states 35.876282%
Observed average DE percentage in Puerto Rico contracts 30.635907%
35.876282 × 60.600000
27.331987
The product thus becomes .
The new intercept for the Puerto Rico model is as follows:
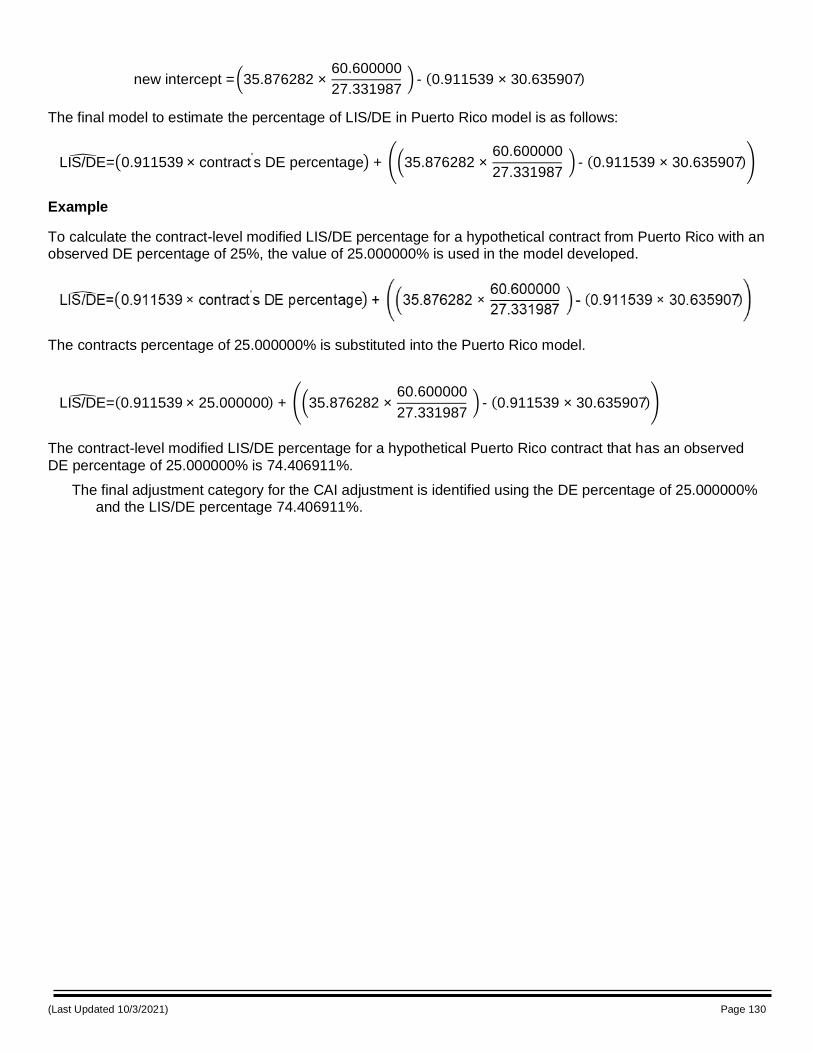
(Last Updated 10/3/2021) Page 130
new intercept = 35.876282 × 60.600000
27.331987 - (0.911539 × 30.635907)
The final model to estimate the percentage of LIS/DE in Puerto Rico model is as follows:
LIS/DE = 0.911539 × contract's DE percentage + 35.876282 ×
60.600000
27.331987 - (0.911539 × 30.635907)
Example
To calculate the contract-level modified LIS/DE percentage for a hypothetical contract from Puerto Rico with an observed DE percentage of 25%, the value of 25.000000% is used in the model developed.
The contracts percentage of 25.000000% is substituted into the Puerto Rico model.
LIS/DE =(0.911539 × 25.000000) + 35.876282 × 60.600000
27.331987 - (0.911539 × 30.635907)
The contract-level modified LIS/DE percentage for a hypothetical Puerto Rico contract that has an observed
DE percentage of 25.000000% is 74.406911%.
The final adjustment category for the CAI adjustment is identified using the DE percentage of 25.000000% and the LIS/DE percentage 74.406911%.
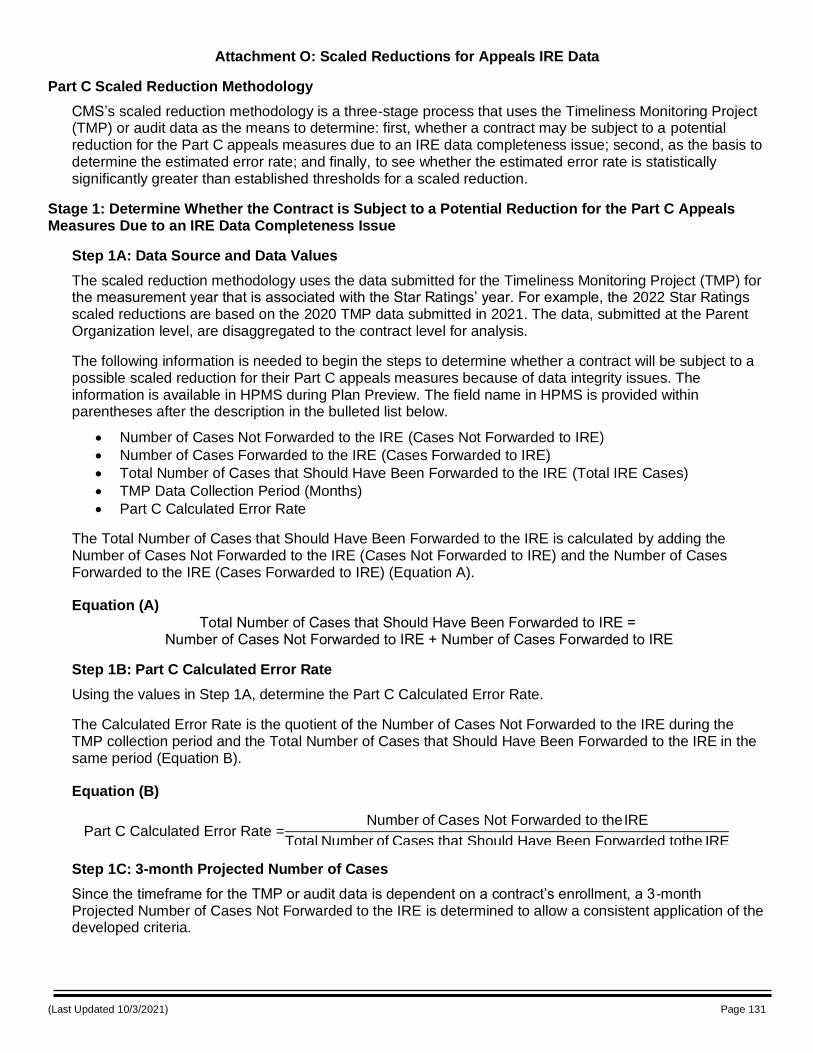
(Last Updated 10/3/2021) Page 131
Attachment O: Scaled Reductions for Appeals IRE Data
Part C Scaled Reduction Methodology
CMS’s scaled reduction methodology is a three-stage process that uses the Timeliness Monitoring Project (TMP) or audit data as the means to determine: first, whether a contract may be subject to a potential reduction for the Part C appeals measures due to an IRE data completeness issue; second, as the basis to determine the estimated error rate; and finally, to see whether the estimated error rate is statistically significantly greater than established thresholds for a scaled reduction.
Stage 1: Determine Whether the Contract is Subject to a Potential Reduction for the Part C Appeals Measures Due to an IRE Data Completeness Issue
Step 1A: Data Source and Data Values
The scaled reduction methodology uses the data submitted for the Timeliness Monitoring Project (TMP) for the measurement year that is associated with the Star Ratings’ year. For example, the 2022 Star Ratings scaled reductions are based on the 2020 TMP data submitted in 2021. The data, submitted at the Parent Organization level, are disaggregated to the contract level for analysis.
The following information is needed to begin the steps to determine whether a contract will be subject to a possible scaled reduction for their Part C appeals measures because of data integrity issues. The information is available in HPMS during Plan Preview. The field name in HPMS is provided within parentheses after the description in the bulleted list below.
• Number of Cases Not Forwarded to the IRE (Cases Not Forwarded to IRE)
• Number of Cases Forwarded to the IRE (Cases Forwarded to IRE)
• Total Number of Cases that Should Have Been Forwarded to the IRE (Total IRE Cases)
• TMP Data Collection Period (Months)
• Part C Calculated Error Rate
The Total Number of Cases that Should Have Been Forwarded to the IRE is calculated by adding the Number of Cases Not Forwarded to the IRE (Cases Not Forwarded to IRE) and the Number of Cases Forwarded to the IRE (Cases Forwarded to IRE) (Equation A).
Equation (A)
Total Number of Cases that Should Have Been Forwarded to IRE = Number of Cases Not Forwarded to IRE + Number of Cases Forwarded to IRE
Step 1B: Part C Calculated Error Rate
Using the values in Step 1A, determine the Part C Calculated Error Rate.
The Calculated Error Rate is the quotient of the Number of Cases Not Forwarded to the IRE during the TMP collection period and the Total Number of Cases that Should Have Been Forwarded to the IRE in the same period (Equation B).
Equation (B)
Part C Calculated Error Rate =Number of Cases Not Forwarded to the IRE
Total Number of Cases that Should Have Been Forwarded to the IRE
Step 1C: 3-month Projected Number of Cases
Since the timeframe for the TMP or audit data is dependent on a contract’s enrollment, a 3-month Projected Number of Cases Not Forwarded to the IRE is determined to allow a consistent application of the developed criteria.
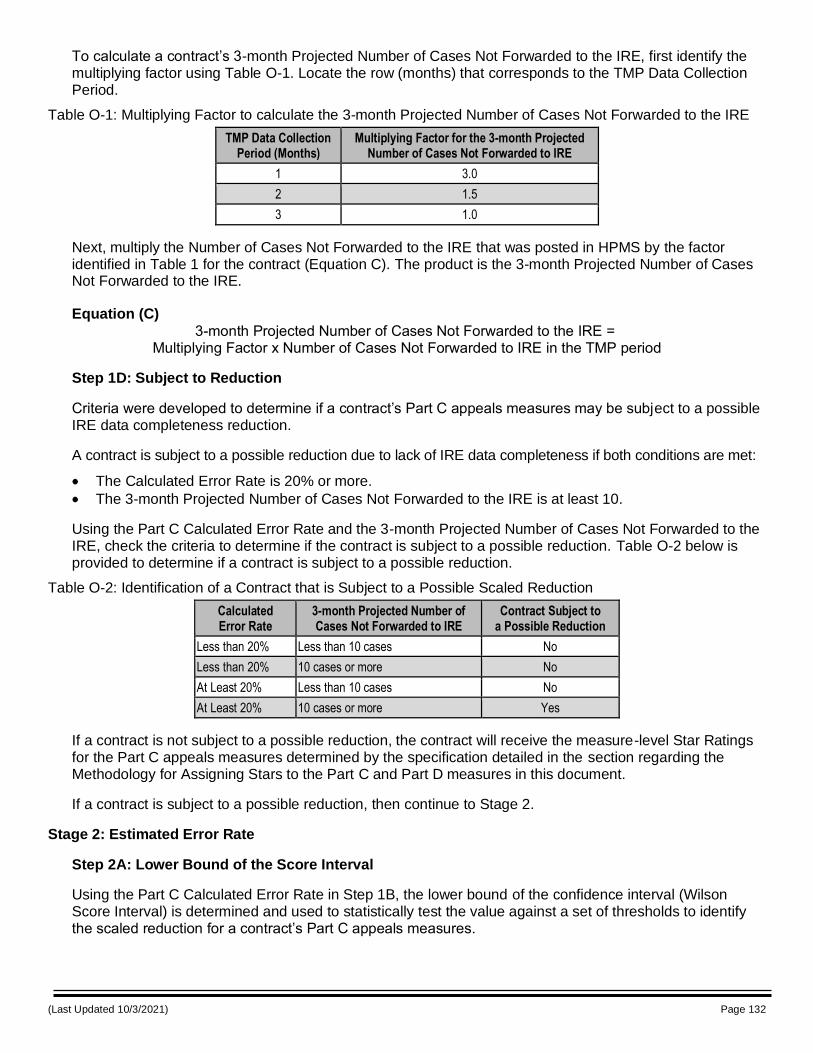
(Last Updated 10/3/2021) Page 132
To calculate a contract’s 3-month Projected Number of Cases Not Forwarded to the IRE, first identify the multiplying factor using Table O-1. Locate the row (months) that corresponds to the TMP Data Collection Period.
Table O-1: Multiplying Factor to calculate the 3-month Projected Number of Cases Not Forwarded to the IRE
TMP Data Collection Period (Months)
Multiplying Factor for the 3-month Projected Number of Cases Not Forwarded to IRE
1 3.0
2 1.5
3 1.0
Next, multiply the Number of Cases Not Forwarded to the IRE that was posted in HPMS by the factor identified in Table 1 for the contract (Equation C). The product is the 3-month Projected Number of Cases Not Forwarded to the IRE.
Equation (C)
3-month Projected Number of Cases Not Forwarded to the IRE = Multiplying Factor x Number of Cases Not Forwarded to IRE in the TMP period
Step 1D: Subject to Reduction
Criteria were developed to determine if a contract’s Part C appeals measures may be subject to a possible IRE data completeness reduction.
A contract is subject to a possible reduction due to lack of IRE data completeness if both conditions are met:
The Calculated Error Rate is 20% or more.
The 3-month Projected Number of Cases Not Forwarded to the IRE is at least 10.
Using the Part C Calculated Error Rate and the 3-month Projected Number of Cases Not Forwarded to the IRE, check the criteria to determine if the contract is subject to a possible reduction. Table O-2 below is provided to determine if a contract is subject to a possible reduction.
Table O-2: Identification of a Contract that is Subject to a Possible Scaled Reduction
Calculated Error Rate
3-month Projected Number of Cases Not Forwarded to IRE
Contract Subject to a Possible Reduction
Less than 20% Less than 10 cases No
Less than 20% 10 cases or more No
At Least 20% Less than 10 cases No
At Least 20% 10 cases or more Yes
If a contract is not subject to a possible reduction, the contract will receive the measure-level Star Ratings for the Part C appeals measures determined by the specification detailed in the section regarding the Methodology for Assigning Stars to the Part C and Part D measures in this document.
If a contract is subject to a possible reduction, then continue to Stage 2.
Stage 2: Estimated Error Rate
Step 2A: Lower Bound of the Score Interval
Using the Part C Calculated Error Rate in Step 1B, the lower bound of the confidence interval (Wilson Score Interval) is determined and used to statistically test the value against a set of thresholds to identify the scaled reduction for a contract’s Part C appeals measures.
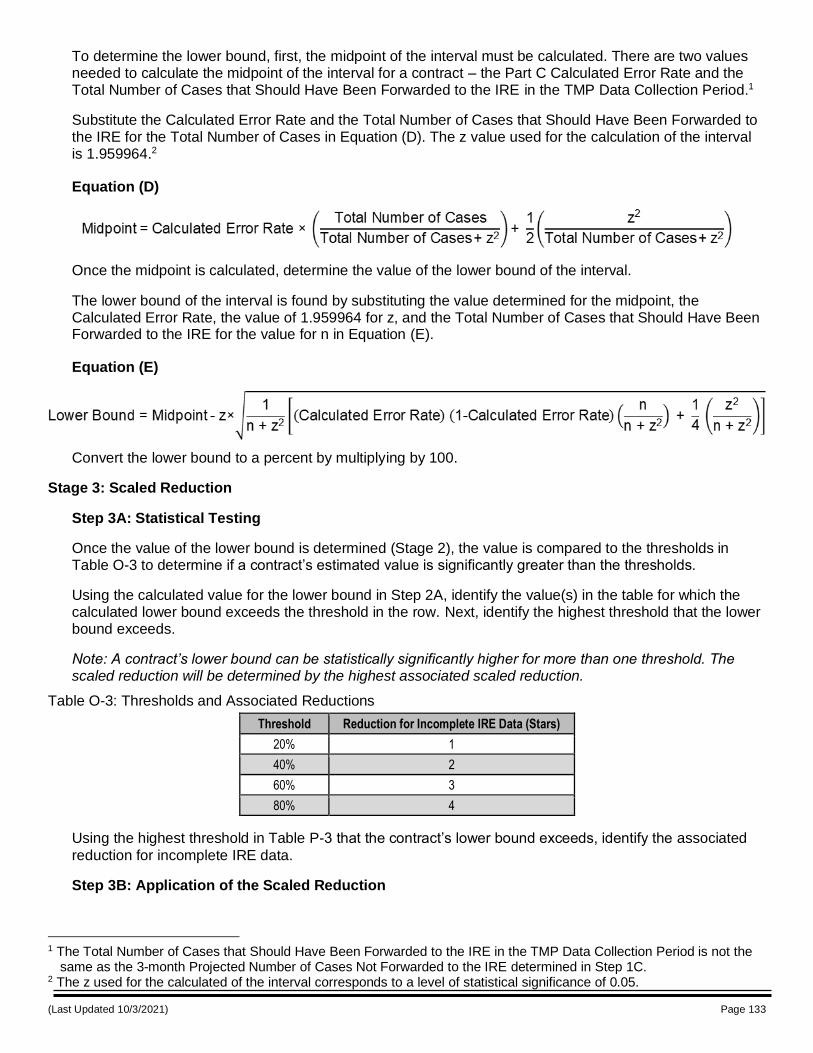
(Last Updated 10/3/2021) Page 133
To determine the lower bound, first, the midpoint of the interval must be calculated. There are two values needed to calculate the midpoint of the interval for a contract – the Part C Calculated Error Rate and the Total Number of Cases that Should Have Been Forwarded to the IRE in the TMP Data Collection Period.1
Substitute the Calculated Error Rate and the Total Number of Cases that Should Have Been Forwarded to the IRE for the Total Number of Cases in Equation (D). The z value used for the calculation of the interval is 1.959964.2
Equation (D)
Once the midpoint is calculated, determine the value of the lower bound of the interval.
The lower bound of the interval is found by substituting the value determined for the midpoint, the Calculated Error Rate, the value of 1.959964 for z, and the Total Number of Cases that Should Have Been Forwarded to the IRE for the value for n in Equation (E).
Equation (E)
Convert the lower bound to a percent by multiplying by 100.
Stage 3: Scaled Reduction
Step 3A: Statistical Testing
Once the value of the lower bound is determined (Stage 2), the value is compared to the thresholds in Table O-3 to determine if a contract’s estimated value is significantly greater than the thresholds.
Using the calculated value for the lower bound in Step 2A, identify the value(s) in the table for which the calculated lower bound exceeds the threshold in the row. Next, identify the highest threshold that the lower bound exceeds.
Note: A contract’s lower bound can be statistically significantly higher for more than one threshold. The scaled reduction will be determined by the highest associated scaled reduction.
Table O-3: Thresholds and Associated Reductions
Threshold Reduction for Incomplete IRE Data (Stars)
20% 1
40% 2
60% 3
80% 4
Using the highest threshold in Table P-3 that the contract’s lower bound exceeds, identify the associated
reduction for incomplete IRE data.
Step 3B: Application of the Scaled Reduction
1 The Total Number of Cases that Should Have Been Forwarded to the IRE in the TMP Data Collection Period is not the
same as the 3-month Projected Number of Cases Not Forwarded to the IRE determined in Step 1C. 2 The z used for the calculated of the interval corresponds to a level of statistical significance of 0.05.

(Last Updated 10/3/2021) Page 134
The identified scaled reduction in Table P-3 is subtracted from the measure-level Star Rating for both Part C appeals measure-level Star Ratings. If the resulting measure-level Star Rating is less than one-star, the measure is assigned one star.
Note: If the Part C appeals measures receive a scaled reduction, the Part C appeals measures would not be eligible for inclusion in of the Part C improvement measure.
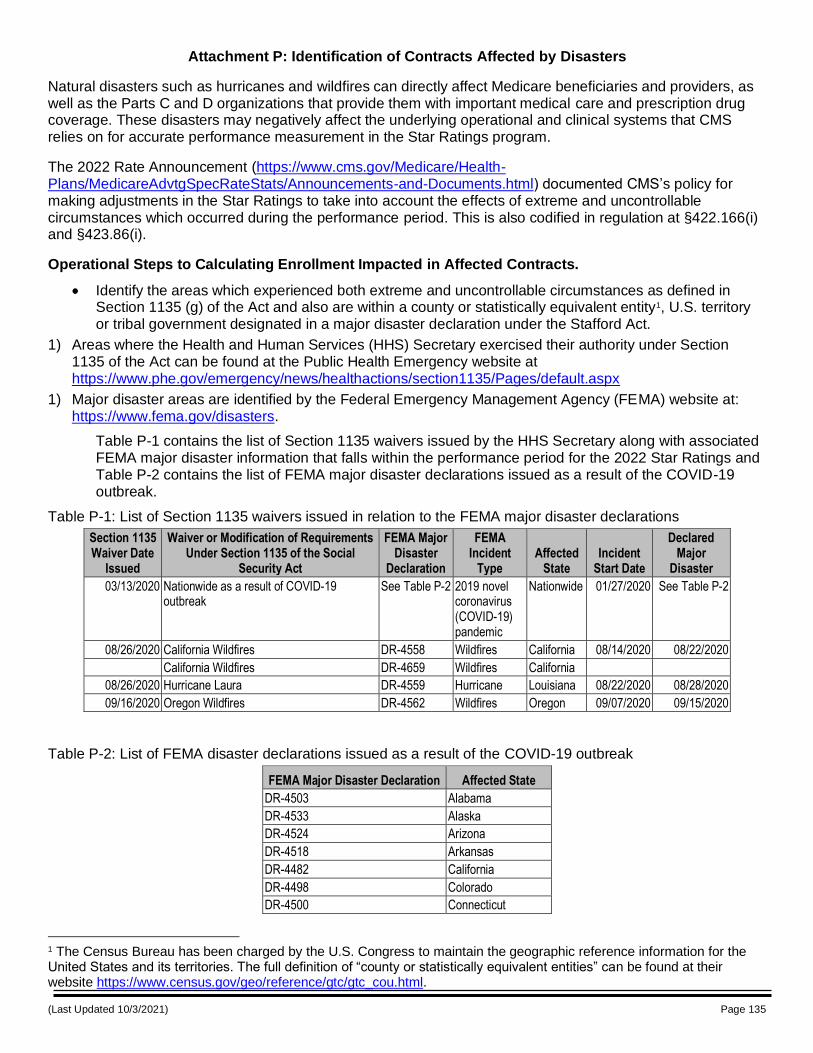
(Last Updated 10/3/2021) Page 135
Attachment P: Identification of Contracts Affected by Disasters
Natural disasters such as hurricanes and wildfires can directly affect Medicare beneficiaries and providers, as well as the Parts C and D organizations that provide them with important medical care and prescription drug coverage. These disasters may negatively affect the underlying operational and clinical systems that CMS relies on for accurate performance measurement in the Star Ratings program.
The 2022 Rate Announcement (https://www.cms.gov/Medicare/Health-Plans/MedicareAdvtgSpecRateStats/Announcements-and-Documents.html) documented CMS’s policy for making adjustments in the Star Ratings to take into account the effects of extreme and uncontrollable circumstances which occurred during the performance period. This is also codified in regulation at §422.166(i) and §423.86(i).
Operational Steps to Calculating Enrollment Impacted in Affected Contracts.
Identify the areas which experienced both extreme and uncontrollable circumstances as defined in Section 1135 (g) of the Act and also are within a county or statistically equivalent entity1, U.S. territory or tribal government designated in a major disaster declaration under the Stafford Act.
1) Areas where the Health and Human Services (HHS) Secretary exercised their authority under Section 1135 of the Act can be found at the Public Health Emergency website at https://www.phe.gov/emergency/news/healthactions/section1135/Pages/default.aspx
1) Major disaster areas are identified by the Federal Emergency Management Agency (FEMA) website at: https://www.fema.gov/disasters.
Table P-1 contains the list of Section 1135 waivers issued by the HHS Secretary along with associated FEMA major disaster information that falls within the performance period for the 2022 Star Ratings and Table P-2 contains the list of FEMA major disaster declarations issued as a result of the COVID-19 outbreak.
Table P-1: List of Section 1135 waivers issued in relation to the FEMA major disaster declarations
Section 1135 Waiver Date
Issued
Waiver or Modification of Requirements Under Section 1135 of the Social
Security Act
FEMA Major Disaster
Declaration
FEMA Incident
Type Affected
State Incident
Start Date
Declared Major
Disaster
03/13/2020 Nationwide as a result of COVID-19 outbreak
See Table P-2 2019 novel coronavirus (COVID-19) pandemic
Nationwide 01/27/2020 See Table P-2
08/26/2020 California Wildfires DR-4558 Wildfires California 08/14/2020 08/22/2020
California Wildfires DR-4659 Wildfires California
08/26/2020 Hurricane Laura DR-4559 Hurricane Louisiana 08/22/2020 08/28/2020
09/16/2020 Oregon Wildfires DR-4562 Wildfires Oregon 09/07/2020 09/15/2020
Table P-2: List of FEMA disaster declarations issued as a result of the COVID-19 outbreak
FEMA Major Disaster Declaration Affected State
DR-4503 Alabama
DR-4533 Alaska
DR-4524 Arizona
DR-4518 Arkansas
DR-4482 California
DR-4498 Colorado
DR-4500 Connecticut
1 The Census Bureau has been charged by the U.S. Congress to maintain the geographic reference information for the United States and its territories. The full definition of “county or statistically equivalent entities” can be found at their website https://www.census.gov/geo/reference/gtc/gtc_cou.html.
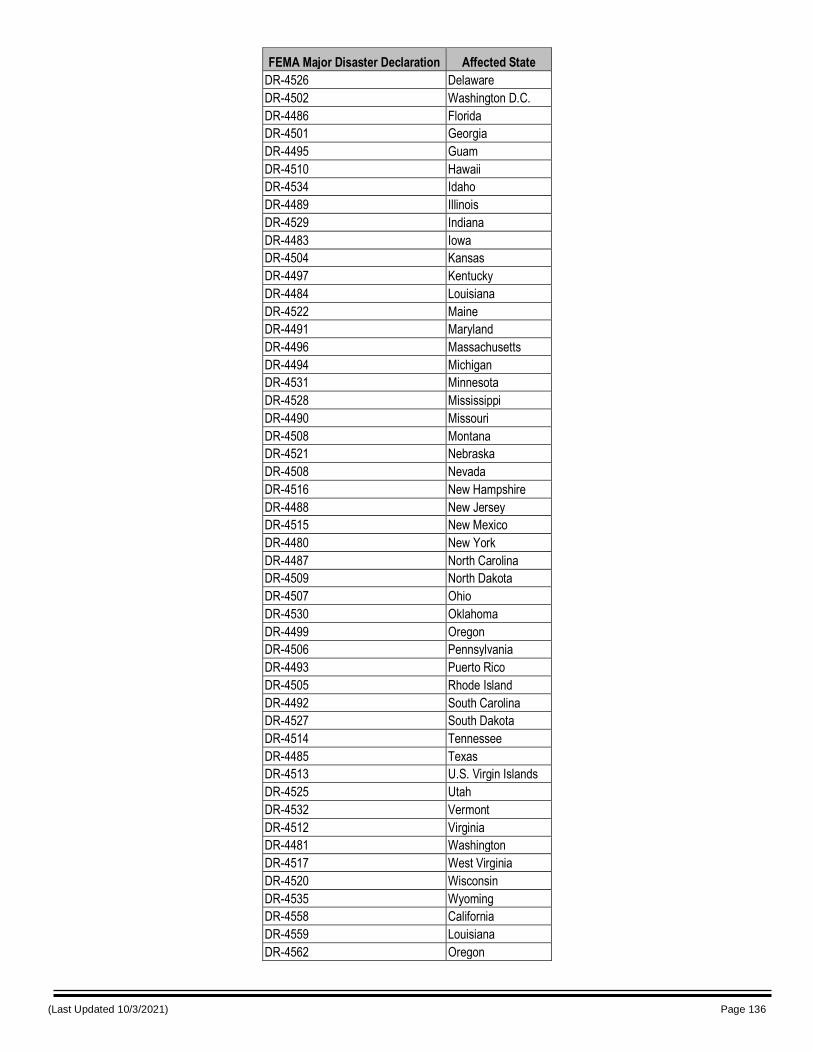
(Last Updated 10/3/2021) Page 136
FEMA Major Disaster Declaration Affected State
DR-4526 Delaware
DR-4502 Washington D.C.
DR-4486 Florida
DR-4501 Georgia
DR-4495 Guam
DR-4510 Hawaii
DR-4534 Idaho
DR-4489 Illinois
DR-4529 Indiana
DR-4483 Iowa
DR-4504 Kansas
DR-4497 Kentucky
DR-4484 Louisiana
DR-4522 Maine
DR-4491 Maryland
DR-4496 Massachusetts
DR-4494 Michigan
DR-4531 Minnesota
DR-4528 Mississippi
DR-4490 Missouri
DR-4508 Montana
DR-4521 Nebraska
DR-4508 Nevada
DR-4516 New Hampshire
DR-4488 New Jersey
DR-4515 New Mexico
DR-4480 New York
DR-4487 North Carolina
DR-4509 North Dakota
DR-4507 Ohio
DR-4530 Oklahoma
DR-4499 Oregon
DR-4506 Pennsylvania
DR-4493 Puerto Rico
DR-4505 Rhode Island
DR-4492 South Carolina
DR-4527 South Dakota
DR-4514 Tennessee
DR-4485 Texas
DR-4513 U.S. Virgin Islands
DR-4525 Utah
DR-4532 Vermont
DR-4512 Virginia
DR-4481 Washington
DR-4517 West Virginia
DR-4520 Wisconsin
DR-4535 Wyoming
DR-4558 California
DR-4559 Louisiana
DR-4562 Oregon
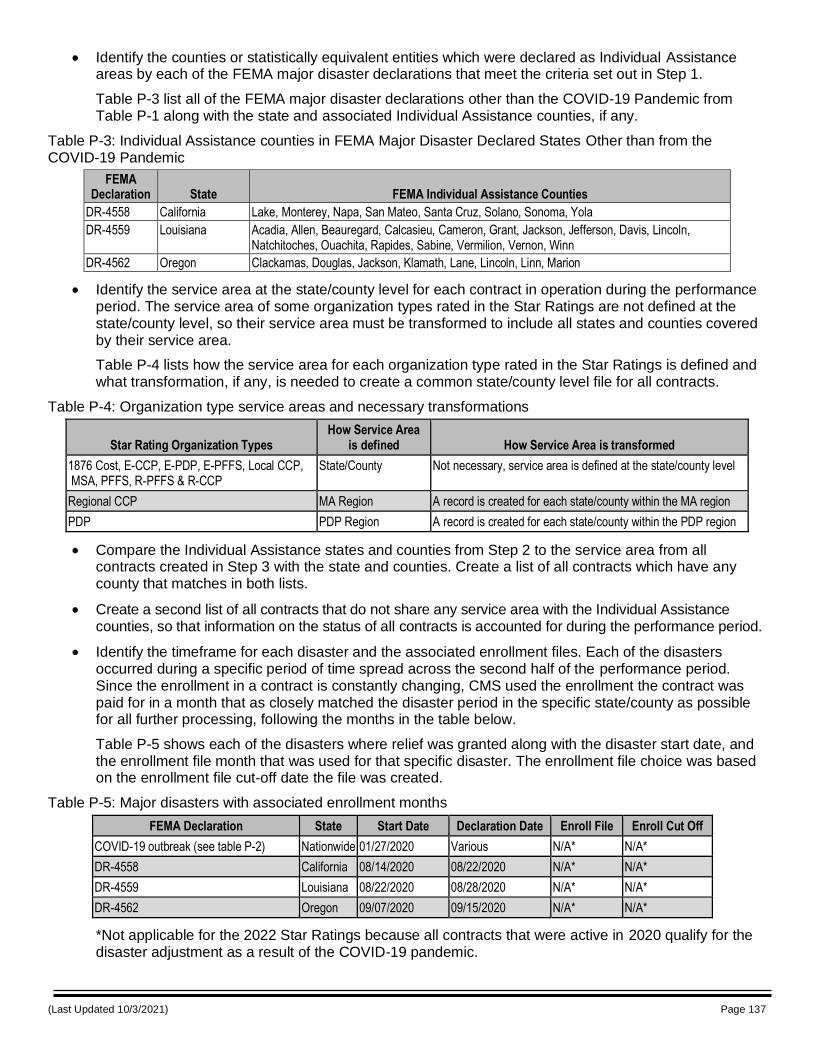
(Last Updated 10/3/2021) Page 137
Identify the counties or statistically equivalent entities which were declared as Individual Assistance areas by each of the FEMA major disaster declarations that meet the criteria set out in Step 1.
Table P-3 list all of the FEMA major disaster declarations other than the COVID-19 Pandemic from Table P-1 along with the state and associated Individual Assistance counties, if any.
Table P-3: Individual Assistance counties in FEMA Major Disaster Declared States Other than from the COVID-19 Pandemic
FEMA Declaration State FEMA Individual Assistance Counties
DR-4558 California Lake, Monterey, Napa, San Mateo, Santa Cruz, Solano, Sonoma, Yola
DR-4559 Louisiana Acadia, Allen, Beauregard, Calcasieu, Cameron, Grant, Jackson, Jefferson, Davis, Lincoln, Natchitoches, Ouachita, Rapides, Sabine, Vermilion, Vernon, Winn
DR-4562 Oregon Clackamas, Douglas, Jackson, Klamath, Lane, Lincoln, Linn, Marion
Identify the service area at the state/county level for each contract in operation during the performance period. The service area of some organization types rated in the Star Ratings are not defined at the state/county level, so their service area must be transformed to include all states and counties covered by their service area.
Table P-4 lists how the service area for each organization type rated in the Star Ratings is defined and what transformation, if any, is needed to create a common state/county level file for all contracts.
Table P-4: Organization type service areas and necessary transformations
Star Rating Organization Types How Service Area
is defined How Service Area is transformed
1876 Cost, E-CCP, E-PDP, E-PFFS, Local CCP, MSA, PFFS, R-PFFS & R-CCP
State/County Not necessary, service area is defined at the state/county level
Regional CCP MA Region A record is created for each state/county within the MA region
PDP PDP Region A record is created for each state/county within the PDP region
Compare the Individual Assistance states and counties from Step 2 to the service area from all contracts created in Step 3 with the state and counties. Create a list of all contracts which have any county that matches in both lists.
Create a second list of all contracts that do not share any service area with the Individual Assistance counties, so that information on the status of all contracts is accounted for during the performance period.
Identify the timeframe for each disaster and the associated enrollment files. Each of the disasters occurred during a specific period of time spread across the second half of the performance period. Since the enrollment in a contract is constantly changing, CMS used the enrollment the contract was paid for in a month that as closely matched the disaster period in the specific state/county as possible for all further processing, following the months in the table below.
Table P-5 shows each of the disasters where relief was granted along with the disaster start date, and the enrollment file month that was used for that specific disaster. The enrollment file choice was based on the enrollment file cut-off date the file was created.
Table P-5: Major disasters with associated enrollment months
FEMA Declaration State Start Date Declaration Date Enroll File Enroll Cut Off
COVID-19 outbreak (see table P-2) Nationwide 01/27/2020 Various N/A* N/A*
DR-4558 California 08/14/2020 08/22/2020 N/A* N/A*
DR-4559 Louisiana 08/22/2020 08/28/2020 N/A* N/A*
DR-4562 Oregon 09/07/2020 09/15/2020 N/A* N/A*
*Not applicable for the 2022 Star Ratings because all contracts that were active in 2020 qualify for the disaster adjustment as a result of the COVID-19 pandemic.
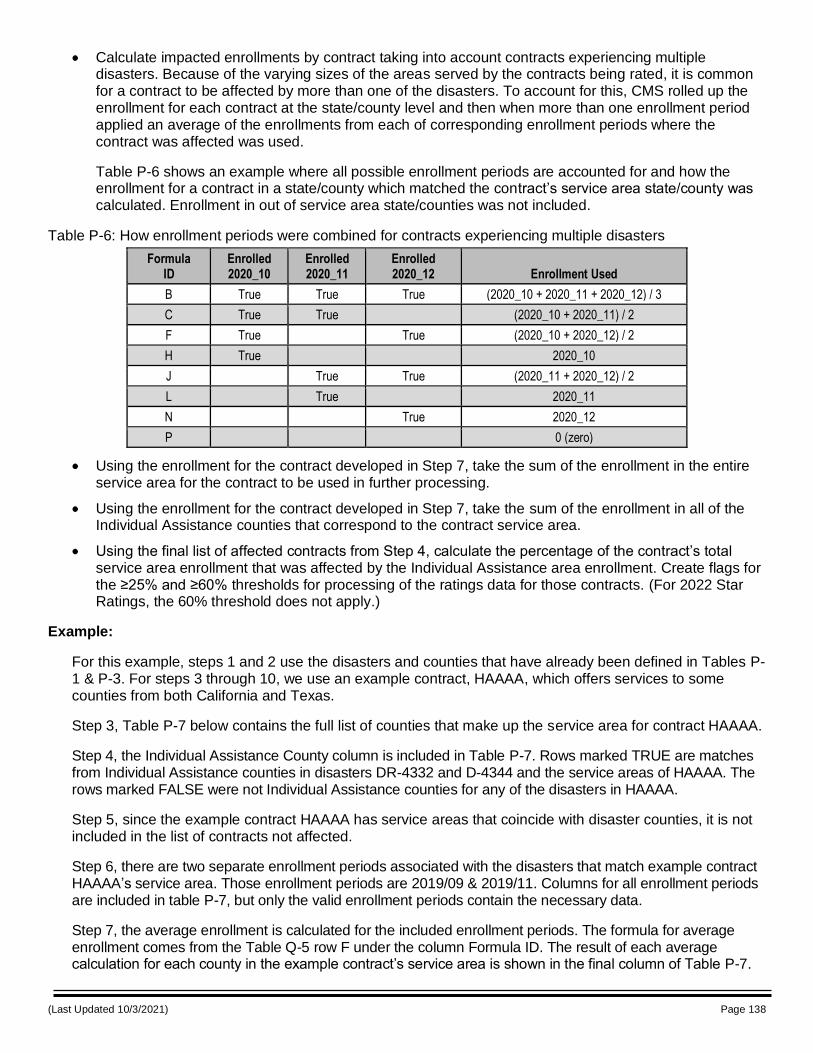
(Last Updated 10/3/2021) Page 138
Calculate impacted enrollments by contract taking into account contracts experiencing multiple disasters. Because of the varying sizes of the areas served by the contracts being rated, it is common for a contract to be affected by more than one of the disasters. To account for this, CMS rolled up the enrollment for each contract at the state/county level and then when more than one enrollment period applied an average of the enrollments from each of corresponding enrollment periods where the contract was affected was used.
Table P-6 shows an example where all possible enrollment periods are accounted for and how the enrollment for a contract in a state/county which matched the contract’s service area state/county was calculated. Enrollment in out of service area state/counties was not included.
Table P-6: How enrollment periods were combined for contracts experiencing multiple disasters
Formula ID
Enrolled 2020_10
Enrolled 2020_11
Enrolled 2020_12 Enrollment Used
B True True True (2020_10 + 2020_11 + 2020_12) / 3
C True True (2020_10 + 2020_11) / 2
F True True (2020_10 + 2020_12) / 2
H True 2020_10
J True True (2020_11 + 2020_12) / 2
L True 2020_11
N True 2020_12
P 0 (zero)
Using the enrollment for the contract developed in Step 7, take the sum of the enrollment in the entire service area for the contract to be used in further processing.
Using the enrollment for the contract developed in Step 7, take the sum of the enrollment in all of the Individual Assistance counties that correspond to the contract service area.
Using the final list of affected contracts from Step 4, calculate the percentage of the contract’s total service area enrollment that was affected by the Individual Assistance area enrollment. Create flags for the ≥25% and ≥60% thresholds for processing of the ratings data for those contracts. (For 2022 Star Ratings, the 60% threshold does not apply.)
Example:
For this example, steps 1 and 2 use the disasters and counties that have already been defined in Tables P-1 & P-3. For steps 3 through 10, we use an example contract, HAAAA, which offers services to some counties from both California and Texas.
Step 3, Table P-7 below contains the full list of counties that make up the service area for contract HAAAA.
Step 4, the Individual Assistance County column is included in Table P-7. Rows marked TRUE are matches from Individual Assistance counties in disasters DR-4332 and D-4344 and the service areas of HAAAA. The rows marked FALSE were not Individual Assistance counties for any of the disasters in HAAAA.
Step 5, since the example contract HAAAA has service areas that coincide with disaster counties, it is not included in the list of contracts not affected.
Step 6, there are two separate enrollment periods associated with the disasters that match example contract HAAAA’s service area. Those enrollment periods are 2019/09 & 2019/11. Columns for all enrollment periods are included in table P-7, but only the valid enrollment periods contain the necessary data.
Step 7, the average enrollment is calculated for the included enrollment periods. The formula for average enrollment comes from the Table Q-5 row F under the column Formula ID. The result of each average calculation for each county in the example contract’s service area is shown in the final column of Table P-7.
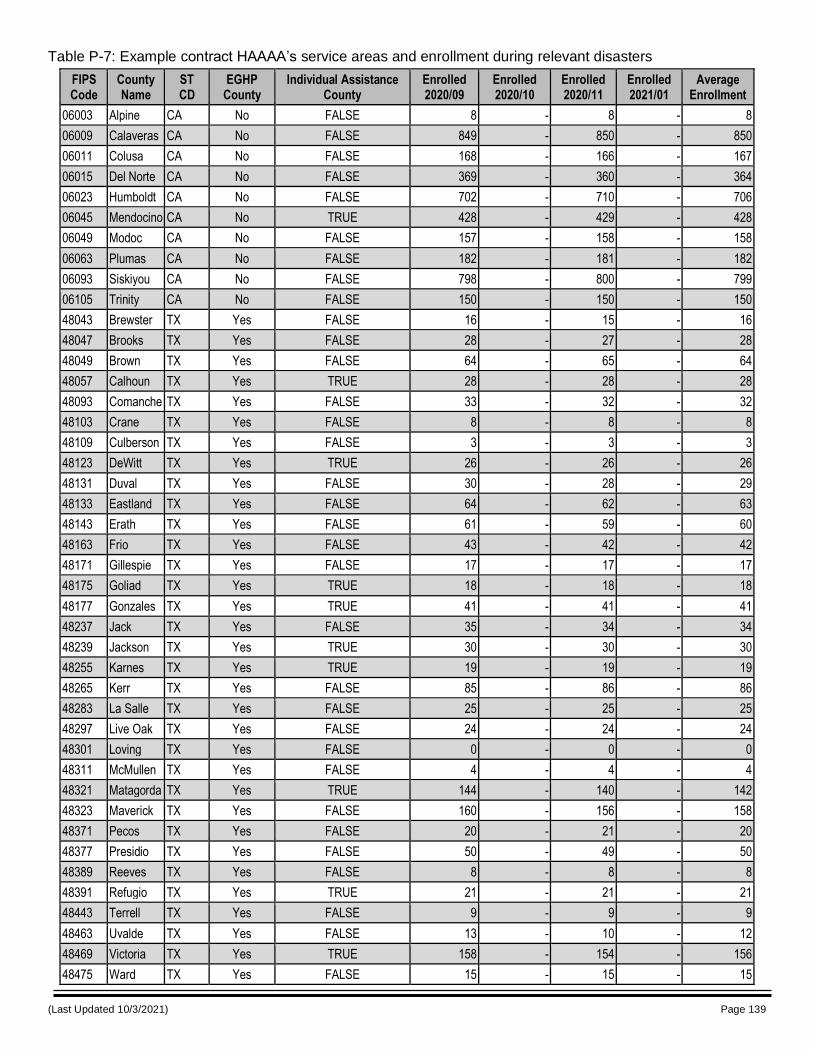
(Last Updated 10/3/2021) Page 139
Table P-7: Example contract HAAAA’s service areas and enrollment during relevant disasters
FIPS Code
County Name
ST CD
EGHP County
Individual Assistance County
Enrolled 2020/09
Enrolled 2020/10
Enrolled 2020/11
Enrolled 2021/01
Average Enrollment
06003 Alpine CA No FALSE 8 - 8 - 8
06009 Calaveras CA No FALSE 849 - 850 - 850
06011 Colusa CA No FALSE 168 - 166 - 167
06015 Del Norte CA No FALSE 369 - 360 - 364
06023 Humboldt CA No FALSE 702 - 710 - 706
06045 Mendocino CA No TRUE 428 - 429 - 428
06049 Modoc CA No FALSE 157 - 158 - 158
06063 Plumas CA No FALSE 182 - 181 - 182
06093 Siskiyou CA No FALSE 798 - 800 - 799
06105 Trinity CA No FALSE 150 - 150 - 150
48043 Brewster TX Yes FALSE 16 - 15 - 16
48047 Brooks TX Yes FALSE 28 - 27 - 28
48049 Brown TX Yes FALSE 64 - 65 - 64
48057 Calhoun TX Yes TRUE 28 - 28 - 28
48093 Comanche TX Yes FALSE 33 - 32 - 32
48103 Crane TX Yes FALSE 8 - 8 - 8
48109 Culberson TX Yes FALSE 3 - 3 - 3
48123 DeWitt TX Yes TRUE 26 - 26 - 26
48131 Duval TX Yes FALSE 30 - 28 - 29
48133 Eastland TX Yes FALSE 64 - 62 - 63
48143 Erath TX Yes FALSE 61 - 59 - 60
48163 Frio TX Yes FALSE 43 - 42 - 42
48171 Gillespie TX Yes FALSE 17 - 17 - 17
48175 Goliad TX Yes TRUE 18 - 18 - 18
48177 Gonzales TX Yes TRUE 41 - 41 - 41
48237 Jack TX Yes FALSE 35 - 34 - 34
48239 Jackson TX Yes TRUE 30 - 30 - 30
48255 Karnes TX Yes TRUE 19 - 19 - 19
48265 Kerr TX Yes FALSE 85 - 86 - 86
48283 La Salle TX Yes FALSE 25 - 25 - 25
48297 Live Oak TX Yes FALSE 24 - 24 - 24
48301 Loving TX Yes FALSE 0 - 0 - 0
48311 McMullen TX Yes FALSE 4 - 4 - 4
48321 Matagorda TX Yes TRUE 144 - 140 - 142
48323 Maverick TX Yes FALSE 160 - 156 - 158
48371 Pecos TX Yes FALSE 20 - 21 - 20
48377 Presidio TX Yes FALSE 50 - 49 - 50
48389 Reeves TX Yes FALSE 8 - 8 - 8
48391 Refugio TX Yes TRUE 21 - 21 - 21
48443 Terrell TX Yes FALSE 9 - 9 - 9
48463 Uvalde TX Yes FALSE 13 - 10 - 12
48469 Victoria TX Yes TRUE 158 - 154 - 156
48475 Ward TX Yes FALSE 15 - 15 - 15
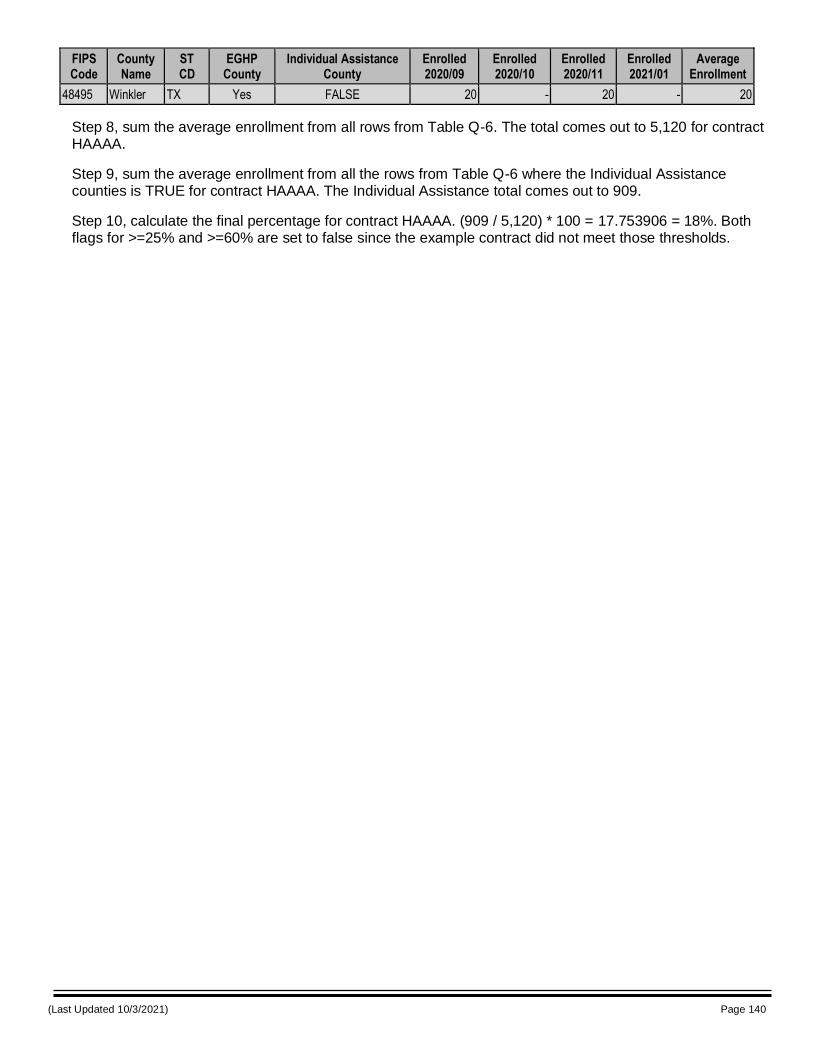
(Last Updated 10/3/2021) Page 140
FIPS Code
County Name
ST CD
EGHP County
Individual Assistance County
Enrolled 2020/09
Enrolled 2020/10
Enrolled 2020/11
Enrolled 2021/01
Average Enrollment
48495 Winkler TX Yes FALSE 20 - 20 - 20
Step 8, sum the average enrollment from all rows from Table Q-6. The total comes out to 5,120 for contract HAAAA.
Step 9, sum the average enrollment from all the rows from Table Q-6 where the Individual Assistance counties is TRUE for contract HAAAA. The Individual Assistance total comes out to 909.
Step 10, calculate the final percentage for contract HAAAA. (909 / 5,120) * 100 = 17.753906 = 18%. Both flags for >=25% and >=60% are set to false since the example contract did not meet those thresholds.
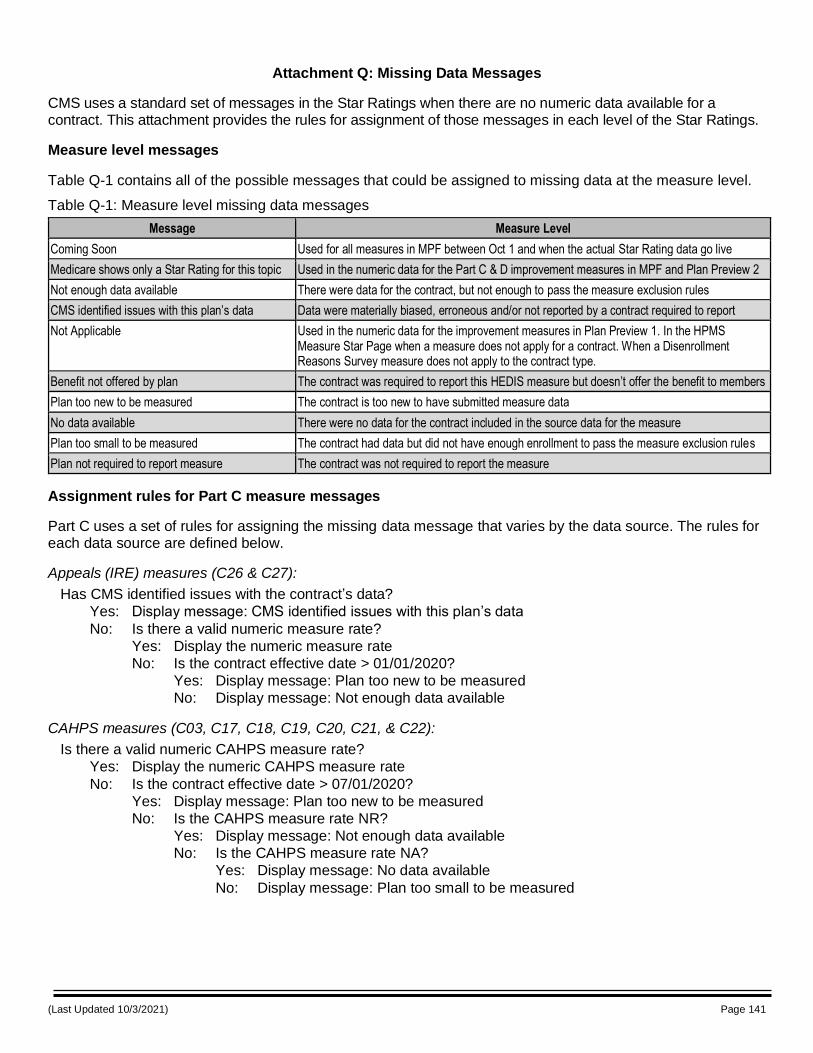
(Last Updated 10/3/2021) Page 141
Attachment Q: Missing Data Messages
CMS uses a standard set of messages in the Star Ratings when there are no numeric data available for a contract. This attachment provides the rules for assignment of those messages in each level of the Star Ratings.
Measure level messages
Table Q-1 contains all of the possible messages that could be assigned to missing data at the measure level.
Table Q-1: Measure level missing data messages
Message Measure Level
Coming Soon Used for all measures in MPF between Oct 1 and when the actual Star Rating data go live
Medicare shows only a Star Rating for this topic Used in the numeric data for the Part C & D improvement measures in MPF and Plan Preview 2
Not enough data available There were data for the contract, but not enough to pass the measure exclusion rules
CMS identified issues with this plan’s data Data were materially biased, erroneous and/or not reported by a contract required to report
Not Applicable Used in the numeric data for the improvement measures in Plan Preview 1. In the HPMS Measure Star Page when a measure does not apply for a contract. When a Disenrollment Reasons Survey measure does not apply to the contract type.
Benefit not offered by plan The contract was required to report this HEDIS measure but doesn’t offer the benefit to members
Plan too new to be measured The contract is too new to have submitted measure data
No data available There were no data for the contract included in the source data for the measure
Plan too small to be measured The contract had data but did not have enough enrollment to pass the measure exclusion rules
Plan not required to report measure The contract was not required to report the measure
Assignment rules for Part C measure messages
Part C uses a set of rules for assigning the missing data message that varies by the data source. The rules for each data source are defined below.
Appeals (IRE) measures (C26 & C27):
Has CMS identified issues with the contract’s data?
Yes: Display message: CMS identified issues with this plan’s data
No: Is there a valid numeric measure rate?
Yes: Display the numeric measure rate
No: Is the contract effective date > 01/01/2020?
Yes: Display message: Plan too new to be measured
No: Display message: Not enough data available
CAHPS measures (C03, C17, C18, C19, C20, C21, & C22):
Is there a valid numeric CAHPS measure rate?
Yes: Display the numeric CAHPS measure rate
No: Is the contract effective date > 07/01/2020?
Yes: Display message: Plan too new to be measured
No: Is the CAHPS measure rate NR?
Yes: Display message: Not enough data available
No: Is the CAHPS measure rate NA?
Yes: Display message: No data available
No: Display message: Plan too small to be measured
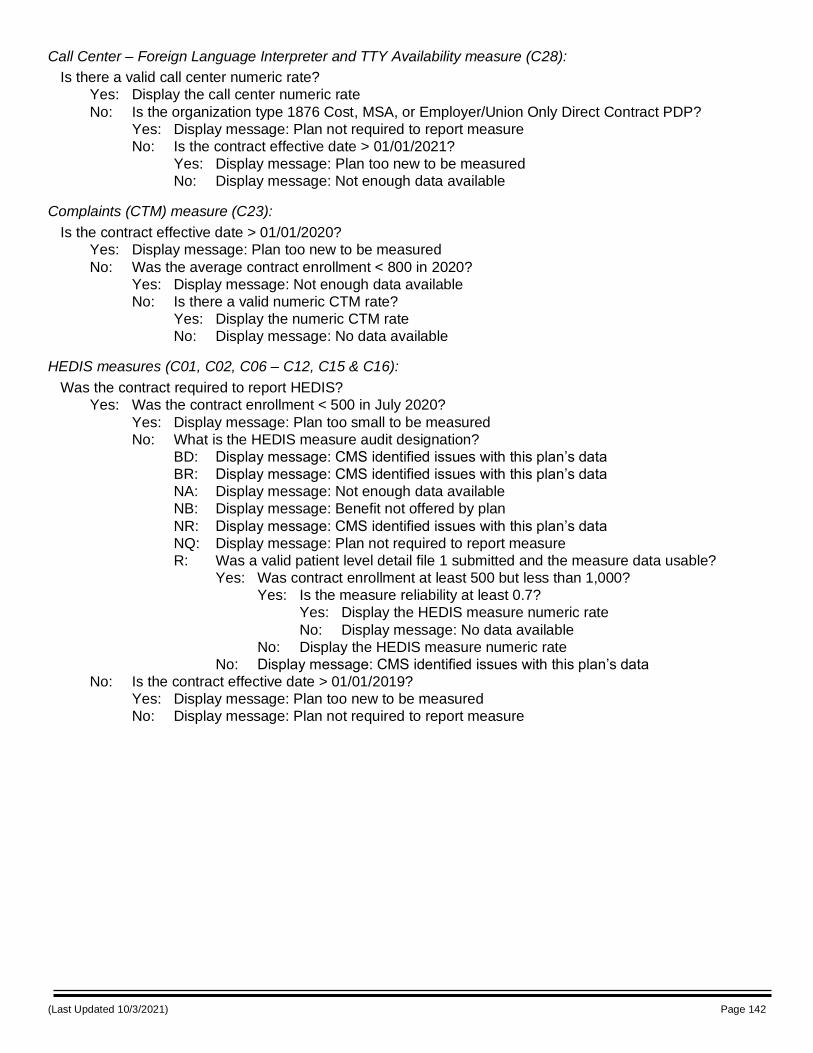
(Last Updated 10/3/2021) Page 142
Call Center – Foreign Language Interpreter and TTY Availability measure (C28):
Is there a valid call center numeric rate?
Yes: Display the call center numeric rate
No: Is the organization type 1876 Cost, MSA, or Employer/Union Only Direct Contract PDP?
Yes: Display message: Plan not required to report measure
No: Is the contract effective date > 01/01/2021?
Yes: Display message: Plan too new to be measured
No: Display message: Not enough data available
Complaints (CTM) measure (C23):
Is the contract effective date > 01/01/2020?
Yes: Display message: Plan too new to be measured
No: Was the average contract enrollment < 800 in 2020?
Yes: Display message: Not enough data available
No: Is there a valid numeric CTM rate?
Yes: Display the numeric CTM rate
No: Display message: No data available
HEDIS measures (C01, C02, C06 – C12, C15 & C16):
Was the contract required to report HEDIS?
Yes: Was the contract enrollment < 500 in July 2020?
Yes: Display message: Plan too small to be measured
No: What is the HEDIS measure audit designation?
BD: Display message: CMS identified issues with this plan’s data
BR: Display message: CMS identified issues with this plan’s data
NA: Display message: Not enough data available
NB: Display message: Benefit not offered by plan
NR: Display message: CMS identified issues with this plan’s data
NQ: Display message: Plan not required to report measure
R: Was a valid patient level detail file 1 submitted and the measure data usable?
Yes: Was contract enrollment at least 500 but less than 1,000?
Yes: Is the measure reliability at least 0.7?
Yes: Display the HEDIS measure numeric rate
No: Display message: No data available
No: Display the HEDIS measure numeric rate
No: Display message: CMS identified issues with this plan’s data
No: Is the contract effective date > 01/01/2019?
Yes: Display message: Plan too new to be measured
No: Display message: Plan not required to report measure
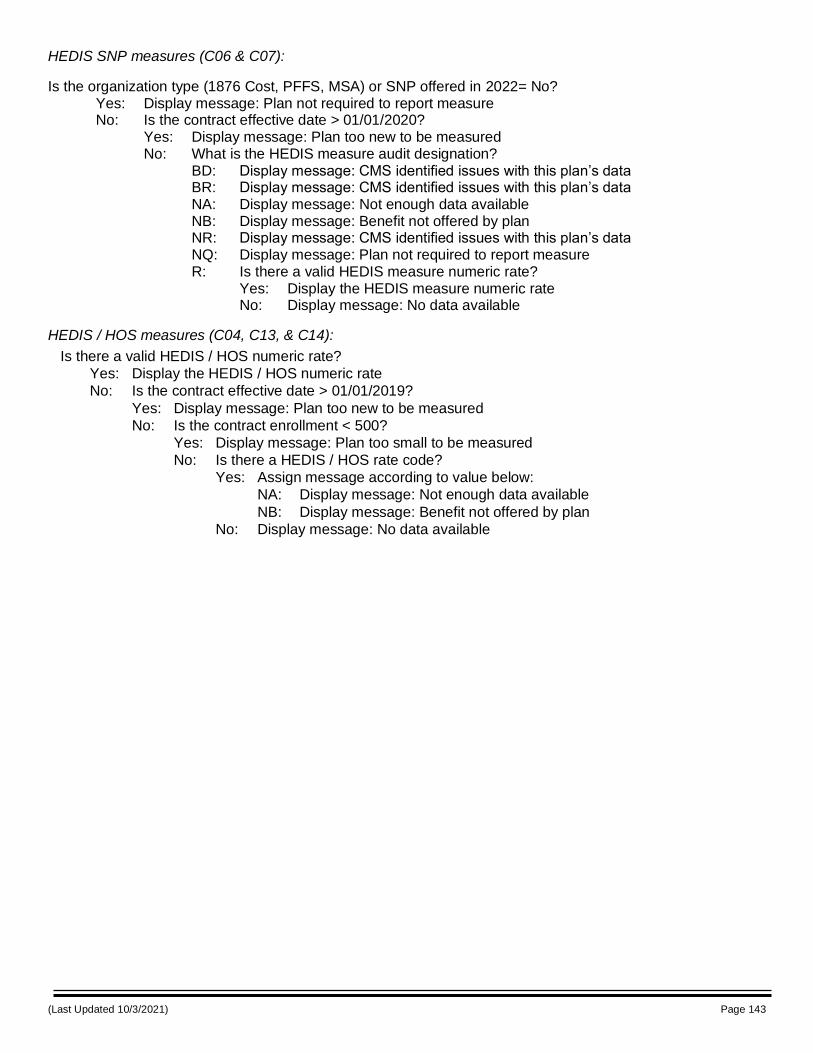
(Last Updated 10/3/2021) Page 143
HEDIS SNP measures (C06 & C07):
Is the organization type (1876 Cost, PFFS, MSA) or SNP offered in 2022= No? Yes: Display message: Plan not required to report measure No: Is the contract effective date > 01/01/2020? Yes: Display message: Plan too new to be measured No: What is the HEDIS measure audit designation? BD: Display message: CMS identified issues with this plan’s data BR: Display message: CMS identified issues with this plan’s data NA: Display message: Not enough data available NB: Display message: Benefit not offered by plan NR: Display message: CMS identified issues with this plan’s data NQ: Display message: Plan not required to report measure R: Is there a valid HEDIS measure numeric rate? Yes: Display the HEDIS measure numeric rate No: Display message: No data available
HEDIS / HOS measures (C04, C13, & C14):
Is there a valid HEDIS / HOS numeric rate?
Yes: Display the HEDIS / HOS numeric rate
No: Is the contract effective date > 01/01/2019?
Yes: Display message: Plan too new to be measured
No: Is the contract enrollment < 500?
Yes: Display message: Plan too small to be measured
No: Is there a HEDIS / HOS rate code?
Yes: Assign message according to value below:
NA: Display message: Not enough data available
NB: Display message: Benefit not offered by plan
No: Display message: No data available
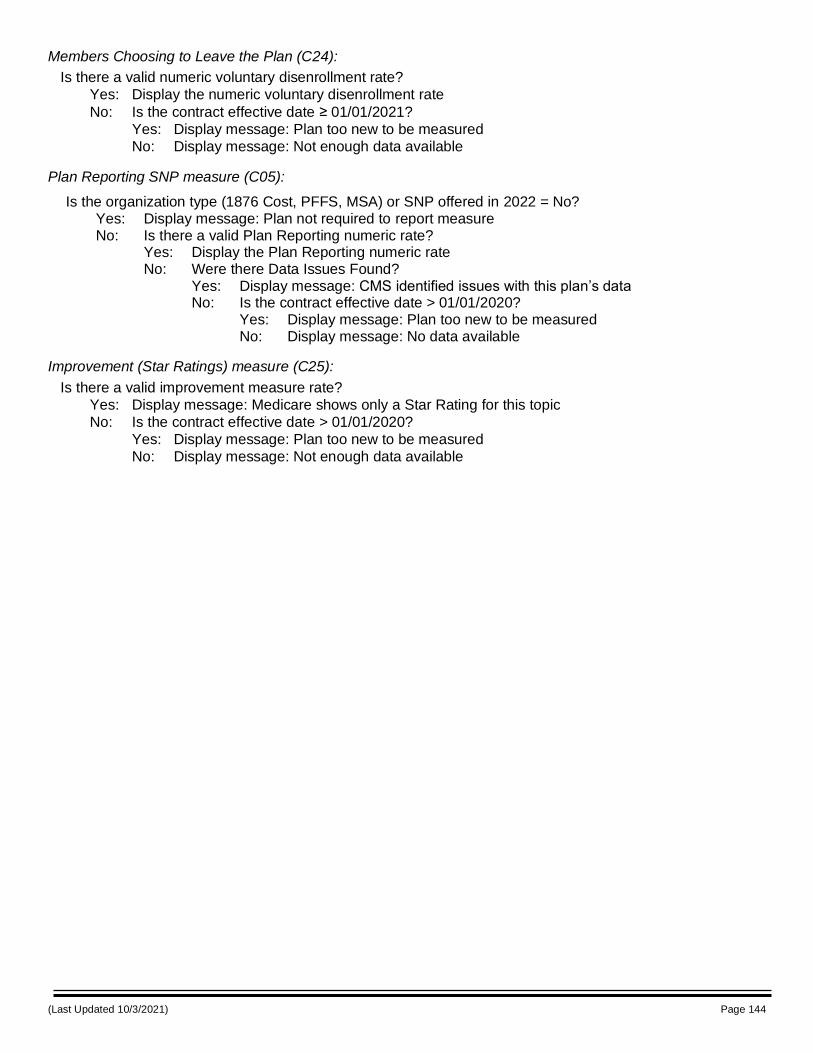
(Last Updated 10/3/2021) Page 144
Members Choosing to Leave the Plan (C24):
Is there a valid numeric voluntary disenrollment rate?
Yes: Display the numeric voluntary disenrollment rate
No: Is the contract effective date ≥ 01/01/2021?
Yes: Display message: Plan too new to be measured
No: Display message: Not enough data available
Plan Reporting SNP measure (C05):
Is the organization type (1876 Cost, PFFS, MSA) or SNP offered in 2022 = No? Yes: Display message: Plan not required to report measure No: Is there a valid Plan Reporting numeric rate? Yes: Display the Plan Reporting numeric rate No: Were there Data Issues Found? Yes: Display message: CMS identified issues with this plan’s data No: Is the contract effective date > 01/01/2020? Yes: Display message: Plan too new to be measured No: Display message: No data available
Improvement (Star Ratings) measure (C25):
Is there a valid improvement measure rate?
Yes: Display message: Medicare shows only a Star Rating for this topic
No: Is the contract effective date > 01/01/2020?
Yes: Display message: Plan too new to be measured
No: Display message: Not enough data available
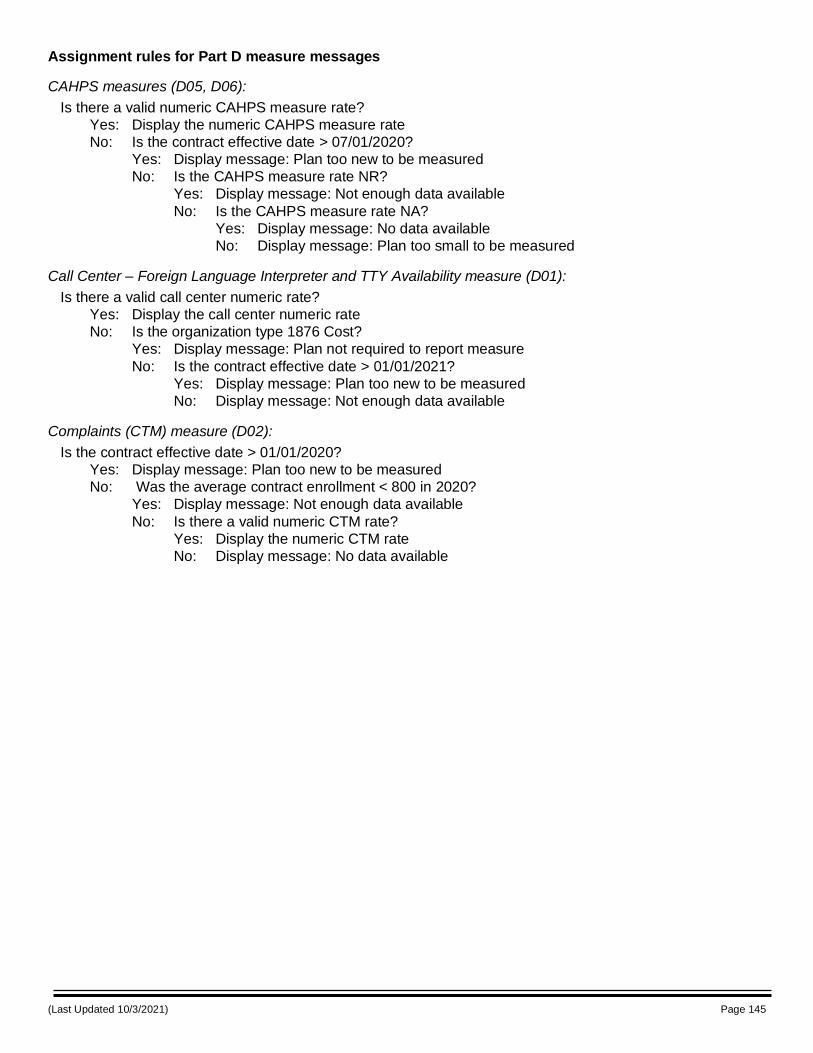
(Last Updated 10/3/2021) Page 145
Assignment rules for Part D measure messages
CAHPS measures (D05, D06):
Is there a valid numeric CAHPS measure rate?
Yes: Display the numeric CAHPS measure rate
No: Is the contract effective date > 07/01/2020?
Yes: Display message: Plan too new to be measured
No: Is the CAHPS measure rate NR?
Yes: Display message: Not enough data available
No: Is the CAHPS measure rate NA?
Yes: Display message: No data available
No: Display message: Plan too small to be measured
Call Center – Foreign Language Interpreter and TTY Availability measure (D01):
Is there a valid call center numeric rate?
Yes: Display the call center numeric rate
No: Is the organization type 1876 Cost?
Yes: Display message: Plan not required to report measure
No: Is the contract effective date > 01/01/2021?
Yes: Display message: Plan too new to be measured
No: Display message: Not enough data available
Complaints (CTM) measure (D02):
Is the contract effective date > 01/01/2020?
Yes: Display message: Plan too new to be measured
No: Was the average contract enrollment < 800 in 2020?
Yes: Display message: Not enough data available
No: Is there a valid numeric CTM rate?
Yes: Display the numeric CTM rate
No: Display message: No data available
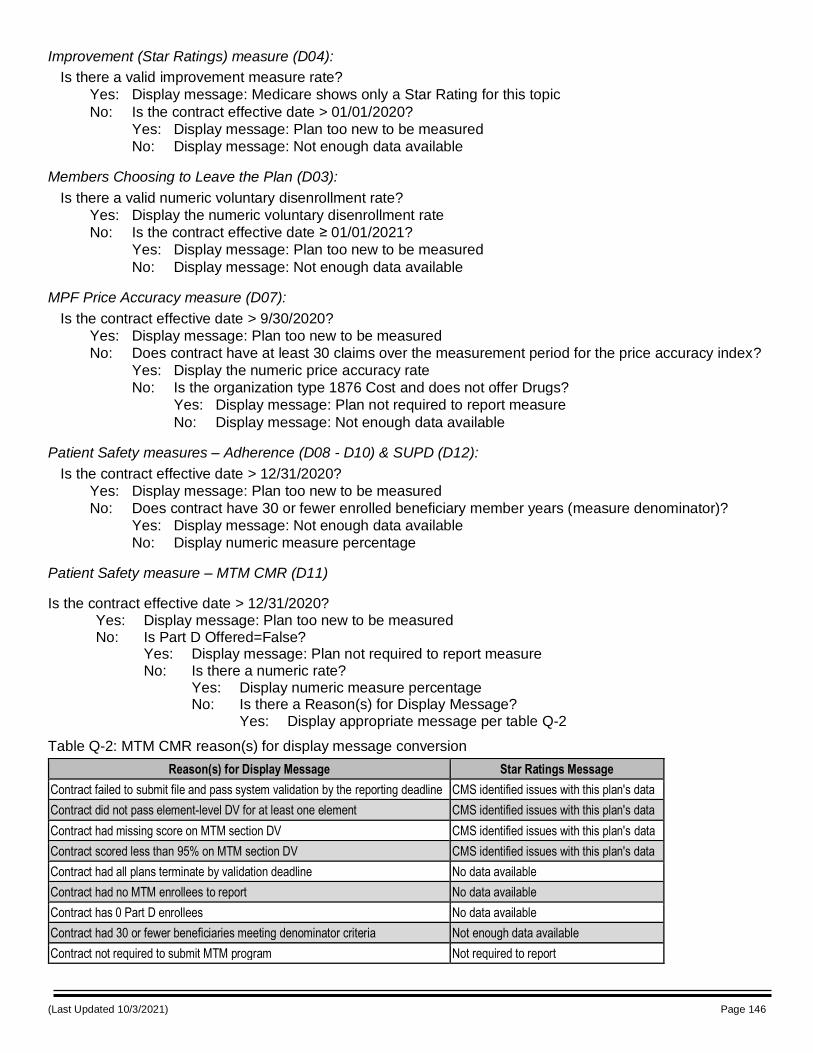
(Last Updated 10/3/2021) Page 146
Improvement (Star Ratings) measure (D04):
Is there a valid improvement measure rate?
Yes: Display message: Medicare shows only a Star Rating for this topic
No: Is the contract effective date > 01/01/2020?
Yes: Display message: Plan too new to be measured
No: Display message: Not enough data available
Members Choosing to Leave the Plan (D03):
Is there a valid numeric voluntary disenrollment rate?
Yes: Display the numeric voluntary disenrollment rate
No: Is the contract effective date ≥ 01/01/2021?
Yes: Display message: Plan too new to be measured
No: Display message: Not enough data available
MPF Price Accuracy measure (D07):
Is the contract effective date > 9/30/2020?
Yes: Display message: Plan too new to be measured
No: Does contract have at least 30 claims over the measurement period for the price accuracy index?
Yes: Display the numeric price accuracy rate
No: Is the organization type 1876 Cost and does not offer Drugs?
Yes: Display message: Plan not required to report measure
No: Display message: Not enough data available
Patient Safety measures – Adherence (D08 - D10) & SUPD (D12):
Is the contract effective date > 12/31/2020?
Yes: Display message: Plan too new to be measured
No: Does contract have 30 or fewer enrolled beneficiary member years (measure denominator)?
Yes: Display message: Not enough data available
No: Display numeric measure percentage
Patient Safety measure – MTM CMR (D11)
Is the contract effective date > 12/31/2020? Yes: Display message: Plan too new to be measured No: Is Part D Offered=False? Yes: Display message: Plan not required to report measure No: Is there a numeric rate? Yes: Display numeric measure percentage No: Is there a Reason(s) for Display Message? Yes: Display appropriate message per table Q-2
Table Q-2: MTM CMR reason(s) for display message conversion
Reason(s) for Display Message Star Ratings Message
Contract failed to submit file and pass system validation by the reporting deadline CMS identified issues with this plan's data
Contract did not pass element-level DV for at least one element CMS identified issues with this plan's data
Contract had missing score on MTM section DV CMS identified issues with this plan's data
Contract scored less than 95% on MTM section DV CMS identified issues with this plan's data
Contract had all plans terminate by validation deadline No data available
Contract had no MTM enrollees to report No data available
Contract has 0 Part D enrollees No data available
Contract had 30 or fewer beneficiaries meeting denominator criteria Not enough data available
Contract not required to submit MTM program Not required to report
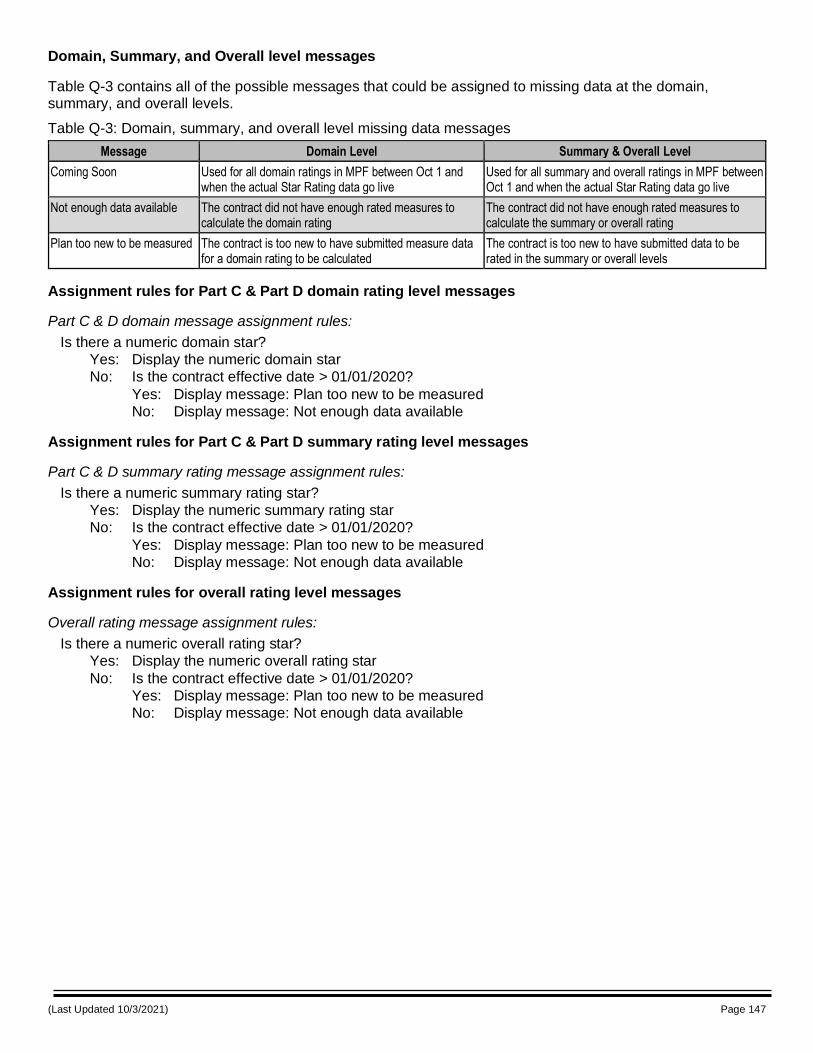
(Last Updated 10/3/2021) Page 147
Domain, Summary, and Overall level messages
Table Q-3 contains all of the possible messages that could be assigned to missing data at the domain, summary, and overall levels.
Table Q-3: Domain, summary, and overall level missing data messages
Message Domain Level Summary & Overall Level
Coming Soon Used for all domain ratings in MPF between Oct 1 and when the actual Star Rating data go live
Used for all summary and overall ratings in MPF between Oct 1 and when the actual Star Rating data go live
Not enough data available The contract did not have enough rated measures to calculate the domain rating
The contract did not have enough rated measures to calculate the summary or overall rating
Plan too new to be measured The contract is too new to have submitted measure data for a domain rating to be calculated
The contract is too new to have submitted data to be rated in the summary or overall levels
Assignment rules for Part C & Part D domain rating level messages
Part C & D domain message assignment rules:
Is there a numeric domain star?
Yes: Display the numeric domain star
No: Is the contract effective date > 01/01/2020?
Yes: Display message: Plan too new to be measured
No: Display message: Not enough data available
Assignment rules for Part C & Part D summary rating level messages
Part C & D summary rating message assignment rules:
Is there a numeric summary rating star?
Yes: Display the numeric summary rating star
No: Is the contract effective date > 01/01/2020?
Yes: Display message: Plan too new to be measured
No: Display message: Not enough data available
Assignment rules for overall rating level messages
Overall rating message assignment rules:
Is there a numeric overall rating star?
Yes: Display the numeric overall rating star
No: Is the contract effective date > 01/01/2020?
Yes: Display message: Plan too new to be measured
No: Display message: Not enough data available
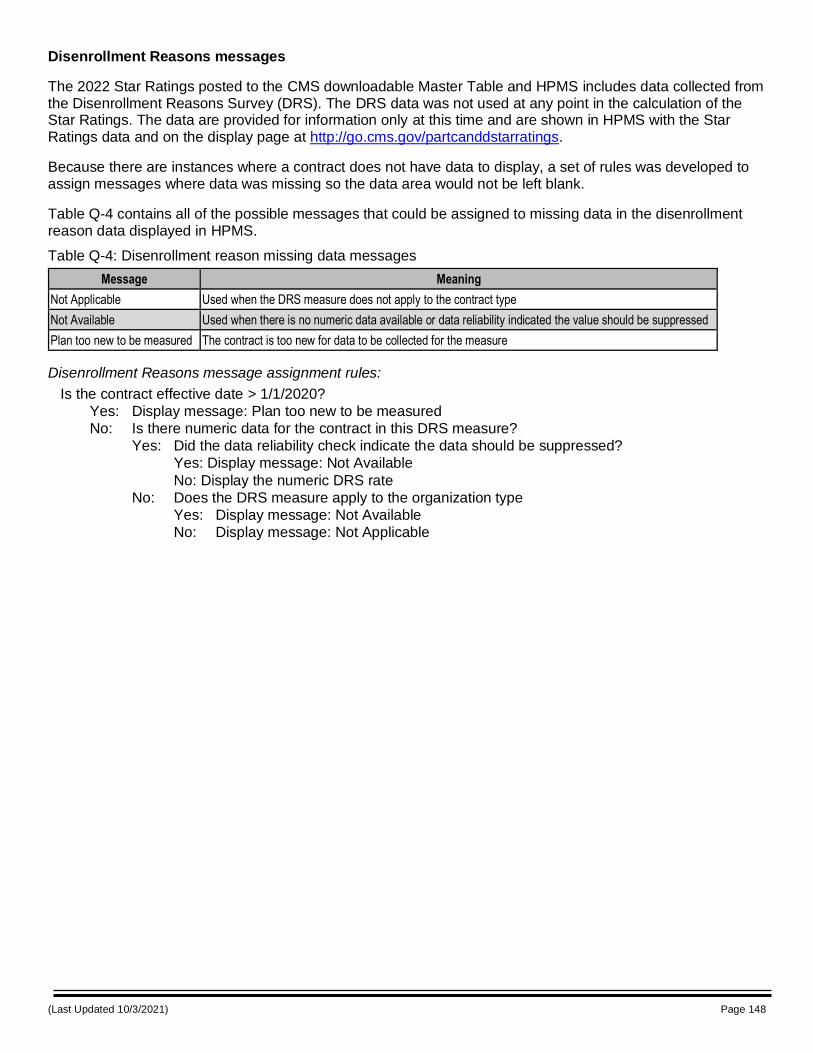
(Last Updated 10/3/2021) Page 148
Disenrollment Reasons messages
The 2022 Star Ratings posted to the CMS downloadable Master Table and HPMS includes data collected from the Disenrollment Reasons Survey (DRS). The DRS data was not used at any point in the calculation of the Star Ratings. The data are provided for information only at this time and are shown in HPMS with the Star Ratings data and on the display page at http://go.cms.gov/partcanddstarratings.
Because there are instances where a contract does not have data to display, a set of rules was developed to assign messages where data was missing so the data area would not be left blank.
Table Q-4 contains all of the possible messages that could be assigned to missing data in the disenrollment reason data displayed in HPMS.
Table Q-4: Disenrollment reason missing data messages
Message Meaning
Not Applicable Used when the DRS measure does not apply to the contract type
Not Available Used when there is no numeric data available or data reliability indicated the value should be suppressed
Plan too new to be measured The contract is too new for data to be collected for the measure
Disenrollment Reasons message assignment rules:
Is the contract effective date > 1/1/2020?
Yes: Display message: Plan too new to be measured
No: Is there numeric data for the contract in this DRS measure?
Yes: Did the data reliability check indicate the data should be suppressed?
Yes: Display message: Not Available
No: Display the numeric DRS rate
No: Does the DRS measure apply to the organization type
Yes: Display message: Not Available
No: Display message: Not Applicable
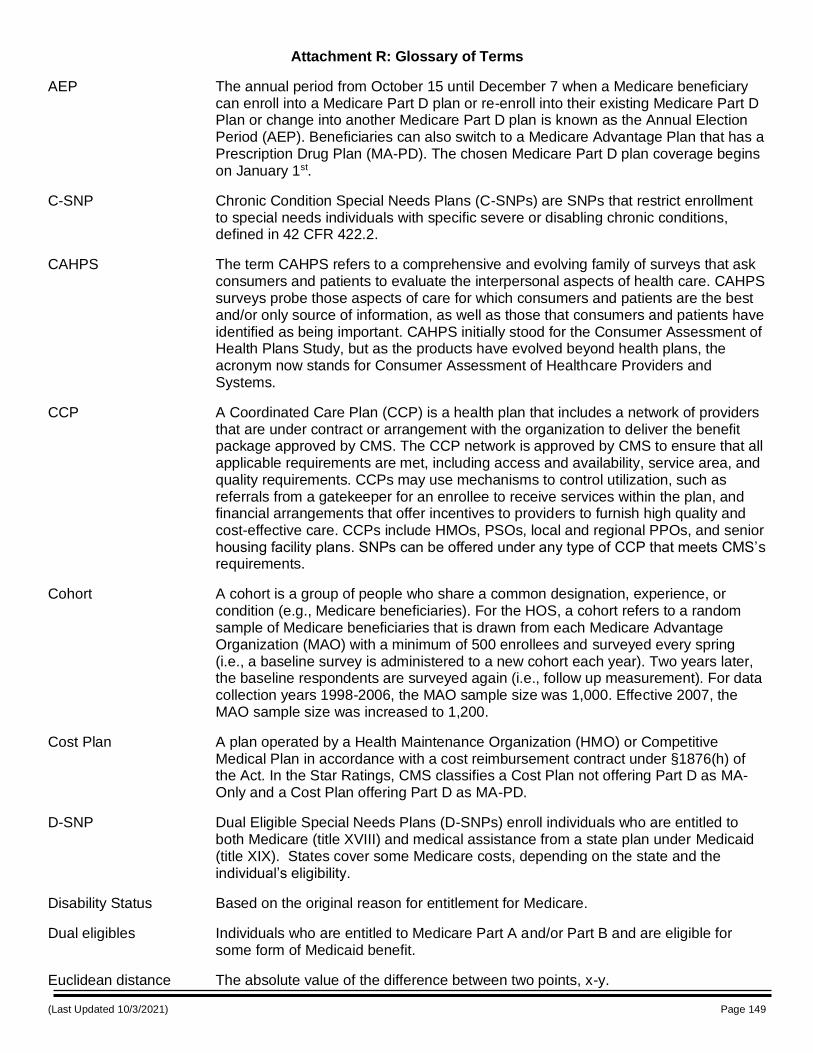
(Last Updated 10/3/2021) Page 149
Attachment R: Glossary of Terms
AEP The annual period from October 15 until December 7 when a Medicare beneficiary can enroll into a Medicare Part D plan or re-enroll into their existing Medicare Part D Plan or change into another Medicare Part D plan is known as the Annual Election Period (AEP). Beneficiaries can also switch to a Medicare Advantage Plan that has a Prescription Drug Plan (MA-PD). The chosen Medicare Part D plan coverage begins on January 1st.
C-SNP Chronic Condition Special Needs Plans (C-SNPs) are SNPs that restrict enrollment to special needs individuals with specific severe or disabling chronic conditions, defined in 42 CFR 422.2.
CAHPS The term CAHPS refers to a comprehensive and evolving family of surveys that ask consumers and patients to evaluate the interpersonal aspects of health care. CAHPS surveys probe those aspects of care for which consumers and patients are the best and/or only source of information, as well as those that consumers and patients have identified as being important. CAHPS initially stood for the Consumer Assessment of Health Plans Study, but as the products have evolved beyond health plans, the acronym now stands for Consumer Assessment of Healthcare Providers and Systems.
CCP A Coordinated Care Plan (CCP) is a health plan that includes a network of providers that are under contract or arrangement with the organization to deliver the benefit package approved by CMS. The CCP network is approved by CMS to ensure that all applicable requirements are met, including access and availability, service area, and quality requirements. CCPs may use mechanisms to control utilization, such as referrals from a gatekeeper for an enrollee to receive services within the plan, and financial arrangements that offer incentives to providers to furnish high quality and cost-effective care. CCPs include HMOs, PSOs, local and regional PPOs, and senior housing facility plans. SNPs can be offered under any type of CCP that meets CMS’s requirements.
Cohort A cohort is a group of people who share a common designation, experience, or condition (e.g., Medicare beneficiaries). For the HOS, a cohort refers to a random sample of Medicare beneficiaries that is drawn from each Medicare Advantage Organization (MAO) with a minimum of 500 enrollees and surveyed every spring (i.e., a baseline survey is administered to a new cohort each year). Two years later, the baseline respondents are surveyed again (i.e., follow up measurement). For data collection years 1998-2006, the MAO sample size was 1,000. Effective 2007, the MAO sample size was increased to 1,200.
Cost Plan A plan operated by a Health Maintenance Organization (HMO) or Competitive Medical Plan in accordance with a cost reimbursement contract under §1876(h) of the Act. In the Star Ratings, CMS classifies a Cost Plan not offering Part D as MA-Only and a Cost Plan offering Part D as MA-PD.
D-SNP Dual Eligible Special Needs Plans (D-SNPs) enroll individuals who are entitled to both Medicare (title XVIII) and medical assistance from a state plan under Medicaid (title XIX). States cover some Medicare costs, depending on the state and the individual’s eligibility.
Disability Status Based on the original reason for entitlement for Medicare.
Dual eligibles Individuals who are entitled to Medicare Part A and/or Part B and are eligible for some form of Medicaid benefit.
Euclidean distance The absolute value of the difference between two points, x-y.
(Last Updated 10/3/2021) Page 150
HEDIS The Healthcare Effectiveness Data and Information Set (HEDIS) is a widely used set of performance measures in the managed care industry, developed and maintained by the National Committee for Quality Assurance (NCQA).
HOS The Medicare Health Outcomes Survey (HOS) is the first patient reported outcomes measure used in Medicare managed care. The goal of the Medicare HOS program is to gather valid, reliable, and clinically meaningful health status data in the Medicare Advantage (MA) program for use in quality improvement activities, pay for performance, program oversight, public reporting, and improving health. All managed care organizations with MA contracts must participate.
I-SNP Institutional Special Needs Plans (I-SNPs) are SNPs that restrict enrollment to institutionalized special needs individuals defined in 42 CFR 422.2.
ICEP The 3 months immediately before beneficiaries are entitled to Medicare Part A and enrolled in Part B are known as the Initial Coverage Election Period (ICEP). Beneficiaries may choose a Medicare health plan during their ICEP and the plan must accept them unless it has reached its limit in the number of members. This limit is approved by CMS.
IRE The Independent Review Entity (IRE) is an independent entity contracted by CMS to review Medicare health and drug plans’ adverse reconsiderations of organization determinations.
IVR Interactive voice response (IVR) is a technology that allows a computer to interact with humans through the use of voice and dual-tone multi-frequency keypad inputs.
LIS The Low Income Subsidy (LIS) from Medicare provides financial assistance for beneficiaries who have limited income and resources. Those who receive the LIS get help paying for their monthly premium, yearly deductible, prescription coinsurance, and copayments and they will have no gap in coverage.
LIS/DE Beneficiaries who qualify at any point in the year for a low income subsidy through the application process and/or who are full or partial Dual (Medicare and Medicaid) beneficiaries.
MA A Medicare Advantage (MA) organization is a public or private entity organized and licensed by a State as a risk-bearing entity (with the exception of provider-sponsored organizations receiving waivers) that is certified by CMS as meeting the MA contract requirements.
MA-Only An MA organization that does not offer Medicare prescription drug coverage.
MA-PD An MA organization that offers Medicare prescription drug coverage and Part A and Part B benefits in one plan.
MSA Medicare Medical Savings Account (MSA) plans combine a high deductible MA plan and a medical savings account (which is an account established for the purpose of paying the qualified medical expenses of the account holder).
Percentage A part of a whole expressed in hundredths. For example, a score of 45 out of 100 possible points is the same as 45%.
Percentile The value below which a certain percent of observations fall. For example, a score equal to or greater than 97 percent of other scores attained on the same measure is said to be in the 97th percentile.
(Last Updated 10/3/2021) Page 151
PDP A Prescription Drug Plan (PDP) is a stand-alone drug plan, offered by insurers and other private companies to beneficiaries who receive their Medicare Part A and/or B benefits either through the Original Medicare Plan, Medicare Private Fee-for-Service Plans that do not offer prescription drug coverage, or Medicare Cost Plans that do not offer Medicare prescription drug coverage.
PFFS Private Fee-for-Service (PFFS) is defined as an MA plan that pays providers of services at a rate determined by the plan on a fee-for-service basis without placing the provider at financial risk; does not vary the rates for a provider based on the utilization of that provider's services; and does not restrict enrollees' choices among providers who are lawfully authorized to provide services and agree to accept the plan's terms and conditions of payment. The Medicare Improvements for Patients and Providers Act (MIPPA) added that although payment rates cannot vary based solely on utilization of services by a provider, a PFFS plan is permitted to vary the payment rates for a provider based on the specialty of the provider, the location of the provider, or other factors related to the provider that are not related to utilization. Furthermore, MIPPA also allows PFFS plans to increase payment rates to a provider based on increased utilization of specified preventive or screening services. See section 30.4 of the Medicare Managed Care Manual Chapter 1 for further details on PFFS plans.
Reliability A measure of the fraction of the variation among the observed measure values that is due to real differences in quality (“signal”) rather than random variation (“noise”). On a scale from 0 (all differences among plans are due to randomness of sampling) to 1 (every plan's quality is measured with perfect accuracy).
SNP A Special Needs Plan (SNP) is a Medicare Advantage (MA) coordinated care plan (CCP) specifically designed to provide targeted care and limits enrollment to special needs individuals. A special needs individual could be any one of the following: 1) an institutionalized individual, 2) a dual eligible beneficiary, or 3) an individual with a severe or disabling chronic condition, as specified by CMS. A SNP may be any type of MA CCP. There are three major types of SNPs: 1) Chronic Condition SNP (C-SNP), 2) Dual Eligible SNP (D-SNP), and 3) Institutional SNP (I-SNP).
Sponsor An entity that sponsors a health or drug plan.
Statistical Significance Statistical significance assesses how likely differences observed are due to chance
when plans are actually the same. CMS uses statistical tests (e.g., t-test) to determine if a contract’s measure value is statistically significantly greater or less than the national average for that measure, or whether conversely the observed differences from the national average could have arisen by chance.
Sum of Squares Method used to measure variation or deviation from the mean.
TTY A teletypewriter (TTY) is an electronic device for text communication via a telephone line, used when one or more of the parties has hearing or speech difficulties.
Very Low Reliability For CAHPS, an indication that reliability is less than 0.6, indicating that 40% or more of observed variation is due to random noise.
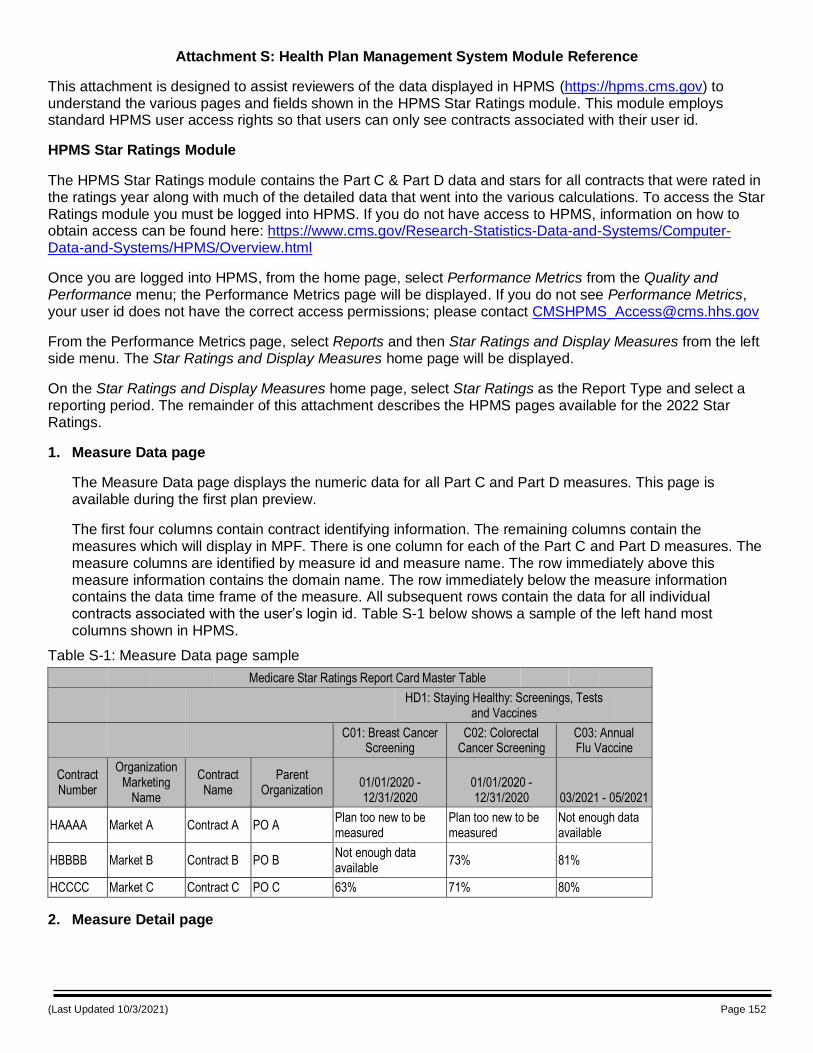
(Last Updated 10/3/2021) Page 152
Attachment S: Health Plan Management System Module Reference
This attachment is designed to assist reviewers of the data displayed in HPMS (https://hpms.cms.gov) to understand the various pages and fields shown in the HPMS Star Ratings module. This module employs standard HPMS user access rights so that users can only see contracts associated with their user id.
HPMS Star Ratings Module
The HPMS Star Ratings module contains the Part C & Part D data and stars for all contracts that were rated in the ratings year along with much of the detailed data that went into the various calculations. To access the Star Ratings module you must be logged into HPMS. If you do not have access to HPMS, information on how to obtain access can be found here: https://www.cms.gov/Research-Statistics-Data-and-Systems/Computer-Data-and-Systems/HPMS/Overview.html
Once you are logged into HPMS, from the home page, select Performance Metrics from the Quality and Performance menu; the Performance Metrics page will be displayed. If you do not see Performance Metrics, your user id does not have the correct access permissions; please contact [email protected]
From the Performance Metrics page, select Reports and then Star Ratings and Display Measures from the left side menu. The Star Ratings and Display Measures home page will be displayed.
On the Star Ratings and Display Measures home page, select Star Ratings as the Report Type and select a reporting period. The remainder of this attachment describes the HPMS pages available for the 2022 Star Ratings.
1. Measure Data page
The Measure Data page displays the numeric data for all Part C and Part D measures. This page is available during the first plan preview.
The first four columns contain contract identifying information. The remaining columns contain the measures which will display in MPF. There is one column for each of the Part C and Part D measures. The measure columns are identified by measure id and measure name. The row immediately above this measure information contains the domain name. The row immediately below the measure information contains the data time frame of the measure. All subsequent rows contain the data for all individual contracts associated with the user’s login id. Table S-1 below shows a sample of the left hand most columns shown in HPMS.
Table S-1: Measure Data page sample
Medicare Star Ratings Report Card Master Table
HD1: Staying Healthy: Screenings, Tests
and Vaccines
C01: Breast Cancer Screening
C02: Colorectal Cancer Screening
C03: Annual Flu Vaccine
Contract Number
Organization Marketing
Name
Contract Name
Parent Organization
01/01/2020 - 12/31/2020
01/01/2020 - 12/31/2020 03/2021 - 05/2021
HAAAA Market A Contract A PO A Plan too new to be measured
Plan too new to be measured
Not enough data available
HBBBB Market B Contract B PO B Not enough data available
73% 81%
HCCCC Market C Contract C PO C 63% 71% 80%
2. Measure Detail page
(Last Updated 10/3/2021) Page 153
The Measure Detail page contains the underlying data used for the Part C and Part D Complaints (C23/D02) and Part C Appeals measures (C26 & C27). This page is available during the first plan preview. Table S-2 below explains each of the columns displayed on this page.
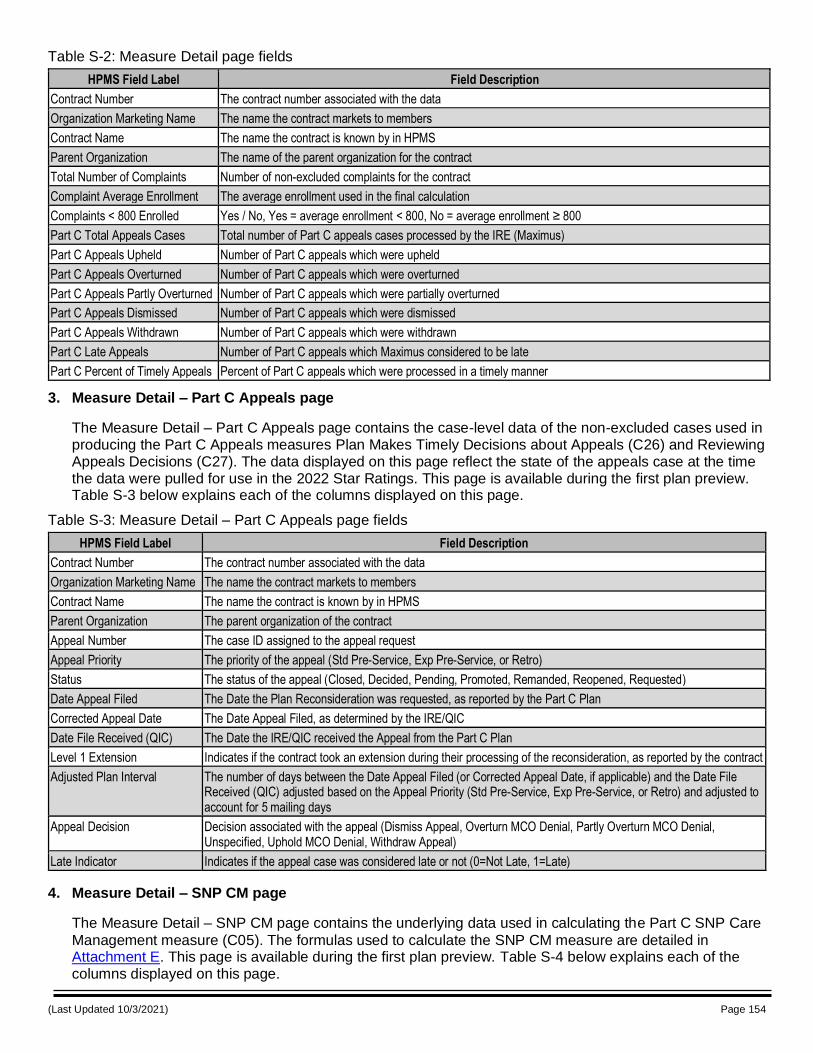
(Last Updated 10/3/2021) Page 154
Table S-2: Measure Detail page fields
HPMS Field Label Field Description
Contract Number The contract number associated with the data
Organization Marketing Name The name the contract markets to members
Contract Name The name the contract is known by in HPMS
Parent Organization The name of the parent organization for the contract
Total Number of Complaints Number of non-excluded complaints for the contract
Complaint Average Enrollment The average enrollment used in the final calculation
Complaints < 800 Enrolled Yes / No, Yes = average enrollment < 800, No = average enrollment ≥ 800
Part C Total Appeals Cases Total number of Part C appeals cases processed by the IRE (Maximus)
Part C Appeals Upheld Number of Part C appeals which were upheld
Part C Appeals Overturned Number of Part C appeals which were overturned
Part C Appeals Partly Overturned Number of Part C appeals which were partially overturned
Part C Appeals Dismissed Number of Part C appeals which were dismissed
Part C Appeals Withdrawn Number of Part C appeals which were withdrawn
Part C Late Appeals Number of Part C appeals which Maximus considered to be late
Part C Percent of Timely Appeals Percent of Part C appeals which were processed in a timely manner
3. Measure Detail – Part C Appeals page
The Measure Detail – Part C Appeals page contains the case-level data of the non-excluded cases used in producing the Part C Appeals measures Plan Makes Timely Decisions about Appeals (C26) and Reviewing Appeals Decisions (C27). The data displayed on this page reflect the state of the appeals case at the time the data were pulled for use in the 2022 Star Ratings. This page is available during the first plan preview. Table S-3 below explains each of the columns displayed on this page.
Table S-3: Measure Detail – Part C Appeals page fields
HPMS Field Label Field Description
Contract Number The contract number associated with the data
Organization Marketing Name The name the contract markets to members
Contract Name The name the contract is known by in HPMS
Parent Organization The parent organization of the contract
Appeal Number The case ID assigned to the appeal request
Appeal Priority The priority of the appeal (Std Pre-Service, Exp Pre-Service, or Retro)
Status The status of the appeal (Closed, Decided, Pending, Promoted, Remanded, Reopened, Requested)
Date Appeal Filed The Date the Plan Reconsideration was requested, as reported by the Part C Plan
Corrected Appeal Date The Date Appeal Filed, as determined by the IRE/QIC
Date File Received (QIC) The Date the IRE/QIC received the Appeal from the Part C Plan
Level 1 Extension Indicates if the contract took an extension during their processing of the reconsideration, as reported by the contract
Adjusted Plan Interval The number of days between the Date Appeal Filed (or Corrected Appeal Date, if applicable) and the Date File Received (QIC) adjusted based on the Appeal Priority (Std Pre-Service, Exp Pre-Service, or Retro) and adjusted to account for 5 mailing days
Appeal Decision Decision associated with the appeal (Dismiss Appeal, Overturn MCO Denial, Partly Overturn MCO Denial, Unspecified, Uphold MCO Denial, Withdraw Appeal)
Late Indicator Indicates if the appeal case was considered late or not (0=Not Late, 1=Late)
4. Measure Detail – SNP CM page
The Measure Detail – SNP CM page contains the underlying data used in calculating the Part C SNP Care
Management measure (C05). The formulas used to calculate the SNP CM measure are detailed in Attachment E. This page is available during the first plan preview. Table S-4 below explains each of the columns displayed on this page.
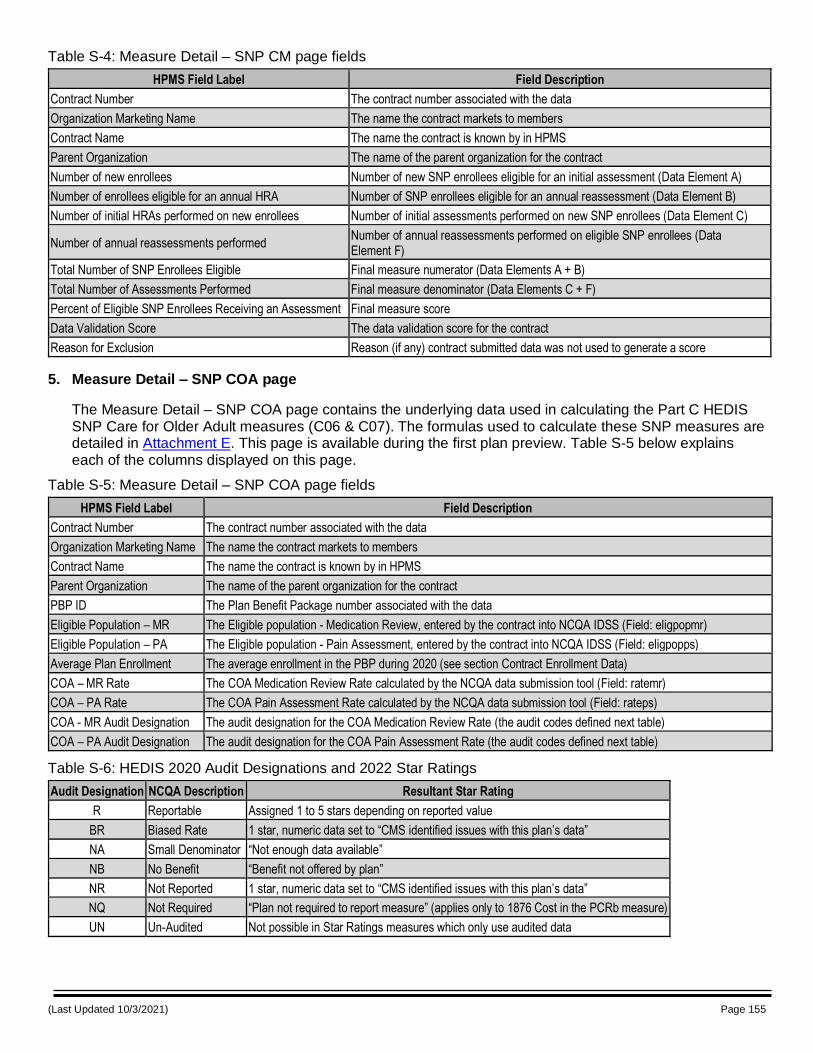
(Last Updated 10/3/2021) Page 155
Table S-4: Measure Detail – SNP CM page fields
HPMS Field Label Field Description
Contract Number The contract number associated with the data
Organization Marketing Name The name the contract markets to members
Contract Name The name the contract is known by in HPMS
Parent Organization The name of the parent organization for the contract
Number of new enrollees Number of new SNP enrollees eligible for an initial assessment (Data Element A)
Number of enrollees eligible for an annual HRA Number of SNP enrollees eligible for an annual reassessment (Data Element B)
Number of initial HRAs performed on new enrollees Number of initial assessments performed on new SNP enrollees (Data Element C)
Number of annual reassessments performed Number of annual reassessments performed on eligible SNP enrollees (Data Element F)
Total Number of SNP Enrollees Eligible Final measure numerator (Data Elements A + B)
Total Number of Assessments Performed Final measure denominator (Data Elements C + F)
Percent of Eligible SNP Enrollees Receiving an Assessment Final measure score
Data Validation Score The data validation score for the contract
Reason for Exclusion Reason (if any) contract submitted data was not used to generate a score
5. Measure Detail – SNP COA page
The Measure Detail – SNP COA page contains the underlying data used in calculating the Part C HEDIS SNP Care for Older Adult measures (C06 & C07). The formulas used to calculate these SNP measures are detailed in Attachment E. This page is available during the first plan preview. Table S-5 below explains each of the columns displayed on this page.
Table S-5: Measure Detail – SNP COA page fields
HPMS Field Label Field Description
Contract Number The contract number associated with the data
Organization Marketing Name The name the contract markets to members
Contract Name The name the contract is known by in HPMS
Parent Organization The name of the parent organization for the contract
PBP ID The Plan Benefit Package number associated with the data
Eligible Population – MR The Eligible population - Medication Review, entered by the contract into NCQA IDSS (Field: eligpopmr)
Eligible Population – PA The Eligible population - Pain Assessment, entered by the contract into NCQA IDSS (Field: eligpopps)
Average Plan Enrollment The average enrollment in the PBP during 2020 (see section Contract Enrollment Data)
COA – MR Rate The COA Medication Review Rate calculated by the NCQA data submission tool (Field: ratemr)
COA – PA Rate The COA Pain Assessment Rate calculated by the NCQA data submission tool (Field: rateps)
COA - MR Audit Designation The audit designation for the COA Medication Review Rate (the audit codes defined next table)
COA – PA Audit Designation The audit designation for the COA Pain Assessment Rate (the audit codes defined next table)
Table S-6: HEDIS 2020 Audit Designations and 2022 Star Ratings
Audit Designation NCQA Description Resultant Star Rating
R Reportable Assigned 1 to 5 stars depending on reported value
BR Biased Rate 1 star, numeric data set to “CMS identified issues with this plan’s data”
NA Small Denominator “Not enough data available”
NB No Benefit “Benefit not offered by plan”
NR Not Reported 1 star, numeric data set to “CMS identified issues with this plan’s data”
NQ Not Required “Plan not required to report measure” (applies only to 1876 Cost in the PCRb measure)
UN Un-Audited Not possible in Star Ratings measures which only use audited data
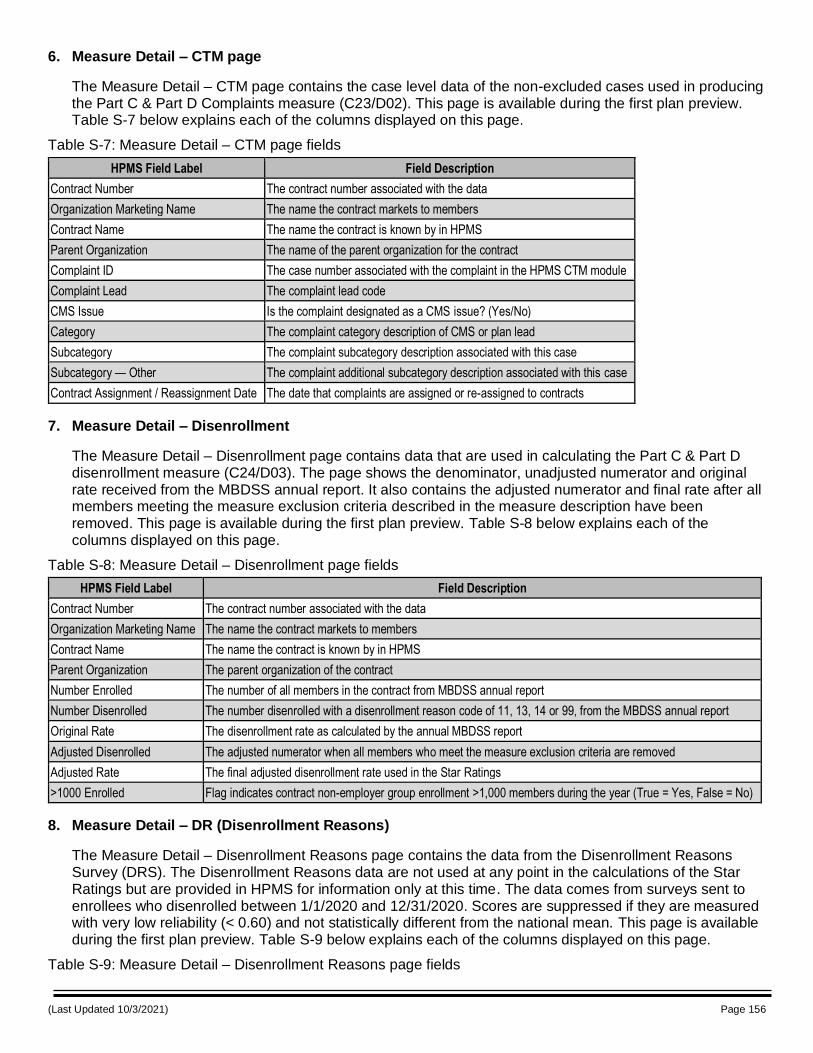
(Last Updated 10/3/2021) Page 156
6. Measure Detail – CTM page
The Measure Detail – CTM page contains the case level data of the non-excluded cases used in producing the Part C & Part D Complaints measure (C23/D02). This page is available during the first plan preview. Table S-7 below explains each of the columns displayed on this page.
Table S-7: Measure Detail – CTM page fields
HPMS Field Label Field Description
Contract Number The contract number associated with the data
Organization Marketing Name The name the contract markets to members
Contract Name The name the contract is known by in HPMS
Parent Organization The name of the parent organization for the contract
Complaint ID The case number associated with the complaint in the HPMS CTM module
Complaint Lead The complaint lead code
CMS Issue Is the complaint designated as a CMS issue? (Yes/No)
Category The complaint category description of CMS or plan lead
Subcategory The complaint subcategory description associated with this case
Subcategory — Other The complaint additional subcategory description associated with this case
Contract Assignment / Reassignment Date The date that complaints are assigned or re-assigned to contracts
7. Measure Detail – Disenrollment
The Measure Detail – Disenrollment page contains data that are used in calculating the Part C & Part D disenrollment measure (C24/D03). The page shows the denominator, unadjusted numerator and original rate received from the MBDSS annual report. It also contains the adjusted numerator and final rate after all members meeting the measure exclusion criteria described in the measure description have been removed. This page is available during the first plan preview. Table S-8 below explains each of the columns displayed on this page.
Table S-8: Measure Detail – Disenrollment page fields
HPMS Field Label Field Description
Contract Number The contract number associated with the data
Organization Marketing Name The name the contract markets to members
Contract Name The name the contract is known by in HPMS
Parent Organization The parent organization of the contract
Number Enrolled The number of all members in the contract from MBDSS annual report
Number Disenrolled The number disenrolled with a disenrollment reason code of 11, 13, 14 or 99, from the MBDSS annual report
Original Rate The disenrollment rate as calculated by the annual MBDSS report
Adjusted Disenrolled The adjusted numerator when all members who meet the measure exclusion criteria are removed
Adjusted Rate The final adjusted disenrollment rate used in the Star Ratings
>1000 Enrolled Flag indicates contract non-employer group enrollment >1,000 members during the year (True = Yes, False = No)
8. Measure Detail – DR (Disenrollment Reasons)
The Measure Detail – Disenrollment Reasons page contains the data from the Disenrollment Reasons Survey (DRS). The Disenrollment Reasons data are not used at any point in the calculations of the Star Ratings but are provided in HPMS for information only at this time. The data comes from surveys sent to enrollees who disenrolled between 1/1/2020 and 12/31/2020. Scores are suppressed if they are measured with very low reliability (< 0.60) and not statistically different from the national mean. This page is available during the first plan preview. Table S-9 below explains each of the columns displayed on this page.
Table S-9: Measure Detail – Disenrollment Reasons page fields
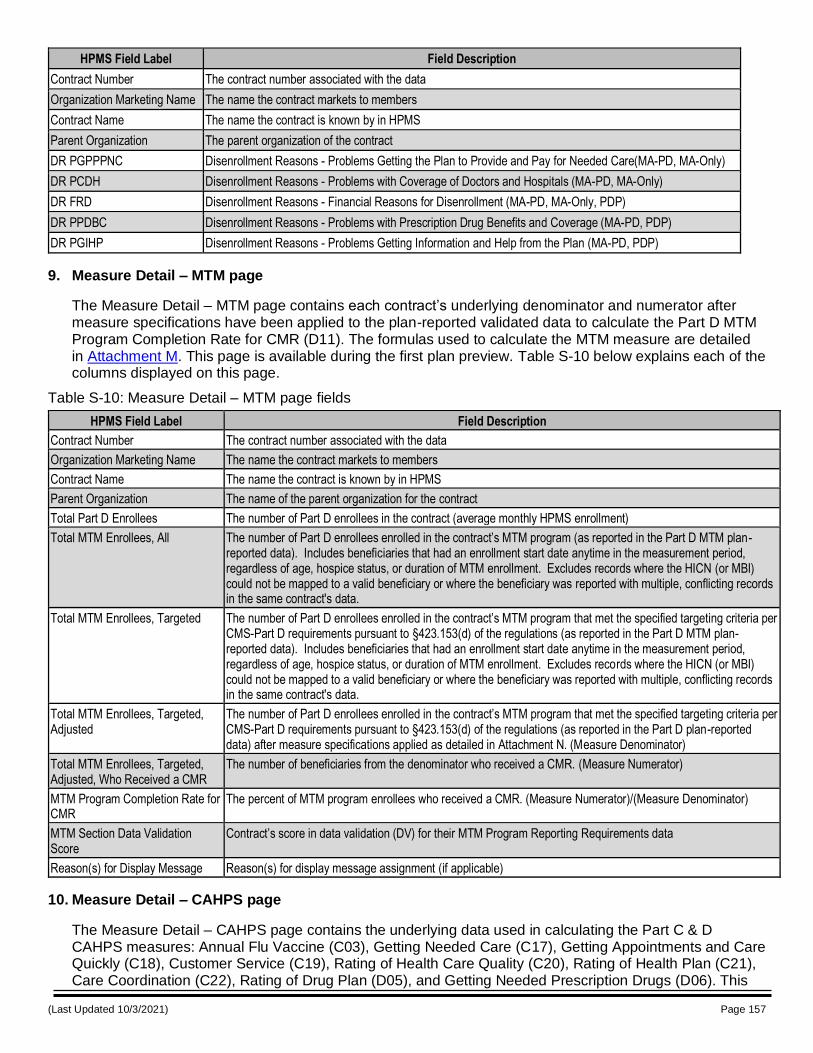
(Last Updated 10/3/2021) Page 157
HPMS Field Label Field Description
Contract Number The contract number associated with the data
Organization Marketing Name The name the contract markets to members
Contract Name The name the contract is known by in HPMS
Parent Organization The parent organization of the contract
DR PGPPPNC Disenrollment Reasons - Problems Getting the Plan to Provide and Pay for Needed Care(MA-PD, MA-Only)
DR PCDH Disenrollment Reasons - Problems with Coverage of Doctors and Hospitals (MA-PD, MA-Only)
DR FRD Disenrollment Reasons - Financial Reasons for Disenrollment (MA-PD, MA-Only, PDP)
DR PPDBC Disenrollment Reasons - Problems with Prescription Drug Benefits and Coverage (MA-PD, PDP)
DR PGIHP Disenrollment Reasons - Problems Getting Information and Help from the Plan (MA-PD, PDP)
9. Measure Detail – MTM page
The Measure Detail – MTM page contains each contract’s underlying denominator and numerator after measure specifications have been applied to the plan-reported validated data to calculate the Part D MTM Program Completion Rate for CMR (D11). The formulas used to calculate the MTM measure are detailed in Attachment M. This page is available during the first plan preview. Table S-10 below explains each of the columns displayed on this page.
Table S-10: Measure Detail – MTM page fields
HPMS Field Label Field Description
Contract Number The contract number associated with the data
Organization Marketing Name The name the contract markets to members
Contract Name The name the contract is known by in HPMS
Parent Organization The name of the parent organization for the contract
Total Part D Enrollees The number of Part D enrollees in the contract (average monthly HPMS enrollment)
Total MTM Enrollees, All The number of Part D enrollees enrolled in the contract’s MTM program (as reported in the Part D MTM plan-reported data). Includes beneficiaries that had an enrollment start date anytime in the measurement period, regardless of age, hospice status, or duration of MTM enrollment. Excludes records where the HICN (or MBI) could not be mapped to a valid beneficiary or where the beneficiary was reported with multiple, conflicting records in the same contract's data.
Total MTM Enrollees, Targeted The number of Part D enrollees enrolled in the contract’s MTM program that met the specified targeting criteria per CMS-Part D requirements pursuant to §423.153(d) of the regulations (as reported in the Part D MTM plan-reported data). Includes beneficiaries that had an enrollment start date anytime in the measurement period, regardless of age, hospice status, or duration of MTM enrollment. Excludes records where the HICN (or MBI) could not be mapped to a valid beneficiary or where the beneficiary was reported with multiple, conflicting records in the same contract's data.
Total MTM Enrollees, Targeted, Adjusted
The number of Part D enrollees enrolled in the contract’s MTM program that met the specified targeting criteria per CMS-Part D requirements pursuant to §423.153(d) of the regulations (as reported in the Part D plan-reported data) after measure specifications applied as detailed in Attachment N. (Measure Denominator)
Total MTM Enrollees, Targeted, Adjusted, Who Received a CMR
The number of beneficiaries from the denominator who received a CMR. (Measure Numerator)
MTM Program Completion Rate for CMR
The percent of MTM program enrollees who received a CMR. (Measure Numerator)/(Measure Denominator)
MTM Section Data Validation Score
Contract’s score in data validation (DV) for their MTM Program Reporting Requirements data
Reason(s) for Display Message Reason(s) for display message assignment (if applicable)
10. Measure Detail – CAHPS page
The Measure Detail – CAHPS page contains the underlying data used in calculating the Part C & D CAHPS measures: Annual Flu Vaccine (C03), Getting Needed Care (C17), Getting Appointments and Care Quickly (C18), Customer Service (C19), Rating of Health Care Quality (C20), Rating of Health Plan (C21), Care Coordination (C22), Rating of Drug Plan (D05), and Getting Needed Prescription Drugs (D06). This
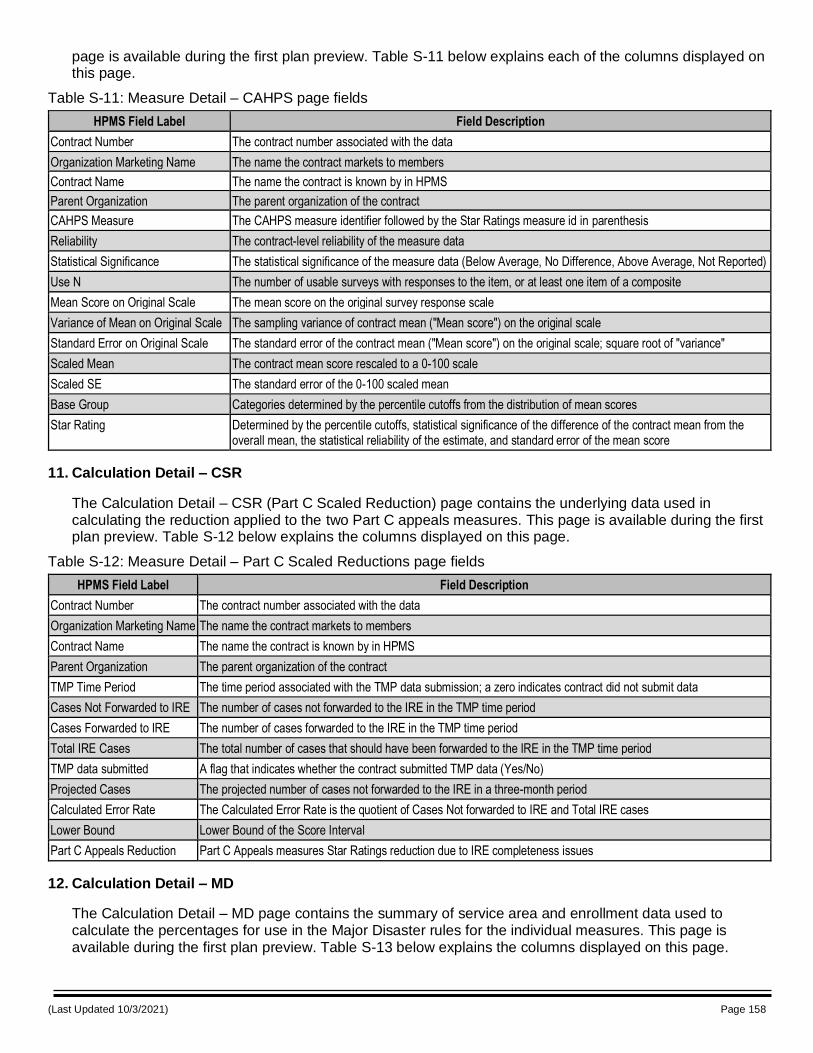
(Last Updated 10/3/2021) Page 158
page is available during the first plan preview. Table S-11 below explains each of the columns displayed on this page.
Table S-11: Measure Detail – CAHPS page fields
HPMS Field Label Field Description
Contract Number The contract number associated with the data
Organization Marketing Name The name the contract markets to members
Contract Name The name the contract is known by in HPMS
Parent Organization The parent organization of the contract
CAHPS Measure The CAHPS measure identifier followed by the Star Ratings measure id in parenthesis
Reliability The contract-level reliability of the measure data
Statistical Significance The statistical significance of the measure data (Below Average, No Difference, Above Average, Not Reported)
Use N The number of usable surveys with responses to the item, or at least one item of a composite
Mean Score on Original Scale The mean score on the original survey response scale
Variance of Mean on Original Scale The sampling variance of contract mean ("Mean score") on the original scale
Standard Error on Original Scale The standard error of the contract mean ("Mean score") on the original scale; square root of "variance"
Scaled Mean The contract mean score rescaled to a 0-100 scale
Scaled SE The standard error of the 0-100 scaled mean
Base Group Categories determined by the percentile cutoffs from the distribution of mean scores
Star Rating Determined by the percentile cutoffs, statistical significance of the difference of the contract mean from the overall mean, the statistical reliability of the estimate, and standard error of the mean score
11. Calculation Detail – CSR
The Calculation Detail – CSR (Part C Scaled Reduction) page contains the underlying data used in calculating the reduction applied to the two Part C appeals measures. This page is available during the first plan preview. Table S-12 below explains the columns displayed on this page.
Table S-12: Measure Detail – Part C Scaled Reductions page fields
HPMS Field Label Field Description
Contract Number The contract number associated with the data
Organization Marketing Name The name the contract markets to members
Contract Name The name the contract is known by in HPMS
Parent Organization The parent organization of the contract
TMP Time Period The time period associated with the TMP data submission; a zero indicates contract did not submit data
Cases Not Forwarded to IRE The number of cases not forwarded to the IRE in the TMP time period
Cases Forwarded to IRE The number of cases forwarded to the IRE in the TMP time period
Total IRE Cases The total number of cases that should have been forwarded to the IRE in the TMP time period
TMP data submitted A flag that indicates whether the contract submitted TMP data (Yes/No)
Projected Cases The projected number of cases not forwarded to the IRE in a three-month period
Calculated Error Rate The Calculated Error Rate is the quotient of Cases Not forwarded to IRE and Total IRE cases
Lower Bound Lower Bound of the Score Interval
Part C Appeals Reduction Part C Appeals measures Star Ratings reduction due to IRE completeness issues
12. Calculation Detail – MD
The Calculation Detail – MD page contains the summary of service area and enrollment data used to calculate the percentages for use in the Major Disaster rules for the individual measures. This page is available during the first plan preview. Table S-13 below explains the columns displayed on this page.
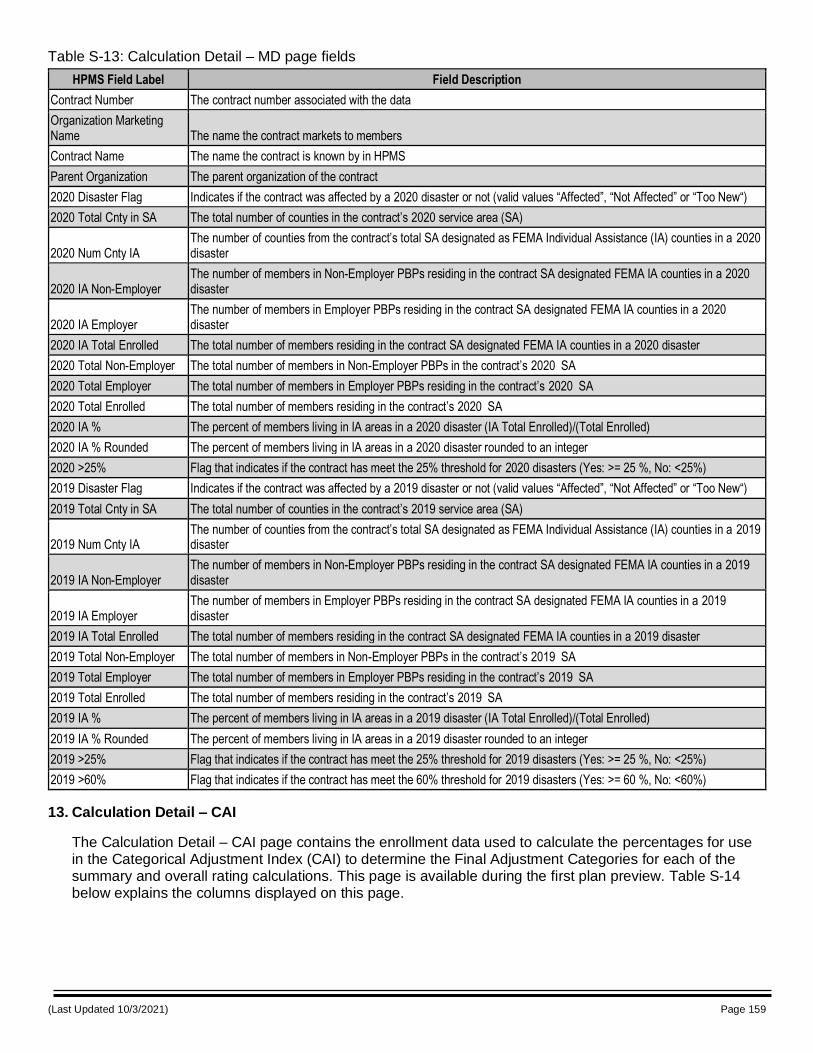
(Last Updated 10/3/2021) Page 159
Table S-13: Calculation Detail – MD page fields
HPMS Field Label Field Description
Contract Number The contract number associated with the data
Organization Marketing Name The name the contract markets to members
Contract Name The name the contract is known by in HPMS
Parent Organization The parent organization of the contract
2020 Disaster Flag Indicates if the contract was affected by a 2020 disaster or not (valid values “Affected”, “Not Affected” or “Too New“)
2020 Total Cnty in SA The total number of counties in the contract’s 2020 service area (SA)
2020 Num Cnty IA The number of counties from the contract’s total SA designated as FEMA Individual Assistance (IA) counties in a 2020 disaster
2020 IA Non-Employer The number of members in Non-Employer PBPs residing in the contract SA designated FEMA IA counties in a 2020 disaster
2020 IA Employer The number of members in Employer PBPs residing in the contract SA designated FEMA IA counties in a 2020 disaster
2020 IA Total Enrolled The total number of members residing in the contract SA designated FEMA IA counties in a 2020 disaster
2020 Total Non-Employer The total number of members in Non-Employer PBPs in the contract’s 2020 SA
2020 Total Employer The total number of members in Employer PBPs residing in the contract’s 2020 SA
2020 Total Enrolled The total number of members residing in the contract’s 2020 SA
2020 IA % The percent of members living in IA areas in a 2020 disaster (IA Total Enrolled)/(Total Enrolled)
2020 IA % Rounded The percent of members living in IA areas in a 2020 disaster rounded to an integer
2020 >25% Flag that indicates if the contract has meet the 25% threshold for 2020 disasters (Yes: >= 25 %, No: <25%)
2019 Disaster Flag Indicates if the contract was affected by a 2019 disaster or not (valid values “Affected”, “Not Affected” or “Too New“)
2019 Total Cnty in SA The total number of counties in the contract’s 2019 service area (SA)
2019 Num Cnty IA The number of counties from the contract’s total SA designated as FEMA Individual Assistance (IA) counties in a 2019 disaster
2019 IA Non-Employer The number of members in Non-Employer PBPs residing in the contract SA designated FEMA IA counties in a 2019 disaster
2019 IA Employer The number of members in Employer PBPs residing in the contract SA designated FEMA IA counties in a 2019 disaster
2019 IA Total Enrolled The total number of members residing in the contract SA designated FEMA IA counties in a 2019 disaster
2019 Total Non-Employer The total number of members in Non-Employer PBPs in the contract’s 2019 SA
2019 Total Employer The total number of members in Employer PBPs residing in the contract’s 2019 SA
2019 Total Enrolled The total number of members residing in the contract’s 2019 SA
2019 IA % The percent of members living in IA areas in a 2019 disaster (IA Total Enrolled)/(Total Enrolled)
2019 IA % Rounded The percent of members living in IA areas in a 2019 disaster rounded to an integer
2019 >25% Flag that indicates if the contract has meet the 25% threshold for 2019 disasters (Yes: >= 25 %, No: <25%)
2019 >60% Flag that indicates if the contract has meet the 60% threshold for 2019 disasters (Yes: >= 60 %, No: <60%)
13. Calculation Detail – CAI
The Calculation Detail – CAI page contains the enrollment data used to calculate the percentages for use in the Categorical Adjustment Index (CAI) to determine the Final Adjustment Categories for each of the summary and overall rating calculations. This page is available during the first plan preview. Table S-14 below explains the columns displayed on this page.
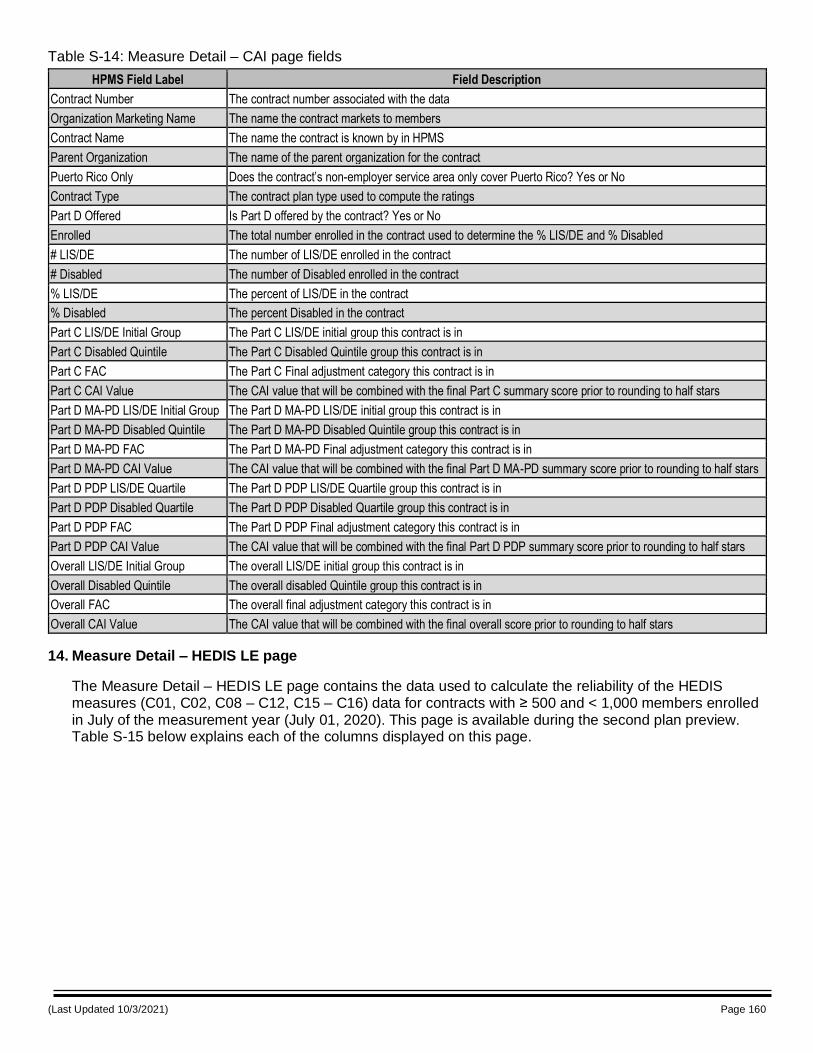
(Last Updated 10/3/2021) Page 160
Table S-14: Measure Detail – CAI page fields
HPMS Field Label Field Description
Contract Number The contract number associated with the data
Organization Marketing Name The name the contract markets to members
Contract Name The name the contract is known by in HPMS
Parent Organization The name of the parent organization for the contract
Puerto Rico Only Does the contract’s non-employer service area only cover Puerto Rico? Yes or No
Contract Type The contract plan type used to compute the ratings
Part D Offered Is Part D offered by the contract? Yes or No
Enrolled The total number enrolled in the contract used to determine the % LIS/DE and % Disabled
# LIS/DE The number of LIS/DE enrolled in the contract
# Disabled The number of Disabled enrolled in the contract
% LIS/DE The percent of LIS/DE in the contract
% Disabled The percent Disabled in the contract
Part C LIS/DE Initial Group The Part C LIS/DE initial group this contract is in
Part C Disabled Quintile The Part C Disabled Quintile group this contract is in
Part C FAC The Part C Final adjustment category this contract is in
Part C CAI Value The CAI value that will be combined with the final Part C summary score prior to rounding to half stars
Part D MA-PD LIS/DE Initial Group The Part D MA-PD LIS/DE initial group this contract is in
Part D MA-PD Disabled Quintile The Part D MA-PD Disabled Quintile group this contract is in
Part D MA-PD FAC The Part D MA-PD Final adjustment category this contract is in
Part D MA-PD CAI Value The CAI value that will be combined with the final Part D MA-PD summary score prior to rounding to half stars
Part D PDP LIS/DE Quartile The Part D PDP LIS/DE Quartile group this contract is in
Part D PDP Disabled Quartile The Part D PDP Disabled Quartile group this contract is in
Part D PDP FAC The Part D PDP Final adjustment category this contract is in
Part D PDP CAI Value The CAI value that will be combined with the final Part D PDP summary score prior to rounding to half stars
Overall LIS/DE Initial Group The overall LIS/DE initial group this contract is in
Overall Disabled Quintile The overall disabled Quintile group this contract is in
Overall FAC The overall final adjustment category this contract is in
Overall CAI Value The CAI value that will be combined with the final overall score prior to rounding to half stars
14. Measure Detail – HEDIS LE page
The Measure Detail – HEDIS LE page contains the data used to calculate the reliability of the HEDIS measures (C01, C02, C08 – C12, C15 – C16) data for contracts with ≥ 500 and < 1,000 members enrolled in July of the measurement year (July 01, 2020). This page is available during the second plan preview. Table S-15 below explains each of the columns displayed on this page.
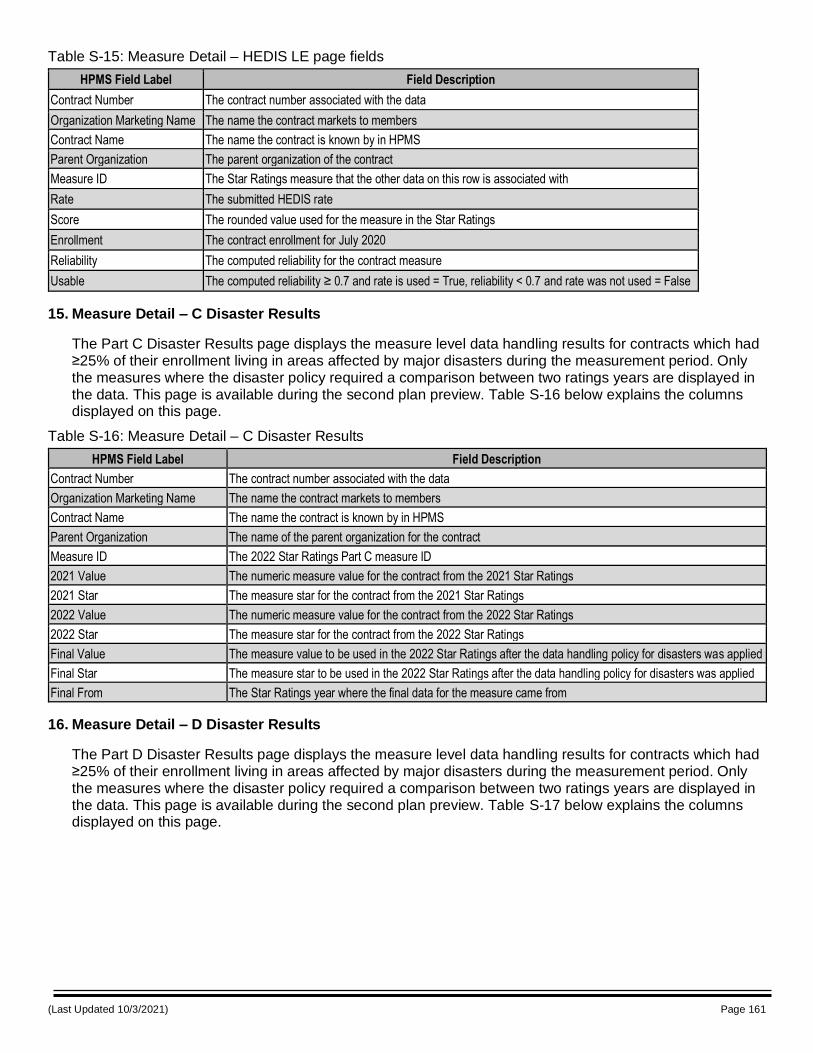
(Last Updated 10/3/2021) Page 161
Table S-15: Measure Detail – HEDIS LE page fields
HPMS Field Label Field Description
Contract Number The contract number associated with the data
Organization Marketing Name The name the contract markets to members
Contract Name The name the contract is known by in HPMS
Parent Organization The parent organization of the contract
Measure ID The Star Ratings measure that the other data on this row is associated with
Rate The submitted HEDIS rate
Score The rounded value used for the measure in the Star Ratings
Enrollment The contract enrollment for July 2020
Reliability The computed reliability for the contract measure
Usable The computed reliability ≥ 0.7 and rate is used = True, reliability < 0.7 and rate was not used = False
15. Measure Detail – C Disaster Results
The Part C Disaster Results page displays the measure level data handling results for contracts which had ≥25% of their enrollment living in areas affected by major disasters during the measurement period. Only the measures where the disaster policy required a comparison between two ratings years are displayed in the data. This page is available during the second plan preview. Table S-16 below explains the columns displayed on this page.
Table S-16: Measure Detail – C Disaster Results
HPMS Field Label Field Description
Contract Number The contract number associated with the data
Organization Marketing Name The name the contract markets to members
Contract Name The name the contract is known by in HPMS
Parent Organization The name of the parent organization for the contract
Measure ID The 2022 Star Ratings Part C measure ID
2021 Value The numeric measure value for the contract from the 2021 Star Ratings
2021 Star The measure star for the contract from the 2021 Star Ratings
2022 Value The numeric measure value for the contract from the 2022 Star Ratings
2022 Star The measure star for the contract from the 2022 Star Ratings
Final Value The measure value to be used in the 2022 Star Ratings after the data handling policy for disasters was applied
Final Star The measure star to be used in the 2022 Star Ratings after the data handling policy for disasters was applied
Final From The Star Ratings year where the final data for the measure came from
16. Measure Detail – D Disaster Results
The Part D Disaster Results page displays the measure level data handling results for contracts which had ≥25% of their enrollment living in areas affected by major disasters during the measurement period. Only the measures where the disaster policy required a comparison between two ratings years are displayed in the data. This page is available during the second plan preview. Table S-17 below explains the columns displayed on this page.
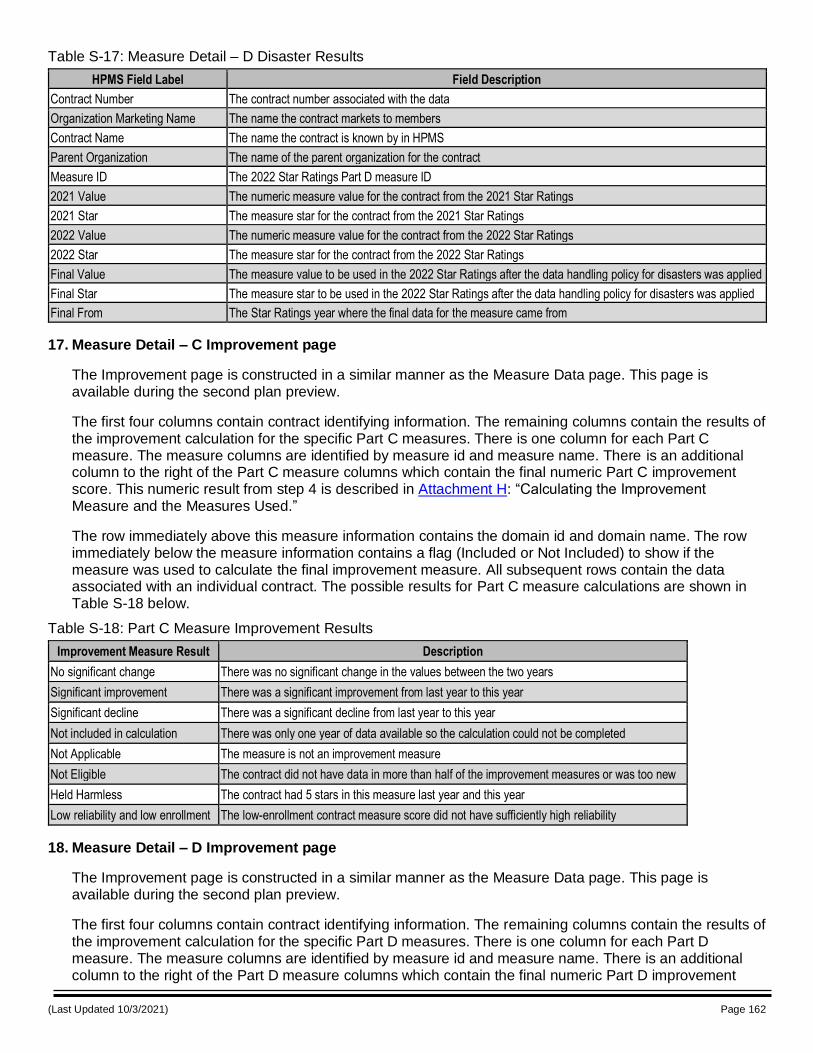
(Last Updated 10/3/2021) Page 162
Table S-17: Measure Detail – D Disaster Results
HPMS Field Label Field Description
Contract Number The contract number associated with the data
Organization Marketing Name The name the contract markets to members
Contract Name The name the contract is known by in HPMS
Parent Organization The name of the parent organization for the contract
Measure ID The 2022 Star Ratings Part D measure ID
2021 Value The numeric measure value for the contract from the 2021 Star Ratings
2021 Star The measure star for the contract from the 2021 Star Ratings
2022 Value The numeric measure value for the contract from the 2022 Star Ratings
2022 Star The measure star for the contract from the 2022 Star Ratings
Final Value The measure value to be used in the 2022 Star Ratings after the data handling policy for disasters was applied
Final Star The measure star to be used in the 2022 Star Ratings after the data handling policy for disasters was applied
Final From The Star Ratings year where the final data for the measure came from
17. Measure Detail – C Improvement page
The Improvement page is constructed in a similar manner as the Measure Data page. This page is available during the second plan preview.
The first four columns contain contract identifying information. The remaining columns contain the results of the improvement calculation for the specific Part C measures. There is one column for each Part C measure. The measure columns are identified by measure id and measure name. There is an additional column to the right of the Part C measure columns which contain the final numeric Part C improvement score. This numeric result from step 4 is described in Attachment H: “Calculating the Improvement Measure and the Measures Used.”
The row immediately above this measure information contains the domain id and domain name. The row immediately below the measure information contains a flag (Included or Not Included) to show if the measure was used to calculate the final improvement measure. All subsequent rows contain the data associated with an individual contract. The possible results for Part C measure calculations are shown in Table S-18 below.
Table S-18: Part C Measure Improvement Results
Improvement Measure Result Description
No significant change There was no significant change in the values between the two years
Significant improvement There was a significant improvement from last year to this year
Significant decline There was a significant decline from last year to this year
Not included in calculation There was only one year of data available so the calculation could not be completed
Not Applicable The measure is not an improvement measure
Not Eligible The contract did not have data in more than half of the improvement measures or was too new
Held Harmless The contract had 5 stars in this measure last year and this year
Low reliability and low enrollment The low-enrollment contract measure score did not have sufficiently high reliability
18. Measure Detail – D Improvement page
The Improvement page is constructed in a similar manner as the Measure Data page. This page is available during the second plan preview.
The first four columns contain contract identifying information. The remaining columns contain the results of the improvement calculation for the specific Part D measures. There is one column for each Part D measure. The measure columns are identified by measure id and measure name. There is an additional column to the right of the Part D measure columns which contain the final numeric Part D improvement
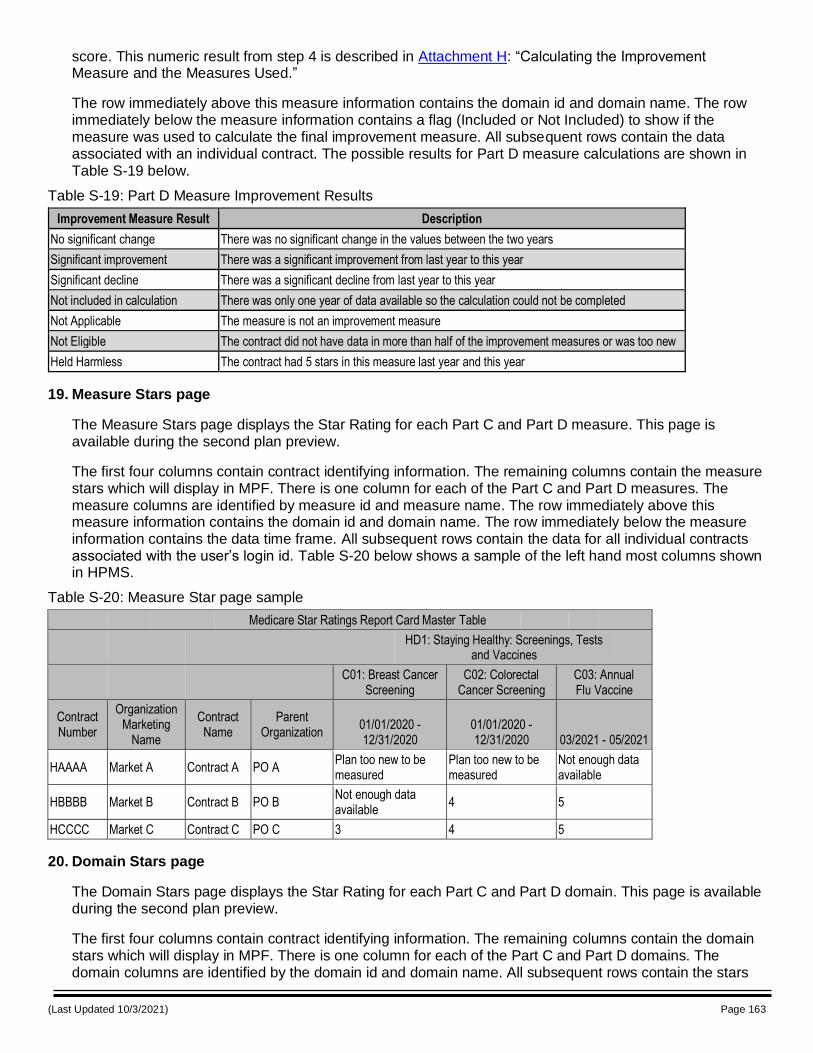
(Last Updated 10/3/2021) Page 163
score. This numeric result from step 4 is described in Attachment H: “Calculating the Improvement Measure and the Measures Used.”
The row immediately above this measure information contains the domain id and domain name. The row immediately below the measure information contains a flag (Included or Not Included) to show if the measure was used to calculate the final improvement measure. All subsequent rows contain the data associated with an individual contract. The possible results for Part D measure calculations are shown in Table S-19 below.
Table S-19: Part D Measure Improvement Results
Improvement Measure Result Description
No significant change There was no significant change in the values between the two years
Significant improvement There was a significant improvement from last year to this year
Significant decline There was a significant decline from last year to this year
Not included in calculation There was only one year of data available so the calculation could not be completed
Not Applicable The measure is not an improvement measure
Not Eligible The contract did not have data in more than half of the improvement measures or was too new
Held Harmless The contract had 5 stars in this measure last year and this year
19. Measure Stars page
The Measure Stars page displays the Star Rating for each Part C and Part D measure. This page is available during the second plan preview.
The first four columns contain contract identifying information. The remaining columns contain the measure stars which will display in MPF. There is one column for each of the Part C and Part D measures. The measure columns are identified by measure id and measure name. The row immediately above this measure information contains the domain id and domain name. The row immediately below the measure information contains the data time frame. All subsequent rows contain the data for all individual contracts associated with the user’s login id. Table S-20 below shows a sample of the left hand most columns shown in HPMS.
Table S-20: Measure Star page sample
Medicare Star Ratings Report Card Master Table
HD1: Staying Healthy: Screenings, Tests
and Vaccines
C01: Breast Cancer Screening
C02: Colorectal Cancer Screening
C03: Annual Flu Vaccine
Contract Number
Organization Marketing
Name
Contract Name
Parent Organization
01/01/2020 - 12/31/2020
01/01/2020 - 12/31/2020 03/2021 - 05/2021
HAAAA Market A Contract A PO A Plan too new to be measured
Plan too new to be measured
Not enough data available
HBBBB Market B Contract B PO B Not enough data available
4 5
HCCCC Market C Contract C PO C 3 4 5
20. Domain Stars page
The Domain Stars page displays the Star Rating for each Part C and Part D domain. This page is available during the second plan preview.
The first four columns contain contract identifying information. The remaining columns contain the domain stars which will display in MPF. There is one column for each of the Part C and Part D domains. The domain columns are identified by the domain id and domain name. All subsequent rows contain the stars
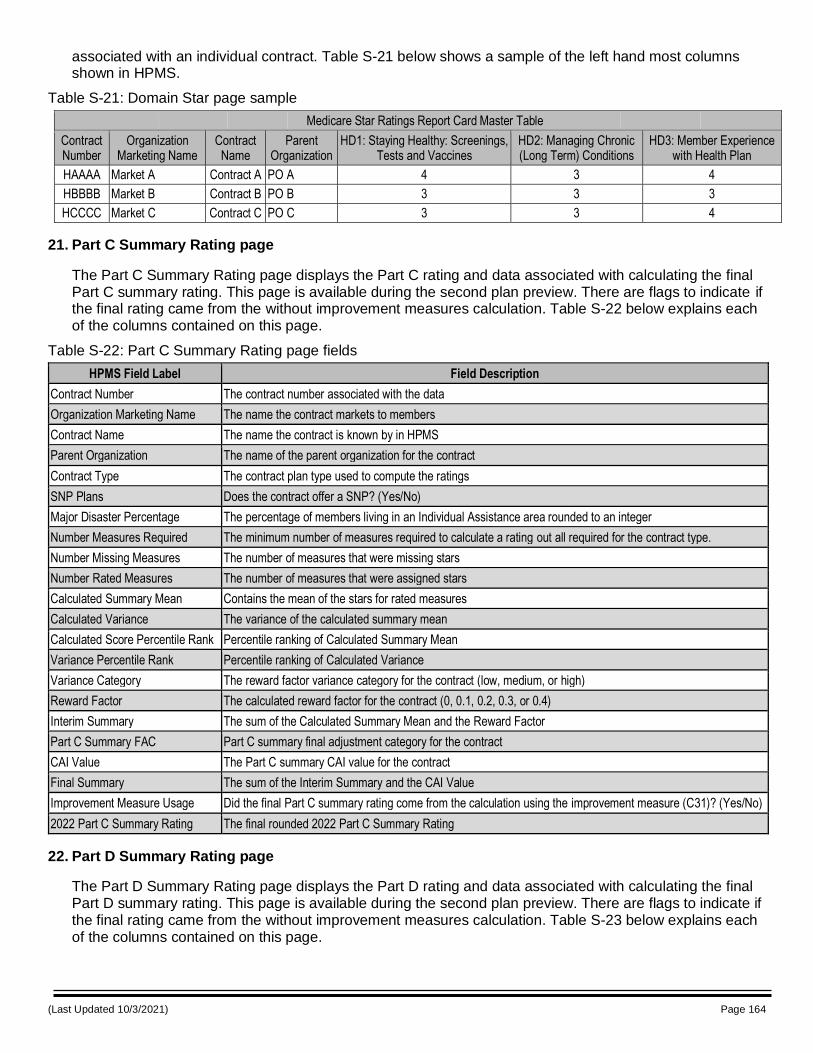
(Last Updated 10/3/2021) Page 164
associated with an individual contract. Table S-21 below shows a sample of the left hand most columns shown in HPMS.
Table S-21: Domain Star page sample
Medicare Star Ratings Report Card Master Table
Contract Number
Organization Marketing Name
Contract Name
Parent Organization
HD1: Staying Healthy: Screenings, Tests and Vaccines
HD2: Managing Chronic (Long Term) Conditions
HD3: Member Experience with Health Plan
HAAAA Market A Contract A PO A 4 3 4
HBBBB Market B Contract B PO B 3 3 3
HCCCC Market C Contract C PO C 3 3 4
21. Part C Summary Rating page
The Part C Summary Rating page displays the Part C rating and data associated with calculating the final Part C summary rating. This page is available during the second plan preview. There are flags to indicate if the final rating came from the without improvement measures calculation. Table S-22 below explains each of the columns contained on this page.
Table S-22: Part C Summary Rating page fields
HPMS Field Label Field Description
Contract Number The contract number associated with the data
Organization Marketing Name The name the contract markets to members
Contract Name The name the contract is known by in HPMS
Parent Organization The name of the parent organization for the contract
Contract Type The contract plan type used to compute the ratings
SNP Plans Does the contract offer a SNP? (Yes/No)
Major Disaster Percentage The percentage of members living in an Individual Assistance area rounded to an integer
Number Measures Required The minimum number of measures required to calculate a rating out all required for the contract type.
Number Missing Measures The number of measures that were missing stars
Number Rated Measures The number of measures that were assigned stars
Calculated Summary Mean Contains the mean of the stars for rated measures
Calculated Variance The variance of the calculated summary mean
Calculated Score Percentile Rank Percentile ranking of Calculated Summary Mean
Variance Percentile Rank Percentile ranking of Calculated Variance
Variance Category The reward factor variance category for the contract (low, medium, or high)
Reward Factor The calculated reward factor for the contract (0, 0.1, 0.2, 0.3, or 0.4)
Interim Summary The sum of the Calculated Summary Mean and the Reward Factor
Part C Summary FAC Part C summary final adjustment category for the contract
CAI Value The Part C summary CAI value for the contract
Final Summary The sum of the Interim Summary and the CAI Value
Improvement Measure Usage Did the final Part C summary rating come from the calculation using the improvement measure (C31)? (Yes/No)
2022 Part C Summary Rating The final rounded 2022 Part C Summary Rating
22. Part D Summary Rating page
The Part D Summary Rating page displays the Part D rating and data associated with calculating the final Part D summary rating. This page is available during the second plan preview. There are flags to indicate if the final rating came from the without improvement measures calculation. Table S-23 below explains each of the columns contained on this page.
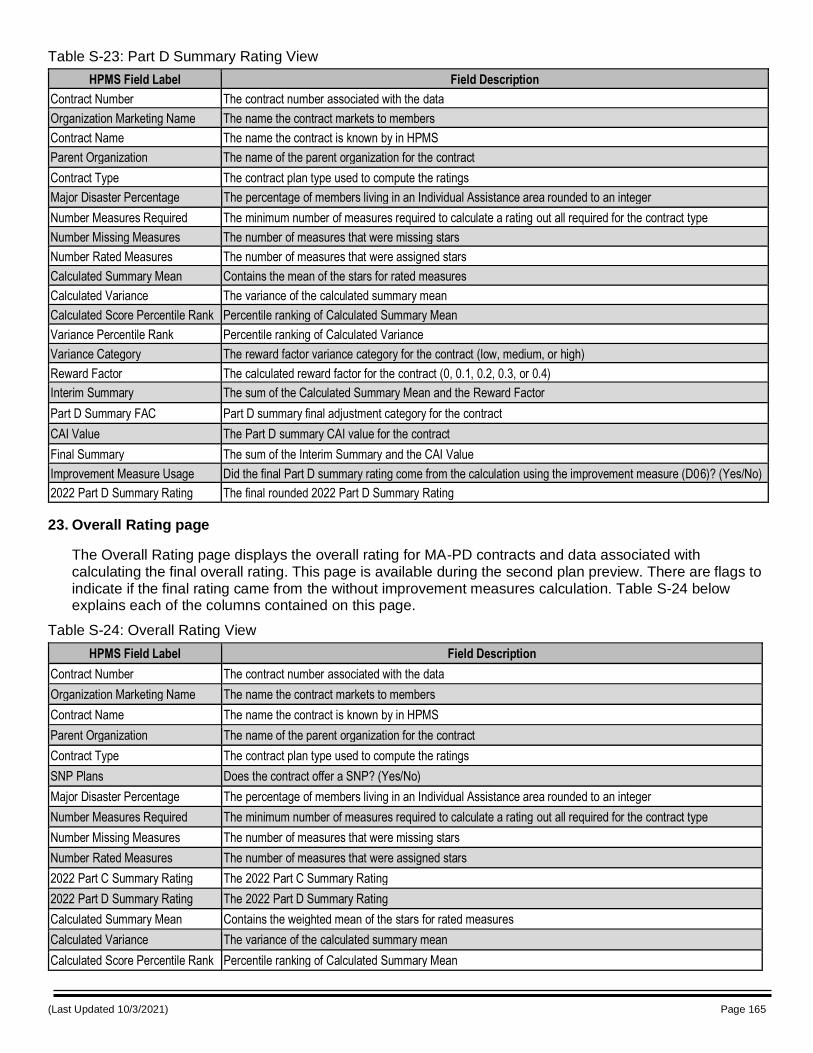
(Last Updated 10/3/2021) Page 165
Table S-23: Part D Summary Rating View
HPMS Field Label Field Description
Contract Number The contract number associated with the data
Organization Marketing Name The name the contract markets to members
Contract Name The name the contract is known by in HPMS
Parent Organization The name of the parent organization for the contract
Contract Type The contract plan type used to compute the ratings
Major Disaster Percentage The percentage of members living in an Individual Assistance area rounded to an integer
Number Measures Required The minimum number of measures required to calculate a rating out all required for the contract type
Number Missing Measures The number of measures that were missing stars
Number Rated Measures The number of measures that were assigned stars
Calculated Summary Mean Contains the mean of the stars for rated measures
Calculated Variance The variance of the calculated summary mean
Calculated Score Percentile Rank Percentile ranking of Calculated Summary Mean
Variance Percentile Rank Percentile ranking of Calculated Variance
Variance Category The reward factor variance category for the contract (low, medium, or high)
Reward Factor The calculated reward factor for the contract (0, 0.1, 0.2, 0.3, or 0.4)
Interim Summary The sum of the Calculated Summary Mean and the Reward Factor
Part D Summary FAC Part D summary final adjustment category for the contract
CAI Value The Part D summary CAI value for the contract
Final Summary The sum of the Interim Summary and the CAI Value
Improvement Measure Usage Did the final Part D summary rating come from the calculation using the improvement measure (D06)? (Yes/No)
2022 Part D Summary Rating The final rounded 2022 Part D Summary Rating
23. Overall Rating page
The Overall Rating page displays the overall rating for MA-PD contracts and data associated with calculating the final overall rating. This page is available during the second plan preview. There are flags to indicate if the final rating came from the without improvement measures calculation. Table S-24 below explains each of the columns contained on this page.
Table S-24: Overall Rating View
HPMS Field Label Field Description
Contract Number The contract number associated with the data
Organization Marketing Name The name the contract markets to members
Contract Name The name the contract is known by in HPMS
Parent Organization The name of the parent organization for the contract
Contract Type The contract plan type used to compute the ratings
SNP Plans Does the contract offer a SNP? (Yes/No)
Major Disaster Percentage The percentage of members living in an Individual Assistance area rounded to an integer
Number Measures Required The minimum number of measures required to calculate a rating out all required for the contract type
Number Missing Measures The number of measures that were missing stars
Number Rated Measures The number of measures that were assigned stars
2022 Part C Summary Rating The 2022 Part C Summary Rating
2022 Part D Summary Rating The 2022 Part D Summary Rating
Calculated Summary Mean Contains the weighted mean of the stars for rated measures
Calculated Variance The variance of the calculated summary mean
Calculated Score Percentile Rank Percentile ranking of Calculated Summary Mean
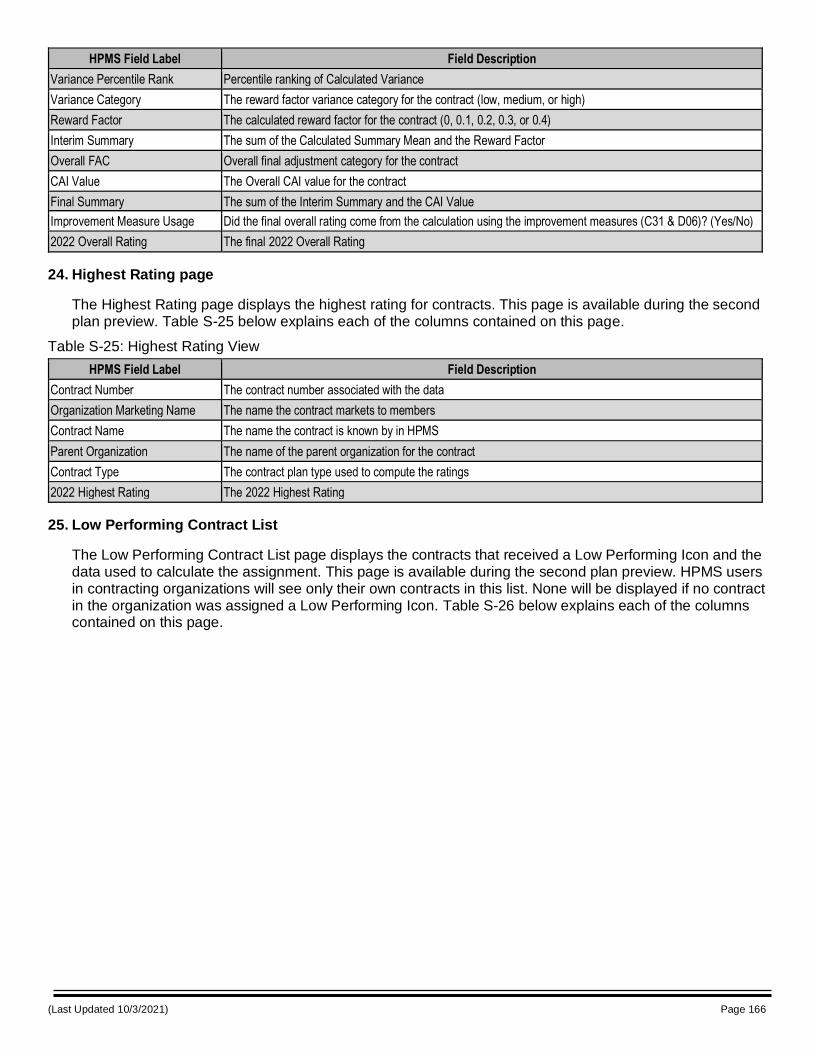
(Last Updated 10/3/2021) Page 166
HPMS Field Label Field Description
Variance Percentile Rank Percentile ranking of Calculated Variance
Variance Category The reward factor variance category for the contract (low, medium, or high)
Reward Factor The calculated reward factor for the contract (0, 0.1, 0.2, 0.3, or 0.4)
Interim Summary The sum of the Calculated Summary Mean and the Reward Factor
Overall FAC Overall final adjustment category for the contract
CAI Value The Overall CAI value for the contract
Final Summary The sum of the Interim Summary and the CAI Value
Improvement Measure Usage Did the final overall rating come from the calculation using the improvement measures (C31 & D06)? (Yes/No)
2022 Overall Rating The final 2022 Overall Rating
24. Highest Rating page
The Highest Rating page displays the highest rating for contracts. This page is available during the second plan preview. Table S-25 below explains each of the columns contained on this page.
Table S-25: Highest Rating View
HPMS Field Label Field Description
Contract Number The contract number associated with the data
Organization Marketing Name The name the contract markets to members
Contract Name The name the contract is known by in HPMS
Parent Organization The name of the parent organization for the contract
Contract Type The contract plan type used to compute the ratings
2022 Highest Rating The 2022 Highest Rating
25. Low Performing Contract List
The Low Performing Contract List page displays the contracts that received a Low Performing Icon and the data used to calculate the assignment. This page is available during the second plan preview. HPMS users in contracting organizations will see only their own contracts in this list. None will be displayed if no contract in the organization was assigned a Low Performing Icon. Table S-26 below explains each of the columns contained on this page.
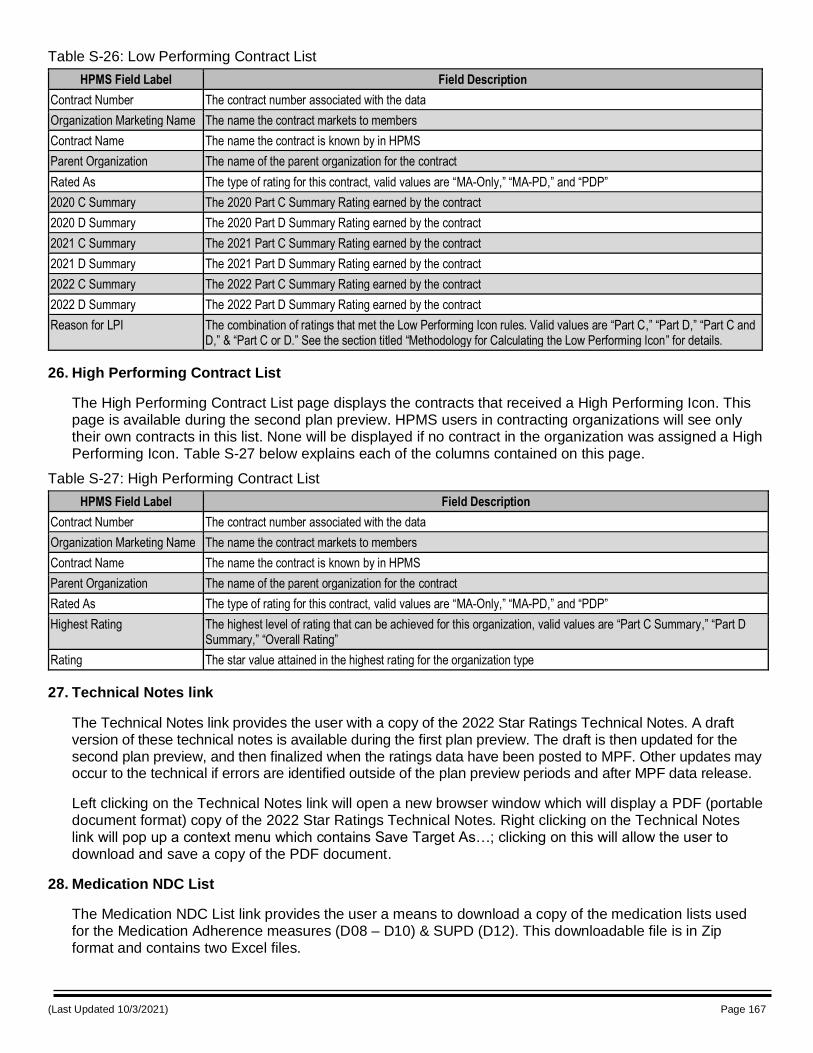
(Last Updated 10/3/2021) Page 167
Table S-26: Low Performing Contract List
HPMS Field Label Field Description
Contract Number The contract number associated with the data
Organization Marketing Name The name the contract markets to members
Contract Name The name the contract is known by in HPMS
Parent Organization The name of the parent organization for the contract
Rated As The type of rating for this contract, valid values are “MA-Only,” “MA-PD,” and “PDP”
2020 C Summary The 2020 Part C Summary Rating earned by the contract
2020 D Summary The 2020 Part D Summary Rating earned by the contract
2021 C Summary The 2021 Part C Summary Rating earned by the contract
2021 D Summary The 2021 Part D Summary Rating earned by the contract
2022 C Summary The 2022 Part C Summary Rating earned by the contract
2022 D Summary The 2022 Part D Summary Rating earned by the contract
Reason for LPI The combination of ratings that met the Low Performing Icon rules. Valid values are “Part C,” “Part D,” “Part C and D,” & “Part C or D.” See the section titled “Methodology for Calculating the Low Performing Icon” for details.
26. High Performing Contract List
The High Performing Contract List page displays the contracts that received a High Performing Icon. This page is available during the second plan preview. HPMS users in contracting organizations will see only their own contracts in this list. None will be displayed if no contract in the organization was assigned a High Performing Icon. Table S-27 below explains each of the columns contained on this page.
Table S-27: High Performing Contract List
HPMS Field Label Field Description
Contract Number The contract number associated with the data
Organization Marketing Name The name the contract markets to members
Contract Name The name the contract is known by in HPMS
Parent Organization The name of the parent organization for the contract
Rated As The type of rating for this contract, valid values are “MA-Only,” “MA-PD,” and “PDP”
Highest Rating The highest level of rating that can be achieved for this organization, valid values are “Part C Summary,” “Part D Summary,” “Overall Rating”
Rating The star value attained in the highest rating for the organization type
27. Technical Notes link
The Technical Notes link provides the user with a copy of the 2022 Star Ratings Technical Notes. A draft version of these technical notes is available during the first plan preview. The draft is then updated for the second plan preview, and then finalized when the ratings data have been posted to MPF. Other updates may occur to the technical if errors are identified outside of the plan preview periods and after MPF data release.
Left clicking on the Technical Notes link will open a new browser window which will display a PDF (portable document format) copy of the 2022 Star Ratings Technical Notes. Right clicking on the Technical Notes link will pop up a context menu which contains Save Target As…; clicking on this will allow the user to download and save a copy of the PDF document.
28. Medication NDC List
The Medication NDC List link provides the user a means to download a copy of the medication lists used for the Medication Adherence measures (D08 – D10) & SUPD (D12). This downloadable file is in Zip format and contains two Excel files.

(Last Updated 10/3/2021) Page 168
29. Part C and Part D Example Measure Data
The Part C and Part D Example Measure Data link provides the user with a means to download a copy of the data for the Breast Cancer Screening Part C measure and the MTM Program Completion Rate for CMR Part D measure for the full set of contracts used to calculate the cut points. The data are de-identified such that individual contract’s data cannot be determined. The data include the measure value, a flag for contracts that had data issues, and two flags identifying contracts with > 25 percent of enrollees living in an area affected by a disaster. There is also a flag in the Part D measure file identifying contracts as MAPD or PDP. This downloadable is in Zip format and contains two Excel files.