BFT Analog Audio Classification Using Device Impedance Characteristics
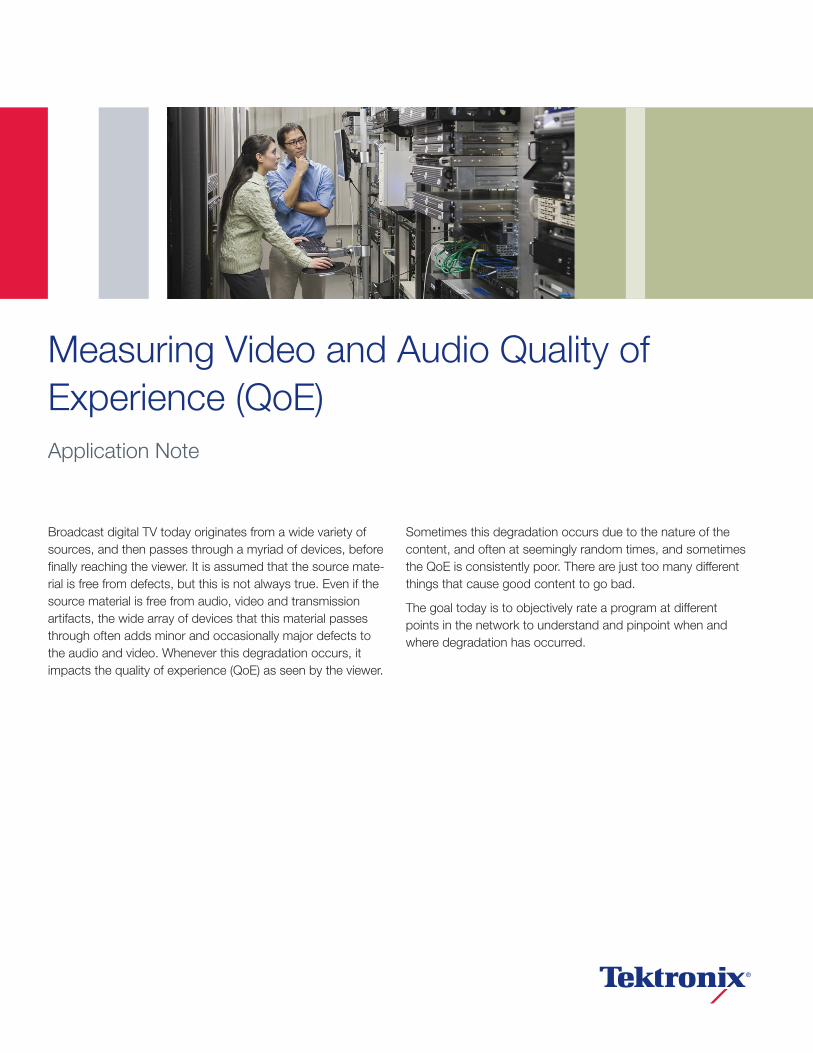
Broadcast digital TV today originates from a wide variety of sources, and then passes through a myriad of devices, before finally reaching the viewer. It is assumed that the source mate-rial is free from defects, but this is not always true. Even if the source material is free from audio, video and transmission artifacts, the wide array of devices that this material passes through often adds minor and occasionally major defects to the audio and video. Whenever this degradation occurs, it impacts the quality of experience (QoE) as seen by the viewer.
Sometimes this degradation occurs due to the nature of the content, and often at seemingly random times, and sometimes the QoE is consistently poor. There are just too many different things that cause good content to go bad.
The goal today is to objectively rate a program at different points in the network to understand and pinpoint when and where degradation has occurred.
Measuring Video and Audio Quality of Experience (QoE)Application Note

Application Note
www.tektronix.com/vqs10002
Ad Splicer IP or ASI
IP or ASI
EdgeDecoder
IP or ASI
IP or ASI
Ad Server
ASI, DHEIor IP
BasebandVideo/Audio
BasebandVideo/Audio
Data(IP or serial)
IP or ASIMPTS(s)
IP or ASIMPTS(s)
IP or ASITransport
IP or ASIMPTS(s)
ASI, IP orSMPTE 310M
IP or ASI
VODServer
VODServer
AnalogPEG Ch.
DOCSISCable
Modem
Set-topBox
Encoder
CMTS
Session-based QAM
Data/MediaCarousels
Switched DigitalServer/RM
(VCT carousel)
Table-based QAM
IP
IP
IP
IP
IP
IP
IP
EAS Encoder(SCTE-18) IP
IP (SNMP Manager for Server/RM)
SourcesDigital Feeds� Pre-encoded� Direct feeds� ASI or DHEI� Satellite Muxes� Fiber feeds� MPTS� SPTS
BasebandVideo/Audio
and Data� Analog NTSC� Digital (SDI)� HDTV (HDSDI)� Audio� Data
PublicEducationalGovernment
GroomingOpen-Loop
Monitoring and Control
Monitoring and Control
Rate-shape / GroomRe-Mulitplexer
MulitplexerStatmux control
Encoding SystemClosed-Loop
IP or ASI
EncoderEncoderEncoderEncoderEncoderEncoderEncoderEncoderEncoderEncoderEncoderEncoder
DTV Receivers8VSB
Demodulators
P.E.G.Encoder
Data/MediaCarousels
M-CMTS
Bulk Encryption
Switched DigitalManager
MulitplexerCombinerGroomer
IP or ASI
IP or ASI
IPRouter
or
ASITransport
IPRouter
or
ASITransport
AdServer
AnalogRF
RF
QAMRF
QAMRF
Monitored by SDV Manager
SCTE-HMS 159r5Reference Architecture (Device level)
Ad Splicer
EdgeQAM
Encryption
QAMRF
IP or ASI
HFCCloud
Technology Background
Audio Loudness
Audio levels between TV channels, programs, and advertise-ments should be consistent, or at least similar to each other. But as we have all experienced from time to time, they can be so far off that we reach for the remote control to normalize their audio levels. This difference in levels has grown so far apart that governments around the world have put legislation in place to help bring levels back to normal. To objectively and accurately measure these audio levels over time (Loudness), standards are needed as a reference point. Two standards actively being used today are:
1. ATSC A/855 recommended practice
2. ITU recommendation 17706 and 17717
With these new recommendations available for DTV audio, we now have the means to objectively and accurately measure audio loudness.
Subjective Video
One method to rate video quality is to use human viewers. This method has merit, but is extremely time-consuming, and is difficult to get a consistent rating between viewers. Too many issues cause inconsistencies between ratings, like the model of Set Top Box (STB), STB firmware version, lighting near the TV, audio procesing and display type (plasma versus LCD), not to mention content and the mood of the viewer. Each viewer has his or her own preconceived notions of what is good and bad quality. Rating over a long period of time is not only tiring, but it is difficult to watch the entire area of every frame. Most people tend to focus of objects of interest. Multiple viewers watching the same material sometimes have a difficult time agreeing on an accurately rating when watch-ing the same content. Given these differences, viewers cannot equally rate material at different points of a network. Therefore, the best method to objectively rate material is to use a device that watches of each frame, in real-time, and can be replicated multiple times across a wide network. From ingest to set top box, the video path shown in Figure 11 includes a series of devices that touch or alter the video stream.
Figure 1. Typical Cable architecture (from SCTE 168-6) with ingest, remultiplexing, transmission, ad-insertion, encryption, and modulation.

www.tektronix.com/vqs1000 3
Measuring Video and Audio Quality of Experience (QoE)
Double Ended File Mode
Another method is to use an objective picture quality analyzer 2. The benefit here is that the device uses a reference file to compare any changes to the received content. This process is repeatable, objective, but does not currently run in real-time on live streams.
Objective and Real-time
Finally, the newest method is to embed a decoder and single – ended video quality analyzer into a single device that is repeatable, objective, and runs in real-time. This solution includes an MPEG-2 and H.264 decoder running on a high-speed server platform receiving video over IP. The optimum solution for identifying a network problem is to monitor the video on each side of each device.
QoE Measurement Strategies
Relying on a set top box to perform the decoding has its merits, but it is very dependent upon the unique model used as well as the specific firmware version used. With all of the different models of set top boxes, and the varying levels of firmware deployed across the many set top boxes, it will be almost impossible to get repeatable ratings across the network. Also, each set top box has the ability to use error concealment causing some errors from being measured by an analyzer. Finally, using the analog output from a set top box reduces the video quality, making it difficult to make accurate video quality measurements. Therefore, it would be more accurate to use a reference decoder just prior to encryption and modulation.
Currently, the MTM400A and its family of remote monitoring probes perform a wide array of measurements in the RF, IP, and Transport Stream domain. This is great for scoring the quality of service (QoS), but without understanding the contents of the payload, the QoE remains unknown. One additional need is to understand the QoE of a program, as well as the level of degradation between two points in the network.
Based upon the MTM400A backhauling application3, it is now possible to remotely gather content from any number of points in a network. To pinpoint device problems, use the MTM400A or IPM400A at the point of ingest to ensure that the QoS is preserved (no transport errors or dropped packets), and then select a program to be monitored for QoE. That specific program will then be routed to the VQS1000 server for a QoE rating. Next, as the program travels across the network, after grooming and ad-insertion, it can be checked again for QoE before going out to the viewing public. This method provides the ability to monitor the QoE of a specific service throughout the network at multiple points. This is extremely important when content is transcoded from MPEG-2 to H.264, as well as after advertisements are inserted.
How does it work?
The QoE solution is based upon the Tektronix VQS1000 Video Quality software and performs a full decode of the video element to baseband video frames for evaluating Frozen, Black, and Blockiness. These measurements not only measure the picture quality of the program to be delivered to the viewer at the end of the network, but can also be used to determine the quality of the video being provided from the contribution source. If you are trying to maintain a high QoE rating throughout the network, it is also very important to rate the QoE of the ingested material.
When making a QoE rating, two different thresholds may be needed to differentiate good quality from bad quality. Knowing when the quality of a single video frame degrades significantly can be important for triggering an event. But it may also be important to be able to allow one more degraded frame to pass and then only trigger when a higher number of degraded frames occur over time.
To measure audio levels from MPEG-1, MPEG-2, MPEG-4, and Dolby Digital (AC-3), the VQS1000 performs a full audio decode and follows the ITU 1770/1771 recommendation for true audio peak levels using 4-times over-sampling. Then to measure Loudness, the software follows either the ATSC A/85 defaults, EBU P/LOUD group defaults, or a manual setup of the Dial Norm level and short duration window time.

Application Note
www.tektronix.com/vqs10004
Editing Trigger/Alarm Conditions
Figure 2 shows the Edit Alarm menu used for all of the video and audio limit tests. Each test provides two optional level checks with a duration requirement, as well as two additional level checks with the provision for an event count requirement during the time limit. The example in Figure 2 enables an alarm condition if
1. The Audio Loudness limit rises above -17 LKFS for at least 10 seconds, or
2. The Audio Loudness limit drops below -45 LKFS for at least 10 seconds, or
3. The Audio Loudness limit rises above -4 LKFS at least 3 times in 10 seconds, or
4. The Audio Loudness limit drops below -47 LKFS at least 3 times in 10 seconds
Once any of the above conditions are met, an event will be written into the Audio or Video Event queue, SNMP trap will be sent back to MTM400A (if connected), and a 64 MB trans-port stream will be recorded to PC disk (if enabled). Also, the specific test being triggered will change the Test Meter (upper right of VQS display) from green to red.
Triggering On Black Frames
The VQS1000 detects black and frozen video frames, which catches long durations of black video on programs not currently being monitoring by human viewers. For a wide variety of reasons, this continues to happen around the world. The important issue here is to set a level of black as well as duration, and then trigger when the condition is met.
To detect a black frame, the VQS1000 Video Quality software decodes each video frame to baseband. Then the selected frame area is measured for its level of luminance. The measured value is then recorded for the real-time graph, trigger conditions, and results logging. One display point is plotted for every second of measurements. For example, a 29.97 Hz video element would plot one sample (max value) for approximately every 30 frames of video. As the amplitude of black is tracked (inverse of luminance), each instance that a threshold-limit is crossed, as well as meeting the duration condition for time or event-count, a trigger condition is met tripping the LED from green to red. At the same time, an SNMP trap can be sent to the remote MTM probe for additional logging, reporting, and transport recording. Figure 3 shows a program with a significant amount of dark areas as signaled by the green blocks on the right window, but not enough to raise the Black level to a full 100%. If the video frame were to go completely dark, then the right window would go complete green, and the graph would peak at 100%. Now, since this happens occasionally in live video and movies, it will be important to set the trigger threshold to a significant duration (e.g., 15 seconds, 10 minutes, etc.).
Figure 3. Video frame with significant amount of black.Figure 2. Edit Alarm menu.
www.tektronix.com/vqs1000 5
Measuring Video and Audio Quality of Experience (QoE)
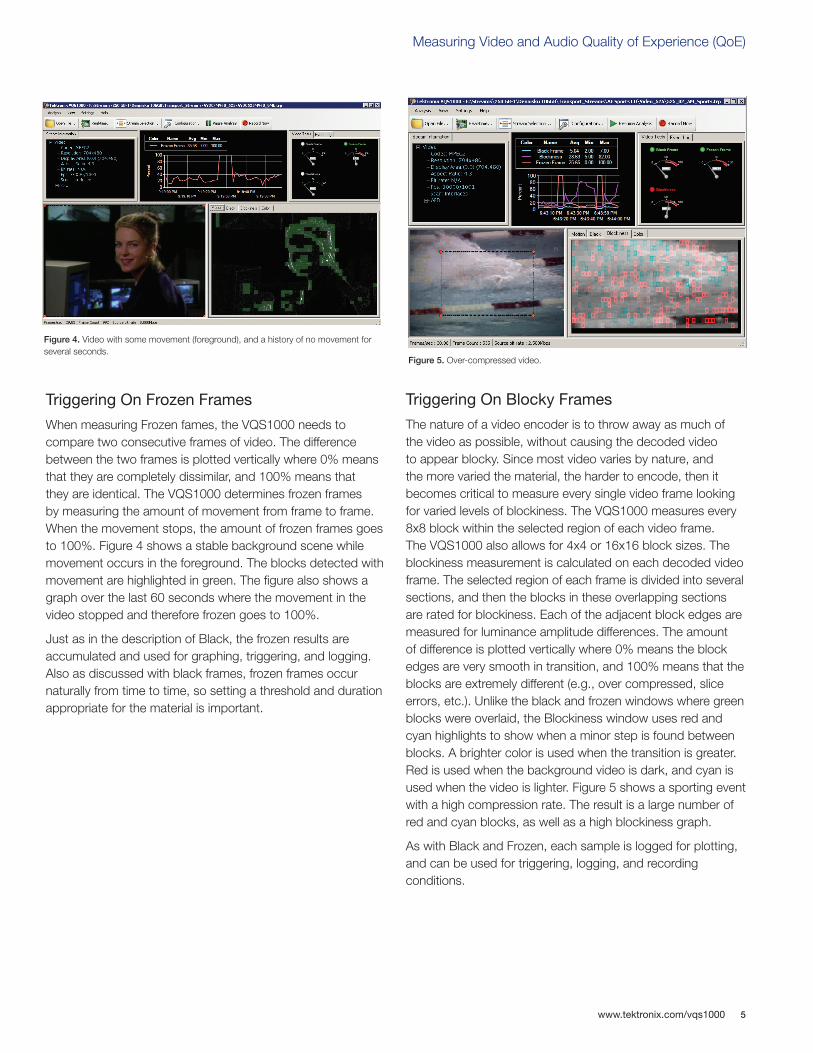
Triggering On Blocky Frames
The nature of a video encoder is to throw away as much of the video as possible, without causing the decoded video to appear blocky. Since most video varies by nature, and the more varied the material, the harder to encode, then it becomes critical to measure every single video frame looking for varied levels of blockiness. The VQS1000 measures every 8x8 block within the selected region of each video frame. The VQS1000 also allows for 4x4 or 16x16 block sizes. The blockiness measurement is calculated on each decoded video frame. The selected region of each frame is divided into several sections, and then the blocks in these overlapping sections are rated for blockiness. Each of the adjacent block edges are measured for luminance amplitude differences. The amount of difference is plotted vertically where 0% means the block edges are very smooth in transition, and 100% means that the blocks are extremely different (e.g., over compressed, slice errors, etc.). Unlike the black and frozen windows where green blocks were overlaid, the Blockiness window uses red and cyan highlights to show when a minor step is found between blocks. A brighter color is used when the transition is greater. Red is used when the background video is dark, and cyan is used when the video is lighter. Figure 5 shows a sporting event with a high compression rate. The result is a large number of red and cyan blocks, as well as a high blockiness graph.
As with Black and Frozen, each sample is logged for plotting, and can be used for triggering, logging, and recording conditions.
Figure 5. Over-compressed video.
Figure 4. Video with some movement (foreground), and a history of no movement for several seconds.
Triggering On Frozen Frames
When measuring Frozen fames, the VQS1000 needs to compare two consecutive frames of video. The difference between the two frames is plotted vertically where 0% means that they are completely dissimilar, and 100% means that they are identical. The VQS1000 determines frozen frames by measuring the amount of movement from frame to frame. When the movement stops, the amount of frozen frames goes to 100%. Figure 4 shows a stable background scene while movement occurs in the foreground. The blocks detected with movement are highlighted in green. The figure also shows a graph over the last 60 seconds where the movement in the video stopped and therefore frozen goes to 100%.
Just as in the description of Black, the frozen results are accumulated and used for graphing, triggering, and logging. Also as discussed with black frames, frozen frames occur naturally from time to time, so setting a threshold and duration appropriate for the material is important.

Application Note
www.tektronix.com/vqs10006
Digital audio today has a very wide dynamic range. Not all broadcasters and content providers use the same Dialog Normalization value (average level of dialog), therefore, switch-ing from channel to channel or even between commercials, we can find a wide difference in the average level of audio. To better monitor these levels over time, setting limits on True Peak, Short Term Loudness, and Long Term Loudness will provide a more objective measurement of the audio levels over time.
Figure 6 shows the VQS1000 measuring the audio levels of a program with Short Term limits set from -45 to -17 LKFS. The default incoming Dial Norm was set to -31 LKFS as seen in the upper-left corner of the VQS display. This value was manually set to -25 for this example (as seen in the legend of the graph menu). The "Pk" bar shows about 5 dBFS of red at the top as this moment of time registers the True Peak level of -10 dBFS. This is 5 dB over the limit of -15 dBFS set in the Edit Parameters.
The "PL" bar shows several different colors in this example. The center of the green section correlates to the Target Dial Norm set at -25 LKFS. The height of the green bar is at 10 dB as this is the limit set by Target Delta (+/- 5 dB). This means that we expect the Short Term Dial Norm to always stay between -30 and -20 LKFS. The level below the green "PL" sections is blue and stops at the lower limit of the Short Term Loudness (-45 LKFS in this example). The level above the green "PL" bar is yellow and stops at the upper limit of the Short Term Loudness (-17 LKFS in this example). The top part of the "PL" bar is red because the current Short Term Loud-ness value is above the Target Delta limits as well as the Short Term upper limit. If you look closely at the Short Term Loud-ness meter, you will see that it is still green. This has not trig-ger a "red" condition yet because we required the limit to be exceeded for at least 10 consecutive seconds. This condition has been met in this example.
Example Applications
Analyzing QoE from pre-recorded files
A pre-recorded transport stream file can come from a variety of places or devices, but as long as it meets the following requirements, its content can be rated for QoE:
1. The file conforms to ISO/IEC 13818-1 with transport packets of 188 or 204 bytes, and
2. The file includes a single or multi-program video element using MPEG-2 or H.264
Analyzing the file is straight forward. Simply open the file and measurements begin. In both the file mode and real-time mode, trigger conditions are logged to an Event window which can be exported to a file. Also, the graphical results can be logged too (see Figure 7). The minimum, mean, and maximum of every minute can be logged to disk. Figure 4 shows a graph covering a specific amount of time. The red graph reached 100% when a large logo appeared in the video frames with no movement in the background (i.e., frozen). The purple graph rises and falls dependent upon the blockiness of the video. For the swimming event, there were frames with very little movement which was easy for the encoder to handle, followed by frames with high action causing the encoder to over compress the frames leaving them very blocky.
For very long files, or for real-time events occurring over extended periods, logging the measurement details to disk can be very beneficial. Figure 7 shows a log file summarizing all of the measurement results in one minute increments.
Figure 7. Log-file showing a summary every 60 seconds.Figure 6. Decoded video along with Dolby AC-3 channel levels, Loudness, True Peak, and DialNorm graphs.

www.tektronix.com/vqs1000 7
Measuring Video and Audio Quality of Experience (QoE)
Analyzing QoE from a Tektronix Network Probe
The VQS1000 application can be integrated with any Tektronix network probe as long as it has been upgraded to V4.6 or later4. Once upgraded, use the Config-Preferences-Decode menu to set the decoder to the VQS1000 application. Each time the “Play” button is selected from the MTM400A remote user interface, the VQS1000 application will be launched and the PC/server will begin receiving RTP packets from the MTM400A. This specific mode uses a backhaul stream with RTP packets rather than UDP packets from the MTM400A. In this method, if the VQS1000 observes a dropped RTP packet due to network congestion, or the MTM400A fails to maintain a continuous RTP flow, then the VQS1000 decoder application will acknowledge the skip and attempt to re-synchronize the stream without impacting the QoE rating. Similarly, if the PC does not have enough throughput to maintain a real-time video rate, then once the PC buffer reaches a full point, the VQS1000 will flush the buffer and restart the real-time video measurements without impacting the QoE rating. This method allows the VQS1000 to maintain an understanding of dropped backhaul packets versus packets dropped over the video network.
The VQS1000 display and operation with an MTM400A is almost identical to the file-mode usage, except for the addition Video PID bandwidth measurement. One other additional feature provided while connected to the MTM400A is that all triggers are sent by SNMP back to the MTM400A. An additional category called AV Quality Tests is available and shown in Figure 8 for tracking the VQS1000 triggers of Black, Frozen, and Blockiness measurements.
Figure 8. MTM400A AV Quality Tests from the VQS1000.

Application Note
www.tektronix.com/vqs10008
Figure 9. Two encoders are compressing the same video content, one at 2 Mbps, and the second at 8 Mbps.
Analyzing QoE Directly from a Switch
The third application is where the VQS1000 is connected directly to a video IP switch. In this example, it is important for the switch manager to either SPAN or mirror the required traffic for the VQS1000 server, or else use the VQS1000 Real-time menu to use IGMP to join a multicast session. Figure 10 shows the menu for entering either the :
1. Port number of IP sessions already being delivered to the VQS PC
2. Multicast IP address
3. Source Specific address (for IGMP V3 if required)
Once connected, the VQS1000 measurements need to be started from the Real-time menu. Upon selection, simply choose the network interface card, and scan for a specific port, or scan for all. The VQS1000 will default to the first IP session with a transport stream. Changing to another stream is as simple as selecting Stream Selection from the menu.
The following example is from a switch pushing two multi-cast streams to the VQS1000 server. The two sessions were from two different video encoders looking at the same live video. The first encoder was set to 2 Mbps, while the sec-ond encoder was set to 8 Mbps. Figure 9 shows two copies of the VQS1000 application operating concurrently. The first instance connected to the 2 Mbps session, while the second instance connected to the 8 Mbps session. Both applications
were running in real-time showing the results side by side. It is easy to see that the 2 Mbps video struggles and has a high blockiness reading while the 8 Mbps video shows a relative flat blockiness rating as expected.
Figure 10. Real-time Analysis menu for selecting IP interface and address.

www.tektronix.com/vqs1000 9
Measuring Video and Audio Quality of Experience (QoE)
ConclusionsEnsuring a good quality of experience requires a real-time measurement device that provides objective and repeatable results. The VQS1000 provides this requirement. A VQS1000 with an IPM400A at the end of the IP chain will help to validate the QoE over any period of time, but when a triggered event occurs, another VQS1000 looking at the ingest signal will help to determine if the problem came from within, or from outside the network. If from within the network, then tests at each stage of the IP chain are required for pinpointing the problem down the single device that caused the error. The VQS1000 can provide this solution and allow for immediate resolution of which device is introducing the problem.
References1. SCTE 168-6 2010 Recommended Practice for Monitoring
Multimedia Distribution Quality
2. Tektronix PQA600 Picture Quality Analyzer Application Note 28W-24876-0 titled “Objective Measurements and Subjective Assessments”
3. Tektronix Application Note 25W-23178-1 titled “MTM Backhauling”
4. http://www.tek.com/downloads/ for current up to date software releases for the MTM400 and MTM400A family. Use version 4.6 or later to enable video backhauling and use of the VQS1000 Video Quality software.
5. ATSC A/85: Recommended Practice: Techniques for Estab-lishing and Maintaining Audio Loudness for Digital Television
6. Rec. ITU-R BS.1770-1: Algorithms to measure audio pro-gramme loudness and true-peak audio level
7. Rec. ITU-R BS.1771: Requirements for loudness and true-peak indicating meters

For Further InformationTektronix maintains a comprehensive, constantly expanding collection of application notes, technical briefs and other resources to help engineers working on the cutting edge of technology. Please visit www.tektronix.com
Copyright © 2010, Tektronix. All rights reserved. Tektronix products are covered by U.S. and foreign patents, issued and pending. Information in this publication supersedes that in all previously published material. Specification and price change privileges reserved. TEKTRONIX and TEK are registered trademarks of Tektronix, Inc. All other trade names referenced are the service marks, trademarks or registered trademarks of their respective companies.
01/11 Internal 21W-25432-1
Contact Tektronix:ASEAN / Australasia (65) 6356 3900
Austria* 00800 2255 4835
Balkans, Israel, South Africa and other ISE Countries +41 52 675 3777
Belgium* 00800 2255 4835
Brazil +55 (11) 3759 7600
Canada 1 (800) 833-9200
Central East Europe, Ukraine and the Baltics +41 52 675 3777
Central Europe & Greece +41 52 675 3777
Denmark +45 80 88 1401
Finland +41 52 675 3777
France* 00800 2255 4835
Germany* 00800 2255 4835
Hong Kong 400-820-5835
India 000-800-650-1835
Italy* 00800 2255 4835
Japan 81 (3) 6714-3010
Luxembourg +41 52 675 3777
Mexico, Central/South America & Caribbean 52 (55) 56 04 50 90
Middle East, Asia and North Africa +41 52 675 3777
The Netherlands* 00800 2255 4835
Norway 800 16098
People’s Republic of China 400-820-5835
Poland +41 52 675 3777
Portugal 80 08 12370
Republic of Korea 001-800-8255-2835
Russia & CIS +7 (495) 7484900
South Africa +27 11 206 8360
Spain* 00800 2255 4835
Sweden* 00800 2255 4835
Switzerland* 00800 2255 4835
Taiwan 886 (2) 2722-9622
United Kingdom & Ireland* 00800 2255 4835
USA 1 (800) 833-9200
* If the European phone number above is not accessible, please call +41 52 675 3777
Contact List Updated 25 May 2010