Measuring the Unmeasurable: Governance & Management of Information Technology

International Telecommunication UnionTelecommunication Development Bureau
Place des NationsCH-1211 Geneva 20
Switzerland
www.itu.int
ISBN 978-92-61-14661-0 SAP id
9 7 8 9 2 6 1 1 5 2 9 1 8
3 9 4 6 4
Price: 86 CHF
Printed in SwitzerlandGeneva, 2014
Photo credits: Shutterstock
Measuring the Information
Society Report2014
Mea
surin
g th
e In
form
atio
n So
ciet
y Re
port
201
4


Measuring the Information Society Report
2014

© 2014 ITU International Telecommunication Union
Place des Nations CH-1211 Geneva Switzerland
Original language of publication: English.
All rights reserved. No part of this publication may be reproduced, stored in a retrieval system, or transmitted in any form or by any means, electronic, mechanical, photocopying, recording, or otherwise, without the prior permission of the
International Telecommunication Union.
ISBN 978-92-61-15291-8
ii

Foreword
iii
I am pleased to present to you the 2014 edition of the Measuring the Information Society Report. Now in its sixth year, this annual report identifies key information and communication technology (ICT) developments and tracks the cost and affordability of ICT services, in accordance with internationally agreed methodologies. Its core feature is the ICT Development Index (IDI), which ranks countries’ performance with regard to ICT infrastructure, use and skills. The report aims to provide an objective international performance evaluation based on quantitative indicators and benchmarks, as an essential input to the ICT policy debate in ITU Member States.
Over the past year, the world witnessed continued growth in the uptake of ICT and, by end 2014, almost 3 billion people will be using the Internet, up from 2.7 billion at end 2013. While the growth in mobile-cellular subscriptions is slowing as the market reaches saturation levels, mobile broadband remains the fastest growing market segment, with continuous double-digit growth rates in 2014 and an estimated global penetration rate of 32 per cent – four times the penetration rate recorded just five years earlier. International bandwidth has also grown steeply, at 45 per cent annually between 2001 and 2013, and the developing countries’ share of total international bandwidth increased from around 9 per cent in 2004 to almost 30 per cent in 2013. Overall, almost all of the 166 countries included in the IDI improved their values in the last year.
Despite this encouraging progress, there are important digital divides that need to be addressed: 4.3 billion people are still not online, and 90 per cent of them live in the developing world. Fixed-broadband penetration stands at 6 per cent in developing countries, compared with 27.5 per cent in developed countries, and growth rates are slowing. Mobile broadband is growing fast, but the difference between developed and developing regions remains large, with 84 per cent penetration in the former as against 21 per cent in the latter. Increasing ICT uptake in the world’s least connected countries (LCCs), which are home to some 2.5 billion people, should therefore be the policy focus for the years to come. In these countries, the share of population living in rural areas is often high, reinforcing the urban-rural digital divide. As this report finds, ICT performance is better in countries with higher shares of the population living in urban areas, where access to ICT infrastructure, usage and skills is more favourable. Yet it is precisely in poor and rural areas where ICTs can make a particularly significant impact. New analysis featured in this report shows that many of the indicators of the Millennium Development Goals (MDGs) show significant correlation with the IDI, notably those related to poverty reduction and health improvement. Furthermore, the report finds that progress in ICT development is linked to progress in achieving some of the MDGs, yet another testimony to the role of ICT as a development enabler.
One reason for the limited uptake of ICT in the developing world is the price of the service, which is often unaffordable for poor segments of the population. While the prices of fixed and mobile services continue to decrease globally, in most developing countries the cost of a fixed-broadband plan represents more than 5 per cent of GNI per capita, and mobile broadband is six times more affordable in developed countries than in developing countries. Income inequalities within countries are one of the reasons why broadband – in particular fixed broadband – remains unaffordable to large segments of the population. The report finds that in 40 per cent of countries a basic fixed-broadband
Brahima Sanou Director
Telecommunication Development Bureau (BDT) International Telecommunication Union
subscription still represents more than 5 per cent of household income for over half of the population. For these income groups, mobile broadband may be the affordable alternative.
An enabling telecommunication regulatory environment can significantly influence the affordability of services. The report finds that the price of ICT services falls with better market regulation and increased competition. For example, in developing countries, fixed-broadband prices could be reduced by 10 per cent and mobile-cellular prices by 5 per cent if competition and/or the regulatory framework improved. International regulatory best practices, such as the ones adopted by the ITU Global Symposium for Regulators (GSR), may serve as a guideline for effective regulatory frameworks which can lay the foundations for affordable fixed-broadband services.
In this fast-changing digital era, one of the key challenges in measuring the information society is the lack of up-to-date data, in particular in developing countries. ITU is joining the international statistical community in looking into ways of using new and emerging data sources – such as those associated with big data – to better provide timely and relevant evidence for policy-making. Calls for a “data revolution” are prominent in the international debates around the post-2015 development agenda, and ICTs have an important role to play in view of their capacity to produce, store and analyse huge amounts of data, as well as being a major source of big data in their own right. Big data from mobile operators, for example, are real-time and low-cost and have one of the greatest development potentials in view of the widespread use and availability of mobile networks and services. This report provides the reader with a comprehensive and critical overview of the role of big data from the telecommunication sector, for use in social and economic development policy and for monitoring the future information society.
I trust that the data and analysis contained in this report will be of great value to the ITU membership, including policy-makers, the ICT industry and others working towards building an inclusive global information society.

AcknowledgementsThe 2014 edition of the Measuring the Information Society Report was prepared by the ICT Data and Statistics Division within the Telecommunication Development Bureau of ITU. The team included Susan Teltscher (Head of Division), Esperanza Magpantay, Vanessa Gray, Ivan Vallejo, Lisa Kreuzenbeck and Ola Amin. The following consultants to ITU provided substantive inputs: Pantelis Koutroumpis (Chapter 4) and Sriganesh Lokanathan (Chapter 5). André Wills, Fernando Callorda and Shazna Zuhyle contributed to the compilation of datasets on prices, and Michael Minges to the compilation of data on international bandwidth, revenue and investment. Helpful inputs and suggestions were received from Joan Calzada Aymerich from the University of Barcelona (Chapter 4), Jake Kendall from the Gates Foundation, Anoush Tatevossian and Alex Rutherford from UN Global Pulse, and Tommy van der Vorst and Reg Brennenraedts from Dialogic (Chapter 5). The following ITU colleagues also made insightful comments: Martin Adolph, Nikolaos Volanis, Phillippa Biggs, Youlia Lozanova, Nancy Sundberg and Chelsea Silva Mori. The work was carried out under the overall direction of Cosmas Zavazava, Chief, Project Support and Knowledge Management Department, Telecommunication Development Bureau.
The report includes data from Eurostat, OECD, IMF, Informa, the UNESCO Institute for Statistics, the United Nations Population Division and the World Bank, which is greatly acknowledged.
ITU also appreciates the cooperation of countries that have provided data included in this report.
The report was edited by Anthony Pitt and Bruce Granger, ITU English Translation Section. The desktop publishing was carried out by Nathalie Delmas, and the cover was designed by Jesus Vicente. Administrative support was provided by Herawasih Yasandikusuma.
v


Table of contents
Foreword .........................................................................................................................................................iii
Acknowledgements ......................................................................................................................................iv
Table of contents ..........................................................................................................................................vii
Chapter 1. Recent information society developments ............................................................................1
1.1 Introduction .........................................................................................................................................................................................1
1.2 The voice market ..............................................................................................................................................................................2
1.3 The broadband market and Internet access ...................................................................................................................4
1.4 Revenue and investment in the telecommunication sector .............................................................................13
1.5 Use of ICTs ..........................................................................................................................................................................................15
1.6 Emerging ICT measurement issues ....................................................................................................................................24
Chapter 2. The ICT Development Index (IDI) ...........................................................................................35
2.1 Introduction to the IDI ..............................................................................................................................................................35
2.2 Global IDI analysis ..........................................................................................................................................................................41
2.3 Monitoring the digital divide: Developed, developing and least connected countries ...................55
2.4 Geography, population size, economic development and the IDI ................................................................57
2.5 IDI and progress towards the Millennium Development Goals (MDGs).....................................................62
Chapter 3. Regional IDI analysis ................................................................................................................83
3.1 Africa ......................................................................................................................................................................................................85
3.2 Arab States .........................................................................................................................................................................................88
3.3 Asia and the Pacific .......................................................................................................................................................................91
3.4 Commonwealth of Independent States .........................................................................................................................95
3.5 Europe ..................................................................................................................................................................................................97
3.6 The Americas .................................................................................................................................................................................101
vii

Chapter 4. ICT prices and the role of competition .............................................................................. 107
4.1 Introduction ..................................................................................................................................................................................107
4.2 Fixed-telephone and mobile-cellular prices ............................................................................................................108
4.3 Broadband prices ......................................................................................................................................................................114
4.4 Income inequality and broadband prices .................................................................................................................140
4.5 The impact of competition and regulation on telecommunication prices ..........................................152
Chapter 5. The role of big data for ICT monitoring and for development ...................................... 173
5.1 Introduction ...................................................................................................................................................................................173
5.2 Big data sources, trends and analytics ...........................................................................................................................175
5.3 Telecommunication data and their potential for big data analytics ..........................................................181
5.4 Big data from mobile telecommunications for development and for better monitoring ..........185
5.5 Challenges and the way forward ......................................................................................................................................195
Chapter 5 Annex ....................................................................................................................................................................................207
List of references ........................................................................................................................................ 213
Annex 1. CT Development Index (IDI) methodology .......................................................................... 221
Annex 2. ICT price data methodology .................................................................................................. 231
Annex 3. Statistical tables of indicators used to compute the IDI ................................................... 241
Annex 4. Statistical tables of prices used to compute the ICT Price Basket ................................... 251
viii

List of charts
1.1 Fixed-telephone subscriptions by level of development, 2005-2014 (left) and by region, 2014 (right) ...................................................................................................................................................................................................2
1.2 Mobile-cellular subscriptions by level of development, 2005-2014 (left) and by region, 2014 (right) ...................................................................................................................................................................................................3
1.3 Fixed (wired)-broadband subscriptions by level of development, 2005-2014 (left) and by region, 2014 (right) ...................................................................................................................................................................................................5
1.4 Active mobile-broadband subscriptions by level of development, 2007-2014 (left) and by region, 2014 (right) ...................................................................................................................................................................................................6
1.5 Share of mobile subscriptions by technology, 2000-2015, developed countries (left) and developing countries (right)..............................................................................................................................................................7
1.6 Rural population covered by at least a 3G mobile network, 2009-2012................................................................8
1.7 Fibre and microwave routes, share of route kilometres (left) and route metres per capita (right), selected regions, 2013 ...........................................................................................................................................................................9
1.8 Total International Internet bandwidth (Gbit/s), by level of development (left) and regional share (right), 2004-2013 ..................................................................................................................................................................................10
1.9 International Internet bandwidth (bit/s) per Internet user, by region, 2004 and 2013 .............................10
1.10 Percentage of households with Internet access, by level of development, 2005-2014 (left) and by region, 2014 (right) ........................................................................................................................................................................11
1.11 Proportion of post offices providing public Internet access and post offices with broadband Internet access, 2012, by level of development .................................................................................................................12
1.12 Proportion of post offices providing public Internet access, by region, 2005-2007 vs 2010-2012 ....12
1.13 Telecommunication revenues, world and by level of development, 2007-2012, total in USD (left) and annual growth (right) ....................................................................................................................................................13
1.14 Annual investment by telecommunication operators, world and by level of development, 2007-2012, total in USD (left) and annual growth (right) .............................................................................................13
1.15 Individuals using the Internet, by level of development, 2005-2014 (left) and by region, 2014 (right) ................................................................................................................................................................................................14
1.16 Growth in daily Google searches, 2007-2013 ......................................................................................................................16
1.17 Growth in Facebook monthly active users, 2004-2013 (millions of users) ........................................................17
1.18 Wikipedia articles – total and English language, 2003-2013 (thousands of articles) ..................................17
1.19 Fixed-broadband access in enterprises using the Internet, selected countries, 2005-2012 ..................19
1.20 E-government Development Index (EGDI), 2003-2014 ................................................................................................20
ix

1.21 E-government services provided by countries (transactional services, left, and e-participation services, right) ..........................................................................................................................................................................................20
1.22 Proportion of schools with Internet access (total and fixed-broadband), 2012 or latest year available ............................................................................................................................................................................................22
1.23 Proportion of ICT-qualified teachers versus proportion of teachers trained to teach subjects using ICTs, by region, 2009-2012 .................................................................................................................................................23
2.1 Fixed (wired)-broadband and wirelessbroadband subscriptions per 100 inhabitants, top five IDI countries, 2013 .......................................................................................................................................................................46
2.2 Wireless-broadband subscriptions per 100 inhabitants, top five IDI countries, 2010-2013 ...................47
2.3 Wireless-broadband penetration, Bhutan, 2008-2013 ...................................................................................................50
2.4 Proportion of households with a computer and proportion of households with Internet access, 2012-2013, Qatar ...............................................................................................................................................54
2.5 IDI by level of development ...........................................................................................................................................................56
2.6 IDI access sub-index by level of development ...................................................................................................................56
2.7 IDI use sub-index by level of development ..........................................................................................................................56
2.8 IDI and GNI per capita ........................................................................................................................................................................60
2.9 IDI and percentage of population living in urban areas ...............................................................................................61
2.10 IDI and population density ..............................................................................................................................................................61
2.11 IDI and population size ......................................................................................................................................................................62
2.12 IDI and land area ....................................................................................................................................................................................62
2.13 IDI and MDG 1: Halve the proportion of people whose income is less than one dollar a day and the proportion of people who suffer from hunger ...............................................................................................71
2.14 IDI and MDG 4: Reduce child mortality ...................................................................................................................................72
2.15 IDI and MDG 5, Target 5.A: Reduce the maternal mortality ratio .............................................................................73
2.16 IDI and MDG 6, Target 6.C: Have halted by 2015 and begun to reverse the spread of HIV, malaria and other major diseases ...............................................................................................................................................75
2.17 IDI and MDG 7, Target 7.C: Halve, by 2015, the proportion of the population without sustainable access to safe drinking water and basic sanitation ...............................................................................76
3.1 IDI ranges and averages, by region and compared to world average, 2013 ....................................................84
3.2 IDI values compared with the global, regional and developing/developed-country averages, Africa, 2013 ................................................................................................................................................................................................85
3.3 Mobile-cellular subscriptions per 100 inhabitants, 2012 and 2013, Africa ........................................................87
3.4 IDI values compared with the global, regional and developing/developed-country averages, Arab States, 2013 ...................................................................................................................................................................................89
x

3.5 Wireless-broadband subscriptions per 100 inhabitants, Arab States, 2012 and 2013 ...............................91
3.6 IDI values compared with the global, regional and developing/developed-country averages, Asia and the Pacific, 2013 .................................................................................................................................................................92
3.7 Wireless-broadband penetration, Asia and the Pacific, 2012 and 2013 ..............................................................94
3.8 IDI values compared with the global, regional and developing/developed-country averages, CIS, 2013 ......................................................................................................................................................................................................95
3.9 Fixed (wired)-broadband subscriptions per 100 inhabitants, CIS, 2012 and 2013 .......................................97
3.10 IDI values compared with the global, regional and developing/developed-country averages, Europe, 2013 .............................................................................................................................................................................................98
3.11 Percentage of Individuals using the Internet, Europe compared to global and developed country average, 2013 .....................................................................................................................................................................100
3.12 IDI values compared with the global, regional and developing/developed-country averages, the Americas, 2013 ............................................................................................................................................................................101
3.13 Proportion of households with Internet access, the Americas, 2012 and 2013 ..........................................103
4.1 Fixed-telephone basket (left) and mobile-cellular basket (right), in PPP$, world and by level of development, 2008-2013 ..............................................................................................................................................................109
4.2 Fixed-telephone basket (left) and mobile-cellular basket (right), as a percentage of GNI p.c., world and by level of development, 2008-2013 .............................................................................................................111
4.3 Fixed-broadband prices in PPP$ (left) and most common entry-level fixed-broadband speed (right), world and by level of development, 2008-2013 .............................................................................................114
4.4 Fixed-broadband prices, as a percentage of GNI p.c., world and by level of development, 2008-2013 ...............................................................................................................................................................................................115
4.5 Fixed-broadband prices as a percentage of GNI p.c. in Europe, 2013 ...............................................................117
4.6 Fixed-broadband prices as a percentage of GNI p.c. in the CIS, 2013 ...............................................................117
4.7 Fixed-broadband prices as a percentage of GNI p.c. in the Arab States, 2013 .............................................119
4.8 Fixed-broadband prices as a percentage of GNI p.c. in the Americas, 2013 .................................................120
4.9 Fixed-broadband prices as a percentage of GNI p.c. in Asia and the Pacific, 2013 ...................................122
4.10 Fixed-broadband prices as a percentage of GNI p.c. in Africa, 2013 ..................................................................123
4.11 Availability of mobile-broadband services by type of service, by level of development, 2013 and 2012 ......................................................................................................................................................................................127
4.12 Mobile-broadband prices, in PPP$, world and by level of development, 2013 ..........................................217
4.13 Mobile-broadband prices, in USD, world and by level of development, 2013 ............................................128
4.14 Mobile-broadband prices as a percentage of GNI p.c., world and by level of development, 2013 ...........................................................................................................................................................................128
xi

4.15 Mobile-broadband prices as a percentage of GNI p.c., by region, 2013 ..........................................................129
4.16 Comparison of postpaid fixed-broadband and postpaid computer-based mobile-broadband prices, in USD, by region, 2013 ...................................................................................................................................................130
4.17 Distribution of household disposable income (left) and household consumption (right), selected countries, 2011 or latest available year .............................................................................................................141
4.18 Fixed-broadband prices as a percentage of household disposable income, by income deciles, Panama and Uruguay, 2013 .......................................................................................................................................142
4.19 Fixed-broadband prices as a percentage of household consumption, by consumption deciles, Angola and Uganda, 2013 ..........................................................................................................................................143
4.20 Prepaid handset-based mobile-broadband prices (500 MB/month) as a percentage of equivalized household income (left), and equivalized household consumption expenditure (right), by deciles, 2013 ...................................................................................................................................................................151
4.21 Competition in fixed-broadband markets and fixed-broadband prices as a percentage of GNI p.c., 2008-2013 ......................................................................................................................................................................155
4.22 Competition in mobile markets and mobilecellular prices as a percentage of GNI p.c., 2008-2013 ..............................................................................................................................................................................................155
4.23 Variation in fixed-broadband prices (%) explained by each variable, 2013 ...................................................162
4.24 Variation in mobile-cellular prices (%) explained by each variable, 2013 .......................................................165
List of figures
2.1 Three stages in the evolution towards an information society ................................................................................36
2.2 ICT Development Index: indicators, reference values and weights .......................................................................40
2.3 IDI spider charts, selected dynamic countries, 2012 and 2013 .................................................................................52
2.4 Significant partial correlations between IDI and MDG indicators ...........................................................................70
2.5 Significant correlations between percentage increases in IDI and percentage changes in MDG indicators .......................................................................................................................................................................................78
4.1 Mobile-broadband services by type of device/plan ....................................................................................................125
4.2 Relationship between regulation, competition and prices .....................................................................................154
4.3 Composition of the variable measuring the regulatory environment .............................................................156
5.1 The five Vs of big data ......................................................................................................................................................................176
5.2 An overview of telecom network data .................................................................................................................................182
5.3 Customer profiling using telecom big data ......................................................................................................................184
xii

List of boxes
1.1 Final review of the WSIS targets: Achievements, challenges and the way forward .....................................26
1.2 A decade of successful international cooperation on ICT measurement..........................................................27
1.3 Strategic targets for the future information society ........................................................................................................28
1.4 What is a data revolution? ................................................................................................................................................................30
2.1 ITU discussion forums on ICT statistics ....................................................................................................................................38
2.2 The world’s least connected countries (LCCs) .....................................................................................................................58
2.3 WSIS and ICT progress as measured by IDI 2002 and 2013 ........................................................................................64
2.4 Thailand: Smart phones and volunteers fight drug-resistant malaria ..................................................................74
4.1 Challenges for fixed-broadband adoption in Mauritania ..........................................................................................120
4.2 Panel regression models for fixed-broadband and mobile-cellular prices ....................................................158
5.1 How big data saves energy – Vestas Wind Systems improves turbine performance ..............................177
5.2 How Twitter helps understand key post-2015 development concerns ..........................................................179
5.3 How mobile operators currently use data to track service uptake, business performance and revenues ...................................................................................................................................................................................................183
5.4 Using mobile data for development ......................................................................................................................................187
5.5 How mobile-network data can track population displacements – an example from the 2010 Haiti earthquake .....................................................................................................................................................................188
5.6 Leveraging mobile-network data for transportation and urban planning in Sri Lanka .........................189
5.7 Poverty mapping in Côte d’Ivoire using mobile-network data .............................................................................190
5.8 Using mobile-phone data to track the creditworthiness of the unbanked ..................................................191
5.9 Using mobile big data and mobile networks for implementing surveys .......................................................193
List of tables
1.1 Rural population covered by a mobile-cellular signal, 2012 .........................................................................................4
1.2 Total Internet domain registrations by world region, 2003, 2008 and 2013.....................................................18
2.1 IDI values and changes, 2012 and 2013 ..................................................................................................................................41
2.2 ICT Development Index (IDI), 2012 and 2013 ......................................................................................................................42
xiii

xiv
2.3 IDI access sub-index, 2012 and 2013 ........................................................................................................................................43
2.4 IDI use sub-index, 2012 and 2013 ...............................................................................................................................................44
2.5 IDI skills sub-index, 2012 and 2013.............................................................................................................................................45
2.6 Most dynamic countries - changes between IDI 2013 and 2012 ...........................................................................49
2.7 IDI by level of development, 2012-2013 .................................................................................................................................55
2.8 IDI by groups, 2012 and 2013 ........................................................................................................................................................57
2.9 Partial correlation analysis of IDI, population and geographic characteristics ...............................................60
2.10 Examples of contribution of ICTs towards the Millennium Development Goals ..........................................66
2.11 Results of partial correlation analysis between IDI and MDG indicators ............................................................67
2.12 Simple correlation analysis between relative change in IDI values and MDG indicators 2002-2011, developing countries ...............................................................................................................................................77
3.1 IDI by region, 2013 and 2012 .........................................................................................................................................................84
3.2 The top five economies in each region and their ranking in the global IDI, 2013 .......................................85
3.3 IDI – Africa ..................................................................................................................................................................................................86
3.4 IDI – Arab States .....................................................................................................................................................................................90
3.5 IDI – Asia and the Pacific ...................................................................................................................................................................93
3.6 IDI – CIS ........................................................................................................................................................................................................96
3.7 IDI – Europe ...............................................................................................................................................................................................99
3.8 IDI – The Americas .............................................................................................................................................................................102
4.1 Fixed-telephone sub-basket, 2013 ..........................................................................................................................................112
4.2 Mobile-cellular sub-basket, 2013 .............................................................................................................................................113
4.3 Fixed-broadband prices as a percentage of GNI p.c., by region, 2013 ..............................................................116
4.4 Fixed-broadband sub-basket, 2013 ........................................................................................................................................124
4.5 Mobile-broadband prices, postpaid handset-based 500 MB, 2013 ....................................................................132
4.6 Mobile-broadband prices, prepaid handset-based 500 MB, 2013 ......................................................................134
4.7 Mobile-broadband prices, postpaid computer-based 1 GB, 2013 ......................................................................136
4.8 Mobile-broadband prices, prepaid computer-based 1 GB, 2013 .........................................................................138
4.9 Fixed-broadband prices as a percentage of household disposable income, selected countries, 2013 .....................................................................................................................................................................................144
4.10 Fixed-broadband prices as a percentage of household consumption expenditure, selected countries, 2013 ................................................................................................................................................................145
xv
4.11 Prepaid handset-based mobile-broadband (500 MB/month) prices as a percentage of household disposable income, selected countries, 2013 .........................................................................................148
4.12 Prepaid handset-based mobile-broadband (500 MB/month) prices as a percentage of household consumption expenditure, selected countries, 2013 ........................................................................149
4.13 Panel regression results, fixed-broadband prices and regulation ........................................................................160
4.14 Panel regression results, mobile-cellular prices and regulation ............................................................................163
4.15 ICT Price Basket and sub-baskets, 2013 ................................................................................................................................166
5.1 Sources of big data ............................................................................................................................................................................175


1
Measuring the Information Society Report 2014
Chapter 1. Recent information society developments
1.1 Introduction
The past year has been characterized by uninterrupted growth in the spread of information and communication technology (ICT) infrastructure and in ICT uptake by citizens and public and private organizations. While the global mobile-cellular market is approaching saturation levels, mobile-broadband uptake continues to grow at double-digit rates in all regions, and mobile broadband remains the strongest growing market segment. This trend is accompanied by a slowdown in fixed-broadband uptake in the developing world, where mobile-broadband services provide a response to the demand for high-speed Internet access in view of the lack of affordable fixed-broadband services, whereas in the developed world both fixed- and mobile-broadband uptake is growing continuously.
The data also show a continuous increase in Internet usage, with growth in the number of Internet users in all countries and increasing availability of online content, much of which is user-created through social media applications and platforms (e.g. Twitter, YouTube, WhatsApp). With more and more applications now available
through mobile platforms (mobile apps), and the strong growth in mobile Internet uptake, an increasing number of people are joining, and participating actively in, the information society.
While the information society is growing worldwide, digital divides remain – and are even widening – in some segments. In particular, there is a significant and persistent urban-rural digital divide, whereby urban citizens enjoy ubiquitous mobile network coverage, affordable high-speed Internet services and the higher levels of skills required to make effective use of online content and services, while the opposite is often the case in rural and remote areas of many developing countries.
This chapter will present and discuss key indicators for monitoring the global information society. It will first look at the uptake of ICT infrastructure and services, covering the fixed and mobile (voice and data) market segments, and considering both subscriptions and household access data. This will be followed by a presentation of the latest trends in terms of investment and revenue in the telecom sector. Then, a number of key indicators will be presented concerning ICT uptake by individuals, businesses and public organizations (from the government and education sectors), as

Chapter 1. Recent information society developments
2
well as growth in online content and particularly social media. The final part of the chapter will discuss emerging issues related to information-society measurements, in particular in the context of the post-2015 development debate and the WSIS+10 review, the demand for a data revolution, and the role of big data for ICT monitoring.
1.2 The voice market
In line with developments in recent years, fixed telephony is on the decline in all regions of the world (Chart 1.1). Worldwide, there are only around a dozen countries where fixed-telephone uptake has actually increased over the past year.1 Fixed-telephone penetration decreased by about 2 per cent globally in the past year, and will drop to its lowest level in 14 years – lower than at the turn of the century – with an estimated 1.1 billion subscriptions by end 2014. The decrease is stronger in developed countries (2.4 per cent) than developing countries (1 per cent), and strongest in the Americas region (2.6 per cent), followed by Asia and the Pacific (2 per cent).
The decline in fixed-telephone subscriptions over the past decade was accompanied by
strong growth in the mobile-cellular market until 2010, at which point mobile-cellular growth rates dropped to single digits, and they have continued to slow down since then. In 2014, global growth in mobile penetration will be at a ten-year low of 2.6 per cent, as the market reaches saturation levels, in particular in developed countries where penetration will reach 121 per cent (Chart 1.2). By end 2014, there will be almost as many mobile-cellular subscriptions (6.9 billion) as people on Earth, more than three quarters of them (5.4 billion) in the developing world and more than half (3.6 billion) in the Asia-Pacific region. While this does not mean that everyone has a mobile phone – since many people have more than one subscription or SIM card – the total numbers and growth rates strongly point to market saturation. Whether this will change in the near future, and whether growth will pick up again, will depend among other things on the types of service plans that will be offered in national markets and their uptake by individuals.
Looking at the six world regions, Africa and Asia and the Pacific are the regions with the strongest mobile-cellular growth, and the lowest penetration rates, which will reach 69 per cent and 89 per cent, respectively, by end 2014.
Chart 1.1: Fixed-telephone subscriptions by level of development, 2005-2014 (left) and by region, 2014* (right)
Note: *Estimate.Source: ITU World Telecommunication/ICT Indicators database.
39.2
26.324.9
15.812.7
8.7
1.3
0
5
10
15
20
25
30
35
40
Europe
The Am
ericas CIS
World
Asia
& P
acifi
c
Arab S
tate
s
Afric
a
Pe
r 1
00
in
ha
bit
an
ts
Pe
r 1
00
in
ha
bit
an
ts
0
10
20
30
40
50
Developed
World
Developing
LDCs
20052006
20072008
20092010
20112012
2013
2014*
40.8
15.8
10.6
1.1

3
Measuring the Information Society Report 2014
Penetration rates in the CIS countries, Arab States, Americas and Europe have attained levels above 100 per cent since 2012 and are expected to grow at less than 2 per cent in 2014.
The above numbers suggest that, globally speaking, the voice market is reaching saturation: the fixed-telephone market is shrinking and the mobile-cellular market is tapering off. In addition, mobile-cellular population coverage has reached 93 per cent globally: in other words, almost every person on the globe lives within reach of a mobile-cellular signal and, at least theoretically, has access to mobile communication services.
Closer examination and disaggregation of the data reveal, however, that digital divides still exist and that some people are still excluded from access to communication networks.
First, there are populations living in rural areas that are not covered by a mobile-cellular signal (Table 1.1). Even though rural population coverage is very high, at 87 per cent globally, at end 2012 around 450 million people worldwide still lived out of reach of a mobile signal.
Second, high mobile-cellular penetration does not imply that everyone owns or is using a mobile
Chart 1.2: Mobile-cellular subscriptions by level of development, 2005-2014 (left) and by region, 2014* (right)
Note: *Estimate.Source: ITU World Telecommunication/ICT Indicators database.
162.7
124.7109.9 108.5
96.489.2
69.3
0
20
40
60
80
100
120
140
160
180
Pe
r 1
00
in
ha
bit
an
ts
CIS
phone. For countries where data are available, the number of mobile subscriptions far exceeds the number of mobile phone users (Partnership, 2014). No regular pattern can be established, though, and the difference between mobile-phone user penetration and mobile-cellular subscription penetration ranges between 8 per cent (France) and 111 per cent (Panama) across countries. According to GSMA estimates, unique mobile subscribers account for about half of mobile-cellular subscriptions, which would translate into a penetration rate of around 48 per cent globally, 63 per cent in developed countries, 45 per cent in developing countries and 30 per cent in least developed countries (LDCs).2
Third, household access to a telephone is still not the norm in many developing countries, in particular in LDCs (Partnership, 2014). For example, according to the latest population and housing census carried out in India in 2011, 63 per cent of households had a telephone (up from 9 per cent ten years earlier). In addition, there were significant differences between urban and rural areas, with 82 per cent of Indian urban households having access to a telephone compared with 54 per cent of rural households.3 Household telephone penetration in Malawi stood at 36 per cent in 2011 – 73 per cent in urban households
125.8
96.4
90.2
59.0
Pe
r 1
00
in
ha
bit
an
ts
0
20
40
60
80
100
120
140 Developed
World
Developing
LDCs
2014*
20052006
20072008
20092010
20112012
2013

Chapter 1. Recent information society developments
4
and 29 per cent rural households. In Uganda, the numbers were 46 per cent (total), 81 per cent (urban) and 38 per cent (rural).The urban-rural gap in household telephone access prevails in many developing countries for which data are available, but is closing with the availability of affordable mobile-phone services in rural areas.
Further research and data would be necessary to determine people’s access to, and use of, voice communications and to identify other potential barriers, such as those related to poverty, literacy, education or lack of electricity, as well as cultural and social barriers.
1.3 The broadband market and Internet access
Fixed (wired)-broadband and mobile-broadband marketsInfrastructure deployment providing access to broadband Internet continues to be a priority for telecommunication service providers and governments in most countries. This is reflected in the continuous growth in the number of mobile- and fixed-broadband subscriptions worldwide.
In 2014, fixed-broadband subscriptions will reach a total of 711 million globally, corresponding to a penetration rate of almost 10 per cent (Chart 1.3),
Table 1.1: Rural population covered by a mobile-cellular signal, 2012
Source: Partnership (2014) based on ITU data.
Overall mobile-cellular population coverage (%)
Rural population covered (%)
Rural population covered (millions)
Rural population not covered (millions)
Africa 88 79 498 129
Americas 99 96 171 9
Asia 92 87 2 017 309
Europe 99 98 196 3
Oceania 96 81 0.9 0.2
World 93 87 2’883 450
as against 220 million and 3.4 per cent in 2005. Distinct patterns can be observed, though, between developed and developing regions. In most developed countries, fixed-broadband penetration has already reached relatively mature levels, with a penetration of 27.5 per cent and continuous low growth, at around 3.5 per cent in 2014.
In developing countries, fixed-broadband penetration growth rates have dropped from 18 per cent in 2011 to 6 per cent in 2014, reaching an overall (low) penetration rate of 6 per cent by end 2014, and less than 1 per cent in LDCs. In the latter, fixed-broad band infrastructure and uptake has not (yet) materialized. This slowdown in/low growth of fixed-broadband subscriptions, despite low penetration, coincides with a strong growth in mobile-broadband subscriptions in the developing world (see Chart 1.3).
A closer look at different regions shows that Africa, the Arab States and CIS are the regions with double-digit fixed-broadband penetration growth rates, whereas the Americas region displays the lowest growth in fixed broadband, estimated at 2.5 per cent and reaching a penetration rate of around 17 per cent by end 2014. Asia and the Pacific stands out as a region registering relatively low fixed-broadband penetration (7.7 per cent) and a sharp decline in the growth of fixed broadband over the past four years. This has been mostly due to a

5
Measuring the Information Society Report 2014
Chart 1.3: Fixed (wired)-broadband subscriptions by level of development, 2005-2014 (left) and by region, 2014* (right)
Note: *Estimate.Source: ITU World Telecommunication/ICT Indicators database.
27.7
16.714.3
9.87.7
3.1
0.4
0
5
10
15
20
25
30
Pe
r 1
00
in
ha
bit
an
ts
CIS
slowdown in fixed-broadband growth in some of the larger economies, such as China, India, the Islamic Republic of Iran and Malaysia. Europe’s fixed-broadband penetration is much higher compared with other regions and almost three times as high as the global average: 27.7 per cent and 9.8 per cent, respectively. For example, Switzerland is the country with the highest fixed-broadband penetration worldwide, at 40 per cent in 2014.
The Arab States region stands out with a low fixed-broadband penetration of 3.1 per cent by end 2014, the second lowest among all regions and considerably below the global average of almost 10 per cent. As compared with other key ICT indicators, the region performs lower than expected on this indicator. However, fixed-wireless broadband, which is not included in this figure, is prominent in some of the countries of the region. In Comoros, Somalia and Yemen, for example, no mobile-broadband services are available, but fixed-wireless and satellite services are offered. In Saudi Arabia, 30 per cent of all wireless-broadband subscriptions are fixed-wireless and satellite subscriptions.
Mobile broadband remains the fastest growing market segment, with continuous double-digit
growth rates in 2014 and an estimated global penetration of 32 per cent – four times the penetration rate recorded just five years earlier (Chart 1.4). Mobile broadband is growing fastest in developing countries, where growth rates over the last year are expected to be twice as high as in developed countries (26 per cent, as against 11.5 per cent). This is driven by the availability and uptake of more affordable devices (smartphones) and types of plan on offer in the market.
Nevertheless, the divide between developed and developing countries remains huge: mobile-broadband penetration will reach 84 per cent in the former compared with 21 per cent in the latter. The high penetration in developed countries is partly due to very high uptake in populous countries such as the United States and Japan, where penetration rates reached 93 per cent and 120 per cent, respectively, at end 2013.
All regions continue to show double-digit growth rates, but Africa stands out with a growth rate of over 40 per cent – twice as high as the global average. By end 2014, mobile-broadband penetration in Africa will have climbed to almost 20 per cent, up from less than 2 per cent four
Pe
r 1
00
in
ha
bit
an
ts
0
5
10
15
20
25
30
Developed
World
Developing
LDCs
27.5
9.8
6.1
0.3
20052006
20072008
20092010
20112012
2013
2014*

Chapter 1. Recent information society developments
6
years earlier (Chart 1.4). This is partly explained by strong growth in populous countries such as Nigeria and South Africa, where mobile-broadband penetration reached 37 per cent and 29 per cent, respectively, by end 2013.
A closer look at the different mobile technologies and their market shares highlights the shift from lower-speed to higher-speed technologies over the past 15 years (Chart 1.5). In developed countries, 3G subscriptions overtook 2G subscriptions in 2010 and 3G growth is flattening. In developing countries, the large majority of subscriptions are still 2G, but 3G is growing rapidly and will overtake 2G subscriptions in a few years. 4G4 services came onto the market only recently and 4G subscriptions still account for only a small market share, in both developed and developing countries.
The data on fixed- and mobile-broadband uptake confirm what has been observed on the ground. In developed countries, fixed-broadband infrastructure and services were available much earlier than in most developing countries, and before fast mobile-broadband services and smartphones entered the market. This has contributed to the higher uptake of fixed broadband in developed countries. In
Chart 1.4: Active mobile-broadband subscriptions by level of development, 2007-2014 (left) and by region, 2014* (right)
Note: *Estimate.Source: ITU World Telecommunication/ICT Indicators database.
83.7
32.0
21.1
6.30
10
20
30
40
50
60
70
80
90Developed
World
Developing
LDCs
Pe
r 1
00
in
ha
bit
an
ts
63.859.1
48.9
32.0
24.6 22.819.0
0
10
20
30
40
50
60
70
Pe
r 1
00
in
ha
bit
an
ts
CIS
developing countries, by contrast, on account of the limited fixed-broadband infrastructure and the lack of affordable fixed-broadband service offerings, mobile-broadband services are increasingly becoming an alternative to fixed broadband, and indeed the preferred choice of consumers. Furthermore, the mobile market has benefited from a more liberal regulatory approach than the fixed market, further contributing to its successful growth (ITU, 2014).
It should be noted that the numbers of fixed- and mobile-broadband subscriptions are, strictly speaking, not comparable. Fixed-broadband connections are mostly shared connections and deployed to a (physical) building (belonging to, for example, households, cybercafés, businesses or other public and private organizations). Mobile-broadband subscriptions are not bound by physical connections and usually refer to individuals, and – in the same way as with mobile-cellular subscriptions – there is a certain amount of double counting involved, for example when people use multiple devices (e.g. smartphone, tablet) and SIM cards.
Looking towards the future, the growth potential for mobile broadband looks promising, as

7
Measuring the Information Society Report 2014
Chart 1.5: Share of mobile subscriptions by technology, 2000-2015, developed countries (left) and developing countries (right)
Source: ITU (2012); data based on ITU and Telecom Advisory Services calculations.
more and more countries upgrade their mobile networks. As mentioned earlier, 2G population coverage stands at over 90 per cent worldwide. Data on 3G population coverage are less available. According to ITU estimates, global 3G population coverage stood at around 50 per cent by end 2012, and there were still sizeable rural-urban gaps. Rural population coverage ranged from 100 per cent in the Gulf countries of United Arab Emirates and Bahrain to zero in some African countries (Chart 1.6).
These numbers are, however, expected to change significantly in the near future, as more and more countries are deploying 3G+ technologies and services, and given the strong growth in mobile-broadband subscriptions. At the same time, the issue of spectrum allocation will have to be addressed to ensure that the increasing demand for high-speed mobile access can be met, including in rural areas, where the additional spectrum represented by the digital dividend could play a crucial role in universalizing mobile-broadband access.
Backbone and bandwidthThe growth in broadband subscriptions is accompanied by continuous growth in national
backbone capacities and international Internet bandwidth. Indeed, without further deployment of backbone infrastructure, service providers are unable to expand their markets to previously underserved regions.
New data collected by ITU on the deployment of fibre transmission capacity in countries shows that by end 2013, more than 11.7 million km of fibre and microwave backbone transmission networks were available in the five regions covered so far: Africa, the Arab States, Asia and the Pacific, CIS countries, and Latin America and the Caribbean.5 While these numbers reflect the huge efforts that have been made to increase international backbone capacity, a closer look at the data also reveals major disparities across regions: Asia and the Pacific (in particular China and India) accounts for more than 85 per cent of the total length of backbone networks (Chart 1.7, left). While this reflects the huge geographical size of the region, and the two countries in particular, the figures for available route metres per capita are also higher than in other regions. In Asia and the Pacific, there are 6.5 times as many route metres per capita than in Africa (Chart 1.7, right). On the other hand, not everyone lives within close range of the transmission networks. In Asia and the Pacific, 40 per cent of the population live out of reach
0
10
20
30
40
50
60
70
80
90
100
Developed countries
1G
2G
3G
4G
%
1G
2G
3G
4G
%
0
10
20
30
40
50
60
70
80
90
100
Developing countries

Chapter 1. Recent information society developments
8
Chart 1.6: Rural population covered by at least a 3G mobile network, 2009-2012
Source: Partnership (2014) based on ITU data.
Percentage of rural population covered by at least a 3G mobile
network 2012 or 2011
Percentage of rural population covered by at least a 3G mobile
network 2010
Percentage of rural population covered by at least a 3G mobile
network 2009
0
0
0
0
0
0
0
0
0
0
0
0
1
5
11
31
32
32
34
36
38
41
42
42
46
50
50
50
55
55
58
60
61
63
65
68
69
69
77
77
77
78
81
84
86
87
88
88
89
90
90
92
93
93
94
94
95
95
96
100
100
0 10 20 30 40 50 60 70 80 90 100
Antigua and Barbuda
Benin
Burkina Faso
Burundi
Congo (Democratic Republic of the)
Cote d'Ivoire
Djibouti
Dominica
Guyana
Saint Lucia
St. Vincent and the Grenadines
Togo
Zambia
Hungary
Namibia
Uganda
Ecuador
Malaysia
French Polynesia
Iceland
Slovakia
Philippines
Morocco
Bosnia and Herzegovina
Serbia
Tunisia
Cyprus
Swaziland
Poland
Croatia
Maldives
Belarus
Portugal
Andorra
Saudi Arabia
Czech Republic
Albania
Finland
New Zealand
Azerbaijan
Spain
Seychelles
Slovenia
Egypt
France
Ireland
Austria
Israel
Romania
Estonia
Australia
Bulgaria
Armenia
Sweden
Korea (Rep. of)
Netherlands
Canada
Greece
United Kingdom
Bahrain
United Arab Emirates

9
Measuring the Information Society Report 2014
of an operational fibre transmission network (i.e. more than 50 km away), and just over 10 per cent live within a range of 10 km. In Africa, 30 per cent of the population live out of reach, and about 22 per cent live within a range of 10 km. These numbers reveal significant digital divides between and within regions and point to opportunities for service providers to increase their subscriber base (ITU, 2014).
Another key indicator that provides further insight into the quality and speed of networks is the amount of international Internet bandwidth available in countries and regions, such bandwidth being a key requirement for delivering data-intensive applications and services through high-speed networks. While fibre transmission networks constitute an essential infrastructure that has to be available in order to provide access to high-speed networks, information on bandwidth is also required to gauge the actual quality and speed available.
Over the past decade, international Internet bandwidth has climbed sharply, from around 1 600 Gbit/s in 2001 to 60 400 Gbit/s in 2010 and more than 140 000 Gbit/s in 2013 (Chart 1.8, left). The average annual growth over this period amounted to 45 per cent, reflecting the strong investment in backbone infrastructure in all parts
Chart 1.7: Fibre and microwave routes, share of route kilometres (left) and route metres per capita (right), selected regions, 2013
Source: ITU Trends in Telecommunication Reform, 2014.
of the world. Growth in international bandwidth has been strong in all regions, and the share of developing countries in total international bandwidth increased from around 9 per cent in 2004 to almost 30 per cent in 2013. Europe leads by far in terms of international Internet bandwidth, accounting for more than 50 per cent of the world’s total (2013), compared with Africa’s share of less than 1 per cent (Chart 1.8, right).
Europe’s leadership in international Internet bandwidth is explained by the advanced level of broadband adoption and usage in the region, and its composition, Europe being made up of countries that are relatively small in geographic size and depend on international connections to reach the global Internet. As a result, the Internet backbone network in the region is interlinked by means of several Internet exchange points (IXPs) that interconnect national networks and give them access to the global Internet. Indeed, some of the world’s largest IXPs are located in Europe and have an international reach, such as for instance the German Commercial Internet Exchange (DE-CIX), the Amsterdam Internet Exchange or the London Internet Exchange.6 The United Kingdom stands out as a prominent global hub for international
3% 2%
85%
4%6%
Africa
Arab States
Asia & Pacific
CIS
The Americas
0.4
0.7
2.6
1.6
1.3
0
0.5
1.0
1.5
2.0
2.5
3.0
Africa Arab
States
Asia &
Pacific
CIS Latin
America
m/c
ap
ita

Chapter 1. Recent information society developments
10
Chart 1.8: Total international Internet bandwidth (Gbit/s), by level of development (left) and regional share (right), 2004-2013
Source: ITU World Telecommunication/ICT Indicators database.
connectivity, because of the strong internal demand and also its location: most transatlantic submarine cables land in the UK, as do several cables linking Western Africa and the Arab States with Europe.7 International Internet bandwidth in the UK accounts for almost twice as much as Africa, Arab States and CIS combined, and almost 20 times as much as the Africa region.
In order to understand better the impact of available international bandwidth on Internet
0
20'000
40'000
60'000
80'000
100'000
120'000
140'000
160'000 Africa
Arab States
CIS
Asia & Pacific
The Americas
Europe
Inte
rna
tio
na
l In
tern
et
ba
nd
wid
th (
Gb
it/s
)
20042005
20062007
20082009
20102011
20122013
-
20'000
40'000
60'000
80'000
100'000
120'000
140'000
160'000 World
Developed
Developing
Inte
rna
tio
na
l In
tern
et
ba
nd
wid
th (
Gb
it/s
)
20042005
20062007
20082009
20102011
20122013
usage, which differs widely across regions and countries, Chart 1.9 shows bandwidth per Internet user. This indicator has increased significantly between 2004 and 2013. There are huge differences, however, between developed and developing regions, with almost five times as much international bandwidth per user available in the former compared to the latter (106 000 vs 23 000 bit/s per user). Looking at regional differences, Europe stands out by far with around 160 000 bit/s per user in 2013 compared to the global average of 52 000 bit/s per user, followed by the Americas with 54 000 bit/s per user.
Households with Internet accessHousehold access to the Internet is the ultimate way of guaranteeing an inclusive information society in which all people, irrespective of age, gender, employment status, etc. or possible level of disability, can access the Internet within the privacy and proximity of their own home. A policy aimed at universal access to broadband Internet will eventually ensure access for all households nationwide. Household access is also mostly shared access, whereby all family members can use the same service and share the subscription fees.
Chart 1.9: International Internet bandwidth (bit/s) per Internet user, by region, 2004 and 2013
Source: ITU World Telecommunication/ICT Indicators database.
221 420 1'213 702 4'384
11'5728'074
19'03721'472
43'072
53'992
-
10'000
20'000
30'000
40'000
50'000
60'000
70'000
80'000
2004
2013
161'027
Inte
rna
tio
na
l In
tern
et
ba
nd
wid
th
(bit
/s p
er
use
r)
Afric
a
Arab S
tate
s
Asia
&Pac
ific
CIS
The Am
ericas
Europe

11
Measuring the Information Society Report 2014
The latest ITU data show that by end 2014, almost 44 per cent of the world’s households will have Internet access at home, up from 40 per cent one year earlier and 30 per cent four years earlier (Chart 1.10). Household Internet access is growing steadily, and strongly, at 9 per cent over the past year. Global growth is mostly driven by developing countries, where household Internet access is growing at 14 per cent as compared with around 4 per cent in developed countries. By end 2014, 78 per cent of households in developed countries will have Internet access, compared with 31 per cent in developing countries and 5 per cent in LDCs. In absolute terms, the number of households with Internet access in developing countries surpassed those in developed countries in 2013, and doubled between 2010 and 2014.
A comparison across regions reveals huge differences: while 78 per cent of households in Europe have Internet access and numbers are approaching saturation rates (with 2.4 per cent growth in 2014), only 11 per cent of households in Africa have Internet, and growth remains at a high 18.4 per cent, which is more than twice the world average growth rate.
The Asia and the Pacific region boasts the highest number of households with Internet
Chart 1.10: Percentage of households with Internet access, by level of development, 2005-2014 (left) and by region, 2014* (right)
Note: *Estimate.Source: ITU World Telecommunication/ICT Indicators database.
78.0
57.453.0
43.6
36.0 35.9
11.1
0
10
20
30
40
50
60
70
80
%
CIS
access in absolute terms, with close to 350 million estimated by end 2014, i.e. almost as many as in the Americas and Europe combined. However, the large majority of them are in China and India. If we take out these, the two largest countries, the number of households with Internet access in the region amounts to (only) 109 billion. Penetration rates in the Asia and the Pacific region are well below the global average and some two-thirds of the household in the region are not yet connected to the Internet.
As is the case with other indicators, there is a significant urban-rural divide when it comes to household Internet access. In countries where data are available, rural household access falls far below urban household access, with differences ranging from 4 per cent (meaning that household Internet penetration in urban areas is 4 per cent higher than in rural areas) in highly developed countries such as Japan and the Republic of Korea to 35 per cent in developing countries such as Colombia and Morocco. In Guatemala, urban households are 12 times more likely to be connected to the Internet than rural households (Partnership, 2014).8 Available data also show that Internet access in rural households is growing slowly,
78.4
43.6
31.2
5.00
10
20
30
40
50
60
70
80
%
Developed
World
Developing
LDCs

Chapter 1. Recent information society developments
12
much more so than urban access, leading to a widening gap. In low-income countries and LDCs, the differences are presumably even more pronounced, but data are not readily available for those countries. As has been illustrated earlier, network deployment is still limited and affordable services are much less available in rural areas, thus preventing rural households from purchasing Internet services. At the same time, the benefits brought by ICTs
and the Internet are especially impactful in rural areas, which often also lack access to other infrastructure and public services. Therefore, connecting rural households to broadband networks should remain a priority for policy-makers in all countries.
In view of these divides and the low level of household Internet access in rural areas of developing countries, public access to the Internet plays a greater role in those areas. Data on public access is collected by ITU through its household questionnaire, but only few countries report data on this indicator, let alone broken down by urban and rural populations. Public access can be provided by commercial facilities, such as privately operated Internet cafes, as well as community-type facilities, which typically provide Internet access free of charge. Schools also constitute an important location for Internet access, especially in rural areas, although access is often limited to students and teachers and restricted to certain hours (see section 1.5).
Public libraries and post offices can play a major role in terms of providing access to the Internet: they are open to the public, their branches are widespread throughout the country and they constitute an established source of information and communication.
Research has shown that the potential of libraries and post offices to provide public Internet access is currently not yet fully tapped (Partnership, 2014). For example, worldwide, only 10 per cent of post offices provide public access to the Internet, even though 31 per cent of post offices have a broadband Internet connection (Chart 1.11), with major differences across regions (Chart 1.12). These numbers refer to 2012, and have most probably increased somewhat today. Nevertheless, there is huge potential if all post offices were provided with broadband Internet and offered this as a service to the public. According to the Universal Postal Union (UPU), increasing the proportion of post offices offering public Internet access to over 45 per cent would ensure that up to a third of all rural areas and
Chart 1.11: Proportion of post offices providing public Internet access and post offices with broadband Internet access, 2012, by level of development
Note: Simple averages.Source: UPU.
59
29
21
9
31
10
0
10
20
30
40
50
60
70
Proportion of post offices with
broadband Internet access
Proportion of post offices
providing public Internet access
%
Developed countries
Developing countries
World
Chart 1.12: Proportion of post offices providing public Internet access, by region, 2005-2007 vs 2010-2012
Note: Simple averages.Source: UPU.
0 5 10 15 20
Americas
Africa
Europe
Asia
Oceania
%
2010–12
2005–07

13
Measuring the Information Society Report 2014
small towns had access to the Internet, while with 60 per cent coverage half of all rural areas would be connected.9
The World Report series published by the International Federation of Library Associations and Institutions Committee on Freedom of Access to Information and Freedom of Expression (IFLA/FAIFE) contains information about the extent and growth of public access to the Internet in public libraries from 2007 to 2009.10 While the results point to improvements in providing public Internet access in public libraries, progress has not been visible everywhere. Significant differences exist between developed and developing countries in terms of the provision of public Internet access, and there are still a number of countries reporting low rates of public access.
1.4 Revenue and investment in the telecommunication sector
In 2012, total telecommunication revenue stagnated at around USD 1.88 trillion, or 2.7 per cent of world GDP (Chart 1.13).
After the slump experienced during the financial crisis in 2008-2009, in developed countries the sector saw some signs of recovery in 2011, with a growth in revenues of 5 per cent, but returned to negative growth in 2012 (-2 per cent). The evolution of telecommunication revenues in developed countries follows the overall pattern of their economies as a whole (in the European Union, for instance, GDP increased in 2011 and decreased in 2012)11 suggesting that there is a link between a country’s economic situation and consumer spending on telecommunication services. In addition to the adverse economic context, the voice market in developed countries is declining or reaching saturation; and the developments observed in broadband markets are taking place in competitive environments, thus also exerting pressure on the revenues generated by the strongest growing market segments, such as mobile broadband.
In contrast to the situation in the developed world, developing countries saw a 4 per cent growth in telecommunication revenues in 2012, hence mitigating the global decrease in revenues experienced in 2012. This confirms the steady progress of telecommunication revenues seen
Chart 1.13: Telecommunication revenues, world and by level of development, 2007-2012, total in USD (left) and annual growth (right)
Note: ‘World’ includes 103 countries accounting for 96 per cent of world GDP. ‘Developed’ includes 40 developed countries accounting for 99 per cent of total GDP in the developed world. ‘Developing’ includes 63 developing countries accounting for 89 per cent of total GDP in the developing world.
Source: ITU.
1 678'1 785'
1 724' 1 777'1 885' 1 881'
1 236'1 301'
1 243' 1 243'1 302' 1 277'
442 484 482 534 582 604
0
200
400
600
800
1 000'
1 200'
1 400'
1 600'
1'800
2'000
2007 2008 2009 2010 2011 2012
World
Developed
Developing
Bill
ion U
SD
%
-6
-4
-2
0
2
4
6
8
10
12
2007-08
2008-09
2009-10 2010-11
2011-12
Developed
World
Developing

Chapter 1. Recent information society developments
14
in developing countries in the period 2007-2012 (6 per cent compound annual growth rate), except for a slight dip in 2008, which coincided with the most turbulent period of the global financial crisis. As a result, the developing countries’ share of total telecommunication revenues increased from 26 per cent in 2007 to 32 per cent in 2012, thus approaching their share in global GDP, which amounts to 36 per cent. This testifies to the growing importance of the telecommunication sector in the economic growth of the developing world. For example, in the recent revision of Nigeria’s GDP, it was found that the telecommunication industry accounted for more than a quarter of the upgrade in GDP.12 Despite the progress seen in several developing countries, there remains huge untapped potential in the 4 billion people not yet online in the developing world.
Chart 1.14 shows the evolution of investment in telecommunications, which is fundamental to supporting ICT uptake and innovation. In 2012, investment grew by 4 per cent to USD 307 billion globally. Despite the progression seen in global investment since 2010 (6 per cent compound annual growth rate), the 2008 investment levels have not been restored.
The recovery of investment levels has been hampered by the situation in developed countries, where the downturn experienced in 2008 was strongest (-16 per cent) and the reduction in telecommunication investment persisted in 2009 (-2 per cent). The overall economic environment of restricted access to capital markets and the efforts of some operators to reduce debt exposure explain the sluggish investment levels seen in 2011 and particularly in 2012.13
In developing countries, investment in telecommunication infrastructure and services has been more stable, with a smaller drop in 2008 (-4 per cent) and moderate growth in the following years (4 per cent compound annual growth rate between 2009 and 2012). This led to the 2008 investment levels being restored by 2011, and an all-time high of USD 121 billion at end 2012. The developing countries’ share of total investment was almost 40 per cent in 2012, which is relatively high compared with the share of global telecommunication revenues generated in developing countries (32 per cent).
The investment-to-revenue ratio in the telecommunication sector stood at 17 per
Chart 1.14: Annual investment by telecommunication operators, world and by level of development, 2007-2012, total in USD (left) and annual growth (right)
Note: ‘World’ includes countries accounting for 91 per cent of world GDP. ‘Developed’ includes 35 developed countries accounting for 98 per cent of total GDP in the developed world. ‘Developing’ includes 45 developing countries accounting for 80 per cent of total GDP in the developing world.
Source: ITU.
287
312
276 276296
307
195 202
169 165180 186
92111 107 110 117 121
0
50
100
150
200
250
300
350
2007 2008 2009 2010 2011 2012
World
Developed
Developing
Bill
ion U
SD
-20
-15
-10
-5
0
5
10
15
20
25
2007-08
2008-09
2009-10 2010-11 2011-12
Developed
World
Developing
%

15
Measuring the Information Society Report 2014
cent in 2012. This means that, on average, for each USD 100 generated globally by telecommunication services, USD 17 were reinvested in capital expenditure (i.e. in upgrading the fixed assets needed to extend and improve telecommunication services). The investment-to-revenue ratio was somewhat lower in developed countries (15 per cent) than in developing countries (22 per cent). In other words, the investments made in developing countries were larger relative to the revenues they generated. This may be explained by two factors. On the one hand, telecommunications is a capital-intensive industry and part of the capital investments are delivered by global equipment providers, resulting in only limited investment cost reductions across countries.14 On the other hand, revenue per user in several developing countries is constrained by low income levels, which limit the margin for revenue growth.15 These constraints call for innovative approaches in the developing world, such as for instance public-private partnerships, in order to provide incentives for operators to make the investments necessary to bridge the infrastructure gap between developing and developed countries.
1.5 Use of ICTs
Internet usersITU estimates that, by end 2014, almost 3 billion people will be using the Internet, corresponding to a global penetration rate of 40.4 per cent (Chart 1.15). This compares to 2.7 billion people and 38 per cent penetration a year earlier, and 2 billion people and 30 per cent penetration four years earlier. The numbers also show that there are still 4.3 billion people worldwide who are not yet using the Internet, 90 per cent of whom live in the developing world. While more than three out of four people are online in the developed countries, one out of three is online in the developing world.
Nevertheless, Internet usage is growing steadily, at 6.6 per cent in 2014 – 3.3 per cent in developed countries and 8.7 per cent in developing countries. Indeed, in developing countries, the number of Internet users will have doubled in five years (2009-2014), and two-thirds of today’s Internet users live in the developing world. Growth rates are highest in LDCs (13 per cent in 2014), but they are starting from low
Chart 1.15: Individuals using the Internet, by level of development, 2005-2014 (left) and by region, 2014* (right)
Note: *Estimate.Source: ITU World Telecommunication/ICT Indicators database.
78.3
40.4
32.4
8.0
%
0
10
20
30
40
50
60
70
80
90
100 Developed
World
Developing
LDCs
74.8
65.5
55.9
40.6 40.4
32.4
19.0
0
10
20
30
40
50
60
70
80
%
CIS

Chapter 1. Recent information society developments
16
values: by end 2014, only an estimated 8 per cent of the population in LDCs will be online.
Internet usage varies considerably across regions. In Europe, Internet usage on average is approaching saturation levels, with almost 75 per cent penetration and low growth of 2.3 per cent during the past year. In Africa, the region with the lowest Internet penetration rate (19 per cent), Internet usage is growing strongly at 13 per cent, and almost twice as many people will be online by the end of this year compared with only four years earlier.
The Asia and the Pacific region includes the two most populous countries, China and India. Therefore, it comes as no surprise that 45 per cent of the world’s Internet users live in this region. The two countries combined are home to around 860 million Internet users, almost 30 per cent of the world’s total and 66 per cent of Internet users in the Asia-Pacific region. Penetration rates in the two countries differ greatly, though, reflecting their overall differences in income and other development indicators: while the percentage of Internet users in China is 46 per cent, it is only 18 per cent in India.
Internet usage in the Americas region is relatively high: with almost 66 per cent penetration,
it is much higher than household Internet access (57 per cent). This suggests that shared household access as well as access outside the home is more common in the region. A similar situation can be observed in Africa, with 19 per cent Internet penetration compared with 11 per cent of households with Internet access. In view of infrastructure limitations and a lack of affordable services, people are more likely to use the Internet at locations outside the home, such as at work, school or public access facilities.
Internet content and use of social mediaThe growth in Internet users has witnessed a parallel, steep growth in the volume of Internet content. More and more people are actively participating in the information society by creating, sharing and uploading content and using social media and other Internet-based applications, covering a large range of topics and sectors. While measuring online content and website use is a challenging task on account of the sheer volume of information available, an attempt to do so has been made by the Partnership on Measuring ICT for Development in its final review of achievement of the WSIS targets, which includes an assessment of Internet content (Partnership, 2014). Some key findings featured in the report are presented below.
Over the past decade, the number of websites has been growing at exponential rates and, according to estimates by Netcraft, there were over 850 million hostnames and approximately 185 million active sites at the beginning of 2014. Google remains the leading search engine in most countries, and accounts for around 90 per cent of the search market.16 The number of daily Google searches reached almost 6 billion by end 2013 (Chart 1.16) and the total number of searches made through Google in 2013 exceeded 2 trillion.
Social media sites have become the most accessed websites by users in both developed
Chart 1.16: Growth in daily Google searches, 2007-2013
Source: Partnership (2014), based on http://www.statisticbrain.com/google-searches/.
0 2'000 4'000 6'000 8'000
2013
2012
2011
2010
2009
2008
2007
Millions of searches

17
Measuring the Information Society Report 2014
and developing countries. Since its creation in 2004, Facebook has grown to comprise 1.3 billion active users by end 2013, a growth of 22 per cent over the past year (Chart 1.17), although a single user could be operating several accounts and therefore the numbers do not represent unique Internet users (ITU, 2011). Twitter, the leading international microblogging service, founded in 2007, has grown to comprise 646 million active registered users by end 2013 (and 115 million active monthly users), and some 58 million tweets were posted daily in the past year.17 The Chinese microblog service Tencent Weibo accounts for a further 507 million subscribers, out of an estimated 582 million Chinese Internet subscribers (Partnership, 2014).
More than 6 billion hours of video are being watched each month and more than 100 hours of video content are uploaded every minute on YouTube, the leading international video-filesharing site with services in 61 countries. As of early 2014, YouTube boasted more than 1 billion unique visitors monthly.
Other top popular websites include Amazon, Wikipedia and LinkedIn as well as various news and online e-market sites at the national level (see below on e-business). Wikipedia, the largest and most widely used online encyclopaedia, featured more than 30 million articles by end 2013 (Chart 1.18). Articles are now available in 287 languages across 30 million pages of content. By February 2014, Wikipedia registered more than 20 billion page views per month by Internet users. At the same time, the proportion of articles in English has decreased significantly – from 46 per cent in 2003 to 15 per cent in 2013 – while those in other languages have increased accordingly, although pages viewed are still predominantly in English and the proportion of contributors writing in English is more than 50 per cent.
While these numbers illustrate the huge increase in Internet content and usage overall, a more nuanced analysis needs to be carried out to identify digital divides. Table 1.2 shows that, for
example, domain-name registrations are still dominated by content providers in developed countries, which account for over 80 per cent in 2013. Domain-name registrations from Africa account for less than 1 per cent. The data include both global top-level domain (gTLD) and country code top-level domain (ccTLD) registrations, and there are comparability issues related to registries across countries. Nevertheless, they offer an indication of the amount of online
Chart 1.17: Growth in Facebook monthly active users, 2004-2013 (millions of users)
Source: Partnership (2014), based on http://www.theguardian.com/news/datablog/2014/feb/04/ Facebook-in-numbers-statistics, accessed 6 March 2014. Data sourced from Facebook.
0 500 1'000 1'500
2013
2012
2011
2010
2009
2008
2007
2006
2005
2004
Millions of users
Chart 1.18: Wikipedia articles – total and English language, 2003-2013 (thousands of articles)
Source: Wikipedia statistics at http://stats.wikimedia.org/EN/TablesArticlesTotal.htm.
0
5'000
10 000'
15 000'
20 000'
25 000'
30 000'
35 000'Total
English

Chapter 1. Recent information society developments
18
content generated by countries and regions and highlight the differences.
E-businessPrivate-sector enterprises are early adopters of ICTs, and are driving the information economy across the globe by providing online services and content, engaging in e-business at both the wholesale and retail levels, and transforming entire business sectors and creating new value chains through the use of ICTs. The diffusion of ICTs in the economy has been found to facilitate macroeconomic performance and business growth by increasing labour productivity, enlarging enterprises’ market reach, saving costs and driving innovation (Partnership, 2014).
International data on ICT access and use by enterprises are collected annually by the United Nations Conference on Trade and Development (UNCTAD), but availability is limited apart from the European region where countries carry out annual surveys on the use of ICTs in enterprises (compiled by Eurostat). The latest results show that in Europe Internet access in enterprises stood at 95 per cent in 2012 (up from 94 per cent a year earlier) and appears to have reached
saturation levels. Internet access varied from 79 per cent in Romania to 100 per cent in Finland, Lithuania and the Netherlands. The proportion of businesses with websites was lower, accounting on average for 71 per cent and ranging from 36 per cent in Romania to 91 per cent in Finland.
In addition to regular business functions carried out over electronic networks, a recent Eurostat survey revealed that more and more enterprises are making use of social media. In 2013, around 30 per cent of European enterprises used social media, ranging from 15 per cent of enterprises in Latvia to 55 per cent in Malta.18 Activities are mostly related to social networks (e.g. Facebook), followed by multimedia content sharing websites (e.g. YouTube) and blogs (e.g. Twitter).
In the developing world, data on ICTs in enterprises are scarce and only collected by few countries. The proportion of businesses with Internet access varies between 48 per cent in Azerbaijan and 97 per cent in Lebanon.19 Of these, not all have broadband access, which is essential to enable businesses to engage in, and take full advantage of, the potential of e-business (Chart 1.19). In addition, Internet access differs enormously according to the size and location of the enterprise – small and
Table 1.2: Total Internet domain registrations by world region, 2003, 2008 and 2013
Source: Partnership (2014). Data supplied by ZookNIC, compiled from ccTLD and other sources. Figures exclude fifteen ccTLDs which act as virtual gTLDs.
2003 2008 2013
Millions % Millions % Millions %
World 59.7 100.0 173.4 100.0 245.2 100.0
Developed 49.6 82.9 135.9 78.4 197.4 80.5
Developing 7.1 11.8 34.7 20.0 45.0 18.4
Other/Unknown 3.1 5.2 2.8 1.6 2.7 1.1
Africa 0.3 0.5 1.0 0.6 2.3 0.9
Americas 23.9 40.1 71.8 41.4 98.9 40.4
Asia 5.3 8.9 29.8 17.2 36.9 15.0
Europe 25.8 43.3 63.7 36.8 98.0 40.0
Oceania 1.2 2.1 4.2 2.4 6.4 2.6

19
Measuring the Information Society Report 2014
micro businesses are much less connected than large enterprises, and rural enterprises are less connected than urban enterprises (Partnership, 2014). As has been shown earlier in this chapter, backbone connectivity and international Internet bandwidth is still lacking in many regions of the developing world. Access to high-speed quality broadband services, however, is especially important to the business sector, in the same way as other basic infrastructure and services necessary to run a successful business.
E-government Not only are government entities major users of ICTs, but governments are also increasingly using the Internet to provide services to their citizens. E-government contributes to increased efficiency and greater transparency and accountability in government, reduces cost and improves service delivery.
There is little data on the use of ICTs by government organizations, and those countries that do have data are usually the more advanced ones with high levels of connectivity in general. More information is available about government
services provided online, tracked by the United Nations through its E-government Survey, which is carried out every two years. The latest data show that, today, governments of all countries have established central websites and that more than 50 per cent of countries provide links to local and/or regional government agencies’ sites (UNDESA, 2014). Efforts are still needed to connect lower-tier administrations in countries.
When it comes to the provision of e-services, the results from the latest UN survey show that considerable progress has been made over the past decade. For example, online information and services on government website portals increased threefold, with 70 per cent of countries providing a one-stop shop portal in 2012, as against 26 per cent in 2003. By 2014, all countries had a government web presence, and almost all countries in Europe – and the majority of countries in the Americas and Asia – provided online information on education, health, social welfare, finance and labour. In Africa, 31 per cent of countries provided online information on social welfare and 65 per cent on finance (Partnership, 2014).
Chart 1.19. Fixed-broadband access in enterprises using the Internet, selected countries, 2005-2012
Source: UNCTAD Information Economy Database, 2014 , available at unctadstat.unctad.org.
Perc
enta
ge o
f ente
rprises
92
85
78
72
43
3130
50
1814
0
10
20
30
40
50
60
70
80
90
100
2005 2006 2007 2008 2009 2010 2011 2012
Uruguay
Colombia
Brazil
Singapore
Russian Federation
Palestine
Kyrgyzstan
Egypt
Azerbaijan
Thailand

Chapter 1. Recent information society developments
20
Over the past decade, the UN E-government Development Index (EGDI)20 has been rising in all regions (Chart 1.20), and more and more countries are providing e-government transactional services and e-participation services (Chart 1.21). Despite the major progress made, disparities remain in the use of ICTs in government across countries. As illustrated in Chart 1.20, Europe tops the E-government
Development Index, followed by the Americas and Asia, whereas Oceania and Africa remain below average. In particular, progress in Africa has been slower compared to other regions. This is consistent with the results of the ICT Development Index (IDI) (see Chapter 2), and given that ICT performance and skills levels are also part of the E-government Development Index.
Chart 1.20: E-government Development Index (EGDI), 2003-2014
Source: UNDESA. Data from United Nations E-government Survey (2014).
Chart 1.21: E-government services provided by countries (transactional services, left, and e-participation services, right)
Source: UNDESA. Data from United Nations E-government Survey (2014).
101
73
60
46
44
42
41
40
39
33
29
27
76
0 20 40 60 80 100 120
Create a personal online account
Submit income taxes
Register a business
Apply for social security benefits
Apply for a birth certificate
Pay fines
Pay for utilities
Apply for environmental permits
Apply for a marriage certificate
Register a motor vehicle
Apply for a driver's license
Apply for a personal identity card
Other online services
Number of
countries
0
10
20
30
40
50
60
70
Africa Americas Asia Europe Oceania
Central government portal providing e-participation
policy/mission statement
Central government portal providing information on
e-participation activities
Pe
rce
nta
ge
of
cou
ntr
ies
0
0.1
0.2
0.3
0.4
0.5
0.6
0.7
0.8
2002 2004 2006 2008 2010 2012 2014
Africa
Americas
Asia
Europe
Oceania
World
Linear (Africa)
Linear (Americas)
Linear (Asia)
Linear (Europe)
Linear (Oceania)
Linear (World)
EG
DI

21
Measuring the Information Society Report 2014
Transactional services are relatively advanced services that are increasingly being provided by governments. For example, income-tax forms can be submitted online in 73 countries, registering a business can be carried out online in 60 countries, and people can apply for birth certificates online in 44 countries. Countries in Europe are most advanced when it comes to transactional services and e-participation services (Chart 1.21). While, globally, around 20 per cent of countries provided information to their citizens on national e-participation policies in 2013, in Europe the proportion was nearer to 60 per cent.
ICT use in schoolsProviding schools with Internet access (in particular broadband Internet) is a basic infrastructure requirement in today’s information society. Access to high-speed Internet is necessary to enable students to use the Internet for educational purposes, and helps enhance education administration through the electronic exchange of forms, data and other information. Internet access in schools also achieves cost efficiencies by automating manual tasks and reducing expenses associated with the printing and distribution of textbooks. The benefits are particularly attractive for remote schools, where Internet access provides the vehicle for online learning and access to educational content.21
In addition to the educational benefits resulting from the use of ICTs in schools, in remote and rural areas schools are indeed often the only place where young people can use the Internet (see section 1.3 above). Therefore, they can also play an important role in terms of providing Internet access to people living in unconnected households.
The latest available data from the UNESCO Institute for Statistics (UIS)22 show that, in developed countries, the vast majority of schools have Internet access, to the extent that some countries no longer track this indicator, having
reached 100 per cent connectivity (Chart 1.22). Nevertheless, there are some countries, such as Poland and the Russian Federation, where school connectivity stands at around 80 per cent, compared with 100 per cent in most other developed countries for which data are available.
In developing countries, school access to Internet is lower on average, although much progress has been made in recent years. There are significant differences across countries, even within the same region and with similar income levels. For example, in the Americas region, only 5 per cent of schools in the Dominican Republic had Internet access in 2012, as against 100 per cent on several Caribbean islands. Argentina, Brazil, Costa Rica and Mexico all had less than 50 per cent of schools connected, compared with 78 per cent in Chile and a high of 96 per cent in Uruguay. In Asia, Thailand stands out with almost 100 per cent school connectivity, as does Mongolia, a country with one of the lowest population densities in the region. Bhutan, an LDC, also features relatively high school connectivity, at 43 per cent, much higher than other LDCs such as Bangladesh (5 per cent), Cambodia (7 per cent) or Nepal (5 per cent). In Africa, Mauritius and Tunisia also enjoy very high levels of school connectivity in relation to their income levels.
Chart 1.22 also shows the type of Internet access schools have, in particular the share of fixed-broadband access. In some countries, the proportion of schools with fixed-broadband Internet access (out of all schools with Internet access) is still low, suggesting that, in those countries, many schools have connections at only narrowband speed. However, since the statistics date back a few years, and given the growth of mobile-broadband services, it may be expected that more and more schools will have broadband access in the near future and that the numbers will evolve significantly.
Government policies and projects, sometimes in cooperation with the private sector, can exert a strong impact on the level of connectivity of

Chapter 1. Recent information society developments
22
Chart 1.22: Proportion of schools with Internet access (total and fixed-broadband), 2012 or latest year available
Note: Data on broadband in secondary schools in Bangladesh are not available. Data for Nicaragua, Philippines and Indonesia do not include upper secondary. Data for European countries and Costa Rica refer to lower secondary. Data for Guyana, Nicaragua and Indonesia refer to primary and lower secondary. Data for Cambodia include pre-primary schools. Data for Morocco, Tunisia, Guyana, Montserrat, Dominican Republic, Nicaragua, Colombia, Trinidad and Tobago, Bangladesh, Philippines, Sri Lanka, Azerbaijan, Bhutan, Cambodia, Kazakhstan, Malaysia, Maldives, Singapore, Belarus and the Russian Federation refer to public schools. In Suriname, there are no private schools in upper secondary. Data for Palestine refer to West Bank schools only.
Source: UIS database, Partnership on Measuring ICT for Development WSIS Targets Questionnaire, 2013.
Perc
enta
ge o
f schools
Americas
0
10
20
30
40
50
60
70
80
90
100
Internet
Fixed broadband Internet
Perc
enta
ge o
f schools
0
10
20
30
40
50
60
70
80
90
100 Asia and Africa
Bangl
adesh
Nepal
Kyrg
yzst
an
Cambodia
Philippin
es
Sri L
anka
Azerb
aija
n
Palest
ine
Indonesi
a
Bhutan
Qat
ar
Saudi A
rabia
Jord
an
Turk
ey
Iran I.
R.
Om
an
Mal
aysia
Mongo
lia
Kazak
hstan
Thaila
nd
Japan
Armenia
Georg
ia
Mal
dives
Bahra
in
Brunei D
aruss
alam
China,
Hong
Kong
Korea
(Rep.)
Singa
pore
Ethio
pia
Moro
cco
Sudan
Senega
l
Leso
tho
Botwan
a
Egypt
Algeria
Tunis
ia
Mau
ritiu
s
Perc
enta
ge o
f schools
010
20
30
40
50
60
70
80
90
100Europe and Oceania
Belaru
s
Russia
n Federa
tion
Poland
Alban
ia
Estonia
Hunga
ry
Slova
kia
Finla
nd
Lith
uania
Andorra
Bosnia
& H
erzego
vina
Croat
ia
Czech
Rep.
Mal
ta
Sweden
Unite
d Kin
gdom
Austria
Belgiu
m
Cypru
s
Denm
ark
Latv
ia
Norw
ay
Spai
n
Austra
lia

23
Measuring the Information Society Report 2014
schools, and explain some of the differences across countries. In Uruguay, the El Ceibal initiative has driven ICT usage in schools, in partnership with the One Laptop per Child (OLCP) project. Similarly, in Chile, the Enlaces initiative, which partners with the private sector, has been very effective in improving Internet access in schools, resulting in 78 per cent of schools being connected to the Internet in 2013, compared to just 44 per cent in 2009 (Partnership, 2014). Finally, Thailand’s SchoolNet programme, which was implemented from 1996 to 2003 and was followed by the EdNet programme, contributed significantly to increasing Internet access in schools nationwide, and the country’s more recent One Tablet per Child (OTPC) initiative has helped increase the learner-to-computer ratio in schools.
Internet connectivity in schools also depends on the development of the national telecommunication infrastructure and on whether service providers have reached out to rural and sometimes geographically difficult areas with low population density (Partnership, 2014). As discussed earlier in this chapter, rural areas often suffer from much lower network coverage and hence ICT uptake compared with urban areas.
While connecting schools to the Internet and other ICTs is essential in order to foster e-education, it is equally important to look at how the technologies are used for educational purposes by both teachers and students. In some cases, computers have been introduced in schools without Internet access, which effectively
Chart 1.23: Proportion of ICT-qualified teachers versus proportion of teachers trained to teach subjects using ICTs, by region, 2009-2012
Note: Data for Philippines refer to primary and lower secondary. Data for Venezuela refer to primary only. Data for Montserrat and Saint Lucia refer to secondary only. Data for Palestine refer to West Bank schools only. Data for Bahrain, Belarus, Morocco and Tunisia refer to 2008. For Morocco, ICT-qualified teachers figures refer to 2008. Data for Azerbaijan, Barbados, Jordan, Saint Lucia, Singapore, Trinidad and Tobago, Uruguay, Philippines and Sri Lanka refer to public schools only.
Source: UIS database, Partnership Questionnaire on WSIS Indicators, 2014.
Proportion of teachers trained to teach basic computer skills (or computing) (%)
Pro
port
ion o
f te
achers
tra
ined to teach s
ubje
cts
usin
g IC
T (
%)
Anguilla
Argentina
Azerbaijan
Bahrain
Barbados
Belarus
Cayman Islands
Chile
Montserrat
Cuba
Egypt
Jordan
Lithuania
MalaysiaChina, Hong Kong
Morocco
Nauru
Oman
Palestine
Qatar
Saint Kitts and Nevis
Saint Lucia
St Vincent and the Grenadines
Singapore
Thailand
Trinidad and Tobago
Tunisia
Turks and Caicos Isl.
Uruguay
Colombia
Philippines
Sri LankaVenezuela
0
10
20
30
40
50
60
70
80
90
100
0 10 20 30 40 50 60 70 80 90 100
Asia
Europe
Africa
Americas

Chapter 1. Recent information society developments
24
limits their use and impact. In other cases, a lack of qualified ICT teachers and of teachers that have been trained to use ICTs to teach their subjects hampers the development of students’ ICT skills and limits the educational impact that ICTs can make.
Available data collected by UIS at the international level shows that education systems in countries seem to put more emphasis on training teachers to teach subjects using ICTs than on training teachers to teach basic computer skills or computing (i.e. ICT-qualified teachers) (Chart 1.23). In most of the countries included in the chart, the proportion of ICT-qualified teachers is below 10 per cent, while a few countries have very high proportions of ICT-qualified teachers (e.g. Thailand, Singapore). It should also be noted that definitions of “ICT-qualified teachers” differ among countries, where in some cases a formal degree is required and in other cases nationally defined certificates are sufficient (Partnership, 2014).
1.6 Emerging ICT measurement issues
Determining and monitoring global ICT goals and targetsThe year 2015 is imminent. It will mark the target date of the Millennium Development Goals (MDGs) set in 2000, which include, under MDG 8, the ICT-specific Target 8F: “In cooperation with the private sector, make available benefits of new technologies, especially information and communications”. Likewise, 2015 will mark the date for the targets set by the World Summit on the Information Society (WSIS) and by the Broadband Commission for Digital Development.23
Accordingly, the process of discussing and determining the post-2015 development
agenda, and setting new sustainable development goals (SDGs) for the next decade or so, will culminate in 2014. The United Nations Open Working Group (OWG) on SDGs concluded its work in July 2014. Its final report is expected to be submitted to the President of the United Nations General Assembly (UNGA) and the UN Secretary-General by August 2014. The final proposal will then be considered by UNGA at its session in September 2014.24
In order to ensure measurability, the official statistical community provided support in the design of the SDGs and the post-2015 development agenda. In March 2014, the Chair of the United Nations Statistical Commission (UNSC) submitted an input document to OWG comprising 29 statistical notes, providing measurement information on the 29 issues discussed during the group’s first eight sessions. The inputs were prepared in cooperation with the UNSC Friends of the Chair (FOC) group on broader measures of progress, which has been tasked with facilitating and providing support to the ongoing process towards a post-2015 development agenda in order to ensure that a robust statistical measurement approach is incorporated from the outset.25 International organizations, including ITU, contributed to the preparation of the statistical notes. An additional five sessions of OWG followed until July 2014, during which 19 focus areas and eight clusters were identified.
The group’s 13th and final session concluded with a proposal for a set of 17 sustainable development goals (SDGs) and 169 targets, which were forwarded to the UN General Assembly for consideration in the post-2015 development agenda that is to be adopted in late 2015. Several of the proposed goals include targets which refer to technology and specifically ICTs, such as providing affordable Internet access in LDCs and enhancing the use of ICTs to promote women’s empowerment. The document also includes two targets on data and monitoring and stresses the “need to take urgent
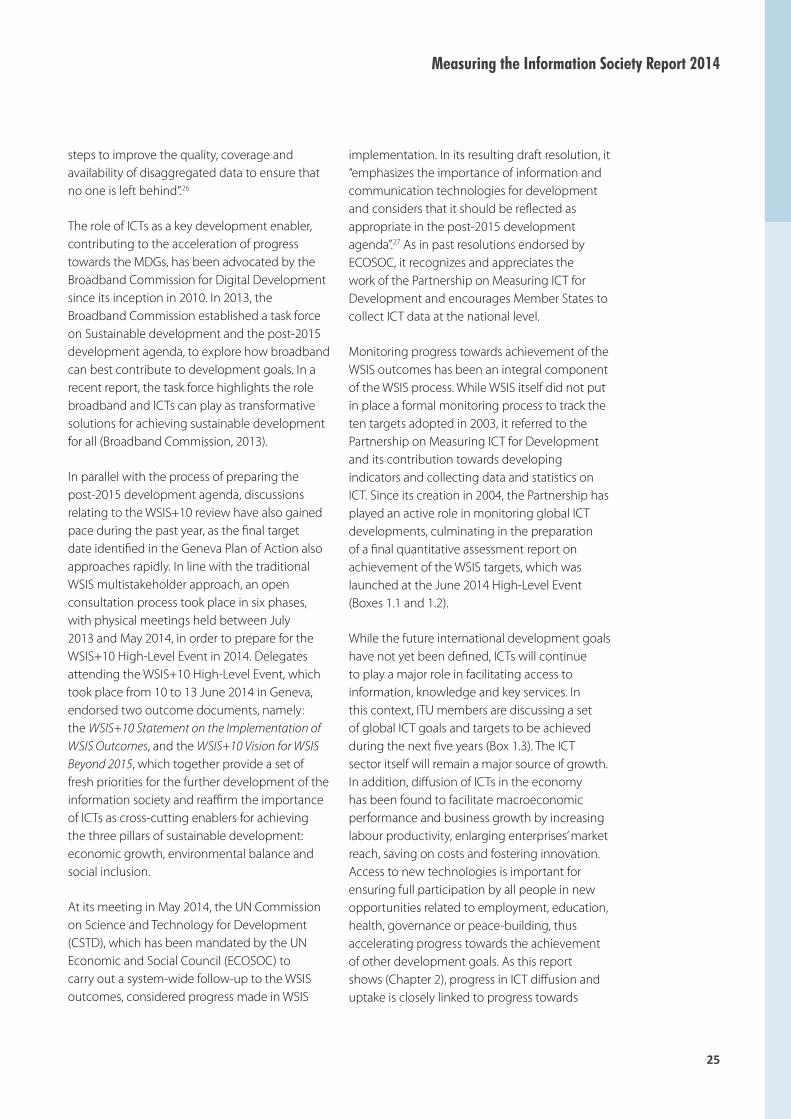
25
Measuring the Information Society Report 2014
steps to improve the quality, coverage and availability of disaggregated data to ensure that no one is left behind”.26
The role of ICTs as a key development enabler, contributing to the acceleration of progress towards the MDGs, has been advocated by the Broadband Commission for Digital Development since its inception in 2010. In 2013, the Broadband Commission established a task force on Sustainable development and the post-2015 development agenda, to explore how broadband can best contribute to development goals. In a recent report, the task force highlights the role broadband and ICTs can play as transformative solutions for achieving sustainable development for all (Broadband Commission, 2013).
In parallel with the process of preparing the post-2015 development agenda, discussions relating to the WSIS+10 review have also gained pace during the past year, as the final target date identified in the Geneva Plan of Action also approaches rapidly. In line with the traditional WSIS multistakeholder approach, an open consultation process took place in six phases, with physical meetings held between July 2013 and May 2014, in order to prepare for the WSIS+10 High-Level Event in 2014. Delegates attending the WSIS+10 High-Level Event, which took place from 10 to 13 June 2014 in Geneva, endorsed two outcome documents, namely: the WSIS+10 Statement on the Implementation of WSIS Outcomes, and the WSIS+10 Vision for WSIS Beyond 2015, which together provide a set of fresh priorities for the further development of the information society and reaffirm the importance of ICTs as cross-cutting enablers for achieving the three pillars of sustainable development: economic growth, environmental balance and social inclusion.
At its meeting in May 2014, the UN Commission on Science and Technology for Development (CSTD), which has been mandated by the UN Economic and Social Council (ECOSOC) to carry out a system-wide follow-up to the WSIS outcomes, considered progress made in WSIS
implementation. In its resulting draft resolution, it “emphasizes the importance of information and communication technologies for development and considers that it should be reflected as appropriate in the post-2015 development agenda”.27 As in past resolutions endorsed by ECOSOC, it recognizes and appreciates the work of the Partnership on Measuring ICT for Development and encourages Member States to collect ICT data at the national level.
Monitoring progress towards achievement of the WSIS outcomes has been an integral component of the WSIS process. While WSIS itself did not put in place a formal monitoring process to track the ten targets adopted in 2003, it referred to the Partnership on Measuring ICT for Development and its contribution towards developing indicators and collecting data and statistics on ICT. Since its creation in 2004, the Partnership has played an active role in monitoring global ICT developments, culminating in the preparation of a final quantitative assessment report on achievement of the WSIS targets, which was launched at the June 2014 High-Level Event (Boxes 1.1 and 1.2).
While the future international development goals have not yet been defined, ICTs will continue to play a major role in facilitating access to information, knowledge and key services. In this context, ITU members are discussing a set of global ICT goals and targets to be achieved during the next five years (Box 1.3). The ICT sector itself will remain a major source of growth. In addition, diffusion of ICTs in the economy has been found to facilitate macroeconomic performance and business growth by increasing labour productivity, enlarging enterprises’ market reach, saving on costs and fostering innovation. Access to new technologies is important for ensuring full participation by all people in new opportunities related to employment, education, health, governance or peace-building, thus accelerating progress towards the achievement of other development goals. As this report shows (Chapter 2), progress in ICT diffusion and uptake is closely linked to progress towards

Chapter 1. Recent information society developments
26
Box 1.1: Final review of the WSIS targets: Achievements, challenges and the way forward
Delegates attending the WSIS+10 High-Level Event, held in June 2014 in Geneva, took stock of the achievements made since the two phases of WSIS (2003 and 2005), and endorsed two major outcome documents, namely: the WSIS+10 Statement on the Implementation of WSIS Outcomes, and the WSIS+10 Vision for WSIS Beyond 2015.
As a key contribution to this process, the Partnership on Measuring ICT for Development prepared a major ten-year quantitative assessment report, entitled Final review of the WSIS targets: Achievements, challenges and the way forward, which reviews progress made towards the achievement of the ten WSIS targets set out in the WSIS Geneva Plan of Action in 2003 (Partnership, 2014). For each target, the report reviews the indicators identified to measure the target, reports on progress made on the target since 2003, proposes new measurement priorities for future discussions related to the target and makes recommendations on how those priorities could be met.
The report also includes a discussion on the post-2015 development agenda, highlights the importance of ICT for development, considers lessons learnt from the WSIS monitoring process and places the WSIS targets in the context of the post-2015 development agenda. This includes a discussion of possible goals, targets and indicators for the post-2015 period.
Since its inception in 2004, shortly after the conclusion of the first phase of WSIS, the Partnership has played a key role in monitoring progress towards achievement of the WSIS outcomes, goals and targets. Its methodological work has contributed significantly to the collection of solid evidence on ICT developments worldwide, based on internationally comparable statistical indicators (see Box 1.2).
In 2010, several partners contributed to the preparation of a mid-term review of the WSIS targets (ITU, 2010). Subsequently, the Partnership launched a new task group, which developed a set of indicators to measure the ten WSIS targets. In 2011, it released the publication Measuring the WSIS targets. A statistical framework, which has become the main reference document for the WSIS+10 quantitative review. The final 2014 review report was prepared by the task group and coordinated by ITU. To this end, a questionnaire was sent to all countries in 2013, to collect national-level data on the indicators identified to measure the WSIS targets. The results of the survey are featured in the report, along with other data sources.
The Final review of the WSIS targets: Achievements, challenges and the way forward report is available at: http://www.itu.int/en/ITU-D/Statistics/Pages/publications/wsistargets2014.aspx.
achieving other MDGs, such as those related to poverty reduction, maternal health or decent employment.
As more and more people join the information society and high-speed communication networks become an indispensable infrastructure, the tracking and measurement of ICT developments become even more relevant. Continuous monitoring and measurement of ICT developments will help to identify progress and gaps, and will guide policies to ensure equal access, use and impact in respect of ICTs.
Using different data sources and big data analytics An important element in the discussion related to the post-2015 development agenda and the setting of measurable goals and targets has
been the need to take a fresh look at the way data and statistics are collected, analysed and disseminated, in view of the large data gaps prevailing in many developing countries in basic statistics in the areas of the economy, health, education, labour, etc., all of which are crucial to monitoring the MDGs, and the future SDGs. This call for a “data revolution” was first enunciated in the report to the UN Secretary-General of the High-Level Panel of Eminent Persons on the Post-2015 Development Agenda published in 2013 (see Box 1.4 on the data revolution). Since then, it has received considerable attention within the statistical community, as well as in other circles concerned with the lack of official statistics and development data.
According to the discussions, a data revolution considers new data sources, in addition to existing official sources: besides governments, other stakeholders such as the private sector, civil

27
Measuring the Information Society Report 2014
Box 1.2: A decade of successful international cooperation on ICT measurement
In 2004, ICT measurement was still in its infancy, with little attention paid to collecting official ICT statistics outside the member countries of the Organisation for Economic Co-operation and Development (OECD), with the exception of telecommunication statistics which have been collected by ITU for decades. In the wake of WSIS, and with the increasing focus on the opportunities offered by ICTs to developing countries, calls surfaced for reliable and comparable data in order to take stock of the emerging information society, identify digital divides and measure the developmental impacts of ICTs. In this context, the Partnership on Measuring ICT for Development was launched during the UNCTAD XI conference in June 2014, with the main objective of enhancing the availability of comparable international ICT statistics, particularly in developing countries. Initiated by UNCTAD, ITU and OECD, its membership has grown rapidly and today encompasses 13 international and regional organizations. Each member contributes to the work of the Partnership within its specific mandate and competence. A unique feature of the Partnership is that it is entirely based on voluntary contributions by its members. With a loose governance structure and no institutionalized secretariat or dedicated budget, partners have devoted time and resources in order to advance the ICT measurement agenda globally, regionally and nationally.
Ten years on, ICTs have transformed the global society and economy and the Partnership has contributed significantly to monitoring and tracking those changes, by developing new indicators and standards, providing technical assistance
to developing countries and providing a forum for countries and statistical experts to discuss ICT measurement. Today, the Partnership is internationally recognized as the authoritative forum for advancing ICT measurement based on official statistics. Since its inception, ICT statistics have been a regular item on the agenda of the UN Statistical Commission (UNSC) and the Partnership has reported to UNSC on progress in its work in 2005, 2007, 2009, 2010, 2012 and 2014. Its core list of 57 ICT indicators, covering many aspects of the information society and economy, is widely used by countries in the course of their national ICT data collection. The methodological work developed by the Partnership has contributed significantly to the collection of evidence on ICT developments worldwide, based on internationally comparable statistical indicators. The work of the Partnership has also been acknowledged in ECOSOC resolutions in 2008, 2009, 2011, 2012 and 2013,28 in the context of assessing progress made in the implementation of the WSIS outcomes.
Data availability has also increased significantly over the past decade. In particular, there are more comparable data on ICT infrastructure, household access and Internet users. For example, at the beginning of the century, only around a dozen developing countries collected data on Internet users, while today there are almost 50 developing countries collecting this indicator through official surveys (Chart Box 1.2). Data on household access to the Internet or a computer are now being collected by more than 100 economies worldwide, and data on Internet use in businesses by almost 70 countries, although not on a regular basis (Partnership UNSC 2011). Similarly, whereas no data were available on ICT access and use in schools, they have now started to be compiled in many developing countries (see section 1.5).
At the same time, major data gaps remain, in particular in developing countries and LDCs. This concerns, notably, statistics on ICT use by individuals, businesses, governments and other public-sector organizations, ICT-related employment data, as well as data related to online security and cybercrime, gender and youth, and cultural and environmental aspects. The growing information society will increasingly require more and better statistics to assess the social, economic and environmental impacts of ICTs. The Partnership, in close collaboration with national statistical systems and the international donor community, will continue its efforts to address these challenges.
Chart Box 1.2: Number of countries collecting Internet user data through official surveys, by level of development
Note: Chart shows countries that have collected data on the number of Internet users through official national surveys. Data are presented in three-year intervals and include countries that have collected data for at least one year within those intervals.
Source: ITU.
0 211
24
36
49
1 3
27
3741
40
15
38
61
77
89
0
20
40
60
80
100
Developing
Developed
World
1997
1998-00
2001-03
2007-09
2004-06
2010-12
(and b
efore
)

Chapter 1. Recent information society developments
28
Box 1.3: Strategic targets for the future information society
As part of its strategic plan for 2016-2019, the ITU membership has been discussing a number of post-2015 global ICT goals and a set of measurable targets that would help monitor and track progress towards achieving those goals over the next five years,
until 202029 (see Table Box 1.3). The proposed set of goals and targets are expected to be finalized at the ITU Plenipotentiary Conference which will take place in Busan, Republic of Korea, from 20 October to 7 November 2014.
Table Box 1.3: ITU goals and targets for 2020 (under discussion)
Goal 1. Growth – Enable and foster access to and increased use of telecommunications/ICTs
Target 1.1: Worldwide, 55% of households should have access to the Internet by 2020Target 1.2: Worldwide, 60% of individuals should be using the Internet by 2020Target 1.3: Worldwide, telecommunication/ICTs should be 40% more affordable by 2020a
Goal 2. Inclusiveness – Bridge the digital divide and provide broadband for allb
Target 2.1.A: In the developing world, 50% of households should have access to the Internet by 2020Target 2.1.B: In the least developed countries (LDCs), 15% of households should have access to the Internet by 2020Target 2.2.A: In the developing world, 50% of individuals should be using the Internet by 2020Target 2.2.B: In the least developed countries (LDCs), 20% of individuals should be using the Internet by 2020Target 2.3.A: The affordability gap between developed and developing countries should be reduced by 40% by 2020Target 2.3.B: Broadband services should cost no more than 5% of average monthly income in developing countries by 2020Target 2.4: Worldwide, 90% of the rural population should be covered by broadband services by 2020c
Target 2.5.A: Gender equality among Internet users should be reached by 2020Target 2.5.B: Enabling environments ensuring accessible telecommunications/ICTs for persons with disabilities should be established in all countries by 2020
Goal 3. Sustainability – Manage challenges resulting from telecommunication/ICT development
Target 3.1: Cybersecurity readiness should be improved by 40% by 2020d
Target 3.2: Volume of redundant e-waste to be reduced by 50% by 2020Target 3.3: Greenhouse gas emissions generated by the telecommunication/ICT sector to be decreased per device by 30% by 2020
Goal 4. Innovation and partnership – Lead, shape and adapt to the changing telecommunication/ICT environment
Target 4.1: Telecommunication/ICT environment conducive to innovationTarget 4.2: Effective partnerships of stakeholders in the telecommunication/ICT environment
society and international organizations should be involved. New data sources could include big data (mostly provided by private-sector companies) which could help “improve the timeliness and completeness of data, without compromising the relevance, impartiality and methodological soundness of the statistics” (UNSC, 2014).
The topic of big data is gaining momentum in the statistical community. Chief statisticians gathering at the UNSC meetings in 2013 recognized that “big data constitute a source of
information that cannot be ignored by official statisticians” and that “official statisticians must organize and take urgent action to exploit the possibilities and harness the challenges effectively” (UNSC, 2014).30 In view of declining responses to national household and business surveys in a number of countries, big data could provide important sources of more timely and relevant information, thus complementing official statistics on the economy, society and environment. Furthermore, administrative records, which are used widely by official
Note: aCost of ICT services to be 60 per cent of the 2012 value. bExisting and additional targets for Goal 2 are being reviewed and adjusted, based on contributions from Member States. c Due to data limitations, currently mobile-broadband signal coverage is considering in determining this target. d Data being compiled by the Global Cybersecurity Index (GCI).
Source: ITU.

29
Measuring the Information Society Report 2014
statisticians, could be explored further, thus potentially becoming big data sources as well.
At the UNSC meeting in 2014, the commission reiterated its call for the global statistical community to take action, and supported the proposal to create a global working group on the use of big data for official statistics. The commission requested the group to include the following in its work programme:31
• To make an inventory of ongoing activities and concrete examples regarding the use of big data for official statistics at regional, subregional and national levels
• To address the concerns of methodology, standards and norms, human resources, research, training, quality, volatility and, with priority, confidentiality, access to data and legislation related to big data
• To address the issue of obtaining “access at no cost” to big data from the private sector for official statistical purposes, as well as the issue of access to transborder data or access to data on transboundary phenomena
• To develop guidelines to classify the various types of big data sources and approaches
• To develop methodological guidelines related to big data, including guidelines for all the legal aspects
• To formulate an adequate communication strategy for data providers and users on the issue of use of big data for official statistics
• To reach out to other communities, especially those more experienced in IT issues or in the use of open data platforms.
The UN Global Working Group on Big Data for Official Statistics was formally launched in June 2014, under the auspices of the UN Statistics
Division. The mandate of the group, of which ITU is a member, includes: provide strategic vision, direction and coordination of a global programme on big data for official statistics; promote practical use of sources of big data for official statistics; provide solutions for methodological, legal and privacy issues; promote capacity building; foster communication and advocacy of the use of big data for policy applications; and build public trust in the use of private-sector big data for official statistics.
ICTs are part of the debate on the data revolution, big data and, more broadly, emerging data issues in the post-2015 development debate. First, the ICT sector in itself represents a new source of data, provided by, for example, Internet and telecommunication companies. Second, the spread and use of ICTs allow public and private entities across all economic sectors to produce, store and analyse huge amounts of data. At the same time, however, monitoring access to and use of ICTs by people, public entities and private enterprises will be essential in order to identify the extent to which stakeholders in the ICT sector can be used as an alternative data source. Without ICTs, no ICT-driven data revolution will take place.
In view of the link between big data and ICTs, work is under way in ITU with a view to contributing to the debate and identifying new ways and means of exploiting the potential of big data. The focus is primarily on the telecommunication/ICT sector as a source of big data, including players such as operators and service providers, in the fixed, mobile and Internet sectors. Delegates attending the eleventh World Telecommunication/ICT Indicators Symposium (WTIS) in Mexico City in December 2014 recommended that ITU should further examine the challenges and opportunities of big data, in particular data coming from ICT companies; that regulatory authorities should explore the development of guidelines on how big data could be produced, exploited and stored; and that national statistical offices, in cooperation with other relevant agencies, should look into the opportunities for big data and address current challenges in terms of big data quality,

Chapter 1. Recent information society developments
30
veracity and privacy within the framework of the
fundamental principles of official statistics.33
The big data approach taken by ITU so far
focuses on the following areas and questions:
Standardization:34
• Which standards are required to facilitate
interoperability and allow technology
integration in the big data value chain?
• Which definitions, taxonomies, secure
architectures and technology roadmaps
need to be developed for big data
analytics and technology infrastructures?
• What is the relationship between cloud
computing and big data in view of
security frameworks?
• Which techniques are needed for data
anonymization for aggregated datasets
such as mobile-phone records?
• How is big data exploited in different
industries; what are the specific
challenges faced; and how can these
challenges be addressed through
international standards?
Regulation:35
• What are the key regulatory issues at stake
and how can and should big data be
regulated?
• How does big data impact on the
regulation of privacy, copyright and
intellectual property rights (IPR),
transparency and digital security issues?
Box 1.4: What is a data revolution?
The report of the High-Level Panel of Eminent Persons on the Post-2015 Development Agenda to the UN Secretary-General, which was published in May 2013, has called for, inter alia, a data revolution taking advantage of new technology and improved connectivity: “We also call for a data revolution for sustainable development, with a new international initiative to improve the quality of statistics and information available to people and governments.”
This has prompted a “revolution” in the debates taking place in the statistical communities at both the international and national levels on what such a data revolution could entail and how it could be implemented. While no internationally agreed concept has thus far been defined, the following elements seem to be part of a data revolution:32
• In view of the ubiquitous availability of communication networks, the use of new information technologies (e.g. mobile technologies) should be leveraged for improving the collection and dissemination of data
• Data should be further disaggregated (by gender, income, age, geography, etc.) to ensure that no one is
left out; in this regard, traditional statistical processes should be made more efficient
• Sustained investment in national statistical capacity, both technical and institutional, is essential and needs to receive a major push from the international donor community
• The focus should go beyond data dissemination and also include investment in the development of concepts, measurement frameworks, classifications and standards
• New, non-traditional data sources should be explored and leveraged to complement existing ones and satisfy the demand for data needs in new areas, such as big data, geospatial information and geographical information systems
• Open data policies should be envisaged to ensure accountability and promote transparency
• The role of data, statistics and monitoring for policy-making and decision-making should be increased.

31
Measuring the Information Society Report 2014
• What is the link between big data and open data (crowdsourcing, cloud computing, etc.)?
• Is there a need to regulate data management and service providers?
• How can market dominance in the area of big data be prevented and the rights of the data owners protected?
ICT data collection and analysis:
• How can big data complement existing ICT statistics to better monitor information-society developments?
• Which type of data from ICT companies are most useful and for which purposes?
• Which new ICT indicators could be produced from big data sources?
• What are the key issues that need to be addressed, and by whom, in terms of collecting and disseminating big data in telecommunications?
• What is the role of national statistical offices and how can big data complement official ICT data?
• How can big data from telecommunications inform not only ICT but broader development policy in real time, leading to prompt and more effective action?
Chapter 5 of this report addresses some of these questions and provides suggestions and recommendations for the way forward.

Chapter 1. Recent information society developments
32
1 Refers to countries where fixed-telephone penetration increased by more than 1 per cent in 2014.
2 See https://gsmaintelligence.com/.
3 http://www.censusindia.gov.in/2011census/hlo/Data_sheet/India/Communication.pdf.
4 4G refers to fourth-generation mobile network or service. It is a mobile-broadband standard offering both mobility and very high bandwidth, such as long-term evolution (LTE) networks (ITU Trends 2014).
5 Data collection on Europe and North America will follow in 2014.
6 For a list of IXPs, see for instance http://www.datacentermap.com/ixps.html.
7 For more details on international submarine fibre-optic links, see TeleGeography’s Submarine Cable Map 2014, available at: http://submarine-cable-map-2014.telegeography.com.
8 For further discussion on progress made towards connecting rural households to the Internet, see Partnership (2014), Chapter on Target 1.
9 Universal Postal Union (forthcoming 2014). Development strategies for the postal sector: An economic perspective.
10 See http://www.ifla.org/faife/world-report.
11 Source: IMF World Economic Outlook Database, April 2014.
12 Source: The Economist, April 12 2014, “Nigeria’s GDP step change”.
13 Telefónica, for instance, reduced its net debt by EUR 4 819 million in 2012 after several years of sustained increases in borrowings. Source: Telefónica Financial Report 2012, p. 18, available at: http://annualreport2012.telefonica.com/pdf/FINANCIERO_2012_ENG.pdf.
14 For example, the cost of buying a mobile cell tower in Europe and in Africa may not be very different, because only a limited group of large global equipment vendors can deliver it, and equipment is usually traded in USD. On-site set-up expenditure may however differ because of varying labour costs across countries and regions, but that is only a part of the total CAPEX of telecommunication operators.
15 For instance, the average revenue per user per month for GSM services in India was less than USD 2 in March 2012, almost unchanged from March 2011. Source: TRAI Annual Report 2011-12, p.2, available at: http://www.trai.gov.in/WriteReadData/Miscelleneus/Document/201301150318386780062Annual%20Report%20English%202012.pdf.
16 Exceptions include China, Russian Federation, Japan and Republic of Korea.
17 http://www.statisticbrain.com/twitter-statistics/.
18 Eurostat news release of 16 December 2013 and http://epp.eurostat.ec.europa.eu/statistics_explained/index.php/Social_media_-_statistics_on_the_use_by_enterprises.
19 Data refer mostly to the year 2011.
20 The UN E-government Development Index is a composite benchmarking indicator based on a direct assessment of the state of national online services, telecommunication infrastructure and human capital in all countries. See http://unpan3.un.org/egovkb/global_reports/index.htm.
21 See ITU Connect a School, Connect a Community Toolkit of Best Practices and Policy Advice, available at: http://connectaschool.org/itu-module-list.
22 See Partnership (2014), Chapter on Target 2.
23 For further information, see http://www.itu.int/wsis/index.html and http://www.broadbandcommission.org.
24 Information on the post-2015 development agenda process is available at: http://sustainabledevelopment.un.org/index.php?menu=1561.
25 See http://unstats.un.org/unsd/broaderprogress/progress.html.
26 “Outcome Document – Open Working Group on Sustainable Development Goals”, available at http://sustainabledevelopment.un.org/focussdgs.html.
27 Available at: http://unctad.org/meetings/en/SessionalDocuments/CSTD_2014_DraftRes_WSIS.pdf.
28 See ECOSOC Resolutions 2008/3, 2009/7, 2011/16, 2012/5 and 2013/9.
29 The ITU strategic goals are under discussion and have to be examined and approved by the 2014 ITU Plenipotentiary Conference.
Endnotes

33
Measuring the Information Society Report 2014
30 E/CN.3/2014/11
31 E/2014/24 and E/CN.3/2014/35 (UNSC Report on the 45th session, 4-7 March 2014).
32 UNSC Friends of the Chair (FOC) Group on Broader Measures of Progress, in its report to UNSC, highlighted a number of elements that should be part of a data revolution.
33 See final report of WTIS-13, available at: http://www.itu.int/en/ITU-D/Statistics/Pages/events/wtis2013/default.aspx.
34 For further information on the work on big data carried out by the ITU Telecommunication Standardization Bureau (TSB), see http://www.itu.int/en/ITU-T/techwatch/Pages/big-data-standards.aspx.
35 A background document on big data that was prepared for GSR-14 is available at http://www.itu.int/en/ITU-D/Conferences/GSR/Pages/gsr2014/default.aspx.


35
Measuring the Information Society Report 2014
Chapter 2. The ICT Development Index (IDI)
2.1 Introduction to the IDI1
The ICT Development Index (IDI) is a composite index combining 11 indicators into one benchmark measure that serves to monitor and compare developments in information and communication technology (ICT) across countries. The IDI was developed by ITU in 2008 and first presented in the 2009 edition of Measuring the Information Society (ITU, 2009). It was produced in response to ITU Member States’ request to develop an ICT index and publish it regularly. This section briefly describes the main objectives, conceptual framework and methodology of the IDI.
The main objectives of the IDI are to measure:
• the level and evolution over time of ICT developments in countries and relative to other countries;
• progress in ICT development in both developed and developing countries: the index should be global and reflect changes taking place in countries at different levels of ICT development;
• the digital divide, i.e. differences between countries in terms of their levels of ICT development;
• the development potential of ICTs or the extent to which countries can make use of ICTs to enhance growth and development, based on available capabilities and skills.
Conceptual frameworkThe recognition that ICTs can be a development enabler, if applied and used appropriately, is critical to countries that are moving towards information or knowledge-based societies, and is central to the IDI’s conceptual framework. The ICT development process, and a country’s transformation to becoming an information society, can be depicted using the following three-stage model (Figure 2.1):
• Stage 1: ICT readiness (reflecting the level of networked infrastructure and access to ICTs);
• Stage 2: ICT intensity (reflecting the level of use of ICTs in the society);

Chapter 2. The ICT Development Index (IDI)
36
• Stage 3: ICT impact (reflecting the result/outcome of efficient and effective ICT use).
Advancing through these stages depends on a combination of three factors: the availability of ICT infrastructure and access, a high level of ICT usage and the capability to use ICTs effectively. Accordingly, the first two stages listed above correspond to two major components of the IDI: ICT access and ICT use.
Reaching the final stage, and maximizing the impact of ICTs, crucially depends on the third component of the IDI: ICT skills. ICT (and other) skills determine the effective use that is made of ICTs, and are critical to leveraging the full potential of ICTs for socio-economic development. Economic growth and development will remain below potential if economies are not capable of exploiting new technologies and reaping their benefits. Therefore, the IDI includes a measurement of the capability to use ICTs effectively.
A single indicator cannot track progress in all three components (access, usage and skills) of the ICT development process, and it is thus necessary to construct a composite index such
Figure 2.1: Three stages in the evolution towards an information society
Source: ITU.
ICT Development Index
ICT Readiness (infrastructure,
access)
ICT Impact
(outcomes)
ICT Use
(intensity)
ICT Capability
(skills)
as the IDI. The IDI aims to capture the evolution of the information society as it goes through its different stages of development, taking into consideration technology convergence and the emergence of new technologies.
Based on this conceptual framework, the IDI is divided into the following three sub-indices:
• Access sub-index: This sub-index captures ICT readiness, and includes five infrastructure and access indicators (fixed-telephone subscriptions, mobile-cellular telephone subscriptions, international Internet bandwidth per Internet user, households with a computer, and households with Internet access).
• Use sub-index: This sub-index captures ICT intensity, and includes three ICT intensity and usage indicators (individuals using the Internet, fixed (wired)-broadband subscriptions, and wireless-broadband subscriptions).
• Skills sub-index: This sub-index captures ICT capability or skills as indispensable input indicators. It includes three proxy
37
Measuring the Information Society Report 2014
indicators (adult literacy, gross secondary enrolment, and gross tertiary enrolment), and is therefore given less weight in the computation of the IDI compared with the other two sub-indices.2
The choice of indicators included in the sub-indices reflects the corresponding stage of transformation to the information society. Therefore, the indicators in each sub-index may change over time to reflect technological developments related to ICTs, and as more and better data become available. For example, what was considered basic infrastructure in the past – such as fixed-telephone lines – is fast becoming less relevant in the light of increasing fixed-mobile substitution. Similarly, broadband is currently considered an advanced technology, characterizing intense Internet use, and is therefore included in stage 2 (as an indicator in the use sub-index). However, in the future it may come to be seen as essential and be moved to stage 1 (as an indicator in the access sub-index), while another, new technology may appear in stage 2.
MethodologyThe IDI includes 11 indicators. A detailed definition of each indicator is provided in Annex 1.
The indicators used to calculate the IDI were selected on the basis of the following criteria:
• The relevance of a particular indicator for contributing to the main objectives and conceptual framework of the IDI. For example, the selected indicators need to be relevant to both developed and developing countries, and should reflect – as much as possible – the framework’s three components described above.
• Data availability and quality. Data are required for a large number of countries, as the IDI is a global index. There is relative paucity of ICT-related data, especially on
ICT usage, in the majority of developing countries. In particular, the three indicators included in the skills sub-index should be considered as proxies until data directly relating to ICT skills become available for more countries.
• The results of various statistical analyses. The statistical associations between various indicators were examined, and principal components analysis (PCA) was used to examine the underlying nature of the data and to explore whether the different dimensions are statistically well-balanced.
While the basic methodology has remained the same since the IDI was first published, minor adjustments are being made each year.
Given the dynamic nature of the ICT sector and related data availability, the indicators included in the IDI and its sub-indices are under regular discussion in ITU, in consultation with experts. Indicator definitions and the IDI methodology are discussed in the ITU Expert Group on Telecommunication/ICT Indicators (EGTI) and the ITU Expert Group on ICT Household Indicators (EGH) (Box 2.1).
The 2014 edition of the IDI reflects updates to indicator definitions and reference values agreed upon during the 2013 meetings of EGTI and EGH.
The definitions of the following core indicators of the Partnership on Measuring ICT for Development included in the IDI were revised at a meeting of EGH held in Brazil in June 2013.3
• Percentage of individuals using the Internet: The suggested reference period for latest Internet usage was changed from the last twelve months to the last three months. The twelve-month period is still used by some countries, but most already apply the period of three months, considering that Internet usage is now sufficiently frequent that the majority of users will be captured with the shorter time-frame.

Chapter 2. The ICT Development Index (IDI)
38
Box 2.1: ITU discussion forums on ICT statistics
Much of ITU’s work in the area of indicator definitions and
statistical methodologies is carried out through its two expert
groups: the Expert Group on Telecommunication/ICT Indicators
(EGTI) and the Expert Group on ICT Household Indicators (EGH).
Created in 2009 and 2012, respectively, these two expert groups
revise and review ITU’s supply-side and demand-side statistics,
and discuss methodological issues and new indicators. Both
groups, which are open to all ITU members and to experts in the
field of ICT statistics and data collection, work through online
discussion forums and annual face-to-face meetings. They
periodically report back to the World Telecommunication/ICT
Indicators Symposium (WTIS), ITU’s main forum on ICT statistics.
In 2011, EGTI opened a discussion item on the IDI on its online forum, and members were invited to provide suggestions on how to improve the IDI methodology. It has been a standing item on the EGTI forum since then. In 2013, EGH revised the Partnership on Measuring ICT for Development core list of ICT indicators, and subsequently updated the ITU Manual for Measuring ICT Access and Use by Households and Individuals (ITU, 2014), which includes the revision of some of the indicators on ICT household access and individual use of ICT included in the IDI.4
Interested experts are invited to join the EGTI and/or the EGH discussion forum to share experiences, contribute to the discussions and participate in the decision-making process.
• Percentage of households with a computer: The definition of computer was revised to include tablet or similar handheld computers in addition to desktop and laptop computers, so as to reflect the uptake of these devices.
• The definition of household access was refined so that, in order for a household to have access to ICT equipment or services, the equipment/service should generally be available for use by all members of the household at any time, regardless of whether it is actually used. ICT equipment may or may not be owned by the household.5
Apart from the revisions to indicator definitions presented above, the revised Manual for Measuring ICT Access and Use by Households and Individuals underlines the importance of surveying the entire population, and suggests an age scope of 5 years old and above for individual usage questions. The updated definitions are expected to be adopted by an increasing number of countries in their upcoming household surveys.
The fourth EGTI meeting, held in Mexico City in December 2013, agreed that the reference values for the indicators international Internet bandwidth per Internet user and mobile-cellular subscriptions
per 100 inhabitants would be reviewed. For international Internet bandwidth per Internet user, the methodology used in previous IDI calculations was kept, as there is no limit to the maximum value that could be achieved by a country. The reference value employed for this indicator is used to screen outlier values. There were three economies that were identified as outliers, namely Hong Kong (China), Luxembourg and Malta.
The reference value for mobile-cellular subscriptions was lowered to 120. This value was derived from examining the distribution of countries based on their mobile-cellular subscriptions per 100 inhabitants in 2013. In order to determine the reference value, prepaid and postpaid mobile markets were examined separately, with the former making up the majority of cases. Of all countries included in the IDI, some 57 per cent have more than 80 per cent prepaid subscriptions. For those countries, a mobile-cellular penetration of 120 per cent is the maximum value that was reached by the largest group of countries (23 countries with a mobile-cellular penetration between 110 and 120 per cent), while in countries where postpaid is the predominant mode of subscriptions 120 is also the maximum value achieved. It was therefore concluded that 120 is the ideal value that a country could reach irrespective of the type of mobile subscription that is predominant.
39
Measuring the Information Society Report 2014
ITU estimates that, by end 2014, the number of mobile-cellular subscriptions will have reached close to 7 billion, which almost corresponds to the figure for the world’s population. Multi-SIM ownership is driving up mobile-cellular subscription numbers, which is an issue in prepaid and, to a lesser extent, also in postpaid mobile markets. No fewer than 104 economies of the 166 included in the IDI have passed the 100 per cent mobile-cellular penetration mark.
In order to improve the measure of mobile-cellular uptake, one possibility would be to replace the subscription-based (supply-side) data with data based on national household surveys (demand-side indicators). An indicator such as the percentage of individuals using a mobile-cellular telephone (which ITU collects through its household survey questionnaire) might therefore provide a more accurate picture of the actual uptake, use and distribution of mobile-cellular services. While the number of countries that collect this information is increasing steadily, still only 42 countries reported these data to ITU for at least one year between 2011 and 2013. It is therefore too early to substitute the current mobile-cellular subscription data in the IDI with mobile-phone user data. In view of the methodological difficulties in collecting harmonized data on international Internet bandwidth, a review of the definition of the indicator is currently under discussion in EGTI.
The IDI was computed using the same methodology as in the past, applying the following steps (Figure 2.2 and Annex 1):
• Preparation of the complete data set. This step includes filling in missing values using various statistical techniques.
• Normalization of data. This is necessary in order to transform the values of the IDI indicators into the same unit of measurement. The chosen normalization method was the distance to a reference value (or goalpost). The reference values
were either 100 or obtained through a statistical procedure.
• Rescaling of data. The data were rescaled on a scale from 0 to 10 in order to compare the values of the indicators and the sub-indices.
• Weighting of indicators and sub-indices. The indicator weights were chosen based on the principal components analysis (PCA) results. The access and use sub-indices were given equal weight (40 per cent each). The skills sub-index was given less weight (20 per cent), since it is based on proxy indicators.
This chapter presents the IDI based on data from 2013 in comparison with 2012. It should be noted that IDI 2012 values have changed from those published in the previous edition of this report as a result of:
• Country data revisions. As more accurate data become available, countries provide ITU with revised statistics for previous years, which have been taken into consideration. This also allows ITU to identify inconsistencies and revise previous estimates.
• Revision of the reference value for the indicator mobile-cellular subscriptions per 100 inhabitants. The change in reference value for this indicator affects the IDI value.
• Revision of the definitions of the indicators percentage of individuals using the Internet (changing the reference period to the last three months) and percentage of households with a computer (updating the definition of computer to include tablet and similar handheld computers – but excluding smartphones).
• Differences among countries included in the IDI. The calculation of the IDI ranking

Chapter 2. The ICT Development Index (IDI)
40
ICT access Reference value (%)
1. Fixed-telephone subscriptions per 100 inhabitants
2. Mobile-cellular telephone subscriptions per 100 inhabitants
3. International Internet bandwidth (bit/s) per Internet user
4. Percentage of households with a computer
5. Percentage of households with Internet access
60
120
787’260*
100
100
20
20
20
20
20
ICT use Reference value (%)
6. Percentage of individuals using the Internet
7. Fixed (wired)-broadband subscriptions per 100 inhab.itants
8. Wireless-broadband subscriptions per 100 inhabitants
100
60
100
33
33
33
ICT skills Reference value (%)
9. Adult literacy rate
10. Secondary gross enrolment ratio
11. Tertiary gross enrolment ratio
100
100
100
33
33
33
ICT
Development
Index
40
40
20
Figure 2.2: ICT Development Index: indicators, reference values and weights
Note: * This corresponds to a log value of 5.90, which was used in the normalization step. Source: ITU.
depends on the values of the other countries included. In each new edition, some countries are excluded and others added based on data availability. Overall, this version of the IDI includes 166 countries/economies as compared with 157 in last year’s edition.
The remainder of the chapter is structured as follows. Section 2.2 presents the IDI results at the global level. It highlights the group of top performers, as well as the most dynamic countries as reflected by their changes in IDI rank from 2012 to 2013.
Section 2.3 analyses the global digital divide by looking at the IDI results by level of development as well as by groups of countries with different IDI levels.
Section 2.4 explores the relationship between countries’ population size and geography and IDI performance.
Section 2.5 highlights the development potential of ICTs, by analysing the relationship between IDI performance and achievement of the Millennium Development Goals (MDGs), as well as progress made towards the World Summit on the Information Society (WSIS) targets.

41
Measuring the Information Society Report 2014
2.2 Global IDI analysis
The results of the IDI 2013 show that levels of ICT development are very different across the globe. IDI values range from as low as 0.96 in the Central African Republic to a high of 8.86 in Denmark (within a possible (theoretical) range of 0 to 10). The 2013 edition of the IDI includes a total of 166 countries (Table 2.1), with an average IDI value of 4.77, up from 4.60 in 2012. Nearly all countries, at the top as well as at the bottom, increased their IDI values between 2012 and 2013, underlining the continued increase in access to and use of ICTs.
Comparing the access and use sub-indices of the IDI, it is the use sub-index which exhibits the most significant disparities between countries. Use sub-index values have the highest standard deviation (StDev) and coefficient of variation (CV), which measure the variation or dispersion of values from the average. The use sub-index also displays the widest range and the lowest average value (3.19). The minimum value is only 0.03 (in Eritrea). All this points to the fact that extremely low levels of, and important differences in, ICT adoption persist in 2013. However, it is the use sub-index that registered the strongest increase from 2012 to 2013 on average (+0.32), making it the most dynamic sub-index, a trend that is observed even in most of the countries with low IDI values. The access sub-index records the highest average value (5.41), while having a lower range and coefficient of variation than the use sub-index. This suggests
that, generally, countries have reached a higher level of ICT readiness, which is yet to translate into intensified usage of ICTs in many countries.
Top IDI countriesThe IDI 2013 is headed by Denmark (with an IDI value of 8.86), replacing long-time front runner the Republic of Korea as the country with the highest IDI value in 2013. The Republic of Korea comes in a very close second, with an IDI value of 8.85. The remaining top ten IDI countries are predominantly European (Sweden, Iceland, United Kingdom, Norway, Netherlands, Finland and Luxembourg) and include an additional economy from Asia and the Pacific (Hong Kong, China) (Table 2.2). Differences in IDI value between the top performers are very small. A mere 0.50 difference in IDI value separates first-placed Denmark from tenth-placed Luxembourg. In particular, second-placed Republic of Korea is just 0.01 points behind Denmark. There was very little movement in the top ten of the IDI 2013, Hong Kong (China) being the only new entrant. This reflects the high level of ICT development that the countries at the top have achieved and sustained: all top ten countries have an IDI value of more than eight. Among the top performers, the United Kingdom is the country with the highest increase in rank, moving up from seventh position in 2012 to fifth in 2013.
The top 30 of the IDI 2013 includes mostly countries from Europe, a number of high-income
Table 2.1: IDI values and changes, 2012 and 2013
Note: *Simple averages. StDev= Standard deviation, CV= Coefficient of variation.Source: ITU.
IDI 2013 IDI 2012 Change in average value
2012-2013Average value* Min. Max. Range StDev CV Average
value* Min. Max. Range StDev CV
IDI 4.77 0.96 8.86 7.90 2.22 46.44 4.60 0.93 8.81 7.87 2.19 47.61 0.20
Access sub-index 5.41 1.27 9.46 8.18 2.24 41.39 5.27 1.22 9.40 8.18 2.26 42.93 0.18
Use sub-index 3.19 0.03 8.71 8.68 2.44 76.45 2.90 0.03 8.47 8.44 2.36 81.33 0.32
Skills sub-index 6.66 1.10 9.90 8.80 2.15 32.28 6.66 1.10 9.90 8.80 2.15 32.30 0.01

Chapter 2. The ICT Development Index (IDI)
42
Table 2.2: ICT Development Index (IDI), 2012 and 2013
Economy Rank 2013 IDI 2013 Rank 2012 IDI 2012 Economy Rank 2013 IDI 2013 Rank 2012 IDI 2012Denmark 1 8.86 2 8.78 Albania 84 4.72 85 4.42Korea (Rep.) 2 8.85 1 8.81 Maldives 85 4.71 82 4.50Sweden 3 8.67 3 8.68 China 86 4.64 86 4.39Iceland 4 8.64 4 8.58 Jordan 87 4.62 84 4.48United Kingdom 5 8.50 7 8.28 Ecuador 88 4.56 88 4.28Norway 6 8.39 6 8.35 Egypt 89 4.45 87 4.28Netherlands 7 8.38 5 8.36 South Africa 90 4.42 89 4.19Finland 8 8.31 8 8.27 Fiji 91 4.40 103 3.90Hong Kong, China 9 8.28 11 8.08 Mongolia 92 4.32 90 4.19Luxembourg 10 8.26 9 8.19 Cape Verde 93 4.30 104 3.86Japan 11 8.22 10 8.15 Iran (I.R.) 94 4.29 97 4.02Australia 12 8.18 12 8.03 Mexico 95 4.29 94 4.07Switzerland 13 8.11 13 7.94 Morocco 96 4.27 92 4.09United States 14 8.02 14 7.90 Jamaica 97 4.26 98 4.01Monaco 15 7.93 17 7.72 Suriname 98 4.26 93 4.08Singapore 16 7.90 15 7.85 Tunisia 99 4.23 96 4.07Germany 17 7.90 18 7.72 Palestine 100 4.16 95 4.07France 18 7.87 16 7.73 Viet Nam 101 4.09 99 3.94New Zealand 19 7.82 19 7.62 Dominican Rep. 102 4.06 105 3.78Andorra 20 7.73 24 7.41 Philippines 103 4.02 102 3.91Estonia 21 7.68 21 7.54 Botswana 104 4.01 100 3.94Macao, China 22 7.66 20 7.59 Peru 105 4.00 101 3.92Canada 23 7.62 25 7.37 Indonesia 106 3.83 106 3.70Austria 24 7.62 23 7.46 Bolivia 107 3.78 109 3.52Belgium 25 7.57 26 7.33 Kyrgyzstan 108 3.78 107 3.69Ireland 26 7.57 22 7.48 Paraguay 109 3.71 108 3.56Bahrain 27 7.40 28 7.22 El Salvador 110 3.61 110 3.47Spain 28 7.38 29 7.14 Guyana 111 3.48 111 3.44Israel 29 7.29 27 7.25 Syria 112 3.46 112 3.39Malta 30 7.25 30 7.08 Ghana 113 3.46 115 3.29Slovenia 31 7.13 31 6.96 Algeria 114 3.42 114 3.30United Arab Emirates 32 7.03 46 6.27 Uzbekistan 115 3.40 116 3.27Latvia 33 7.03 33 6.84 Sri Lanka 116 3.36 113 3.31Qatar 34 7.01 42 6.46 Namibia 117 3.24 118 3.08Barbados 35 6.95 32 6.87 Guatemala 118 3.20 117 3.11Italy 36 6.94 36 6.66 Honduras 119 3.18 119 3.01Croatia 37 6.90 34 6.70 Nicaragua 120 2.96 120 2.78Belarus 38 6.89 43 6.45 Zimbabwe 121 2.89 123 2.68Greece 39 6.85 35 6.70 Sudan 122 2.88 121 2.69Lithuania 40 6.74 40 6.50 Bhutan 123 2.85 126 2.58Czech Republic 41 6.72 38 6.57 Kenya 124 2.79 124 2.62Russian Federation 42 6.70 41 6.48 Cuba 125 2.77 122 2.69Portugal 43 6.67 39 6.57 Gabon 126 2.66 125 2.61Poland 44 6.60 37 6.63 Cambodia 127 2.61 127 2.54Slovakia 45 6.58 45 6.30 Swaziland 128 2.60 128 2.43Hungary 46 6.52 44 6.35 India 129 2.53 129 2.42Saudi Arabia 47 6.36 50 6.01 Senegal 130 2.46 133 2.20Uruguay 48 6.32 51 5.92 Nepal 131 2.37 134 2.20Bulgaria 49 6.31 47 6.12 Lesotho 132 2.36 131 2.22Serbia 50 6.24 49 6.07 Nigeria 133 2.35 135 2.14Cyprus 51 6.11 48 6.09 Lao P.D.R. 134 2.35 130 2.25Oman 52 6.10 61 5.43 Gambia 135 2.31 136 2.12Kazakhstan 53 6.08 53 5.80 Solomon Islands 136 2.29 132 2.22St. Kitts and Nevis 54 6.01 52 5.89 Congo (Rep.) 137 2.24 137 2.09Costa Rica 55 5.92 55 5.64 Yemen 138 2.18 138 2.07Chile 56 5.92 54 5.68 Angola 139 2.17 139 2.06Antigua & Barbuda 57 5.89 59 5.49 Cameroon 140 2.10 142 1.98Romania 58 5.83 58 5.52 Djibouti 141 2.08 140 2.01Argentina 59 5.80 56 5.58 Pakistan 142 2.05 141 2.01TFYR Macedonia 60 5.77 62 5.42 Mali 143 2.04 147 1.86Moldova 61 5.72 60 5.44 Zambia 144 2.02 143 1.97Lebanon 62 5.71 64 5.32 Bangladesh 145 1.97 146 1.90Montenegro 63 5.67 57 5.52 Uganda 146 1.94 144 1.90Azerbaijan 64 5.65 65 5.22 Mauritania 147 1.91 145 1.90Brazil 65 5.50 67 5.16 Rwanda 148 1.86 151 1.74Brunei Darussalam 66 5.43 63 5.36 Benin 149 1.84 149 1.75Trinidad & Tobago 67 5.29 70 4.99 Myanmar 150 1.82 148 1.75Turkey 68 5.29 68 5.12 Côte d'Ivoire 151 1.80 150 1.74Bosnia and Herzegovina 69 5.23 74 4.89 Tanzania 152 1.76 152 1.72Mauritius 70 5.22 72 4.96 Liberia 153 1.70 154 1.57Malaysia 71 5.20 66 5.18 Guinea-Bissau 154 1.67 153 1.60St. Vincent and the Gren. 72 5.17 69 5.04 Afghanistan 155 1.67 155 1.57Ukraine 73 5.15 71 4.97 Burkina Faso 156 1.56 160 1.35Armenia 74 5.08 73 4.89 Congo (Dem. Rep.) 157 1.56 157 1.47Seychelles 75 4.97 76 4.70 Malawi 158 1.52 156 1.50Grenada 76 4.96 75 4.83 Mozambique 159 1.52 159 1.40Colombia 77 4.95 80 4.61 Madagascar 160 1.42 158 1.43Georgia 78 4.86 83 4.48 Guinea 161 1.42 161 1.31St. Lucia 79 4.81 79 4.66 Ethiopia 162 1.31 162 1.24Venezuela 80 4.81 78 4.68 Eritrea 163 1.20 163 1.18Thailand 81 4.76 91 4.09 Chad 164 1.11 164 1.09Panama 82 4.75 77 4.69 Niger 165 1.03 165 0.97Dominica 83 4.72 81 4.58 Central African Rep. 166 0.96 166 0.93
Source: ITU.

43
Measuring the Information Society Report 2014
Table 2.3: IDI access sub-index, 2012 and 2013
Economy Rank 2013 Access 2013 Rank 2012 Access 2012 Economy Rank 2013 Access 2013 Rank 2012 Access 2012Luxembourg 1 9.46 1 9.40 Jordan 84 5.47 81 5.43Switzerland 2 9.36 3 9.30 Colombia 85 5.44 86 5.08Iceland 3 9.28 2 9.31 Suriname 86 5.38 87 5.05Hong Kong, China 4 9.24 4 9.16 Venezuela 87 5.36 84 5.23Germany 5 9.19 7 8.99 Ecuador 88 5.16 89 4.89United Kingdom 6 9.18 5 9.10 China 89 5.10 91 4.78Malta 7 8.98 10 8.88 Egypt 90 5.09 88 4.99Korea (Rep.) 8 8.94 9 8.91 Thailand 91 4.88 92 4.71Sweden 9 8.93 6 9.02 South Africa 92 4.82 94 4.66Netherlands 10 8.93 8 8.95 Mexico 93 4.80 97 4.54Denmark 11 8.80 11 8.83 Mongolia 94 4.79 90 4.78France 12 8.65 13 8.52 Palestine 95 4.77 93 4.67Singapore 13 8.61 12 8.53 El Salvador 96 4.76 95 4.61Japan 14 8.40 15 8.26 Albania 97 4.62 101 4.42Norway 15 8.36 14 8.33 Fiji 98 4.60 100 4.44Israel 16 8.31 18 8.21 Jamaica 99 4.58 99 4.46Monaco 17 8.31 20 8.19 Tunisia 100 4.56 96 4.56Austria 18 8.28 16 8.23 Cape Verde 101 4.55 108 4.19Belgium 19 8.26 19 8.20 Peru 102 4.54 102 4.41Ireland 20 8.24 17 8.22 Syria 103 4.50 98 4.47Australia 21 8.23 21 8.14 Paraguay 104 4.49 104 4.36Qatar 22 8.09 28 7.80 Viet Nam 105 4.48 103 4.39Canada 23 8.01 22 8.04 Ghana 106 4.47 106 4.30Slovenia 24 7.91 26 7.84 Algeria 107 4.46 107 4.22Macao, China 25 7.88 24 7.90 Guatemala 108 4.35 105 4.32Barbados 26 7.86 25 7.89 Indonesia 109 4.32 109 4.19Andorra 27 7.84 30 7.69 Philippines 110 4.30 110 4.17Estonia 28 7.82 33 7.67 Dominican Rep. 111 4.15 114 3.97Finland 29 7.80 27 7.80 Bolivia 112 4.11 116 3.85New Zealand 30 7.79 23 7.94 Botswana 113 4.06 113 3.99United States 31 7.78 29 7.75 Kyrgyzstan 114 4.05 111 4.01Bahrain 32 7.72 34 7.64 Guyana 115 4.04 112 3.99Spain 33 7.70 31 7.69 Nicaragua 116 3.98 119 3.63Portugal 34 7.67 32 7.68 Honduras 117 3.94 120 3.62United Arab Emirates 35 7.67 38 7.39 Namibia 118 3.93 121 3.59Italy 36 7.62 36 7.44 Gabon 119 3.88 117 3.81Greece 37 7.53 35 7.48 Sri Lanka 120 3.85 115 3.86Belarus 38 7.39 42 7.12 Cambodia 121 3.73 118 3.70Hungary 39 7.32 41 7.15 Mali 122 3.55 126 3.13Croatia 40 7.31 37 7.43 Sudan 123 3.46 122 3.24St. Kitts and Nevis 41 7.29 40 7.22 Gambia 124 3.39 131 2.95Latvia 42 7.29 44 7.06 Kenya 125 3.29 124 3.14Czech Republic 43 7.26 46 7.02 Senegal 126 3.23 128 3.03Russian Federation 44 7.25 48 7.01 Côte d'Ivoire 127 3.19 127 3.07Brunei Darussalam 45 7.24 39 7.22 Bhutan 128 3.18 125 3.13Serbia 46 7.22 43 7.09 Zimbabwe 129 3.12 129 2.99Oman 47 7.12 63 6.28 Lao P.D.R. 130 3.10 132 2.93Uruguay 48 7.05 52 6.80 Mauritania 131 3.08 123 3.15Poland 49 7.04 49 7.00 India 132 3.05 133 2.89Saudi Arabia 50 7.04 53 6.80 Pakistan 133 3.03 130 2.95Slovakia 51 7.03 50 6.93 Lesotho 134 3.02 134 2.82Antigua & Barbuda 52 7.02 45 7.02 Swaziland 135 3.02 135 2.78Lithuania 53 7.00 51 6.91 Uzbekistan 136 2.95 136 2.78Cyprus 54 6.93 47 7.02 Benin 137 2.94 137 2.72St. Vincent and the Gren. 55 6.85 56 6.72 Cameroon 138 2.75 140 2.53Kazakhstan 56 6.84 54 6.73 Nepal 139 2.70 143 2.44Bulgaria 57 6.77 55 6.72 Zambia 140 2.68 138 2.63Montenegro 58 6.74 57 6.66 Yemen 141 2.66 142 2.49Romania 59 6.62 60 6.40 Congo (Rep.) 142 2.65 139 2.55Argentina 60 6.62 61 6.38 Bangladesh 143 2.57 144 2.42Malaysia 61 6.58 58 6.59 Nigeria 144 2.53 148 2.29Moldova 62 6.56 64 6.26 Angola 145 2.52 141 2.51TFYR Macedonia 63 6.55 59 6.40 Guinea-Bissau 146 2.50 146 2.33Seychelles 64 6.46 69 6.06 Burkina Faso 147 2.46 150 2.27Lebanon 65 6.45 62 6.29 Solomon Islands 148 2.45 145 2.36Trinidad & Tobago 66 6.36 65 6.18 Afghanistan 149 2.44 151 2.23Chile 67 6.35 66 6.17 Rwanda 150 2.43 152 2.23Mauritius 68 6.32 68 6.07 Tanzania 151 2.37 147 2.31Costa Rica 69 6.27 67 6.11 Djibouti 152 2.36 149 2.28Ukraine 70 6.16 71 6.01 Liberia 153 2.36 154 2.14Brazil 71 6.14 70 6.03 Guinea 154 2.28 155 2.00Grenada 72 6.07 72 5.96 Mozambique 155 2.21 156 1.93Azerbaijan 73 6.07 73 5.83 Uganda 156 2.18 153 2.19Maldives 74 6.05 76 5.75 Niger 157 1.95 158 1.81Georgia 75 5.99 78 5.61 Malawi 158 1.89 157 1.90Dominica 76 5.86 74 5.79 Ethiopia 159 1.87 159 1.73Turkey 77 5.83 77 5.66 Cuba 160 1.87 162 1.66St. Lucia 78 5.68 75 5.77 Myanmar 161 1.85 161 1.72Armenia 79 5.64 79 5.55 Congo (Dem. Rep.) 162 1.72 164 1.54Morocco 80 5.63 82 5.39 Madagascar 163 1.68 160 1.72Bosnia and Herzegovina 81 5.63 83 5.31 Chad 164 1.65 163 1.61Iran (I.R.) 82 5.53 85 5.11 Central African Rep. 165 1.32 165 1.28Panama 83 5.53 80 5.46 Eritrea 166 1.27 166 1.22
Source: ITU.

Chapter 2. The ICT Development Index (IDI)
44
Table 2.4: IDI use sub-index, 2012 and 2013
Economy Rank 2013 Use 2013 Rank 2012 Use 2012 Economy Rank 2013 Use 2013 Rank 2012 Use 2012Denmark 1 8.71 1 8.47 Panama 84 2.70 74 2.61Sweden 2 8.29 2 8.22 Brunei Darussalam 85 2.68 79 2.53Korea (Rep.) 3 8.26 3 8.20 Maldives 86 2.66 82 2.43Finland 4 8.09 4 8.01 Dominican Rep. 87 2.65 92 2.13Norway 5 8.07 5 7.99 Jamaica 88 2.62 94 2.13United Kingdom 6 7.88 9 7.39 Tunisia 89 2.59 88 2.18Japan 7 7.80 6 7.78 Georgia 90 2.58 95 2.03Luxembourg 8 7.66 7 7.54 Ecuador 91 2.58 87 2.18Iceland 9 7.65 8 7.47 Morocco 92 2.50 84 2.30United States 10 7.50 11 7.21 Viet Nam 93 2.50 86 2.21Australia 11 7.48 12 7.19 St. Vincent and the Gren. 94 2.47 85 2.27Netherlands 12 7.43 10 7.34 Mexico 95 2.45 90 2.17Hong Kong, China 13 7.36 14 6.93 Venezuela 96 2.36 89 2.17Monaco 14 7.29 15 6.89 Philippines 97 2.28 93 2.13Singapore 15 7.19 13 7.14 Jordan 98 2.22 100 1.90New Zealand 16 7.10 20 6.47 Grenada 99 2.14 99 1.91Bahrain 17 7.06 17 6.70 Ukraine 100 2.11 101 1.80Macao, China 18 7.01 16 6.81 Uzbekistan 101 2.09 98 1.94Andorra 19 6.79 22 6.12 Suriname 102 2.06 97 1.96Estonia 20 6.77 18 6.58 Zimbabwe 103 1.92 108 1.53Switzerland 21 6.75 21 6.38 Bolivia 104 1.86 109 1.46France 22 6.74 19 6.52 Palestine 105 1.84 102 1.72Canada 23 6.63 24 5.97 Indonesia 106 1.80 104 1.61United Arab Emirates 24 6.51 36 4.90 Ghana 107 1.76 107 1.55Austria 25 6.28 26 5.93 Peru 108 1.69 103 1.62Ireland 26 6.24 23 6.02 Mongolia 109 1.69 112 1.37Germany 27 6.21 25 5.97 Namibia 110 1.67 106 1.60Belgium 28 6.18 28 5.63 Bhutan 111 1.67 119 1.06Spain 29 6.04 30 5.46 Sudan 112 1.65 111 1.39Qatar 30 5.95 38 4.86 Nigeria 113 1.60 113 1.32Latvia 31 5.91 27 5.67 Kyrgyzstan 114 1.59 110 1.41Croatia 32 5.62 34 5.00 Paraguay 115 1.50 115 1.24Israel 33 5.53 29 5.53 Iran (I.R.) 116 1.44 116 1.18Malta 34 5.48 31 5.16 Kenya 117 1.41 117 1.15Italy 35 5.38 37 4.87 Guyana 118 1.36 114 1.31Lithuania 36 5.29 40 4.79 El Salvador 119 1.27 118 1.07Slovakia 37 5.28 41 4.69 Senegal 120 1.25 126 0.80Czech Republic 38 5.22 32 5.09 Sri Lanka 121 1.10 120 0.96Slovenia 39 5.21 39 4.85 Syria 122 1.07 122 0.93Barbados 40 5.20 35 4.95 Angola 123 1.06 124 0.82Belarus 41 4.99 48 4.16 Honduras 124 1.03 121 0.93Russian Federation 42 4.97 42 4.69 Swaziland 125 0.99 125 0.82Poland 43 4.94 33 5.06 Guatemala 126 0.96 127 0.78Saudi Arabia 44 4.77 49 4.13 Nepal 127 0.92 128 0.77Bulgaria 45 4.77 45 4.34 Cuba 128 0.86 123 0.86Hungary 46 4.67 43 4.42 Uganda 129 0.83 129 0.74Oman 47 4.65 54 3.81 Yemen 130 0.73 131 0.63Greece 48 4.65 46 4.32 Algeria 131 0.73 130 0.67Portugal 49 4.61 44 4.35 Nicaragua 132 0.68 132 0.58Uruguay 50 4.56 53 3.81 India 133 0.68 133 0.57Costa Rica 51 4.48 52 3.92 Congo (Rep.) 134 0.57 145 0.27Azerbaijan 52 4.40 58 3.55 Lesotho 135 0.55 138 0.41Serbia 53 4.34 50 4.05 Solomon Islands 136 0.55 135 0.47Cyprus 54 4.34 47 4.22 Cambodia 137 0.55 139 0.40Lebanon 55 4.33 59 3.52 Zambia 138 0.54 134 0.48Kazakhstan 56 4.33 55 3.73 Gambia 139 0.51 136 0.46TFYR Macedonia 57 4.22 60 3.51 Lao P.D.R. 140 0.50 137 0.43St. Kitts and Nevis 58 4.21 51 3.99 Rwanda 141 0.49 141 0.38Chile 59 4.08 56 3.67 Burkina Faso 142 0.45 155 0.13Brazil 60 4.01 62 3.25 Djibouti 143 0.43 142 0.37Antigua & Barbuda 61 3.99 68 2.99 Pakistan 144 0.42 140 0.38Moldova 62 3.94 57 3.56 Mauritania 145 0.40 143 0.31Romania 63 3.87 61 3.33 Gabon 146 0.35 144 0.30Bosnia and Herzegovina 64 3.71 63 3.17 Malawi 147 0.31 146 0.26Trinidad & Tobago 65 3.60 67 3.03 Congo (Dem. Rep.) 148 0.30 147 0.25Argentina 66 3.42 65 3.10 Cameroon 149 0.28 153 0.19Montenegro 67 3.37 66 3.08 Bangladesh 150 0.27 148 0.23Albania 68 3.26 71 2.73 Tanzania 151 0.24 150 0.21Turkey 69 3.24 69 2.98 Mozambique 152 0.24 149 0.23Malaysia 70 3.16 64 3.10 Ethiopia 153 0.24 151 0.20Thailand 71 3.12 105 1.61 Afghanistan 154 0.24 152 0.20Fiji 72 3.08 96 1.99 Liberia 155 0.21 156 0.13Colombia 73 3.07 75 2.58 Benin 156 0.18 154 0.16Botswana 74 3.03 70 2.93 Côte d'Ivoire 157 0.16 157 0.13St. Lucia 75 3.02 78 2.55 Mali 158 0.14 159 0.10Armenia 76 3.02 73 2.66 Central African Rep. 159 0.12 158 0.10China 77 2.99 72 2.68 Guinea-Bissau 160 0.10 160 0.10Mauritius 78 2.97 76 2.57 Madagascar 161 0.09 161 0.08Cape Verde 79 2.90 91 2.15 Niger 162 0.09 163 0.07Egypt 80 2.87 77 2.55 Myanmar 163 0.08 165 0.04Dominica 81 2.79 80 2.50 Chad 164 0.08 162 0.08South Africa 82 2.75 83 2.32 Guinea 165 0.05 164 0.05Seychelles 83 2.74 81 2.47 Eritrea 166 0.03 166 0.03
Source: ITU.

45
Measuring the Information Society Report 2014
Table 2.5: IDI skills sub-index, 2012 and 2013
Economy Rank 2013 Skills 2013 Rank 2012 Skills 2012 Economy Rank 2013 Skills 2013 Rank 2012 Skills 2012Greece 1 9.90 1 9.90 China 84 7.02 84 7.02Korea (Rep.) 2 9.81 2 9.81 Lebanon 85 6.99 85 6.99Finland 3 9.75 3 9.75 South Africa 86 6.98 86 6.98Belarus 4 9.69 4 9.69 Bolivia 87 6.97 87 6.97United States 5 9.56 5 9.56 Mexico 88 6.96 88 6.96Australia 6 9.50 6 9.50 Qatar 89 6.95 89 6.95Slovenia 7 9.43 7 9.43 Oman 90 6.95 90 6.95Andorra 8 9.41 8 9.41 Uzbekistan 91 6.94 91 6.94Spain 9 9.41 9 9.41 Philippines 92 6.93 92 6.93Iceland 10 9.32 10 9.32 Sri Lanka 93 6.91 93 6.91New Zealand 11 9.28 11 9.28 Jamaica 94 6.89 94 6.89Denmark 12 9.28 12 9.28 Indonesia 95 6.89 95 6.89Ukraine 13 9.23 13 9.23 Tunisia 96 6.86 96 6.86Estonia 14 9.21 14 9.21 United Arab Emirates 97 6.79 97 6.79Netherlands 15 9.20 15 9.20 Algeria 98 6.72 98 6.72Lithuania 16 9.12 16 9.12 Dominican Rep. 99 6.69 100 6.67Norway 17 9.09 17 9.09 St. Lucia 100 6.67 99 6.67Russian Federation 18 9.03 18 9.03 Fiji 101 6.64 101 6.64Poland 19 9.01 19 9.01 Cape Verde 102 6.62 102 6.62Belgium 20 8.99 20 8.99 Paraguay 103 6.59 103 6.59Austria 21 8.96 21 8.96 Guyana 104 6.59 104 6.59Argentina 22 8.94 22 8.94 Malaysia 105 6.54 105 6.54Ireland 23 8.92 23 8.92 Trinidad & Tobago 106 6.54 106 6.54Sweden 24 8.90 24 8.90 Viet Nam 107 6.50 107 6.50Canada 25 8.85 25 8.85 Seychelles 108 6.44 108 6.44Israel 26 8.78 26 8.78 Suriname 109 6.40 109 6.40Portugal 27 8.77 27 8.77 Egypt 110 6.33 110 6.33Latvia 28 8.75 28 8.75 Dominica 111 6.31 111 6.31Chile 29 8.72 29 8.72 Syria 112 6.17 112 6.17Italy 30 8.71 30 8.71 Maldives 113 6.12 113 6.12Germany 31 8.68 31 8.68 El Salvador 114 6.00 114 6.00Japan 32 8.67 32 8.67 Honduras 115 5.96 115 5.96Barbados 33 8.65 33 8.65 Botswana 116 5.86 116 5.86Czech Republic 34 8.65 34 8.65 Nicaragua 117 5.49 117 5.49Mongolia 35 8.64 35 8.64 Solomon Islands 118 5.44 118 5.44Croatia 36 8.63 36 8.63 Guatemala 119 5.37 119 5.37Hungary 37 8.62 37 8.62 Myanmar 120 5.22 120 5.22Venezuela 38 8.62 38 8.62 India 121 5.20 121 5.20France 39 8.57 39 8.57 Morocco 122 5.07 122 5.07Macao, China 40 8.53 40 8.53 Namibia 123 5.02 123 5.02Bulgaria 41 8.46 41 8.46 Swaziland 124 4.96 124 4.96Monaco 42 8.45 42 8.45 Djibouti 125 4.84 127 4.76United Kingdom 43 8.41 43 8.41 Ghana 126 4.82 128 4.72Cuba 44 8.41 44 8.41 Gabon 127 4.82 125 4.82Uruguay 45 8.39 45 8.39 Congo 128 4.77 126 4.77Grenada 46 8.38 46 8.38 Lesotho 129 4.66 129 4.66Switzerland 47 8.34 47 8.34 Nepal 130 4.61 130 4.58Turkey 48 8.34 48 8.34 Kenya 131 4.54 131 4.54Slovakia 49 8.28 49 8.28 Bhutan 132 4.54 132 4.54Hong Kong, China 50 8.24 50 8.24 Lao P.D.R. 133 4.53 133 4.53Saudi Arabia 51 8.17 51 8.17 Cambodia 134 4.49 134 4.49Romania 52 8.17 52 8.17 Cameroon 135 4.45 135 4.45Montenegro 53 8.15 53 8.15 Zimbabwe 136 4.36 136 4.36Costa Rica 54 8.13 54 8.13 Bangladesh 137 4.18 137 4.18Serbia 55 8.07 55 8.07 Sudan 138 4.18 138 4.18Kazakhstan 56 8.06 56 8.06 Yemen 139 4.11 139 4.11Armenia 57 8.04 57 8.04 Gambia 140 3.76 140 3.76Cyprus 58 7.99 58 7.99 Congo (Dem. Rep.) 141 3.76 141 3.76Singapore 59 7.90 59 7.90 Uganda 142 3.66 142 3.66Albania 60 7.82 61 7.82 Angola 143 3.65 143 3.65Thailand 61 7.81 60 7.82 Zambia 144 3.64 144 3.64Jordan 62 7.74 62 7.74 Madagascar 145 3.55 145 3.55Colombia 63 7.71 63 7.71 Tanzania 146 3.55 146 3.55Kyrgyzstan 64 7.62 64 7.62 Nigeria 147 3.51 147 3.51Palestinian Authority 65 7.59 65 7.59 Rwanda 148 3.49 148 3.49Moldova 66 7.57 66 7.57 Eritrea 149 3.41 149 3.41Peru 67 7.53 67 7.53 Pakistan 150 3.36 150 3.36Iran (I.R.) 68 7.52 68 7.52 Senegal 151 3.35 151 3.35Mauritius 69 7.51 69 7.51 Liberia 152 3.32 152 3.32Bosnia and Herzegovina 70 7.50 70 7.50 Malawi 153 3.21 153 3.21Bahrain 71 7.44 71 7.44 Guinea-Bissau 154 3.12 154 3.12Antigua & Barbuda 72 7.41 72 7.41 Afghanistan 155 2.98 155 2.98Azerbaijan 73 7.33 73 7.33 Benin 156 2.96 156 2.96Panama 74 7.32 74 7.32 Mali 157 2.85 157 2.85Malta 75 7.32 75 7.32 Mozambique 158 2.71 158 2.71Brunei Darussalam 76 7.32 76 7.32 Mauritania 159 2.58 159 2.58Ecuador 77 7.29 78 7.24 Guinea 160 2.44 160 2.44TFYR Macedonia 78 7.29 77 7.29 Ethiopia 161 2.35 161 2.35St. Vincent and the Gr. 79 7.23 79 7.23 Côte d'Ivoire 162 2.32 162 2.32Brazil 80 7.22 80 7.22 Chad 163 2.08 163 2.08Georgia 81 7.14 81 7.14 Burkina Faso 164 1.97 164 1.97Luxembourg 82 7.08 82 7.08 Central African Rep. 165 1.91 165 1.91St. Kitts and Nevis 83 7.03 83 7.03 Niger 166 1.10 166 1.10
Source: ITU.

Chapter 2. The ICT Development Index (IDI)
46
countries from Asia and the Pacific (Japan, Australia, Singapore, New Zealand and Macao (China)), the United States and Canada, as well as Bahrain, the only country from the Arab States region. All countries included in the top 30 have an IDI value of more than seven.
The top performers of the IDI 2013 share a number of common characteristics that help to explain their high levels of ICT access and use. All have highly liberalized and competitive ICT markets that are at the forefront of innovation, and people that have the skills to make use of ICTs. Furthermore, there is a strong link between income levels and IDI values, with all of the top ten countries being high-income economies (see section 2.3).6 The following section looks at the performance of the top ten countries of IDI 2013.
Denmark ranks at the top of the IDI 2013, replacing the Republic of Korea, the front-runner in 2012, 2011 and 2010. This small, technology-driven country with a highly skilled population has been quick to adapt to new technologies. According to data from the European Union (EU), 85 per cent of Danes have some level of computer skills (compared to the EU average of 67 per cent) and 42 per cent of the population have “high” computer skills.7 In 2010, the digital
economy accounted for more than 5.8 per cent of GDP, and it continues to grow. Having regard to the general economic downturn, Denmark’s government sees ICTs as a major driver for growth, innovation and economic development (Government of Denmark, 2012).
The country has a highly developed ICT infrastructure, as reflected by an access sub-index value of 8.84. Household ICT connectivity is extremely high, among the highest in Europe, with 93 per cent of households with Internet access and households with a computer by end 2013. Next-generation access, providing speeds of at least 30 Mbit/s, was available to 73 per cent of households, well above the EU average of 54 per cent. Denmark’s national target even exceeds the EU’s Digital Agenda objective of 100 per cent coverage of households with broadband speeds of 30 Mbit/s, and aims to provide access of at least 100 Mbit/s to all households in the country by 2020 (Erhvervs- og Vækstministeriet, 2012). The Danish Internet service provider (ISP) TDC is making investments to provide access to ultra-fast speeds for over half a million households.9 Denmark enjoys abundant international Internet bandwidth of more than 260 000 bit/s per Internet user in 2013.
Denmark tops the IDI use sub-index. The country’s broadband market is particularly well advanced. At 107 per cent, it has one of the highest wireless-broadband penetration rates in the world, and an equally impressive fixed-broadband penetration rate of 40 per cent. In both indicators – although Sweden has a slightly higher wireless-broadband penetration – Denmark surpasses the other top five IDI countries (see Chart 2.1). In terms of LTE population coverage, Denmark stands way above the regional (and world) average, with 65 per cent of the population covered.9 In January 2013, Denmark auctioned the 800 MHz spectrum in order to meet the increasing demand generated by wireless-broadband services. There is an obligation for the licensees to ensure that by 2015 users in areas with the lowest speeds will
Chart 2.1: Fixed (wired)-broadband and wireless-broadband subscriptions per 100 inhabitants, top five IDI countries, 2013
Source: ITU World Telecommunication/ICT Indicators database.
33
35
36
38
40
110
75
87
105
107
0 50 100 150
Sweden
Iceland
United Kingdom
Korea (Rep.)
Denmark
Per 100 inhabitants
Wireless-broadband subscriptions
Fixed (wired)- broadband subscriptions

47
Measuring the Information Society Report 2014
Chart 2.2: Wireless-broadband subscriptions per 100 inhabitants, top five IDI countries, 2010-2013
Source: ITU World Telecommunication/ICT Indicators database.
have access to mobile broadband at speeds of at least 10 Mbit/s.10
The Republic of Korea ranks second in the IDI 2013. The former leader in the IDI 2012, 2011 and 2010 continues to attain very high values on all the sub-indices of the IDI. It ranks in third position in the use sub-index, and eighth position in the access sub-index. Fixed-broadband and wireless-broadband penetration stand at top levels at 38 per cent and 105 per cent, respectively (see Chart 2.1). The Republic of Korea was the first country to offer 3G services commercially in 2002, and LTE was first offered in 2011. Two years after commercializing the first LTE network, leading operator SK Telecom reported that it passed the 10 million LTE subscriber mark in April 2013; this represents 37 per cent of its total mobile subscriber base. Full coverage having being achieved (by April 2012, LTE was available nationwide), the wireless-broadband market is showing signs of saturation, with little growth over the past years. From 2012 to 2013, there was only a minimal increase in penetration, from 105.1 per cent in 2012 to 105.3 in 2013 (see Chart 2.2). The focus of operators and policy-makers has shifted from access to wireless services to improving quality and speed. In July 2013, SK Telecom launched the “world`s first LTE-Advanced Network”, with speeds of up to 150 Mbit/s. In 2014, the Vice-President of the European Commission for the Digital Agenda and the Republic of Korea’s Minister of Science, ICT and Future Planning signed an agreement to work towards a global definition of 5G and to cooperate in 5G research.11
In regard to fixed broadband, there is still more potential for growth, and from 2012 to 2013 more fixed-broadband than wireless-broadband subscriptions were added (around 485 000 fixed-broadband compared with 370 000 wireless-broadband subscriptions). Data also show that the Republic of Korea achieves the highest advertised fixed-broadband speeds, with all subscriptions providing at least 10 Mbit/s. This compares with 75 per cent of fixed-broadband subscriptions at advertised speeds of at least 10
0
20
40
60
80
100
120
2010 2011 2012 2013
Korea (Rep.)
Denmark
Iceland
Sweden
United Kingdom
Pe
r 1
00
in
ha
bit
an
ts
Mbit/s in Denmark, and 66 per cent in Sweden.
At 98 per cent, the Republic of Korea has the highest proportion of households with Internet access worldwide. A somewhat lower proportion of 81 per cent of households have a computer. International Internet bandwidth is relatively low, compared to other top IDI countries, at just over one Tbit/s in 2012. There is however a sizeable domestic demand for data driven by the high volume of local content, and domestic Internet bandwidth was ten times higher compared with international bandwidth.
Third-placed Sweden records an IDI value of 8.67 in 2013. Like the remaining EU countries in the top ten, namely United Kingdom (fifth), Netherlands (seventh), Finland (eighth) and Luxembourg (tenth), Sweden has an excellent ICT infrastructure, a skilled population and high levels of ICT usage. Iceland (fourth) and Norway (sixth) are not EU members, but cooperate with the EU in the field of ICTs, for example through the Digital Agenda for Europe initiative, and share many common characteristics. All these countries have an IDI value of more than eight and were already among the top ten countries of the IDI 2012. Luxembourg ranks first in the IDI access sub-index with its state-of-the-art infrastructure and large amounts of international

Chapter 2. The ICT Development Index (IDI)
48
Internet bandwidth. The United Kingdom stands out as the most dynamic of the top ten IDI countries. It improved its IDI value from 8.28 in 2012 to 8.51 in 2013.
The growth in wireless-broadband subscriptions is having a major impact on ICT markets, and European top performers have been at the forefront of this trend. Wireless-broadband penetration exceeds 60 per cent in these countries, with Finland and Sweden having more than one subscription per inhabitant. Norway has a wireless-broadband penetration of 89 per cent, followed by the United Kingdom (87 per cent), Luxembourg (80.5 per cent), Iceland (75 per cent) and the Netherlands (62 per cent). By early 2013, virtually all (96 per cent) of EU citizens were covered by a 3G signal and 26 per cent of the population was covered by an LTE network.12 Denmark, Sweden and Finland are the countries with the highest LTE coverage in the European region (European Commission, 2014a).
The European Commission is partnering with the Republic of Korea to work towards a definition of 5G. Furthermore, it launched a public-private partnership on 5G (5G PPP) in late 2013 that aims to “deliver solutions, architectures, technologies and standards for the ubiquitous next-generation communication infrastructures of the coming decade”. A total of EUR 3 billion have been pledged over the next seven years, with EUR 700 million coming from the European Commission and the private sector set to match this investment by up to five times.13
European top performers stand out when it comes to ICT access at home. Data from the EU confirm that household access is highly correlated with regular use of the Internet, which underlines the importance of household access.14 All European countries included in the top ten of the IDI have a household ICT penetration (both households with a computer and households with Internet) of at least 88 per cent. Iceland and the Netherlands display the highest levels of households with a computer, at 97 and 95 per cent, respectively.15 In Luxembourg and Norway,
94 per cent of households have Internet access, followed by Sweden (93 per cent), Finland (89 per cent) and the United Kingdom (88 per cent). With household ICT connectivity reaching saturation levels in the top performing countries, the attention of policy-makers has shifted to improving quality of access. The European Commission’s Digital Agenda for Europe acknowledges the importance of connecting homes with fast and ultra-fast broadband and sets ambitious targets to have 50 per cent of homes subscribed to ultra-fast broadband (at least 100 Mbit/s) and coverage of all households by broadband speeds of at least 30 Mbit/s by 2020.16
In the United Kingdom, the country that saw the highest increase in rank within the top ten, the availability of superfast broadband17 of at least 30 Mbit/s is increasing steadily. In 2013, superfast networks covered 73 per cent of premises, up from 65 per cent in 2012. Most of this can be put down to the incumbent operator’s fibre-to-the-cabinet’ (FTTC) network, which passed 57 per cent of premises. The UK government aims to achieve coverage of at least 90 per cent in 2016, and has made GBP 530 million of funding available for the roll-out of networks in sparsely populated underserved areas. With this continued increase in availability, uptake of superfast fixed broadband is increasing: as of June 2013, 22 per cent of broadband connections were superfast, compared to 10 per cent in 2012 (Ofcom, 2013).
The countries with the highest fixed-broadband penetration in the world are all from Europe, and have attained a penetration of at least 30 per cent by end 2013. Sweden has the fastest fixed broadband in Europe, with a quarter of all fixed-broadband subscriptions reaching (advertised) speeds of 100 Mbit/s and above. Data from the European Commission’s Digital Agenda underline the competitiveness of the European fixed-broadband market: in January 2013, the market shares of the incumbent operators compared to new entrants were 42 per cent to 58 per cent on average.18
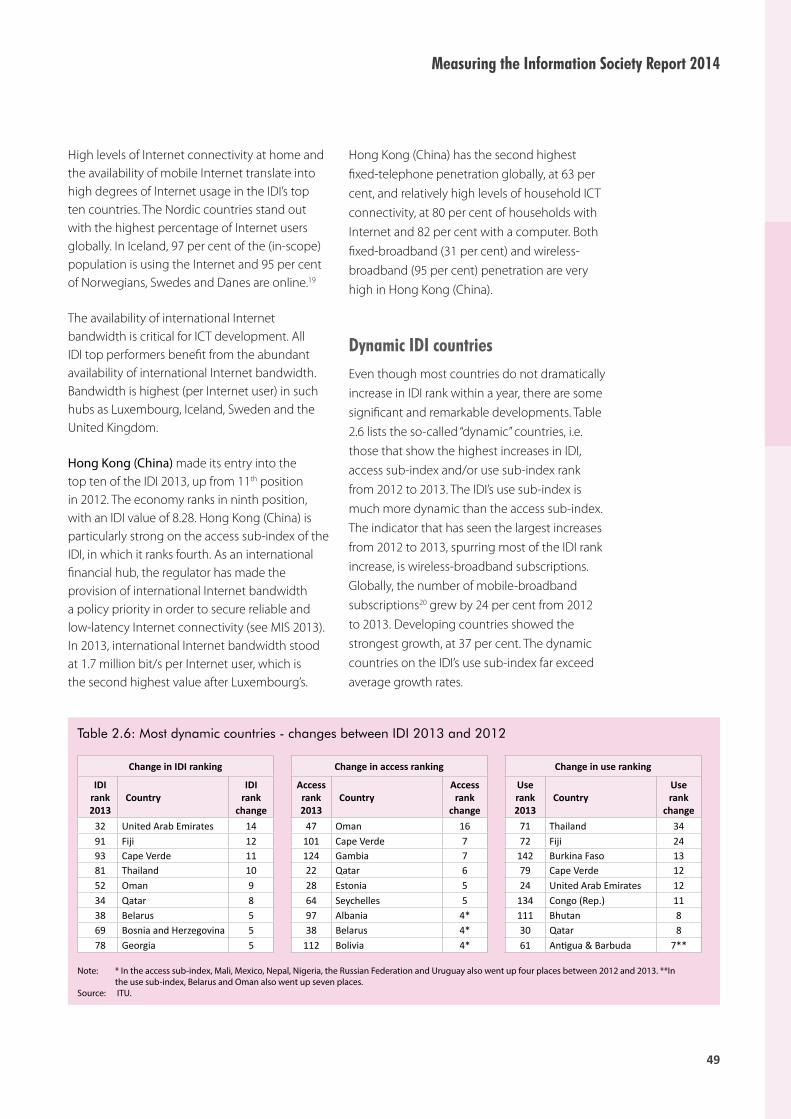
49
Measuring the Information Society Report 2014
High levels of Internet connectivity at home and the availability of mobile Internet translate into high degrees of Internet usage in the IDI’s top ten countries. The Nordic countries stand out with the highest percentage of Internet users globally. In Iceland, 97 per cent of the (in-scope) population is using the Internet and 95 per cent of Norwegians, Swedes and Danes are online.19
The availability of international Internet bandwidth is critical for ICT development. All IDI top performers benefit from the abundant availability of international Internet bandwidth. Bandwidth is highest (per Internet user) in such hubs as Luxembourg, Iceland, Sweden and the United Kingdom.
Hong Kong (China) made its entry into the top ten of the IDI 2013, up from 11th position in 2012. The economy ranks in ninth position, with an IDI value of 8.28. Hong Kong (China) is particularly strong on the access sub-index of the IDI, in which it ranks fourth. As an international financial hub, the regulator has made the provision of international Internet bandwidth a policy priority in order to secure reliable and low-latency Internet connectivity (see MIS 2013). In 2013, international Internet bandwidth stood at 1.7 million bit/s per Internet user, which is the second highest value after Luxembourg’s.
Hong Kong (China) has the second highest fixed-telephone penetration globally, at 63 per cent, and relatively high levels of household ICT connectivity, at 80 per cent of households with Internet and 82 per cent with a computer. Both fixed-broadband (31 per cent) and wireless-broadband (95 per cent) penetration are very high in Hong Kong (China).
Dynamic IDI countriesEven though most countries do not dramatically increase in IDI rank within a year, there are some significant and remarkable developments. Table 2.6 lists the so-called “dynamic” countries, i.e. those that show the highest increases in IDI, access sub-index and/or use sub-index rank from 2012 to 2013. The IDI’s use sub-index is much more dynamic than the access sub-index. The indicator that has seen the largest increases from 2012 to 2013, spurring most of the IDI rank increase, is wireless-broadband subscriptions. Globally, the number of mobile-broadband subscriptions20 grew by 24 per cent from 2012 to 2013. Developing countries showed the strongest growth, at 37 per cent. The dynamic countries on the IDI’s use sub-index far exceed average growth rates.
Table 2.6: Most dynamic countries - changes between IDI 2013 and 2012
Note: * In the access sub-index, Mali, Mexico, Nepal, Nigeria, the Russian Federation and Uruguay also went up four places between 2012 and 2013. **In the use sub-index, Belarus and Oman also went up seven places.
Source: ITU.
Change in IDI ranking Change in access ranking Change in use ranking
IDI rank 2013
CountryIDI
rank change
Access rank 2013
CountryAccess rank
change
Use rank 2013
CountryUse rank
change32 United Arab Emirates 14 47 Oman 16 71 Thailand 3491 Fiji 12 101 Cape Verde 7 72 Fiji 2493 Cape Verde 11 124 Gambia 7 142 Burkina Faso 1381 Thailand 10 22 Qatar 6 79 Cape Verde 1252 Oman 9 28 Estonia 5 24 United Arab Emirates 1234 Qatar 8 64 Seychelles 5 134 Congo (Rep.) 1138 Belarus 5 97 Albania 4* 111 Bhutan 869 Bosnia and Herzegovina 5 38 Belarus 4* 30 Qatar 878 Georgia 5 112 Bolivia 4* 61 Antigua & Barbuda 7**

Chapter 2. The ICT Development Index (IDI)
50
High increases in wireless-broadband subscriptions can be seen in countries that were late adopters of 3G technology. For instance, mobile-broadband services were only commercialized in mid-2013 in Burkina Faso,21 which is among the most dynamic countries on the use sub-index (+13 ranks). Other most dynamic countries have seen a significant increase in the number of wireless-broadband subscriptions from 2012 to 2013 due to a rise in competition (i.e. the awarding of further licences), lower prices (see Chapter 4) and increased uptake by users. In the Republic of the Congo, 3G was launched in late 2011 by Airtel Congo, and the entry of a second operator (MTN Congo) is reflected in a significant increase in penetration rate from 2 per cent in 2012 to 11 per cent in 2013 (Agence de Régulation des Postes et des Communications Electroniques, 2011), placing the country among the most dynamic on the use sub-index. In the United Arab Emirates, increases in IDI rank (+14) are also mostly due to the expansion of wireless-broadband penetration, which doubled from 45 per cent (in 2012) to 90 per cent (in 2013).
The following section looks at selected most dynamic countries in more detail. Figure 2.3 shows spider charts of the most dynamic countries, which illustrate normalized values and
changes between 2012 and 2013 for each one of the 11 indicators included in the IDI.
Cape Verde moved up eleven ranks in the IDI 2013, to 93rd position. Significant improvements were made in both the access (+7 ranks) and use (+12 ranks) sub-indices. Cape Verde’s progress in terms of ICT development can be linked to the country’s connection to the West Africa Cable System (WACS)22 in mid-2012, which added significant amounts of international Internet bandwidth and increased international Internet bandwidth per Internet user from around 6 000 bit/s in 2012 to close to 12 000 bit/s per user in 2013. The submarine cable system spans Africa’s west coast, from South Africa to Côte d’Ivoire, and connects it to Europe. It provides international Internet connectivity, which is of particular importance for enabling an island state such as Cape Verde to join the information society. Further progress in the access sub-index is attributable to the increase in mobile-cellular penetration, which in 2013 exceeded 100 per cent of inhabitants. Increases in the use sub-index are mostly driven by the impressive growth in the number of wireless-broadband subscriptions. From 2012 to 2013, the number of subscriptions almost doubled, reaching a penetration of 43 per cent. Mobile-broadband services were only launched in December 2011, and by 2013 operator CVMovel had expanded 3G services to all the islands of the archipelago.23
Bhutan is one of the most dynamic countries in the use sub-index, moving up eight places. The country ranks 123rd in the IDI 2013. While mobile-broadband services were introduced as early as 2008 by state-owned operator Bhutan Telecom (under its B-Mobile brand), major developments took place in 2013 that helped to boost penetration from only 2.5 per cent in 2012 to 16 per cent in 2013 (see Chart 2.3). Bhutan Telecom expanded its 3G services, which had been limited to the nation’s capital Thimphu, to 15 out of 20 districts in Bhutan. Some USD 10.9 million were allocated to optimize and expand the operator’s mobile network.24 Furthermore, Bhutan Telecom launched its high-speed 4G services in Thimphu
Chart 2.3: Wireless-broadband penetration, Bhutan, 2008-2013
Source: ITU World Telecommunication/ICT Indicators database.
0.00.1 0.3
1.02.5
15.6
0
2
4
6
8
10
12
14
16
18
2008
%
2010 2011 2012 20132009
51
Measuring the Information Society Report 2014
in late 2013. The launch of mobile-broadband services by the country’s only private-owned operator Tashi Cell in late 2013 has helped to increase coverage and competition in the market, which in turn has led to higher adoption rates.25 Apart from those major improvements in access to wireless-broadband services, uptake is also ascribed to the growing popularity of social media and increased availability of smartphones.26
Bolivia is among the most dynamic countries on the access sub-index (+4 ranks), and also shows good progress in the generally more dynamic use sub-index (+5 ranks). The country reported an important increase in international Internet bandwidth. International Internet bandwidth per Internet user27 almost doubled between 2012 and 2013, climbing to 9 000 bit/s per user. While this is still one of the lowest absolute figures in the Americas region (only Cuba has a lower bandwidth per Internet user), it indicates that good progress in being made in improving connectivity in the country. Bolivia has seen an important increase in wireless-broadband penetration, from 7 per cent in 2012 to 14 per cent in 2013.
In order to increase rural connectivity, landlocked Bolivia launched its first telecommunication satellite “Tupac Katari” in late 2013.28 ENTEL – Bolivia’s state-owned operator – is contracting capacity from Tupac Katari, which it will use to connect more rural areas of the country through the establishment of 3 000 telecentres by end 2014.29
Georgia made remarkable progress in terms of ICT development over the period 2012-2013. The country moved up five places to 78th position in the IDI 2013. Georgia has a well-developed ICT infrastructure, reflected in its relatively high ranking on the access sub-index (75th position), a liberalized and competitive ICT market, and a high amount of international Internet bandwidth (close to 82 000 bit/s per Internet user).30 It is well-connected to its neighbouring countries in the CIS region
and to Europe through two Black Sea fibre-optic cables and terrestrial links.31 This laid the foundation for the country’s improvement in the IDI 2013, with strong growth across the different indicators (USAID, 2013). In particular, the country was very successful in connecting households to the Internet – penetration increased from 27 per cent in 2012 to 35 per cent in 2013 – and in increasing the proportion of households with a computer – from 33 per cent in 2012 to close to 40 per cent in 2013. At the same time, both wireless- and fixed-broadband penetration went up significantly. Wireless-broadband penetration almost doubled, to 17 per cent, while fixed-broadband penetration reached 10 per cent by end 2013, up from 9 per cent in 2012.
Qatar moved up eight places to 34th position in the IDI 2013. Progress was strong in both the access (+6 ranks) and use (+8 ranks) sub-indices of the IDI. In particular, Qatar exhibits some of the highest increases in household ICT connectivity. The proportion of households with Internet stands at 96 per cent and the proportion of households with a computer at 97 per cent in 2013 (see Chart 2.4). A report by ICTQatar shows that Qataris are not only almost all very well-connected at home, but have a multitude of devices at their disposal. Over the period 2012-2013, the ownership of devices such as mobile phones and laptops increased significantly within the country’s mainstream population.32
The report also highlights discrepancies in ICT connectivity between Qataris and westerners, on the one hand, and transient labourers, on the other. While virtually all Qataris and westerners have an Internet connection at home, penetration stands at 85 per cent for the overall population. Smartphone penetration is also much lower among transient labourers (24 per cent). Therefore, “increasing the penetration of newer devices such as smartphones and tablets, particularly in specific demographic segments like the transient labour population” is one of the policy recommendations brought forward by the report (ICTQatar 2014).

Chapter 2. The ICT Development Index (IDI)
52
Figure 2.3: IDI spider charts, selected dynamic countries, 2012 and 2013
0.0
0.2
0.4
0.6
0.8
1.0 Mobile-cellular
subscriptions
InternationalInternet bandwidth
per Internet user
Households witha computer
Householdswith Internet
Fixed-telephonesubscriptions
Internet usersFixed-broadbandsubscriptions
Active mobile-
subscriptionsbroadband
Secondaryenrolment
Tertiaryenrolment
Literacy
Bhutan
2012
2013
0.0
0.2
0.4
0.6
0.8
1.0 Mobile-cellular
subscriptions
InternationalInternet bandwidth
per Internet user
Households witha computer
Householdswith Internet
Fixed-telephonesubscriptions
Internet usersFixed-broadbandsubscriptions
Active mobile-
subscriptionsbroadband
Secondaryenrolment
Tertiaryenrolment
Literacy
Bolivia
2012
2013
0.0
0.2
0.4
0.6
0.8
1.0 Mobile-cellular
subscriptions
InternationalInternet bandwidth
per Internet user
Households witha computer
Householdswith Internet
Fixed-telephonesubscriptions
Internet usersFixed-broadbandsubscriptions
Active mobile-
subscriptionsbroadband
Secondaryenrolment
Tertiaryenrolment
Literacy
Bosnia and Herzegovina
2012
2013
0.0
0.2
0.4
0.6
0.8
1.0 Mobile-cellular
subscriptions
InternationalInternet bandwidth
per Internet user
Households witha computer
Householdswith Internet
Fixed-telephonesubscriptions
Internet usersFixed-broadbandsubscriptions
Active mobile-
subscriptionsbroadband
Secondaryenrolment
Tertiaryenrolment
Literacy
Burkina Faso
2012
2013
0.0
0.2
0.4
0.6
0.8
1.0 Mobile-cellular
subscriptions
InternationalInternet bandwidth
per Internet user
Households witha computer
Householdswith Internet
Fixed-telephonesubscriptions
Internet usersFixed-broadbandsubscriptions
Active mobile-
subscriptionsbroadband
Secondaryenrolment
Tertiaryenrolment
Literacy
Cape Verde
2012
2013
0.0
0.2
0.4
0.6
0.8
1.0 Mobile-cellular
subscriptions
InternationalInternet bandwidth
per Internet user
Households witha computer
Householdswith Internet
Fixed-telephonesubscriptions
Internet usersFixed-broadbandsubscriptions
Active mobile-
subscriptionsbroadband
Secondaryenrolment
Tertiaryenrolment
Literacy
Estonia
2012
2013

53
Measuring the Information Society Report 2014
Figure 2.3: IDI spider charts, selected dynamic countries, 2012 and 2013 (continued)
0.0
0.2
0.4
0.6
0.8
1.0 Mobile-cellular
subscriptions
InternationalInternet bandwidth
per Internet user
Households witha computer
Householdswith Internet
Fixed-telephonesubscriptions
Internet usersFixed-broadbandsubscriptions
Active mobile-
subscriptionsbroadband
Secondaryenrolment
Tertiaryenrolment
Literacy
Fiji
2012
2013
0.0
0.2
0.4
0.6
0.8
1.0 Mobile-cellular
subscriptions
InternationalInternet bandwidth
per Internet user
Households witha computer
Householdswith Internet
Fixed-telephonesubscriptions
Internet usersFixed-broadbandsubscriptions
Active mobile-
subscriptionsbroadband
Secondaryenrolment
Tertiaryenrolment
Literacy
Georgia
2012
2013
0.0
0.2
0.4
0.6
0.8
1.0 Mobile-cellular
subscriptions
InternationalInternet bandwidth
per Internet user
Households witha computer
Householdswith Internet
Fixed-telephonesubscriptions
Internet usersFixed-broadbandsubscriptions
Active mobile-
subscriptionsbroadband
Secondaryenrolment
Tertiaryenrolment
Literacy
Gambia
2012
2013
0.0
0.2
0.4
0.6
0.8
1.0 Mobile-cellular
subscriptions
InternationalInternet bandwidth
per Internet user
Households witha computer
Householdswith Internet
Fixed-telephonesubscriptions
Internet usersFixed-broadbandsubscriptions
Active mobile-
subscriptionsbroadband
Secondaryenrolment
Tertiaryenrolment
Literacy
Mali
2012
2013
0.0
0.2
0.4
0.6
0.8
1.0 Mobile-cellular
subscriptions
InternationalInternet bandwidth
per Internet user
Households witha computer
Householdswith Internet
Fixed-telephonesubscriptions
Internet usersFixed-broadbandsubscriptions
Active mobile-
subscriptionsbroadband
Secondaryenrolment
Tertiaryenrolment
Literacy
Oman
2012
2013
0.0
0.2
0.4
0.6
0.8
1.0 Mobile-cellular
subscriptions
InternationalInternet bandwidth
per Internet user
Households witha computer
Householdswith Internet
Fixed-telephonesubscriptions
Internet usersFixed-broadbandsubscriptions
Active mobile-
subscriptionsbroadband
Secondaryenrolment
Tertiaryenrolment
Literacy
Qatar
2012
2013

Chapter 2. The ICT Development Index (IDI)
54
Looking to the future, the country released its first national broadband plan in 2013, which prioritizes broadband infrastructure development to make services faster, more affordable and more secure. One of the core projects of the Qatar National Broadband Network is the deployment of a fibre-optic network infrastructure.33
Chart 2.1: Fixed (wired)-broadband and wireless-broadband subscriptions per 100 inhabitants, top five IDI countries, 2013
Source: ITU.
33
35
36
38
40
110
75
87
105
107
0 50 100 150
Sweden
Iceland
United Kingdom
Korea (Rep.)
Denmark
Per 100 inhabitants
Wireless-broadband subscriptions
Fixed (wired)- broadband subscriptions
Chart 2.4: Proportion of households with a computer and proportion of households with Internet access, 2012-2013, Qatar
Source: ITU World Telecommunication/ICT Indicators database.
91.588.1
97.2 96.4
0
10
20
30
40
50
60
70
80
90
100
Households with a
computer
Household with Internet
access
2012
2013
Pe
r 1
00
ho
use
ho
lds
Thailand is one of the most dynamic countries on the use sub-index (+34 ranks), which led to an improvement in its overall IDI ranking from 91st in 2012 to 81st in 2013. In particular, the country’s wireless market proved to be extremely vibrant during the period 2012-2013: more than 7 million new mobile-cellular subscriptions and close to 28 million new wireless-broadband subscriptions were added within one year. Penetration rates stand at 138 per cent for mobile-cellular and 52 per cent for wireless-broadband services by end 2013. This is one of the highest wireless-broadband penetration rates in Asia and the Pacific, only surpassed by the region’s high-income economies. The launch of 3G was much anticipated in Thailand, following the long delay in the auctioning of 3G licences. In December 2012, licences were finally awarded to three Thai operators,34 providing high-speed mobile Internet connectivity to users. The rapid uptake of mobile-broadband services was spurred by heated competition among operators offering subsidized smartphones and promotions on mobile data plans.35 During 2013, operators further extended their wireless infrastructure and services throughout Thailand, and are planning to provide further network updates.36
Figure 2.3: IDI spider charts, selected dynamic countries, 2012 and 2013 (continued)
Note: These charts show normalized values of the indicators included in the IDI.Source: ITU.
0.0
0.2
0.4
0.6
0.8
1.0 Mobile-cellular
subscriptions
InternationalInternet bandwidth
per Internet user
Households witha computer
Householdswith Internet
Fixed-telephonesubscriptions
Internet usersFixed-broadbandsubscriptions
Active mobile-
subscriptionsbroadband
Secondaryenrolment
Tertiaryenrolment
Literacy
Thailand
2012
2013
0.0
0.2
0.4
0.6
0.8
1.0 Mobile-cellular
subscriptions
InternationalInternet bandwidth
per Internet user
Households witha computer
Householdswith Internet
Fixed-telephonesubscriptions
Internet usersFixed-broadbandsubscriptions
Active mobile-
subscriptionsbroadband
Secondaryenrolment
Tertiaryenrolment
Literacy
United Arab Emirates
2012
2013

55
Measuring the Information Society Report 2014
2.3 Monitoring the digital divide: Developed, developing and least connected countries
Tracking the global digital divide is one of the main objectives of the IDI. The digital divide can be understood as the difference in ICT development, within and between countries, regions or other groupings. In this section, IDI performance will be analysed and compared with regard to levels of (economic) development, and on the basis of IDI groupings (based on IDI values). The digital divide is measured by looking at differences in IDI values between these different groups. As a composite index that consolidates several ICT indicators into one single value, the IDI is an especially useful tool for comparing differences in ICT developments. Based on the 2013 and 2012 data presented in this chapter, the current (2013) global divide is measured and differences from 2012 are identified. This also serves to determine whether the digital divide has been increasing or decreasing over the past year. Special emphasis is placed on those countries that lie at the bottom of the IDI – the so-called “least connected countries” (LCCs).
The analysis of IDI values by level of development reveals a significant disparity between developed and developing countries. Developed countries reach an average IDI value of 7.20, while the developing-country average is almost half that, at 3.84. The increase in average value between 2012
and 2013 was almost the same in developing (+0.17) and developed countries (+0.18) when measured in absolute terms (Table 2.7). This indicates that developing countries – as a group – are not progressing enough in terms of ICT development to close the gap. Given their lower starting point, however, the average IDI value of developing countries increased twice as much (+4.9 per cent) compared to developed countries (+2.5 per cent) when measured in relative terms (Chart 2.5).
The range of IDI values is much higher in developing countries, a group that includes both top IDI countries such as the Republic of Korea as well as LCCs. The measures of dispersion and variation (StDev, CV and range) continue to increase, indicating that disparities within the group of developing countries are rising. Furthermore, the minimum value is not only significantly lower in developing than in developed countries, but has also increased much less. While both developed and developing countries exhibit progress in ICT development, the analysis shows that developing countries are not advancing enough to catch up with developed countries and that within the group of developing countries disparities in ICT development continue to rise.
The most important increases in the access-sub index occurred in developing countries, with an average value increase almost three times that of developed countries. At the same time, the difference in average value (between developed and developing countries) is lower than in the use
Table 2.7: IDI by level of development, 2012-2013
Note: *Simple averages. StDev= Standard deviation, CV= Coefficient of variation.Source: ITU.
IDI 2012 IDI 2013 Change in average value
2012-2013Average value* Min. Max. Range StDev CV Average
value* Min. Max. Range StDev CV
World 4.60 0.93 8.81 7.87 2.19 47.61 4.77 0.96 8.86 7.90 2.22 46.44 0.17
Developed 7.03 4.42 8.78 4.35 1.08 15.39 7.20 4.72 8.86 4.14 1.03 14.24 0.18
Developing 3.67 0.93 8.81 7.87 1.75 47.61 3.84 0.96 8.85 7.89 1.80 46.93 0.17

Chapter 2. The ICT Development Index (IDI)
56
sub-index, showing that developing countries are improving their ICT infrastructure, which is a prerequisite for intensifying ICT usage (Chart 2.6). However, progress was slower than in the other sub-indices of the IDI. Fixed-telephone penetration is decreasing in developing and developed countries. Mobile-cellular subscription growth rates are slowing down, indicating that mobile-cellular penetration is nearing saturation, including in developing countries. The growth in household ICT connectivity is much higher in developing countries, where around three-quarters of households are not yet connected to the Internet, leaving ample room for growth. This also holds true for international Internet bandwidth, which is still at very low levels in many developing countries.
The use sub-index is the most dynamic, showing the biggest improvements, particularly in developing countries. However, the average value is lowest in this sub-index, affording the biggest potential for growth. The difference in average value between developed and developing countries is also highest in the use sub-index, which underlines that significant differences exist with regard to the intensity of ICT usage (Chart 2.7). In many developing countries, the availability and uptake of wireless-broadband and fixed-broadband services in particular is still relatively limited. On average, fixed-broadband penetration reached 6 per cent in developing countries by end 2013, compared with 27 per cent in developed countries. While many developing countries saw important increases in their use sub-index value following the introduction of 3G services in 2012/2013, there were still a few countries that had not launched services by end 2013. In 2014, close to 4.3 billion people, most of them living in the developing world, were not using the Internet. Bringing those people online is an important task in developing countries.
Differences are smallest between developed and developing countries in the skills sub-index. However, in the absence of alternative measurements, this sub-index includes three proxy indicators that do not measure actual
Chart 2.5: IDI by level of development
Chart 2.6: IDI access sub-index by level of development
Chart 2.7: IDI use sub-index by level of development
Note: Simple averages. Source: ITU.
2012
2013
IDI
4.6
7.0
3.7
4.8
7.2
3.8
0
1
2
3
4
5
6
7
8
9
World Developed Developing
Change:
+4.9%
Change:
+2.5%
Change:
+3.9%
2012
2013
IDI
acc
ess
su
b-i
nd
ex
5.3
7.6
4.4
5.4
7.7
4.5
0
1
2
3
4
5
6
7
8
9
World Developed Developing
:
Change:
+3.6%
Change:
+1.2%
Change:
+2.6%
2012
2013
IDI
use
su
b-i
nd
ex
Change:
+15.4%
2.9
5.5
1.9
3.2
5.9
2.2
0
1
2
3
4
5
6
7
8
9
World Developed Developing
Change:
+6.3%
Change:
+10.6%

57
Measuring the Information Society Report 2014
Table 2.8: IDI by groups, 2012 and 2013
Note: *Simple averages. StDev= Standard deviation, CV= Coefficient of variation.Source: ITU.
Group
IDI 2012 IDI 2013
Number of coun-
tries
Averagevalue* Min. Max. Range StDev CV Average
value* Min. Max. Range StDev CV
High 42 7.52 6.46 8.81 2.35 0.70 9.27 7.69 6.70 8.86 2.16 0.63 8.22
Upper 40 5.38 4.50 6.45 1.95 0.56 10.38 5.63 4.75 6.67 1.91 0.58 10.26
Medium 42 3.69 2.62 4.48 1.86 0.54 14.61 3.88 2.79 4.72 1.93 0.58 14.97
Low 42 1.83 0.93 2.61 1.68 0.44 23.77 1.93 0.96 2.77 1.81 0.46 24.03
Total 166 4.60 0.93 8.81 7.87 2.19 47.61 4.77 0.96 8.86 7.90 2.22 46.44
ICT skills, but rather levels of literacy and school enrolment. Data change very little over time and advances in skills do not show immediate effects.
One shortcoming of grouping countries into only two categories (developed and developing) is that these categories include countries at very different stages of ICT development. The developing-country group, which is defined on the basis of the United Nations classification, also includes ICT champions such as the Republic of Korea, Hong Kong (China) and Singapore. Therefore, for the purpose of comparing levels of ICT development and analysing the digital divide, countries are also grouped on the basis of their IDI value. To this end, four groups/quartiles were formed, reflecting four different levels of ICT development: high, upper, medium and low (Table 2.8).
The average value of each of the IDI groups increased between 2012 and 2013, showing that countries with high and low IDI values are progressing in terms of ICT development. The upper IDI group shows the highest increase in average value between 2012 and 2013. The range and measures of disparity in IDI values decreased the most for the high IDI group. This indicates that countries with higher IDI values are making good progress in terms of ICT development and are moving at a similar pace. In the low IDI group, the range is not only the
smallest – reflecting the extremely low levels of ICT development reached across this group – but is also widening between 2012 and 2013. The countries in the low group of the IDI have been coined “least connected countries” (LCCs) since the 2012 edition of the MIS Report (ITU, 2012) (Box 2.2).
2.4 Geography, population size, economic development and the IDI
IntroductionThe purpose of this section is to look in more detail at some of the underlying factors that can have an influence on ICT development and IDI performance across countries. The 166 countries included in the IDI 2013 all have very different socio-economic characteristics that may be reflected in their different levels of ICT development. Countries differ significantly in terms of land area, size of the economy, population or geographic location. Indeed, adverse geography is often cited by economists to explain why some countries are doing better than others in terms of economic development.37 Jeffrey Sachs argues that “geography matters because it affects

Chapter 2. The ICT Development Index (IDI)
58
Box 2.2: The world’s least connected countries (LCCs)
The world’s least connected countries (LCCs) are the group of 42 countries that fall within the low IDI group, based on a categorization that divides the 166 countries included in the IDI into four groups (high, upper, medium, and low) (Figure Box 2.2). In the LCCs, levels of ICT access and usage are extremely low.
International Internet bandwidth availability is very limited, thus constraining Internet connectivity and driving up ICT prices, which in turn hampers usage of ICTs. Few households (less than 5 per cent in the majority of LCCs) are connected to the Internet and fewer than 5 per cent of households in all LCCs have a computer. Basic voice services are more widely available, although LCCs like Eritrea (6 per cent), Myanmar (13 per cent) and Cuba (18 per cent) still have very low mobile-cellular penetration levels. More advanced, broadband Internet access is scarce: fixed broadband is almost non-existent, with penetration rates of less than 1 per cent in almost all LCCs. Wireless broadband, although below 5 per cent penetration in the vast majority of LCCs, has registered important increases in countries such as Republic of the Congo (from 2 per cent in 2012 to 10.5 per cent in 2013), Lesotho (from 7 per cent in 2012 to 11 per cent in 2013) and Senegal (from 3.5 per cent in 2012 to 15 per cent
in 2013). The increased availability of wireless broadband could help bring more people online in LCCs. Today, in the majority of LCCs, few people use the Internet: an estimated less than 2 per cent the population is online in Eritrea, Myanmar, Guinea, Niger and Ethiopia.
The majority of LCCs are in Africa and they closely match the list of least developed countries (LDCs). Among the factors holding back improved access to ICTs in LDCs are low education and literacy rates, a generally poor infrastructure and limited or lack of access to electricity (UN-OHLLS, 2013). However, Bhutan and Sudan, both LDCs included in the IDI 2013 that are not considered as LCCs, show that even LDCs can achieve a higher level of ICT development. There are also some non-LDCs among the least connected, most notably such populous economies as India, Pakistan and Nigeria. In total, close to 2.5 billion people live in LCCs, which is more than one-third of the world’s total population. Special policy attention should be directed towards connecting people in LCCs, because they are most in need of improved access to ICTs and could benefit most from ICTs to advance socio-economic development.
Figure Box 2.2: Least connected countries (LCCs), 2013
Source: ITU.
IDI value:
Above 2.78LCC (2.78 and below)Data not available

59
Measuring the Information Society Report 2014
the profitability of various kinds of economic activities” (Sachs, 2012). This section will explore to what extent geographic and other variables are important in terms of ICT development.
MethodologyIn order to better understand the relationship between IDI, the economy, geography and population, the following variables were selected for each country:
• Urban population: refers to population living in urban areas, expressed as percentage of total population, as defined by national statistics offices
• Population density: refers to the mid-year population divided by land area in square kilometers
• Population size: refers to the size of the population of a country
• Land area: refers to a country’s total area, excluding area under inland water bodies, national claims to continental shelf and exclusive economic zones. In most cases, the definition of inland water bodies includes major rivers and lakes.
• Gross national income (GNI) per capita: GNI is the sum of value added by all resident producers plus any product taxes (less subsidies) not included in the valuation of output plus net receipts of primary income (compensation of employees and property income) from abroad.38 It is the total domestic and foreign output by residents of a country and consists of gross domestic product (GDP) plus factor incomes earned by foreign residents, minus income earned in the domestic economy by non-residents. GNI, calculated in national currency, is usually converted to United States dollars at official exchange rates for comparisons across
economies, although an alternative rate is used when the official exchange rate is judged to diverge by an exceptionally large margin from the rate actually applied in international transactions.
Apart from the potential relationship of these variables with ICT developments, they were selected for their high data availability for a large number of countries.
Past editions of this report (see MIS 2013) have pointed out the strong link between IDI and GNI, and the preceding sections highlighted the differences that persist in terms of ICT development between developed and developing countries.
In order to test the relationship between GNI and the other selected variables, a simple correlation analysis was conducted between IDI, the variables mentioned above and GNI per capita (p.c.). Results show that there is a strong and significant correlation between IDI and GNI p.c. (r = 0.78) (Chart 2.8). Furthermore, there is a strong and significant positive correlation between GNI p.c. and the percentage of population living in urban areas. In other words, the higher the level of GNI p.c. in a country, the higher the percentage of the population living in urban areas. There is also a significant, albeit weak correlation between GNI p.c. and population density, indicating that countries with a high GNI p.c. generally have a high population density.
Given the strong correlation of GNI p.c. with IDI, a partial correlation analysis between geographic factors, population factors and IDI value was conducted in which GNI p.c. was used as a control variable. This type of analysis makes it possible to look at the correlation while discounting for the effects of GNI p.c. The partial correlation analysis (Table 2.9) found a significant correlation between IDI and urban population, while no correlation was found between IDI and the other geographic and population variables. The following section looks at the results of the correlation analysis for each of the selected variables in more detail.

Chapter 2. The ICT Development Index (IDI)
60
Chart 2.8: IDI and GNI per capita
Note: Countries with GNI p.c. values of more than USD 60 000 are excluded from the chart.
Source: ITU.
IDI and urban population
The results of the partial correlation analysis revealed that the percentage of population living in urban areas was the only variable that showed a relationship with IDI results. Although the correlation is moderate (r = 0.5), it is significant (see Table 2.9). This shows that the higher a country’s share of population living in urban areas, the higher the values reached on the IDI (Chart 2.9).
This urban-rural divide can also be observed in a number of indicators included in the IDI, in particular those related to household ICT access, ICT skills and fixed telecommunication infrastructure.
Table 2.9: Partial correlation analysis of IDI, population and geographic characteristics
Control VariableCorrelations
IDI Population size
Population density
Land area
Urban population
GNI per capita
IDI 1 -0.032 0 0.017 0.501*
Population size -0.032 1 -0.009 0.455* -0.045
Population density 0 -0.009 1 -0.090 0.101
Land area 0.017 0.455* -0.090 1 0.075
Urban population 0.501* -0.045 0.101 0.075 1
Note: Data on urban population, population density, land area and GNI p.c. are sourced from the World Bank. Data on population size are sourced from UNPD. *Correlation is significant at 0.01 level.
Source: ITU.
Providing access to ICTs in rural areas of a country can be challenging, in particular in developing countries. Given the large investments that are required when deploying ICT infrastructure, private operators assess the profitability of providing their service depending on the demand and the specific business case in each geographic area. The marginal cost of service provision in densely populated urban areas is usually much lower than in rural areas. Furthermore, in many developing countries a higher proportion of lower-income populations, who might not be able to afford the service, live in rural areas, with the result that operators are not sure of obtaining a return on their investment. This points to other important factors, apart from service availability, that explain why countries with large rural populations have lower IDI values. People living in rural areas, in particular in developing countries, generally have a lower socio-economic status compared with their urban counterparts. High service costs and lack of ICT skills (see Chapter 1) have been identified as major barriers to increased use of ICTs, and are of particular relevance to rural populations in developing countries.
Chapter 1 of this report drew attention to the significant and persistent urban-rural digital divide. On the one hand, mobile-cellular coverage for rural populations has reached very high levels, with almost 90 per cent of the world’s rural inhabitants covered by a 2G mobile-cellular signal by 2013. On the other hand, 3G mobile-cellular coverage was comparatively low for
0
1
2
3
4
5
6
7
8
9
10
0 10000 20000 30000 40000 50000 60000
GNI p.c. (USD)
r = 0.775
IDI
20
13

61
Measuring the Information Society Report 2014
rural populations. The rural-urban divide is most pronounced when it comes to data on Internet access and use. Access to the Internet (be it narrowband or broadband, fixed or wireless) is extremely low for rural households in developing countries, while rural households in developed countries enjoy comparable access to their urban counterparts, albeit with slight variations in type of access and (usually) a small lag in levels of penetration.
IDI and population density
The partial correlation analysis did not find a significant correlation between IDI value and population density (r = 0). This indicates that the level of population density does not make any difference in terms of the IDI values that countries attain. Chart 2.10 illustrates, for example, that countries with low population densities exhibit very different levels of ICT development, and may be anywhere on the scale from IDI top performers (such as Denmark, Sweden, Norway and Finland) to LCCs (such as Chad, Niger, and Central African Republic). Rather than population density, therefore, it is the concentration of people in certain areas of a country (i.e. percentage of population in urban areas) that seems to play a role in determining ICT development. This is the case, for example, of the top ten countries in the IDI 2013, where the percentage of population living in urban areas are all above 80 per cent.
IDI and population size
The partial correlation analysis did not find a significant relationship between IDI value and population size (r = -0.032) (see Chart 2.11). This means that the total size of the population of a country does not play any role in determining levels of ICT development achieved. Countries with small populations include both IDI top performers (such as Monaco, Iceland and Luxembourg) and LCCs (such as Solomon Islands, Djibouti and Swaziland), while countries with larger populations also exhibit very diverse IDI values (e.g. Japan, United States, France and
Chart 2.9: IDI and percentage of population living in urban areas
Source: ITU.
Chart 2.10: IDI and population density
Note: Chart excludes countries with a population density above 2 000 people per km2 of land area.
Source: ITU.
Germany). These findings are independent of the country’s economic level, as the correlation analysis was controlled for the effect of the GNI p.c. When it comes to ICT development, it may be that the potentially positive and negative factors related to population size cancel each other out. For instance, while a large population naturally means that more people have to be connected and become digital citizens, a larger customer base allows ICT service providers to benefit from economies of scale.
0
r = 0.501
IDI
20
13
0
1
2
3
4
5
6
7
8
9
10
10 20 30 40 50 60 70 80 90 100
Population in urban areas (%)
0
r = 0
IDI
20
13
0
1
2
3
4
5
6
7
8
9
10
500 1'000 1'500 2'000
Density 2013

Chapter 2. The ICT Development Index (IDI)
62
Conversely, countries with large land areas (such as Australia, Canada and the United States) can also have high IDI levels, while there are LCCs with large geographic areas such as India, Democratic Republic of the Congo and Chad.
In conclusion, the strongest relationship remains that between IDI levels and the size of a country’s economy (measured by GNI p.c.). GNI levels are also correlated with other variables, such as population density and share of urban population.
Discounting the effect of GNI levels, the analysis revealed that there is a relationship between ICT performance and share of urban population, while no relationship was found with the other selected geographic variables. The results confirm the strong need to address the urban-rural digital divide that prevails in many developing countries. People living in rural areas, particularly in developing countries, are disadvantaged compared to their urban counterparts because of lower service coverage; they also often lack the economic means to pay for broadband Internet services, as well as the skills to make effective use of ICTs. This applies in particular to most LCCs identified earlier in this chapter (Box 2.2). The majority of LCCs have large rural populations: in 25 out of the 42 LCCs, less than 35 per cent of the population lives in urban areas, and these closely correspond to the list of LDCs.
2.5 IDI and progress towards the Millennium Development Goals (MDGs)
ICTs as development enablersThere is plenty of anecdotal evidence from initiatives in the field of ICT for development that points to the potential impact of ICTs on development. However, quantitative hard evidence of this impact is still limited, especially
Chart 2.11: IDI and population size
Note: Chart excludes China and India.Source: ITU.
Chart 2.12: IDI and land area
Note: Chart excludes countries with a land area above 3 million km2.Source: ITU.
IDI and land area
The partial correlation analysis did not find a significant relationship between IDI value and the size of countries’ land areas (r = 0.017) (see Chart 2.12). This indicates that countries reach very different IDI levels irrespective of geographic size (see Chart 2.12). For example, some economies with small land areas such as Barbados, Bahrain, Hong Kong (China), Singapore, Monaco, Iceland and Luxembourg have high IDI levels, while the opposite is true for LCCs with small land areas (such as Gambia, Rwanda and Swaziland).
0
r = -0.032
IDI
20
13
0
1
2
3
4
5
6
7
8
9
10
50'000'000 100'000'000 150'000'000 200'000'000 250'000'000
Population 2013
r = 0.017
IDI
20
13
0
1
2
3
4
5
6
7
8
9
10
- 500'000 1'000'000 1'500'000 2'000'000 2'500'000 3'000'000
Land area

63
Measuring the Information Society Report 2014
when looking beyond measuring the economic impact. A growing number of studies suggest that ICTs are enablers of all three pillars of sustainable development: social development, economic development and environmental sustainability. In terms of economic development, apart from the ICT sector being an important industry in its own right, studies have linked the expansion of broadband networks and ICT applications to GDP growth and job creation.39 ICTs also provide increased access to education, government and health services, and empower people by providing a platform for communication, the impacts of which are more difficult to measure.
Since the Millennium Declaration was issued in 2000, ICTs have grown unprecedentedly, a trend which has underscored their potential for enabling socio-economic development. In 2000, the international community was only starting to grasp the “catalytic potential of ICTs to advance development agendas and priorities”.40 The potential of ICTs was further emphasized by the World Summit on the Information Society (WSIS), the first phase of which was held in 2003. WSIS recognized ICTs as a transformational technology and as a key to advancing social and economic development. It pointed to the potential of ICTs as enablers for the achievement of internationally agreed development goals, and the need to extend access to ICTs (Box 2.3); for access to ICTs also means access to information and services that may have previously been unavailable, especially to people living in rural and remote areas. ICTs can make a difference in many areas covered by the MDGs, such as poverty reduction and food security (MDG 1), education (MDG 2), gender equality (MDG 3), health (MDG 4, MDG 5, MDG 6) and environmental sustainability (MDG 7). Table 2.10 provides some examples of how ICTs can contribute to each of the MDGs. ICTs are also directly recognized under MDG 8 (Develop a global partnership for development), in Target 18.F: “in cooperation with the private sector, make available the benefits of new technologies, especially information and communications”.
Measuring the link between IDI and the MDGsThe aim of this analysis is to assess the link between ICT development and achievement of the MDGs. It represents an initial attempt to quantify the relationship between ICT development (as measured by the IDI) and the MDGs, and a contribution to the ongoing discussions on the potential of ICTs as development enablers. Such an analysis is particularly timely at this juncture, in the year before the target date for achievement of the MDGs.
Methodology
In order to explore the relationship between IDI and the MDGs, a correlation analysis between IDI values and MDG indicators was conducted for 2011 where data are available for both sets of indicators. The following steps were performed:
• First, developed countries were excluded from the analysis in order to make the results more meaningful for developing countries, which are the target group of the MDGs. A total of 101 developing countries are included in the analysis.
• Second, from the total of 60 official MDG indicators used to measure progress towards the eight MDGs, 38 were identified in respect of which data pertaining to both the MDG indicators and the IDI are available for at least 16 countries.41 The MDG indicators measuring Goal 2 (literacy rate and enrolment in primary education) and Goal 8 (fixed-telephone and mobile-cellular penetration and percentage of Internet users) were not considered, since they are also included in the IDI.
• Third, a simple correlation analysis between IDI, GNI p.c. and MDG indicators was performed in order to explore the relationship between the different indicators. The results of the simple correlation analysis confirmed a significant
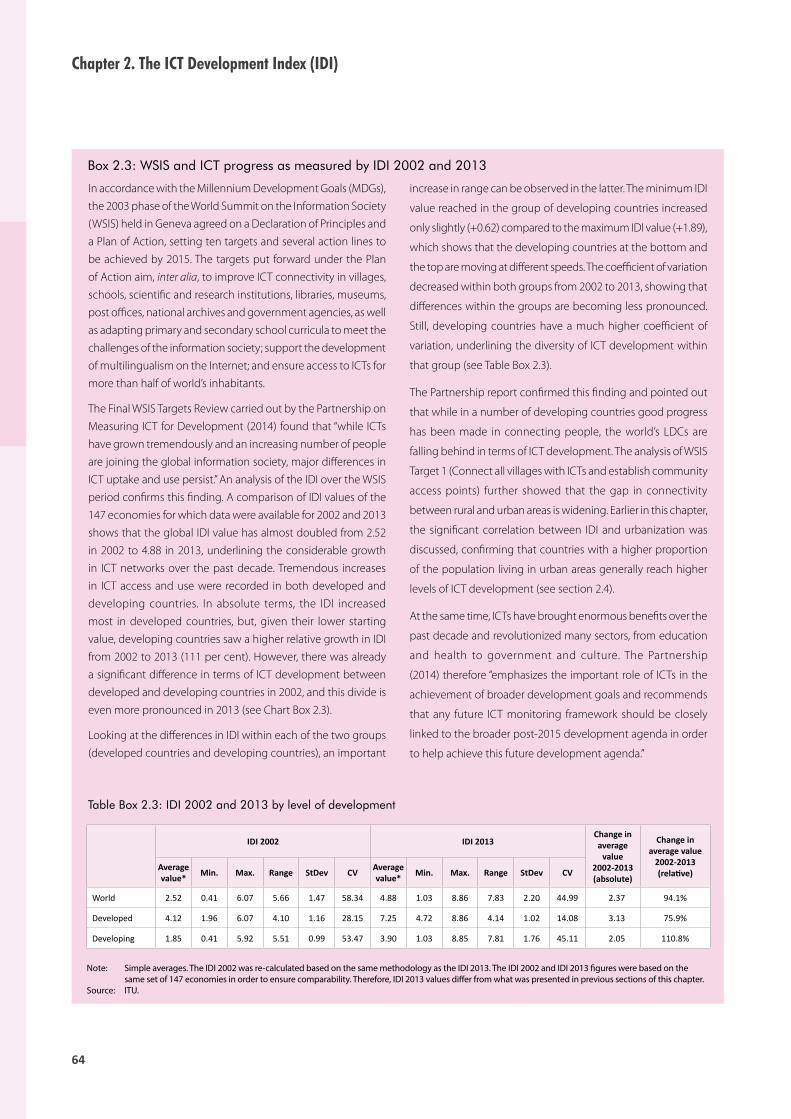
Chapter 2. The ICT Development Index (IDI)
64
Box 2.3: WSIS and ICT progress as measured by IDI 2002 and 2013
In accordance with the Millennium Development Goals (MDGs), the 2003 phase of the World Summit on the Information Society (WSIS) held in Geneva agreed on a Declaration of Principles and a Plan of Action, setting ten targets and several action lines to be achieved by 2015. The targets put forward under the Plan of Action aim, inter alia, to improve ICT connectivity in villages, schools, scientific and research institutions, libraries, museums, post offices, national archives and government agencies, as well as adapting primary and secondary school curricula to meet the challenges of the information society; support the development of multilingualism on the Internet; and ensure access to ICTs for more than half of world’s inhabitants.
The Final WSIS Targets Review carried out by the Partnership on Measuring ICT for Development (2014) found that “while ICTs have grown tremendously and an increasing number of people are joining the global information society, major differences in ICT uptake and use persist.” An analysis of the IDI over the WSIS period confirms this finding. A comparison of IDI values of the 147 economies for which data were available for 2002 and 2013 shows that the global IDI value has almost doubled from 2.52 in 2002 to 4.88 in 2013, underlining the considerable growth in ICT networks over the past decade. Tremendous increases in ICT access and use were recorded in both developed and developing countries. In absolute terms, the IDI increased most in developed countries, but, given their lower starting value, developing countries saw a higher relative growth in IDI from 2002 to 2013 (111 per cent). However, there was already a significant difference in terms of ICT development between developed and developing countries in 2002, and this divide is even more pronounced in 2013 (see Chart Box 2.3).
Looking at the differences in IDI within each of the two groups (developed countries and developing countries), an important
increase in range can be observed in the latter. The minimum IDI
value reached in the group of developing countries increased
only slightly (+0.62) compared to the maximum IDI value (+1.89),
which shows that the developing countries at the bottom and
the top are moving at different speeds. The coefficient of variation
decreased within both groups from 2002 to 2013, showing that
differences within the groups are becoming less pronounced.
Still, developing countries have a much higher coefficient of
variation, underlining the diversity of ICT development within
that group (see Table Box 2.3).
The Partnership report confirmed this finding and pointed out
that while in a number of developing countries good progress
has been made in connecting people, the world’s LDCs are
falling behind in terms of ICT development. The analysis of WSIS
Target 1 (Connect all villages with ICTs and establish community
access points) further showed that the gap in connectivity
between rural and urban areas is widening. Earlier in this chapter,
the significant correlation between IDI and urbanization was
discussed, confirming that countries with a higher proportion
of the population living in urban areas generally reach higher
levels of ICT development (see section 2.4).
At the same time, ICTs have brought enormous benefits over the
past decade and revolutionized many sectors, from education
and health to government and culture. The Partnership
(2014) therefore “emphasizes the important role of ICTs in the
achievement of broader development goals and recommends
that any future ICT monitoring framework should be closely
linked to the broader post-2015 development agenda in order
to help achieve this future development agenda.”
Table Box 2.3: IDI 2002 and 2013 by level of development
Note: Simple averages. The IDI 2002 was re-calculated based on the same methodology as the IDI 2013. The IDI 2002 and IDI 2013 figures were based on the same set of 147 economies in order to ensure comparability. Therefore, IDI 2013 values differ from what was presented in previous sections of this chapter.
Source: ITU.
IDI 2002 IDI 2013Change in average
value 2002-2013 (absolute)
Change in average value
2002-2013 (relative)
Average value* Min. Max. Range StDev CV Average
value* Min. Max. Range StDev CV
World 2.52 0.41 6.07 5.66 1.47 58.34 4.88 1.03 8.86 7.83 2.20 44.99 2.37 94.1%
Developed 4.12 1.96 6.07 4.10 1.16 28.15 7.25 4.72 8.86 4.14 1.02 14.08 3.13 75.9%
Developing 1.85 0.41 5.92 5.51 0.99 53.47 3.90 1.03 8.85 7.81 1.76 45.11 2.05 110.8%
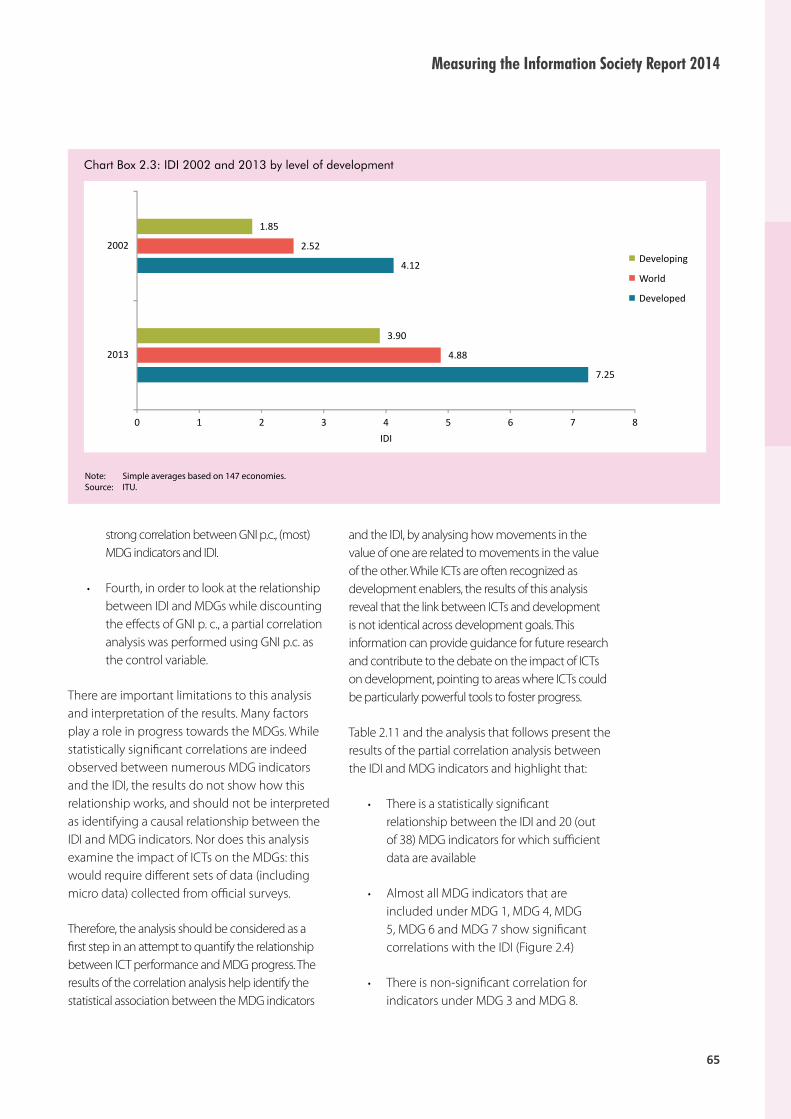
65
Measuring the Information Society Report 2014
Chart Box 2.3: IDI 2002 and 2013 by level of development
Note: Simple averages based on 147 economies. Source: ITU.
strong correlation between GNI p.c., (most) MDG indicators and IDI.
• Fourth, in order to look at the relationship between IDI and MDGs while discounting the effects of GNI p. c., a partial correlation analysis was performed using GNI p.c. as the control variable.
There are important limitations to this analysis and interpretation of the results. Many factors play a role in progress towards the MDGs. While statistically significant correlations are indeed observed between numerous MDG indicators and the IDI, the results do not show how this relationship works, and should not be interpreted as identifying a causal relationship between the IDI and MDG indicators. Nor does this analysis examine the impact of ICTs on the MDGs: this would require different sets of data (including micro data) collected from official surveys.
Therefore, the analysis should be considered as a first step in an attempt to quantify the relationship between ICT performance and MDG progress. The results of the correlation analysis help identify the statistical association between the MDG indicators
and the IDI, by analysing how movements in the value of one are related to movements in the value of the other. While ICTs are often recognized as development enablers, the results of this analysis reveal that the link between ICTs and development is not identical across development goals. This information can provide guidance for future research and contribute to the debate on the impact of ICTs on development, pointing to areas where ICTs could be particularly powerful tools to foster progress.
Table 2.11 and the analysis that follows present the results of the partial correlation analysis between the IDI and MDG indicators and highlight that:
• There is a statistically significant relationship between the IDI and 20 (out of 38) MDG indicators for which sufficient data are available
• Almost all MDG indicators that are included under MDG 1, MDG 4, MDG 5, MDG 6 and MDG 7 show significant correlations with the IDI (Figure 2.4)
• There is non-significant correlation for indicators under MDG 3 and MDG 8.
7.25
4.12
4.88
2.52
3.90
1.85
0 1 2 3 4 5 6 7 8
2013
2002
IDI
Developing
World
Developed

Chapter 2. The ICT Development Index (IDI)
66
Tabl
e 2.
10:
Exam
ples
of c
ontr
ibut
ion
of IC
Ts to
war
ds th
e M
illen
nium
Dev
elop
men
t Goa
ls
Sour
ce:
ITU
and
Bro
adba
nd C
omm
issi
on.42
Mill
enni
um D
evel
opm
ent G
oal
Cont
ributi
on o
f ICT
s
MDG
1 (E
radi
cate
ext
rem
e po
vert
y an
d hu
nger
)•
Incr
ease
GDP
gro
wth
and
job
crea
tion
• Lo
cate
and
trac
k ou
tbre
aks
of d
iseas
e an
d fa
min
e •
Prov
ide
mor
e ac
cura
te w
eath
er in
form
ation
that
hel
ps to
incr
ease
agr
icul
tura
l pro
ducti
on•
Deliv
ery
of re
al-ti
me
mar
ket i
nfor
mati
on/s
ales
pric
es fo
r far
mer
s
MDG
2 (A
chie
ve u
nive
rsal
prim
ary
educ
ation
)•
Impr
ove
acce
ss to
edu
catio
n th
roug
h m
obile
tech
nolo
gies
/rem
ote
lear
ning
• Tr
ain
teac
hers
thro
ugh
ICT-
enha
nced
ser
vice
s an
d cr
eate
net
wor
ks a
mon
g te
ache
rs•
Broa
den
the
avai
labi
lity
of q
ualit
y ed
ucati
onal
mat
eria
ls/re
sour
ce•
Incr
ease
acc
ess
to li
ngui
stica
lly a
nd c
ultu
rally
div
erse
edu
catio
nal c
onte
nt
MDG
3 (P
rom
ote
gend
er e
qual
ity a
nd e
mpo
wer
wom
en)
• G
reat
er a
cces
s to
fina
ncia
l ser
vice
s fo
r wom
en e
ntre
pren
eurs
• De
liver
edu
catio
nal a
nd li
tera
cy p
rogr
amm
es s
peci
fical
ly ta
rget
ed to
poo
r girl
s an
d w
omen
usin
g ap
prop
riate
te
chno
logi
es
MDG
4 (R
educ
e ch
ild m
orta
lity)
• Da
ta c
olle
cted
thro
ugh
ICT
appl
icati
ons
allo
w h
ealth
pro
fess
iona
ls to
ass
ess
child
hea
lth a
nd w
ell-b
eing
, com
pare
in
dica
tors
acr
oss
loca
lities
and
regi
ons,
and
mak
e be
tter
-info
rmed
pub
lic p
olic
y de
cisio
ns
• O
nlin
e co
mm
uniti
es o
f par
ents
and
/or p
aedi
atric
ians
faci
litat
e ex
chan
ge b
etw
een
expe
rts
and
pare
nts
and
cont
ribut
e to
th
e att
ainm
ent o
f phy
sical
, men
tal a
nd s
ocia
l wel
l-bei
ng fo
r inf
ants
MDG
5 (Im
prov
e m
ater
nal h
ealth
)•
Mon
itorin
g of
mat
erna
l hea
lth v
ia te
xt, v
oice
mes
sagi
ng a
nd m
obile
app
s •
Onl
ine
platf
orm
s ar
e se
rvin
g as
an
info
rmati
on a
nd c
omm
unic
ation
hub
for h
ealth
faci
lities
and
sup
porti
ng c
onve
rsati
ons
betw
een
com
mun
ity h
ealth
wor
kers
, mid
wiv
es, c
linic
ians
and
exp
ecta
nt m
othe
rs
MDG
6 (C
omba
t HIV
/AID
S, m
alar
ia a
nd o
ther
dise
ases
)•
Incr
ease
acc
ess
to re
prod
uctiv
e he
alth
info
rmati
on, i
nclu
ding
info
rmati
on o
n pr
even
tion
of d
iseas
es•
Cont
ent-s
harin
g pl
atfor
ms
that
app
ly m
obile
ser
vice
s to
raise
aw
aren
ess
abou
t AID
S an
d co
ndom
use
• M
onito
ring
and
trea
tmen
t of p
atien
ts (e
.g. S
MS
rem
inde
rs fo
r app
oint
men
ts o
r med
ical
trea
tmen
t)•
Impr
ove
acce
ss to
med
ical
dat
abas
es a
nd e
lect
roni
c he
alth
reco
rds
(EH
Rs)
• Li
nk c
omm
unity
hea
lth w
orke
rs to
the
natio
nal h
ealth
syst
em/s
peci
alist
sup
port
MDG
7 (E
nsur
e en
viro
nmen
tal s
usta
inab
ility
)•
Redu
ce g
reen
hous
e ga
s (G
HG
) em
issio
ns th
roug
h de
mat
eria
lizati
on o
f phy
sical
pro
duct
s an
d sy
stem
s, fo
r exa
mpl
e by
su
bstit
uting
the
need
to p
rodu
ce p
hysic
al p
rodu
cts
thro
ugh
the
deliv
ery
of e
-pro
duct
s an
d se
rvic
es•
Clim
ate
adap
tatio
n: S
mar
t pla
nnin
g an
d re
liabl
e ac
cess
to re
al-ti
me
data
for c
limat
e m
onito
ring,
as
wel
l as
the
impl
emen
tatio
n of
ear
ly w
arni
ng sy
stem
s•
Redu
ce e
nerg
y an
d w
ater
con
sum
ption
thro
ugh
smar
t tra
nspo
rtati
on a
nd lo
gisti
cs, d
emat
eria
lizati
on a
nd o
ther
te
chno
logi
es.
• Sm
art g
rids
can
redu
ce e
nerg
y co
nsum
ption
thro
ugh
impr
oved
hea
ting,
coo
ling
and
mon
itorin
g te
chno
logi
es
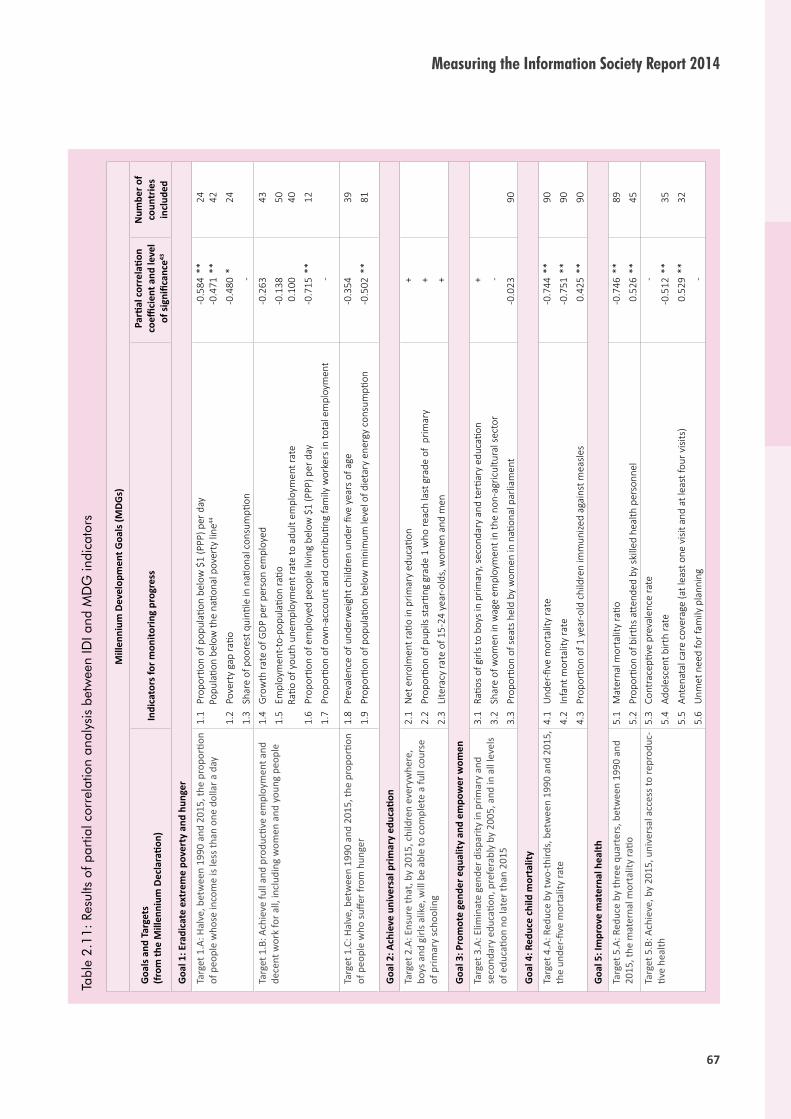
67
Measuring the Information Society Report 2014
Tabl
e 2.
11:
Resu
lts o
f par
tial c
orre
latio
n an
alys
is b
etw
een
IDI a
nd M
DG
indi
cato
rs
Mill
enni
um D
evel
opm
ent G
oals
(MDG
s)
Goa
ls a
nd T
arge
ts
(from
the
Mill
enni
um D
ecla
ratio
n)In
dica
tors
for m
onito
ring
prog
ress
Parti
al c
orre
latio
n co
effici
ent a
nd le
vel
of si
gnifi
canc
e43
Num
ber o
f co
untr
ies
incl
uded
Goa
l 1: E
radi
cate
ext
rem
e po
vert
y an
d hu
nger
Targ
et 1
.A: H
alve
, bet
wee
n 19
90 a
nd 2
015,
the
prop
ortio
n of
peo
ple
who
se in
com
e is
less
than
one
dol
lar a
day
1.1
Pro
porti
on o
f pop
ulati
on b
elow
$1
(PPP
) per
day
Pop
ulati
on b
elow
the
natio
nal p
over
ty li
ne44
1.2
Pov
erty
gap
ratio
1.3
Sha
re o
f poo
rest
qui
ntile
in n
ation
al c
onsu
mpti
on
-0.5
84
-0.4
71
-0.4
80
-
**
** *
24
42 24
Targ
et 1
.B: A
chie
ve fu
ll an
d pr
oduc
tive
empl
oym
ent a
nd
dece
nt w
ork
for a
ll, in
clud
ing
wom
en a
nd y
oung
peo
ple
1.4
Gro
wth
rate
of G
DP p
er p
erso
n em
ploy
ed
1.5
Em
ploy
men
t-to-
popu
latio
n ra
tio
R
atio
of y
outh
une
mpl
oym
ent r
ate
to a
dult
empl
oym
ent r
ate
1.6
Pro
porti
on o
f em
ploy
ed p
eopl
e liv
ing
belo
w $
1 (P
PP) p
er d
ay
1.7
Pro
porti
on o
f ow
n-ac
coun
t and
con
trib
uting
fam
ily w
orke
rs in
tota
l em
ploy
men
t
-0.2
63
-0.1
38
0.10
0
-0.7
15
-
**
43 50
40 12
Targ
et 1
.C: H
alve
, bet
wee
n 19
90 a
nd 2
015,
the
prop
ortio
n of
peo
ple
who
suffe
r fro
m h
unge
r1.
8 P
reva
lenc
e of
und
erw
eigh
t chi
ldre
n un
der fi
ve y
ears
of a
ge
1.9
Pro
porti
on o
f pop
ulati
on b
elow
min
imum
leve
l of d
ieta
ry e
nerg
y co
nsum
ption
-0.3
54
-0.5
02**
39 81
Goa
l 2: A
chie
ve u
nive
rsal
prim
ary
educ
ation
Targ
et 2
.A: E
nsur
e th
at, b
y 20
15, c
hild
ren
ever
ywhe
re,
boys
and
girl
s alik
e, w
ill b
e ab
le to
com
plet
e a
full
cour
se
of p
rimar
y sc
hool
ing
2.1
Net
enr
olm
ent r
atio
in p
rimar
y ed
ucati
on
2.2
Pro
porti
on o
f pup
ils st
artin
g gr
ade
1 w
ho re
ach
last
gra
de o
f pr
imar
y
2.3
Lite
racy
rate
of 1
5-24
yea
r-ol
ds, w
omen
and
men
+ + +
Goa
l 3: P
rom
ote
gend
er e
qual
ity a
nd e
mpo
wer
wom
en
Targ
et 3
.A: E
limin
ate
gend
er d
ispar
ity in
prim
ary
and
seco
ndar
y ed
ucati
on, p
refe
rabl
y by
200
5, a
nd in
all
leve
ls of
edu
catio
n no
late
r tha
n 20
15
3.1
Rati
os o
f girl
s to
boy
s in
prim
ary,
seco
ndar
y an
d te
rtiar
y ed
ucati
on
3.2
Sha
re o
f wom
en in
wag
e em
ploy
men
t in
the
non-
agric
ultu
ral s
ecto
r
3.3
Pro
porti
on o
f sea
ts h
eld
by w
omen
in n
ation
al p
arlia
men
t
+ -
-0.0
2390
Goa
l 4: R
educ
e ch
ild m
orta
lity
Targ
et 4
.A: R
educ
e by
two-
third
s, b
etw
een
1990
and
201
5,
the
unde
r-five
mor
talit
y ra
te4.
1 U
nder
-five
mor
talit
y ra
te
4.2
Inf
ant m
orta
lity
rate
4.3
Pro
porti
on o
f 1 y
ear-
old
child
ren
imm
unize
d ag
ains
t mea
sles
-0.7
44
-0.7
51
0.42
5
** ** **
90 90 90
Goa
l 5: I
mpr
ove
mat
erna
l hea
lth
Targ
et 5
.A: R
educ
e by
thre
e qu
arte
rs, b
etw
een
1990
and
20
15, t
he m
ater
nal m
orta
lity
ratio
5.1
Mat
erna
l mor
talit
y ra
tio
5.2
Pro
porti
on o
f birt
hs a
tten
ded
by s
kille
d he
alth
per
sonn
el
-0.7
46
0.52
6
** **
89 45Ta
rget
5.B
: Ach
ieve
, by
2015
, uni
vers
al a
cces
s to
repr
oduc
-tiv
e he
alth
5.3
Con
trac
eptiv
e pr
eval
ence
rate
5.4
Ado
lesc
ent b
irth
rate
5.5
Ant
enat
al c
are
cove
rage
(at l
east
one
visi
t and
at l
east
four
visi
ts)
5.6
Unm
et n
eed
for f
amily
pla
nnin
g
-
-0.5
12
0.52
9 -
** **
35 32
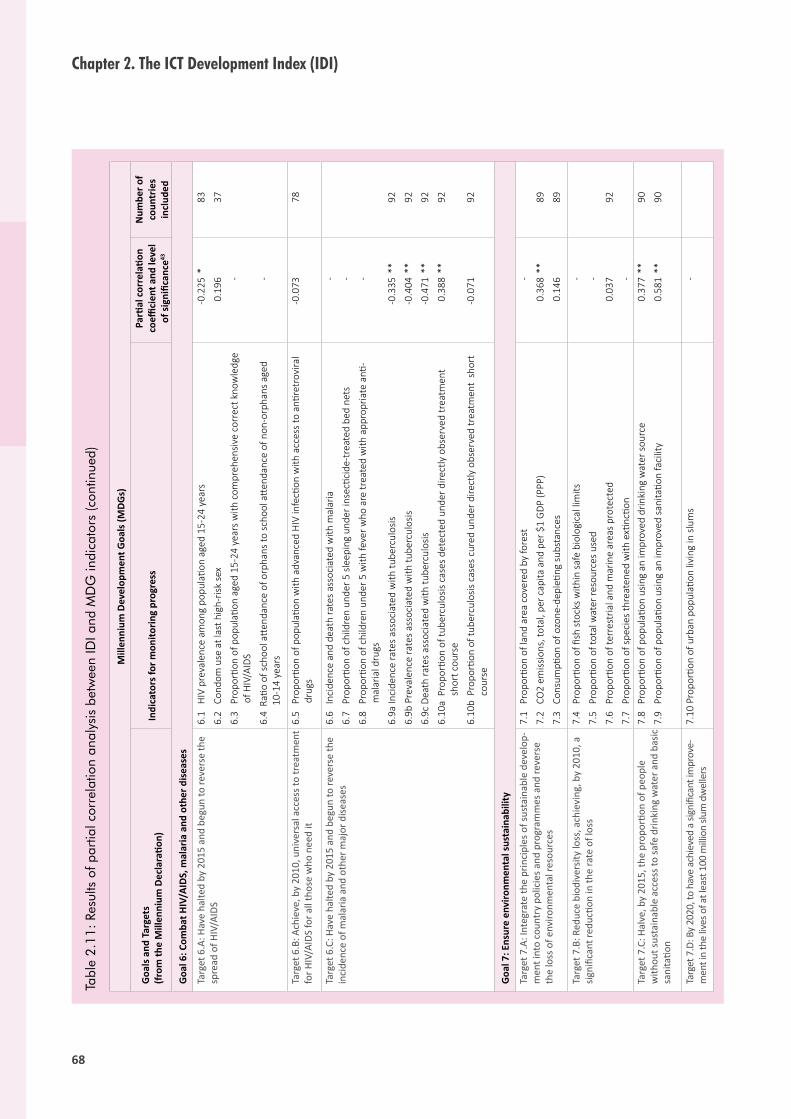
Chapter 2. The ICT Development Index (IDI)
68
Tabl
e 2.
11:
Resu
lts o
f par
tial c
orre
latio
n an
alys
is b
etw
een
IDI a
nd M
DG
indi
cato
rs (c
ontin
ued)
Mill
enni
um D
evel
opm
ent G
oals
(MDG
s)
Goa
ls a
nd T
arge
ts
(from
the
Mill
enni
um D
ecla
ratio
n)In
dica
tors
for m
onito
ring
prog
ress
Parti
al c
orre
latio
n co
effici
ent a
nd le
vel
of si
gnifi
canc
e43
Num
ber o
f co
untr
ies
incl
uded
Goa
l 6: C
omba
t HIV
/AID
S, m
alar
ia a
nd o
ther
dis
ease
s
Targ
et 6
.A: H
ave
halte
d by
201
5 an
d be
gun
to re
vers
e th
e sp
read
of H
IV/A
IDS
6.1
HIV
pre
vale
nce
amon
g po
pula
tion
aged
15-
24 y
ears
6.2
Con
dom
use
at l
ast h
igh-
risk
sex
6.3
Pro
porti
on o
f pop
ulati
on a
ged
15-2
4 ye
ars
with
com
preh
ensiv
e co
rrec
t kno
wle
dge
of H
IV/A
IDS
6.4
Rati
o of
sch
ool a
tten
danc
e of
orp
hans
to s
choo
l att
enda
nce
of n
on-o
rpha
ns a
ged
1
0-14
yea
rs
-0.2
25
0.19
6 - -
*83 37
Targ
et 6
.B: A
chie
ve, b
y 20
10, u
nive
rsal
acc
ess t
o tr
eatm
ent
for H
IV/A
IDS
for a
ll th
ose
who
nee
d it
6.5
Pro
porti
on o
f pop
ulati
on w
ith a
dvan
ced
HIV
infe
ction
with
acc
ess
to a
ntire
trov
iral
dr
ugs
-0.0
7378
Targ
et 6
.C: H
ave
halte
d by
201
5 an
d be
gun
to re
vers
e th
e in
cide
nce
of m
alar
ia a
nd o
ther
maj
or d
iseas
es6.
6 I
ncid
ence
and
dea
th ra
tes
asso
ciat
ed w
ith m
alar
ia
6.7
Pro
porti
on o
f chi
ldre
n un
der 5
sle
epin
g un
der i
nsec
ticid
e-tr
eate
d be
d ne
ts
6.8
Pro
porti
on o
f chi
ldre
n un
der 5
with
feve
r who
are
trea
ted
with
app
ropr
iate
anti
-
mal
aria
l dru
gs
6.9a
Inci
denc
e ra
tes
asso
ciat
ed w
ith tu
berc
ulos
is
6.9b
Pre
vale
nce
rate
s as
soci
ated
with
tube
rcul
osis
6.9c
Dea
th ra
tes
asso
ciat
ed w
ith tu
berc
ulos
is
6.10
a P
ropo
rtion
of t
uber
culo
sis c
ases
det
ecte
d un
der d
irect
ly o
bser
ved
trea
tmen
t
shor
t cou
rse
6.10
b P
ropo
rtion
of t
uber
culo
sis c
ases
cur
ed u
nder
dire
ctly
obs
erve
d tr
eatm
ent
shor
t
co
urse
- - -
-0.3
35
-0.4
04
-0.4
71
0.38
8
-0.0
71
** ** ** **
92 92 92 92
92
Goa
l 7: E
nsur
e en
viro
nmen
tal s
usta
inab
ility
Targ
et 7
.A: I
nteg
rate
the
prin
cipl
es o
f sus
tain
able
dev
elop
-m
ent i
nto
coun
try
polic
ies a
nd p
rogr
amm
es a
nd re
vers
e th
e lo
ss o
f env
ironm
enta
l res
ourc
es
7.1
Pro
porti
on o
f lan
d ar
ea c
over
ed b
y fo
rest
7.2
CO
2 em
issio
ns, t
otal
, per
cap
ita a
nd p
er $
1 G
DP (P
PP)
7.3
Con
sum
ption
of o
zone
-dep
letin
g su
bsta
nces
-
0.36
8
0.14
6
**89 89
Targ
et 7
.B: R
educ
e bi
odiv
ersit
y lo
ss, a
chie
ving
, by
2010
, a
signi
fican
t red
uctio
n in
the
rate
of l
oss
7.4
Pro
porti
on o
f fish
stoc
ks w
ithin
saf
e bi
olog
ical
lim
its
7.5
Pro
porti
on o
f tot
al w
ater
reso
urce
s us
ed
7.6
Pro
porti
on o
f ter
rest
rial a
nd m
arin
e ar
eas
prot
ecte
d
7.7
Pro
porti
on o
f spe
cies
thre
aten
ed w
ith e
xtinc
tion
- -
0.03
7 -
92
Targ
et 7
.C: H
alve
, by
2015
, the
pro
porti
on o
f peo
ple
with
out s
usta
inab
le a
cces
s to
safe
drin
king
wat
er a
nd b
asic
sa
nita
tion
7.8
Pro
porti
on o
f pop
ulati
on u
sing
an im
prov
ed d
rinki
ng w
ater
sou
rce
7.9
Pro
porti
on o
f pop
ulati
on u
sing
an im
prov
ed s
anita
tion
faci
lity
0.37
7
0.58
1
** **
90 90
Targ
et 7
.D: B
y 20
20, t
o ha
ve a
chie
ved
a sig
nific
ant i
mpr
ove-
men
t in
the
lives
of a
t lea
st 1
00 m
illion
slum
dw
elle
rs7.
10 P
ropo
rtion
of u
rban
pop
ulati
on li
ving
in s
lum
s
-

69
Measuring the Information Society Report 2014
Tabl
e 2.
11:
Resu
lts o
f par
tial c
orre
latio
n an
alys
is b
etw
een
IDI a
nd M
DG
indi
cato
rs (c
ontin
ued)
Mill
enni
um D
evel
opm
ent G
oals
(MDG
s)
Goa
ls a
nd T
arge
ts
(from
the
Mill
enni
um D
ecla
ratio
n)In
dica
tors
for m
onito
ring
prog
ress
Parti
al c
orre
latio
n co
effici
ent a
nd le
vel
of si
gnifi
canc
e43
Num
ber o
f co
untr
ies
incl
uded
Goa
l 8: D
evel
op a
glo
bal p
artn
ersh
ip fo
r dev
elop
men
tTa
rget
8.A
: Dev
elop
furt
her a
n op
en, r
ule-
base
d, p
redi
ct-
able
, non
-disc
rimin
ator
y tr
adin
g an
d fin
anci
al sy
stem
In
clud
es a
com
mitm
ent t
o go
od g
over
nanc
e, d
evel
opm
ent
and
pove
rty
redu
ction
– b
oth
natio
nally
and
inte
rnati
on-
ally
Som
e of
the
indi
cato
rs li
sted
bel
ow a
re m
onito
red
sepa
rate
ly fo
r the
leas
t dev
elop
ed
coun
trie
s (L
DCs)
, Afr
ica,
land
lock
ed d
evel
opin
g co
untr
ies
(LLD
Cs) a
nd s
mal
l isla
nd
deve
lopi
ng st
ates
(SID
S)
Offi
cial
dev
elop
men
t ass
istan
ce (O
DA)
8.1
Net
ODA
, tot
al a
nd to
the
LDCs
, as p
erce
ntag
e of
OEC
D/DA
C do
nors
’ gro
ss n
ation
al in
com
e8.
2 P
ropo
rtion
of t
otal
bila
tera
l, se
ctor
-allo
cabl
e O
DA o
f OEC
D/DA
C do
nors
to b
asic
soci
al s
ervi
ces
(bas
ic e
duca
tion,
prim
ary
heal
thca
re, n
utriti
on, s
afe
wat
er a
nd
sa
nita
tion)
- -
Targ
et 8
.B: A
ddre
ss th
e sp
ecia
l nee
ds o
f the
leas
t dev
el-
oped
cou
ntrie
s
Incl
udes
: tar
iff a
nd q
uota
free
acc
ess f
or th
e le
ast d
evel
-op
ed c
ount
ries’
exp
orts
; enh
ance
d pr
ogra
mm
e of
deb
t re
lief f
or h
eavi
ly in
debt
ed p
oor c
ount
ries (
HIPC
) and
can
-ce
llatio
n of
offi
cial
bila
tera
l deb
t; an
d m
ore
gene
rous
ODA
fo
r cou
ntrie
s com
mitt
ed to
pov
erty
redu
ction
8.3
Pro
porti
on o
f bila
tera
l offi
cial
dev
elop
men
t ass
istan
ce o
f OEC
D/DA
C do
nors
that
is
un
tied
8.4
ODA
rece
ived
in L
LDCs
as
a pr
opor
tion
of th
eir g
ross
nati
onal
inco
mes
8.5
ODA
rece
ived
in S
IDS
as a
pro
porti
on o
f the
ir gr
oss
natio
nal i
ncom
es
-
0.44
0
-0.3
38
17 7
Targ
et 8
.C: A
ddre
ss th
e sp
ecia
l nee
ds o
f lan
dloc
ked
deve
lopi
ng c
ount
ries a
nd sm
all i
sland
dev
elop
ing
stat
es
(thr
ough
the
Prog
ram
me
of A
ction
for t
he S
usta
inab
le
Deve
lopm
ent o
f Sm
all I
sland
Dev
elop
ing
Stat
es a
nd th
e ou
tcom
e of
the
twen
ty-s
econ
d sp
ecia
l ses
sion
of th
e Ge
nera
l Ass
embl
y)
Mar
ket a
cces
s 8.
6a P
ropo
rtion
of t
otal
dev
elop
ed-c
ount
ry im
port
s (b
y va
lue
and
excl
udin
g ar
ms)
from
deve
lopi
ng c
ount
ries,
adm
itted
free
of d
uty
8.6a
Pro
porti
on o
f tot
al d
evel
oped
cou
ntry
impo
rts
(by
valu
e an
d ex
clud
ing
arm
s) fr
om
le
ast d
evel
oped
cou
ntrie
s, a
dmitt
ed fr
ee o
f dut
y8.
7 A
vera
ge ta
riffs
impo
sed
by d
evel
oped
cou
ntrie
s on
agr
icul
tura
l pro
duct
s an
d
te
xtile
s an
d cl
othi
ng fr
om d
evel
opin
g co
untr
ies
8.8
Agr
icul
tura
l sup
port
esti
mat
e fo
r OEC
D co
untr
ies
as a
per
cent
age
of th
eir g
ros
do
mes
tic p
rodu
ct8.
9 P
ropo
rtion
of O
DA p
rovi
ded
to h
elp
build
trad
e ca
paci
ty
-0
.213
-0.2
22 - - -
90
23
Targ
et 8
.D: D
eal c
ompr
ehen
sivel
y w
ith th
e de
bt p
robl
ems
of d
evel
opin
g co
untr
ies t
hrou
gh n
ation
al a
nd in
tern
ation
al
mea
sure
s in
orde
r to
mak
e de
bt su
stai
nabl
e in
the
long
te
rm
Debt
sus
tain
abili
ty
8.10
Tot
al n
umbe
r of c
ount
ries
that
hav
e re
ache
d th
eir H
IPC
deci
sion
poin
ts a
nd n
umbe
r
that
hav
e re
ache
d th
eir H
IPC
com
pleti
on p
oint
s (c
umul
ative
)8.
11 D
ebt r
elie
f com
mitt
ed u
nder
HIP
C an
d M
DRI I
nitia
tives
8.12
Deb
t ser
vice
as
a pe
rcen
tage
of e
xpor
ts o
f goo
ds a
nd s
ervi
ces
- -0.
160
71
Targ
et 8
.E: I
n co
oper
ation
with
pha
rmac
eutic
al c
ompa
nies
, pr
ovid
e ac
cess
to a
fford
able
ess
entia
l dru
gs in
dev
elop
ing
coun
trie
s
8.13
Pro
porti
on o
f pop
ulati
on w
ith a
cces
s to
affo
rdab
le e
ssen
tial d
rugs
on
a su
stai
nabl
e
ba
sis-
Targ
et 8
.F: I
n co
oper
ation
with
the
priv
ate
sect
or, m
ake
avai
labl
e th
e be
nefit
s of n
ew te
chno
logi
es, e
spec
ially
info
r-m
ation
and
com
mun
icati
ons
8.14
Fix
ed-t
elep
hone
sub
scrip
tions
per
100
inha
bita
nts
8.15
Mob
ile-c
ellu
lar s
ubsc
riptio
ns p
er 1
00 in
habi
tant
s
8.16
Int
erne
t use
rs p
er 1
00 in
habi
tant
s
+ + +
Not
e:
**Si
gnifi
cant
at 0
.01
leve
l. *S
igni
fican
t at 0
.05
leve
l. –
Insu
ffici
ent d
ata.
+Th
e in
dica
tor o
r sim
ilar i
ndic
ator
is in
clud
ed in
the
IDI.
Sour
ce:
UN
for t
he li
st o
f MD
G in
dica
tors
and
ITU
for t
he c
orre
latio
n re
sults
.

Chapter 2. The ICT Development Index (IDI)
70
The following section presents a more detailed analysis of the MDG indicators for which significant partial correlations with the IDI were found.
IDI and MDG 1: Eradicate extreme poverty and hunger
The results of the partial correlation analysis indicate that there is a significant negative correlation between IDI, on the one hand, and the proportion of people whose income is less than one dollar a day as well as the percentage
Figure 2.4: Significant partial correlations between IDI and MDG indicators
Source: ITU.
of population that is undernourished, on the other. High IDI levels are associated with lower percentages of undernourished population and lower proportions of population living below the poverty line (Chart 2.13).
IDI and MDG 4: Reduce child mortality
A strong negative correlation was found between IDI and the indicators of MDG 4 on child and infant mortality, in other words, the higher the IDI, the lower infant and child
Goal 1
1.1 Proportion of population below $1 (PPP) per day1.1 Population below national poverty line1.2 Poverty gap ratio1.6 Proportion of employed people living below 1$ per day1.9 Proportion of population below minimum level of dietary energy consumption
Goal 66.1 HIV prevalence among population aged 15-49 years old6.9 Incidence, prevalence and death rates associated with tuberculosis6.10 Proportion of tuberculosis cases detected and cured under directly observed treatment short course
Goal 44.1 Under-five mortality rate4.2 Infant mortality rate4.3 Proportion of 1 year-old children immunised against measles
Goal 55.1 Maternal mortality ratio5.2 Proportion of births attended by skilled health personnel5.4 Adolescent birth rate5.5 Antenatal care coverage (at least one visit and at least four visits)
IDI
Goal 77.2 CO2 emissions, metric tons of CO2 per capita7.8 Proportion of population using an improved drinking water source7.9 Proportion of population using improved sanitation facility

71
Measuring the Information Society Report 2014
Chart 2.13: IDI and MDG 1: Halve the proportion of people whose income is less than one dollar a day and the proportion of people who suffer from hunger, 2011
Source: ITU.
0
20
40
60
80
100
- 1 2 3 4 5
IDI
r = -0.584
Po
pu
lati
on
be
low
$1
(P
PP
) p
er
da
y,
pe
rce
nta
ge
r = -0.471
Po
pu
lati
on
be
low
na
tio
na
l p
ove
rty
lin
e,
tota
l, p
erc
en
tag
e
0
20
40
60
80
100
- 1 2 3 4 5
IDI
r = -0.480
Po
ve
rty
ga
p r
ati
o a
t $
1 a
da
y (
PP
P),
pe
rce
nta
ge
0
10
20
30
40
50
- 1 2 3 4 5
IDI
r = -0.715
Pro
po
rtio
n o
f e
mp
loye
d p
eo
ple
liv
ing
be
low
$1
(P
PP
) p
er
da
y, p
erc
en
tag
e
0
5
10
15
20
25
30
- 1 2 3 4 5
IDI
r = -0.502
Po
pu
lati
on
un
de
rno
uri
she
d,
pe
rce
nta
ge
0
20
40
60
80
100
- 1 2 3 4 5
IDI

Chapter 2. The ICT Development Index (IDI)
72
Chart 2.14: IDI and MDG 4: Reduce child mortality, 2011
Source: ITU.
r = -0.744
Ch
ild
ren
un
de
r fi
ve
mo
rta
lity
ra
te
pe
r 1
'00
0 l
ive
bir
ths
0
20
40
60
80
100
120
140
160
180
200
- 1 2 3 4 5
IDI
r = -0.751
0
10
20
30
40
50
60
70
80
90
100
- 1 2 3 4 5
IDI
Infa
nt
mo
rta
lity
ra
te (
0-1
ye
ar)
pe
r 1
'00
0 l
ive
bir
ths
r = 0.425
Ch
ild
ren
1 y
ea
r o
ld i
mm
un
ize
d
aga
inst
me
asl
es,
pe
rce
nta
ge
0
20
40
60
80
100
- 1 2 3 4 5
IDI
mortality rates (see Chart 2.14). There is also a significant positive relationship between the percentage of one year olds that are immunized against measles and the IDI, meaning the higher the IDI, the higher the proportion of children that are immunized. With regard to MDG 4, ICTs can contribute, for example, through improved monitoring and surveillance of infants and children, through the analysis of health data collected through public health applications and by serving as a platform for exchange and advocacy. In remote and rural areas, ICTs may be the main means of communicating during an emergency or of getting urgent medical attention remotely.
IDI and MDG 5: Improve maternal health
There is a significant negative correlation between IDI and the indicators of MDG 5 on maternal mortality and adolescent birth rate. Countries with higher IDI have lower levels of maternal mortality (see Chart 2.15) and lower adolescent birth rates. Attendance of skilled health personnel at birth and a minimum of antenatal care visits, both of which are positively correlated with IDI, are essential for reducing maternal mortality. ICTs can complement and facilitate those essential services through the monitoring of maternal health, for example, via SMS and by providing information-sharing platforms (see Box 2.4).

73
Measuring the Information Society Report 2014
Chart 2.15: IDI and MDG 5, Target 5.A: Reduce the maternal mortality ratio, 2011
Source: ITU.
r = -0.746
Ma
tern
al
mo
rta
lity
ra
tio
pe
r 1
00
'00
0 l
ive
bir
ths
0
100
200
300
400
500
600
700
- 1 2 3 4 5
IDI
r = 0.526
Bir
ths
att
en
de
d b
y s
kil
led
he
alt
h
pe
rso
nn
el,
pe
rce
nta
ge
0
20
40
60
80
100
120
140
- 1 2 3 4 5
IDI
r = -0.512
Ad
ole
sce
nt
bir
th r
ate
,
pe
r 1
'00
0 w
om
en
0
20
40
60
80
100
120
140
160
180
- 1 2 3 4 5
IDI
r = 0.529An
ten
ata
l ca
re c
ove
rag
e,
at
lea
st
fou
r vis
its,
pe
rce
nta
ge
0
20
40
60
80
100
120
140
- 1 2 3 4 5
IDI
IDI and MDG 6: Combat HIV/AIDS, malaria and other diseases
With regard to MDG 6 on combating HIV/AIDS, malaria and other diseases such as tuberculosis, it was observed that while the incidence and prevalence of malaria and tuberculosis and associated death rates decrease with higher IDI levels (as shown by a significant negative correlation), there was no relationship between treatment success rates and IDI levels. The same can be observed with regard to HIV/AIDS: the higher the IDI, the lower the percentage of people living with HIV, but no relationship exists between antiretroviral therapy coverage
among people with advanced HIV and IDI (see Chart 2.16). ICTs can help raise awareness and provide access to health information, including information on preventive measures. They can be used in the monitoring and treatment of patients and can link practitioners to the national healthcare system (see Box 2.4)
IDI and MDG 7: Ensure environmental sustain-ability
MDG 7 Target 7.C: “Halve, by 2015, the proportion of the population without sustainable access to safe drinking water and basic sanitation” also displays a significant

Chapter 2. The ICT Development Index (IDI)
74
Box 2.4: Thailand: Smart phones and volunteers fight drug-resistant malaria
In 2008, evidence showed that malaria parasites in Cambodia and Thailand were developing resistance to artemisinin, the most effective single drug for treating malaria. In response, the countries, with support from the World Health Organization (WHO), launched a joint monitoring, prevention and treatment project in seven provinces along their shared border. In Thailand, more than 300 volunteer village malaria health workers were trained to test for malaria and directly observe the treatment
of patients with confirmed malaria in remote villages. The use of smartphones to capture essential data on the patients and monitor their treatment has accelerated progress. An electronic malaria information system (e-MIS) uploaded on the health workers’ mobile devices shows malaria volunteers where to find patients and the status of their treatment, and helps analyse the situation and trends
Source: MDG Fact Sheet.45
positive correlation with IDI. The higher the IDI, the higher the proportion of the population using improved drinking water sources and sanitation facilities (see Chart 2.17). ICTs can contribute to the improved management of water and sanitation facilities, by providing timely information on weather and water management and locating new sources of water. Furthermore, ICTs such as mobile phones and the Internet can help inform people and allow them to share information on the use and availability of facilities.46 Results are mixed for the other targets under MDG 7, no statistically significant relationship being observed between IDI and the proportion of terrestrial and marine areas protected (Target 7.B) or the consumption of ozone-depleting substances. On the other hand, a significant positive correlation exists between carbon dioxide (CO2) emissions and IDI, countries with a higher IDI producing more CO2. This points to the possible negative effects that ICTs can have on the environment, as the manufacture and use of ICTs and ICT equipment require increased energy consumption and lead to the production of e-waste.47
Linking IDI growth and progress to-wards achieving the MDGsThe first part of this section highlighted the significant correlations between IDI and a number of MDG indicators. It showed that
developing countries with higher IDI levels generally fare better on numerous MDGs. To go one step further, this second part analyses the correlation between growth in IDI and changes in MDG indicators between the years 2002 and 2011. This analysis shows to what extent growth in the IDI can be associated with progress towards the MDGs over the ten-year period. For example, if increases in ICT developments lead to a reduction of the proportion of people that suffer from hunger, then the percentage increase in the IDI value is expected to be significantly and negatively correlated with the percentage decrease in the level of undernourished population in a country.
Methodology
In order to explore the relationship between increases in IDI levels and changes in MDG indicators, a simple correlation analysis was carried out between the percentage change in IDI values and the percentage change in values of MDG indicators, where 2002 and 2011 data are available for both sets of indicators. The following steps were performed:
• As in the first part of this section, developed countries were excluded from the analysis in order to make the results more meaningful for developing countries, which are the target group of the MDGs.

75
Measuring the Information Society Report 2014
Chart 2.16: IDI and MDG 6, Target 6.C: Have halted by 2015 and begun to reverse the spread of HIV, malaria and other major diseases, 2011
Source: ITU.
r = -0.225
Pe
op
le l
ivin
g w
ith
HIV
, 1
5-4
9 y
ea
rs o
ld,
pe
rce
nta
ge
0
5
10
15
20
25
30
- 1 2 3 4 5
IDI
r = -0.335
Tub
erc
ulo
sis
inci
de
nce
ra
te p
er
ye
ar
pe
r 1
00
'00
0 p
op
ula
tio
n (
mid
-po
int)
0
50
100
150
200
250
300
350
400
450
500
- 1 2 3 4 5
IDI
r = 0.388
Tub
erc
ulo
sis
de
tect
ion
ra
te u
nd
er
DO
TS
,
pe
rce
nta
ge
(m
id-p
oin
t)
0
20
40
60
80
100
120
- 1 2 3 4 5IDI
r = -0.404
Tub
erc
ulo
sis
pre
va
len
ce r
ate
pe
r 1
00
'00
0 p
op
ula
tio
n (
mid
-po
int)
0
100
200
300
400
500
- 1 2 3 4 5IDI
r = -0.471
Tub
erc
ulo
sis
de
ath
ra
te p
er
ye
ar
pe
r 1
00
'00
0 p
op
ula
tio
n (
mid
-po
int)
0
20
40
60
80
100
- 1 2 3 4 5
IDI

Chapter 2. The ICT Development Index (IDI)
76
Chart 2.17: IDI and MDG 7, Target 7.C: Halve, by 2015, the proportion of the population without sustainable access to safe drinking water and basic sanitation, 2011
Source: ITU.
r = 0.368
Ca
rbo
n d
ioxid
e e
mis
sio
ns
(CO
2),
me
tric
ton
s o
f C
O2
pe
r ca
pit
a (
CD
IAC
)
0
0.2
0.4
0.6
0.8
1.0
- 1 2 3 4 5
IDI
r = 0.377
Pro
po
rtio
n o
f th
e p
op
ula
tio
n u
sin
g
imp
rove
d d
rin
kin
g w
ate
r so
urc
es,
to
tal
0
20
40
60
80
100
- 1 2 3 4 5
IDI
r = 0.581
Pro
po
rtio
n o
f th
e p
op
ula
tio
n u
sin
g
imp
rove
d s
an
ita
tio
n f
aci
liti
es,
to
tal
0
20
40
60
80
100
- 1 2 3 4 5
IDI
• A simple correlation analysis between percentage change in IDI and percentage change in MDG indicators between 2002 and 2011 was performed. This analysis included the 38 indicators for which data are available for 2002 and 2011 for both the MDG indicators and the IDI. The number of countries included in the analysis ranges from 16 to 101. As the percentage change in MDG indicators over the time period under consideration is not correlated with GNI p.c., a simple correlation analysis is sufficient to
examine the relationship between the indicators.
• A simple correlation analysis was further performed on subgroups of countries. The groups were derived using quartiles of countries according to their level of percentage change in IDI between 2002 and 2011. The four groups are: group 1 (percentage change of 0.70 or below), group 2 (percentage change of 0.71 to 0.82), group 3 (percentage change of 0.83 to 0.97) and group 4 (percentage

77
Measuring the Information Society Report 2014
change of 0.98 to 1.75). In addition, the performance of LDCs against non-LDCs was examined to explain where a stronger relationship exists (Table 2.12).
Findings
Out of the 38 indicators mentioned in the earlier section, the percentage change in value between 2002 and 2011 for nine MDG indicators was found to be significantly correlated with the percentage change in the IDI (Table 2.12 and Figure 2.5). The results derived from the simple correlation analysis are highlighted below.
Goal 1:
There is a significant negative correlation between percentage change (increase) in IDI and percentage change in the proportion of population living below the national poverty line, as well as between percentage change in IDI and percentage change in the undernourished population in developing countries. This means that there is a relationship between improved ICT access/usage and poverty reduction. In particular, countries that have improved their IDI levels the most between 2002 and 2011 (group 4) showed the strongest significant correlation with population below the poverty line. Conversely, countries with the lowest improvements in their IDI values (group 1) showed the weakest relationship.
Goal 3:
A significant positive correlation exists between percentage increase in IDI and percentage change in the number of seats held by women in parliament. Although no relationship existed between the IDI and this indicator in the earlier section where 2011 data were analysed, improvements in the level of ICT access and use between the ten-year periods have shown a positive relationship with improving gender equality and the role of women in parliament in developing countries, particularly in non-LDCs.
Tabl
e 2.
12:
Sim
ple
corr
elat
ion
anal
ysis
bet
wee
n re
lativ
e ch
ange
in ID
I val
ues
and
MD
G in
dica
tors
200
2-20
11, d
evel
opin
g co
untr
ies
Not
e:
* Si
gnifi
cant
at 0
.05
leve
l. **
Sig
nific
ant a
t 0.0
1 le
vel
Sour
ce:
ITU
.
Targ
et
MDG
1: T
arge
t 1.
C: H
alve
, be
twee
n 19
90
and
2015
, the
pr
opor
tion
of
peop
le w
ho
suffe
r fro
m
hung
er
MDG
1: T
arge
t 1.C
: H
alve
, bet
wee
n 19
90 a
nd 2
015,
th
e pr
opor
tion
of
peop
le w
ho s
uffer
fr
om h
unge
r
MDG
3: P
rom
ote
gend
er e
qual
ity
and
empo
wer
w
omen
MDG
4: T
arge
t 4.A
: Red
uce,
by
two-
third
s, b
etw
een
1990
and
201
5, th
e un
der-fi
ve m
orta
lity
rate
MDG
5: I
mpr
ove
mat
erna
l hea
lth
MDG
7: T
arge
t 7.A
: Int
egra
te
the
prin
cipl
es o
f sus
tain
able
de
velo
pmen
t int
o co
untr
y po
licie
s an
d pr
ogra
mm
es a
nd re
vers
e th
e lo
ss o
f env
ironm
enta
l res
ourc
es
Indi
cato
rPo
pula
tion
belo
w
natio
nal p
over
ty
line,
tota
l, pe
rcen
tage
Popu
latio
n un
dern
ouris
hed,
pe
rcen
tage
Seat
s he
ld
by w
omen
in
parli
amen
t, pe
rcen
tage
Infa
nt m
orta
lity
rate
(0-1
yea
rs)
per 1
000
live
bi
rths
Child
ren
unde
r fiv
e m
orta
lity
rate
per
1 0
00
live
birt
hs
Mat
erna
l m
orta
lity
ratio
pe
r 100
000
live
bi
rths
Adol
esce
nt b
irth
rate
, per
1 0
00
wom
en
CO2
emiss
ions
, to
tal,
thou
sand
m
etric
tons
of
CO2
(CDI
AC)
CO2
emiss
ions
, m
etric
ton
of
CO2
per c
apita
(C
DIAC
)
Corr
elati
on
coeffi
cien
t-0
.545
**-0
.189
*0.
308*
*-0
.256
*-0
.265
**-0
.196
*0.
372*
0.25
9*0.
215*

Chapter 2. The ICT Development Index (IDI)
78
Figure 2.5: Significant correlations between percentage increases in IDI and percentage changes in MDG indicators, 2002 and 2011
Source: ITU.
IDI
Goals 4 and 5:
The results further highlighted a significant and negative correlation between percentage change in IDI and percentage changes in infant mortality, child mortality and maternal mortality. These results are particularly true in non-LDCs, where the IDI values increased more during the ten-year period than in LDCs. This can be due to several factors, including the attendance of skilled health personnel as well as the role that ICTs can play in complementing and facilitating the monitoring of health via SMS and increased availability of information thanks to the Internet.
Goal 7:
The significant positive correlation between percentage change in carbon dioxide (CO2) emissions and percentage increase in IDI emphasizes a possible adverse impact that ICTs can exert on the environment. The use of ICTs requires electricity, which is one of the contributors to high CO2 emissions. The combustion of fossil fuels to generate electricity is the largest single source of CO2 emissions. Another important source of CO2 emissions is industrial processes. High usage of ICT devices and frequent improvements and innovation on ICT devices result in increases in industrial production, and the growth of the ICT production sector entails industrial processes that emit CO2 through fossil fuel combustion. Note
Goal 33.3 Seats held by women in national parliaments
Goal 44.1 Children under five mortality rate per 1’000 llive births4.2 Infant mortality rate
Goal 55.1 Maternal mortality ratio.5.4 Adolescent birth rate
Goal 11.1 Proportion below the national poverty line1.9 Proportion of population below minimum level of dietary energy consumption
Goal 77.2 CO2 emissions, total 7.2 CO2 emissions, metric ton per capita
79
Measuring the Information Society Report 2014
that industrial processes also use electricity and therefore indirectly cause emissions from electricity production.
ConclusionThe analysis linking ICT and MDG indicators found statistically significant correlations between IDI values and numerous MDG indicators (20 out of 38 analysed). This shows that there is an important relationship between ICT development and other development indicators in developing countries.
Furthermore, the analysis comparing the relative change or increase in IDI and the relative change in MDG indicators between 2002 and 2011 found significant correlations between increases in IDI and progress towards selected MDG indicators. This suggests that ICT development could lead to improvements in other areas of social and
economic development (with the exception of CO2 emissions, for which an unfavourable relationship was found).
The results presented in this section should be understood as a starting point for further quantitative analyses in the area of ICT and social and economic development. In order to better understand the relationship between ICT development and the MDGs, further research is needed. In particular, future research should focus on developing methodologies that can quantitatively assess the impact of ICTs on a range of socio-economic variables. This type of analysis will require different data sets, including micro data on ICT usage collected from official surveys. Micro data offer analysts and researchers ample information and considerable flexibility to apply quantitative models that identify relationships and interactions between indicators and topics covered in a survey, thereby fostering the diversity and quality of research and analysis.

Chapter 2. The ICT Development Index (IDI)
80
1 This section is based on the 2013 edition of Measuring the Information Society. The presentation of the conceptual framework and methodology of the IDI is maintained in each version of the report. The reader is also advised to consult Annex 1 to this report, as well as the 2009 edition of Measuring the Information Society (ITU, 2009), which describe the methodology in more detail.
2 Data on the indicators included in the skills sub-index are sourced from the UNESCO Institute for Statistics (UIS). See Annex 1 for more details on the definition of the indicators.
3 See final report of the meeting: http://www.itu.int/en/ITU-D/Statistics/Pages/events/brazil2013/default.aspx and the ITU Manual for Measuring ICT Access and Use by Households and Individuals, 2014 (ITU, 2014).
4 For more information on the EGTI online forum see: http://www.itu.int/ITU-D/ict/ExpertGroup/default_group.asp. To join EGTI, visit: http://www.itu.int/ITU-D/ict/ExpertGroup/default.asp. To join EGH, visit: http://www.itu.int/net4/ITU-D/forum/expertgrouponhouseholds/forum/.
5 Household surveys traditionally ask about the availability of assets in the household, including TV, electricity, refrigerator, piped water, etc. A similar principle has been adopted for ICT equipment and services, i.e. they should be available for use by household members at home, regardless of whether they are used. They can be taken away from home occasionally, but the basic principle is that they are usually available for use by all household members at home.
6 Income classifications are based on the World Bank method: http://data.worldbank.org/about/country-classifications/country-and-lending-groups#High_income.
7 Based on 2011 data: https://ec.europa.eu/digital-agenda/sites/digital-agenda/files/DAE%20SCOREBOARD%202013%20-%203-INTERNET%20USE%20AND%20SKILLS.pdf.
8 http://presse.tdc.dk/pressemeddelelser/tdc-klar-til-100-mbit-s-ogsa-pa-kobberkabler-987457.
9 https://ec.europa.eu/digital-agenda/sites/digital-agenda/files/DK%20%20-%20Broadband%20markets.pdf.
10 http://www.gsma.com/spectrum/wp-content/uploads/DigitalDividend/DDtoolkit/auctions-summary.html#denmark and http://danishbusinessauthority.dk/800-mhz-auction.
11 http://europa.eu/rapid/press-release_IP-14-680_en.htm.
12 https://ec.europa.eu/digital-agenda/sites/digital-agenda/files/DAE%20SCOREBOARD%202013%20-%202-BROADBAND%20MARKETS%20.pdf.
13 http://europa.eu/rapid/press-release_IP-14-680_en.htm and http://ec.europa.eu/research/press/2013/pdf/ppp/5g_factsheet.pdf.
14 https://ec.europa.eu/digital-agenda/sites/digital-agenda/files/DAE%20SCOREBOARD%202013%20-%203-INTERNET%20USE%20AND%20SKILLS.pdf.
15 Qatar (ranked 34th) has 97 per cent of households with a computer by end 2013.
15 https://ec.europa.eu/digital-agenda/en/scoreboard.
17 Ofcom and the European Union define superfast services as those delivering download speeds of 30 Mbit/s or more.
18 https://ec.europa.eu/digital-agenda/en/pillar-4-fast-and-ultra-fast-internet-access.
19 In these countries, the in-scope population for data on Internet users is individuals aged 16-74.
20 Refers to the indicator active mobile-broadband subscriptions. Mobile-broadband subscriptions generally make up the largest part of wireless-broadband subscriptions, which also includes terrestrial (fixed) wireless and satellite broadband subscriptions.
21 http://www.itnewsafrica.com/2013/05/airtel-launches-first-3-75-g-service-in-burkina-faso/ and http://news.aouaga.com/documents/docs/RapportARCEP.pdf.
22 http://www.thisdaylive.com/articles/a-year-after-wacs-is-faster-more-affordable-mobile-broadband-becoming-a-reality-/156011/ and http://wacscable.com/index.jsp.
23 http://www.cvmovel.cv/nacional-gsm-3g-edge-e-gprs.
24 http://www.telecomasia.net/content/bhutan-telecom-expand-3g-network.
25 http://www.tashigroup.bt/?p=1058 and http://www.kuenselonline.com/tashicell-goes-3g/#.U4RlG3KSx8E.
26 http://www.kuenselonline.com/530-increase-in-mobile-broadband-users/#.U4RsGHKSx8E.
27 Purchased capacity.
Endnotes

81
Measuring the Information Society Report 2014
28 http://www.bbc.com/news/world-latin-america-26850393.
29 http://www.entel.bo/inicio3.0/index.php/sala-de-prensa/item/309-contrato-entel-abe and http://www.entel.bo/inicio3.0/index.php/sala-de-prensa/item/272-telecentro-san-juan-de-chiquitos.
30 http://www.eeca-ict.eu/countries/georgia.
31 http://www.submarinecablemap.com/#/landing-point/poti-georgia.
32 The mainstream population, as well as the household access data, excludes transient labourers, which account for a significant proportion of residents in Qatar. According to data from ICTQatar, “transient labourers” make up 27 per cent of the overall population.
33 http://qnbn.qa/qatar-vision-2030/.
34 http://www.nbtc.go.th/wps/portal/NTC/!ut/p/c5/04_SB8K8xLLM9MSSzPy8xBz9CP0os3gTf3MX0wB3U09jtwBDA88QS-dQEwMfT1dzE6B8pFm8s7ujh4m5j4GBgZ-nqYGRS5iLn6erpYGBkxEB3eEg-_DrB8kb4ACOBvp-Hvm5qfoFuREGWSaOigCGMx-z/dl3/d3/L2dJQSEvUUt3QS9ZQnZ3LzZfNE83RDVQRzVJQjdWMjBJVjg2RTZJSTA1NjQ!/?WCM_GLOBAL_CONTEXT=/wps/wcm/connect/library+ntc/internetsite/eng/en_interesting_articles/en_interesting_articles_detail/ae185900400633288ac5ceabcb3fbcab.
35 http://www.telecompaper.com/news/thai-operators-reduce-prices-of-smartphone-data-plans--900198.
36 http://www.telegeography.com/products/commsupdate/articles/2013/05/09/true-4g-launch-trumps-rivals-ais-claims-800000-users-at-official-2100mhz-launch-dtac-waits-until-june/?utm_source=CommsUpdate&utm_campaign=40c2385114-CommsUpdate+09+May+2013&utm_medium=email&utm_term=0_0688983330-40c2385114-8868625.
37 See for example Sachs 2012, Henderson 2000, Gallup 1999 and Krugman 1998.
38 Source: World Bank, see http://data.worldbank.org/indicator/NY.GNP.PCAP.CD.
39 See: Czernich, N., Falck, O., Kretschmer, T. and Woessmann, L. (2009), Broadband Infrastructure and Economic Growth, http://papers.ssrn.com/sol3/papers.cfm?abstract_id=1516232; World Bank (2009), Information and Communication for Development: Extending Reach and Increasing Impact, http://go.worldbank.org/NATLOH7HV0. For an overview, see chapter 3 of Broadband Commission for Digital Development. Broadband: A Platform for Progress, 2011. Available at: http://www.broadbandcommission.org/net/broadband/Reports/Report_2.pdf. For a criticism see: Kenny, C. (2011), Overselling Broadband: A Critique of the Recommendations of the Broadband Commission for Digital Development, http://www.cgdev.org/files/1425798_file_Kenny_overselling_broadband_FINAL.pdf.
40 http://www.unesco.org/new/fileadmin/MULTIMEDIA/HQ/CI/CI/pdf/wsis/ungis_joint_statement_wsis_2013.pdf.
41 A correlation analysis for a particular MDG indicator was performed if there is available data for at least one year between 2010 and 2012. The number of countries included in the analysis varies from 16 to 101 developing countries. The IDI 2011 was used as a reference, since it is the closest year to available MDG data.
42 Broadband Commission. Transformative Solutions for 2015 and Beyond a Report of the Broadband Commission Task Force on Sustainable Development and http://www.broadbandcommission.org/Documents/Climate/BD-bbcomm-climate.pdf and The State of Broadband 2013 http://www.broadbandcommission.org/documents/bb-annualreport2013.pdf.
43 The Pearson correlation coefficient (r) is a measure of the strength and direction of association that exists between two indicators. A positive correlation coefficient means that as the value of one indicator increases, the value of the other indicator increases; as one decreases the other decreases. A negative correlation coefficient indicates that as one indicator increases, the other decreases, and vice-versa. A statistically significant correlation means that the relationship between the two indicators does not happen by chance.
44 Indicator where there is no attached code (such as this one) is not included in the official list of MDG indicators, but they are tracked by responsible agencies as additional indicators to help measure progress on the MDGs.
45 http://www.un.org/millenniumgoals/pdf/Goal_6_fs.pdf.
46 http://www.multidisciplinaryjournals.com/wp-content/uploads/2014/01/THE-ROLE-OF-INFORMATION-COMMUNICATION-TECHNOLOGY-ICT-.pdf.
47 UNCTAD (2011), Measuring the Impacts of Information and Communication Technology for Development, http://unctad.org/en/docs/dtlstict2011d1_en.pdf.


83
Measuring the Information Society Report 2014
Chapter 3. Regional IDI analysis
This chapter, which is based on the results of the IDI 2013 presented in Chapter 2 of this report, focuses specifically on analysis of the IDI by region. It presents IDI results separately for each of the six ITU Telecommunication Development Bureau (BDT) regions (Africa, Americas, Arab States, Asia and the Pacific, Commonwealth of Independent States (CIS) and Europe),1 and a comparative analysis of the six regions.
The analysis of IDI 2013 results on the basis of the six ITU-BDT regions provides insights into differences in ICT development within and between regions. Europe displays by far the highest average IDI value of 7.14. The regional IDI values of the CIS (5.33), the Americas (4.86), Asia and the Pacific (4.57) and Arab States (4.55) are relatively close to each other. However, they fall either side of an important benchmark, as only the CIS and the Americas regional averages exceed the world average of 4.77, while Asia and the Pacific and Arab States remain below that value. Africa has by far the lowest regional IDI of 2.31, less than one-third the European average (Chart 3.1).
A look at the range (calculated by subtracting the lowest IDI value in the region from the
highest value) and additional measures of disparity2 yields information on differences in ICT development within regions and allows a comparative analysis of regional disparities (see Table 3.1). The range in IDI values, as well as the standard deviation (StDev) and coefficient of variation (CV), are highest by far in Asia and the Pacific, indicating that differences in ICT development are greatest in that region. The region includes both top performers (such as the Republic of Korea, Hong Kong (China) and Japan) and a number of least connected countries (LCCs) (including Afghanistan, Myanmar and Bangladesh). The CIS region has the smallest range in IDI values, which shows that the relatively small number of countries it comprises are relatively homogenous in terms of ICT development. The measures of disparity (StDev and CV) are lowest in Europe, which underlines that not only do European countries have a generally high level of ICT development, but also that differences between them are relatively small.
A comparison between 2012 and 2013 regional IDI values shows that the CIS and Arab States regional IDI averages increased the most within one year, and twice as much as in Africa, the region with the least improvements and lowest

Chapter 3. Regional IDI analysis
84
average in 2013. This indicates that Africa is not advancing enough in terms of ICT development to catch up with other, more advanced regions. Europe saw by far the biggest decrease in IDI range, and both the country at the top and that at the bottom of the regional ranking progressed from 2012 to 2013. Furthermore, Europe’s standard deviation and coefficient of variation, which are lowest of all regions, further decreased. The range also slightly decreased in Asia and the Pacific, where the top and bottom-ranked countries both improved their values. While this region still has the most significant
Table 3.1: IDI by region, 2013 and 2012
Note: *Simple averages. StDev= Standard deviation, CV= Coefficient of variation.Source: ITU.
Region
IDI 2013 IDI 2012 Difference 2012-2013
Max
.
Min
.
Rang
e
Aver
age
valu
e*
StDe
v
CV Max
.
Min
.
Rang
e
Aver
age
valu
e*
StDe
v
CV Rang
e
Aver
age
valu
e*
CV
Europe 8.86 4.72 4.14 7.14 1.04 14.55 8.78 4.42 4.35 6.98 1.09 15.60 -0.21 0.16 -1.05
CIS 6.89 3.40 3.49 5.33 1.13 21.26 6.45 3.27 3.18 5.07 1.06 20.91 0.31 0.26 0.35
The Americas 8.02 2.77 5.25 4.86 1.30 26.76 7.90 2.69 5.21 4.67 1.27 27.33 0.04 0.20 -0.56
Asia & Pacific 8.85 1.67 7.18 4.57 2.30 50.44 8.81 1.57 7.24 4.42 2.31 52.22 -0.06 0.15 -1.78
Arab States 7.40 1.91 5.49 4.55 1.80 39.51 7.22 1.90 5.32 4.30 1.64 38.10 0.17 0.25 1.41
Africa 5.22 0.96 4.26 2.31 1.08 46.68 4.96 0.93 4.02 2.18 1.02 46.53 0.24 0.13 0.15
regional divide (in terms of range, StDev and CV), it is encouraging to see that the divide is narrowing. On the other hand, the CIS region, while remaining the region with the smallest range in IDI values, showed the highest increase in regional range. This is because the top-ranked CIS country improved its IDI value significantly more than the bottom-ranked country.
Table 3.2 presents a comparison of the global and regional rankings of the top five economies in each of the six regions, in order to provide further insights into the differences in ICT development. The European top five countries closely resemble the global top five – the Republic of Korea is the only non-European country among the global top five – which is dominated by Nordic countries. The top five economies from Asia and the Pacific also rank relatively high globally, all of them coming in the global top 20. In the Arab States and CIS regions, the top five countries are somewhat further apart, and rank lower globally, but are all still in the high and upper group of the IDI (see Chapter 2). The Americas’ regional top five shows the highest disparity, reflecting the divide between the North American countries (United States and Canada), which are in the global top 25, and the Caribbean and Latin American countries, which rank somewhat lower. African countries rank quite low in the IDI and disparities between the top five are also quite considerable. Mauritius
Chart 3.1: IDI ranges and averages, by region and compared to world average, 2013
Note: Simple averages. Source: ITU.
IDI
20
13
7.14
5.33 4.86
4.57 4.55
2.31
0
1
2
3
4
5
6
7
8
9
10
Europe CIS The
Americas
Asia &
Pacific
Arab
States
Africa
Regional average
World average (4.77)
Range

85
Measuring the Information Society Report 2014
Table 3.2: The top five economies in each region and their ranking in the global IDI, 2013
Regional IDI
rankEurope
Global IDI
rank
Asia & Pacific
Global IDI
rank
The Americas
Global IDI
rankArab States
Global IDI
rankCIS
Global IDI
rankAfrica
Global IDI
rank
1 Denmark 1 Korea (Rep.) 2 United States 14 Bahrain 27 Belarus 38 Mauritius 70
2 Sweden 3 Hong Kong, China 9 Canada 23 United Arab
Emirates 32 Russian Federation 42 Seychelles 75
3 Iceland 4 Japan 11 Barbados 35 Qatar 34 Kazakhstan 53 South Africa 90
4 United Kingdom 5 Australia 12 Uruguay 48 Saudi Arabia 47 Moldova 61 Cape Verde 93
5 Norway 6 Singapore 16 St. Kitts and Nevis 54 Oman 52 Azerbaijan 64 Botswana 104
Source: ITU.
(70th position) and Seychelles (75th position) are the highest placed countries in the region.
3.1 Africa
The African regional IDI is the lowest of all six regions. Only two countries – Mauritius (5.22) and Seychelles (4.97) – lie above the global IDI average (4.77). South Africa, with an IDI value of 4.42, falls just below the global average, but together with Cape Verde and Botswana achieves a higher value
than the developing-country average (3.84) in the IDI 2013. Mauritius, Seychelles, South Africa and Cape Verde are the only African countries in the top 100 of the IDI 2013. Nigeria, the region’s most populous country, ranks 133rd in the IDI 2013, with an IDI value of 2.35 (see Chart 3.2). Three-quarters – or 29 out of 38 African countries – are considered to be LCCs. The bottom eleven of the IDI 2013 are all African countries, including the Central African Republic, the only country with an IDI value of less than one. This underlines that there is a severe divide between the regions and
Chart 3.2: IDI values compared with the global, regional and developing/developed-country averages, Africa, 2013
Source: ITU.
0
1
2
3
4
5
6
7Developed
Developing
Africa
Mau
ritiu
s
World
Seyc
helles
South
Afr
ica
Cape V
erde
Botsw
ana
Ghan
a
Nam
ibia
Zim
babw
e
Kenya
Gab
on
Swaz
iland
Senega
l
Leso
tho
Nig
eria
Gam
bia
Congo (R
ep.)
Angola
Camero
onM
ali
Zam
bia
Uga
nda
Rwan
da
Benin
Côte d
’Ivoire
Tanza
nia
Liberia
Guin
ea-Bis
sau
Burkin
a Fa
so
Congo (D
em. R
ep.)
Mal
awi
Moza
mbiq
ue
Mad
agas
car
Guin
ea
Ethio
pia
Eritre
a
Chad
Nig
er
Central
Afr
ican
Rep.
IDI
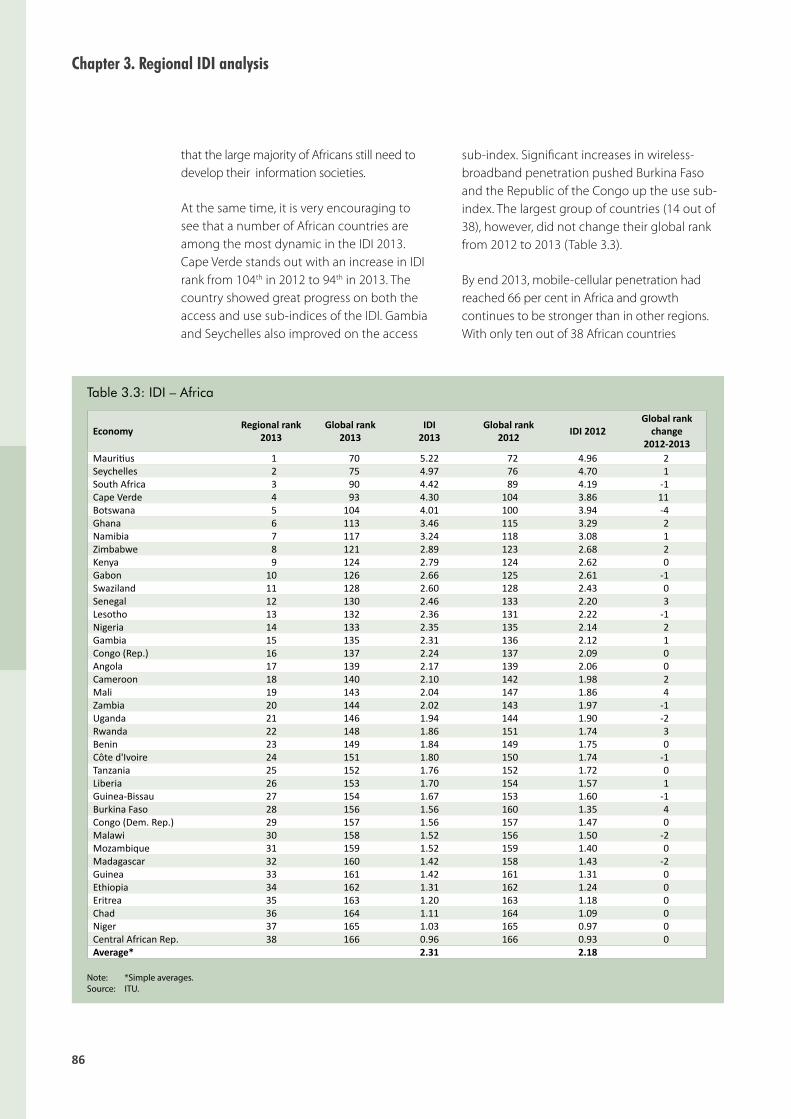
Chapter 3. Regional IDI analysis
86
that the large majority of Africans still need to develop their information societies.
At the same time, it is very encouraging to see that a number of African countries are among the most dynamic in the IDI 2013. Cape Verde stands out with an increase in IDI rank from 104th in 2012 to 94th in 2013. The country showed great progress on both the access and use sub-indices of the IDI. Gambia and Seychelles also improved on the access
sub-index. Significant increases in wireless-broadband penetration pushed Burkina Faso and the Republic of the Congo up the use sub-index. The largest group of countries (14 out of 38), however, did not change their global rank from 2012 to 2013 (Table 3.3).
By end 2013, mobile-cellular penetration had reached 66 per cent in Africa and growth continues to be stronger than in other regions. With only ten out of 38 African countries
Table 3.3: IDI – Africa
Note: *Simple averages. Source: ITU.
Economy Regional rank 2013
Global rank 2013
IDI 2013
Global rank 2012 IDI 2012
Global rank change
2012-2013Mauritius 1 70 5.22 72 4.96 2Seychelles 2 75 4.97 76 4.70 1South Africa 3 90 4.42 89 4.19 -1Cape Verde 4 93 4.30 104 3.86 11Botswana 5 104 4.01 100 3.94 -4Ghana 6 113 3.46 115 3.29 2Namibia 7 117 3.24 118 3.08 1Zimbabwe 8 121 2.89 123 2.68 2Kenya 9 124 2.79 124 2.62 0Gabon 10 126 2.66 125 2.61 -1Swaziland 11 128 2.60 128 2.43 0Senegal 12 130 2.46 133 2.20 3Lesotho 13 132 2.36 131 2.22 -1Nigeria 14 133 2.35 135 2.14 2Gambia 15 135 2.31 136 2.12 1Congo (Rep.) 16 137 2.24 137 2.09 0Angola 17 139 2.17 139 2.06 0Cameroon 18 140 2.10 142 1.98 2Mali 19 143 2.04 147 1.86 4Zambia 20 144 2.02 143 1.97 -1Uganda 21 146 1.94 144 1.90 -2Rwanda 22 148 1.86 151 1.74 3Benin 23 149 1.84 149 1.75 0Côte d'Ivoire 24 151 1.80 150 1.74 -1Tanzania 25 152 1.76 152 1.72 0Liberia 26 153 1.70 154 1.57 1Guinea-Bissau 27 154 1.67 153 1.60 -1Burkina Faso 28 156 1.56 160 1.35 4Congo (Dem. Rep.) 29 157 1.56 157 1.47 0Malawi 30 158 1.52 156 1.50 -2Mozambique 31 159 1.52 159 1.40 0Madagascar 32 160 1.42 158 1.43 -2Guinea 33 161 1.42 161 1.31 0Ethiopia 34 162 1.31 162 1.24 0Eritrea 35 163 1.20 163 1.18 0Chad 36 164 1.11 164 1.09 0Niger 37 165 1.03 165 0.97 0Central African Rep. 38 166 0.96 166 0.93 0Average* 2.31 2.18

87
Measuring the Information Society Report 2014
reaching more than 100 per cent mobile-cellular penetration, there is certainly still room for growth in the mobile markets. Improving coverage is particularly challenging in vast rural areas and where the reach of basic infrastructure, including electricity, is limited. Eritrea has the lowest mobile-cellular penetration in the world, at 6 per cent. Penetration levels are also extremely low, at below 30 per cent, in Ethiopia and the Central African Republic. Both Eritrea and Ethiopia have one of the last remaining monopolies in the mobile market. On the other hand, Gambia and Namibia both exceeded 100 per cent penetration by end 2013. Significant increases in mobile-cellular penetration from 2012 to 2013 were also registered in Guinea (from 49 per cent to 63 per cent), Mozambique (from 35 per cent to 48 per cent) and the Republic of the Congo (from 31 per cent to 44 per cent) (see Chart 3.3).
A lack of international Internet bandwidth is seriously hampering ICT development in Africa. Although the region has been connected to a number of international submarine cables along its East and West coasts, African countries are lacking international Internet connectivity.
Chart 3.3: Mobile-cellular subscriptions per 100 inhabitants, 2012 and 2013, Africa
Note: Gabon mobile-cellular penetration is 215 per cent by end 2013. Source: ITU World Telecommunication/ICT Indicators database.
0
20
40
60
80
100
120
140
160
180
2012
2013
Pe
r 1
00
in
ha
bit
an
ts
Gab
on
Botsw
ana
South
Afr
ica
Seyc
hellesM
ali
Mau
ritiu
s
Nam
ibia
Ghan
a
Congo (R
ep.)
Cape V
erde
Gam
bia
Zim
babw
e
Côte d
'Ivoire
Benin
Senega
l
Leso
tho
Guin
ea-Bis
sau
Nig
eria
Zam
bia
Swaz
iland
Kenya
Camero
on
Burkin
a Fa
so
Guin
ea
Angola
Liberia
Rwan
da
Tanza
nia
Moza
mbiq
ue
Uga
nda
Congo (D
em. R
ep.)
Nig
er
Mad
agas
car
Chad
Mal
awi
Central
Afr
ican
Rep.
Ethio
pia
Eritre
a
Countries including the Central African Republic, Republic of the Congo, Madagascar, Congo (Dem. Rep.), Chad and Nigeria have less than 1 000 bit/s of international Internet bandwidth per Internet user at their disposal. Being connected to four international submarine cable systems, Kenya has the highest amount of international Internet bandwidth, both in total and per Internet user, at 50 000 bit/s per user (see MIS 2013). Seychelles (24 000 bit/s) and Mauritius (24 500 bit/s) also have relatively high amounts of bandwidth per Internet user, partly because of their very small populations and hence small number of Internet users.
The divide between Africa and the world becomes most visible when looking at ICT household penetration: by end 2013, on average, less than 10 per cent of households in the region had access to the Internet at home, compared to the global average of 40 per cent and the developing-country average of 28 per cent. Looking at the country level, only four out of a total of 38 countries in Africa record more than 30 per cent of households with Internet access. They are: Seychelles (51 per cent), Mauritius (44.5 per cent), South Africa (39 per cent) and

Chapter 3. Regional IDI analysis
88
Ghana (32 per cent). Twenty countries have a penetration of less than 5 per cent, including eight countries in which less than 2 per cent of households have Internet access.
The most dynamic indicator in the region, as at the global level, is without doubt wireless broadband. While 3G networks are continuing to be built and expanded across the region, numerous countries saw some important increases in penetration from 2012 to 2013. In Burkina Faso, 3G was finally launched in 2013, reaching a penetration of 9 per cent by end 2013. Cape Verde attained the second highest penetration in the region, at 43 per cent (after Botswana with 74 per cent) following an expansion of network coverage throughout the archipelago.3 Large-scale infrastructure roll-out also helped to increase uptake of wireless broadband in Nigeria4 (from 5 per cent in 2012 to 10 per cent in 2013). Data from South African operators show that not only is wireless-broadband penetration reaching higher levels – 29per cent by end 2013 – but customers are consuming more data, indicating an increase in the intensity of usage. MTN reported a growth of 63 per cent in data volumes in the first half of 2013 and Vodacom reported that on average users were generating 75 per cent more data traffic per device than a year ago.5 Wireless broadband is of particular importance in the region because fixed-broadband infrastructure is lacking. The vast majority of African countries – 32 out of 38 – had a fixed-broadband penetration of less than 1 per cent by end 2013. In fact, only two countries, Seychelles (13 per cent) and Mauritius (12.5 per cent) have notable numbers of fixed-broadband subscriptions.
Africa was home to 150 million Internet users by end 2013. This corresponds to around 17 per cent of the population in the region. A lack of ICT infrastructure and high service costs (see Chapter 4) are some of the main obstacles preventing more people from going online. However, in a number of African countries, a relatively high proportion of the population is online. These include Seychelles (50 per cent), South Africa (49
per cent), Mauritius and Kenya (both 39 per cent) and Cape Verde and Nigeria (both 38 per cent).
3.2 Arab States
The top five countries in the Arab States in terms of ICT development – Bahrain, United Arab Emirates, Qatar, Saudi Arabia and Oman – are all oil-rich, high-income economies and are part of the Cooperation Council for the Arab States of the Gulf (GCC). They exhibit IDI values of six and above and are in the top 60 in the global rankings. The performance of GCC countries underlines the link between IDI and GNI per capita, with high-income countries attaining higher IDI values. Those countries, as well as the regional number six Lebanon, all exceed the global average IDI value. At the other end of the scale, there are a number of countries in the Arab States region which have a much lower level of development, namely Syria, Algeria, Sudan, Yemen, Djibouti and Mauritania, with IDI values below the developing-country average (see Chart 3.4). The latter three are considered as LCCs (see Box 2.2). Egypt, which is by far the region’s most populous country with around 82 million inhabitants, ranks in eight position regionally, with an IDI value of 4.45, just below the regional average (4.55).
The countries at the top recorded the largest improvements in IDI ranking from 2012 to 2013; the United Arab Emirates (+14 ranks), Qatar (+8 ranks) and Oman (+9 ranks), in particular, moved up considerably. The United Arab Emirates overtook Qatar as the second highest ranked Arab country in 2013. All top six countries in the region managed to improve their global ranking from 2012 to 2013. However, all the remaining Arab countries remained at the same position as in 2012 or went down in international comparison, most notably Palestine, which dropped from 95th in 2012 to 100th place in 2013, as well as Morocco and Jordan, which lost four and three places, respectively, in relation to 2012. Finally, the country at the very bottom of the

89
Measuring the Information Society Report 2014
regional rankings – Mauritania – managed only a very slight increase in its IDI value, and fell two places to 147th position globally (Table 3.4). This indicates that the Arab States with a lower IDI are not keeping up with ICT developments, while the top countries in the region are catching up with the IDI top performers.
In the vast majority of Arab States, mobile-cellular penetration has reached very high levels of 100 per cent and above. Only Djibouti (30 per cent) and Syria (56 per cent) still had a very low mobile-cellular penetration in 2013. The region’s predominantly prepaid markets (the share of prepaid subscriptions was reported to be 90 per cent or more in the majority of countries) are characterized by a high level of competition and high levels of multi-SIM ownership (GSMA and Deloitte, 2013). Furthermore, the very high mobile-cellular penetration rates reached in the GCC countries are driven by large transient worker and expatriate populations. Data from household surveys show that the actual number of people using a mobile-cellular phone is much lower than the number of subscriptions. In Tunisia, 72 per cent of individuals were using a mobile-cellular phone, compared with a
mobile-cellular penetration of 118 per cent in 2012. Egypt reported a penetration of 120 per cent by end 2012, compared with 74 per cent of individuals using a mobile-cellular phone. Fixed-telephone penetration is extremely low in the Arab States region, with a regional average of 9 per cent in 2013. This further highlights the importance of mobile networks in the region.
The Arab States region and in particular the GCC countries are well-connected to submarine Internet cables. The United Arab Emirates boasts the highest amount of international Internet bandwidth per Internet user (around 52 000 bit/s per user) in the region. Furthermore, the country almost doubled its Internet bandwidth between 2012 and 2013. Oman, too, saw a significant increase in total international Internet bandwidth, up from 17 792 Mbit/s in 2012 to 82 010 Mbit/s in 2013. In 2013, the Europe-Persia Express Gateway that connects the United Arab Emirates and Oman to Germany via the Islamic Republic of Iran went live, increasing the region’s international Internet connectivity.6 Furthermore, the Gulf Bridge International (GBI) system completed its “North Route” terrestrial link in 2013, which connects the Gulf region to Europe.7
Chart 3.4: IDI values compared with the global, regional and developing/developed-country averages, Arab States, 2013
Source: ITU.
IDI
Developed
Developing
Arab StatesWorld
0
1
2
3
4
5
6
7
8
Bahra
in
Saudi A
rabia
Unite
d Ara
b Em
irate
s
Qat
ar
Om
an
Leban
on
Moro
cco
Jord
an
Egypt
Tunis
ia
Palest
ine
Sudan
Syria
Algeria
Yem
en
Djib
outi
Mau
ritan
ia

Chapter 3. Regional IDI analysis
90
In terms of ICT household connectivity, Qatar stands out not only in the region but in international comparison with more than 96 per cent of households with Internet access and with a computer. The remaining GCC states all reach high household ICT penetration rates of 70 per cent and above. Income disparities in the region are also reflected when it comes to the number of households with Internet access: in Yemen and Mauritania, less than 5 per cent of households have Internet access. Morocco was able to connect a significant number of households to the Internet in 2013, penetration increasing from 39 per cent in 2012 to 46 per cent in 2013. Oman saw high increases in terms of both households with Internet access and households with a computer as a result of the National PC Initiative. Through this initiative, eligible families (those benefiting from the social welfare programme with at least one child enrolled in primary school, secondary school or higher education studies) in Oman are offered one free computer per student. Furthermore, Omantel provides discounted broadband Internet offers for eligible customers.8
Wireless-broadband penetration levels vary considerably across the region. The number of subscriptions exceeds the population in Bahrain, the United Arab Emirates has a penetration of 89 per cent, and both Qatar and Saudi Arabia exceed 70 per cent penetration. While the Gulf States are extending and upgrading their mobile-broadband networks – in Qatar LTE is available throughout the entire country9 – Algeria and Djibouti had not yet launched mobile-broadband services in 2013 (see Chart 3.5). However, there is some room for optimism, as 3G licences were finally awarded to three Algerian operators by end 2013.10 Penetration is also extremely low in Yemen (0.3 per cent), Palestine (1 per cent) and Syria (3 per cent). Those discrepancies underline the different levels of economic development within the Arab States region and also reflect the fact that mobile-broadband services in the lower-income countries are much less affordable than in the high-income Arab States (see Chapter 3).
Fixed-broadband penetration is generally low in the Arab States, with a regional average of just 3 per cent by end 2013. Mobile (voice and
Table 3.4: IDI – Arab States
Note: *Simple averages. Source: ITU.
Economy Regional rank 2013
Global rank 2013
IDI 2013
Global rank 2012 IDI 2012
Global rank change
2012-2013Bahrain 1 27 7.40 28 7.22 1United Arab Emirates 2 32 7.03 46 6.27 14Qatar 3 34 7.01 42 6.46 8Saudi Arabia 4 47 6.36 50 6.01 3Oman 5 52 6.10 61 5.43 9Lebanon 6 62 5.71 64 5.32 2Jordan 7 87 4.62 84 4.48 -3Egypt 8 89 4.45 87 4.28 -2Morocco 9 96 4.27 92 4.09 -4Tunisia 10 99 4.23 96 4.07 -3Palestine 11 100 4.16 95 4.07 -5Syria 12 112 3.46 112 3.39 0Algeria 13 114 3.42 114 3.30 0Sudan 14 122 2.88 121 2.69 -1Yemen 15 138 2.18 138 2.07 0Djibouti 16 141 2.08 140 2.01 -1Mauritania 17 147 1.91 145 1.90 -2Average* 4.55 4.30

91
Measuring the Information Society Report 2014
broadband) services are much more popular in the region. The majority of Arab States have a fixed-broadband penetration of less than 5 per cent, with Syria, Yemen, Mauritania and Sudan displaying less than 2 per cent penetration. Only Bahrain (13 per cent) and the United Arab Emirates (13 per cent) reach double-digit rates.
Around 137 million people in the Arab States were online by end 2013. The countries where the biggest proportions of the population are online are Bahrain (90 per cent), United Arab Emirates (88 per cent) and Qatar (85 per cent).11 Egypt and Morocco, which have a much larger number of inhabitants than the Gulf States, also reach Internet user penetration rates of 50 and 56 per cent, respectively. On the other hand, in the LCCs Mauritania and Djibouti, less than 10 per cent of the population are online.
3.3 Asia and the Pacific
Asia and the Pacific is indisputably the most diverse region in terms of ICT development, reflecting the stark differences in economic
development throughout the region. At the top of the regional ranking stand a group of ICT champions – the Republic of Korea, Hong Kong (China), Japan, Australia, Singapore, New Zealand and Macao (China) – that all exceed the developed-country average and rank in the top 25 on the global IDI. There is a visible gap between the regional number seven – Macao (China), with an IDI of 7.66 – and the regional number eight – Brunei Darussalam with an IDI of 5.43. Brunei Darussalam and Malaysia still achieve an IDI value that is higher than the global average (4.77). All remaining 20 countries lie below the IDI global average, and12 of them fall short of the developing-country average (3.84). Most of these countries make up the Asia-Pacific’s LCCs: Afghanistan, Bangladesh, Cambodia, India, Lao P.D.R., Myanmar, Nepal, Pakistan and Solomon Islands. The world’s most populous country, China, ranks in 12th position in the region, with an IDI value of 4.64 (Chart 3.6).
The largest group of countries from Asia and the Pacific saw a decrease in global rank from 2012 to 2013. Malaysia moved down the most in international comparison, from 66th to 71st
Chart 3.5: Wireless-broadband subscriptions per 100 inhabitants, Arab States, 2012 and 2013
Source: ITU World Telecommunication/ICT Indicators database.
2012
2013
Pe
r 1
00
in
ha
bit
an
ts
Bahra
in
Unite
d Ara
b Em
irate
s
Qat
ar
0
20
40
60
80
100
120
140
Saudi A
rabia
Om
an
Leban
on
Egypt
Sudan
Tunis
ia
Jord
an
Moro
cco
Syria
Palest
ine
Yem
en
Algeria
Mau
ritan
ia
Djib
outi

Chapter 3. Regional IDI analysis
92
position in the IDI 2013. Lao P.D.R. and Solomon Islands lost four ranks on the 2013 IDI in relation to the previous year. At the same time, Fiji (+12 ranks) and Thailand (+10 ranks) are among the most dynamic countries of the IDI 2013. In both cases, a significant increase in wireless-broadband penetration is responsible for the boost. Countries such as Bhutan, Nepal and the Islamic Republic of Iran also made good progress on the global IDI (see Table 3.5).
More than half of all Asia and the Pacific countries have reached a mobile-cellular penetration of 100 per cent or above by end 2013. A number of countries with penetration rates below 100 per cent nonetheless saw significant increases from 2012 to 2013. Although Myanmar stands out as having one of the lowest mobile-cellular penetrations worldwide, it almost doubled its rate from 7 per cent in 2012 to 13 per cent in 2013. Nepal achieved a mobile-cellular penetration rate of 71 per cent in 2013, up from 60 per cent in 2012. In China, more than 100 million new mobile-cellular subscriptions were added in 2013, taking the penetration rate up to 89 per cent.
Hong Kong (China) has the highest amount of international Internet bandwidth in the region, and indeed one of the highest volumes in the world, at close to 9.5 million Mbit/s12 by end 2013. As a regional hub and international financial centre, Hong Kong (China) relies upon a secure and low-latency Internet connection, and the telecommunication regulator has made the attraction of international submarine cables a policy priority13 (see MIS 2013, Box 2.10). In 2013, the Southeast Asia Japan Cable (SJC) became available for service, connecting Japan with Hong Kong (China), China, the Philippines, Thailand, Brunei Darussalam and Singapore.14 With the landing of the SJC cable system, international Internet connectivity was boosted in these countries. Additional international Internet bandwidth is of particular importance for sustaining ICT growth and ensuring Internet connectivity for an increasing number of users in populous countries such as China (with an estimated 600 million Internet users) and the Philippines (with an estimated 36.5 million Internet users by end 2013). Within the Philippines, domestic connectivity was further improved by connecting some of the
Chart 3.6: IDI values compared with the global, regional and developing/developed-country averages, Asia and the Pacific, 2013
Source: ITU.
IDI
Developing
Asia and the
Korea
(Rep.)
0
1
2
3
4
5
6
7
8
Pacific
World
Developed
Hong
Kong, Chin
a
Japan
Austra
lia
Singa
pore
New
Zeal
and
Mac
ao, Chin
a
Brunei D
aruss
alam
Mal
aysia
Thaila
nd
Mal
dives
China
Fiji
Mongo
lia
Iran (I
.R.)
Viet N
am
Philippin
es
Indonesi
a
Sri L
anka
Bhutan
Cambodia
India
Nepal
Lao P
.D.R
.
Solo
mon Is
lands
Pakist
an
Bangl
adesh
Mya
nmar
Afghan
ista
n
9

93
Measuring the Information Society Report 2014
archipelago’s islands through the Boracay-Palawan Submarine Cable System, which went live in the summer of 2013.15 Regional Internet connectivity was further enhanced when the Tonga Cable, connecting Fiji and Tonga, and the Guam Okinawa Kyushu Incheon (GOKI) cable, connecting Japan with Guam, went live in 2013. On the other hand, a number of countries in Asia and the Pacific have very low levels of international Internet connectivity; these include, in particular, the landlocked and least connected countries Afghanistan, Bhutan and Nepal, with less than 4 000 bit/s per Internet user.
The regional divide in the Asia-Pacific region becomes very visible when comparing the ICT connectivity of households throughout the region. While no more than 5 per cent of
households in Afghanistan, Bangladesh, Lao P.D.R., Myanmar, Nepal and Solomon Islands have Internet access at home, virtually all households in the Republic of Korea (98 per cent) enjoy this facility. In Japan and Singapore, 86 per cent of households have Internet access, and Macao (China) registered 83 per cent of households with Internet access by end 2013. Thailand made good progress in connecting more of the kingdom’s households with ICTs. Penetration increased from 17.5 per cent of households with Internet access in 2012 to 23 per cent by end 2013. By end 2013, 29 per cent of households had a computer. Data from the annual ICT household survey show that, since 2008, computers have replaced telephones as the most commonly available ICT device in Thai homes. Furthermore, the majority of households
Table 3.5: IDI – Asia and the Pacific
Note: *Simple averages. Source: ITU.
Economy Regional rank 2013
Global rank 2013
IDI 2013
Global rank 2012 IDI 2012
Global rank change
2012-2013Korea (Rep.) 1 2 8.85 1 8.81 -1Hong Kong, China 2 9 8.28 11 8.08 2Japan 3 11 8.22 10 8.15 -1Australia 4 12 8.18 12 8.03 0Singapore 5 16 7.90 15 7.85 -1New Zealand 6 19 7.82 19 7.62 0Macao, China 7 22 7.66 20 7.59 -2Brunei Darussalam 8 66 5.43 63 5.36 -3Malaysia 9 71 5.20 66 5.18 -5Thailand 10 81 4.76 91 4.09 10Maldives 11 85 4.71 82 4.50 -3China 12 86 4.64 86 4.39 0Fiji 13 91 4.40 103 3.90 12Mongolia 14 92 4.32 90 4.19 -2Iran (I.R.) 15 94 4.29 97 4.02 3Viet Nam 16 101 4.09 99 3.94 -2Philippines 17 103 4.02 102 3.91 -1Indonesia 18 106 3.83 106 3.70 0Sri Lanka 19 116 3.36 113 3.31 -3Bhutan 20 123 2.85 126 2.58 3Cambodia 21 127 2.61 127 2.54 0India 22 129 2.53 129 2.42 0Nepal 23 131 2.37 134 2.20 3Lao P.D.R. 24 134 2.35 130 2.25 -4Solomon Islands 25 136 2.29 132 2.22 -4Pakistan 26 142 2.05 141 2.01 -1Bangladesh 27 145 1.97 146 1.90 1Myanmar 28 150 1.82 148 1.75 -2Afghanistan 29 155 1.67 155 1.57 0Average* 4.57 4.42

Chapter 3. Regional IDI analysis
94
with Internet access have a fixed-broadband connection.16
Given its large population size, Asia and the Pacific has the highest number of mobile-broadband subscriptions, at just over 750 million by end 2013. Growth continues to be very dynamic throughout the region, and in particular in those countries that had a relatively low penetration in 2012 (see Chart 3.7). Bhutan increased its penetration rates more than sixfold, from only 2.5 per cent (in 2012) to 16 per cent (in 2013). In Thailand, where 3G was launched very late, wireless-broadband penetration went up from 11 per cent in 2012 to more than 50 per cent in 2013. Both countries feature among the most dynamic of the IDI 2013, mostly because of the considerable, above-average increases in wireless-broadband penetration. While some economies, including Australia, Japan, Macao (China), Republic of Korea and Singapore, had already reached very high levels of penetration, other countries in the region still lag behind. Wireless-broadband penetration was less than 5 per cent by end 2013 in Afghanistan, India, Islamic Republic of Iran, Lao P.D.R. and Myanmar. All of these – with the exception of the Islamic
Republic of Iran – are LCCs that could greatly benefit from the extension of wireless broadband to connect more people with ICTs.
By end 2013, fixed-broadband penetration stood at 38 per cent in the Republic of Korea, one of the highest values attained worldwide. This underlines the country’s high rank on the IDI 2013, with an exceptionally well-developed ICT infrastructure and high levels of ICT uptake and usage. Hong Kong (China), New Zealand, Japan, Macao (China), Singapore and Australia also registered high levels of between 25 and 30 per cent fixed-broadband penetration. China stands out for a relatively high fixed-broadband penetration of 14 per cent, above the global average of 9 per cent. In 2013 alone, close to 14 million new fixed-broadband subscriptions were added, although numbers of additions in absolute terms have been declining since 2012. Penetration is expected to regain momentum in 2014, with China Mobile entering the fixed-line market.17 China’s broadband strategy, published in August 2013, underlines the importance of broadband as a “strategic public infrastructure for China’s economic and social development in the new age”. The plan targets a fixed-broadband
Chart: 3.7: Wireless-broadband penetration, Asia and the Pacific, 2012 and 2013
Note: Macao (China) penetration of 303 per cent by end 2013 and 289 per cent by end 2012.Source: ITU World Telecommunication/ICT Indicators database.
2012
2013
Pe
r 1
00
in
ha
bit
an
ts
0
20
40
60
80
100
120
140
Mac
ao, C
hina
Singa
pore
Japan
Austra
lia
Korea
(Rep.)
Hong
Kong, Chin
a
New
Zeal
and
Fiji
Thaila
nd
Indonesi
a
Philippin
es
Mal
dives
Mongo
lia
Viet N
amChin
a
Bhutan
Mal
aysia
Nepal
Cambodia
Solo
mon Is
lands
Sri L
anka
Brunei D
aruss
alam
India
Iran (I
.R.)
Lao P
.D.R
.
Afghan
ista
n
Mya
nmar
Pakist
an
Bangl
adesh

95
Measuring the Information Society Report 2014
household penetration of 50 per cent and a 3G penetration rate of 32.5 per cent by 2015.18
There were 1.2 billion people from the Asia and the Pacific region online by end 2013. This includes around 600 million Chinese and 200 million Indian Internet users. Comparing the two, the proportion of the population using the Internet is much higher in China (44 per cent) than India (15 per cent). India has one of the lowest rates in the region (and globally): only Afghanistan, Bangladesh, Cambodia, Lao P.D.R., Myanmar, Nepal, Pakistan and Solomon Islands recorded a lower proportion of Internet users. Japan (86 per cent), the Republic of Korea (85 per cent) and Australia and New Zealand (both 83 per cent) exhibit the highest rates in the Asia and the Pacific region.
3.4 Commonwealth of Independent States
Belarus is the highest ranked country from the Commonwealth of Independent States (CIS), with an IDI value of 6.89, followed by the Russian
Federation, with an IDI value of 6.70. All CIS countries remain below the developed-country average (7.20).19 With the exception of Kyrgyzstan and Uzbekistan, however, they are all above the global average of 4.77. While Kyrgyzstan lies above the developing-country average (3.84), Uzbekistan remains below (see Chart 3.8).
The CIS region shows the most important increase in IDI value from 2012 to 2013. Two countries – Belarus and Georgia – stand out in terms of improvement in their global IDI rankings from 2012 to 2013. Belarus climbed from 43rd place in 2012 to 38th in 2013, overtaking the Russian Federation as the country with the highest IDI in the region. Georgia went up five places to 78th position in the IDI 2013. Uzbekistan, which lies at the bottom of the regional ranking, and Azerbaijan improved their position in the global IDI by one rank from 2012 to 2013. All other CIS countries fell by one position in the global IDI, with the exception of Ukraine, which went down two places (see Table 3.6).
By end 2013, the CIS region had the highest mobile-cellular penetration of all regions, at
Chart 3.8: IDI values compared with the global, regional and developing/developed-country averages, CIS, 2013
Note: Until 2009, the CIS region included the above countries. Georgia exited the Commonwealth on August 18, 2009, but is included in this report. Source: ITU.
Developing
World
Developed
IDI
0
1
2
3
4
5
6
7
8
CIS
Belaru
s
Russia
n
Kazak
hstan
Mold
ova
Azerb
aija
n
Ukr
aine
Armenia
Georg
ia*
Kyrg
yzst
an
Uzb
ekist
an
Federa
tion

Chapter 3. Regional IDI analysis
96
137 per cent. Penetration well exceeded the number of inhabitants in all CIS countries with the exception of Uzbekistan. The mobile markets in the CIS are predominately prepaid, with typically high rates of multi-SIM ownership. Furthermore, markets are very competitive, with a relatively high number of mobile operators. In the majority of CIS countries, at least four mobile operators are active in the market. The Russian Federation, for example, has one of the most de-concentrated mobile markets globally, with three national operators and several regional operators competing for 143 million potential customers.
Data from household surveys collected in a number of CIS countries underline that mobile-cellular penetration, measured as the number of mobile-cellular subscriptions, can give no more than an indication of the actual number of subscribers (i.e. a mobile-cellular penetration of above 100 per cent does not mean that every inhabitant has a mobile-cellular subscriptions). For instance, whereas mobile-cellular penetration in Ukraine stood at 130 per cent by end 2012, 9 per cent of households did not have access to a mobile-cellular telephone. In Georgia, 18 per cent of households did not have access to a mobile-cellular telephone in 2012, even though mobile-cellular penetration stood at 108 per cent.
The Russian Federation had the highest proportion of households with Internet access and
households with a computer in the region by end 2013, at 67 per cent and 70 per cent, respectively. In Azerbaijan, Belarus and Kazakhstan, more than half of households have Internet access at home and a computer. Kyrgyzstan and Uzbekistan display a very low ICT household penetration, with less than 10 per cent of households in the country having access to the Internet. Total international Internet bandwidth is by far highest in the Russian Federation, which is connected through a number of terrestrial links to both Europe and the Asia-Pacific region.20 However, given its large population size, in terms of bandwidth per Internet user the country is below most other CIS countries. International Internet bandwidth per Internet user is highest in Moldova (115 845 bit/s per user), followed by Belarus (94 797 bit/s per user) and Georgia (82 094 bit/s per user). Kyrgyzstan and Uzbekistan have very limited bandwidth, which hampers Internet connectivity and hence further development of the ICT sector in those countries.
By end 2013, half of CIS countries had reached a wireless-broadband penetration of more than 45 per cent. The Russian Federation boasted the highest penetration (60 per cent), followed by Kazakhstan (56.5 per cent). The Russian Federation was one of the first countries in the region to launch 3G services in 2007.21 Since then, operators have expanded their mobile-broadband networks beyond the main cities
Table 3.6: IDI – CIS
Note: *Simple averages. ** Until 2009, the CIS region included the above countries. Georgia exited the Commonwealth on August 18, 2009, but is included in this report.Source: ITU.
Economy Regional rank 2013
Global rank 2013
IDI 2013
Global rank 2012 IDI 2012
Global rank change
2012-2013Belarus 1 38 6.89 43 6.45 5Russian Federation 2 42 6.70 41 6.48 -1Kazakhstan 3 53 6.08 53 5.80 0Moldova 4 61 5.72 60 5.44 -1Azerbaijan 5 64 5.65 65 5.22 1Ukraine 6 73 5.15 71 4.97 -2Armenia 7 74 5.08 73 4.89 -1Georgia** 8 78 4.86 83 4.48 5Kyrgyzstan 9 108 3.78 107 3.69 -1Uzbekistan 10 115 3.40 116 3.27 1Average* 5.33 5.07
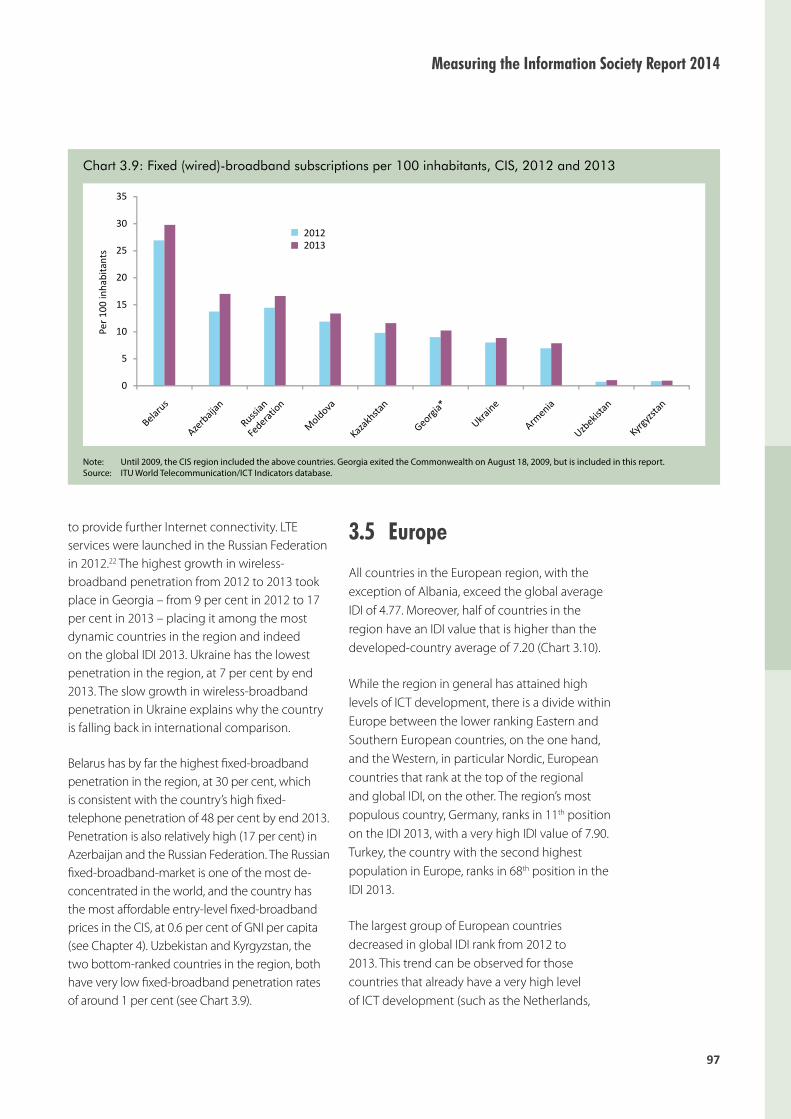
97
Measuring the Information Society Report 2014
to provide further Internet connectivity. LTE services were launched in the Russian Federation in 2012.22 The highest growth in wireless-broadband penetration from 2012 to 2013 took place in Georgia – from 9 per cent in 2012 to 17 per cent in 2013 – placing it among the most dynamic countries in the region and indeed on the global IDI 2013. Ukraine has the lowest penetration in the region, at 7 per cent by end 2013. The slow growth in wireless-broadband penetration in Ukraine explains why the country is falling back in international comparison.
Belarus has by far the highest fixed-broadband penetration in the region, at 30 per cent, which is consistent with the country’s high fixed-telephone penetration of 48 per cent by end 2013. Penetration is also relatively high (17 per cent) in Azerbaijan and the Russian Federation. The Russian fixed-broadband-market is one of the most de-concentrated in the world, and the country has the most affordable entry-level fixed-broadband prices in the CIS, at 0.6 per cent of GNI per capita (see Chapter 4). Uzbekistan and Kyrgyzstan, the two bottom-ranked countries in the region, both have very low fixed-broadband penetration rates of around 1 per cent (see Chart 3.9).
3.5 Europe
All countries in the European region, with the exception of Albania, exceed the global average IDI of 4.77. Moreover, half of countries in the region have an IDI value that is higher than the developed-country average of 7.20 (Chart 3.10).
While the region in general has attained high levels of ICT development, there is a divide within Europe between the lower ranking Eastern and Southern European countries, on the one hand, and the Western, in particular Nordic, European countries that rank at the top of the regional and global IDI, on the other. The region’s most populous country, Germany, ranks in 11th position on the IDI 2013, with a very high IDI value of 7.90. Turkey, the country with the second highest population in Europe, ranks in 68th position in the IDI 2013.
The largest group of European countries decreased in global IDI rank from 2012 to 2013. This trend can be observed for those countries that already have a very high level of ICT development (such as the Netherlands,
Chart 3.9: Fixed (wired)-broadband subscriptions per 100 inhabitants, CIS, 2012 and 2013
Note: Until 2009, the CIS region included the above countries. Georgia exited the Commonwealth on August 18, 2009, but is included in this report.Source: ITU World Telecommunication/ICT Indicators database.
2012
2013
Pe
r 1
00
in
ha
bit
an
ts
Belaru
s
0
5
10
15
20
25
30
35
Azerb
aija
n
Russia
n
Federa
tion
Mold
ova
Kazak
hstan
Georg
ia*
Ukr
aine
Armenia
Uzb
ekist
an
Kyrg
yzst
an

Chapter 3. Regional IDI analysis
98
Luxembourg, France and Austria) and are reaching saturation levels with regard to ICT penetration. The most significant decreases in global IDI rank, however, occurred in the lower half of the regional ranking. Countries such as Poland (-7), Montenegro (-6), Greece, Portugal (both -4), Croatia, Cyprus and Czech Republic (all -3) lost ground to countries from the CIS, the Americas and the Arab States region that are moving up the IDI. Poland and the Czech Republic lost places on the use sub-index, in particular because wireless-broadband penetration grew very little, an indicator that is very dynamic in the developing world. On the other hand, some European countries are still moving up the IDI rankings. Most importantly, Denmark took the leading position in the IDI 2013, replacing long-time number one Republic of Korea. Bosnia and Herzegovina made the largest improvement in rank of all European countries, jumping from 74th to 69th position in the IDI 2013 (see Table 3.7).
Most European countries have achieved very high values on the access sub-index of the IDI. Luxembourg, Switzerland, Iceland (which form the top three on this sub-index) as well
as Germany and the United Kingdom have a sub-index value of above nine. By end 2013, only one country (Andorra) had a mobile-cellular penetration of less than 90 per cent. Most remaining countries well exceeded 100 per cent penetration, and no significant increases took place from 2012 to 2013, which indicates that saturation has been reached in most European mobile-cellular markets. Data from the Eurobarometer underlines this finding: on average, 92 per cent of European Union citizens (the majority of countries in the region are members of the EU) had access to a mobile phone in 2013 (European Commission, 2014b).
The region benefits from an abundant supply of international Internet bandwidth. The highest levels are reached in international hubs such as Germany, Luxembourg and the United Kingdom. High amounts of bandwidth per Internet user, as registered in most European countries, ensure that a large number of Internet users can go online at high speeds.
Around three-quarters of European households have access to the Internet at home. The highest proportions of households connected to the
Chart 3.10: IDI values compared with the global, regional and developing/developed-country averages, Europe, 2013
Source: ITU.
IDI
Developing
Europe
World
Developed
Denm
ark
0
1
2
3
4
5
6
7
8
9
10
Sweden
Icela
nd
Unite
d Kin
gdom
Norw
ay
Neth
erlands
Finla
nd
Luxe
mbourg
Switz
erland
Monac
o
Germ
any
Fran
ce
Andorra
Estonia
Austria
Belgiu
m
Irela
nd
Spai
n
Isra
el
Mal
ta
Slove
nia
Latv
iaIta
ly
Croat
ia
Gre
ece
Lith
uania
Czech
Republic
Portuga
l
Poland
Slova
kia
Hunga
ry
Bulgar
ia
Serb
ia
Cypru
s
Roman
ia
TFYR M
acedonia
Monte
negro
Turk
ey
Alban
ia
Bosnia
and H
erzego
vina

99
Measuring the Information Society Report 2014
Internet are found in Iceland (96 per cent), Luxembourg (95 per cent), the Netherlands (95 per cent) and Norway (94 per cent). Those countries also display an equally high level of households with a computer. In the majority of countries in Europe (25 out of 40), 70 per cent of households have Internet access; and in an even higher number of countries (28 out of 40), 70 per cent of households have a computer. Albania ranks last in the region also in terms of household ICT
penetration, with 22 per cent of households with a computer and 24.5 per cent with Internet access by end 2013. Among the countries that made the most progress in connecting households to the Internet from 2012 to 2013 are Italy (from 63 to 69 per cent), Czech Republic (from 65 to 73 per cent) and Estonia (from 75 to 80 per cent).
Very high household ICT penetration levels having been reached in most of the countries in
Table 3.7: IDI – Europe
Note: *Simple averages. Source: ITU.
Economy Regional rank 2013
Global rank 2013
IDI 2013
Global rank 2012 IDI 2012
Global rank change
2012-2013Denmark 1 1 8.86 2 8.78 1Sweden 2 3 8.67 3 8.68 0Iceland 3 4 8.64 4 8.58 0United Kingdom 4 5 8.50 7 8.28 2Norway 5 6 8.39 6 8.35 0Netherlands 6 7 8.38 5 8.36 -2Finland 7 8 8.31 8 8.27 0Luxembourg 8 10 8.26 9 8.19 -1Switzerland 9 13 8.11 13 7.94 0Monaco 10 15 7.93 17 7.72 2Germany 11 17 7.90 18 7.72 1France 12 18 7.87 16 7.73 -2Andorra 13 20 7.73 24 7.41 4Estonia 14 21 7.68 21 7.54 0Austria 15 24 7.62 23 7.46 -1Belgium 16 25 7.57 26 7.33 1Ireland 17 26 7.57 22 7.48 -4Spain 18 28 7.38 29 7.14 1Israel 19 29 7.29 27 7.25 -2Malta 20 30 7.25 30 7.08 0Slovenia 21 31 7.13 31 6.96 0Latvia 22 33 7.03 33 6.84 0Italy 23 36 6.94 36 6.66 0Croatia 24 37 6.90 34 6.70 -3Greece 25 39 6.85 35 6.70 -4Lithuania 26 40 6.74 40 6.50 0Czech Republic 27 41 6.72 38 6.57 -3Portugal 28 43 6.67 39 6.57 -4Poland 29 44 6.60 37 6.63 -7Slovakia 30 45 6.58 45 6.30 0Hungary 31 46 6.52 44 6.35 -2Bulgaria 32 49 6.31 47 6.12 -2Serbia 33 50 6.24 49 6.07 -1Cyprus 34 51 6.11 48 6.09 -3Romania 35 58 5.83 58 5.52 0TFYR Macedonia 36 60 5.77 62 5.42 2Montenegro 37 63 5.67 57 5.52 -6Turkey 38 68 5.29 68 5.12 0Bosnia and Herzegovina 39 69 5.23 74 4.89 5Albania 40 84 4.72 85 4.42 1Average* 7.14 6.98

Chapter 3. Regional IDI analysis
100
the region, the focus of policy-makers is shifting from providing access to ICTs to improving the quality and speed of access. A number of recent studies have pointed to the disparities in levels of broadband speeds that persist throughout the European Union (EU). The EU seeks to create a coherent broadband market within the Union, in terms of speeds, but also pricing and information/transparency that is required from operators.23 The provision of fast and ultra-fast Internet access is one of the goals of the European Digital Agenda. Fast broadband coverage (defined at 30 Mbit/s) should be available throughout the entire EU and 50 per cent of households should have a broadband subscription with an advertised speed of at least 100 Mbit/s by 2020.24
High-quality and high-speed access are the foundations for making full use of ICTs. Europe stands out with very high levels of ICT usage throughout most countries in the region. Wireless-broadband services are available in every European country, and the large majority of countries have a penetration rate of more than 50 per cent. Finland (123.4 per cent), Sweden
(110 per cent) and Denmark (107 per cent) have the highest penetration rates in the region, while Albania, Hungary, Bosnia and Herzegovina and Montenegro have the lowest, at less than 30 per cent. Growth in wireless-broadband penetration continued at double-digit rates from 2012 to 2013 in the majority of European countries. Some of the highest increases (from 2012 to 2013) took place in Bosnia and Herzegovina (from 12 per cent to 24 per cent), Albania (from 19 per cent to 28 per cent), Romania (from 27 per cent to 38 per cent), TFYR Macedonia (from 25 per cent to 40 per cent) and Slovakia (from 39 per cent to 55 per cent). In Albania, the incumbent operator launched its 3G services in early 2013, increasing competition in the market.25 Operators in Slovakia and Romania have extended and upgraded their networks and started to offer LTE services to customers. The top five countries in the world in terms of fixed-broadband penetration (Monaco, Switzerland, Denmark, Netherlands and France) are all European. Average fixed-broadband penetration in the region stands at 27 per cent by end 2013, way above the global average of 9 per cent. With the exception of Albania, where fixed-broadband
Chart 3.11: Percentage of Individuals using the Internet, Europe compared to global and developed-country average, 2013
Note: Data on Individuals using the Internet for Eurostat members are sourced from Eurostat. Eurostat collects data for Internet users aged 16-74 years old. Source: ITU World Telecommunication/ICT Indicators database.
World
Developed
0
10
20
30
40
50
60
70
80
90
100
%

101
Measuring the Information Society Report 2014
penetration stands at 6 per cent, all European countries exceed the global average penetration.
A well-developed ICT infrastructure and the availability of high-speed broadband Internet access and relevant content are reflected in a higher proportion of Internet users in the region. Close to half a billion Europeans were online in 2013, which corresponds to 73 per cent of the population. Iceland has the highest proportion of Internet users globally, at 96.5 per cent, followed by three other Nordic countries – Norway, Sweden and Denmark – with 95 per cent of the population using the Internet. Turkey has the lowest proportion of Internet users, at below 50 per cent. In Romania, too, less than half of the population are online (Chart 3.11).
3.6 The Americas
The United States and Canada lead the Americas regional ranking, with IDI values of 8.02 and 7.62, respectively. Half of the countries in the Americas have IDI values above the global average, while
the other half fall below. Uruguay is the highest ranked Latin American country, with an IDI of 6.32, which is significantly above the regional (4.86) and developing-country (3.84) average. The region’s most populous developing country, Brazil (5.50), also lies above the regional and developing-country averages. Cuba is the only LCC in the Americas, and has an IDI value of just 2.77. The lower-middle income countries Bolivia, El Salvador, Guatemala, Guyana, Honduras, Nicaragua and Paraguay also fall short of the developing-country average (see Chart 3.12).
Colombia, the Dominican Republic, Trinidad and Tobago and Uruguay were the most dynamic countries in the region. On the access sub-index, Bolivia and Mexico stand out for substantial improvements in ICT infrastructure development. However, from 2012 to 2013, more countries in the Americas declined than improved in the global IDI rankings. Those that dropped down the global rankings from 2012 to 2013 include Panama and Suriname (-5 ranks) and Peru (-4 ranks). In particular, Cuba is falling further behind, ranking 125th in the IDI 2013 as against 122nd in 2012 (see Table 3.8). The country’s mobile-cellular
Chart 3.12: IDI values compared with the global, regional and developing/developed-country averages, the Americas, 2013
Source: ITU.
Developing
The Americas
World
Developed
Unite
d Sta
tes
IDI
0
1
2
3
4
5
6
7
8
9
Canad
a
Barbad
os
Uru
guay
St. K
itts an
d Nevi
s
Costa
Rica
Chile
Antigua
& B
arbuda
Argentin
a
Brazil
Trin
idad
& Tobag
o
St. V
ince
nt and th
e Gr.
Gre
nada
Colom
bia
St. L
ucia
Venezuela
Panam
a
Dom
inic
a
Ecuad
or
Mexi
co
Jam
aica
Surin
ame
Dom
inic
an R
ep.
Peru
Bolivia
Parag
uay
El Sal
vador
Guya
na
Guat
emal
a
Hondura
s
Nic
arag
ua
Cuba

Chapter 3. Regional IDI analysis
102
penetration is one of the lowest in the world and increased only marginally from 2012 to 2013. Broadband is almost non-existent, with wireless-broadband services still not available in 2013 and a fixed-broadband penetration of less than 1 per cent.
With an average mobile-cellular penetration of 107 per cent by end 2013, penetration is reaching saturation levels in the Americas. Few countries saw noteworthy increases in subscriptions from 2012 to 2013. While penetration exceeded 150 per cent in Panama, Argentina and Uruguay by end 2013, Cuba is seriously lagging behind, with only 18 per cent penetration. The country’s Empresa de Telecomunicaciones de Cuba has one of the last
state telecommunication-sector monopolies in the world.
International Internet connectivity, measured in bit/s per Internet user, is ample in the United States and Canada, and Brazil26 also has a large amount of bandwidth. Brazil is connected within the region and across the Atlantic Ocean through a multitude of submarine cables. Colombia managed to quadruple its amount of international Internet bandwidth, from around 20 000 bit/s per Internet user in 2012 to close to 80 000 bit/s in 2013.
The Americas region has a relatively high household ICT penetration. By end 2013, on
Table 3.8: IDI – The Americas
Note: *Simple averages. Source: ITU.
Economy Regional rank 2013
Global rank 2013
IDI 2013
Global rank 2012 IDI 2012
Global rank change
2012-2013United States 1 14 8.02 14 7.90 0Canada 2 23 7.62 25 7.37 2Barbados 3 35 6.95 32 6.87 -3Uruguay 4 48 6.32 51 5.92 3St. Kitts and Nevis 5 54 6.01 52 5.89 -2Costa Rica 6 55 5.92 55 5.64 0Chile 7 56 5.92 54 5.68 -2Antigua & Barbuda 8 57 5.89 59 5.49 2Argentina 9 59 5.80 56 5.58 -3Brazil 10 65 5.50 67 5.16 2Trinidad & Tobago 11 67 5.29 70 4.99 3St. Vincent and the Grenadines 12 72 5.17 69 5.04 -3Grenada 13 76 4.96 75 4.83 -1Colombia 14 77 4.95 80 4.61 3St. Lucia 15 79 4.81 79 4.66 0Venezuela 16 80 4.81 78 4.68 -2Panama 17 82 4.75 77 4.69 -5Dominica 18 83 4.72 81 4.58 -2Ecuador 19 88 4.56 88 4.28 0Mexico 20 95 4.29 94 4.07 -1Jamaica 21 97 4.26 98 4.01 1Suriname 22 98 4.26 93 4.08 -5Dominican Rep. 23 102 4.06 105 3.78 3Peru 24 105 4.00 101 3.92 -4Bolivia 25 107 3.78 109 3.52 2Paraguay 26 109 3.71 108 3.56 -1El Salvador 27 110 3.61 110 3.47 0Guyana 28 111 3.48 111 3.44 0Guatemala 29 118 3.20 117 3.11 -1Honduras 30 119 3.18 119 3.01 0Nicaragua 31 120 2.96 120 2.78 0Cuba 32 125 2.77 122 2.69 -3Average* 4.86 4.67
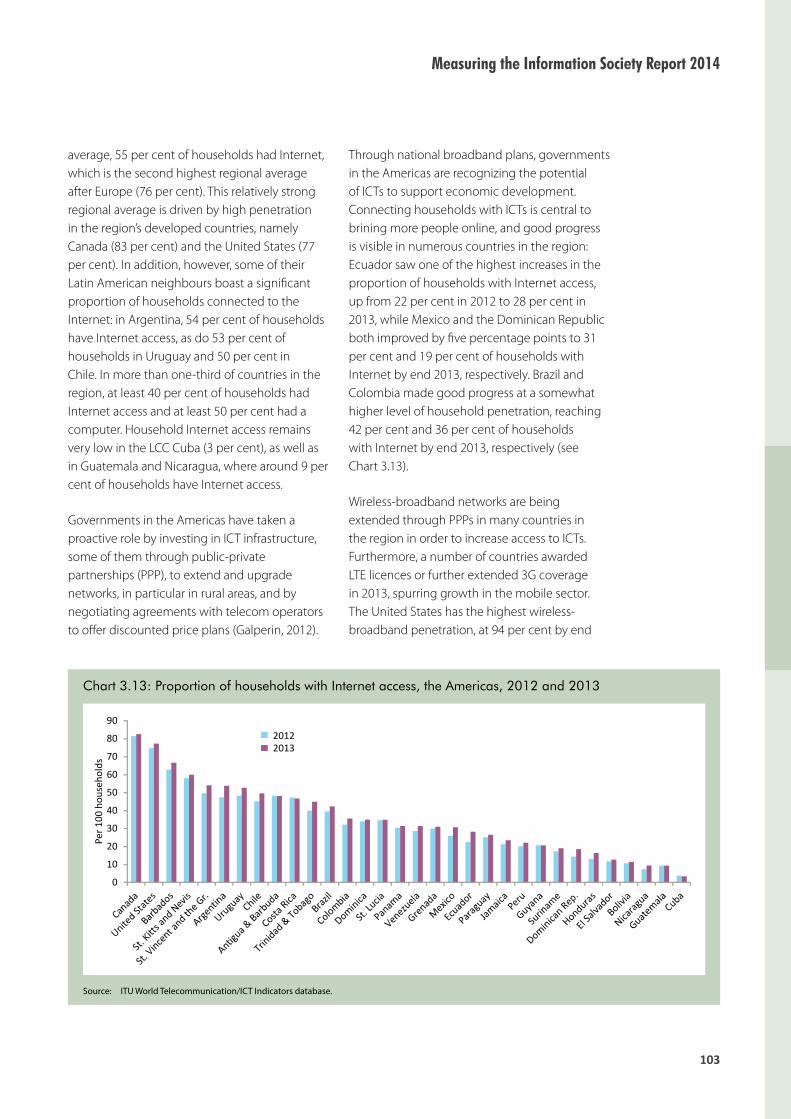
103
Measuring the Information Society Report 2014
average, 55 per cent of households had Internet, which is the second highest regional average after Europe (76 per cent). This relatively strong regional average is driven by high penetration in the region’s developed countries, namely Canada (83 per cent) and the United States (77 per cent). In addition, however, some of their Latin American neighbours boast a significant proportion of households connected to the Internet: in Argentina, 54 per cent of households have Internet access, as do 53 per cent of households in Uruguay and 50 per cent in Chile. In more than one-third of countries in the region, at least 40 per cent of households had Internet access and at least 50 per cent had a computer. Household Internet access remains very low in the LCC Cuba (3 per cent), as well as in Guatemala and Nicaragua, where around 9 per cent of households have Internet access.
Governments in the Americas have taken a proactive role by investing in ICT infrastructure, some of them through public-private partnerships (PPP), to extend and upgrade networks, in particular in rural areas, and by negotiating agreements with telecom operators to offer discounted price plans (Galperin, 2012).
Through national broadband plans, governments in the Americas are recognizing the potential of ICTs to support economic development. Connecting households with ICTs is central to brining more people online, and good progress is visible in numerous countries in the region: Ecuador saw one of the highest increases in the proportion of households with Internet access, up from 22 per cent in 2012 to 28 per cent in 2013, while Mexico and the Dominican Republic both improved by five percentage points to 31 per cent and 19 per cent of households with Internet by end 2013, respectively. Brazil and Colombia made good progress at a somewhat higher level of household penetration, reaching 42 per cent and 36 per cent of households with Internet by end 2013, respectively (see Chart 3.13).
Wireless-broadband networks are being extended through PPPs in many countries in the region in order to increase access to ICTs. Furthermore, a number of countries awarded LTE licences or further extended 3G coverage in 2013, spurring growth in the mobile sector. The United States has the highest wireless-broadband penetration, at 94 per cent by end
Chart 3.13: Proportion of households with Internet access, the Americas, 2012 and 2013
Source: ITU World Telecommunication/ICT Indicators database.
0
10
20
30
40
50
60
70
80
90
2012
2013
Pe
r 1
00
ho
use
ho
lds

Chapter 3. Regional IDI analysis
104
2013. It was an early adopter of LTE technology, and coverage was massively extended throughout the country in 2013. The operator Verizon had achieved 97 per cent LTE population coverage, and the majority of all data traffic is carried by the LTE network.27 Very high increases were reported by Brazil, where 40 million new wireless-broadband subscriptions were added within a year, resulting in a penetration of 52 per cent by end 2013. LTE services were first launched in the country in early 2013.28 Antigua and Barbuda (from 23 per cent to 49 per cent), Colombia (from 15 per cent to 25 per cent) and Saint Lucia (from 19 per cent to 33 per cent) also show very good progress in terms of wireless-broadband penetration from 2012 to 2013. While the majority of countries in the Americas region are making remarkable progress in extending their wireless-broadband networks, services were still not available in Cuba, Dominica, Guyana and St. Vincent and the Grenadines by end 2013.
Fixed-broadband penetration is high in regional but also global comparison in the United States (33 per cent) and Canada (28 per cent).
St. Kitts and Nevis, Barbados and Uruguay also display relatively high levels of more than 20 per cent penetration by end 2013. Uruguay registered the highest absolute increase from 2012 to 2013, with penetration rates rising from 16.5 per cent to 21 per cent. The country has some of the lowest fixed-broadband prices in the region, which has contributed to driving uptake (Chapter 3). A number of countries in the Americas, particularly those that were late adopters of mobile-broadband technology such as Dominica, Grenada and St. Vincent and the Grenadines, have significantly higher fixed-broadband than wireless-broadband penetration rates.
Close to 1 billion people are using the Internet in the Americas region. While the highest proportion of individuals using the Internet is to be found in the United States and Canada, more than half of the population is online in countries such as Argentina, Brazil, Chile, Colombia, Uruguay and Venezuela.

105
Measuring the Information Society Report 2014
1 See: http://www.itu.int/ITU-D/ict/definitions/regions/index.html.
2 The standard deviation (StDev) shows the average distance of a value to the mean. The coefficient of variation (CV) measures the dispersion of a variable independently of the variable’s measurement unit. The higher the CV, the greater the dispersion in the variable.
3 http://www.cvmovel.cv/nacional-gsm-3g-edge-e-gprs.
4 http://www.telegeography.com/products/commsupdate/articles/2014/04/24/mtn-reports-210-1m-subscribers-at-end-march/?utm_source=CommsUpdate&utm_campaign=76faf56793-CommsUpdate+24+April+2014&utm_medium=email&utm_term=0_0688983330-76faf56793-8868625 and http://www.telegeography.com/products/commsupdate/articles/2012/10/22/airtel-widens-3-5g-footprint/.
5 http://www.gsmamobileeconomyafrica.com/Sub-Saharan%20Africa_ME_Report_English_2013.pdf.
6 http://www.epegcable.com/.
7 http://www.gbiinc.com/SitePages/News_Details.aspx?itmID=110.
8 http://www.omantel.om/OmanWebLib/Individual/Internet/pc_initiative.aspx?linkId=3&MenuId=420 and http://www.ita.gov.om/ITAPortal/Pages/Page.aspx?NID=617&PID=2209&LID=111.
9 http://www.qatar-tribune.com/viewnews.aspx?n=4392EF47-A715-496F-BF1D-A0EE8B74D0E7&d=20140128.
10 http://www.telecompaper.com/news/algeria-awards-3g-licences-to-all-three-bidders--972965.
11 Internet user data from Gulf countries are not comparable, as they refer to different populations. Data from Bahrain and Qatar refer to the overall population, i.e. including expatriate/transient workers. Data from United Arab Emirates are estimated by ITU based on base data excluding the transient worker population.
12 Reported in activated external capacity.
13 http://www.ofca.gov.hk/en/industry_focus/telecommunications/facility_based/infrastructures/submarine_cables/index.html.
14 http://submarinenetworks.com/systems/intra-asia/sjc/sjc-cable-system.
15 http://www.submarinecablemap.com/#/submarine-cable/boracay-palawan-submarine-cable-system.
16 http://web.nso.go.th/en/survey/data_survey/560619_2012_Information-.pdf.
17 http://www.digitimes.com/news/a20131227PD215.html and http://www.eurobiz.com.cn/chinas-broadband-strategy/.
18 http://file.eu-chinapdsf.org/Internet/PUB/Activity4/Results%203/Broadband%20China%20introduction_Yu%20Xiaohui.pdf.
19 Belarus, Moldova, Russian Federation and Ukraine are considered as developed countries according to the UN classification.
20 See ITU Interactive Transmission Map: http://www.itu.int/en/ITU-D/Technology/Pages/InteractiveTransmissionMaps.aspx.
21 http://www.mtsgsm.com/upload/contents/328/2008_07_25_3G_Strategy.pdf.
22 http://www.mtsgsm.com/news/2014-01-23-61993/ and http://english.corp.megafon.ru/news/20140425-1712.html.
23 http://europa.eu/rapid/press-release_IP-14-314_en.htm.
24 http://ec.europa.eu/digital-agenda/en/digital-agenda-scoreboard.
25 http://www.telegeography.com/products/commsupdate/articles/2013/03/01/the-eagle-has-landed-incumbent-swoops-into-3g-sector/.
26 Data reported by the country refer to 2012.
27 http://www.verizonwireless.com/wcms/consumer/4g-lte.html and http://www.telecompaper.com/news/verizon-wireless-lte-reaches-500-markets--952458.
28 http://www.rcrwireless.com/article/20121214/carriers/claro-first-launch-lte-services-brazil/.
Endnotes


107
Measuring the Information Society Report 2014
Chapter 4. ICT prices and the role of competition
4.1 Introduction
The price of ICT services constitutes a determining factor for ICT uptake and, as such, continues to be a focus of attention for regulators and policy-makers. Affordability remains the main barrier to Internet access at home in many developing countries. In Brazil, for instance, 44 per cent of all households with a computer did not have Internet in 2013 because they considered it too expensive or beyond their means (CETIC.BR, 2013). In developed countries, although not having Internet at home may be more attributable to other factors, such as lack of interest, cost still represents a barrier for many people. In the European Union, around one in five households without Internet cite cost as the reason, and seven out of ten of those who have Internet state that price is the most important factor when choosing the service (European Commission, 2013; European Commission, 2014). The importance of affordability also applies to other ICT services, and its impact goes beyond access, also influencing usage: over half of EU citizens limit their national mobile phone calls because of concerns about cost (European Commission, 2014).
In response to the demand for global benchmarks on ICT prices, ITU has been collecting ICT price
data following a harmonized methodology since 2008. Initially, prices were collected for fixed-telephone, mobile-cellular (voice and SMS) and fixed-broadband services. Since 2012, the data collection has been extended to include mobile-broadband prices. These data have proved to be useful for the international comparison of ICT prices across more than 160 countries, and for identifying those cases where prices constitute a barrier to ICT uptake.
This year’s analysis of ICT prices goes beyond simply measuring affordability, and provides some insights into the relationship between affordability and income inequality, competition and regulation. The objective is to single out some salient explanatory factors for the affordability of ICT prices, and offer a quantitative assessment of how policy actions targeting these factors may help in making ICT services more affordable and thus increase ICT access and use.
The affordability of an ICT service does not only depend on its price, but also on the means of each specific income group within a country to whom the service is offered, and on the distribution of income within a community. There is growing interest in considering income inequality in the international development debate.1 The work on

Chapter 4. ICT prices and the role of competition
108
income distribution stems partly from the tracking of global objectives on poverty reduction, such as the Millennium Development Goals (MDGs), but also from the growing academic attention given to this topic in the aftermath of the global financial crisis. In the context of ICTs, income distribution also plays a role in determining uptake, because it conditions affordability.
The effects of competition in driving prices down and fostering innovation have been most apparent in the mobile-cellular market, where low prepaid prices became a key enabler for the mass uptake of mobile-cellular services observed in the developing world in the last decade; but they also apply to other telecommunication markets. Regulation sets the framework for competition, and is thus the lever which policy-makers and regulators can use to influence competition. As a result, of all the important elements in the analysis of the affordability of ICT prices, competition and regulation are those upon which telecommunication administrations may exert more direct control. They therefore merit particular attention.
This chapter will present and discuss key metrics for monitoring the global affordability of ICT services. It will first look at prices in the voice market and their evolution in the period 2008-2013. This will be followed by a more in-depth analysis of prices in the broadband market in the same period, highlighting some pricing trends in the most dynamic market segment: mobile broadband. Then, the affordability of ICT services will be analysed in the light of household income inequalities, thereby quantifying how far low-income segments of the population may be excluded from the information society by price barriers. The final part of the chapter will assess the impact of competition and regulation on ICT prices. Based on an econometric model, a number of conclusions will be presented on the effects of competition and regulation on mobile-cellular and fixed-broadband prices.
The results of the latest ICT Price Basket (IPB) are presented in Table 4.15 at the end of this chapter.
They include end-2013 data for each of the three price sets contained in the IPB (fixed-telephone, mobile-cellular and fixed-broadband services), as well as the general IPB ranking combining the three sub-baskets expressed in terms of GNI per capita (GNI p.c.).
Prices in this chapter are expressed in three complementary units:
• In USD, using the IMF annual rates of exchange.
• In international dollars (PPP$), using purchasing power parity (PPP) conversion factors instead of market exchange rates. The use of PPP exchange factors helps to screen out price and exchange-rate distortions, thus providing a measure of the cost of a given service taking into account the purchasing power equivalences between countries.2
• As a percentage of countries’ monthly GNI p.c. (Atlas method).3 Prices are expressed as a percentage of GNI p.c. in order to show them in relative terms to the size of the economy of each country, thus pointing to the affordability of each ICT service at a country level.
The methodological details of the IPB and the collection of mobile-broadband prices can be found in Annex 2.
4.2 Fixed-telephone and mobile-cellular prices
Traditional voice services4 and SMS have become the most ubiquitous ICT services,overtaking historical ICTs such as radio and television broadcasting in many countries. For instance, only 9 per cent of households had a telephone in India in 2001, compared with 32 per cent of households with a TV and 35 per cent of
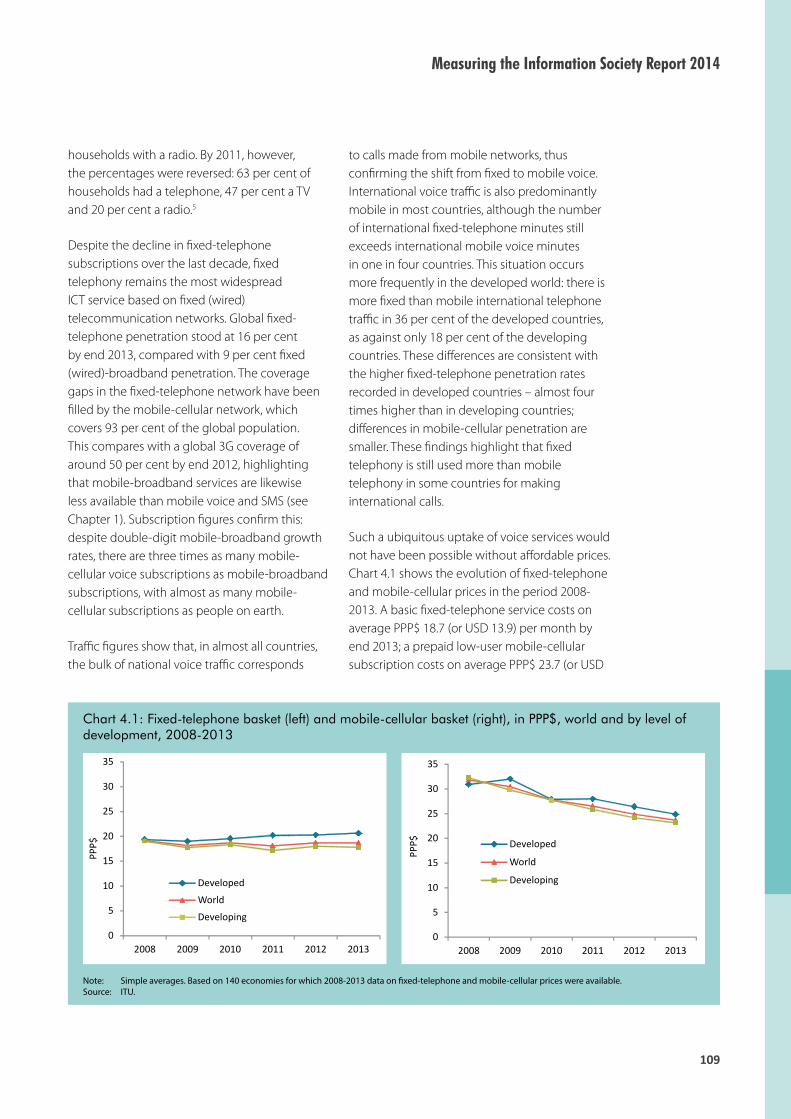
109
Measuring the Information Society Report 2014
households with a radio. By 2011, however, the percentages were reversed: 63 per cent of households had a telephone, 47 per cent a TV and 20 per cent a radio.5
Despite the decline in fixed-telephone subscriptions over the last decade, fixed telephony remains the most widespread ICT service based on fixed (wired) telecommunication networks. Global fixed-telephone penetration stood at 16 per cent by end 2013, compared with 9 per cent fixed (wired)-broadband penetration. The coverage gaps in the fixed-telephone network have been filled by the mobile-cellular network, which covers 93 per cent of the global population. This compares with a global 3G coverage of around 50 per cent by end 2012, highlighting that mobile-broadband services are likewise less available than mobile voice and SMS (see Chapter 1). Subscription figures confirm this: despite double-digit mobile-broadband growth rates, there are three times as many mobile-cellular voice subscriptions as mobile-broadband subscriptions, with almost as many mobile-cellular subscriptions as people on earth.
Traffic figures show that, in almost all countries, the bulk of national voice traffic corresponds
to calls made from mobile networks, thus confirming the shift from fixed to mobile voice. International voice traffic is also predominantly mobile in most countries, although the number of international fixed-telephone minutes still exceeds international mobile voice minutes in one in four countries. This situation occurs more frequently in the developed world: there is more fixed than mobile international telephone traffic in 36 per cent of the developed countries, as against only 18 per cent of the developing countries. These differences are consistent with the higher fixed-telephone penetration rates recorded in developed countries – almost four times higher than in developing countries; differences in mobile-cellular penetration are smaller. These findings highlight that fixed telephony is still used more than mobile telephony in some countries for making international calls.
Such a ubiquitous uptake of voice services would not have been possible without affordable prices. Chart 4.1 shows the evolution of fixed-telephone and mobile-cellular prices in the period 2008-2013. A basic fixed-telephone service costs on average PPP$ 18.7 (or USD 13.9) per month by end 2013; a prepaid low-user mobile-cellular subscription costs on average PPP$ 23.7 (or USD
Chart 4.1: Fixed-telephone basket (left) and mobile-cellular basket (right), in PPP$, world and by level of development, 2008-2013
Note: Simple averages. Based on 140 economies for which 2008-2013 data on fixed-telephone and mobile-cellular prices were available.Source: ITU.
0
5
10
15
20
25
30
35
2008 2009 2010 2011 2012 2013
Developed
World
Developing
PP
P$
0
5
10
15
20
25
30
35
2008 2009 2010 2011 2012 2013
Developed
World
Developing
PP
P$

Chapter 4. ICT prices and the role of competition
110
16.2) per month.6 This compares with an average of PPP$ 53.0 (or USD 31.9) per month for an entry-level fixed-broadband plan, and PPP$ 28.4 (or USD 19.5) per month for a prepaid mobile-broadband service with a 500 MB monthly data allowance.7 Despite the limitations of comparing such different services, the results roughly confirm that fixed-telephone and mobile-cellular prices are the cheapest among ICT services, suggesting that low prices have contributed to the widespread adoption of traditional voice and SMS services.
Fixed-telephone prices have followed an almost flat evolution, with a small decrease in prices observed during the period in developing countries (-1.3 per cent compound annual growth rate (CAGR) in the developing world in the period 2008-2013). The fixed-telephone market is the most mature segment of those included in the ITU price data collection exercise. Growth rates have been stagnating since 2008, and there have been few structural changes in the market: 78 per cent of the countries with price data had already fully or partially liberalized their fixed-telephone market in 2008, compared with 88 per cent in 2013. Moreover, in some cases liberalization has signalled the end of cross-subsidies for fixed-telephone services, and the deregulation of retail fixed-telephone prices. The cheapest fixed-telephone prices are found in countries where there is still strong government control over the main fixed-telephone operator, such as the Islamic Republic of Iran, Cuba and Moldova, where basic fixed-telephone services cost less than USD 0.5 per month (Table 4.1).
Mobile-cellular prices have declined in the period 2008-2013, with a CAGR of -5.7 per cent globally. The decrease in prices has affected developed and developing countries alike, with -4.3 and -6.4 per cent CAGR, respectively. Mobile-cellular penetration was already above 100 per cent in developed countries in 2008, but pro-competitive measures – such as mobile number portability, reductions in mobile termination rates and the licensing of new entrants, including mobile virtual network operators (MVNOs) –
have been implemented and thus driven prices down. In developing countries, the number of mobile-cellular subscriptions almost doubled in the period 2008-2013. Operators developed innovative prepaid offers at reduced prices to reach the huge customer base that remained untapped in 2008, thus growing organically and benefitting from economies of scale.
The top countries with the cheapest prepaid mobile-cellular plans are all from the developing world, including 15 countries where a low-usage monthly mobile-cellular plan costs less than USD 5 per month (Table 4.2). Most countries with the cheapest prepaid mobile-cellular prices are in the Asia and the Pacific region, with Sri Lanka (USD 0.95 or PPP$ 2.6 per month) and Bangladesh (USD 1.41 or PPP$ 4.0 per month) standing out with the lowest prepaid mobile-cellular prices in the world. These are examples of the levels of efficiency that operators can achieve, and how cheaper prices may help reach low-income users (who can afford the service) and extend operators’ customer bases, even if at lower margins for some segments.8
Prices in PPP$ or USD show the supply-side perspective, i.e. the price that the operator sets for the service. To better understand how much the price of a given ICT service represents for the user in each country, prices are also presented as a percentage of GNI p.c., so as to provide an insight into the affordability of fixed-telephone and mobile-cellular services from a demand-side perspective (Chart 4.2).
From this perspective, voice services are less affordable in developing countries than in developed countries. By end 2013, a basic fixed-telephone service cost on average 1.0 per cent of GNI per capita in developed countries compared with 5.2 per cent in developing countries. There are, however, notable exceptions, with developing countries such as Islamic Republic of Iran, Cuba, Venezuela and Qatar topping the ranking of the world’s most affordable fixed-telephone services with prices below 0.2 per cent of GNI p.c. The relatively high

111
Measuring the Information Society Report 2014
Chart 4.2: Fixed-telephone basket (left) and mobile-cellular basket (right), as a percentage of GNI p.c., world and by level of development, 2008-2013
Note: Simple averages. Based on 140 economies for which 2008-2013 data on fixed-telephone and mobile-cellular prices were available.Source: ITU.
0
2
4
6
8
10
12
2008 2009 2010 2011 2012 2013
Developing
World
Developed
As
a %
of
GN
I p
.c.
0
2
4
6
8
10
12
2008 2009 2010 2011 2012 2013
Developing
World
Developed
As
a %
of
GN
I p
.c.
average in developing countries is explained by the large dispersion of fixed-telephone prices in the developing world: affordability ranges from less than 0.2 per cent of GNI p.c. in the countries cited above, to more than 30 per cent of GNI p.c. in Niger, Central African Republic, Malawi and Madagascar (Table 4.1). If the affordability target set by the Broadband Commission for Digital Development for broadband prices (less than 5 per cent of monthly GNI p.c. by 2015) were applied to fixed-telephone prices, there would be 35 developing countries not meeting the target in 2013, most of them from Africa. On the other hand, all developed countries would already have met the target in 2008. A fixed-line fee is in most cases required for contracting ADSL services. Since ADSL is currently the predominant fixed-broadband technology,9 it is thus relevant to track the cost of fixed-line subscriptions also in the context of fixed-broadband prices.
By end 2013, a low-usage prepaid mobile-cellular service cost on average 1.6 per cent of GNI p.c. in developed countries, as against 6.2 per cent in developing countries. Although affordability improved in developing countries, from an average of 11.8 per cent of GNI p.c. in 2008 to 6.2 per cent in 2013, in 43 developing countries
mobile-cellular services still cost more than 5 per cent of GNI p.c. in 2013. The affordability of basic mobile-cellular services remains a major barrier to further adoption in several African countries: of the 20 countries with the least affordable mobile-cellular prices in 2013, 16 were from Africa. These countries could follow the best practices of other economies in the region, such as Kenya and Ghana, which have succeeded in bringing prices down through a pro-competitive approach (see Box 3.1 in ITU, 2011).
The case of Kenya points to the importance, but also the limits, of operators’ actions as a stimulus to make mobile-cellular prices affordable. Despite Kenya being one of the most dynamic mobile markets in Africa and having the twelfth cheapest prices in USD in the world (USD 3.8 for a low-user basket in 2013), they still represented 5.0 per cent of GNI p.c., on account of the country’s low-income level.10 Further reductions in mobile-cellular prices could be achieved by combining regulatory actions to promote competition – such as fostering inter-operator competition continuing with the glide-path set for mobile termination rates (MTRs) (CCK, 2010), allowing the entry of MVNOs11 and streamlining mobile number portability12 – and policy initiatives to strengthen the demand side.

Chapter 4. ICT prices and the role of competition
112
Table 4.1: Fixed-telephone sub-basket, 2013
Note: * Data correspond to the GNI per capita (Atlas method) in 2013 or latest available year adjusted with the international inflation rates. ** Country not ranked because data on GNI p.c. are not available for the last five years.
Source: ITU. GNI p.c. and PPP$ values are based on World Bank data.
Rank Economy
Fixed-telephone sub-basket GNI p.c., USD,
2013* Rank Economy
Fixed-telephone sub-basket GNI p.c., USD,
2013*as % of GNI p.c. USD PPP$
as % of GNI p.c. USD PPP$
1 Iran (I.R.) 0.03 0.12 0.26 5’780 85 Romania 1.57 11.88 16.27 9’0602 Cuba 0.05 0.24 - 6’014 86 Equatorial Guinea 1.60 19.13 - 14’3203 Venezuela 0.11 1.18 1.49 12’550 87 Poland 1.73 18.70 30.74 12’9604 Qatar 0.13 9.07 12.32 85’550 88 Barbados 1.73 22.00 17.74 15’2315 Macao, China 0.16 8.39 11.35 64’691 89 Mongolia 1.74 5.48 11.67 3’7706 Belarus 0.17 0.97 2.58 6’720 90 Czech Republic 1.76 26.49 34.89 18’0607 Singapore 0.20 8.80 9.10 54’040 91 Albania 1.82 7.11 13.03 4’7008 Moldova 0.23 0.48 1.04 2’460 92 Bulgaria 1.94 11.38 21.86 7’0309 Trinidad & Tobago 0.24 3.22 4.04 15’760 93 India 1.95 2.55 8.52 1’570
10 Kuwait 0.27 10.23 15.77 45’889 94 Bosnia and Herzegovina 1.97 7.79 13.57 4’74011 Korea (Rep.) 0.29 6.22 7.44 25’920 95 Namibia 1.98 9.63 16.69 5’84012 Bahrain 0.29 4.76 8.12 19’756 96 St. Vincent and the Grenadines 1.98 10.86 14.39 6’58013 Norway 0.33 27.88 16.71 102’610 97 Swaziland 2.01 5.15 11.05 3’08014 United Arab Emirates 0.33 10.62 - 39’006 98 Guatemala 2.05 5.70 11.06 3’34015 Russian Federation 0.34 3.93 6.85 13’860 99 Dominica 2.14 12.06 16.13 6’76016 Suriname 0.37 2.87 4.86 9’260 100 Grenada 2.16 13.41 17.51 7’46017 Azerbaijan 0.42 2.55 5.90 7’350 101 Hungary 2.17 22.71 35.36 12’53418 Hong Kong, China 0.44 14.18 18.23 38’420 102 TFYR Macedonia 2.18 8.71 17.35 4’80019 Luxembourg 0.45 27.20 20.51 72’528 103 Botswana 2.20 14.20 - 7’73020 Brunei Darussalam 0.46 12.55 18.91 33’002 104 Ethiopia 2.22 0.87 2.31 47021 United States 0.47 21.22 21.22 53’670 105 St. Lucia 2.27 13.41 16.59 7’09022 Oman 0.48 10.18 19.44 25’503 106 Mexico 2.27 18.80 25.61 9’94023 Switzerland 0.49 33.17 19.77 81’760 107 Jordan 2.28 9.42 19.64 4’95024 Kazakhstan 0.50 4.76 8.07 11’380 108 Peru 2.36 12.58 21.06 6’39025 Australia 0.56 30.84 20.75 65’520 109 Chile 2.38 30.27 37.90 15’23026 Sweden 0.57 28.20 20.19 59’130 110 Brazil 2.50 24.34 29.26 11’69027 Denmark 0.57 29.20 19.43 61’110 111 Paraguay 2.55 8.57 15.54 4’04028 Costa Rica 0.60 4.80 6.57 9’550 112 Colombia 2.67 16.80 25.81 7’56029 Uzbekistan 0.62 0.97 - 1’900 113 Fiji 2.68 9.88 14.56 4’43030 Japan 0.62 23.72 20.63 46’140 114 Jamaica 2.73 11.85 16.62 5’22031 Iceland 0.63 23.15 19.16 43’930 115 Ghana 2.76 4.05 8.52 1’76032 Israel 0.64 18.19 15.10 34’120 116 Afghanistan 2.78 1.62 4.56 70033 Austria 0.66 26.53 23.06 48’590 117 Nigeria 3.18 7.30 12.13 2’76034 Mauritius 0.66 5.09 8.24 9’300 118 Dominican Rep. 3.24 15.16 29.10 5’62035 Bhutan 0.66 1.35 4.06 2’460 119 South Africa 3.25 19.49 34.51 7’19036 Canada 0.67 29.08 23.17 52’200 120 Honduras 3.48 6.33 11.98 2’18037 Germany 0.71 27.42 25.10 46’100 121 El Salvador 3.49 10.82 20.60 3’72038 Maldives 0.73 3.42 4.44 5’600 122 Bangladesh 3.49 2.62 7.47 90039 Malta 0.78 12.97 15.15 19’927 123 Cape Verde 3.61 10.92 18.97 3’63040 France 0.79 27.94 23.80 42’250 124 Sudan 3.94 3.71 - 1’13041 Georgia 0.81 2.40 4.99 3’570 125 Angola 3.94 16.46 18.57 5’01042 Estonia 0.83 12.06 14.03 17’370 126 Lao P.D.R. 3.94 4.80 12.01 1’46043 Netherlands 0.83 32.94 27.79 47’440 127 Pakistan 4.27 4.91 17.22 1’38044 Armenia 0.85 2.69 5.71 3’790 128 Samoa 4.31 12.33 15.13 3’43045 China 0.88 4.80 7.92 6’560 129 Nepal 4.37 2.66 8.37 73046 Finland 0.88 34.54 25.99 47’110 130 Nicaragua 4.59 6.81 15.79 1’78047 Seychelles 0.88 9.22 13.05 12’530 131 Cambodia 4.80 3.80 9.81 95048 Uruguay 0.89 11.32 12.45 15’180 132 Zambia 5.36 6.61 12.93 1’48049 Morocco 0.90 2.26 4.55 3’030 133 Belize 5.38 20.88 35.91 4’66050 Latvia 0.93 11.04 14.43 14’201 134 Kiribati 5.53 12.07 - 2’62051 Bahamas 0.94 16.25 14.29 20’806 135 Gabon 5.69 50.52 69.76 10’65052 Slovenia 0.96 18.37 20.49 23’058 136 Burundi 5.85 1.37 3.54 28053 Belgium 0.97 36.50 31.02 45’210 137 Philippines 6.05 16.49 36.15 3’27054 Egypt 0.97 2.56 8.63 3’160 138 Timor-Leste 6.61 19.72 31.49 3’58055 Guyana 0.98 3.05 - 3’750 139 S. Tomé & Principe 6.74 8.25 13.08 1’47056 Lithuania 0.99 11.50 16.54 13’958 140 Haiti 7.68 5.18 10.00 81057 United Kingdom 1.01 32.77 26.82 39’110 141 Papua New Guinea 7.85 13.14 - 2’01058 Panama 1.02 9.10 15.48 10’700 142 Lesotho 8.14 10.52 24.45 1’55059 Malaysia 1.05 9.08 17.99 10’400 143 Solomon Islands 8.24 11.05 10.37 1’61060 Cyprus 1.08 24.08 25.97 26’654 144 Rwanda 8.98 4.64 11.29 62061 Italy 1.09 31.32 28.19 34’400 145 Eritrea 11.17 4.56 - 49062 Sri Lanka 1.11 2.94 8.10 3’170 146 Bolivia 11.32 24.05 53.57 2’55063 St. Kitts and Nevis 1.12 12.61 15.55 13’460 147 Marshall Islands 13.07 45.75 - 4’20064 Antigua & Barbuda 1.19 12.78 15.55 12’910 148 Senegal 13.39 11.94 24.31 1’07065 Saudi Arabia 1.21 26.40 53.93 26’200 149 Mali 14.22 7.94 17.47 67066 Ireland 1.23 40.36 31.76 39’501 150 Zimbabwe 14.89 10.18 - 82067 Slovakia 1.25 18.09 23.79 17’372 151 Vanuatu 15.99 41.71 33.26 3’13068 New Zealand 1.26 37.72 29.30 35’875 152 Kenya 16.78 13.00 28.31 93069 Viet Nam 1.26 1.82 4.44 1’730 153 Côte d'Ivoire 17.21 19.80 41.36 1’38070 Serbia 1.27 6.06 10.51 5’730 154 Mauritania 18.71 16.53 - 1’06071 Croatia 1.29 14.30 19.40 13’330 155 Togo 18.98 8.38 17.68 53072 Greece 1.29 24.23 25.16 22’530 156 Cameroon 19.13 20.24 42.84 1’27073 Kyrgyzstan 1.30 1.30 3.40 1’200 157 Tanzania 19.27 10.12 22.89 63074 Spain 1.31 31.97 31.33 29’180 158 Benin 19.37 12.75 26.91 79075 Turkey 1.32 12.03 17.38 10’950 159 Uganda 21.09 8.96 21.11 51076 Ukraine 1.33 4.38 10.92 3’960 160 Burkina Faso 25.38 14.17 31.25 67077 Algeria 1.33 5.87 13.51 5’290 161 Mozambique 26.62 13.09 24.70 59078 Montenegro 1.33 8.06 13.33 7’260 162 Micronesia 27.81 79.50 - 3’43079 Indonesia 1.34 4.00 9.54 3’580 163 Niger 43.45 14.84 32.31 41080 Lebanon 1.37 11.28 - 9’870 164 Central African Rep. 48.20 12.85 22.87 32081 Portugal 1.37 23.66 25.56 20’670 165 Malawi 54.19 12.19 38.63 27082 Thailand 1.38 6.18 14.55 5’370 166 Madagascar 56.62 20.76 59.81 44083 Tunisia 1.44 5.23 11.29 4’360 Argentina** - 3.40 - -84 Ecuador 1.51 6.94 12.16 5’510

113
Measuring the Information Society Report 2014
Table 4.2: Mobile-cellular sub-basket, 2013
Note: * Data correspond to the GNI per capita (Atlas method) in 2013 or latest available year adjusted with the international inflation rates. ** Country not ranked because data on GNI p.c. are not available for the last five years.
Source: ITU. GNI p.c. and PPP$ values are based on World Bank data.
Rank Economy
Mobile-cellular sub-basket GNI p.c., USD,
2013* Rank Economy
Mobile-cellular sub-basket GNI p.c., USD,
2013*as % of GNI p.c. USD PPP$
as % of GNI p.c. USD PPP$
1 Macao, China 0.11 5.68 7.68 64’691 85 Indonesia 2.30 6.86 16.38 3’5802 Hong Kong, China 0.18 5.70 7.32 38’420 86 Hungary 2.40 25.07 39.03 12’5343 Denmark 0.19 9.87 6.57 61’110 87 Peru 2.43 12.93 21.64 6’3904 Singapore 0.19 8.74 9.04 54’040 88 Equatorial Guinea 2.46 29.31 - 14’3205 Qatar 0.26 18.68 25.38 85’550 89 Romania 2.49 18.80 30.46 9’0606 United Arab Emirates 0.28 9.06 - 39’006 90 Viet Nam 2.50 3.61 8.81 1’7307 Switzerland 0.29 19.42 11.57 81’760 91 Armenia 2.60 8.22 17.49 3’7908 Norway 0.29 24.86 14.90 102’610 92 TFYR Macedonia 2.83 11.31 22.53 4’8009 Austria 0.34 13.62 11.84 48’590 93 Nigeria 2.83 6.51 10.81 2’760
10 Australia 0.35 18.95 12.75 65’520 94 Turkey 2.91 26.52 38.31 10’95011 Finland 0.36 14.02 10.55 47’110 95 Dominican Rep. 2.91 13.62 26.16 5’62012 Sri Lanka 0.36 0.95 2.61 3’170 96 Algeria 2.94 12.97 29.85 5’29013 Cyprus 0.36 8.06 8.69 26’654 97 Dominica 2.97 16.74 22.40 6’76014 Kuwait 0.39 15.07 23.24 45’889 98 Lebanon 3.00 24.71 - 9’87015 Sweden 0.42 20.54 14.70 59’130 99 Pakistan 3.17 3.65 12.79 1’38016 Oman 0.43 9.11 17.41 25,503 100 Serbia 3.17 15.16 26.29 5’73017 Luxembourg 0.44 26.85 20.25 72’528 101 Guyana 3.20 10.01 - 3’75018 Iran (I.R.) 0.46 2.23 4.79 5’780 102 Colombia 3.35 21.11 32.43 7’56019 Germany 0.47 18.03 16.50 46’100 103 South Africa 3.40 20.40 36.12 7’19020 Costa Rica 0.51 4.06 5.56 9’550 104 Ghana 3.51 5.15 10.82 1’76021 New Zealand 0.52 15.58 12.10 35’875 105 Grenada 3.54 21.98 28.70 7’46022 Iceland 0.60 22.09 18.28 43’930 106 Paraguay 3.64 12.24 22.19 4’04023 Russian Federation 0.64 7.34 12.79 13’860 107 Bosnia and Herzegovina 3.72 14.68 25.59 4’74024 Saudi Arabia 0.65 14.13 28.86 26’200 108 Philippines 3.72 10.15 22.24 3’27025 Brunei Darussalam 0.71 19.65 29.60 33’002 109 Ecuador 3.74 17.17 30.10 5’51026 Bahrain 0.73 12.04 20.52 19’756 110 Sudan 3.92 3.69 - 1’13027 Canada 0.73 31.97 25.46 52’200 111 St. Vincent and the Grenadines 4.07 22.33 29.61 6’58028 China 0.74 4.04 6.65 6’560 112 St. Lucia 4.21 24.89 30.78 7’09029 Lithuania 0.75 8.77 12.61 13’958 113 Cuba 4.30 21.53 - 6’01430 Mauritius 0.79 6.09 9.85 9’300 114 Nepal 4.37 2.66 8.37 73031 United States 0.80 35.62 35.62 53’670 115 Angola 4.66 19.47 21.96 5’01032 Malaysia 0.83 7.16 14.20 10’400 116 Timor-Leste 4.71 14.04 22.43 3’58033 Korea (Rep.) 0.86 18.58 22.23 25’920 117 Micronesia 4.77 13.63 - 3’43034 Belgium 0.91 34.17 29.04 45’210 118 Kenya 4.96 3.84 8.37 93035 Japan 0.92 35.50 30.87 46’140 119 Brazil 4.96 48.32 58.11 11’69036 Portugal 0.93 16.03 17.31 20’670 120 Moldova 4.97 10.18 22.24 2’46037 Poland 1.01 10.86 17.85 12’960 121 Morocco 5.18 13.09 26.33 3’03038 Latvia 1.01 11.90 15.56 14’201 122 Bolivia 5.38 11.43 25.46 2’55039 Bahamas 1.01 17.48 15.37 20’806 123 Kyrgyzstan 5.42 5.42 14.17 1’20040 Venezuela 1.01 10.60 13.37 12’550 124 Fiji 5.56 20.54 30.25 4’43041 Netherlands 1.05 41.51 35.01 47’440 125 Bulgaria 5.67 33.23 63.82 7’03042 Slovakia 1.11 16.07 21.14 17’372 126 El Salvador 5.78 17.93 34.14 3’72043 Trinidad & Tobago 1.14 15.02 18.85 15’760 127 Lao P.D.R. 5.86 7.13 17.84 1’46044 France 1.14 40.29 34.33 42’250 128 Marshall Islands 6.35 22.22 - 4’20045 Kazakhstan 1.15 10.91 18.48 11’380 129 Samoa 6.36 18.17 22.29 3’43046 Malta 1.20 19.85 23.19 19’927 130 Swaziland 6.59 16.92 36.31 3’08047 Thailand 1.20 5.36 12.61 5’370 131 Honduras 7.49 13.61 25.96 2’18048 Italy 1.23 35.19 31.67 34’400 132 Guatemala 7.75 21.58 41.86 3’34049 Maldives 1.23 5.74 7.45 5’600 133 Cambodia 7.92 6.27 16.16 95050 Israel 1.24 35.32 29.32 34’120 134 Belize 8.06 31.30 53.83 4’66051 Belarus 1.25 7.02 18.70 6’720 135 Albania 8.10 31.73 58.13 4’70052 Slovenia 1.25 24.11 26.89 23’058 136 Kiribati 8.30 18.12 - 2’62053 United Kingdom 1.31 42.62 34.89 39’110 137 Ethiopia 8.83 3.46 9.19 47054 Ireland 1.33 43.94 34.58 39’501 138 Vanuatu 9.92 25.88 20.64 3’13055 Bhutan 1.37 2.81 8.47 2’460 139 Afghanistan 10.07 5.87 16.51 70056 Mexico 1.40 11.58 15.77 9’940 140 S. Tomé & Principe 10.32 12.64 20.03 1’47057 Panama 1.41 12.59 21.42 10’700 141 Cape Verde 10.38 31.40 54.55 3’63058 Croatia 1.49 16.53 22.42 13’330 142 Rwanda 12.39 6.40 15.57 62059 Seychelles 1.50 15.71 22.23 12’530 143 Lesotho 12.50 16.15 37.53 1’55060 Mongolia 1.51 4.74 10.10 3’770 144 Solomon Islands 13.22 17.74 16.65 1’61061 Spain 1.56 37.82 37.06 29’180 145 Côte d'Ivoire 14.11 16.23 33.91 1’38062 Estonia 1.59 23.09 26.86 17’370 146 Zambia 14.31 17.64 34.52 1’48063 Tunisia 1.62 5.90 12.72 4’360 147 Haiti 14.46 9.76 18.83 81064 Botswana 1.64 10.57 - 7’730 148 Mauritania 15.97 14.10 - 1’06065 Czech Republic 1.66 25.04 32.99 18’060 149 Papua New Guinea 16.09 26.95 - 2’01066 Uruguay 1.67 21.10 23.22 15’180 150 Cameroon 16.70 17.67 37.40 1’27067 Barbados 1.71 21.70 17.50 15’231 151 Tanzania 17.85 9.37 21.20 63068 Azerbaijan 1.71 10.49 24.28 7’350 152 Nicaragua 18.54 27.50 67.07 1’78069 Antigua & Barbuda 1.78 19.12 23.26 12’910 153 Senegal 18.58 16.57 33.73 1’07070 Uzbekistan 1.82 2.89 - 1’900 154 Burkina Faso 20.90 11.67 25.74 67071 Suriname 1.86 14.39 24.38 9,260 155 Benin 20.91 13.77 29.06 79072 Bangladesh 1.88 1.41 4.03 900 156 Uganda 22.14 9.41 22.16 51073 Jordan 1.90 7.84 16.34 4’950 157 Mozambique 25.91 12.74 24.04 59074 Montenegro 1.92 11.62 19.22 7’260 158 Mali 26.54 14.82 32.61 67075 Chile 1.98 25.17 31.52 15’230 159 Zimbabwe 29.75 20.33 - 82076 St. Kitts and Nevis 2.04 22.87 28.19 13’460 160 Eritrea 31.84 13.00 - 49077 Georgia 2.05 6.10 12.67 3’570 161 Niger 34.37 11.74 25.56 41078 Egypt 2.05 5.40 18.18 3’160 162 Burundi 36.56 8.53 22.13 28079 Jamaica 2.08 9.06 12.70 5’220 163 Togo 38.47 16.99 35.84 53080 Namibia 2.13 10.36 17.94 5’840 164 Central African Rep. 51.63 13.77 24.50 32081 Ukraine 2.18 7.19 17.91 3’960 165 Madagascar 52.55 19.27 55.50 44082 Greece 2.18 40.97 42.55 22’530 166 Malawi 56.29 12.67 40.13 27083 India 2.23 2.91 9.74 1’570 Argentina** - 33.03 - -84 Gabon 2.25 19.95 27.54 10’650

Chapter 4. ICT prices and the role of competition
114
Mobile-cellular services are very affordable in most developed countries, corresponding to less than 2 per cent of GNI p.c. in the majority of them. The exceptions are Moldova (5.0 per cent of GNI p.c.), Bulgaria (5.7 per cent) and Albania (8.1 per cent), where mobile-cellular services are the least affordable in the developed world. This suggests that cost may be a barrier for further uptake of mobile-cellular services in these countries, and therefore requires regulatory and policy attention.
4.3 Broadband prices
Fixed broadbandFixed broadband continues to be a critical service for accessing high-speed, high-capacity and reliable Internet services. Despite the growth of mobile-broadband subscriptions, less than 3 per cent of global IP traffic corresponded to mobile networks by end 2013 according to CISCO estimates (CISCO, 2013). Until deployments of advanced mobile-broadband technologies13 become more widespread, fixed broadband remains the de facto option for accessing
high-volume Internet applications such as file sharing (less than 1 per cent of total file-sharing traffic was transmitted through mobile networks in 2013) and Internet video (2 per cent of total Internet video traffic was transmitted through mobile networks in 2013). Therefore, some of the potential benefits of broadband as a development enabler, such as for instance its use in education (see Featured Insight 10 in Broadband Commission, 2013a), depend on fixed-broadband uptake in the near future. In addition, CISCO estimates that 45 per cent of total mobile data traffic was offloaded onto fixed networks in 2013 (CISCO, 2014), highlighting the role that fixed broadband plays in supporting the growth in mobile-broadband networks.
In the period 2008-2013, the price of an entry-level fixed-broadband plan decreased by almost 70 per cent globally: from an average of PPP$ 157.7 in 2008 to PPP$ 49.2 in 2013 (Chart 4.3).14 In parallel with the reduction in prices, there was a notable increase in the advertised speed for fixed-broadband plans: 256 kbit/s was the most common entry-level speed in 2008, compared with 1 Mbit/s in 2013.
The decrease in fixed-broadband prices was remarkable in developing countries, where
Chart 4.3: Fixed-broadband prices in PPP$ (left) and most common entry-level fixed-broadband speed (right), world and by level of development, 2008-2013
Note: Simple averages in the case of the fixed-broadband prices; mode in the case of the entry-level fixed-broadband speeds. Based on 143 economies for which 2008-2013 data on fixed-broadband prices were available.
Source: ITU.
0
50
100
150
200
250
2008 2009 2010 2011 2012 2013
Developed
World
Developing
PP
P$
0
1
2
3
2008 2009 2010 2011 2012 2013
Developed
World
Developing
Mb
it/s
25
6 k
bit
/s
25
6 k
bit
/s2
56
kb
it/s
25
6 k
bit
/s
25
6 k
bit
/s2
56
kb
it/s
25
6 k
bit
/s2
56
kb
it/s
25
6 k
bit
/s
1 M
bit
/s
1 M
bit
/s
1 M
bit
/s
2 M
bit
/s
2 M
bit
/s
5 M
bit
/s
1 M
bit
/s
1 M
bit
/s1
Mb
it/s

115
Measuring the Information Society Report 2014
average prices dropped by 70 per cent in the five-year period, down to PPP$ 59.4 (or USD 34.1) in 2013. The fall in prices was particularly strong in the period 2008-2012, with the average price in developing countries declining by more than 20 per cent per year (-25 per cent CAGR in 2008-2012). In 2013, there was a slowdown, with the average entry-level fixed-broadband price in developing countries decreasing by only 4 per cent. Indeed, the countries with the most expensive fixed-broadband prices, such as Papua New Guinea, Rwanda and Vanuatu (all of them with entry-level fixed-broadband services costing more than USD 100) saw little improvement in prices in 2013. On the other hand, there was an upgrade of entry-level fixed-broadband speeds in developing countries in 2013, with 1 Mbit/s becoming the most common entry-level speed, as opposed to 256 kbit/s in 2012. This suggests operators in several developing countries focused their efforts on improving the speed rather than the price of fixed-broadband entry-level plans in 2013.
Entry-level fixed-broadband prices remained much more stable in developed countries, and registered only a slight decrease in the period 2008-2013 (-2 per cent CAGR), to an average of PPP$ 26.0 (or USD 25.5). The almost flat evolution of entry-level fixed-broadband prices in the developed world suggests that competition in the market is centred around higher-end users contracting higher speeds and/or fixed broadband bundled with other services. This is in line with the findings on bundle adoption from household surveys (European Commission, 2014) and data on fixed (wired)-broadband subscriptions by speed, which show that a significant share of fixed (wired)-broadband subscriptions in developed countries had advertised speeds equal to or greater than 10 Mbit/s (ITU, 2014).
Nevertheless, entry-level fixed-broadband prices in developed countries still remained significantly less expensive on average than in developing countries in 2013: less than half the price in PPP$, and 25 per cent cheaper in terms of USD. In addition, differences in the quality of
the connection persisted: the most common advertised speed for entry-level fixed-broadband plans was 5 Mbit/s in developed countries in 2013, as against 1 Mbit/s in developing countries. Therefore, despite paying more for an entry-level fixed-broadband plan, customers in developing countries are getting a connection five times slower on average than that enjoyed by customers in developed countries.
In line with the reduction of fixed-broadband prices in PPP$ and USD, entry-level fixed-broadband plans are becoming more and more affordable: they fell from an average price of 94.5 per cent of GNI p.c. in 2008 to 18.3 of GNI p.c. in 2013 (Chart 4.4).
The biggest increase in affordability occurred in developing countries between 2008 and 2011, where the average price (relative to GNI p.c.) for an entry-level fixed-broadband plan was divided by four. In 2012 and 2013, prices in developing countries remained more stable, suggesting that operators’ efforts were focused on improving the quality of the service. Despite the progress made in improving the affordability of fixed-broadband services, the average price for an entry-level fixed-broadband plan still represented
Chart 4.4: Fixed-broadband prices, as a percentage of GNI p.c., world and by level of development, 2008-2013
Note: Simple averages. Based on 143 economies for which 2008-2013 data on fixed-broadband prices were available.
Source: ITU.
0
20
40
60
80
100
120
140
2008 2009 2010 2011 2012 2013
Developed
World
Developing
As
a %
of
GN
I p
.c.
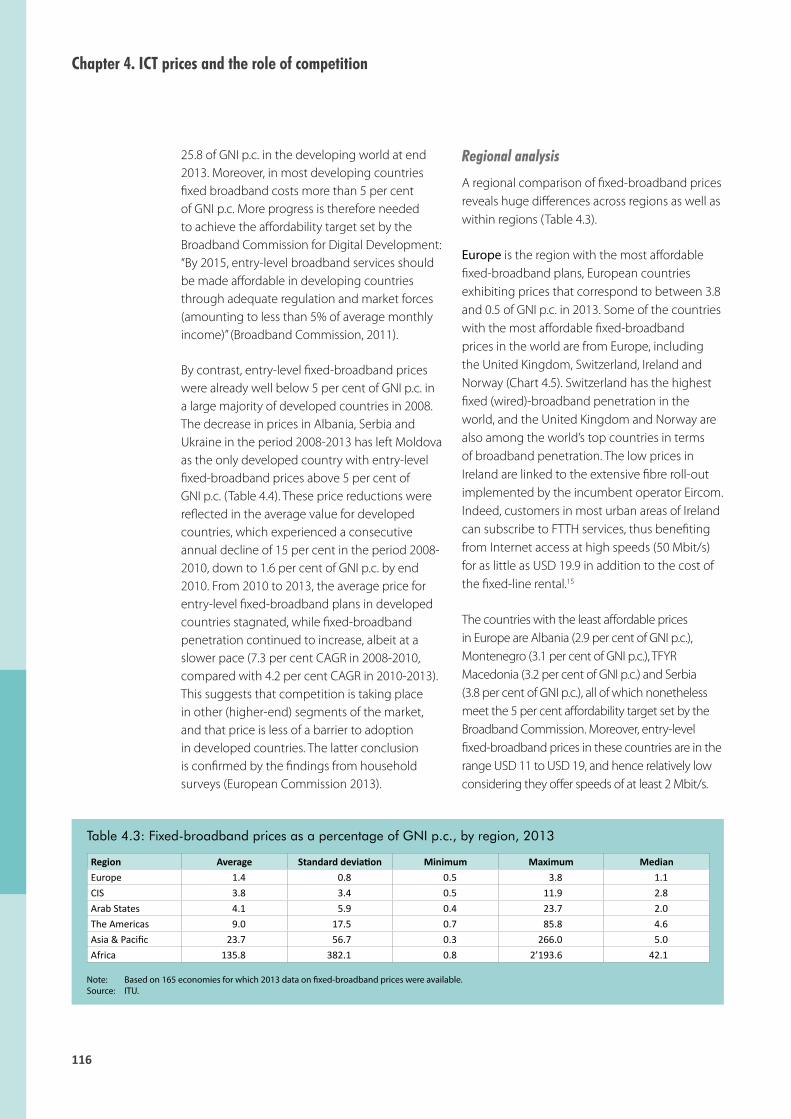
Chapter 4. ICT prices and the role of competition
116
25.8 of GNI p.c. in the developing world at end 2013. Moreover, in most developing countries fixed broadband costs more than 5 per cent of GNI p.c. More progress is therefore needed to achieve the affordability target set by the Broadband Commission for Digital Development: “By 2015, entry-level broadband services should be made affordable in developing countries through adequate regulation and market forces (amounting to less than 5% of average monthly income)” (Broadband Commission, 2011).
By contrast, entry-level fixed-broadband prices were already well below 5 per cent of GNI p.c. in a large majority of developed countries in 2008. The decrease in prices in Albania, Serbia and Ukraine in the period 2008-2013 has left Moldova as the only developed country with entry-level fixed-broadband prices above 5 per cent of GNI p.c. (Table 4.4). These price reductions were reflected in the average value for developed countries, which experienced a consecutive annual decline of 15 per cent in the period 2008-2010, down to 1.6 per cent of GNI p.c. by end 2010. From 2010 to 2013, the average price for entry-level fixed-broadband plans in developed countries stagnated, while fixed-broadband penetration continued to increase, albeit at a slower pace (7.3 per cent CAGR in 2008-2010, compared with 4.2 per cent CAGR in 2010-2013). This suggests that competition is taking place in other (higher-end) segments of the market, and that price is less of a barrier to adoption in developed countries. The latter conclusion is confirmed by the findings from household surveys (European Commission 2013).
Table 4.3: Fixed-broadband prices as a percentage of GNI p.c., by region, 2013
Note: Based on 165 economies for which 2013 data on fixed-broadband prices were available.Source: ITU.
Region Average Standard deviation Minimum Maximum MedianEurope 1.4 0.8 0.5 3.8 1.1CIS 3.8 3.4 0.5 11.9 2.8Arab States 4.1 5.9 0.4 23.7 2.0The Americas 9.0 17.5 0.7 85.8 4.6Asia & Pacific 23.7 56.7 0.3 266.0 5.0Africa 135.8 382.1 0.8 2’193.6 42.1
Regional analysis
A regional comparison of fixed-broadband prices reveals huge differences across regions as well as within regions (Table 4.3).
Europe is the region with the most affordable fixed-broadband plans, European countries exhibiting prices that correspond to between 3.8 and 0.5 of GNI p.c. in 2013. Some of the countries with the most affordable fixed-broadband prices in the world are from Europe, including the United Kingdom, Switzerland, Ireland and Norway (Chart 4.5). Switzerland has the highest fixed (wired)-broadband penetration in the world, and the United Kingdom and Norway are also among the world’s top countries in terms of broadband penetration. The low prices in Ireland are linked to the extensive fibre roll-out implemented by the incumbent operator Eircom. Indeed, customers in most urban areas of Ireland can subscribe to FTTH services, thus benefiting from Internet access at high speeds (50 Mbit/s) for as little as USD 19.9 in addition to the cost of the fixed-line rental.15
The countries with the least affordable prices in Europe are Albania (2.9 per cent of GNI p.c.), Montenegro (3.1 per cent of GNI p.c.), TFYR Macedonia (3.2 per cent of GNI p.c.) and Serbia (3.8 per cent of GNI p.c.), all of which nonetheless meet the 5 per cent affordability target set by the Broadband Commission. Moreover, entry-level fixed-broadband prices in these countries are in the range USD 11 to USD 19, and hence relatively low considering they offer speeds of at least 2 Mbit/s.
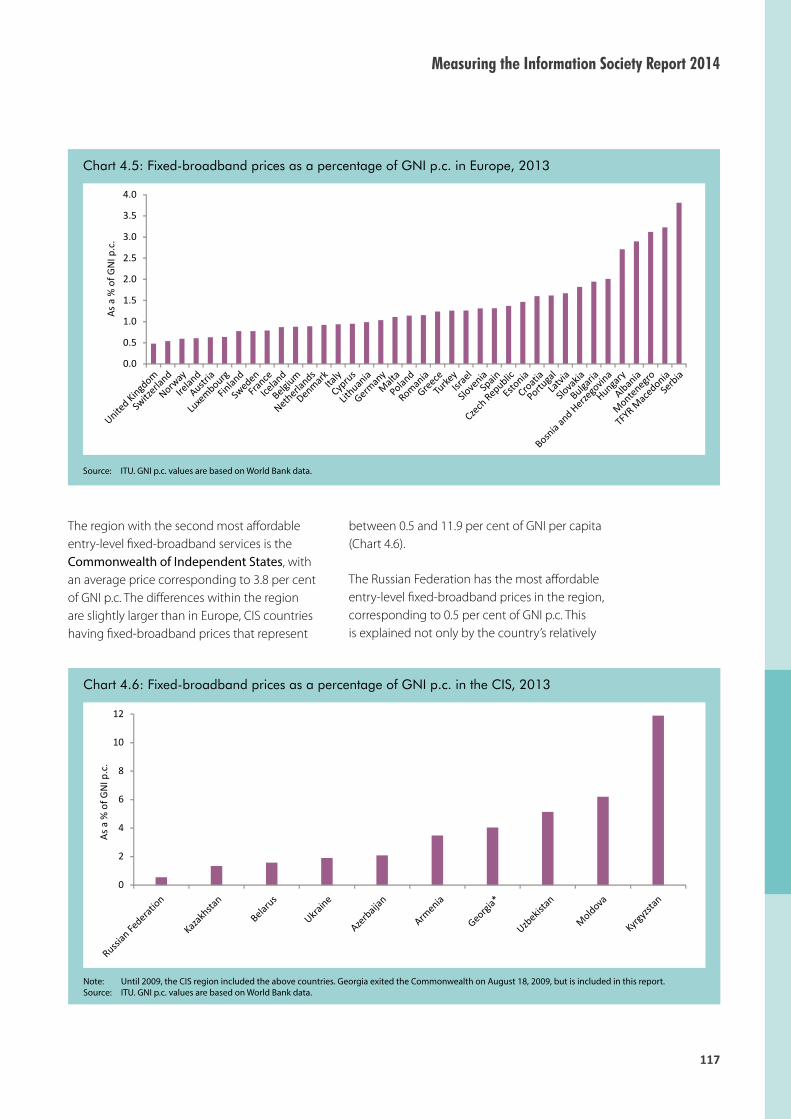
117
Measuring the Information Society Report 2014
Chart 4.5: Fixed-broadband prices as a percentage of GNI p.c. in Europe, 2013
Source: ITU. GNI p.c. values are based on World Bank data.
0.0
0.5
1.0
1.5
2.0
2.5
3.0
3.5
4.0
As
a %
of
GN
I p
.c.
Unite
d Kin
gdom
Switz
erland
Norw
ay
Irela
nd
Austria
Luxe
mbourg
Finla
nd
Sweden
Fran
ce
Icela
nd
Belgiu
m
Neth
erlands
Denm
arkIta
ly
Cypru
s
Lith
uania
Germ
any
Mal
ta
Poland
Roman
ia
Gre
ece
Turk
ey
Isra
el
Slove
nia
Spai
n
Czech
Republic
Estonia
Croat
ia
Portuga
l
Latv
ia
Slova
kia
Bulgar
ia
Bosnia
and H
erzego
vina
Hunga
ry
Alban
ia
Monte
negro
TFYR M
acedonia
Serb
ia
The region with the second most affordable entry-level fixed-broadband services is the Commonwealth of Independent States, with an average price corresponding to 3.8 per cent of GNI p.c. The differences within the region are slightly larger than in Europe, CIS countries having fixed-broadband prices that represent
Chart 4.6: Fixed-broadband prices as a percentage of GNI p.c. in the CIS, 2013
Note: Until 2009, the CIS region included the above countries. Georgia exited the Commonwealth on August 18, 2009, but is included in this report. Source: ITU. GNI p.c. values are based on World Bank data.
0
2
4
6
8
10
12
As
a %
of
GN
I p
.c.
Russia
n Federa
tion
Kazak
hstan
Belaru
s
Ukr
aine
Azerb
aija
n
Armenia
Georg
ia*
Uzb
ekist
an
Mold
ova
Kyrg
yzst
an
between 0.5 and 11.9 per cent of GNI per capita (Chart 4.6).
The Russian Federation has the most affordable entry-level fixed-broadband prices in the region, corresponding to 0.5 per cent of GNI p.c. This is explained not only by the country’s relatively

Chapter 4. ICT prices and the role of competition
118
high gross national income (the highest in the CIS), but also by the low prices: USD 6.3 for a fixed-broadband plan at 5 Mbit/s, the lowest price in the region. Several large operators compete in the Russian fixed-broadband market, taking advantage of the economies of scale built up in different regional and local markets. As a result, a number of operators have achieved a significant volume of fixed-broadband subscriptions, including the incumbent Rostelecom, Mobile TeleSystems OJSC (MTS) and ER-Telecom. The national fixed-broadband market in the Russian Federation is thus one of the most de-concentrated in the world.
All CIS countries included in the analysis have fixed-broadband prices below the 5 per cent affordability threshold, except for Uzbekistan (5.1 per cent of GNI p.c.), Moldova (6.2 per cent) and Kyrgyzstan (11.9 per cent). In the case of Uzbekistan, prices are relatively cheap (USD 8.1), but GNI per capita is very low. It is to be expected that the target will be met there by end 2015 if fixed-broadband prices are maintained and economic growth continues. However, policy and regulatory action will be necessary to step up a gear in broadband adoption, since fixed (wired)-broadband penetration in Uzbekistan stood at only 1.1 per cent at end 2013. Limited international connectivity is one of the important bottlenecks to be addressed in the Uzbek broadband market, where there was only 20 000 Mbit/s of international Internet bandwidth to share among more than 300 000 fixed (wired)-broadband subscriptions in 2013. The scarcity of international Internet bandwidth is further confirmed by the fact that the entry-level plan in Uzbekistan is capped at 1.2 GB of usage per month, whereas in most CIS countries fixed-broadband plans allow unlimited usage. Future growth in broadband adoption would require an increase in international connectivity.
Moldova has the most expensive entry-level fixed-broadband prices in the region, together with Azerbaijan (both USD 12.7), but Moldova has a much lower GNI p.c. and therefore services are less affordable. The relatively
high prices in Moldova are explained by the characteristics of the fixed-broadband plan offered by Moldtelecom, which is based on FTTx technology, cheaper than the ADSL offers in the country, and has an advertised speed of 20 Mbit/s. This is by far the fastest speed for an entry-level broadband plan in the CIS.
Kyrgyzstan stands out as the country with the least affordable fixed-broadband prices in the CIS, corresponding to 11.9 per cent of GNI p.c. This suggests that affordability may be a determining factor for the low fixed-broadband penetration in the country (1.0 per cent by end 2013). Being a landlocked country like Uzbekistan, Kyrgyzstan also faces a lack of international connectivity, with 5 000 Mbit/s to be shared by more than 53 000 fixed (wired)-broadband subscriptions. In addition, the fixed-broadband market in the country has a limited number of facilities-based ISPs and is relatively concentrated, dominated by Kyrgyz Telecom. These factors suggest that regulatory measures to promote competition and ease the international connectivity bottleneck could help drive prices down to the levels achieved in other CIS countries, such as the Russian Federation and Ukraine, where entry-level fixed-broadband plans cost less than USD 7 (compared with almost USD 12 in Kyrgyzstan).
The average price for an entry-level fixed-broadband plan in the Arab States corresponds to 4.1 per cent of GNI per capita, slightly higher than in the CIS. Differences within the region are wider, however, countries in the region having prices that represent between 23.7 and 2.0 of GNI p.c.
The high-income Gulf Cooperation Council (GCC) countries have the most affordable fixed-broadband prices, along with Tunisia (Chart 4.7). Tunisie Telecom offers regular ongoing promotions for ADSL services with some of the most advantageous prices in the region: USD 6.1, by far the cheapest price offered by an incumbent operator in the Arab States for an Internet service at speeds above 512 kbit/s. The relatively low fixed (wired)-broadband

119
Measuring the Information Society Report 2014
penetration in Tunisia (4.8 per cent by end 2013) suggests that efforts need to be focused on extending the reach of the ADSL network in order to make available such affordable fixed-broadband prices to more areas in the country, and on improving ICT skills and promoting relevant local content in Arabic.16
Kuwait stands out as the country with the most affordable fixed-broadband prices in the region (0.4 per cent of GNI p.c.), which indeed places it second in the world ranking. The low prices offered by Kuwait’s leading fixed ISP Qualitynet17 are in sharp contrast with the very low fixed (wired)-broadband penetration in the country: 1.4 per cent by end 2013. This may be explained by the limited coverage of Qualitynet, which suggests the need for more investment in broadband network equipment and network roll-out to enable the take-off of fixed-broadband services in Kuwait.
Mauritania is the Arab country where entry-level fixed-broadband prices are the least affordable. Indeed, an entry-level fixed broadband-plan corresponded to 23.7 per cent of GNI p.c. in 2013, thus pointing to affordability as a major barrier
Chart 4.7: Fixed-broadband prices as a percentage of GNI p.c. in the Arab States, 2013
Source: ITU. GNI p.c. values are based on World Bank data.
for fixed-broadband uptake in the country. This may be an explanatory factor for the low fixed (wired)-broadband penetration in Mauritania: 0.2 per cent by end 2013, the second lowest in the region after Sudan’s. Policy and regulatory actions to address the challenge of unaffordable fixed-broadband services would need to target both the supply and the demand sides (Box 4.1).
The average price for an entry-level fixed-broadband plan in the Americas region corresponds to 0.6 per cent of GNI per capita, more than twice as much as in the Arab States and CIS, but lower than in Asia and the Pacific. Differences within the region are significant, countries lying in the range 0.7 to 85.8 per cent of GNI p.c. The median price corresponds to 4.6 per cent of GNI p.c., which means that half of the countries in the region have prices below that value.
The United States is the country with the most affordable entry-level fixed-broadband services in the region (0.7 of GNI p.c.), and the second in terms of fixed (wired)-broadband penetration, after Canada, with 29 and 33 fixed (wired)-broadband subscriptions per 100 inhabitants,
0
1
2
3
4
5
6
7
8
9
10
As
a %
of
GN
I p
.c.
Kuwai
t
Qat
ar
Om
an
Bahra
in
Unite
d Ara
b Em
irate
s
Tunis
ia
Saudi A
rabia
Leban
on
Egypt
Algeria
Jord
an
Moro
cco
Sudan
Mau
ritan
ia
23.7

Chapter 4. ICT prices and the role of competition
120
Box 4.1: Challenges for fixed-broadband adoption in Mauritania
Unaffordable fixed-broadband services in Mauritania are the result of factors on both the supply and the demand side.
On the supply side, there are only two facilities-based fixed-broadband operators in the market, with the incumbent Mauritel largely dominating it.18 Moreover, international Internet bandwidth is very limited in the country: 620 Mbit/s in 2013, more than 40 times less than any other Arab country included in the comparison of fixed-broadband prices. This means that if one-third of fixed (wired)-broadband subscriptions in Mauritania try to access the international Internet at the same time, they will have on average a speed below 256 kbit/s, i.e. narrowband speed. Taking into account that fixed (wired)-broadband penetration is below 0.2 per cent in the country, international connectivity could be a major bottleneck for future broadband growth. Regulatory interventions to promote competition and
to improve international connectivity could greatly contribute to stimulating the fixed-broadband market.
On the demand side, GNI per capita in Mauritania is the lowest of all Arab countries included in the comparison of fixed-broadband prices. In order to reach the 5 per cent affordability target, an entry-level fixed-broadband plan would have to cost USD 4.4 in Mauritania. Such low fixed-broadband prices are only available in Bangladesh, Sri Lanka and Viet Nam, the countries with the cheapest entry-level fixed-broadband plans in USD in the world. In order to advance towards such a challenging target, public policies to support demand for fixed-broadband services could lead to wider adoption and thus give a positive signal to operators. These could include, inter alia, special subsidized plans for low-income households or the promotion of public Internet access centres (based on either commercial or public schemes).
Source: ITU.
Chart 4.8: Fixed-broadband prices as a percentage of GNI p.c. in the Americas, 2013
Source: ITU. GNI p.c. values are based on World Bank data.
0
5
10
15
20
As
a %
of
GN
I p
.c.
85.866.1
Unite
d Sta
tes
Trin
idad
& Tobag
o
Venezuela
Canad
a
Uru
guay
Panam
a
Brazil
Mexi
co
Baham
as
Costa
Rica
Chile
Colom
bia
St. K
itts an
d Nevi
s
Barbad
osPeru
Ecuad
or
Dom
inic
an R
ep.
Gre
nada
El Sal
vador
Antigua
& B
arbuda
Surin
ame
Jam
aica
St. L
ucia
St. V
ince
nt and th
e Gre
nadin
es
Parag
uay
Dom
inic
a
Guya
na
Hondura
s
Guat
emal
a
Bolivia
Belize
Nic
arag
uaHai
ti
Cuba
respectively. The affordability of fixed-broadband prices in North America was to be expected, given the high GNI per capita levels and the advanced level of ICT development in the United States and Canada.
Countries in the Americas region with relatively affordable fixed-broadband plans include
Trinidad and Tobago, Venezuela and Uruguay (Chart 4.8). Trinidad and Tobago is the Caribbean country that has experienced the highest growth in fixed (wired)-broadband penetration in the period 2010-2013 (7 per cent CAGR), pointing to the importance of affordable entry-level plans for promoting fixed-broadband uptake. In Venezuela, the government-owned incumbent,

121
Measuring the Information Society Report 2014
CANTV, offers affordable fixed-broadband services, including prepaid plans, starting at USD 10.9 for unlimited monthly usage, the cheapest prices in USD in the Americas together with those in Panama (USD 10.7). However, the country still has plenty of room for further broadband adoption, since fixed-broadband penetration stood at 7.3 per cent by end 2013. Uruguay had entry-level fixed-broadband plans almost as affordable as Venezuela’s (corresponding to 1.1 and 1.0 per cent of GNI p.c., respectively). Uruguay being a much smaller country than Venezuela in terms of size and population, the low prices had a much greater impact on its fixed-broadband penetration, which doubled in the last three years, climbing to 21 per cent by end 2013, the highest in South America. Taking into account the policy actions being implemented in the framework of the “Agenda digital Uruguay 2011-2015” – which include specific entry-level fixed-broadband plans offered by the state-owned telecom operator ANTEL (ITU, 2013a) – Uruguay could aspire to reaching the fixed (wired)-broadband penetration levels of developed countries (27 per cent on average by end 2013).
Of the 16 countries in the Americas with fixed-broadband prices above the 5 per cent affordability threshold, Antigua and Barbuda, Belize, Cuba, Haiti and Suriname stand out for having high entry-level prices (costing more than USD 40). Fixed-broadband services in these countries cost more than in the United States, despite the difference in income. This suggests that in all these countries there is plenty of room on the supply side to offer lower prices. Regulatory and policy action could contribute to the process by proposing innovative solutions, such as public-private partnerships to expand the wired broadband infrastructure. This may be particularly necessary in countries like Haiti, where the 2010 earthquake damaged part of the already limited fixed wired infrastructure. In addition, lack of international connectivity would be an issue for future broadband adoption in Belize and Cuba. In the case of Cuba, ADSL subscriptions are still priced as premium services with similar tariffs as leased lines. As a result,
dial-up (narrowband) Internet remains the de facto technology for Internet access by residential customers in the island.19
Asia and the Pacific is a region exhibiting striking contrasts in fixed-broadband prices, with the average price corresponding to 23.7 per cent of GNI p.c. and prices ranging from 0.3 per cent in Macao (China) to over 100 per cent in Kiribati, Solomon Islands and Papua New Guinea.
It is home to the economy with the most affordable entry-level fixed-broadband plans, Macao (China), where a fixed-broadband service costs less than 0.4 per cent of GNI p.c. (Chart 4.9). Other high-income economies in the region, such as Singapore and Japan – with fixed-broadband prices corresponding to 0.4 and 0.6 per cent of GNI p.c., respectively – also feature among the global top ten. Moreover, entry-level plans in Singapore and Japan offer outstanding speeds: 25 Mbit/s and 12 Mbit/s, respectively. This is also the case in Hong Kong (China) (0.7 per cent of GNI p.c. for a plan at 8 Mbit/s) and the Republic of Korea (1.4 per cent of GNI p.c. for a plan at 50 Mbit/s). These examples show that high-speed broadband at affordable prices is possible if there is strong policy leadership and the engagement from the private sector.
Asia and the Pacific is also home to the countries with the lowest entry-level fixed-broadband prices in USD: Viet Nam (USD 2.9), Sri Lanka (USD 4.3), Bangladesh (USD 4.4) and India (USD 4.8). Although they are not at the top when prices are measured in relative terms on account of their level of GNI p.c., the entry-level fixed-broadband prices achieved in these countries are outstandingly low, and there is little margin for price reduction. These prices are available in the main urban areas, and therefore part of the challenge may be making these offers available to all inhabitants in the country, particularly in Bangladesh, India and Sri Lanka where fixed (wired)-broadband penetration was below 2 per cent in 2013. Sustained initiatives to promote ICT skills in these countries could also contribute to promoting fixed-broadband uptake.20

Chapter 4. ICT prices and the role of competition
122
Chart 4.9: Fixed-broadband prices as a percentage of GNI p.c. in Asia and the Pacific, 2013
Source: ITU. GNI p.c. values are based on World Bank data.
There are 13 countries in the Asia and the Pacific region where entry-level fixed-broadband plans cost more than 10 per cent of GNI p.c. These include some large countries, such as Pakistan and the Philippines, and several small island developing states (SIDS) in the Pacific. A stronger policy impetus would be necessary for these countries to reach the affordability target of 5 per cent of GNI p.c. set by the Broadband Commission for 2015. Because of their geographic situation, one of the main challenges facing these countries is international Internet bandwidth. Indeed, the latest data on international connectivity show that this may remain an issue in Kiribati (45 Mbit/s), Marshall Islands (45 Mbit/s), Micronesia (45 Mbit/s), Samoa (135 Mbit/s), Solomon Islands (216 Mbit/s), Timor-Leste (178 Mbit/s) and Vanuatu (60 Mbit/s). In several of these countries, it would not be possible to offer the entry-level fixed-broadband plan available in the Republic of Korea (advertised speed of 50 Mbit/s) to even one customer. Since this is a problem shared by many SIDS in the Pacific, a common approach might be an efficient solution to help overcome it, e.g. by concentrating international traffic in a regional Internet exchange point and sharing the
cost of building a high-capacity international link from there.
Africa is by far the region with the least affordable fixed-broadband prices, with the average price representing more than 100 per cent of GNI per capita. In seven African countries (20 per cent of those included in the price benchmark), fixed-broadband plans cost more than 100 per cent of GNI p.c. (Chart 4.10). This is in line with the low fixed (wired)-broadband penetration in the region (0.4 per cent on average by end 2013).
The unaffordability of fixed-broadband prices in Africa is closely linked to the small size of the region’s economies and therefore low GNI levels in the region. Half of the African countries included in the price benchmark have a GNI p.c. below USD 1 000, which means that fixed-broadband prices would need to cost less than USD 4.2 to meet the affordability target set by the Broadband Commission for 2015. Worldwide, only one country (Viet Nam) had such low fixed-broadband prices in 2013, suggesting that meeting the target may not be possible given the GNI levels.
As
a %
of
GN
I p
.c.
Mac
ao, C
hina
0
5
10
15
2038.6
41.6
110.5
202.1
266.0
Singa
pore
Japan
Hong
Kong, Chin
a
Austra
lia
Iran (I
.R.)
Korea
(Rep.)
Sri L
anka
Brunei D
aruss
alam
Viet N
am
New
Zeal
and
Mal
aysia
Mongo
lia
Mal
dives
China
India
Bhutan
Thaila
ndFi
ji
Bangl
adesh
Indonesi
a
Philippin
es
Nepal
Pakist
an
Mic
ronesi
a
Lao P
.D.R
.
Mar
shal
l Islan
ds
Cambodia
Sam
oa
Timor-
Lest
e
Afghan
ista
n
Vanuat
u
Kiribat
i
Solo
mon Is
lands
Papua
New
Guin
ea

123
Measuring the Information Society Report 2014
Chart 4.10: Fixed-broadband prices as a percentage of GNI p.c. in Africa, 2013
Source: ITU. GNI p.c. values are based on World Bank data.
However, a comparison with other regions shows that it is feasible to improve the affordability of fixed-broadband prices in Africa significantly even if the Broadband Commission target is not met. For example, entry-level fixed-broadband prices cost less than USD 20 in 65 countries worldwide (39 per cent of the total included in the price benchmark), and most of these countries are in the developing world. In Africa, only Mauritius (USD 6.5), Cape Verde (USD 10.7), Uganda (USD 13.7), Seychelles (USD 16.7), South Africa (USD 17.1) and Tanzania (USD 18.7) have prices below USD 20. If entry-level fixed-broadband prices at USD 20 were offered in the remaining African countries, the average price would be reduced to an equivalent of 25.8 per cent of GNI p.c., and there would be no countries in the region where fixed broadband would represent more than 100 per cent of GNI p.c.
As several international submarine cables have become operational in Africa, along both the East coast (e.g. TEAMS in 2009, EASSy in 2010)21 and the West coast (e.g. WACS and ACE in 2012),22 the bottleneck in the broadband chain may have moved a step onwards in Africa. Regulatory action to open the international gateways to
competition and to facilitate backhaul (e.g. by setting a reference offer for the leased lines of the incumbent that provide connectivity to the landing station) could lower barriers to entry in the market, and stimulate competition in broadband services. This would contribute to opening up fixed-broadband markets to competition in Africa, and alter the status quo in several African countries, where the market is concentrated in a single operator. With the exception of micro states and small islands, fixed-broadband markets have been opened to a much larger degree of competition in other regions, to the benefit of customers.
Entry-level fixed-broadband prices are below the 5 per cent affordability threshold in five African countries: Mauritius (0.8 per cent of GNI p.c.), Seychelles (1.6 per cent), South Africa (2.9 per cent), Gabon (3.4 per cent) and Cape Verde (3.5 per cent). Mauritius and Seychelles are the African countries with the highest fixed (wired)-broadband penetration, both having almost reached 13 per cent. These results are explained by the countries’ relatively strong economies and therefore high GNI levels, coupled with their low fixed-broadband prices.
As
a %
of
GN
I p
.c.
Mau
ritiu
s0
10
20
30
40
50
60
70
80
90
100102.2
159.4
176.2
220.5
241.2 2'193.6
642.5
Seyc
helles
South
Afr
ica
Gab
on
Cape V
erde
Botsw
ana
Nam
ibia
Angola
Nig
eria
Leso
tho
Equat
orial G
uinea
Swaz
iland
Ghana
Côte d
'Ivoire
Uga
nda
Tanza
nia
Senega
l
S. Tom
é & P
rinci
pe
Zim
babw
e
Kenya
Moza
mbiq
ue
Ethio
pia
Camero
on
Zam
bia
Benin
Burkin
a Fa
soM
ali
Togo
Mad
agas
car
Nig
er
Burundi
Mal
awi
Rwan
da
Central
Afr
ican
Rep.

Chapter 4. ICT prices and the role of competition
124
Table 4.4: Fixed-broadband sub-basket, 2013
Note: * Data correspond to the GNI per capita (Atlas method) in 2013 or latest available year adjusted with the international inflation rates. ** Country not ranked because data on GNI p.c. are not available for the last five years.
Source: ITU. GNI p.c. and PPP$ values are based on World Bank data.
Rank Economy
Fixed-broadband sub-basketSpeed
in Mbit/s
Cap per month in
GB
GNI p.c., USD,
2013* Rank Economy
Fixed-broadband sub-basketSpeed
in Mbit/s
Cap per month in
GB
GNI p.c., USD,
2013*as % of GNI p.c. USD PPP$
as % of GNI p.c. USD PPP$
1 Macao, China 0.32 17.27 23.37 4 Unlimited 64’691 85 Cape Verde 3.54 10.72 18.62 2 3.4 3’6302 Kuwait 0.37 14.11 21.76 1 Unlimited 45’889 86 China 3.54 19.37 31.92 1 Unlimited 6’5603 Singapore 0.44 19.90 20.58 25 Unlimited 54’040 87 India 3.66 4.79 16.01 2 1.0 1’5704 United Kingdom 0.48 15.63 12.80 16 10.0 39’110 88 Serbia 3.81 18.19 31.56 5 Unlimited 5’7305 Switzerland 0.54 36.68 21.86 5 Unlimited 81’760 89 Georgia 4.04 12.02 24.96 5 Unlimited 3’5706 Russian Federation 0.54 6.28 10.95 5 Unlimited 13’860 90 Peru 4.14 22.05 36.91 1 Unlimited 6’3907 Japan 0.57 21.73 18.89 12 900.0 46’140 91 Bhutan 4.15 8.52 25.67 2 4.0 2’4608 Norway 0.60 50.89 30.51 2 Unlimited 102’610 92 Ecuador 4.39 20.16 35.33 2 Unlimited 5’5109 Ireland 0.61 19.92 15.67 50 30.0 39’501 93 Algeria 4.45 19.60 45.11 0.51 Unlimited 5’290
10 Austria 0.63 25.43 22.10 8 Unlimited 48’590 94 Dominican Rep. 4.54 21.28 40.86 1 Unlimited 5’62011 Luxembourg 0.64 38.50 29.04 8 2.0 72’528 95 Jordan 4.58 18.89 39.36 1 80.0 4’95012 Hong Kong, China 0.68 21.66 27.85 8 Unlimited 38’420 96 Morocco 4.66 11.78 23.70 4 Unlimited 3’03013 United States 0.73 32.65 32.65 1 Unlimited 53’670 97 Grenada 4.73 29.39 38.38 2 Unlimited 7’46014 Qatar 0.77 54.95 74.67 1 Unlimited 85’550 98 Thailand 5.02 22.46 52.85 13 Unlimited 5’37015 Finland 0.77 30.41 22.88 10 Unlimited 47’110 99 El Salvador 5.10 15.81 30.10 0.5 Unlimited 3’72016 Sweden 0.78 38.23 27.36 10 Unlimited 59’130 100 Antigua & Barbuda 5.11 54.94 66.85 1 Unlimited 12’91017 France 0.79 27.88 23.76 8 Unlimited 42’250 101 Uzbekistan 5.14 8.14 - 0.26 1.2 1’90018 Mauritius 0.84 6.51 10.53 0.26 2.0 9’300 102 Fiji 5.15 19.01 28.00 10 5.0 4’43019 Iceland 0.87 31.84 26.35 12 1.0 43’930 103 Suriname 5.38 41.48 70.28 6.14 9’26020 Belgium 0.88 33.13 28.15 30 100.0 45’210 104 Jamaica 5.88 25.57 35.84 1 Unlimited 5’22021 Netherlands 0.89 35.19 29.68 8 Unlimited 47’440 105 Bangladesh 5.89 4.42 12.59 0.25 2.0 90022 Denmark 0.92 47.01 31.27 20 Unlimited 61’110 106 Botswana 6.05 38.99 - 0.51 Unlimited 7’73023 Trinidad & Tobago 0.93 12.28 15.41 0.25 Unlimited 15’760 107 Sudan 6.06 5.71 - 0.51 2.0 1’13024 Italy 0.94 26.94 24.25 7 Unlimited 34’400 108 St. Lucia 6.13 36.20 44.77 2 Unlimited 7’09025 Cyprus 0.95 21.12 22.78 2 Unlimited 26’654 109 St. Vincent and the G. 6.14 33.65 44.61 1 6’58026 Australia 0.97 53.10 35.71 Unlimited 65’520 110 Moldova 6.20 12.71 27.76 20 Unlimited 2’46027 Lithuania 0.99 11.50 16.54 50 Unlimited 13’958 111 Paraguay 6.29 21.19 38.42 0.75 Unlimited 4’04028 Germany 1.04 39.77 36.40 16 Unlimited 46’100 112 Dominica 6.73 37.91 50.71 2 Unlimited 6’76029 Venezuela 1.04 10.91 13.77 1 Unlimited 12’550 113 Indonesia 6.87 20.50 48.92 0.38 3.0 3’58030 Canada 1.05 45.59 36.32 5 20.0 52’200 114 Guyana 7.79 24.34 - 0.25 Unlimited 3’75031 Malta 1.11 18.40 21.49 4 25.0 19’927 115 Honduras 8.63 15.68 28.40 0.25 Unlimited 2’18032 Uruguay 1.11 14.06 15.47 5.0 15’180 116 Philippines 8.64 23.54 51.59 3 Unlimited 3’27033 Poland 1.14 12.34 20.28 0.5 Unlimited 12’960 117 Guatemala 9.83 27.36 53.09 0.5 Unlimited 3’34034 Romania 1.15 8.71 14.09 50 Unlimited 9’060 118 Nepal 10.43 6.35 20.01 0.5 7.0 73035 Panama 1.20 10.69 18.19 1 Unlimited 10’700 119 Namibia 10.62 51.68 89.53 0.38 Unlimited 5’84036 Oman 1.22 26.01 49.69 2 Unlimited 25’503 120 Pakistan 10.70 12.30 43.12 1 Unlimited 1’38037 Iran (I.R.) 1.24 5.97 12.84 0.256 2.0 5’780 121 Micronesia 11.55 33.00 - 0.25 3’43038 Greece 1.24 23.32 24.21 4 Unlimited 22’530 122 Bolivia 11.78 25.04 55.76 0.42 Unlimited 2’55039 Turkey 1.26 11.50 16.62 1 1.0 10’950 123 Kyrgyzstan 11.89 11.89 31.07 0.5 Unlimited 1’20040 Israel 1.26 35.95 29.85 5 Unlimited 34’120 124 Angola 12.16 50.76 57.24 0.26 Unlimited 5’01041 Korea (Rep.) 1.27 27.40 32.78 50 Unlimited 25’920 125 Belize 12.88 50.00 86.01 0.26 Unlimited 4’66042 Slovenia 1.31 25.23 28.14 1 Unlimited 23’058 126 Lao P.D.R. 13.67 16.64 41.65 0.5 1’46043 Spain 1.31 31.97 31.33 1 5.0 29’180 127 Nicaragua 13.96 20.70 47.98 0.5 Unlimited 1’78044 Kazakhstan 1.34 12.69 21.49 1 3.0 11’380 128 Marshall Islands 14.27 49.95 - 0.25 4’20045 Czech Republic 1.37 20.64 27.19 2 Unlimited 18’060 129 Cambodia 14.97 11.85 30.55 2 Unlimited 95046 Brazil 1.42 13.82 16.62 1 Unlimited 11’690 130 Samoa 14.99 42.84 52.55 2 3.0 3’43047 Estonia 1.47 21.24 24.72 5 Unlimited 17’370 131 Timor-Leste 16.42 49.00 78.25 0.5 3.0 3’58048 Belarus 1.58 8.83 23.54 1 Unlimited 6’720 132 Nigeria 17.64 40.58 67.39 1 5.0 2’76049 Mexico 1.60 13.23 18.02 1 25.0 9’940 133 Lesotho 20.05 25.89 60.18 0.51 4.0 1’55050 Seychelles 1.60 16.69 23.62 1.02 1.5 12’530 134 Equatorial Guinea 20.35 242.90 - 0.26 Unlimited 14’32051 Croatia 1.60 17.78 24.11 4 1.0 13’330 135 Swaziland 22.19 56.96 122.26 0.26 6.0 3’08052 Bahrain 1.62 26.60 45.35 1 2.0 19’756 136 Ghana 22.74 33.36 70.12 4 15.0 1’76053 Portugal 1.62 27.87 30.10 12 30.0 20’670 137 Mauritania 23.65 20.89 - 0.26 Unlimited 1’06054 Sri Lanka 1.64 4.34 11.95 2 2.5 3’170 138 Côte d'Ivoire 31.68 36.43 76.11 0.26 Unlimited 1’38055 United Arab Emirates 1.67 54.19 - 0.51 Unlimited 39’006 139 Uganda 32.18 13.68 32.20 0.512 1.0 51056 Latvia 1.67 19.78 25.86 5 Unlimited 14’201 140 Tanzania 35.70 18.74 42.41 0.51 Unlimited 63057 Tunisia 1.68 6.09 13.15 2 Unlimited 4’360 141 Afghanistan 38.61 22.52 63.30 0.25 Unlimited 70058 Bahamas 1.73 29.99 26.37 1 Unlimited 20’806 142 Senegal 40.86 36.43 74.17 1 Unlimited 1’07059 Saudi Arabia 1.82 39.73 81.16 2 Unlimited 26’200 143 Vanuatu 41.60 108.50 86.52 0.25 Unlimited 3’13060 Slovakia 1.82 26.38 34.70 5 2.0 17’372 144 S. Tomé & Principe 43.35 53.11 83.85 0.51 8.0 1’47061 Brunei Darussalam 1.89 51.95 78.28 1 Unlimited 33’002 145 Zimbabwe 43.90 30.00 - 0.26 10.0 82062 Ukraine 1.90 6.26 15.60 5 Unlimited 3’960 146 Kenya 44.80 34.72 75.58 0.26 Unlimited 93063 Bulgaria 1.95 11.40 21.90 15 Unlimited 7’030 147 Mozambique 50.67 24.91 47.02 0.51 6.0 59064 Costa Rica 2.00 15.90 21.77 0.5 Unlimited 9’550 148 Ethiopia 55.14 21.59 57.40 0.51 2.0 47065 Bosnia and Herzegovina 2.01 7.94 13.84 2 2.0 4’740 149 Cameroon 57.19 60.52 128.08 0.26 Unlimited 1’27066 Viet Nam 2.03 2.93 7.15 2.5 1.0 1’730 150 Zambia 60.11 74.13 145.03 0.26 Unlimited 1’48067 New Zealand 2.06 61.51 47.78 30.0 35’875 151 Haiti 66.07 44.60 86.07 0.25 Unlimited 81068 Azerbaijan 2.08 12.75 29.51 1 Unlimited 7’350 152 Benin 76.87 50.60 106.80 0.51 Unlimited 79069 Lebanon 2.13 17.51 - 1 4.0 9’870 153 Burkina Faso 79.76 44.53 98.22 0.26 Unlimited 67070 Malaysia 2.42 20.95 41.52 0.51 Unlimited 10’400 154 Mali 85.56 47.77 105.12 2 Unlimited 67071 Egypt 2.49 6.55 22.04 0.26 2.0 3’160 155 Cuba 85.79 430.00 - 0.25 Unlimited 6’01472 Hungary 2.71 28.34 44.14 10 Unlimited 12’534 156 Togo 102.18 45.13 95.20 0.26 Unlimited 53073 Mongolia 2.72 8.53 18.16 1 Unlimited 3’770 157 Kiribati 110.54 241.35 - 0.25 Unlimited 2’62074 Maldives 2.78 12.95 16.83 2 5.0 5’600 158 Madagascar 159.42 58.45 168.38 8 Unlimited 44075 South Africa 2.85 17.09 30.26 1 5.0 7’190 159 Niger 176.25 60.22 131.07 0.26 Unlimited 41076 Albania 2.90 11.35 20.79 2 4.0 4’700 160 Solomon Islands 202.13 271.19 254.52 0.26 6.0 1’61077 Chile 3.02 38.34 48.02 4 Unlimited 15’230 161 Burundi 220.47 51.44 133.45 0.26 Unlimited 28078 Montenegro 3.12 18.89 31.25 1 1.0 7’260 162 Malawi 241.25 54.28 171.99 0.26 Unlimited 27079 Colombia 3.14 19.80 30.41 1 Unlimited 7’560 163 Papua New Guinea 265.99 445.53 - 4 Unlimited 2’01080 TFYR Macedonia 3.23 12.91 25.72 4 30.0 4’800 164 Rwanda 642.45 331.93 807.40 0.256 Unlimited 62081 St. Kitts and Nevis 3.27 36.67 45.20 2 13’460 165 Central African Rep. 2193.65 584.97 1040.74 0.256 Unlimited 32082 Barbados 3.35 42.50 34.28 6 Unlimited 15’231 Argentina** - 40.30 - 3 Unlimited83 Gabon 3.42 30.36 41.92 0.51 Unlimited 10’65084 Armenia 3.48 10.99 23.37 1.0 3’790

125
Measuring the Information Society Report 2014
Cape Verde and South Africa are the third and fourth African countries with the highest fixed (wired)-broadband penetration, at 4 and 3 per cent, respectively. Cape Verde was in the list of least developed countries (LDCs) until 2007 and, despite having a lower GNI p.c. than other African countries, stands out for its inexpensive entry-level fixed-broadband prices (USD 10.7), three times lower than in Gabon (USD 30.4). This suggests that Gabon could progress in terms of fixed (wired)-broadband adoption (0.5 per cent penetration by end 2013) if cheaper prices were available. Other countries with higher incomes than Cape Verde that could meet the 5 per cent affordability target by 2015 would be Angola, Botswana, Equatorial Guinea and Namibia. In order to reach that goal, strong policy and regulatory attention to broadband markets would be required.
Mobile broadbandMobile broadband is the most dynamic telecommunication market, the only one displaying sustained double-digit growth rates since 2008 (Chapter 1). According to ITU
estimates, around 50 per cent of the global population are covered by a 3G network, and this figure will grow as more and more mobile-broadband networks are deployed, until eventually 3G coverage approaches mobile-cellular coverage (93 per cent). As 3G networks become ubiquitous and therefore accessible to most of the population, affordability will be one of the most decisive factors for actual uptake of mobile broadband.
The dynamism of the mobile-broadband market is also reflected in prices. Unlike the fixed-broadband market, where price structures are fairly homogenous across countries and stable in time, mobile-broadband prices vary and operators are continuously launching innovative offers to try to attract new customers. On top of the main types of mobile-broadband plans for which ITU collects data on prices (Figure 4.1), operators are adding plans for specific devices, such as tablets, MiFi dongles, BlackBerry, etc. Some operators, like for instance Rogers in Canada and Verizon in the United States, are allowing customers to pool the data consumed by different devices in a single subscription.23 In addition, handset-based mobile-broadband
Figure 4.1: Mobile-broadband services by type of device/plan
Source: ITU.
Mobile broadband
Handset-based
Computer-based
Prepaid
Postpaid
Prepaid
Postpaid

Chapter 4. ICT prices and the role of competition
126
plans are often bundled with mobile voice and SMS. This makes it difficult to isolate the prices of mobile-broadband services, particularly for postpaid plans where it is sometimes cheaper to buy a package including Internet, voice and SMS than to contract only Internet.
Fixed-broadband and mobile-broadband Internet prices follow different pricing structures, and therefore the analysis of mobile-broadband prices cannot be based on the same parameters used for fixed broadband. In the case of fixed Internet access, the progress from narrowband (dial-up) to broadband brought not only a change in speed but also in pricing. Dial-up was priced on the basis of usage (usually billed per minute/hour), whereas fixed-broadband Internet usually follows a flat-rate arrangement, whereby the customer pays a monthly fee and has unlimited access to the Internet at a given speed, with neither time nor data volume constraints. This is the common scheme in a vast majority of countries, where fixed-broadband plans are unlimited and the differentiating factor is the speed of the connection (Table 4.4).
Mobile-broadband plans are seldom based on flat-rate schemes, and almost all of them include data volume caps, e.g. USD 10 for 50 MB per month. Several operators also offer advantageous plans based on a combination of time and data volume limitations, e.g. USD 5 for one day of use with a maximum of 50 MB. This reflects the stricter bandwidth constraints of mobile-broadband networks, and particularly the spectrum limitations in the access network. The situation could change in the future if new spectrum is allocated for mobile broadband (for instance, part of the digital dividend) and mobile-broadband networks are upgraded to advanced technologies (such as LTE-Advanced and WirelessMAN-Advanced) that allow more efficient use of spectrum.
Currently, most mobile-broadband plans are priced on the basis of the data allowance (i.e. the data volume in MB included in the plan) and not the speed. Many operators do not even advertise
the speed of the mobile-broadband service, but confine themselves to a generic mention of the technology deployed (which provides only an indication of the speed, since the definition of ‘3.5G’ or ‘4G’ may vary across operators). This may also change in the future, as some operators are starting to offer premium plans (at a higher cost) for mobile-broadband services based on high-speed networks. These plans are often labelled as ‘4G’ and may include some indication of the theoretical speeds that can be achieved. This is the case, for instance, of the operator Tigo, which offers premium ‘4G’ plans in Bolivia, Colombia, Guatemala and Paraguay.24 In any case, mobile-broadband speeds depend on several external factors, such as distance from the base station, location (e.g. inside a building or outside), movement (stationary or in motion) and the number of people concurrently accessing the network in the same area. These factors are difficult to predetermine for service providers, which makes mobile-broadband speeds more difficult to predict than fixed-broadband speeds (see for instance Ofcom, 2011).
Chart 4.11 shows that mobile-broadband plans are becoming more and more available, particularly in developing countries, where around 20 per cent more countries were offering mobile-broadband plans in 2013 than in 2012. The figures also highlight the difference in the types of plans offered in developed and developing countries: prepaid plans are slightly more available than postpaid plans in developing countries, whereas the opposite is true in developed countries. This tallies with the situation in respect of voice and SMS mobile-cellular services, for which prepaid plans are most popular in the developing world. Globally, the mobile-broadband service available in the most countries is prepaid handset-based, which was offered in 153 countries in 2013. There are far fewer countries (121 in 2013) where all four modalities of mobile-broadband services are offered.
In view of the dynamics of the mobile-broadband market, this section will focus on

127
Measuring the Information Society Report 2014
Chart 4.11: Availability of mobile-broadband services by type of service, by level of development, 2013 and 2012
Note: A mobile-broadband service is counted as available if it was advertised on the website of the dominant operator or prices were provided to ITU through the ICT Price Basket Questionnaire.25
Source: ITU.
analysis of the 2013 prices, without comparing them with the 2012 figures. A comparison of mobile-broadband prices across time would reflect the changes in pricing structures (changes in data allowances, bundled voice minutes and SMS, time limitations, premium speeds, etc.) rather than actual differences in prices for the same mobile-broadband service.
The global average price for a computer-based mobile-broadband service with 1 GB monthly data allowance was PPP$ 36.6 (or USD 24.4) for prepaid plans and PPP$ 30.0 (or USD 19.2) for postpaid plans in 2013 (Chart 4.12). The price difference between postpaid and prepaid plans is also found in respect of regular mobile-cellular services, because operators will usually offer lower prices to customers who subscribe to a monthly service, since they generate a more predictable revenue flow. This is particularly true in developed countries, where postpaid computer-based mobile-broadband plans cost 37 per cent less than the corresponding prepaid plans in PPP terms. Differences between prepaid and postpaid computer-based mobile-broadband plans are less marked in developing countries, suggesting that operators differentiate less between postpaid and prepaid offers for the time being.
The average cost for a handset-based mobile-broadband service with 500 MB monthly data allowance was PPP$ 25.3 (or USD 16.9) for prepaid plans and PPP$ 25.7 (or USD 17.6) for postpaid plans in 2013. Prices were cheaper compared with computer-based plans because the monthly data allowance was half as large. Nevertheless, the reduction in price was not proportional to the reduction in the data allowance, confirming that the price per GB is lower for larger data allowances, the equivalent of a volume discount. Unlike in the case of computer-based mobile-broadband services, the prices for postpaid and prepaid handset-based mobile-broadband plans were similar, which means that operators are in most cases offering the same rates to postpaid and prepaid smartphone customers.
A feature of postpaid handset-based mobile-broadband plans is that they are in some cases bundled with voice minutes and SMS. This is particularly so in developed countries, where in one in four countries the cheapest postpaid handset-based Internet plans included free minutes and SMS in 2013. It is much less
0
20
40
60
80
100
120
140
Nu
mb
er
of
cou
ntr
ies
2013
handset-based
(500MB)
Prepaid
handset-based
(500MB)
Postpaid
computer-based
(1GB)
Prepaid
computer-based
(1GB)
developing developed160
2012
Postpaid
2013 2012 2013 2012 2013 2012
Chart 4.12: Mobile-broadband prices, in PPP$, world and by level of development, 2013
Note: Simple averages. Based on 119 economies for which data on mobile-broadband prices were available for the four types of plans.
Source: ITU.
25.7
25.3
30.0
36.6
18.4
19.0
17.7
28.1
29.0
28.2
35.6
40.4
0 20 40
Postpaid handset-
based (500MB)
Prepaid handset-
based (500MB)
Postpaid computer-
based (1GB)
Prepaid computer-
based (1GB)
PPP$
Developing
Developed
World

Chapter 4. ICT prices and the role of competition
128
common in developing countries, where fewer than one in ten countries have bundled offers as the cheapest option for postpaid handset-based mobile broadband. The existence of different levels of bundling in mobile-broadband plans makes it difficult to compare prices on a like-for-like basis.
Mobile-broadband prices in PPP$ are more expensive in developing countries than in developed countries, for all types of plans. In terms of USD, mobile-broadband services cost almost the same on average in developed and developing countries (Chart 4.13). This suggests that operators in developing countries still have ample room to streamline their mobile-broadband services and offer cheaper prices. Indeed, operating costs should be lower in developing countries and, if enough competition exists in the market, these lower costs should be passed on to retail prices. This is the case, for instance, for fixed-telephone and mobile-cellular services.26 The fact that this is not fully happening for fixed- and mobile-broadband services may be explained by the early stage of development of these services in the developing world. Operators are in the process of rolling out new infrastructure and most markets have not yet grown enough to allow operators to benefit from economies of scale and scope.
These differences in mobile-broadband prices between developed and developing countries are even more apparent when looking at the affordability of the service. Indeed, handset-based mobile-broadband plans with a monthly data allowance of 500 MB are about eight times more affordable in developed countries than in developing countries, on average (Chart 4.14). Computer-based services with a monthly allowance of 1 GB are about six times more affordable in developed countries, on average.
The regional analysis confirms that there are significant differences in the affordability of each service, and that there is a gap between Africa and the other regions (Chart 4.15). The average price for a computer-based mobile-broadband service with 1 GB monthly data allowance corresponded to more than 20 per cent of GNI p.c. in Africa, and around 15 per cent of GNI p.c. in the case of handset-based plans with 500 MB. Average prices represented less than 10 per cent of GNI p.c. in all other regions.
Mobile-broadband penetration in Africa is higher than might be expected given the high prices
Chart 4.13: Mobile-broadband prices, in USD, world and by level of development, 2013
Note: Simple averages. Based on 119 economies for which data on mobile-broadband prices were available for the four types of plans.
Source: ITU.
17.6
16.9
19.2
24.4
17.8
18.3
16.3
24.9
17.5
16.3
20.6
24.1
0 10 20 30
Postpaid handset-
based (500MB)
Prepaid handset-
based (500MB)
Postpaid computer-
based (1GB)
Prepaid computer-
based (1GB)
USD
Developing
Developed
World
Chart 4.14: Mobile-broadband prices as a percentage of GNI p.c., world and by level of development, 2013
Note: Simple averages. Based on 119 economies for which data on mobile-broadband prices were available for the four types of plans.
Source: ITU.
Developing
Developed
World
6.4
5.8
8.3
8.5
1.0
1.1
1.2
1.9
8.9
8.0
11.5
11.5
0 2 4 6 8 10 12
Postpaid handset-
based (500MB)
Prepaid handset-
based (500MB)
Postpaid computer-
based (1GB)
Prepaid computer-
based (1GB)
% GNI p.c.

129
Measuring the Information Society Report 2014
in the region, particularly when compared to the lower prices in other regions. Indeed, it is estimated that mobile-broadband penetration will reach 19 per cent in Africa by end 2014, as compared with 23 per cent in Asia and the Pacific and 25 per cent in the Arab States by the same date. This observation may be explained by different usage patterns in Africa, with mobile-broadband subscribers consuming much less than 500 MB of Internet data per month, supported by the fact that several African operators offer discount plans for occasional use. For instance, MTN Cameroon offers low-price mobile-broadband services priced per connection or per 15 minutes; Orange Côte d’Ivoire also offers discount plans priced per hour of use;27 and almost all African operators offer low-volume bundles with a validity of one or two days. However, such low-volume short-validity plans allow only limited use of the Internet, and therefore restrict the benefits that can be obtained from broadband. For instance, Internet video cannot be consumed on the basis of such limited data allowances, and even Internet radio would need to be limited.
This suggests that, if mobile broadband is to bridge the broadband gap between Africa and the other regions, mobile-broadband services will have to become more affordable in Africa so that most applications enabled by a broadband connection are within the means of a majority of the population.
Europe stands out as having the most affordable mobile-broadband plans, corresponding to less than 2 per cent of GNI p.c. for all services. At the other end of the scale, Asia and the Pacific is, together with Africa, the region were average mobile-broadband prices correspond to significantly more than 5 per cent of GNI p.c. for all services except prepaid handset-based (500 MB).
In the Arab States and the CIS, handset-based mobile-broadband prices are on average below the 5 per cent threshold, and prices are just slightly above that value in the case of computer-
Chart 4.15: Mobile-broadband prices as a percentage of GNI p.c., by region, 2013
Note: Simple averages. Based on 119 economies for which data on mobile-broadband prices were available for the four types of plans.
Source: ITU.
0.9
1.2
1.1
2.0
3.5
3.8
4.4
5.2
4.7
4.8
5.9
5.1
5.3
5.4
5.7
7.0
7.5
5.0
9.3
9.0
16.5
15.3
23.3
22.2
0 5 10 15 20 25
Postpaid handset-
based (500MB)
Prepaid handset-
based (500MB)
Postpaid computer-
based (1GB)
Prepaid computer-
based (1GB)
% GNI p.c.
Africa
Asia & Pacific
The Americas
Arab States
CIS
Europe
based mobile-broadband services. The Americas region also has average prices corresponding to slightly more than 5 per cent of GNI p.c., prepaid computer-based plans being the only ones clearly above that threshold. Country data for the Americas reveal that there are a number of countries which have high prepaid computer-based prices because minimum packages include a monthly data allowance much larger than 1 GB (Table 4.8). This is the case of Chile (USD 73 for 14 GB), Antigua and Barbuda (USD 63 for 10 GB), Haiti (USD 23 for 10 GB), El Salvador (USD 28 for 8 GB) and Argentina (USD 46 for 7 GB). Such high monthly data allowances for prepaid mobile-broadband dongles suggest that these services target high-end customers, rather than the average user. Postpaid mobile-broadband dongles include much lower monthly data allowances in the Americas (Table 3.7), suggesting that postpaid rather than prepaid is the base offer for regular computer-based mobile-broadband customers.
Average prices for computer-based mobile-broadband plans with a monthly data allowance of 1 GB suggest that mobile broadband could be a cheaper alternative to fixed broadband in many

Chapter 4. ICT prices and the role of competition
130
Chart 4.16: Comparison of postpaid fixed-broadband and postpaid computer-based mobile-broadband prices, in USD, by region, 2013
Note: Percentages are calculated on the basis of the total number of countries with data available in each region: 27 countries in Africa, 14 countries in the Arab States, 29 economies in Asia and the Pacific, 10 countries in the CIS, 41 countries in Europe and 27 countries in the Americas.
Source: ITU.
Pe
rce
nta
ge
of
cou
ntr
ies
Africa
Cheaper mobile broadband
Cheaper fixed broadband
Almost no difference
0
10
20
30
40
50
60
70
<5 5-10 10-20 20-30 >30
Difference in prices (USD)P
erc
en
tag
e o
f co
un
trie
s
Arab States
Cheaper mobile broadband
Cheaper fixed broadband
Almost no difference
0
10
20
30
40
50
60
70
<5 5-10 10-20 20-30 >30
Pe
rce
nta
ge
of
cou
ntr
ies
Asia and the Pacific
Cheaper mobile broadband
Cheaper fixed broadband
Almost no difference
0
10
20
30
40
50
60
70
<5 5-10 10-20 20-30 >30
Difference in prices (USD)
Pe
rce
nta
ge
of
cou
ntr
ies
CIS
Cheaper mobile broadband
Cheaper fixed broadband
Almost no difference
0
10
20
30
40
50
60
70
<5 5-10 10-20 20-30 >30
Difference in prices (USD)
Pe
rce
nta
ge
of
cou
ntr
ies
Europe
Cheaper mobile broadband
Cheaper fixed broadband
Almost no difference
0
10
20
30
40
50
60
70
<5 5-10 10-20 20-30 >30
Difference in prices (USD)
Pe
rce
nta
ge
of
cou
ntr
ies
The Americas
Cheaper mobile broadband
Cheaper fixed broadband
Almost no difference
0
10
20
30
40
50
60
70
<5 5-10 10-20 20-30 >30
Difference in prices (USD)

131
Measuring the Information Society Report 2014
countries. There are qualitative differences that make mobile-broadband and fixed-broadband plans not strictly comparable (see Box 3.4 in ITU, 2013a). Nevertheless, mobile broadband may be the only alternative in countries where fixed wired infrastructure is underdeveloped or fixed-broadband services are unaffordable for a majority of the population.
Chart 4.16 shows a comparison of prices for fixed-broadband and postpaid computer-based mobile-broadband plans with a 1 GB monthly allowance. This latter mobile-broadband plan is chosen because it is the best match for fixed-broadband services: both are postpaid, are computer-based and include a monthly data allowance of at least 1 GB. Although the minimum data allowance is the same, in practice most fixed-broadband plans allow unlimited data use (Table 4.4), whereas most computer-based mobile-broadband plans with a minimum monthly data allowance of 1 GB really do have a cap of 1 GB (Tables 4.7 and 4.8).
In almost half of the African countries included in the price benchmark, mobile-broadband prices were more than USD 10 cheaper per month than fixed-broadband prices. Taking into account the GNI p.c. levels in Africa, such price savings could make the difference between a service being affordable or not. This is particularly so in Namibia, where an entry-level fixed-broadband plan corresponds to 10.6 per cent of GNI p.c., as against 3.2 of GNI p.c. for a computer-based mobile-broadband plan. In other African countries, mobile broadband may be a more affordable alternative to fixed broadband – for instance, in the Democratic Republic of the Congo and Zambia, where mobile broadband is more than USD 50 cheaper per month – but mobile-broadband prices still correspond to more than 5 per cent of GNI p.c. This reinforces the idea that mobile operators and policy-makers in Africa share the common challenge of achieving lower mobile-broadband prices in order to unlock the real potential of broadband in the region. More affordable prices could be a strong driver for uptake and
therefore benefit both consumers and service providers.
In the Arab States and the CIS, there are almost as many countries where mobile broadband is cheaper than fixed broadband as vice versa. There are some exceptions, such as Tajikistan, where fixed-broadband prices are prohibitive (more than USD 100) and mobile-broadband prices are more in line with those of the region (USD 14.0 as against USD 9.3 on average in the region for 1 GB postpaid computer-based plans).
In many countries in Asia and the Pacific, there is little difference between fixed-broadband and mobile-broadband prices. Of those countries where mobile broadband is significantly cheaper, Indonesia and Thailand are the only ones in which the 5 per cent affordability target for broadband services is achieved, thanks to affordable mobile-broadband plans. In the Solomon Islands, Timor-Leste and Vanuatu, despite mobile broadband being more than USD 20 cheaper per month than entry-level fixed broadband, mobile-broadband prices are still high. This suggests that some of the bottlenecks in the fixed-broadband markets of SIDS in the Pacific, such as the lack of international Internet bandwidth, also constrain mobile-broadband services.
There are four countries in the Americas that attain the 5 per cent affordability target by virtue of cheaper mobile-broadband prices: Belize, El Salvador, Paraguay and Suriname. In these countries, mobile broadband is an affordable alternative to entry-level fixed-broadband plans. However, the mobile-broadband market is still in its early stages, with penetration rates below 5 per cent in Belize, El Salvador and Paraguay, and at 15 per cent in Suriname. Therefore, the extent to which Internet users turn to mobile broadband as an affordable alternative to fixed broadband will only be seen in the coming years.
Mobile broadband is cheaper than entry-level fixed–broadband plans in 80 per cent of countries in Europe, and in one out of three countries in

Chapter 4. ICT prices and the role of competition
132
Table 4.5: Mobile-broadband prices, postpaid handset-based 500 MB, 2013
Rank Economy
Mobile-broadband, postpaid handset-based (500 MB)
GNI p.c., USD,
2013*Monthly data
allowance (MB)as % of GNI p.c. USD PPP$
1 Austria 0.13 5.31 4.62 48'590 1'024 2 Finland 0.13 5.18 3.9 47'110 500 3 Iceland 0.13 4.83 4 43'930 500 4 Liechtenstein1 0.17 20.5 - 142'885 1'000 5 Denmark 0.17 8.9 5.92 61'110 1'024 6 Australia 0.18 9.65 6.49 65'520 500 7 Norway 0.2 16.85 10.1 102'610 1'024 8 Luxembourg 0.22 13.28 10.01 72'528 500 9 Qatar 0.23 16.48 22.4 85'550 1'000
10 Hong Kong, China 0.32 10.31 13.26 38'420 1'000 11 Lithuania 0.33 3.84 5.53 13'958 1'024 12 Poland 0.35 3.8 6.24 12'960 1'024 13 Russian Federation 0.41 4.68 8.16 13'860 500 14 Macao, China 0.41 22.28 30.15 64'691 500 15 Korea (Rep.) 0.47 10.05 12.02 25'920 500 16 Netherlands 0.5 19.92 16.8 47'440 500 17 Turkey 0.52 4.73 6.83 10'950 500 18 Belgium2 0.53 19.92 16.93 45'210 500 19 Sri Lanka 0.57 1.51 4.16 3'170 500 20 Spain3 0.59 14.46 14.17 29'180 500 21 Estonia 0.6 8.62 10.03 17'370 1'536 22 Sweden4 0.62 30.55 21.87 59'130 512 23 Slovenia 0.62 11.95 13.33 23'058 1'024 24 Switzerland 0.63 42.94 25.59 81'760 500 25 Slovakia 0.64 9.28 12.21 17'372 700 26 Belarus 0.66 3.72 9.9 6'720 500 27 Latvia 0.68 8.05 10.52 14'201 600 28 Kazakhstan 0.69 6.51 11.02 11'380 1'024 29 Greece 0.71 13.28 13.79 22'530 750 30 Singapore5 0.71 31.89 32.97 54'040 2'048 31 Kuwait 0.74 28.21 43.52 45'889 3'072 32 France4 0.75 26.42 22.51 42'250 3'000 33 United Kingdom 0.77 25.01 20.48 39'110 3'072 34 Croatia 0.77 8.59 11.65 13'330 1'024 35 Bahrain 0.81 13.3 22.67 19'756 500 36 Brunei Darussalam 0.81 22.38 33.72 33'002 2'048 37 United Arab Emirates 0.83 26.96 - 39'006 1'000 38 Azerbaijan 0.83 5.1 11.8 7'350 600 39 Tunisia 0.85 3.08 6.64 4'360 500 40 Portugal 0.85 14.61 15.78 20'670 500 41 Saudi Arabia 0.85 18.67 38.13 26'200 500 42 Hungary 0.86 8.94 13.92 12'534 500 43 Cyprus 0.9 19.92 21.47 26'654 1'024 44 Uruguay6 0.96 12.16 13.38 15'180 1'024 45 Germany7 0.97 37.12 33.98 46'100 500 46 Romania 1.06 7.97 12.88 9'060 500 47 New Zealand8 1.07 31.98 24.84 35'875 500 48 Montenegro 1.12 6.76 11.18 7'260 750 49 Panama 1.12 9.99 17 10'700 1'024 50 Canada 1.14 49.38 39.33 52'200 540 51 Japan 1.18 45.19 39.28 46'140 500 52 Czech Republic 1.18 17.83 23.49 18'060 1'024 53 Albania 1.21 4.73 8.67 4'700 500 54 Oman9 1.22 26.01 49.69 25'503 500 55 Bhutan 1.24 2.54 7.67 2'460 500 56 Suriname 1.28 9.85 16.69 9'260 500 57 Peru 1.39 7.4 12.39 6'390 500 58 Malaysia 1.39 12.06 23.91 10'400 500 59 Ireland8 1.41 46.47 36.57 39'501 500 60 Barbados 1.42 18 14.52 15'231 2'048 61 Bahamas 1.44 25 21.98 20'806 1'024 62 Mauritius 1.47 11.37 18.38 9'300 1'000 63 China 1.48 8.07 13.3 6'560 500 64 Armenia 1.55 4.88 10.39 3'790 1'500 65 Moldova 1.55 3.18 6.94 2'460 500 66 Italy4 1.57 45.14 40.63 34'400 1'124 67 TFYR Macedonia 1.61 6.44 12.84 4'800 1'024 68 Costa Rica10 1.63 13.01 17.81 9'550 500 69 Serbia 1.7 8.1 14.06 5'730 3'064 70 United States11 1.7 76.21 76.21 53'670 1'024 71 Indonesia 1.76 5.26 12.54 3'580 1'024 72 Mexico 1.88 15.58 21.22 9'940 500 73 Ukraine12 1.9 6.26 15.6 3'960 600 74 Venezuela 1.9 19.84 25.04 12'550 800 75 Bulgaria 1.97 11.53 22.14 7'030 500 76 Seychelles 1.99 20.73 29.34 12'530 500 77 Bosnia and Herzegovina 2.01 7.94 13.84 4'740 500 78 Georgia 2.02 6.01 12.48 3'570 500 79 Jordan 2.05 8.45 17.61 4'950 500
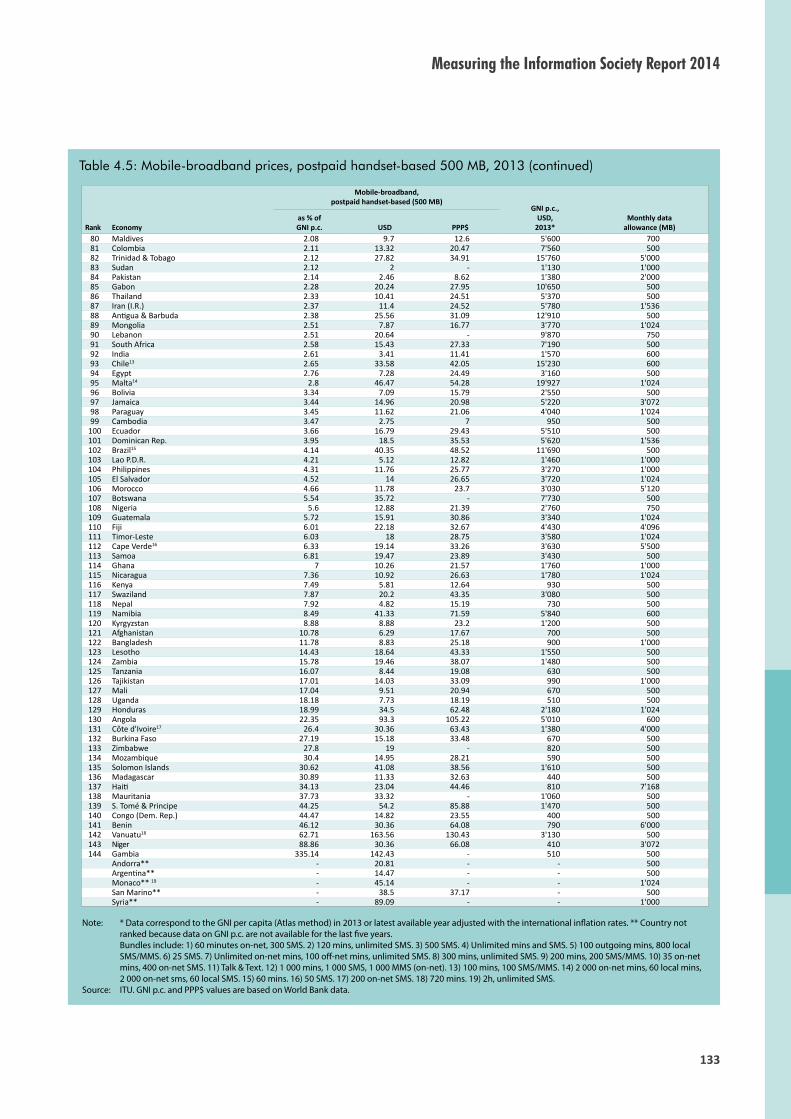
133
Measuring the Information Society Report 2014
Table 4.5: Mobile-broadband prices, postpaid handset-based 500 MB, 2013 (continued)
Rank Economy
Mobile-broadband, postpaid handset-based (500 MB)
GNI p.c., USD,
2013*Monthly data
allowance (MB)as % of GNI p.c. USD PPP$
80 Maldives 2.08 9.7 12.6 5'600 700 81 Colombia 2.11 13.32 20.47 7'560 500 82 Trinidad & Tobago 2.12 27.82 34.91 15'760 5'000 83 Sudan 2.12 2 - 1'130 1'000 84 Pakistan 2.14 2.46 8.62 1'380 2'000 85 Gabon 2.28 20.24 27.95 10'650 500 86 Thailand 2.33 10.41 24.51 5'370 500 87 Iran (I.R.) 2.37 11.4 24.52 5'780 1'536 88 Antigua & Barbuda 2.38 25.56 31.09 12'910 500 89 Mongolia 2.51 7.87 16.77 3'770 1'024 90 Lebanon 2.51 20.64 - 9'870 750 91 South Africa 2.58 15.43 27.33 7'190 500 92 India 2.61 3.41 11.41 1'570 600 93 Chile13 2.65 33.58 42.05 15'230 600 94 Egypt 2.76 7.28 24.49 3'160 500 95 Malta14 2.8 46.47 54.28 19'927 1'024 96 Bolivia 3.34 7.09 15.79 2'550 500 97 Jamaica 3.44 14.96 20.98 5'220 3'072 98 Paraguay 3.45 11.62 21.06 4'040 1'024 99 Cambodia 3.47 2.75 7 950 500
100 Ecuador 3.66 16.79 29.43 5'510 500 101 Dominican Rep. 3.95 18.5 35.53 5'620 1'536 102 Brazil15 4.14 40.35 48.52 11'690 500 103 Lao P.D.R. 4.21 5.12 12.82 1'460 1'000 104 Philippines 4.31 11.76 25.77 3'270 1'000 105 El Salvador 4.52 14 26.65 3'720 1'024 106 Morocco 4.66 11.78 23.7 3'030 5'120 107 Botswana 5.54 35.72 - 7'730 500 108 Nigeria 5.6 12.88 21.39 2'760 750 109 Guatemala 5.72 15.91 30.86 3'340 1'024 110 Fiji 6.01 22.18 32.67 4'430 4'096 111 Timor-Leste 6.03 18 28.75 3'580 1'024 112 Cape Verde16 6.33 19.14 33.26 3'630 5'500 113 Samoa 6.81 19.47 23.89 3'430 500 114 Ghana 7 10.26 21.57 1'760 1'000 115 Nicaragua 7.36 10.92 26.63 1'780 1'024 116 Kenya 7.49 5.81 12.64 930 500 117 Swaziland 7.87 20.2 43.35 3'080 500 118 Nepal 7.92 4.82 15.19 730 500 119 Namibia 8.49 41.33 71.59 5'840 600 120 Kyrgyzstan 8.88 8.88 23.2 1'200 500 121 Afghanistan 10.78 6.29 17.67 700 500 122 Bangladesh 11.78 8.83 25.18 900 1'000 123 Lesotho 14.43 18.64 43.33 1'550 500 124 Zambia 15.78 19.46 38.07 1'480 500 125 Tanzania 16.07 8.44 19.08 630 500 126 Tajikistan 17.01 14.03 33.09 990 1'000 127 Mali 17.04 9.51 20.94 670 500 128 Uganda 18.18 7.73 18.19 510 500 129 Honduras 18.99 34.5 62.48 2'180 1'024 130 Angola 22.35 93.3 105.22 5'010 600 131 Côte d'Ivoire17 26.4 30.36 63.43 1'380 4'000 132 Burkina Faso 27.19 15.18 33.48 670 500 133 Zimbabwe 27.8 19 - 820 500 134 Mozambique 30.4 14.95 28.21 590 500 135 Solomon Islands 30.62 41.08 38.56 1'610 500 136 Madagascar 30.89 11.33 32.63 440 500 137 Haiti 34.13 23.04 44.46 810 7'168 138 Mauritania 37.73 33.32 - 1'060 500 139 S. Tomé & Principe 44.25 54.2 85.88 1'470 500 140 Congo (Dem. Rep.) 44.47 14.82 23.55 400 500 141 Benin 46.12 30.36 64.08 790 6'000 142 Vanuatu18 62.71 163.56 130.43 3'130 500 143 Niger 88.86 30.36 66.08 410 3'072 144 Gambia 335.14 142.43 - 510 500
Andorra** - 20.81 - - 500 Argentina** - 14.47 - - 500 Monaco** 19 - 45.14 - - 1'024 San Marino** - 38.5 37.17 - 500 Syria** - 89.09 - - 1'000
Note: * Data correspond to the GNI per capita (Atlas method) in 2013 or latest available year adjusted with the international inflation rates. ** Country not ranked because data on GNI p.c. are not available for the last five years. Bundles include: 1) 60 minutes on-net, 300 SMS. 2) 120 mins, unlimited SMS. 3) 500 SMS. 4) Unlimited mins and SMS. 5) 100 outgoing mins, 800 local SMS/MMS. 6) 25 SMS. 7) Unlimited on-net mins, 100 off-net mins, unlimited SMS. 8) 300 mins, unlimited SMS. 9) 200 mins, 200 SMS/MMS. 10) 35 on-net mins, 400 on-net SMS. 11) Talk & Text. 12) 1 000 mins, 1 000 SMS, 1 000 MMS (on-net). 13) 100 mins, 100 SMS/MMS. 14) 2 000 on-net mins, 60 local mins, 2 000 on-net sms, 60 local SMS. 15) 60 mins. 16) 50 SMS. 17) 200 on-net SMS. 18) 720 mins. 19) 2h, unlimited SMS.
Source: ITU. GNI p.c. and PPP$ values are based on World Bank data.

Chapter 4. ICT prices and the role of competition
134
Table 4.6: Mobile-broadband prices, prepaid handset-based 500 MB, 2013
Rank Economy
Mobile-broadband, prepaid handset-based (500 MB)
GNI p.c., USD,
2013*Monthly data
allowance (MB)as % of GNI p.c. USD PPP$
1 Norway 0.1 8.34 5 102'610 500 2 Austria 0.13 5.31 4.62 48'590 1'024 3 Iceland 0.13 4.83 4 43'930 500 4 Sweden 0.15 7.52 5.38 59'130 1'024 5 Lithuania 0.2 2.31 3.32 13'958 1'024 6 Finland 0.23 9.03 6.79 47'110 500 7 Singapore 0.27 11.99 12.4 54'040 500 8 Qatar 0.31 21.98 29.87 85'550 3'000 9 Switzerland 0.33 22.66 13.5 81'760 500
10 Poland 0.35 3.8 6.24 12'960 1'024 11 Australia 0.35 19.31 12.99 65'520 700 12 Bahrain 0.4 6.65 11.34 19'756 500 13 Russian Federation 0.41 4.68 8.16 13'860 500 14 Kuwait 0.46 17.63 27.2 45'889 1'024 15 New Zealand 0.52 15.58 12.1 35'875 500 16 Estonia 0.58 8.43 9.81 17'370 500 17 Canada 0.63 27.43 21.85 52'200 500 18 Belarus 0.66 3.72 9.9 6'720 500 19 Kazakhstan 0.69 6.51 11.02 11'380 1'024 20 Italy1 0.69 19.78 17.81 34'400 1'024 21 Macao, China 0.7 37.55 50.81 64'691 800 22 United Kingdom 0.72 23.45 19.2 39'110 2'048 23 Brunei Darussalam 0.73 19.98 30.11 33'002 500 24 Slovakia 0.73 10.62 13.97 17'372 700 25 France 0.75 26.55 22.62 42'250 1'000 26 Uruguay 0.77 9.76 10.75 15'180 768 27 Croatia 0.79 8.73 11.84 13'330 500 28 Indonesia 0.8 2.39 5.7 3'580 600 29 Slovenia 0.83 15.93 17.77 23'058 500 30 United Arab Emirates 0.83 26.96 - 39'006 1'000 31 Azerbaijan 0.83 5.1 11.8 7'350 600 32 Tunisia 0.85 3.08 6.64 4'360 500 33 Portugal 0.85 14.61 15.78 20'670 500 34 Saudi Arabia 0.85 18.67 38.13 26'200 500 35 Hungary 0.86 8.94 13.92 12'534 500 36 Spain 0.86 20.87 20.45 29'180 500 37 Romania 0.88 6.64 10.73 9'060 500 38 Belgium2 0.88 33.19 28.21 45'210 500 39 Oman 0.92 19.51 37.27 25'503 500 40 Malta 0.96 15.93 18.61 19'927 1'200 41 Sri Lanka 0.98 2.6 7.16 3'170 1'024 42 Germany 1.03 39.63 36.28 46'100 600 43 Greece 1.06 19.92 20.68 22'530 600 44 Turkey 1.09 9.98 14.42 10'950 500 45 Costa Rica 1.1 8.79 12.03 9'550 500 46 Albania 1.21 4.73 8.67 4'700 500 47 Ireland3 1.21 39.83 31.34 39'501 500 48 Serbia 1.25 5.97 10.36 5'730 500 49 Pakistan 1.28 1.48 5.17 1'380 1'024 50 Hong Kong, China 1.32 42.29 54.37 38'420 5'000 51 Montenegro 1.34 8.1 13.4 7'260 600 52 Malaysia 1.39 12.06 23.91 10'400 1'024 53 Brazil 1.41 13.77 16.57 11'690 600 54 Barbados 1.46 18.5 14.92 15'231 2'048 55 United States4 1.46 65.33 65.33 53'670 2'048 56 Mauritius 1.47 11.37 18.38 9'300 1'000 57 Czech Republic 1.49 22.43 29.54 18'060 500 58 Moldova 1.55 3.18 6.94 2'460 500 59 Chile 1.59 20.17 25.26 15'230 800 60 TFYR Macedonia 1.61 6.44 12.84 4'800 1'024 61 Panama 1.68 14.99 25.51 10'700 1'024 62 Bahamas 1.73 30 26.38 20'806 1'024 63 Denmark 1.73 88.14 58.63 61'110 500 64 Trinidad & Tobago 1.76 23.15 29.06 15'760 2'000 65 Cyprus 1.81 40.19 43.34 26'654 600 66 Ukraine 1.9 6.26 15.6 3'960 600 67 Venezuela 1.9 19.84 25.04 12'550 800 68 Cape Verde 1.99 6.02 10.46 3'630 500 69 Netherlands 2.02 79.66 67.2 47'440 600 70 Georgia 2.02 6.01 12.48 3'570 500 71 Jordan 2.05 8.45 17.61 4'950 500 72 Seychelles 2.06 21.46 30.37 12'530 500 73 Maldives 2.08 9.7 12.6 5'600 700 74 Gabon 2.17 19.23 26.55 10'650 500 75 Bulgaria 2.31 13.5 25.94 7'030 512 76 Thailand 2.33 10.41 24.51 5'370 500 77 Iran (I.R.) 2.37 11.4 24.52 5'780 1'536 78 Mongolia 2.51 7.87 16.77 3'770 1'000 79 Lebanon 2.51 20.64 - 9'870 750

135
Measuring the Information Society Report 2014
Table 4.6: Mobile-broadband prices, prepaid handset-based 500 MB, 2013 (continued)
Note: * Data correspond to the GNI per capita (Atlas method) in 2013 or latest available year adjusted with the international inflation rates. ** Country not ranked because data on GNI p.c. are not available for the last five years. Bundles include: 1) 200 mins, 200 SMS. 2) 150 mins, unlimited SMS. 3) Unlimited on-net mins and SMS, 100 international mins. 4) Unlimited on-net mins and SMS.
Source: ITU. GNI p.c. and PPP$ values are based on World Bank data.
Rank Economy
Mobile-broadband, prepaid handset-based (500 MB)
GNI p.c., USD,
2013*Monthly data
allowance (MB)as % of GNI p.c. USD PPP$
80 Antigua & Barbuda 2.58 27.78 33.8 12'910 1'024 81 India 2.58 3.38 11.29 1'570 600 82 South Africa 2.75 16.47 29.16 7'190 500 83 Egypt 2.76 7.28 24.49 3'160 500 84 Peru 2.78 14.8 24.78 6'390 500 85 Mexico 2.83 23.41 31.89 9'940 1'024 86 Namibia 2.96 14.4 24.94 5'840 500 87 Turkmenistan 3.06 17.54 - 6'880 500 88 Colombia 3.31 20.87 32.06 7'560 2'048 89 Cambodia 3.47 2.75 7 950 500 90 Libya 3.49 39.3 - 13'508 500 91 Fiji 3.68 13.58 20 4'430 2'048 92 Iraq 3.76 21.01 - 6'710 500 93 Uzbekistan 3.79 6 - 1'900 500 94 Suriname 3.83 29.55 50.06 9'260 3'584 95 Armenia 3.86 12.21 25.97 3'790 500 96 Jamaica 4.01 17.46 24.47 5'220 3'072 97 Philippines 4.31 11.76 25.77 3'270 1'000 98 Guatemala 4.53 12.6 24.44 3'340 1'024 99 Sudan 4.66 4.39 - 1'130 2'000
100 Morocco 4.71 11.9 23.93 3'030 500 101 El Salvador 4.84 15 28.55 3'720 1'024 102 Bolivia 5.11 10.85 24.17 2'550 500 103 Ecuador 5.36 24.62 43.15 5'510 600 104 Paraguay 5.52 18.59 33.7 4'040 1'024 105 Ghana 5.6 8.21 17.26 1'760 500 106 Nigeria 5.6 12.88 21.39 2'760 750 107 Timor-Leste 6.03 18 28.75 3'580 1'024 108 Dominican Rep. 6.8 31.84 61.15 5'620 2'800 109 Samoa 6.81 19.47 23.89 3'430 540 110 Botswana 7.12 45.84 - 7'730 500 111 Kenya 7.49 5.81 12.64 930 500 112 Nepal 7.92 4.82 15.19 730 500 113 Honduras 8.1 14.72 27.86 2'180 1'024 114 Bosnia and Herzegovina 8.59 33.94 59.17 4'740 500 115 Kyrgyzstan 8.88 8.88 23.2 1'200 500 116 Swaziland 9.24 23.72 50.91 3'080 500 117 Bangladesh 9.82 7.36 20.98 900 800 118 Afghanistan 10.78 6.29 17.67 700 500 119 Nicaragua 10.89 16.15 39.38 1'780 2'048 120 Congo (Rep.) 11.41 25.3 39.66 2'660 500 121 Yemen 12.18 13.5 - 1'330 1'024 122 Vanuatu 14.63 38.17 30.43 3'130 512 123 Tanzania 14.88 7.81 17.67 630 500 124 Rwanda 15.07 7.79 18.94 620 500 125 Benin 15.37 10.12 21.36 790 500 126 Zambia 15.78 19.46 38.07 1'480 500 127 Tajikistan 17.01 14.03 33.09 990 1'000 128 Mali 17.04 9.51 20.94 670 500 129 Lesotho 17.64 22.79 52.96 1'550 600 130 Uganda 18.18 7.73 18.19 510 500 131 Angola 22.35 93.3 105.22 5'010 600 132 Sierra Leone 25.05 14.2 28.96 680 500 133 Côte d'Ivoire 26.4 30.36 63.43 1'380 4'000 134 Burkina Faso 27.19 15.18 33.48 670 500 135 Solomon Islands 28.07 37.66 35.34 1'610 500 136 Malawi 28.11 6.32 20.04 270 500 137 Papua New Guinea 29.26 49.01 - 2'010 500 138 Zimbabwe 29.27 20 - 820 500 139 Madagascar 31.51 11.55 33.28 440 500 140 Kiribati 33.16 72.4 - 2'620 500 141 Haiti 34.13 23.04 44.46 810 7'168 142 Mauritania 37.73 33.32 - 1'060 500 143 Mozambique 40.54 19.93 37.62 590 1'000 144 Congo (Dem. Rep.) 44.47 14.82 23.55 400 500 145 Chad 47.63 40.48 - 1'020 2'048 146 Senegal 56.75 50.6 103.01 1'070 5'120 147 Togo 68.74 30.36 64.05 530 500 148 Niger 88.86 30.36 66.08 410 3'072 149 Liberia 113.78 38.87 - 410 500 150 S. Tomé & Principe 138.27 169.38 268.39 1'470 500
Andorra** - 38.85 - - 1'400 Argentina** - 9.16 - - 500 San Marino** - 26.55 25.64 - 800

Chapter 4. ICT prices and the role of competition
136
Table 4.7: Mobile-broadband prices, postpaid computer-based 1 GB, 2013
Rank Economy
Mobile-broadband, postpaid computer-based (1 GB)
GNI p.c., USD,
2013*Monthly data
allowance (MB)as % of GNI p.c. USD PPP$
1 Austria 0.13 5.31 4.62 48’590 12 Norway 0.20 16.85 10.10 102’610 13 Qatar 0.23 16.48 22.40 85’550 14 Iceland 0.24 8.92 7.38 43’930 15 Sweden 0.31 15.20 10.88 59’130 26 Hong Kong, China 0.32 10.31 13.26 38’420 17 Ireland 0.32 10.61 8.35 39’501 18 Finland 0.33 13.14 9.89 47’110 19 Denmark 0.35 17.63 11.73 61’110 1
10 Liechtenstein 0.35 42.08 - 142’885 511 United States 0.36 16.32 16.32 53’670 112 Italy 0.38 10.95 9.86 34’400 313 Lithuania 0.40 4.61 6.64 13’958 114 Luxembourg 0.44 26.55 20.02 72’528 515 Singapore 0.44 19.90 20.58 54’040 516 Australia 0.44 24.13 16.23 65’520 117 Switzerland 0.44 30.21 18.00 81’760 118 France 0.49 17.13 14.59 42’250 119 Poland 0.58 6.30 10.35 12’960 220 Romania 0.60 4.51 7.29 9’060 121 Oman 0.61 13.00 24.85 25’503 122 Germany 0.62 23.83 21.81 46’100 123 United Kingdom 0.62 20.32 16.64 39’110 124 Netherlands 0.67 26.55 22.40 47’440 125 Estonia 0.68 9.89 11.51 17’370 1526 Kazakhstan 0.69 6.51 11.02 11’380 127 Macao, China 0.69 37.30 50.47 64’691 128 Belgium 0.70 26.54 22.56 45’210 229 Uruguay 0.76 9.67 10.64 15’180 130 Latvia 0.79 9.37 12.25 14’201 231 Malta 0.80 13.28 15.51 19’927 532 Brunei Darussalam 0.81 22.38 33.72 33’002 233 United Arab Emirates 0.83 26.96 - 39’006 134 Slovenia 0.83 16.03 17.88 23’058 335 Mauritius 0.84 6.51 10.53 9’300 236 Hungary 0.86 8.94 13.92 12’534 237 Cyprus 0.90 19.92 21.47 26’654 138 Belarus 0.92 5.14 13.68 6’720 239 Kuwait 0.92 35.26 54.40 45’889 1540 Russian Federation 0.95 10.99 19.17 13’860 341 Canada 1.01 43.89 34.96 52’200 542 Libya 1.05 11.79 - 13’508 143 Greece 1.06 19.92 20.68 22’530 144 Croatia 1.10 12.27 16.64 13’330 245 Korea (Rep.) 1.12 24.11 28.85 25’920 246 Panama 1.12 9.99 17.00 10’700 147 Bahrain 1.13 18.62 31.74 19’756 548 Turkey 1.15 10.45 15.10 10’950 249 Bulgaria 1.15 6.72 12.90 7’030 150 Sri Lanka 1.15 3.04 8.38 3’170 651 Czech Republic 1.18 17.83 23.49 18’060 152 Portugal 1.19 20.51 22.16 20’670 153 Saudi Arabia 1.22 26.67 54.47 26’200 254 Egypt 1.27 3.35 11.27 3’160 155 Japan 1.32 50.57 43.96 46’140 356 Spain 1.32 32.13 31.48 29’180 157 New Zealand 1.37 40.96 31.82 35’875 258 Barbados 1.42 18.00 14.52 15’231 259 Azerbaijan 1.46 8.92 20.65 7’350 160 Chile 1.57 19.99 25.03 15’230 161 TFYR Macedonia 1.61 6.44 12.84 4’800 162 Slovakia 1.65 23.89 31.42 17’372 663 Serbia 1.70 8.10 14.06 5’730 364 Costa Rica 1.73 13.81 18.90 9’550 165 Malaysia 1.76 15.23 30.20 10’400 266 Indonesia 1.76 5.26 12.54 3’580 267 Venezuela 1.98 20.67 26.08 12’550 268 Trinidad & Tobago 2.12 27.82 34.91 15’760 569 Gabon 2.28 20.24 27.95 10’650 170 Mexico 2.35 19.50 26.56 9’940 171 Suriname 2.36 18.18 30.80 9’260 372 Bhutan 2.50 5.12 15.44 2’460 173 Mongolia 2.51 7.87 16.77 3’770 174 Colombia 2.54 16.00 24.58 7’560 175 Armenia 2.71 8.54 18.18 3’790 2

137
Measuring the Information Society Report 2014
Table 4.7: Mobile-broadband prices, postpaid computer-based 1 GB, 2013 (continued)
Note: * Data correspond to the GNI per capita (Atlas method) in 2013 or latest available year adjusted with the international inflation rates. ** Country not ranked because data on GNI p.c. are not available for the last five years.
Source: ITU. GNI p.c. and PPP$ values are based on World Bank data.
Rank Economy
Mobile-broadband, postpaid computer-based (1 GB)
GNI p.c., USD,
2013*Monthly data
allowance (MB)as % of GNI p.c. USD PPP$
76 Montenegro 2.89 17.49 28.93 7’260 377 China 2.95 16.14 26.60 6’560 278 Seychelles 2.98 31.10 44.01 12’530 179 Georgia 3.03 9.02 18.72 3’570 180 Thailand 3.11 13.90 32.71 5’370 181 Namibia 3.17 15.43 26.73 5’840 282 Brazil 3.23 31.49 37.87 11’690 283 Jordan 3.41 14.08 29.35 4’950 384 Maldives 3.49 16.27 21.14 5’600 385 Ukraine 3.49 11.51 28.69 3’960 186 Lebanon 3.83 31.50 - 9’870 287 Belize 3.86 15.00 25.80 4’660 188 Moldova 3.88 7.94 17.35 2’460 589 Dominican Rep. 3.95 18.50 35.53 5’620 290 Bosnia and Herzegovina 4.02 15.89 27.69 4’740 191 Peru 4.10 21.84 36.55 6’390 192 Albania 4.11 16.09 29.47 4’700 393 Paraguay 4.14 13.94 25.27 4’040 194 South Africa 4.30 25.79 45.67 7’190 195 El Salvador 4.51 13.99 26.63 3’720 296 Ecuador 4.63 21.28 37.30 5’510 197 Morocco 4.66 11.78 23.70 3’030 598 Lao P.D.R. 5.26 6.40 16.02 1’460 599 Antigua & Barbuda 5.47 58.89 71.65 12’910 10
100 Jamaica 5.73 24.94 34.96 5’220 1101 Fiji 6.01 22.18 32.67 4’430 6102 Cambodia 6.32 5.00 12.73 950 2103 Cape Verde 6.33 19.14 33.26 3’630 6104 Guatemala 6.63 18.46 35.80 3’340 1105 Bolivia 6.74 14.33 31.91 2’550 2106 Ghana 7.00 10.26 21.57 1’760 1107 Timor-Leste 8.38 25.00 39.92 3’580 2108 Philippines 8.60 23.44 51.38 3’270 2109 Botswana 9.24 59.53 - 7’730 2110 Nicaragua 9.30 13.80 31.99 1’780 1111 Nigeria 9.80 22.54 37.44 2’760 2112 Kyrgyzstan 10.12 10.12 26.43 1’200 1113 Samoa 11.36 32.46 39.81 3’430 1114 Bangladesh 11.78 8.83 25.18 900 1115 Pakistan 12.26 14.10 49.43 1’380 30116 India 12.39 16.21 54.19 1’570 6117 Nepal 13.87 8.44 26.61 730 1118 Honduras 13.93 25.30 45.82 2’180 5119 Kenya 14.98 11.61 25.28 930 2120 Sudan 15.16 14.27 - 1’130 5121 Tajikistan 17.01 14.03 33.09 990 1122 Zambia 18.78 23.17 45.32 1’480 1123 Equatorial Guinea 20.35 242.90 - 14’320 1124 Tanzania 20.47 10.75 24.31 630 1125 Lesotho 20.85 26.93 62.59 1’550 1126 Afghanistan 21.56 12.58 35.35 700 1127 Côte d'Ivoire 26.40 30.36 63.43 1’380 4128 Mali 27.19 15.18 33.41 670 1129 Vanuatu 29.26 76.33 60.87 3’130 2130 Uganda 34.09 14.49 34.11 510 1131 Haiti 34.13 23.04 44.46 810 10132 Burkina Faso 36.25 20.24 44.65 670 5133 Mauritania 37.73 33.32 - 1’060 1134 Mozambique 40.54 19.93 37.62 590 1135 Ethiopia 41.35 16.20 43.05 470 1136 Benin 46.12 30.36 64.08 790 6137 Guinea 56.20 21.54 - 460 3138 Madagascar 56.85 20.84 60.04 440 1139 Solomon Islands 57.49 77.13 72.39 1’610 1140 Congo (Dem. Rep.) 59.30 19.77 31.40 400 1141 Zimbabwe 65.85 45.00 - 820 1142 Togo 72.23 31.90 67.29 530 2143 Burundi 137.80 32.15 83.41 280 1144 Gambia 164.28 69.82 - 510 1
Andorra** - 38.85 - - 2Argentina** - 20.15 - - 1Monaco** - 58.95 - - 7San Marino** - 38.50 37.17 - 1Syria** - 89.09 - - 1
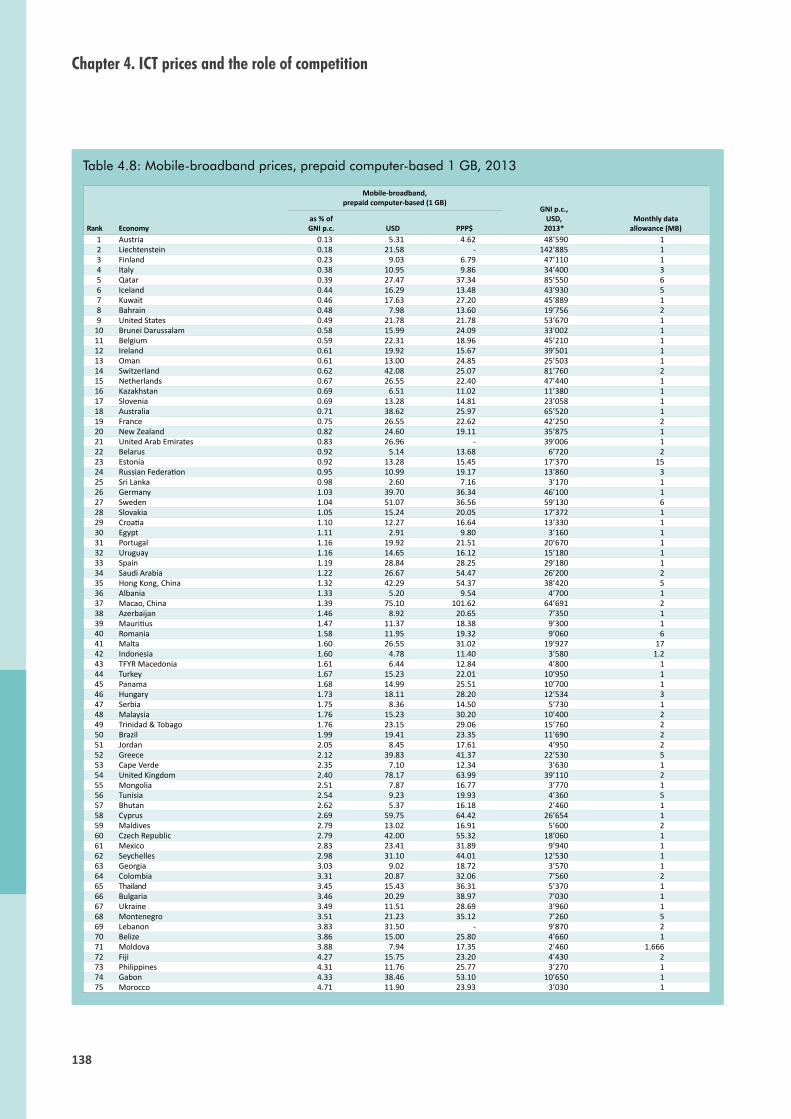
Chapter 4. ICT prices and the role of competition
138
Table 4.8: Mobile-broadband prices, prepaid computer-based 1 GB, 2013
Rank Economy
Mobile-broadband, prepaid computer-based (1 GB)
GNI p.c., USD,
2013*Monthly data
allowance (MB)as % of GNI p.c. USD PPP$
1 Austria 0.13 5.31 4.62 48’590 12 Liechtenstein 0.18 21.58 - 142’885 13 Finland 0.23 9.03 6.79 47’110 14 Italy 0.38 10.95 9.86 34’400 35 Qatar 0.39 27.47 37.34 85’550 66 Iceland 0.44 16.29 13.48 43’930 57 Kuwait 0.46 17.63 27.20 45’889 18 Bahrain 0.48 7.98 13.60 19’756 29 United States 0.49 21.78 21.78 53’670 1
10 Brunei Darussalam 0.58 15.99 24.09 33’002 111 Belgium 0.59 22.31 18.96 45’210 112 Ireland 0.61 19.92 15.67 39’501 113 Oman 0.61 13.00 24.85 25’503 114 Switzerland 0.62 42.08 25.07 81’760 215 Netherlands 0.67 26.55 22.40 47’440 116 Kazakhstan 0.69 6.51 11.02 11’380 117 Slovenia 0.69 13.28 14.81 23’058 118 Australia 0.71 38.62 25.97 65’520 119 France 0.75 26.55 22.62 42’250 220 New Zealand 0.82 24.60 19.11 35’875 121 United Arab Emirates 0.83 26.96 - 39’006 122 Belarus 0.92 5.14 13.68 6’720 223 Estonia 0.92 13.28 15.45 17’370 1524 Russian Federation 0.95 10.99 19.17 13’860 325 Sri Lanka 0.98 2.60 7.16 3’170 126 Germany 1.03 39.70 36.34 46’100 127 Sweden 1.04 51.07 36.56 59’130 628 Slovakia 1.05 15.24 20.05 17’372 129 Croatia 1.10 12.27 16.64 13’330 130 Egypt 1.11 2.91 9.80 3’160 131 Portugal 1.16 19.92 21.51 20’670 132 Uruguay 1.16 14.65 16.12 15’180 133 Spain 1.19 28.84 28.25 29’180 134 Saudi Arabia 1.22 26.67 54.47 26’200 235 Hong Kong, China 1.32 42.29 54.37 38’420 536 Albania 1.33 5.20 9.54 4’700 137 Macao, China 1.39 75.10 101.62 64’691 238 Azerbaijan 1.46 8.92 20.65 7’350 139 Mauritius 1.47 11.37 18.38 9’300 140 Romania 1.58 11.95 19.32 9’060 641 Malta 1.60 26.55 31.02 19’927 1742 Indonesia 1.60 4.78 11.40 3’580 1.243 TFYR Macedonia 1.61 6.44 12.84 4’800 144 Turkey 1.67 15.23 22.01 10’950 145 Panama 1.68 14.99 25.51 10’700 146 Hungary 1.73 18.11 28.20 12’534 347 Serbia 1.75 8.36 14.50 5’730 148 Malaysia 1.76 15.23 30.20 10’400 249 Trinidad & Tobago 1.76 23.15 29.06 15’760 250 Brazil 1.99 19.41 23.35 11’690 251 Jordan 2.05 8.45 17.61 4’950 252 Greece 2.12 39.83 41.37 22’530 553 Cape Verde 2.35 7.10 12.34 3’630 154 United Kingdom 2.40 78.17 63.99 39’110 255 Mongolia 2.51 7.87 16.77 3’770 156 Tunisia 2.54 9.23 19.93 4’360 557 Bhutan 2.62 5.37 16.18 2’460 158 Cyprus 2.69 59.75 64.42 26’654 159 Maldives 2.79 13.02 16.91 5’600 260 Czech Republic 2.79 42.00 55.32 18’060 161 Mexico 2.83 23.41 31.89 9’940 162 Seychelles 2.98 31.10 44.01 12’530 163 Georgia 3.03 9.02 18.72 3’570 164 Colombia 3.31 20.87 32.06 7’560 265 Thailand 3.45 15.43 36.31 5’370 166 Bulgaria 3.46 20.29 38.97 7’030 167 Ukraine 3.49 11.51 28.69 3’960 168 Montenegro 3.51 21.23 35.12 7’260 569 Lebanon 3.83 31.50 - 9’870 270 Belize 3.86 15.00 25.80 4’660 171 Moldova 3.88 7.94 17.35 2’460 1.66672 Fiji 4.27 15.75 23.20 4’430 273 Philippines 4.31 11.76 25.77 3’270 174 Gabon 4.33 38.46 53.10 10’650 175 Morocco 4.71 11.90 23.93 3’030 1

139
Measuring the Information Society Report 2014
Table 4.8: Mobile-broadband prices, prepaid computer-based 1 GB, 2013 (continued)
Note: * Data correspond to the GNI per capita (Atlas method) in 2013 or latest available year adjusted with the international inflation rates. ** Country not ranked because data on GNI p.c. are not available for the last five years.
Source: ITU. GNI p.c. and PPP$ values are based on World Bank data.
Rank Economy
Mobile-broadband, prepaid computer-based (1 GB)
GNI p.c., USD,
2013*Monthly data
allowance (MB)as % of GNI p.c. USD PPP$
76 South Africa 4.82 28.90 51.17 7’190 177 Suriname 4.91 37.88 64.17 9’260 578 Namibia 5.09 24.75 42.88 5’840 179 Paraguay 5.52 18.59 33.70 4’040 180 Lithuania 5.59 65.00 93.50 13’958 28081 Uzbekistan 5.68 8.99 - 1’900 182 Chile 5.72 72.65 90.98 15’230 1483 Antigua & Barbuda 5.82 62.59 76.15 12’910 1084 Cambodia 6.32 5.00 12.73 950 285 Angola 6.70 27.99 31.57 5’010 186 Guatemala 6.81 18.96 36.79 3’340 287 Jamaica 6.88 29.93 41.96 5’220 188 Ghana 7.00 10.26 21.57 1’760 189 Dominican Rep. 7.04 32.96 63.30 5’620 390 Iraq 7.52 42.02 - 6’710 191 Sudan 7.88 7.42 - 1’130 392 Honduras 8.10 14.72 27.86 2’180 193 Peru 8.20 43.67 73.10 6’390 294 Timor-Leste 8.38 25.00 39.92 3’580 295 El Salvador 9.03 28.00 53.30 3’720 896 Nigeria 9.80 22.54 37.44 2’760 297 Kyrgyzstan 10.12 10.12 26.43 1’200 198 Bolivia 10.22 21.71 48.35 2’550 299 Pakistan 10.22 11.76 41.23 1’380 5
100 Ecuador 10.72 49.24 86.30 5’510 1101 Armenia 10.82 34.18 72.71 3’790 28102 Nicaragua 10.89 16.15 39.38 1’780 1103 Botswana 11.09 71.44 - 7’730 1104 Yemen 12.18 13.50 - 1’330 1105 Samoa 12.95 37.01 45.40 3’430 1106 Nepal 13.87 8.44 26.61 730 1107 Kenya 14.98 11.61 25.28 930 2108 Bangladesh 15.71 11.78 33.57 900 2109 Swaziland 16.10 41.33 88.69 3’080 2110 Tajikistan 17.01 14.03 33.09 990 1111 Bosnia and Herzegovina 17.60 69.52 121.17 4’740 1112 Tanzania 17.85 9.37 21.20 630 1113 Zambia 18.78 23.17 45.32 1’480 1114 Cameroon 19.13 20.24 42.84 1’270 2115 Iran (I.R.) 20.18 97.21 208.98 5’780 4116 Congo (Rep.) 21.00 46.55 72.97 2’660 1117 Afghanistan 21.56 12.58 35.35 700 1118 Rwanda 24.11 12.46 30.30 620 1119 Côte d'Ivoire 26.40 30.36 63.43 1’380 4120 Lesotho 26.46 34.18 79.44 1’550 1121 Vanuatu 27.17 70.88 56.52 3’130 2122 Mali 27.19 15.18 33.41 670 1123 Benin 30.75 20.24 42.72 790 3124 Uganda 34.09 14.49 34.11 510 1125 Haiti 34.13 23.04 44.46 810 10126 Burkina Faso 36.25 20.24 44.65 670 5127 Mauritania 37.73 33.32 - 1’060 1128 Mozambique 40.54 19.93 37.62 590 1129 Sierra Leone 41.75 23.66 48.26 680 1130 Zimbabwe 51.22 35.00 - 820 1131 Madagascar 55.61 20.39 58.74 440 1132 Solomon Islands 56.14 75.32 70.69 1’610 1133 Guinea 56.20 21.54 46.84 460 3134 Malawi 56.21 12.65 40.08 270 1135 Senegal 56.75 50.60 103.01 1’070 5136 Congo (Dem. Rep.) 59.30 19.77 31.40 400 1137 Togo 72.23 31.90 67.29 530 2138 Niger 88.86 30.36 66.08 410 3139 Liberia 117.07 40.00 - 410 1140 Chad 133.35 113.35 - 1’020 4141 Gambia 164.28 69.82 - 510 1142 Burundi 282.21 65.85 170.82 280 1
Andorra** - 38.85 - - 1Argentina** - 46.16 - - 7Nauru** - 43.44 - - 5

Chapter 4. ICT prices and the role of competition
140
the region mobile broadband is more than USD 10 cheaper per month. This is a striking finding, taking into account that Europe is the region with the most affordable fixed-broadband plans. This reflects the early launch of 3G services in Europe28 and the maturity achieved in the mobile-broadband market, with a mobile-broadband penetration of 57 per cent by end 2013, the highest of all regions. European countries dominate the global top ten of most affordable mobile-broadband plans, with Austria, Finland and Iceland featuring in the top ten for all categories of mobile-broadband services (Tables 4.5 to 4.8).
4.4 Income inequality and broadband prices
The affordability of ICT services depends as much on the price of the service itself as on the economic means of the specific customer. In this and previous Measuring the Information Society Reports, affordability has been measured in terms of prices as a percentage of GNI per capita, thus showing how much ICT services cost relative to the economic value generated by each country. However, overall economic levels, as measured by macroeconomic variables such as GNI, do not reflect the actual means of the population nor how income is distributed. In order to understand better the affordability of ICT services, other variables such as household disposable income need to be considered.
Measurement efforts related to tracking the global development goals on poverty – such as Millennium Development Goal 1: Eradicate extreme poverty and hunger – have contributed to making available more data on household and individual economic welfare, as well as its distribution. This section presents a refined analysis of the affordability of broadband services for a number of countries for which data on the distribution of household income or consumption expenditure are available. The objective is to explore how factors such as
income inequality may affect people’s access to, and use of, broadband services.
Household disposable income and GNI are two fundamentally different economic indicators. On the one hand, GNI is a macroeconomic aggregate similar to gross domestic product (GDP) and measures the size of a country’s economy as a whole, including the business sector. It is a measure of the value of the national production of an economy, and is calculated in the context of national accounts. It is similar to GDP, except that GNI accounts for primary flows in and out of the country.29 GNI has been used as a measure of national economic development and, in view of its wide availability, as a way of classifying countries by income levels – for instance by the World Bank.30
Data on household income, on the other hand, measure only people’s economic welfare, and do not include the business sector. Household disposable income is a measure of all the income received by the members of a household31 less the taxes and social security contributions paid directly by the household. Data are collected by national statistical offices by means of household income and expenditure surveys (HIES) or household surveys including a module on income/expenditure – such as some national implementations of the Living Standards Measurement survey or the European Union survey on Income and Living Conditions – and processed to produce a breakdown of disposable income by quantiles. The household is taken as the unit within which income sources are pooled and equally shared. This implies that the income of the household is attributed to each of its members, irrespective of who in the household receives that income.32 In order to classify income data by deciles, individuals are placed in ascending order according to the household income attributed to them, and then the population is divided into ten equal parts, each corresponding to an income decile.33
An alternative measure to household disposable income is household consumption expenditure,

141
Measuring the Information Society Report 2014
which is often considered a better indicator for living standards. This is particularly the case for developing countries, where income may be difficult to measure – because of large informal sectors and self-employment – and other barriers to consumption expenditure, such as access and availability of products, may be relevant.34 Data on household consumption expenditure are also obtained from household surveys.
Caution must be exercised when making international comparisons based on data on household economic welfare, because there are several methodological issues that limit comparability, notably: differing household survey vehicles and periodicity, the choice of income or consumption as the reference for household economic means, and differing equivalence scales.35 Nevertheless, household-level economic data provide information (not available from macroeconomic indicators) on the actual income and expenditure capacity of households in a country and the differences across households. Subject to the caveats previously mentioned, these data can be used to obtain a finer-grain indication of the affordability of broadband services for households from different economic levels.
Chart 4.17 shows the household income and expenditure distribution in four selected countries from the developed and the developing world. In Sweden, the poorest 20 per cent of the population have 9 per cent of total household disposable income, compared with 5 per cent in the United States. Differences increase when comparing the top income deciles: the richest 20 per cent hold 34 per cent of total household income in Sweden, as against 44 per cent in the United States. Disparities in the distribution of economic welfare also occur in the developing world, in some cases even to a larger extent. The richest 20 per cent concentrate 43 per cent of total household consumption in Viet Nam, and as much as 68 per cent in South Africa. This is a remarkable difference given that the distribution of income is typically more unequal than the distribution of consumption, and therefore differences in income distribution would probably be even larger. These examples show that income and consumption distribution can vary significantly across developing as well as developed countries.
Fixed broadbandIncome inequality also has an impact on the affordability of broadband prices. For example, taking two countries that have similar fixed-
Chart 4.17: Distribution of household disposable income (left) and household consumption (right), selected countries, 2011 or latest available year
Source: Data for the United States and Sweden are sourced from the OECD Database on Income Distribution and refer to 2011. Data for South Africa and Viet Nam are sourced from the World Bank’s PovcalNet and refer to 2008.
0
20
40
60
80
100
10 20 30 40 50 60 70 80 90 100
% population
Sweden United States
% o
f to
tal
ho
use
ho
ld d
isp
osa
ble
in
com
e
% o
f to
tal
ho
use
ho
ld c
on
sum
pti
on
0
20
40
60
80
100
10 20 30 40 50 60 70 80 90 100
% population
Viet Nam South Africa

Chapter 4. ICT prices and the role of competition
142
broadband prices in terms of GNI p.c., Chart 4.18 uses data on income inequality to reveal differences in the affordability of fixed-broadband services between these two countries, and even larger differences within each country. In Chart 4.18, the affordability of a fixed-broadband plan for the first decile is calculated by dividing the price of the fixed-broadband plan by the average disposable income of the poorest 10 per cent of the population in the country. Conversely, for the tenth decile, the price of the fixed-broadband plan is divided by the disposable income of the richest 10 per cent of the population in the country. It is assumed that the cost of the fixed-broadband subscription is shared by all members of the household, and therefore the price of the plan is divided by the estimated income of all members of a household.36
In Panama, the poorest 10 per cent of the population would need to spend 12.6 per cent of their household disposable income to subscribe to an entry-level fixed-broadband plan, whereas the richest 10 per cent of the population would only be spending 0.3 per cent of their household income. In Uruguay, for a similar fixed-broadband plan, the poorest 10 per cent of the population
Chart 4.18: Fixed-broadband prices as a percentage of household disposable income, by income deciles, Panama and Uruguay, 2013
Source: ITU. Household disposable income based on World Bank’s PovcalNet data adjusted with ITU estimates on average persons per household.
would need to spend 8.5 per cent of their household disposable income, whereas the outlay would represent only 0.5 per cent of household disposable income for the richest 10 per cent of the population. The comparison between the two countries shows that fixed broadband is more affordable for low-income households in Uruguay than in Panama. This is explained by income distribution: low-income households in Uruguay have a higher share of total household income than in Panama. Conversely, for middle and high-income households in Panama, entry-level fixed broadband is slightly more affordable than for the corresponding households in Uruguay. This example illustrates how income inequalities may explain differences in the affordability of fixed-broadband services within a country, and between countries with similar fixed-broadband prices expressed as a percentage of GNI p.c.
In addition to highlighting differences in fixed-broadband affordability due to income inequality within countries, economic data at the household level also make it possible to determine more precisely the affordability of residential fixed-broadband services. As an example, Chart 4.19 shows that the price of an entry-level fixed-broadband plan corresponds to a larger share of household consumption expenditure in Angola than in Uganda for all deciles, despite the fact that prices in terms of GNI p.c. are almost three times lower in Angola.37 The richest 10 per cent of the population in Uganda would need to devote 4.2 per cent of their household expenditure to subscribe to a fixed-broadband plan, compared with 6.7 per cent in the case of the richest 10 per cent of the population in Angola. Affordability is clearly a barrier to fixed-broadband adoption in Angola: for 60 per cent of the population in the country, the price of a basic fixed-broadband plan corresponds to more than a quarter of their household expenditure. In Uganda, fixed broadband is less expensive, but still unaffordable for many: for the poorest 40 per cent of the population in the country it would represent more than a quarter of their total household expenditure.
0
5
10
1Bottom
10%
2 3 4 5 6 7 8 9 10Top10%
Income deciles
Panama Uruguay
As
% o
f h
ou
seh
old
dis
po
sab
le i
nco
me
12.6

143
Measuring the Information Society Report 2014
Chart 4.19: Fixed-broadband prices as a percentage of household consumption, by consumption deciles, Angola and Uganda, 2013
Source: ITU. Household consumption based on World Bank’s PovcalNet data adjusted with ITU estimates on average persons per household.
Table 4.9 and Table 4.10 show the price of entry-level fixed-broadband plans as a percentage of household disposable income and household consumption expenditure, respectively. It is assumed that all members of the household share the cost of the fixed-broadband subscription, and therefore prices are divided by the estimated household income or consumption expenditure.
Taking as a reference the affordability threshold set by the Broadband Commission (i.e. an entry-level broadband service should be made affordable … “amounting to less than 5% of average monthly income”) and applying this threshold to both household disposable income and expenditure data, the following conclusions can be drawn:
• In more than 85 per cent of countries for which data are available, the richest 20 per cent of the population can afford an entry-level fixed-broadband plan. The remaining 15 per cent of countries are from Sub-Saharan Africa, all of them LDCs except for Nigeria and Swaziland. In most of these countries, the cost of a basic fixed-broadband plan corresponds to more than 20 per cent of household expenditure for 80 per cent of the population (less in Togo and Angola: 60 and 70 per cent, respectively). Making fixed broadband more affordable should thus be a priority for ICT policy-makers and regulators in these countries, since cost constitutes a major barrier for almost the entire population.
• In 40 per cent of countries for which data are available, a basic fixed-broadband subscription still represents more than 5 per cent of household income/consumption for over half of the population. This is the case not only in low-income countries, but also in several countries classified as upper-middle-income economies by the World Bank: several Latin American countries
(Colombia, Dominican Republic, Ecuador and Peru), two African countries (Angola and South Africa) and Belarus, Serbia and Thailand. These countries should also address the issue of affordability of fixed-broadband services among low and middle-income households, since price may still be a barrier for many households.
• Income and expenditure inequalities within countries greatly influence the affordability of fixed broadband. The smallest differences are in Iceland, where an entry-level fixed-broadband plan is 3.5 times more affordable for the richest 20 per cent of the population than for the poorest 20 per cent. Differences are much wider in several developing countries, such as Brazil, Colombia, Honduras, Bolivia and South Africa, where fixed broadband is more than 20 times more affordable for the richest 20 per cent of the population than for the poorest 20 per cent. As a result, in most developing countries for which data on household income or expenditure distribution are available, fixed-broadband plans remain
0
20
40
60
80
100
1Bottom
10%
2 3 4 5 6 7 8 9 10Top10%
Consumption deciles
Angola Uganda
As
% o
f h
ou
seh
old
co
nsu
mp
tio
n

Chapter 4. ICT prices and the role of competition
144
Table 4.9: Fixed-broadband prices as a percentage of household disposable income, selected countries, 2013
Note: Data on household disposable income refer to 2011 or latest year available. * ‘Lowest 20%’ refers to the price divided by the average income of the first and second income/consumption deciles. ‘Highest 20%’ refers to the price divided by the average income of the ninth and tenth income/consumption deciles.
Source: ITU. Household disposable income for OECD countries and the Russian Federation based on data from the OECD Database on Income Distribution adjusted with ITU estimates on average persons per household. Household disposable income and consumption expenditure for other countries based on World Bank’s PovcalNet data adjusted with ITU estimates on average persons per household.
Fixed-broadband prices as a % of household disposable income % households whee fixed broadband
< 5% household incomeCountry Average Lowest 20%* Highest 20%*Ireland 0.37 0.97 0.18 100United Kingdom 0.39 1.06 0.19 100Switzerland 0.45 1.07 0.23 100Luxembourg 0.53 1.14 0.29 100Japan 0.54 1.66 0.27 100Austria 0.57 1.24 0.32 100France 0.65 1.52 0.33 100United States 0.68 2.47 0.31 100Norway 0.69 1.49 0.41 100Finland 0.71 1.50 0.40 100Italy 0.76 2.16 0.39 100Iceland 0.80 1.62 0.47 100Belgium 0.81 1.79 0.46 100Australia 0.82 2.29 0.41 100Netherlands 0.83 1.88 0.44 100Sweden 0.83 1.89 0.47 100Canada 0.84 2.25 0.42 100Greece 0.88 2.61 0.43 100Denmark 0.88 1.83 0.51 100Slovenia 0.92 1.96 0.54 100Korea (Rep.) 1.03 3.10 0.54 100Poland 1.05 2.64 0.54 100Germany 1.06 2.43 0.56 100Portugal 1.27 3.46 0.60 100Czech Republic 1.29 2.62 0.72 100New Zealand 1.35 3.48 0.68 100Slovakia 1.96 4.26 1.11 100Russian Federation 0.59 1.94 0.26 90Israel 1.04 3.81 0.49 90Spain 1.06 3.49 0.53 90Estonia 1.67 4.55 0.85 90Turkey 1.25 4.41 0.53 80Panama 1.39 8.41 0.49 80Brazil 1.53 10.76 0.52 80Uruguay 1.63 6.63 0.64 80Malaysia 1.64 7.22 0.64 80Mexico 1.70 8.42 0.66 80Hungary 3.23 7.13 1.76 80Costa Rica 1.94 10.08 0.69 70Chile 2.23 10.31 0.79 70Colombia 2.89 19.28 0.96 50Peru 3.03 15.52 1.15 50Ecuador 3.06 14.25 1.14 50El Salvador 3.57 19.24 1.34 50Honduras 3.51 34.76 1.17 40Paraguay 3.73 22.86 1.32 40Dominican Rep. 4.94 21.16 1.87 30Bolivia 7.20 67.58 2.43 20

145
Measuring the Information Society Report 2014
Table 4.10: Fixed-broadband prices as a percentage of household consumption expenditure, selected countries, 2013
Note: Data on household consumption expenditure refer to 2011 or latest year available. * ‘Lowest 20%’ refers to the price divided by the average expenditure of the first and second consumption expenditure deciles. ‘Highest 20%’ refers to the price divided by the average expenditure of the ninth and tenth consumption expenditure deciles.
Source: ITU. Household consumption expenditure based on World Bank’s PovcalNet data adjusted with ITU estimates on average persons per household.
Fixed-broadband prices as a % of household consumption expenditure % householdswhere fixed broadband
< 5% expenditureCountry Average Lowest 20%* Highest 20%*Croatia 1.60 3.98 0.76 100Lithuania 1.76 5.31 0.79 90Tunisia 1.99 5.90 0.93 90Jordan 2.10 5.44 0.96 90Viet Nam 2.42 6.52 1.11 80Romania 2.69 6.08 1.49 80Montenegro 2.74 6.27 1.47 80TFYR Macedonia 2.40 8.89 0.96 70Fiji 2.67 8.60 1.08 70Azerbaijan 2.95 7.39 1.40 70Sri Lanka 2.98 7.72 1.34 70Albania 3.03 7.45 1.41 70Bhutan 3.23 9.58 1.41 60Latvia 3.53 10.11 1.68 60Kazakhstan 3.93 8.62 2.05 60Ukraine 3.76 12.88 1.48 40Egypt 4.65 10.07 2.31 40Sudan 4.84 14.21 2.28 40South Africa 3.40 25.18 1.00 30Thailand 5.19 15.36 2.23 30Georgia 5.35 21.27 2.25 30Bangladesh 5.44 12.25 2.63 30Armenia 5.57 12.63 2.75 30Serbia 5.77 13.80 3.02 30Moldova 5.98 15.32 2.90 30Nepal 6.14 14.84 2.96 20Belarus 6.65 14.16 3.71 20Cambodia 6.87 17.32 3.09 20Philippines 7.92 26.49 3.19 20Côte d'Ivoire 8.11 28.97 3.41 10Lao P.D.R. 8.39 21.95 3.74 10Kyrgyzstan 9.07 23.62 4.38 10Senegal 9.25 30.59 3.95 10Mauritania 9.43 31.33 4.01 10Uganda 15.11 51.74 5.96 10Togo 19.36 64.66 8.47 0Angola 21.73 80.47 8.93 0Burkina Faso 24.26 72.20 10.31 0Mali 27.86 69.92 13.49 0Swaziland 29.34 144.91 10.37 0Nigeria 35.06 119.04 15.21 0Ethiopia 44.45 111.69 21.24 0Zambia 68.76 384.13 22.12 0Madagascar 123.19 455.40 49.14 0Malawi 160.18 568.03 63.87 0Central African Rep. 439.65 2609.18 145.10 0Rwanda 490.31 1900.41 172.52 0

Chapter 4. ICT prices and the role of competition
146
unaffordable for large segments of the population.
Looking at the six regions, the following points can be highlighted:
• In most European countries, entry-level fixed-broadband prices represent less than 5 per cent of household income/expenditure for almost all households.38 The main exception is Serbia, where a basic fixed-broadband plan corresponds to more than 5 per cent of consumption expenditure for 70 per cent of households in the country.
• In CIS countries, affordability varies from very affordable in the Russian Federation to rather unaffordable in Belarus and Kyrgyzstan, where more than three quarters of households would need to spend more than 5 per cent of their household consumption expenditure to subscribe to an entry-level fixed-broadband plan.
• In the Americas, basic fixed-broadband plans are affordable for around 80 per cent of the population in Brazil, Mexico, Panama and Uruguay, whereas in Bolivia and the Dominican Republic their cost would correspond to more than 5 per cent of household income for 70 per cent of the population. In the other Latin American countries, fixed broadband is unaffordable for many: a basic subscription would correspond to more than 5 per cent of household income for 40 per cent of the population or more. In contrast, in the United States and Canada, entry-level fixed broadband plans are affordable for almost all households.
• There is also a wide range in Asia and the Pacific: while entry-level prices are affordable for almost all households in high-income economies in the region, in Cambodia, Nepal and the Philippines fixed-
broadband prices represent more than 5 per cent of consumption expenditure for most households. Viet Nam and Sri Lanka stand out because, despite low income levels, the cost of an entry-level fixed-broadband plan represents less than 5 per cent of household expenditure for 70 per cent of the population.
• In the Arab States, the comparison is limited by lack of data on the distribution of household income/expenditure. Available data suggest that basic fixed-broadband plans are affordable for 90 per cent of the population in Jordan and Tunisia, whereas they are less affordable in Egypt and Sudan, where their cost would correspond to more than 5 per cent of household consumption expenditure for most of the population. Indeed, in Egypt and Sudan, income inequalities explain why the cost of a basic fixed-broadband plan represents less than 2.5 per cent of household consumption expenditure for the richest 20 per cent of the population, as against more than 10 per cent of household expenditure for the poorest 20 per cent of the population.
Mobile broadbandThe same approach is used to analyse how income inequalities within countries determine the affordability of mobile-broadband services.
Table 4.11 and Table 4.12 show the price of prepaid handset-based mobile-broadband plans (with a 500 MB monthly data allowance) as a percentage of disposable household income and household consumption expenditure, respectively. Prepaid handset-based mobile-broadband prices are chosen for the comparison because prepaid handset-based is on average the cheapest of the four mobile-broadband services for which ITU collects price data (Chart 4.13), and is currently the mobile-broadband service that is available in most countries (Chart 4.11).

147
Measuring the Information Society Report 2014
Handset-based mobile-broadband services are affordable for the large majority of the population in all developed countries except Ukraine, where the cost of the service represents more than 5 per cent of household expenditure for more than half of the population. The unaffordability of prepaid handset-based mobile-broadband plans in Ukraine is partially attributable to income and expenditure inequalities: for the richest 20 per cent of the population, the cost of the service corresponds to 1.5 per cent of their household expenditure (thus affordable), whereas for the poorest 20 per cent of the population it represents 12.9 per cent of household expenditure (making it quite unaffordable). Ukraine is the developed country with the lowest mobile-broadband penetration, which suggests that the unaffordability of handset-based mobile-broadband services for low- and middle-income households is holding back mobile-broadband adoption in the country.
The affordability of prepaid handset-based mobile-broadband services differs considerably across developing countries and within some developing countries because of income inequalities. In Latin American, for example, the cost of handset-based mobile-broadband services in countries such as Ecuador, El Salvador, Honduras and Paraguay corresponds to less than 1.5 per cent of household disposable income for the richest 20 per cent of the population, but more than 15 per cent of household disposable income for the poorest 20 per cent of the population. Other developing countries that are in a similar situation because of household income and expenditure inequalities include Sudan, Philippines and Nepal.
In Africa, handset-based mobile-broadband prices are affordable (i.e. represent less than 5 per cent of household expenditure) for less than 40 per cent of the population in every country for which data are available. This is also the situation in Armenia, Dominican Republic and Egypt. In these countries, a prepaid handset-based mobile-broadband plan represents, on average, more than 5 per cent of household income or
expenditure, suggesting that mobile-broadband affordability is an issue irrespective of income/expenditure distribution.
On the other hand, in developing countries such as Azerbaijan, Cambodia, Chile, Costa Rica, Jordan, Uruguay, Tunisia and Turkey, handset-based mobile-broadband services are affordable for almost the entire population. This suggests that neither handset-based mobile-broadband prices nor income/expenditure inequalities are a barrier to mobile-broadband adoption in these countries.
A comparison of fixed-broadband and prepaid handset-based mobile-broadband prices shows that mobile broadband may be the only affordable alternative for low-income households in several developing countries. For instance, for more than 40 per cent of the population in Belarus, Cambodia, Georgia, Moldova, Serbia and Thailand, a handset-based mobile-broadband plan corresponds to less than 5 per cent of household expenditure, whereas a basic fixed-broadband plan represents more than that. As a result, mobile broadband may contribute significantly to making broadband available to low-income households in these countries. In other developing countries where fixed-broadband services are affordable for most of the population, mobile broadband may help to connect the 20-30 per cent of households with the lowest incomes for which a fixed-broadband plan may be unaffordable, but which could afford a mobile-broadband plan. This might be the case in countries such as Albania, Azerbaijan, Kazakhstan, Sri Lanka and TFYR Macedonia.
This assessment of the impact of income inequalities on the affordability of mobile-broadband services is made on the basis of the cost of one handset-based mobile-broadband subscription per household. However, subscription data show that, in developed countries, handset-based mobile-broadband subscriptions are individual, rather than shared per household. In some countries, such as for instance Australia, Denmark, Finland and

Chapter 4. ICT prices and the role of competition
148
Table 4.11: Prepaid handset-based mobile-broadband (500 MB/month) prices as a percentage of household disposable income, selected countries, 2013
Note: Data on household disposable income refer to 2011 or latest year available. * ‘Lowest 20%’ refers to the price divided by the average income of the first and second income deciles. ‘Highest 20%’ refers to the price divided by the average income of the ninth and tenth income deciles.
Source: ITU. Household disposable income for OECD countries and the Russian Federation based on data from the OECD Database on Income Distribution adjusted with ITU estimates on average persons per household. Household disposable income for other countries based on World Bank’s PovcalNet data adjusted with ITU estimates on average persons per household.
Prepaid handset-based mobile-broadband prices as a % of household disposable income
% populationfor which prepaid handset-based mobile broadband< 5% household incomeCountry Average Lowest 20%* Highest 20%*
Norway 0.11 0.24 0.07 100Austria 0.12 0.26 0.07 100Iceland 0.12 0.25 0.07 100Sweden 0.16 0.37 0.09 100Finland 0.21 0.45 0.12 100Switzerland 0.28 0.66 0.15 100Australia 0.30 0.83 0.15 100Poland 0.32 0.81 0.17 100New Zealand 0.34 0.88 0.17 100Russian Federation 0.44 1.45 0.19 100Canada 0.50 1.35 0.26 100Italy 0.56 1.59 0.29 100Slovenia 0.58 1.24 0.34 100United Kingdom 0.59 1.59 0.28 100France 0.62 1.44 0.32 100Estonia 0.66 1.81 0.34 100Portugal 0.67 1.81 0.32 100Spain 0.69 2.28 0.35 100Ireland 0.74 1.95 0.36 100Greece 0.75 2.23 0.37 100Belgium 0.81 1.80 0.46 100Hungary 1.02 2.25 0.56 100Germany 1.06 2.42 0.56 100United States 1.36 4.94 0.62 100Czech Republic 1.40 2.84 0.79 100Slovakia 1.57 3.10 0.87 100Denmark 1.66 3.42 0.96 100Costa Rica 1.07 5.57 0.38 90Uruguay 1.13 4.60 0.44 90Chile 1.18 5.42 0.42 90Turkey 1.55 5.62 0.68 90Netherlands 1.87 4.25 0.99 90Malaysia 0.94 4.16 0.37 80Brazil 1.53 10.72 0.52 80Panama 1.95 11.79 0.69 70Peru 2.04 10.42 0.77 70Mexico 3.01 14.89 1.17 60Colombia 3.05 20.32 1.01 50Bolivia 3.12 29.30 1.05 50Paraguay 3.27 20.05 1.16 50El Salvador 3.39 18.26 1.28 50Honduras 3.44 34.11 1.15 40Ecuador 3.73 17.40 1.39 40Dominican Rep. 7.39 31.66 2.80 20

149
Measuring the Information Society Report 2014
Table 4.12: Prepaid handset-based mobile-broadband (500 MB/month) prices as a percentage of household consumption expenditure, selected countries, 2013
Note: Data on household consumption expenditure refer to 2011 or latest year available. * ‘Lowest 20%’ refers to the price divided by the average expenditure of the first and second expenditure deciles. ‘Highest 20%’ refers to the price divided by the average expenditure of the ninth and tenth expenditure deciles.
Source: ITU. Household consumption expenditure based on World Bank’s PovcalNet data adjusted with ITU estimates on average persons per household.
Prepaid handset-based mobile-broadband prices as a % of household consumption expenditure
% populationfor which prepaid handset-based mobile broadband
< 5% household expenditureCountry Average Lowest 20%* Highest 20%*
Lithuania 0.35 1.07 0.16 100Croatia 0.79 1.95 0.37 100Jordan 0.94 2.43 0.43 100Tunisia 1.00 2.98 0.47 100Montenegro 1.18 2.69 0.63 100Azerbaijan 1.18 2.96 0.56 100Albania 1.26 3.11 0.59 100Moldova 1.49 3.83 0.73 100Cambodia 1.57 3.97 0.71 100TFYR Macedonia 1.20 4.44 0.48 90Sri Lanka 1.78 4.62 0.80 90Serbia 1.89 4.53 0.99 90Kazakhstan 2.02 4.42 1.05 90Romania 2.05 4.63 1.13 90Fiji 1.90 6.14 0.77 80Thailand 2.41 7.12 1.03 80Belarus 2.80 5.96 1.56 80Georgia 2.67 10.64 1.12 70Sudan 3.72 10.93 1.76 60Ukraine 3.76 12.88 1.48 40Philippines 3.96 13.23 1.59 40Nepal 4.66 11.26 2.25 40South Africa 3.28 24.26 0.96 30Egypt 5.17 11.19 2.56 30Mali 5.55 13.92 2.69 30Armenia 6.19 14.03 3.06 20Côte d'Ivoire 6.76 24.14 2.84 20Kyrgyzstan 6.77 17.63 3.27 20Burkina Faso 8.27 24.61 3.52 10Uganda 8.54 29.23 3.37 10Bangladesh 9.06 20.41 4.38 10Nigeria 11.13 37.79 4.83 10Rwanda 11.50 44.58 4.05 10Swaziland 12.22 60.34 4.32 10Senegal 12.85 42.49 5.49 10Togo 13.03 43.50 5.70 10Mauritania 15.04 49.96 6.40 10Zambia 18.05 100.83 5.81 10Malawi 18.66 66.18 7.44 0Madagascar 24.35 90.02 9.71 0Angola 39.94 147.92 16.42 0

Chapter 4. ICT prices and the role of competition
150
Sweden, there is on average more than one mobile-broadband subscription per person. The situation is more diverse in the developing world. On the one hand, there are many more mobile-broadband subscriptions than households in countries such as Botswana, Bahrain, Costa Rica, Qatar and the United Arab Emirates, suggesting that handset-based mobile-broadband subscriptions are also individual in these countries. On the other hand, there are fewer mobile-broadband subscriptions than households in most African countries and in several developing countries in the Asia and the Pacific and Americas regions. This is consistent with the early stages of development of the mobile-broadband market in these countries, but it may also indicate that handset-based mobile-broadband subscriptions are shared per household. In addition, fixed-broadband infrastructure may have a limited reach in several developing countries, where mobile broadband may thus be the only alternative for household access.
In order to take into consideration both situations (i.e. individual and shared use of handset-based mobile broadband), Chart 4.20 complements the previous analysis by showing the affordability of handset-based mobile-broadband plans assuming that each member of the household has his/her own SIM card with a mobile-broadband plan. In this case, affordability is measured in terms of equivalized income or consumption per person.39
Data show that handset-based mobile-broadband prices (with a 500 MB monthly allowance) are affordable for a majority of the population in developed countries, but much less so in developing countries. This suggests that a large proportion of households in the developing world could not afford to have one handset-based mobile-broadband plan per person, and would have to share a subscription among members of the household.
Handset-based mobile-broadband prices are affordable for almost all households in Europe,40
and so most of them could afford to have one handset-based mobile-broadband subscription per person. This is consistent with the high mobile-broadband penetration in Europe. In the CIS region, individual handset-based mobile-broadband plans are also affordable for most of the population in the Russian Federation, Azerbaijan, Moldova and Kazakhstan. On the other hand, the cost of a handset-based mobile-broadband plan represents more than 10 per cent of the equivalized household expenditure for 80 per cent of the population in Kyrgyzstan and Armenia. This may explain why these countries have the lowest mobile-broadband penetration in the CIS, along with Georgia. Income inequalities within countries partly explain these results: in Armenia, the richest 10 per cent of the population could afford to pay for one mobile-broadband plan with 500 MB/month for each person in the household; the next 10 per cent richest (ninth decile) could afford to have a shared mobile-broadband plan with 500 MB/month in the household; for the remaining 80 per cent of the population, such a mobile-broadband plan would be somewhat unaffordable (i.e. represent more than 5 per cent of household consumption expenditure).
In Latin America, individual handset-based mobile-broadband subscriptions are affordable for almost the whole population in Uruguay, Chile and Costa Rica. These are the only countries in Latin America, together with Brazil, with mobile-broadband penetrations above 30 per cent. In Brazil, Peru and Panama, an individual handset-based mobile-broadband subscription remains unaffordable for around 20 to 30 per cent of the population. In the other Latin American countries included in the comparison, affordability would be an issue for half of the population, for which the cost of a 500 MB handset-based mobile-broadband plan would represent more than 10 per cent of equivalized household income.
In Asia and the Pacific, the affordability of individual handset-based mobile-broadband subscriptions ranges from very affordable in

151
Measuring the Information Society Report 2014
Chart 4.20: Prepaid handset-based mobile-broadband prices (500 MB/month) as a percentage of equivalized household income (left), and equivalized household consumption expenditure (right), by deciles, 2013
Note: Data on equivalized household income and consumption expenditure per decile refer 2011 or latest available year. Source: ITU. Equivalized household disposable income for OECD countries and the Russian Federation based on data from the OECD Database on Income
Distribution. Equivalized household disposable income and consumption for other countries based on World Bank’s PovcalNet data adjusted with ITU estimates on average persons per household.
high-income economies (Australia and New Zealand) to unaffordable for a majority of the population in Bangladesh, Nepal and the Philippines. This tallies with the variations in mobile-broadband penetration in the region,
which ranges from more than 100 per cent in Australia to less than 1 per cent in Bangladesh. Cambodia and Sri Lanka stand out for having lower penetrations than would be expected given the affordability of handset-based mobile-
0 10 20 30 40 50 60 70 80 90 100
Dominican Rep.
Ecuador
Honduras
Colombia
Bolivia
Mexico
Paraguay
El Salvador
Panama
Peru
Brazil
Turkey
Costa Rica
Malaysia
Chile
Hungary
Uruguay
Netherlands
Russian Federation
Slovakia
Spain
Greece
Czech Republic
Denmark
Norway
Austria
Iceland
Sweden
Finland
Switzerland
Australia
Poland
New Zealand
Canada
Italy
United Kingdom
France
Slovenia
Estonia
Portugal
Belgium
Ireland
Germany
United States
% population
Price < 5% equivalized income
Price 5%-10% equivalized income
Price 10%-20% equivalized income
Price >20% equivalized income
0 10 20 30 40 50 60 70 80 90 100
Angola
Mauritania
Senegal
Malawi
Madagascar
Togo
Zambia
Rwanda
Nigeria
Swaziland
Uganda
Bangladesh
Burkina Faso
Côte d'Ivoire
Kyrgyzstan
Mali
Armenia
Egypt
Nepal
Philippines
Sudan
South Africa
Ukraine
Georgia
Fiji
Thailand
Belarus
Sri Lanka
Cambodia
Kazakhstan
TFYR Macedonia
Serbia
Romania
Jordan
Albania
Moldova
Azerbaijan
Tunisia
Montenegro
Lithuania
Croatia
% population
Price < 5% equivalized
expenditure
Price 5%-10% equivalized
expenditure
Price 10%-20% equivalized
expenditure
Price >20% equivalized
expenditure
Chapter 4. ICT prices and the role of competition
152
broadband services: although they represent less than 5 per cent of the equivalized household expenditure for half of the inhabitants in the country, who could thus afford to have one subscription per household member, mobile-broadband penetration remains below 10 per cent. Considering the high mobile-cellular penetration in both countries, this suggests they are in a good position to see an increase in mobile-broadband adoption in the coming years.
Data for the Arab States are limited to four countries. In Tunisia and Jordan, individual handset-based mobile-broadband subscriptions are affordable for a majority of the population. Nevertheless, income inequalities in these two countries mean that individual mobile-broadband plans would be somewhat unaffordable (i.e. represent more than 5 per cent of household expenditure) for the poorest 20 per cent of the population, who may thus need to share a mobile-broadband plan with other members of their household. In Egypt and Sudan, the cost of a mobile-broadband plan corresponds to more than 10 per cent of equivalized household expenditure for more than half of the population. Taking into consideration that these two countries had mobile-broadband penetrations of around 30 per cent by end 2013, mobile-broadband uptake could be held back if income inequalities persist.
Africa is the region where a prepaid handset-based mobile-broadband plan with a 500 MB monthly allowance is the least affordable in the light of household expenditure. In South Africa, the African country where prices are most affordable, they still correspond to more than 10 per cent of equivalized household expenditure for 70 per cent of inhabitants. This means that only the richest 30 per cent of the population could afford to have a handset-based mobile-broadband subscription for each member of the household, whereas the remaining 70 per cent of the population could not afford to have an individual subscription. For the other African countries included in the comparison, prices are unaffordable for a higher proportion
of the population, suggesting that in almost all households handset-based mobile-broadband subscriptions would need to be shared. This is consistent with mobile-broadband penetrations in these countries, which were all below 30 per cent by end 2013. It highlights that low household income and expenditure constitute major barriers for increasing mobile-broadband adoption in many African countries.
On the basis of the data presented, it can be concluded that income inequality does not only have an impact on the proportion of households within a country that have access to mobile-broadband services, but in some cases also determines whether individuals can afford their own subscription or have to share a subscription within the household. In some developing countries, the richest households may have the means to pay for individual handset-based mobile-broadband subscriptions, while the rest may share the subscription with other members of the household. As a result, affordability may also explain different patterns of use of mobile-broadband services across developing countries, and income inequality similar differences within countries. Thus, mobile-broadband usage patterns may not only be determined by cultural and user preferences, but also by affordability.
4.5 The impact of competition and regulation on telecommunication prices
The impact of ICTs as development enablers depends on access to ICT services and the use that is made of them (see Figure 2.1). In turn, both access to and use of ICTs are determined to a large extent by the affordability of ICT services. Therefore, the ultimate goal of policy and regulatory interventions in the sector is often to bring about a sustainable reduction in the prices of ICT services, and in many cases this is achieved through regulatory actions to promote competition, such as mandating local-loop unbundling or granting

153
Measuring the Information Society Report 2014
a licence to a new entrant in the mobile-cellular market. This section presents a quantitative analysis of the role of competition and regulation in shaping prices for mobile-cellular (voice and SMS) and fixed-broadband services. Among all ICT services, mobile cellular and fixed broadband have been selected for the analysis because of the availability of comprehensive data series on the prices for these two services, which makes it possible to study the impact of different factors on prices across countries and time.
There is an extensive body of literature looking at the effects of competition and regulation on ICT adoption.41 However, research is more limited when it comes to analysing the impact of competition and regulation on prices, and is often limited in scope because of lack of data for developing countries. Quantitative studies are in several cases restricted to samples of EU and OECD countries, or else to subregional and country case studies. This section aims to contribute to closing the gap in terms of quantitative analysis in order to support evidence-based policy-making in developing countries, by using ITU price and regulatory data for up to 144 countries in the period 2008-2013. Including such a large set of countries in the sample, most of them from the developing world, makes it possible to formulate some genuine global conclusions on the links between competition, regulation and telecommunication prices, based on a worldwide representative sample, and to check to what extent the quantitative results based on telecommunication data from EU, OECD and specific countries hold true in a global context. On the other hand, extending the number of countries included in the analysis has the trade-off of restricting the length of the time series and the level of detail of the indicators, since data availability and comparability for such a large number of countries is more limited. Therefore, more specific quantitative results, such as the impact of a specific regulatory intervention on telecommunication prices (e.g. mandating infrastructure sharing or granting a new licence), lie beyond the scope of this analysis.
Overview of the links between regula-tion, competition and pricesThe fall in telecommunication prices in the last decade, and in the period analysed in this chapter (2008-2013), is linked to several factors, including technological progress and standardization, which have made more efficient network infrastructure available at lower cost.42 A pivotal element for ensuring that lower costs are passed on in terms of lower prices for customers is competition. In recent decades, there has been a global trend towards the liberalization of telecommunication services and the privatization of incumbent operators. In parallel, national regulators have been created to establish a level playing field and monitor the liberalized electronic communication markets (ITU, 2013b). Regulators have thus become the custodians of competition in telecommunication services at the country level.
From the literature on cross-national institutional analysis, there is a broad consensus on the importance of institutional soundness and its links to the performance of capital-intensive industries like telecommunications.43 A country’s institutional endowment determines the scope for arbitrary administrative discretion, the legal certainty necessary for investors and, through this, the performance of regulated industries.44 Various industry performance indicators have been reported to correlate with improved regulatory governance, including prices and adoption levels.45
These findings help shape the conceptual framework for the econometric models presented in this section (Figure 4.2). Competition directly affects prices in markets where retail prices are deregulated, such as the majority of mobile-cellular and fixed-broadband markets. Regulatory and policy action can also have a direct impact on retail prices, as is the case with some entry-level fixed-broadband plans in Brazil and Uruguay that have been created as part of the broadband strategies implemented in these countries.46 Regulators can also intervene

Chapter 4. ICT prices and the role of competition
154
indirectly on retail prices through wholesale price regulation, such as for instance by regulating mobile termination rates, as happens in most countries.47
Regulation also affects the level of competition in each market, for instance by dictating the number of licences issued in mobile-cellular markets or by limiting foreign participation in fixed-line operators. In addition, regulation is a significant part of the institutional framework that affects telecommunication markets. Thus, it can contribute to creating legal certainty and a level playing field, which are important drivers for investment and competition. In addition, regulation can promote efficiency, e.g. infrastructure and spectrum efficiency, which may help to drive prices down.
For the purpose of the analysis carried out in this section, the impact of the regulatory environment on prices is measured as the combination of the effects of the regulator’s autonomy, enforcement power, mandate and regime (i.e. 2 in Figure 4.2). The direct impact of regulation on competition (i.e. 3 in Figure 4.2) is not considered, as it cannot be separated
Figure 4.2: Relationship between regulation, competition and prices
Source: ITU.
from the effects of competition on prices (i.e. 1 in Figure 4.2), which are accounted for by the variables on competition.
Market competition is one of the main drivers of affordable prices in telecommunication services. Chart 4.21 shows the evolution of average entry-level fixed-broadband prices and competition. The latter is measured using the Herfindahl-Hirschman Index (HHI) for the fixed-broadband market. The HHI is a measure of market concentration, and is calculated as the sum of the squared market shares (in terms of number of subscriptions) of each Internet service provider (ISP). The result ranges from 0 (perfect competition) to 1 (no competition, with only one operator in the market). The fall in entry-level fixed-broadband prices coincides with an increase in competition in the period 2008-2013. Chart 4.22 shows the evolution of entry-level prices and competition in mobile-cellular markets, where the decline in prices during the period 2008-2013 has also coincided with an increase in competition.
These simple descriptive statistics do not necessarily mean, however, that there is a causal
Competition
Regulatory environment
Institutional framework
Prices
Autonomy, enforcement power, mandate and regime of the regulator Retail and wholesale price regulation
2
Competition & foreign participation allowed by regulation
3 Impact of market competition on prices
1
Legal certainty Level playing field Efficient regulation
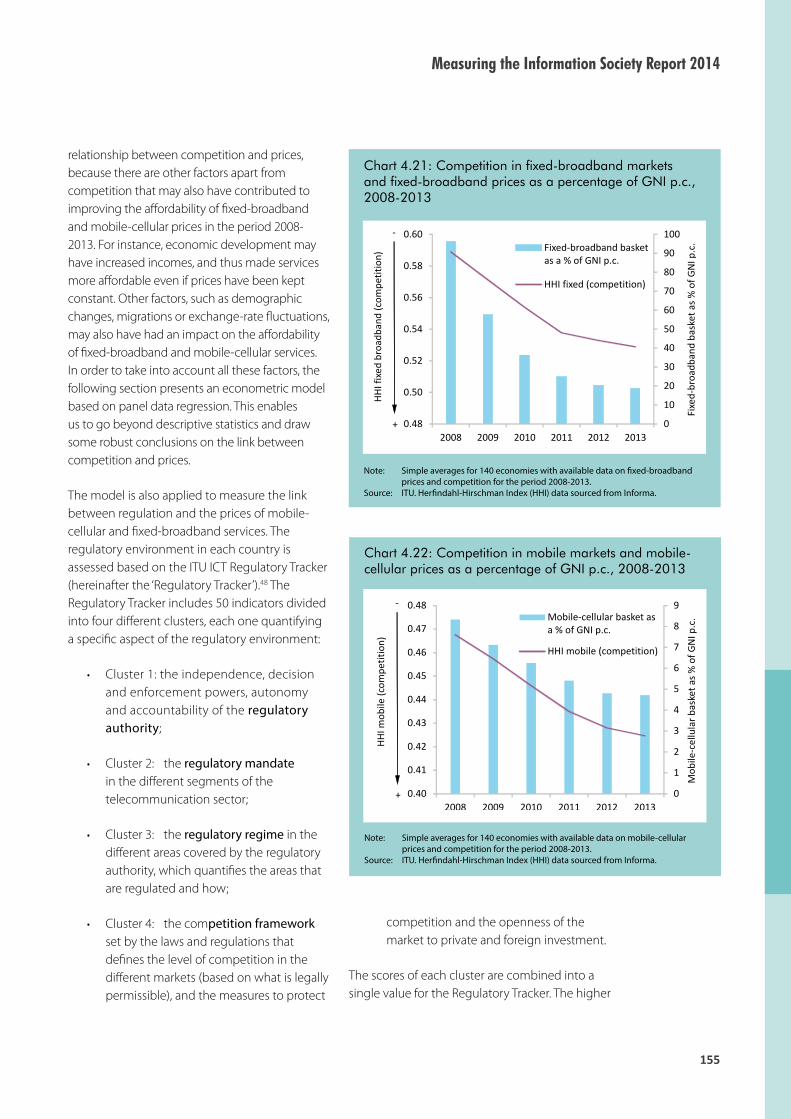
155
Measuring the Information Society Report 2014
Chart 4.21: Competition in fixed-broadband markets and fixed-broadband prices as a percentage of GNI p.c., 2008-2013
Note: Simple averages for 140 economies with available data on fixed-broadband prices and competition for the period 2008-2013.
Source: ITU. Herfindahl-Hirschman Index (HHI) data sourced from Informa.
Chart 4.22: Competition in mobile markets and mobile-cellular prices as a percentage of GNI p.c., 2008-2013
Note: Simple averages for 140 economies with available data on mobile-cellular prices and competition for the period 2008-2013.
Source: ITU. Herfindahl-Hirschman Index (HHI) data sourced from Informa.
competition and the openness of the market to private and foreign investment.
The scores of each cluster are combined into a single value for the Regulatory Tracker. The higher
relationship between competition and prices, because there are other factors apart from competition that may also have contributed to improving the affordability of fixed-broadband and mobile-cellular prices in the period 2008-2013. For instance, economic development may have increased incomes, and thus made services more affordable even if prices have been kept constant. Other factors, such as demographic changes, migrations or exchange-rate fluctuations, may also have had an impact on the affordability of fixed-broadband and mobile-cellular services. In order to take into account all these factors, the following section presents an econometric model based on panel data regression. This enables us to go beyond descriptive statistics and draw some robust conclusions on the link between competition and prices.
The model is also applied to measure the link between regulation and the prices of mobile-cellular and fixed-broadband services. The regulatory environment in each country is assessed based on the ITU ICT Regulatory Tracker (hereinafter the ‘Regulatory Tracker’).48 The Regulatory Tracker includes 50 indicators divided into four different clusters, each one quantifying a specific aspect of the regulatory environment:
• Cluster 1: the independence, decision and enforcement powers, autonomy and accountability of the regulatory authority;
• Cluster 2: the regulatory mandate in the different segments of the telecommunication sector;
• Cluster 3: the regulatory regime in the different areas covered by the regulatory authority, which quantifies the areas that are regulated and how;
• Cluster 4: the competition framework set by the laws and regulations that defines the level of competition in the different markets (based on what is legally permissible), and the measures to protect
0
10
20
30
40
50
60
70
80
90
100
0.48
0.50
0.52
0.54
0.56
0.58
0.60
2008 2009 2010 2011 2012 2013
Fixed-broadband basket
as a % of GNI p.c.
HHI fixed (competition)
+
-
HH
I fi
xed
bro
ad
ba
nd
(co
mp
eti
tio
n)
Fix
ed
-bro
ad
ba
nd
ba
ske
t a
s %
of
GN
I p
.c.
+
-
HH
I m
ob
ile
(co
mp
eti
tio
n)
Mo
bil
e-c
ell
ula
r b
ask
et
as
% o
f G
NI
p.c
.
0
1
2
3
4
5
6
7
8
9
0.40
0.41
0.42
0.43
0.44
0.45
0.46
0.47
0.48
2008 2009 2010 2011 2012 2013
Mobile-cellular basket as
a % of GNI p.c.
HHI mobile (competition)

Chapter 4. ICT prices and the role of competition
156
the value, the more conducive the regulatory environment to ICT developments. For the analyses in this section, data from the Regulatory Tracker have been extracted for clusters 1, 2 and 3, and combined into a single value per country per year (Figure 4.3). Cluster 4 is excluded because it is directly linked to competition, which is already considered in the models through a specific variable on competition (i.e. the HHI). The combined value of clusters 1 to 3 is used to test the link between regulation and prices of mobile-cellular and fixed-broadband services.
Choice of the modelThe analysis was conducted through econometric modelling using panel regressions for up to 144 countries based on data for the five-year period from 2008 to 2013.
Panel data regression is a statistical technique which is used to assess how variations in a set of variables over a given time period relate to
Figure 4.3: Composition of the variable measuring the regulatory environment
Source: ITU.
the changes in a variable that is modelled as the dependent variable. Panel regressions minimize problems of omitted variable bias (the omission of important variables) and multicollinearity (the co-variations of variables modelled as independent).
In addition, panel regressions have the advantage of discounting known and unknown region fixed effects. These are structural geographic conditions which generally hold constant over the time period examined, such as, for instance, similar pricing strategies of transnational operators present in one region, and common institutional frameworks that go beyond telecommunication regulation (e.g. the European Union acquis).49 Such background fixed effects may be important for each region, but they do not enter into the variations studied across the observations as they hold constant for each region. In a similar way, the year-specific fixed effects are also considered. For instance, high volatility in the exchange rates from one year to another could have an
REGULATORY VARIABLE
CLUSTER 1 CLUSTER 2 CLUSTER 3
15. National plan that involves broadband
14. Individual users allowed to use VoIP
13. Mobile number partability implemented
12. Fixed number portability implemented
11. Bang migration allowed
10. Secondary trading allowed
9. Unbundled access to the local loop required
8. Co-location/site sharing mandated
7. Infrastructure sharing mandated
6. Infrastructure sharing for mobile operators allowed
5. QoS monitoring required
4. Interconnection prices made public
3. Required Reference Interconnecion Offer (RIO)
2. Licence exempt
1. Types of licences provided
Regulatory regime
10. Existence of competition authority
9. Appeals to decisions
8. Dispute resolution mechanism
7. Sanctions or penalties imposed by regulator
6. Enforcement power
5. Public consultations mandatory before decisions
4. Percentage of diversified funding
3. Accountability
2. Autonomy in decision making
1. Separate telecom/ICT regulator
Regulatory authority
11. Tariff info, consumer education & complaints
10. IT
9. Internet content
8. Broadcasting content
7. Broadcasting (radio and TV transmission)
6. Universal service/access
5. Spectrum monitoring and enforcement
4. Radio frequency allocation and assignment
3. Interconnection rates and price regulation
2. Licencing
1. QoS measures and monitoring
Entity in charge of:
Regulatory mandate
+ +
=

157
Measuring the Information Society Report 2014
impact on prices in USD, but this would be discounted based on the variation in the year fixed effects.
The model described in Box 4.2 was developed to test linear correlations between fixed-broadband and mobile-cellular prices and competition and regulation metrics, using panel regressions with fixed effects.
Prices for fixed-broadband and mobile voice services are modelled as two separate variables, as they follow distinctly separate patterns – fixed broadband has generally become subject to competition much later than mobile services and penetration levels are significantly lower for fixed broadband, especially in the developing world.
Final prices reflect a number of parameters that characterize a telecommunication market and are often the result of the simultaneous effects of technology choices, competition and regulation. At the same time, parameters like economic development, local geography, institutional quality, usage characteristics and others may also affect final pricing. The following explanatory variables have been retained in the model:
• It is well established that prices of telecommunication services vary with levels of economic development. Therefore, gross national income per capita (GNI p.c.) is included in the model to control for the differences in economic resources that play a role in shaping prices.
• The deployment of telecommunication networks requires large investments that operators evaluate depending on the demand for the service and the specific business case in each geographic area. The marginal cost of service provision in dense urban centres is often much lower than that in remote villages, pointing to the different cost per subscriber in urban
and rural areas, as well as in dense and sparse agglomerations. These constraints are taken into account in the econometric model by including as a control variable the percentage of population living in urban areas.
• The degree of competition for the fixed-broadband and mobile-cellular markets is captured through the Herfindahl-Hirschman Index (HHI), which is a measure of market concentration. On the basis of the HHI, a few strong players may provide more competition than several small competitors. For instance, a mobile-cellular market with three players with one-third market share each would be more competitive (i.e. have a lower HHI) than a market with a dominant operator holding 60 per cent of the market and four additional operators with 10 per cent market share each. To test whether different degrees of market concentration have an impact on prices, the HHI is included in the econometric model.
• A regulatory variable is constructed on the basis of the Regulatory Tracker and considered as a proxy for the soundness of the regulatory framework in each country. This variable is included in the model in order to evaluate the effects of regulation on prices.
• Fixed-broadband prices collected by ITU are based on a minimum set of features: at least 256 kbit/s download speed and 1 GB of data allowance included per month. However, entry-level fixed-broadband plans in several countries offer higher speeds and larger data allowances. In order to measure how these enhanced features affect prices, a variable on fixed-broadband speed and another one on capped data allowances are included as controls in the model for fixed-broadband prices.

Chapter 4. ICT prices and the role of competition
158
Box 4.2: Panel regression models for fixed-broadband and mobile-cellular prices
Two models are used for the regressions: one for fixed-broadband prices and another for mobile-cellular prices (voice and SMS). Both models test variations between prices and a number of variables for up to 144 countries over the five-year period from 2008 to 2013 using ordinary least squares (OLS) estimation.
For i=1,…,n and t=1,..,T, where Pit is the dependent variable (fixed-broadband or mobile-cellular prices) in country i and year t; α is the constant of the estimation; Χit is the vector of explanatory variables described below for country i and year t; β is the vector of coefficients that quantify the effects that the explanatory variables have on Pit; γrt stands for the unobserved region and year fixed effects. These binary variables control for effects that are not explicitly accounted for in the Χit vector and correlate with a specific region and year. Essentially this component absorbs part of the unaccounted effects that would otherwise bias the coefficients β. Finally εit stands for an idiosyncratic error term. The dependent and independent variables are modelled using natural logarithms, except the dummy variables.
1. Dependent variables:
Fixed-broadband prices: This is the first dependent variable and represents the price by country and year for an entry-level fixed-broadband service in current USD. Data collected by ITU, see Annex 2 for more details on the methodology for the collection of fixed-broadband prices.
Mobile-cellular prices: This is the second dependent variable and represents the price by country and year for a low-user basket of mobile-cellular calls and SMS in current USD. Data collected by ITU, see Annex 2 for more details on the methodology for the collection of mobile-cellular prices.
Descriptive statistics of the dependent variables:
Average Standard deviation Minimum Maximum
2008 2013 2008 2013 2008 2013 2008 2013
Fixed-broadband prices 77.4 26.1 204.8 16.7 4.0 2.9 1718.8 108.5
Mobile-cellular prices 22.1 16.4 13.9 10.4 2.8 0.9 75.4 48.3
2. Explanatory variables
GNI p.c. – Gross national income per capita in current USD by year and country, as reported by the World Bank.
% urban population – Percentage of the population living in urban areas, as defined by national statistical offices (NSOs), and published by the World Bank.
Herfindahl-Hirschman Index for fixed broadband:
with Ci being the number of fixed-broadband subscriptions of Internet Service Provider (ISP) i, and TC the total number of fixed-broadband subscriptions in the country. It is the sum of the squared market shares of each ISP calculated in terms of subscriptions. This index ranges from to 1, where m is the total number of ISPs in the market. The higher the value, the more the market is concentrated, i.e. higher HHI values indicate less competition and, conversely, lower HHI values indicate more competition. Data sourced from Informa.
Herfindahl-Hirschman Index for mobile cellular (voice and SMS):
with Li being the number of mobile-cellular subscriptions of firm i, and TL he total number of mobile-cellular subscriptions in the country. It is the sum of the squared market shares of each mobile-cellular service provider calculated in terms of subscriptions. As in the case of the HHI for fixed broadband, this ranges from to 1, where k is the total number of mobile-cellular service providers in the market. Data sourced from Informa.

159
Measuring the Information Society Report 2014
Box 4.2: Panel regression models for fixed-broadband and mobile-cellular prices (continued)
Regulatory variable: The combined values of clusters 1 to 3 of the ITU ICT Regulatory Tracker. The Regulatory Tracker is an aggregate benchmark of each country’s legal and regulatory frameworks using as a reference internationally recognized regulatory best practices. The following three clusters are used for the analysis:
Score of cluster 1: Regulatory authority
Score of cluster 2: Regulatory mandate
Score of cluster 3: Regulatory regime
The scores of each cluster are combined into a single value for the regulatory variable, ranging from 0 to 72, 72 being the most effective regulatory environment to foster ICT developments. Data collected by ITU, see www.itu.int/tracker for more information.
Fixed-broadband speed: Speed of the entry-level fixed broadband plan in Mbit/s. Data collected by ITU.
Fixed-broadband cap: Dummy variable that takes the value of 1 if the fixed-broadband plan includes a cap in the monthly data allowance, and 0 otherwise. Data collected by ITU.
Descriptive statistics of the dependent variables:
Average Standard deviation Minimum Maximum
2008 2013 2008 2013 2008 2013 2008 2013
GNI p.c. 14’707 16’439 18’813 20’521 370 440 85’580 102’610
Urban % 58.4 60.1 22.3 22.1 12.9 14.2 100 100
HHI fixed broadband 0.57 0.53 0.29 0.28 0.13 0.13 1.00 1.00
HHI mobile cellular 0.46 0.41 0.16 0.14 0.17 0.15 1.00 1.00
Regulatory variable 44.8 52.4 12.7 10.9 3.5 9 62 67.5
Fixed-broadband speed (Mbit/s) 1.0 5.2 1.5 9.9 0.25 0.25 8.2 50
Fixed-broadband cap (1=cap; 0=no cap) 0.23 0.36 0.43 0.48 0 0 1 1
All variables modelled as independent are weakly correlated among themselves, except GNI p.c. and percentage of urban population, which have a correlation coefficient of 0.63 (i.e. about 40 per cent of the variation of one variable can be explained by the variation of the other one). This does not affect the explanatory power of the overall model. However, it means that the impact of different levels of GNI p.c. and percentages of urban population on prices may be mixed in the results, and this needs to be considered when analysing the explanatory power of each of these two variables.
Note: Descriptive statistics calculated for 124 economies that have complete data for the two models. Source: ITU.
Results for fixed broadbandThe panel regression model for fixed-broadband prices has a medium explanatory power (an R-squared value of 0.41, where 1 represents a perfect fit of the model with the observations), and all the variables included are statistically significant except fixed-broadband speed (Table 4.13).
Competition in the market as measured by HHI is significantly correlated to prices, and the sign
indicates that increased competition reduces prices. The model suggests that changing from two ISPs with 50 per cent market share each to three ISPs with 33 per cent market share each is linked to a reduction in prices of 5.8 per cent, other things being equal. Adding more operators is correlated with further reductions in prices, although the magnitudes of the reductions diminish: a 4.2 per cent reduction when moving from three to four ISPs; and 3.2 per cent when moving from four to five ISPs (assuming in all cases

Chapter 4. ICT prices and the role of competition
160
equal market shares for all ISPs in the market). The presence of fringe competitors would have a much smaller effect on prices: in a market with only two ISPs with equal market shares, the entry of a third ISP securing 10 per cent of the total market share would be correlated with a price drop of 2.7 per cent. This is less than half of the price reduction that would be achieved if the new operator obtained a third of the total market share. This is due in part to the nature of the HHI, which gives more weight to few competitors with large market shares than many with smaller market shares. A more detailed analysis would be necessary to determine to what extent small but disruptive operators may have an impact on prices.
By end 2013, fixed-broadband markets in developing countries were on average more concentrated than in developed countries (mean HHIs of 0.63 and 0.31, respectively);50 in other words, competition was not as strong in the developing world. According to the results of the econometric model, if fixed-broadband markets
in developing countries were to achieve the competition levels of developed countries, entry-level fixed-broadband prices could be reduced by as much as 10 per cent in the developing world. The effects of competition on prices could be particularly beneficial in the 21 developing countries that by end 2013 still had no competition in fixed-broadband services. Indeed, if the fixed-broadband market were liberalized in these countries and a second operator achieved 20 per cent of the market share, entry-level prices could go down as much as 5.5 per cent. Leaving aside four countries with very small populations and four small island states (where the specific geography and small population may justify the existence of a single operator),opening up the market to some competition in the remaining 13 developing economies would be a natural option with a view to boosting fixed-broadband penetration, which in all these countries is below 5 per cent.
Another important finding is that stronger regulatory frameworks (as measured by clusters
Table 4.13: Panel regression results, fixed-broadband prices and regulation
Variable Coefficient Statistical significance Interpretation
GNI p.c. 0.217 (0.034)
Highly significant (1% level)
A country with GNI p.c. of USD 11 000 is linked to prices 2.1% higher than a country with GNI p.c. of USD 10 000
Urban % -0.221 (0.107)
Highly significant (1% level)
A country with 55% urban population is linked to prices 2.1% lower than a country with 50% urban population
HHI fixed broadband 0.148 (0.051)
Highly significant (1% level)
A change from a duopoly to a triopoly (with operators holding equal market shares) is linked to prices 5.8% lower
Regulatory variable -0.447 (0.096)
Highly significant (1% level)
A 10% increase in the value of the regulatory variable is linked to a 4.2% drop in prices
Fixed-broadband cap -0.372 (0.052)
Highly significant (1% level)
Fixed-broadband plans with data caps are linked to prices 31% lower than unlimited plans
Fixed-broadband speed 0.016 (0.023) Not significant
Constant 4.304 (0.506)
Highly significant (1% level)
Year fixed effects YES Year fixed effects absorb annual effects not accounted for by the other variables
Region fixed effects YES Region fixed effects absorb regional specificities not accounted for by the other variables
Observations 801R-squared 0.408
Note: Robust standard errors in parentheses. The independent and the dependent variables are modelled using natural logarithms, except for the dummy variables (fixed-broadband cap, year fixed effects, region fixed effects).
Source: ITU.

161
Measuring the Information Society Report 2014
1-3 of the Regulatory Tracker) are linked to lower fixed-broadband prices.
In 2013, the sum of clusters 1-3 of the Regulatory Tracker was 59 on average in developed countries, compared with an average of 47 in developing countries.51 This suggests that regulation in developed countries was more effective than in developing countries, and therefore more conducive to lower prices. According to the results of the econometric model, if the regulatory framework in developing countries converged on that prevailing in developed countries, fixed-broadband prices could be reduced by as much as 9.7 per cent. This highlights the importance of an enabling regulatory environment for affordable fixed-broadband prices. Although there is no one-size-fits-all approach, international regulatory best practices, such as the ones adopted by the global community of regulators at meetings of the ITU Global Symposium for Regulators (GSR)52 and reflected in the ITU ICT Regulatory Tracker, may serve as a guideline for effective regulatory frameworks which can lay the foundations for affordable fixed-broadband services.
For instance, a country with a separate telecommunication/ICT regulator that has autonomy in decision-making, enforcement power, the right to impose sanctions or penalties and clear dispute-resolution mechanisms would have fixed-broadband prices 10.4 per cent lower than a country without these regulatory features, other things being equal.53 A strong regulatory framework creates legal certainty for the players in the market, and this in turn fosters competition and ultimately contributes to achieving lower fixed-broadband prices.
The analysis of the variables that affect fixed-broadband prices cannot be reduced to competition only. The results previously discussed are only valid if considered in combination with the other explanatory variables included in the model.
GNI per capita is an important variable because it controls for differences in economic
development between countries. This is a very strong factor in the setting of prices, because it determines to a great extent how much customers are willing to pay for a given service. In a country with high economic levels, there are potentially more customers who can pay more for the same service than in a country with low economic levels. According to the results of the econometric model, a country with a GNI p.c. of USD 11 000 is correlated with prices 2.1 per cent higher than a country with GNI per capita of USD 10 000, other things being equal. Since GNI p.c. is a variable that tends to change slowly with time and depends on many different factors that go well beyond the ICT sector, it should be considered as an explanatory factor when benchmarking prices of ICT services internationally, rather than as an area of direct policy action.
Similarly, there is also a significant linked between the percentage of the population living in urban areas and fixed-broadband prices: a higher percentage of urban population correlates with lower prices. Clearly, concentration of the population in areas that can be more easily covered by fixed-wired infrastructure benefits operators because it reduces deployment costs. The results of the econometric model show that a 5 per cent higher urban population (as could happen, for instance, owing to the migration of population from rural areas to large cities) would result in fixed-broadband prices 1.1 per cent lower. It needs to be taken into account that the percentage of urban population in a country is significantly correlated with GNI p.c., so that economies with higher percentage of urban population tend to have higher GNI p.c. This means that the effects of both variables cannot be isolated in practice, and therefore both should be considered together as explanatory factors for the base levels of prices in a given country.
The model also suggests that the application of data caps by fixed-broadband service providers is correlated with cheaper entry-level fixed-broadband plans, other things being equal. The ITU data collection considers a minimum of 1 GB

Chapter 4. ICT prices and the role of competition
162
monthly consumption for fixed-broadband plans. Once that requirement is met, the cheapest plan is selected irrespective of whether it includes a data cap of 1 GB or more, or allows unlimited traffic. In 2013, entry-level fixed-broadband plans included a data cap in 35 per cent of the countries included in the fixed-broadband model, a higher percentage than in 2008 (24 per cent). Other variables being equal, fixed-broadband prices are cheaper in countries where data caps were enforced in entry-level fixed-broadband plans. This suggests that operators can offer cheaper prices in exchange for reduced data consumption, thus indicating that capacity in fixed-broadband networks is still an issue in several countries, i.e. the marginal cost of additional Internet data beyond 1 GB is still non-negligible in many countries.
Finally, different entry-level fixed-broadband speeds are not found to have a significant impact on prices. Since entry-level plans offer speeds at the lower end of those available in each country,
this finding suggests that the starting speed offered in a country is not a determining factor for pricing; it may rather be the incremental speed offered for higher-end plans, which is priced as a premium. This is consistent with the strategies of several operators, which offered automatic upgrades of base speeds once networks are upgraded.54
Chart 4.23 provides an approximation of the explanatory power of each factor in the variations in fixed-broadband prices observed across countries in 2013. Values are calculated taking as a reference the average of each variable and evaluating the impact that a change equal to the standard deviation of that variable would have in terms of fixed-broadband prices, keeping all other factors constant. The results show that differences in fixed-broadband prices (in USD) across countries are largely explained by differences in GNI p.c. and in the percentage of urban population, since both variables are correlated. However, these two variables are differently correlated with prices, so they have opposite effects. A high percentage of urban population is associated with lower fixed-broadband prices because of the lower costs of deployment of wired networks, whereas higher GNI p.c. is associated with higher prices in USD because of higher purchasing power. The combination of these two variables may partially balance out and thus ultimately have a weaker final effect on prices.
Factors that are purely attributable to the ICT sector, such as operators’ strategies on data caps, competition in the fixed-broadband market and the ICT regulatory environment, may together be a greater determinant for fixed-broadband prices than the price difference explained by GNI p.c. and percentage of the population living in urban areas.
Based on the econometric model presented, it can be estimated that about 9 per cent of the variation in entry-level fixed-broadband prices across countries in 2013 was due to differences in the regulatory framework. Different levels
Chart 4.23: Variation in fixed-broadband prices (%) explained by each variable, 2013
Note: Calculated taking as a reference the average of each variable and adding a standard deviation. In each case, the percentage displayed is the relative difference in fixed-broadband prices that would be obtained keeping all other variables constant. The calculation does not take into consideration the region fixed effects. All variables are negatively correlated with prices (i.e. an increase in their value is linked to a decrease in prices), except GNI p.c., which is positively correlated with prices. GNI p.c. and % urban population are correlated, so the explanatory power of these variables needs to be considered together.
Source: ITU.
0
5
10
15
20
25
GNI p.c. Fixed-
broadband
cap
Regulation(clusters 1-3Regulatory
Tracker)
% urbanpopulation
Competition(HHI)
%

163
Measuring the Information Society Report 2014
of competition across countries are estimated to account for 6 per cent of the variations observed in prices. This provides a quantitative assessment of the benefits that competition and enabling regulation can bring to fixed-broadband markets, particularly in developing countries, as previously highlighted. Differences in fixed-broadband prices are not just a matter of economic and geographic divides, but also hinge on an adequate regulatory environment in the markets. It is therefore in the hands of policy-makers and regulators to set the conditions for more affordable fixed-broadband prices based on increased competition.
Results for mobile cellularThe results of the panel regression for mobile-cellular prices (voice and SMS) indicate that the model constructed has a medium explanatory power (an R-squared value of 0.41, where 1 represents a perfect fit) and all variables included are statistically significant (Table 4.14).
Competition in the market as measured by HHI is significantly correlated to prices, and the sign indicates that increased competition reduces
prices. For example, the model predicts that in a market with two mobile-cellular operators sharing the market equally, the entry of a new operator securing 10 per cent of the market is correlated with a 3.7 cent decrease in prices. If the new entrant achieved a 20 per cent market share, prices would be reduced by 6.4 per cent compared with the initial situation with only two operators, and by 7.7 per cent if the new entrant reached a 30 per cent market share. The presence of fringe competitors would have a much smaller effect on prices due to the nature of the HHI, which gives more weight to few competitors with large market shares than many with smaller market shares. A more detailed analysis would be necessary to determine to which extent small but disruptive operators, such as mobile virtual network operators (MVNOs), may have an impact on prices.
Competition in mobile-cellular markets is stronger than in fixed-broadband markets, and differences in competition levels across mobile-cellular markets are on average smaller. Nevertheless, mobile-cellular markets in developing countries were on average more concentrated than in developed countries at end 2013 (mean HHI of 0.46 and 0.35, respectively).55
Table 4.14: Panel regression results, mobile-cellular prices and regulation
Variable Coefficient Statistical significance Interpretation
GNI p.c. 0.147 (0.024)
Highly significant (1% level)
A GNI p.c. of USD 11 000 is linked to prices 1.4% higher than a GNI p.c. of USD 10 000
Urban % -0.284 (0.071)
Highly significant (1% level)
A country with 55% urban population is linked to prices 2.7% cheaper than a country with 50% urban population
HHI mobile cellular 0.201 (0.082)
Significant (5% level)
A change from a duopoly to a triopoly (with operators holding equal market shares) is linked to prices 7.8% lower
Regulatory variable -0.080 (0.045)
Significant (10% level)
A 10% increase in the value of the regulatory variable is linked to a 0.8% drop in prices
Constant 0.675 (0.278)
Significant (5% level)
Year fixed effects YES Year fixed effects absorb annual effects not accounted for by the other variables
Region fixed effects YES Region fixed effects absorb regional specificities not accounted for by the other variables
Observations 805R-squared 0.409
Note: Robust standard errors in parentheses. The independent and the dependent variables are modelled using natural logarithms. Source: ITU.

Chapter 4. ICT prices and the role of competition
164
According to the results of the econometric model, if mobile-cellular markets in developing countries were to achieve the competition levels prevailing in developed countries, mobile-cellular prices could be reduced by up to 5 per cent in the developing world.
Regulation is also found to be correlated with mobile-cellular prices, but with a weaker coefficient than in the case of fixed-broadband services. The 10 per cent of countries with the lowest regulatory value are all (except one) from the developing world, and have an average regulatory value of 23 compared with a global average of 51. If measures such as making interconnection prices public, publishing reference interconnection offers (RIO), allowing infrastructure sharing for mobile operators, permitting secondary trading of spectrum, allowing band migration and implementing mobile number portability were implemented in these countries, the improvements in regulation could result in a 3 per cent decrease in prices.
This is a modest decrease when compared with the reduction in mobile-cellular prices that could be achieved in those developing countries with highly concentrated markets, i.e. with an HHI above 0.6, which means that there is a dominant operator holding more than 70 per cent of the market share. If the market share of the dominant operator were reduced to 50 per cent through the entry of new players or the consolidation of existing ones, so that there were at least three players in the market with more than a 10 per cent market share each, prices could be reduced by no less than 7 per cent. This highlights the benefits that stronger competition can have on mobile-cellular prices in highly concentrated markets.
The link between competition, regulation and prices in mobile-cellular markets discussed is only valid if considered in combination with the other explanatory variables included in the model.
As in the case of fixed-broadband, GNI per capita is an important variable because it controls for
differences in economic development between countries, and thus differences in purchasing power. For instance, the model predicts that, in a country with a GNI per capita of USD 11 000, prices are 1.4 per cent higher than in a country with a GNI p.c. of USD 10 000, other things being equal.
Urbanization is significantly related to final prices for mobile-cellular services: a 5 per cent increase in the percentage of the population in urban areas is correlated with prices 2.7 per cent cheaper. This may be explained by the fact that infrastructure deployment in sparse and rural areas is more costly than in dense urban areas. Urbanization and GNI p.c. are significantly correlated, and therefore the effects of both variables need to be considered together as a reference for comparisons across countries, so that the impact of regulation and competition on prices is assessed discounting the effects of these two variables.
Chart 4.24 provides an estimation of the explanatory power of each factor in the variations in mobile-cellular prices observed across countries in 2013. Differences in mobile-cellular prices across countries are smaller than the differences in fixed-broadband prices and, as a result, the impact of the different explanatory variables is smaller.
The variable that has the highest explanatory power is GNI p.c., which accounts for an estimated 13 per cent of the variations in mobile-cellular prices observed in 2013. As previously highlighted, GNI p.c. is correlated with the percentage of urban population, which also has a significant explanatory power (9 per cent of the differences). Since the effects of both factors on mobile-cellular prices are opposite, the impact of these variables may almost balance out and have a limited effect on prices. Compared with fixed-broadband prices, GNI p.c. has a weaker effect on the final price in the case of mobile-cellular services. This suggests that economic levels are less of a determinant, probably because prices were already low enough in 2008 (for a lower-

165
Measuring the Information Society Report 2014
user voice and SMS basket) to be affordable for most of the population and, it being a mature market, competition is a stronger determinant of pricing trends.
Different competition levels may account for an estimated 7 per cent of the differences in mobile-cellular prices observed across countries. Taking into consideration that differences in prices are smaller than in fixed-broadband services,56 this finding highlights the importance of competition as a driver for lower prices in mobile-cellular markets.
Regulation is found to have a weak explanatory power of only 2 per cent, suggesting that regulation is less of an issue in mobile-cellular markets. This may be because the regulation in place in most countries (e.g. regulation of mobile termination rates) already supports the development of competition in the market, since the degree of liberalization achieved in mobile-cellular markets is high when compared with that prevailing in fixed-broadband markets. In addition, the deployment of mobile networks tends to be less capital-intensive than the deployment of fixed-broadband networks, and disruptive players, such as MVNOs, may enter a market with relatively low upfront capital investments, and yet enjoy a stronger position than resellers have in fixed-broadband markets. This could explain the dynamism observed in mobile-cellular markets, and why light-touch regulation and a liberal spectrum assignment approach may already be conducive to competition and lower prices in mobile-cellular services, whereas in fixed-broadband markets stronger regulatory action may be needed because essential facilities – such as the local loop or the international gateway – may be controlled by the incumbent.
Conclusions On the basis of the results of the model presented in this section, it is possible to draw the following overall conclusions on the
Chart 4.24: Variation in mobile-cellular prices (%) explained by each variable, 2013
Note: Calculated taking as a reference the average of each variable and adding a standard deviation. In each case, the percentage displayed is the relative difference in mobile-cellular prices that would be obtained keeping all other variables constant. The calculation does not take into consideration the region fixed effects. All variables are negatively correlated with prices (i.e. an increase in their value is linked to a decrease in prices), except GNI p.c., which is positively correlated with prices. GNI p.c. and % urban population are correlated, so the explanatory power of these variables needs to be considered together.
Source: ITU.
impact of competition and regulation on fixed-broadband and mobile-cellular prices:
• Fixed broadband: Different regulation may account for almost 10 per cent of the differences in prices observed across countries. This highlights the importance of considering international best practices as a guide for implementing regulatory actions that promote efficiency, legal certainty and a level playing field for all operators. Different competition levels may explain around 6 per cent of the differences in prices observed across countries. This confirms that competition plays an important role in determining prices in fixed-broadband markets. Another factor that is found to be relevant in fixed-broadband prices is the existence of data caps, which is correlated with lower prices. This may indicate that fixed-broadband capacity may still be an issue in several countries,
%
0
2
4
6
8
10
12
14
GNI p.c. % urban
population
Competition (HHI) Regulation
(clusters 1-3
Regulatory
Tracker)
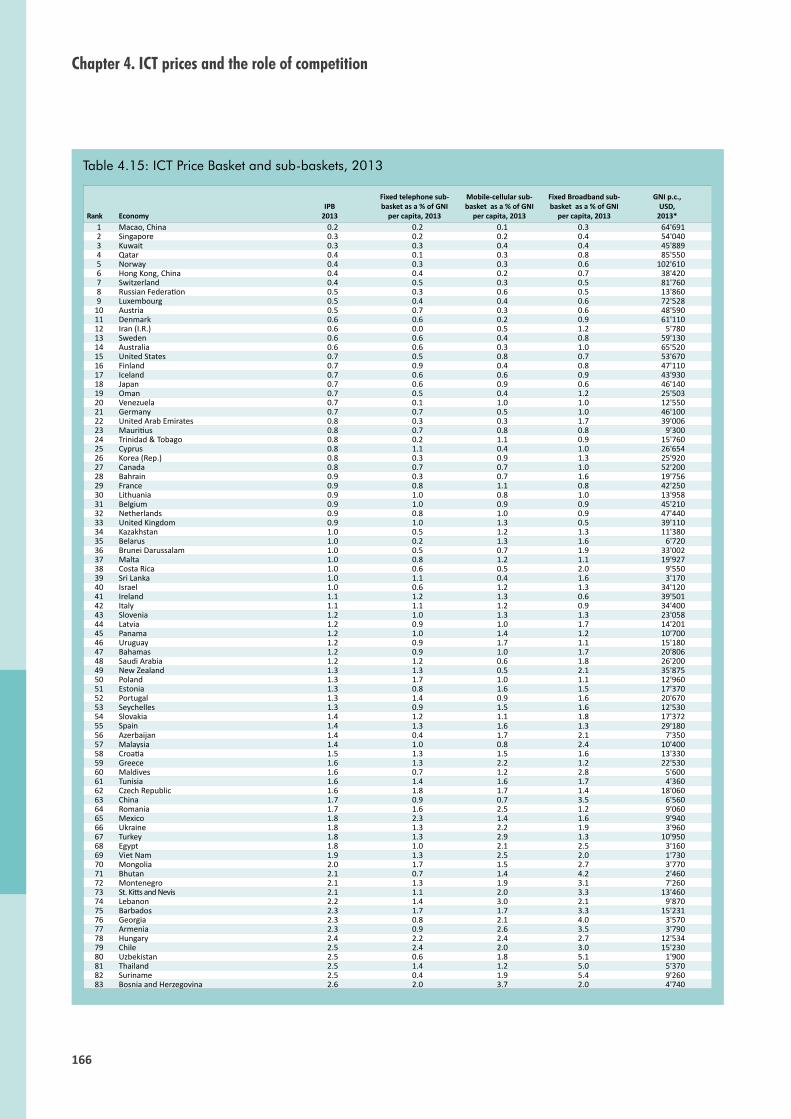
Chapter 4. ICT prices and the role of competition
166
Table 4.15: ICT Price Basket and sub-baskets, 2013
Rank EconomyIPB
2013
Fixed telephone sub-basket as a % of GNI
per capita, 2013
Mobile-cellular sub-basket as a % of GNI
per capita, 2013
Fixed Broadband sub-basket as a % of GNI
per capita, 2013
GNI p.c., USD,
2013*1 Macao, China 0.2 0.2 0.1 0.3 64'6912 Singapore 0.3 0.2 0.2 0.4 54'0403 Kuwait 0.3 0.3 0.4 0.4 45'8894 Qatar 0.4 0.1 0.3 0.8 85'5505 Norway 0.4 0.3 0.3 0.6 102'6106 Hong Kong, China 0.4 0.4 0.2 0.7 38'4207 Switzerland 0.4 0.5 0.3 0.5 81'7608 Russian Federation 0.5 0.3 0.6 0.5 13'8609 Luxembourg 0.5 0.4 0.4 0.6 72'528
10 Austria 0.5 0.7 0.3 0.6 48'59011 Denmark 0.6 0.6 0.2 0.9 61'11012 Iran (I.R.) 0.6 0.0 0.5 1.2 5'78013 Sweden 0.6 0.6 0.4 0.8 59'13014 Australia 0.6 0.6 0.3 1.0 65'52015 United States 0.7 0.5 0.8 0.7 53'67016 Finland 0.7 0.9 0.4 0.8 47'11017 Iceland 0.7 0.6 0.6 0.9 43'93018 Japan 0.7 0.6 0.9 0.6 46'14019 Oman 0.7 0.5 0.4 1.2 25'50320 Venezuela 0.7 0.1 1.0 1.0 12'55021 Germany 0.7 0.7 0.5 1.0 46'10022 United Arab Emirates 0.8 0.3 0.3 1.7 39'00623 Mauritius 0.8 0.7 0.8 0.8 9'30024 Trinidad & Tobago 0.8 0.2 1.1 0.9 15'76025 Cyprus 0.8 1.1 0.4 1.0 26'65426 Korea (Rep.) 0.8 0.3 0.9 1.3 25'92027 Canada 0.8 0.7 0.7 1.0 52'20028 Bahrain 0.9 0.3 0.7 1.6 19'75629 France 0.9 0.8 1.1 0.8 42'25030 Lithuania 0.9 1.0 0.8 1.0 13'95831 Belgium 0.9 1.0 0.9 0.9 45'21032 Netherlands 0.9 0.8 1.0 0.9 47'44033 United Kingdom 0.9 1.0 1.3 0.5 39'11034 Kazakhstan 1.0 0.5 1.2 1.3 11'38035 Belarus 1.0 0.2 1.3 1.6 6'72036 Brunei Darussalam 1.0 0.5 0.7 1.9 33'00237 Malta 1.0 0.8 1.2 1.1 19'92738 Costa Rica 1.0 0.6 0.5 2.0 9'55039 Sri Lanka 1.0 1.1 0.4 1.6 3'17040 Israel 1.0 0.6 1.2 1.3 34'12041 Ireland 1.1 1.2 1.3 0.6 39'50142 Italy 1.1 1.1 1.2 0.9 34'40043 Slovenia 1.2 1.0 1.3 1.3 23'05844 Latvia 1.2 0.9 1.0 1.7 14'20145 Panama 1.2 1.0 1.4 1.2 10'70046 Uruguay 1.2 0.9 1.7 1.1 15'18047 Bahamas 1.2 0.9 1.0 1.7 20'80648 Saudi Arabia 1.2 1.2 0.6 1.8 26'20049 New Zealand 1.3 1.3 0.5 2.1 35'87550 Poland 1.3 1.7 1.0 1.1 12'96051 Estonia 1.3 0.8 1.6 1.5 17'37052 Portugal 1.3 1.4 0.9 1.6 20'67053 Seychelles 1.3 0.9 1.5 1.6 12'53054 Slovakia 1.4 1.2 1.1 1.8 17'37255 Spain 1.4 1.3 1.6 1.3 29'18056 Azerbaijan 1.4 0.4 1.7 2.1 7'35057 Malaysia 1.4 1.0 0.8 2.4 10'40058 Croatia 1.5 1.3 1.5 1.6 13'33059 Greece 1.6 1.3 2.2 1.2 22'53060 Maldives 1.6 0.7 1.2 2.8 5'60061 Tunisia 1.6 1.4 1.6 1.7 4'36062 Czech Republic 1.6 1.8 1.7 1.4 18'06063 China 1.7 0.9 0.7 3.5 6'56064 Romania 1.7 1.6 2.5 1.2 9'06065 Mexico 1.8 2.3 1.4 1.6 9'94066 Ukraine 1.8 1.3 2.2 1.9 3'96067 Turkey 1.8 1.3 2.9 1.3 10'95068 Egypt 1.8 1.0 2.1 2.5 3'16069 Viet Nam 1.9 1.3 2.5 2.0 1'73070 Mongolia 2.0 1.7 1.5 2.7 3'77071 Bhutan 2.1 0.7 1.4 4.2 2'46072 Montenegro 2.1 1.3 1.9 3.1 7'26073 St. Kitts and Nevis 2.1 1.1 2.0 3.3 13'46074 Lebanon 2.2 1.4 3.0 2.1 9'87075 Barbados 2.3 1.7 1.7 3.3 15'23176 Georgia 2.3 0.8 2.1 4.0 3'57077 Armenia 2.3 0.9 2.6 3.5 3'79078 Hungary 2.4 2.2 2.4 2.7 12'53479 Chile 2.5 2.4 2.0 3.0 15'23080 Uzbekistan 2.5 0.6 1.8 5.1 1'90081 Thailand 2.5 1.4 1.2 5.0 5'37082 Suriname 2.5 0.4 1.9 5.4 9'26083 Bosnia and Herzegovina 2.6 2.0 3.7 2.0 4'740

167
Measuring the Information Society Report 2014
Table 4.15: ICT Price Basket and sub-baskets, 2013 (continued)
Rank EconomyIPB
2013
Fixed telephone sub-basket as a % of GNI
per capita, 2013
Mobile-cellular sub-basket as a % of GNI
per capita, 2013
Fixed Broadband sub-basket as a % of GNI
per capita, 2013
GNI p.c., USD,
2013*84 India 2.6 1.9 2.2 3.7 1'57085 Antigua & Barbuda 2.7 1.2 1.8 5.1 12'91086 TFYR Macedonia 2.7 2.2 2.8 3.2 4'80087 Serbia 2.8 1.3 3.2 3.8 5'73088 Algeria 2.9 1.3 2.9 4.4 5'29089 Jordan 2.9 2.3 1.9 4.6 4'95090 Brazil 3.0 2.5 5.0 1.4 11'69091 Peru 3.0 2.4 2.4 4.1 6'39092 Colombia 3.1 2.7 3.4 3.1 7'56093 South Africa 3.2 3.3 3.4 2.9 7'19094 Bulgaria 3.2 1.9 5.7 1.9 7'03095 Ecuador 3.2 1.5 3.7 4.4 5'51096 Botswana 3.3 2.2 1.6 6.1 7'73097 Grenada 3.5 2.2 3.5 4.7 7'46098 Indonesia 3.5 1.3 2.3 6.9 3'58099 Jamaica 3.6 2.7 2.1 5.9 5'220
100 Dominican Rep. 3.6 3.2 2.9 4.5 5'620101 Morocco 3.6 0.9 5.2 4.7 3'030102 Bangladesh 3.8 3.5 1.9 5.9 900103 Gabon 3.8 5.7 2.2 3.4 10'650104 Moldova 3.8 0.2 5.0 6.2 2'460105 Dominica 3.9 2.1 3.0 6.7 6'760106 Guyana 4.0 1.0 3.2 7.8 3'750107 St. Vincent and the Grenadines 4.1 2.0 4.1 6.1 6'580108 Paraguay 4.2 2.5 3.6 6.3 4'040109 St. Lucia 4.2 2.3 4.2 6.1 7'090110 Albania 4.3 1.8 8.1 2.9 4'700111 Fiji 4.5 2.7 5.6 5.1 4'430112 Sudan 4.6 3.9 3.9 6.1 1'130113 El Salvador 4.8 3.5 5.8 5.1 3'720114 Namibia 4.9 2.0 2.1 10.6 5'840115 Cape Verde 5.8 3.6 10.4 3.5 3'630116 Pakistan 6.0 4.3 3.2 10.7 1'380117 Philippines 6.1 6.1 3.7 8.6 3'270118 Kyrgyzstan 6.2 1.3 5.4 11.9 1'200119 Nepal 6.4 4.4 4.4 10.4 730120 Honduras 6.5 3.5 7.5 8.6 2'180121 Guatemala 6.5 2.0 7.8 9.8 3'340122 Angola 6.9 3.9 4.7 12.2 5'010123 Lao P.D.R. 7.8 3.9 5.9 13.7 1'460124 Nigeria 7.9 3.2 2.8 17.6 2'760125 Equatorial Guinea 8.1 1.6 2.5 20.4 14'320126 Samoa 8.6 4.3 6.4 15.0 3'430127 Belize 8.8 5.4 8.1 12.9 4'660128 Cambodia 9.2 4.8 7.9 15.0 950129 Timor-Leste 9.2 6.6 4.7 16.4 3'580130 Bolivia 9.5 11.3 5.4 11.8 2'550131 Ghana 9.7 2.8 3.5 22.7 1'760132 Swaziland 10.3 2.0 6.6 22.2 3'080133 Marshall Islands 11.2 13.1 6.3 14.3 4'200134 Nicaragua 12.4 4.6 18.5 14.0 1'780135 Lesotho 13.6 8.1 12.5 20.0 1'550136 Micronesia 14.7 27.8 4.8 11.5 3'430137 Afghanistan 17.2 2.8 10.1 38.6 700138 Mauritania 19.4 18.7 16.0 23.7 1'060139 S. Tomé & Principe 20.1 6.7 10.3 43.4 1'470140 Côte d'Ivoire 21.0 17.2 14.1 31.7 1'380141 Ethiopia 22.1 2.2 8.8 55.1 470142 Kenya 22.2 16.8 5.0 44.8 930143 Vanuatu 22.5 16.0 9.9 41.6 3'130144 Tanzania 24.3 19.3 17.9 35.7 630145 Senegal 24.3 13.4 18.6 40.9 1'070146 Uganda 25.1 21.1 22.1 32.2 510147 Zambia 26.6 5.4 14.3 60.1 1'480148 Haiti 29.4 7.7 14.5 66.1 810149 Zimbabwe 29.5 14.9 29.8 43.9 820150 Cuba 30.0 0.0 4.3 85.8 6'014151 Cameroon 31.0 19.1 16.7 57.2 1'270152 Mozambique 34.4 26.6 25.9 50.7 590153 Kiribati 37.9 5.5 8.3 110.5 2'620154 Benin 39.0 19.4 20.9 76.9 790155 Rwanda 40.5 9.0 12.4 642.5 620156 Solomon Islands 40.5 8.2 13.2 202.1 1'610157 Papua New Guinea 41.3 7.8 16.1 266.0 2'010158 Burkina Faso 42.0 25.4 20.9 79.8 670159 Mali 42.1 14.2 26.5 85.6 670160 Burundi 47.5 5.9 36.6 220.5 280161 Eritrea 47.7 11.2 31.8 3909.8 490162 Togo 52.5 19.0 38.5 102.2 530163 Niger 59.3 43.4 34.4 176.2 410164 Central African Rep. 66.6 48.2 51.6 2193.6 320165 Madagascar 69.7 56.6 52.5 159.4 440166 Malawi 70.2 54.2 56.3 241.2 270
Note: * Data correspond to the GNI per capita (Atlas method) in 2013 or latest available year adjusted with the international inflation rates. Source: ITU. GNI p.c. and PPP$ values are based on World Bank data.

Chapter 4. ICT prices and the role of competition
168
and that policy-makers and regulators may need to look at the actions that can be taken to ease capacity bottlenecks. Based on the econometric model, it can be concluded that factors that are purely attributable to the telecommunication sector, such as operators’ strategies on data caps, competition in the fixed-broadband market and the ICT regulatory environment, are together more of a determinant for fixed-broadband prices than exogenous factors, such as overall levels of economic development. Thus, policy-makers and regulators can contribute significantly to setting the conditions for more affordable fixed-broadband prices, particularly in those developing countries where fixed-broadband prices remain unaffordable for the majority of the population.
• Mobile cellular: Differences in mobile-cellular prices across countries are smaller than the differences in fixed-broadband
prices, and competition is stronger in mobile-cellular markets. Different competition levels largely explain the differences in mobile-cellular prices observed across countries (an estimated 7 per cent), whereas differences in the regulatory environment have less of an impact in setting mobile-cellular prices, since regulation in most countries is already open enough to allow competition. Regulatory efforts should be focused on ensuring that higher levels of competition are achieved, particularly in those countries where dominant operators still hold market shares above 60 per cent, thus limiting the possible benefits that competition may yield in terms of more affordable prices for customers. Efficient spectrum allocation and assignment could allow the entry of new players or the consolidation of stronger alternative operators and thus help to spur competition in some markets, even if penetration levels are already high.

169
Measuring the Information Society Report 2014
1 Examples of international organizations that have specific programmes in the area of income inequality include IMF (http://www.imf.org/external/np/fad/inequality), OECD (http://www.oecd.org/social/inequality.htm) and the World Bank (http://www.worldbank.org/en/topic/isp).
2 For example, if country A and country B have the same price in USD for any given ICT service, but in country A prices of other products are in general cheaper (in USD), then applying PPP exchange rates to the price of the ICT service in country A will make this service more expensive. That is so because, compared to country B, in country A the same amount of USD (exchanged into national currency at market exchange rates) can buy more products or services. Therefore, the ICT service in country A is more expensive in terms of what could be bought with that amount in each country. The International Comparison Program (ICP) is the major global initiative to produce internationally comparable price levels. For more information on the PPP methodology and data, see http://icp.worldbank.org.
3 GNI takes into account all production in the domestic economy (i.e. GDP) plus the net flows of factor income (such as rents, profits and labour income) from abroad. The Atlas method smooths exchange-rate fluctuations by using a three-year moving average, price-adjusted conversion factor. See: http://data.worldbank.org/indicator/NY.GNP.PCAP.CD.
4 Voice over Internet services, such as Skype or VoipBuster, are excluded from the analysis in this section because they require an Internet connection and do not have a guaranteed quality of service. They are considered under broadband services.
5 Source: Census of India 2011. Mode of communication 2001-2011. Available at: http://censusindia.gov.in/2011census/hlo/Data_sheet/India/Communication.pdf.
6 Prices for each service are calculated on the basis of a low-user basket that defines the number of calls, minutes and SMS (in the case of mobile-cellular plans) that are consumed per month. For more information on the baskets and the price-collection methodology, see Annex 2.
7 Prepaid handset-based mobile-broadband plans were only available in 122 out of the 140 countries included in the comparison with the other telecommunication services. Therefore, the average for handset-based mobile-broadband prices provides only an indication, and is not strictly comparable with the other averages.
8 In the case of Sri Lanka, the entry of Bharti Airtel as the fifth mobile network operator in the market led to an aggressive price war. This prompted the regulator to impose termination rates and a floor rate for national mobile calls with the aim of protecting mobile operators’ margins. At present, Sri Lanka continues to have some of the cheapest mobile-cellular prices in the world and the mobile market has achieved a stable financial situation. For a more detailed analysis of the ICT sector in Sri Lanka, see Galpaya (2011) and the presentation of the Telecommunications Regulatory Commission of Sri Lanka on the impact of the floor rate, available at: http://www.itu.int/ITU-D/finance/work-cost-tariffs/events/tariff-seminars/Indonesia-12/pdf/Session4_SriLanka_Nishantha.pdf.
9 Based on 2012 and 2011 ITU data for countries accounting for 97 per cent of global fixed (wired)-broadband subscriptions, it is estimated that 59 per cent of total fixed (wired)-broadband subscriptions were through ADSL in 2012.
10 References to income levels are based on the World Bank classification, see http://data.worldbank.org/about/country-classifications/country-and-lending-groups.
11 The Communications Commission of Kenya (CCK) issued mobile virtual network operator licences to three operators in April 2014. For more information, see CCK’s press release available at: http://www.cck.go.ke/news/downloads/MVNO.pdf.
12 Although four international operators compete in the Kenyan mobile-cellular market, the dominant mobile operator (Safaricom) holds a market share of almost 70 per cent, and on-net traffic accounts for 87 per cent of the total. Mobile number portability is yet to make an impact in the market, with only 267 in-ports in the period October-December 2013 (CCK, 2014). These data suggest there is limited competition among operators.
13 Advanced mobile technologies refer to standards agreed by the ITU Radiocommunication Assembly for next-generation mobile technologies – IMT-Advanced – such as LTE-Advanced and WirelessMAN-Advanced. For more details on these standards, see http://www.itu.int/net/pressoffice/press_releases/2012/02.aspx.
14 Cuba is excluded from the world and developing averages of fixed-broadband prices, because fixed-broadband services in the island are only available to business customers, the only Internet access available to residential customers being dial-up.
15 For more details on Eircom’s FTTH roll-out, see http://www.eircom.net/efibreinfo/map.
16 The most visited websites in Tunisia by December 2011 were predominantly in English. Initiatives to promote Arab digital content in Tunisia include, for instance, the e-government portal www.tunisie.gov.tn. For more information, see p. 122 in ITU (2012a).
17 For a map of the availability of Qualitynet fixed-broadband services, see http://www.qualitynet.net/map/qnetmap.htm.
Endnotes

Chapter 4. ICT prices and the role of competition
170
18 Mauritel reported 7 352 fixed Internet subscriptions by end 2013, 97 per cent of which trhough ADSL (source: Maroc Telecom, http://www.iam.ma/Groupe/Institutionnel/Qui-Sommes-Nous/Filiales_Participations/Pages/Mauritel.aspx), out of a total of 7 532 fixed (wired)-broadband subscriptions in the country.
19 For more information on the tariffs offered by ETCSA for Internet access, see http://www.etecsa.cu/?page=internet_conectividad&sub=internet.
20 For instance, the latest Computer Literacy Survey in Sri Lanka (2009) found that only 20 per cent of the household population (aged 5 - 69) could use a computer on their own (Department of Census and Statistics Sri Lanka, 2009). The Ministry of Education of Sri Lanka and eSri Lanka have undertaken several actions to improve digital literacy (Galpaya, 2011).
21 Sources: TEAMS’ website (http://www.teams.co.ke) and EASSy’s website (http://www.eassy.org).
22 Sources: Orange press release for the launch of the ACE cable, https://www.ace-submarinecable.com/ace/media/ace_fr/UPL389171684192165237_CP_Orange_ACE_FR_191212.pdf, and for the go-live of WACS, see http://www.oafrica.com/broadband/west-africa-cable-system-wacs-technically-goes-live.
23 For more information on Rogers’ “Share Everything” plans, see http://www.rogers.com/web/content/share-everything?asc_refid=shareeverything. For the details of Verizon’s “MORE Everything” plan, see http://www.verizonwireless.com/wcms/consumer/shop/shop-data-plans/more-everything.html.
24 The details of the different ‘4G’ plans offered by Tigo can be found on the following websites: http://www.tigo.com.bo/personas/planes-y-promociones/Internet-movil-en-tu-modem, http://www.tigo.com.co/4g, http://www.tigo.com.gt/personas/internet-movil/internet-movil-tigo-4g and https://www.tigo.com.py/contenido/para-navegar-con-el-modem.
25 Data for mobile-broadband services have been collected since 2012 through the ITU ICT Price Basket Questionnaire, which is sent out annually to all ITU Member States/national statistical contacts.
26 In 2013, the average price in USD for an entry-level fixed-telephone service was 49 per cent cheaper in developing countries than in developed countries, and 14 per cent cheaper in PPP$. Likewise, a low-user mobile-cellular basket was 41 per cent cheaper in USD, and 7 per cent cheaper in PPP$.
27 For more information on MTN Cameroon tariffs, see www.mtncameroon.net, and for Orange Côte d’Ivoire mobile-broadband plans, see http://www.orange.ci/menu-mobile-3g/pass-internet-3g.html.
28 The UMTS auctions took place in 2000 and 2001 in Europe (van Damme, 2002 and OECD, 2001), preceded only by Japan and the Republic of Korea, where 3G licences were awarded in 2000. In most developing countries, on the other hand, 3G licences were not granted until much later. In large emerging countries such as China and India, for instance, 3G licences were awarded in 2009 and 2010, respectively. See for instance Xia (2011) and India’s Department of Telecommunication press release: http://www.dot.gov.in/as/Auction%20of%20Spectrum%20for3G%20&%20BWA/Auction%20results/3G_Auction_-_Final_Results.pdf.
29 For example, outflows of profits generated by a multinational operating in country A and transferred back to the country of ownership of the multinational would count in country A’s GDP, but not in its GNI.
30 The World Bank classification by income groups is available at: http://data.worldbank.org/about/country-classifications/country-and-lending-groups.
31 Household incomes include wages, salaries, self-employment incomes, capital and property income, private transfers and social security transfers from public sources. For more information, see the 2012 OECD Terms of Reference for the OECD Project on the Distribution of Household Incomes, available at: http://www.oecd.org/els/soc/IDD-ToR.pdf.
32 Individual income is calculated by dividing total household income by the number of persons or using equivalence scales. Equivalence scales are used to account for the fact that the needs of a household do not grow proportionally with its size owing to economies of scale in consumption, e.g. a household with four persons does not pay for four fixed-broadband subscriptions, but rather shares the cost of one connection. Other needs, such as electricity or housing space, follow similar patterns that allow savings in larger households. For more information on the most common equivalence scales, see the OECD note available at: http://www.oecd.org/els/soc/OECD-Note-EquivalenceScales.pdf.
33 The first decile corresponds to the 10 per cent of the population with the lowest income. Conversely, the tenth decile corresponds to the 10 per cent of the population with the highest income.
34 For a discussion on the differences between income and consumption expenditure as welfare indicators, see for instance the World Bank’s website on measuring poverty: http://go.worldbank.org/W3HL5GD710.
35 Differences in the equivalence scales of the source data used in this chapter are roughly corrected using ITU estimates on the number of inhabitants per household for each country. World Bank PovcalNet data on income distribution are published per capita, and figures from the OECD Database on Income Distribution are equivalized using the square root scale.
36 For OECD countries, household income is estimated by multiplying the equivalized household income by the square root of the average number of inhabitants per household in the country. For non-OECD countries, household income or consumption is estimated as the per capita household income or consumption multiplied by the average number of inhabitants per household in the country.

171
Measuring the Information Society Report 2014
37 Angola has a GNI per capita almost ten times higher than that of Uganda, and relatively high compared with most African countries (USD 5 010 per capita in Angola by end 2013). A very significant share of Angola’s GNI depends on the oil and mineral industries. According to 2008/9 survey data, mean household consumption in Angola was almost the same as in Uganda, suggesting that the high GNI p.c. is mainly attributable to some specific industries, rather than to an overall higher level of income and consumption expenditure by most households.
38 Data on income distribution are aggregated per household and then equally attributed to each member of the household. As a result, people who may not have any direct income are attributed a proportional part of the household’s total income. In addition, data on income distribution are averaged per decile. If the price of a fixed-broadband plan represents less than 5 per cent of the average income of the first decile in a country, this does not mean that all households can afford the service. In the first decile there will be some households with incomes below the average of the decile and for which a fixed-broadband plan may still be unaffordable. In conclusion, the data presented do not determine whether 100 per cent of a population within a country can afford a fixed-broadband plan, but rather provide an approximation based on 10 per cent population intervals. Thus, if a fixed-broadband plan costs less than 5 per cent of household disposable income for all deciles, it can be stated that more than 90 per cent of the population live in a household where a basic fixed-broadband plan costs less than 5 per cent of the total household income.
39 Household disposable income or consumption figures are equivalized using the square root scale to account for economies of scale in large households. The World Bank’s PovcalNet data are adjusted using ITU estimates on the average number of inhabitants per household.
40 See Footnote 10.
41 For examples regarding broadband markets, see Bouckaert, Van Dijk and Verboven (2010), Calzada and Martinez (2014), Nardotto, Valletti and Verboven (2012) and Gruber and Koutroumpis (2013). Regarding mobile services, see for instance Gruber and Verboven (2001), Grzybowski (2005) and Koski and Kretschmer (2005).
42 Gruber and Verboven (2001), Gruber and Koutroumpis (2013).
43 North (1990), North and Thomas (1973), Levy and Spiller (1994, 1996).
44 Levy and Spiller (1996).
45 Waverman and Koutroumpis (2011), Fink, Mattoo and Rathindran (2002), Wallsten (2001), Gutierrez and Berg (2000), Ros (1999, 2003), Guttierez (2003), Gual and Trillas (2004).
46 The Brazilian National Broadband Plan (see Box 3 in Broadband Commission, 2013b) and the Uruguayan Digital Agenda (see pp. 85-86 in ITU, 2013a) have set specific entry-level fixed-broadband plans that are offered by the main operators in these countries.
47 Mobile termination rates are regulated in more than 120 countries. Source: ITU Tariff Policies Database 2013 (ICTEye, http://www.itu.int/net4/ITU-D/icteye).
48 For a detailed description of the ITU ICT Regulatory Tracker, see www.itu.int/tracker.
49 The EU acquis is the body of rights and obligations that is binding on all the EU member states, and also a reference for neighbouring countries. For more details, see: http://ec.europa.eu/enlargement/policy/glossary/terms/acquis_en.htm.
50 The mean HHI for fixed broadband is calculated as the simple average of the HHI of 139 economies for which price and market share data were available. This includes 95 economies from the developing world and 44 from the developed world.
51 The mean value of clusters 1 to 3 of the Regulatory Tracker is calculated as the simple average of the scores of 142 economies for which price and market share data were available for 2013. This includes 99 economies from the developing world and 43 from the developed world.
52 http://www.itu.int/en/ITU-D/Regulatory-Market/Pages/bestpractices.aspx.
53 The Regulatory Tracker quantifies these aspects of the regulatory framework through the indicators “Separate telecom/ICT regulator”, “Separate telecom/ICT regulator”, “Enforcement power”, “Sanctions or penalties imposed by regulator” and “Dispute resolution mechanism”. Each indicator has a weight of 2, so they account for 10 points out of a maximum of 72 for the sum of clusters 1 to 3 of the Regulatory Tracker. To quantify the effects of this on fixed-broadband prices, a regulatory value of 36 (half the maximum) has been taken as a reference to test how the addition of these 10 points would correlate with prices.
54 This was, for instance, the case of Omantel, which doubled the speeds of Home Broadband customers at no extra cost in March 2014, see: http://www.omantel.om/OmanWebLib/MediaCenter/Press Release.aspx.
55 The mean HHI for mobile cellular is calculated as the simple average of the HHI of 140 economies for which price and market share data were available. This includes 96 economies from the developing world and 44 from the developed world.
56 The coefficient of variation of fixed-broadband prices is 1.7, compared with 0.6 for mobile-cellular prices. This means that the dispersion of fixed-broadband prices (as measured by the standard deviation) is of ± 170 per cent around the mean, whereas dispersion in mobile-cellular prices is of ± 60 per cent around the mean.


173
Measuring the Information Society Report 2014
Chapter 5. The role of big data for ICTmonitoring and for development
5.1 Introduction
One of the key challenges in measuring the information society has been the lack of up-to-date and reliable data, in particular from developing countries. The information and communication technologies (ICT) sector is evolving rapidly, as are the types of service and application that are driving the information society, all of which makes identifying and tracking new trends even more challenging. As the key global source for internationally comparable ICT statistics, ITU is continuously working to improve the availability and quality of those statistics and identify new data sources. In this context, the emergence of big data holds great promise, and there is an opportunity to explore their use in order to complement the existing, but often limited, ICT data.
There is no unique definition of the relatively new phenomenon known as big data. At the most basic level it is understood as being data sets whose volume, velocity or variety is very high compared to the kinds of datasets that have traditionally been used. The emergence of big data is closely linked to advances in ICTs. In today’s hyper-connected digital world, people
and things leave digital footprints in many different forms and through ever-increasing data flows originating from, among other things, commercial transactions, private and public records that companies and governments collect and store about their clients and citizens, user-generated online content such as photos, videos, tweets and other messages, but also traces left by the Internet of Things (IoT), i.e. by those uniquely identifiable objects that can be tracked.
Big data have great potential to help produce new and insightful information, and there is a growing debate on how businesses, governments and citizens can maximize the benefits of big data. Although it was the private sector that first used big data to enhance efficiency and increase revenues, the practice has expanded to the global statistical community. The United Nations Statistical Commission (UNSC) and national statistical organizations (NSOs) are looking into ways of using big data sources to complement official statistics and better meet their objectives for providing timely and accurate evidence for policy-making.1
So far, there is limited evidence as to the value added by big data in the context of monitoring of the information society, and

Chapter 5. The role of big data for ICT monitoring and for development
174
there is a need to explore its potential as a new data source. While existing data can provide a relatively accurate picture of the spread of telecommunication networks and services, there are significant data gaps when it comes to understanding the development of the information society. Relatively little information, for example, is available on the demand side. While an increasing number of countries currently collect data on the individual use of ICTs, many developing countries do not produce such information (collected through household surveys or national population and housing censuses) on a regular basis. Consequently, not enough data are available about the types of activity that the Internet is used for, and little is known about the Internet user in terms of age, gender, educational or income level, and so on.
In other areas, such as education, health or public services, even fewer data are available to show developments over time and enable informed policy decisions. The recently published Final WSIS Targets Review report (Partnership, 2014), which attempts to assess developments in the information society between 2003 and 2013/14, shows that little information is available to track progress over time. It is obvious that greater efforts must be made to overcome the lack of reliable, timely and relevant statistics on the information society, and that big data have the potential to help realize those efforts.
In addition to the data produced and held by telecommunication operators, the broader ICT sector, which includes not just telecommunication companies but also over-the-top (OTT) service providers such as Google, Twitter, Facebook, WhatsApp, Netflix, Amazon and many others, captures a wide array of behavioural data. Together, these data sources hold great promise for ICT monitoring, and this chapter will explore the potential of today’s hyper-connected digital world to expand on existing access and infrastructure indicators and move towards indicators on use, quality and equality of use.
At the same time, there is a growing debate on the role and potential of big data when it comes to providing new insights for broader social and economic development. Big data are already being leveraged to understand socio-economic well-being, forecast unemployment and analyse societal ties. Big data from the ICT industry play a particularly important role because they are the only stream of big data with global socio-economic coverage. In particular, mobile telephone access is quasi-ubiquitous, and ITU estimates that by the end of 2014 the number of global mobile subscriptions will be approaching 7 billion. At the same time, almost 3 billion people – 40 per cent of the world’s population – will be using the Internet. In recent years, moreover, the strongest growth in telecommunication access and use has been recorded in the developing economies, where ICT penetration levels have increased and where big data hold great promise for development. However, while there are a growing number of research collaborations and promising proof-of-concept studies, no significant project has yet been brought to a replicable scale in the development sphere. Future efforts will have to overcome a number of barriers, including the development of models to protect user privacy while at the same time allowing for the extraction of insights that can improve service delivery to low-income populations. To this end, this chapter will contribute to the debate on big data for development, highlight advances, point to some best practices and identify challenges, including in regard to the production and sharing of big data for development.
The chapter will first (in Section 5.2) describe some of the current big data trends and definitions, highlight the technological developments that have facilitated the emergence of big data, and identify the main sources and uses of big data, including the use of big data for development and ICT monitoring. Section 5.3 will examine the range and type of data that telecommunication companies, in particular mobile-cellular operators, produce, and how those data are

175
Measuring the Information Society Report 2014
currently being used to track ICT developments and improve their business. Section 5.4 looks at the ways in which telecom big data may be used to complement official ICT statistics and assist in the provision of new evidence for a host of policy domains, while Section 5.5 discusses the challenges of leveraging big data for ICT monitoring and broader development, including in terms of standardization and privacy. It will also make some recommendations for mainstreaming and fully exploiting telecom big data for monitoring and for social and economic development, in particular with regard to the different stakeholders involved in the area of big data from the ICT industry.
5.2 Big data sources, trends and analytics
With the origins of the term “big data” being shared between academic circles, industry and the media, the term itself is amorphous, with no single definition (Ward and Barker, 2013). At the most basic level of understanding, it usually refers to large and complex datasets,
Table 5.1: Sources of big data
Sources Some examples
Administrative data • Electronic medical records• Insurance records• Tax records
Commercial transactions • Bank transactions (inter-bank as well as personal)• Credit card transactions• Supermarket purchases • Online purchases
Sensors and tracking devices • Road and traffic sensors• Climate sensors• Equipment and infrastructure sensors • Mobile phones• Satellite/GPS devices
Online activities/social media • Online search activities• Online page views• Blogs and posts and other authored and unauthored online content and social media
activities• Audio/images/videos
Source: ITU, adapted from UNSC (2013).
and reflects advances in technology that make it possible to capture, store and process increasing amounts of data from different data sources. Indeed, one of the key trends fostering the emergence of big data is the massive “datafication” and digitization, including of human activity, into digital “breadcrumbs” or “footprints”.
In an increasingly digitized world, big data are generated in digital form from a number of sources. They include administrative records (for example, bank or electronic medical records), commercial transactions between two entities (such as online purchases or credit card transactions), sensors and tracking devices (for example, mobile phones and GPS devices), and activities carried out by users on the Internet (including searches and social media content) (Table 5.1).
Big data is not just about the volume of the data. One of the earliest definitions, introduced by the Gartner consultancy firm, describes big data characteristics such as velocity and variety, in addition to volume (Laney, 2001). “Velocity” refers to the speed at which data are generated, assessed and analysed, while the
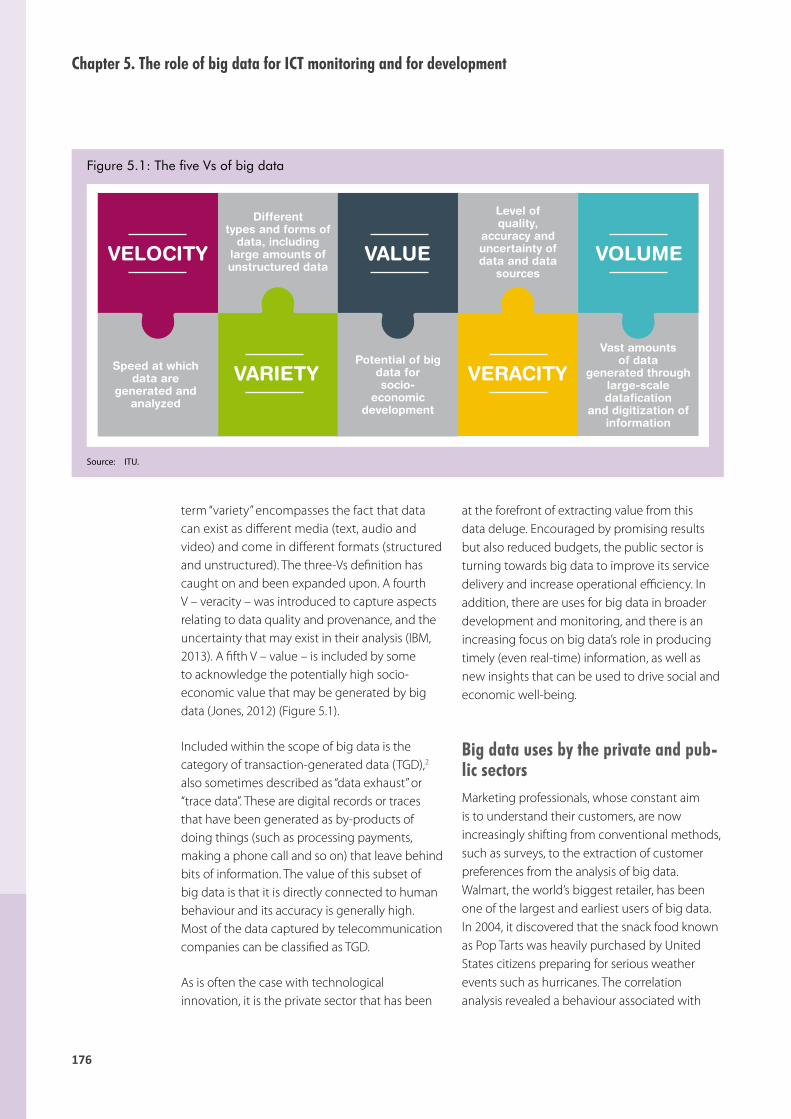
Chapter 5. The role of big data for ICT monitoring and for development
176
term “variety” encompasses the fact that data can exist as different media (text, audio and video) and come in different formats (structured and unstructured). The three-Vs definition has caught on and been expanded upon. A fourth V – veracity – was introduced to capture aspects relating to data quality and provenance, and the uncertainty that may exist in their analysis (IBM, 2013). A fifth V – value – is included by some to acknowledge the potentially high socio-economic value that may be generated by big data (Jones, 2012) (Figure 5.1).
Included within the scope of big data is the category of transaction-generated data (TGD),2 also sometimes described as “data exhaust” or “trace data”. These are digital records or traces that have been generated as by-products of doing things (such as processing payments, making a phone call and so on) that leave behind bits of information. The value of this subset of big data is that it is directly connected to human behaviour and its accuracy is generally high. Most of the data captured by telecommunication companies can be classified as TGD.
As is often the case with technological innovation, it is the private sector that has been
Figure 5.1: The five Vs of big data
Source: ITU.
at the forefront of extracting value from this data deluge. Encouraged by promising results but also reduced budgets, the public sector is turning towards big data to improve its service delivery and increase operational efficiency. In addition, there are uses for big data in broader development and monitoring, and there is an increasing focus on big data’s role in producing timely (even real-time) information, as well as new insights that can be used to drive social and economic well-being.
Big data uses by the private and pub-lic sectorsMarketing professionals, whose constant aim is to understand their customers, are now increasingly shifting from conventional methods, such as surveys, to the extraction of customer preferences from the analysis of big data. Walmart, the world’s biggest retailer, has been one of the largest and earliest users of big data. In 2004, it discovered that the snack food known as Pop Tarts was heavily purchased by United States citizens preparing for serious weather events such as hurricanes. The correlation analysis revealed a behaviour associated with
VOLUME
VARIETY VERACITYVast amounts
of datagenerated through
large-scaledatafication
and digitization of information
Differenttypes and forms of
data, including large amounts of unstructured data
Level ofquality,
accuracy anduncertainty of data and data
sources
VALUE
Potential of big data forsocio-
economicdevelopment
VELOCITY
Speed at whichdata are
generated and analyzed

177
Measuring the Information Society Report 2014
a specific condition that then led Walmart to improve its production chain – in this case, by increasing the supply of Pop Tarts to areas likely to be affected by a disaster. Walmart has also made use of predictive analytics, which uses personal information and purchasing patterns to extrapolate to a likely future behaviour, and to better target and address customer needs. Together, large-scale automated correlation analysis and predictive analytics are two of the key techniques that have helped unleash the value of big data.
Nor is the private sector’s use of big data techniques restricted solely to market research. Companies and whole industries (healthcare, energy and utilities, transport, etc.) are using such techniques to optimize supply chains and production (see Box 5.1 for an example from the energy industry). New value is extracted by being able to link new information on customers to the production process in a way that enables companies to tailor and segment their products at low cost. Firms that are highly proficient in their use of data-driven decision making have been found to have productivity levels up to 6 per cent higher than firms making minimal to no use of data for decision-making (Brynjolfsson, Hitt and Kim, 2011). Significantly, industries now have the ability to conduct controlled experiments at a scale and with
Box 5.1: How big data saves energy – Vestas Wind Systems improves turbine performance
Vestas, a global energy company dedicated to wind energy, with installations in over 70 countries, has used big data platforms to improve the modelling of wind energy production and identify the optimal placement for turbines.
Wind turbines represent a major investment and have a typical lifespan of 20 to 30 years. To determine the optimal placement for a turbine, a large number of location-dependent factors must be considered, including temperature, precipitation, wind velocity, humidity and atmospheric pressure. By using big data techniques based on a large set of factors and an extended set of structured and unstructured data, Vestas was able to significantly improve customer turbine location models and optimize turbine performance.
Big data have enabled the creation of a new information environment and allowed the company to manage and analyse weather and location data in ways that were previously not possible. These new insights have led to improved decisions relating not only to wind turbine placement and operation, but also to more accurate power-production forecasts, not to mention greater business-case certainty, speedier results, and increased predictability and reliability. This reduces the cost to customers per kilowatt-hour produced, while increasing the accuracy of the customer’s return-on-investment estimates.
Source: ITU, based on IBM (2012).
a speed that are unprecedented. Google, for example, is running about a thousand experiments at any given point in time (Varian, 2013a). Telecom network operators make extensive use of such techniques when rolling out new services, among other things for the purpose of pricing. Telecom operators also use big data techniques to understand and control churn, optimize their management of customer relations and manage their network quality and performance.
These fundamental shifts in data exploitation to generate new socio-economic value, coupled with the simultaneous emergence of new rich data sources that can potentially be linked together and analysed with ease, have also sparked the interest of governments, researchers and development agencies. Encouraged by the potential of big data to produce new insights and slimmer budgets, governments (at all levels) are now looking to exploit big data and increase the application of data analytics to a range of activities, including monitoring and improvement of tax compliance and revenues, crime detection and prediction, and improvement of public service delivery (Giles, 2012; Lazer et al., 2009).
To this end, governments, in addition to the data they collect and generate themselves,

Chapter 5. The role of big data for ICT monitoring and for development
178
complement their official statistics by leveraging data from new sources, including crowd-sourced data generated by the public. In the United States, for example, Boston City Hall released the mobile app “Street Bump”, which uses a phone’s accelerometer to detect potholes while the app user is driving around Boston and notifies City Hall.3 Some of the richest data sources for enabling governments and development agencies to improve service delivery are actually external. Such external data include those captured and/or collected by the private sector, as well as the digital breadcrumbs left behind by citizens as they go about their daily lives.
According to a recently published White House report, United States government agencies can make use of public and private databases and big data analytics to improve public administration, from land management to the administration of benefits. The Department of the Treasury has set up a “Do Not Pay” portal, which links various databases and identifies ineligible recipients to avoid wrong payments and reduce waste and fraud4 (The White House, 2014).
Big data for development and ICT monitoring One of the richest sources of big data is the data captured by the use of ICTs. This broadly includes data captured directly by telecommunication operators as well as by Internet companies and by content providers such as Google, Facebook, Twitter, etc. Big data from the ICT services industry are already helping to produce large-scale development insights of relevance to public policy. Collectively, they can provide rich and potentially real-time insights to a host of policy domains. It should be noted that in some countries and regions the use of big data, including big data from the ICT industry, is subject to national regulation. In the EU, for example, a number of directives require data
producers to obtain users’ consent before gathering any of their personal data.5
One of the best-known examples of leveraging the online population’s digital breadcrumbs for development purposes is Google Flu Trends (GFT). Following its launch in 2008, GFT was remarkably accurate in tracking the spread of influenza in the United States, doing so more rapidly than the Centers for Disease Control and Prevention (CDC), with a lag time of only one day as opposed to one week. Although it has since been subject to criticism (see Section 5.5), GFT was held up as an outstanding example of big data in action and of the great potential of big data for broader development and monitoring (Mayer-Schönberger and Cukier, 2013; McAfee and Brynjolfsson, 2012). GFT worked by monitoring health-seeking behaviour expressed through online searches, with the search terms being correlated wherever they related to flu-like symptoms (Ginsberg et al., 2009). This proved to be so successful that it spawned similar efforts focusing on the use of search-engine data to understand dengue fever outbreaks,6 monitor prescription drug use (Simmering, Polgreen and Polgreen, 2014), predict unemployment claims in the United States (Choi and Varian, 2009) and Germany (Askitas and Zimmermann, 2009), and forecast near-term values for economic indicators such as car and home sales and international visitor statistics (Choi and Varian, 2012).
The Internet has also been a rich source of big data beyond the realm of user search terms. Online job-posting data are being used to supplement traditional labour statistics in the United States7 and other countries. In another effort, an academic project at MIT known as the Billion Prices Project collects high-frequency price data from hundreds of online retailers.8 The data are then used by researchers to understand a whole host of macroeconomic questions relating to, among other things, pricing behaviour, daily inflation and asset-price movements. This has the advantage of providing near real-time inflation statistics that are traditionally published monthly.

179
Measuring the Information Society Report 2014
UN Global Pulse, a UN initiative to use big data for sustainable development and humanitarian action, has been mining Twitter data from Indonesia (where Twitter usage is high)9 to understand food price crises. Global Pulse was able to identify a consistent pattern among specific food-related tweets and the daily food price index. In fact, it was able to use predictive analytics on the Twitter data to forecast the consumer price index several weeks in advance (Byrne, 2013). As discussions on the post-2015 development agenda continue, UN Global Pulse is also using Twitter data to understand and compare the relevance of different development topics among countries (Box 5.2).
Box 5.2: How Twitter helps understand key post-2015 development concerns
As the process of formulating the post-2015 development agenda continues, UN Global Pulse and the Millennium Campaign are using big data and visual analytics to identify the most pressing development topics that people around the world are concerned about and consider a priority.
Their interactive visualization tool shows the 16 topics that people have tweeted the most about. Users can select a country to see the number of tweets generated by its Twitter users in regard to the highlighted topic, as compared to tweets about
all the other topics. This information provides insight as to which
of the various post-2015 issues are being talked about the most.
In September 2014, at the global (“all countries”) level, An honest
and responsive government was the key priority, followed by Better
job opportunities and Freedom from discrimination. Also highly
ranked, in 7th position, was phone and Internet access. By clicking
on any of the data points in the chart, the application provides
information on the number of tweets (per month) for each topic.
It also lists the top words that those tweets contained.
Source: UN Global Pulse, see: http://post2015.unglobalpulse.net/#.
Chart Box 5.2: Using Twitter to visualize trends in global development topics
In fact, the ICT sector is itself using the Internet as a source of big data for monitoring purposes. Regulators and others are now using the Internet to crowd-source quality of service (QoS) data on broadband quality. For example, the United States Federal Communications Commission (FCC) has released mobile apps that enable consumers to check their broadband quality. The test results, which are anonymous, are then used by FCC to understand and address coverage and quality issues in different areas.10
-
200'000
400'000
600'000
800'000
1'000'000
1'200'000
Sept.
2013
Oct.
2013
Nov.
2013
Dec.
2013
Jan.
2014
Feb.
2014
Mar.
2014
Apr.
2014
May
2014
Jun.
2014
Jul.
2014
Aug.
2014
Sept.
2014
An honest and
responsive government
Better job opportunities
Freedom from
discrimination
A good education
Political freedoms
Protecting forests rivers
and oceans
Phone and Internet access
Equality between men
and women

Chapter 5. The role of big data for ICT monitoring and for development
180
Mobile data
Despite the rapid growth in Internet access, 60 per cent of the world’s population is still not using the Internet. Household Internet penetration in developing economies is expected to reach 31 per cent by the end of 2014, as against almost 80 per cent in developed economies. In addition, as Internet penetration rates remain limited, Internet users are not (yet) representative of the population at large. For example, Internet users tend to be younger, relatively well educated, with men still more likely to be online than women, especially in developing countries11 (ITU, 2013).
Depending on the source of Internet data, results may also be more or less biased. A 2013 study into the characteristics and behaviour of Facebook users, for example, revealed that while in many ways Facebook users have real-life behaviour and characteristics, in many ways the social network fails as a representation of society. On the one hand, for example, the American Facebook user’s relationship status of “married” on Facebook is very similar to real life (census) data on the average age when American people get married. On the other hand, however, the average American Facebook user is much younger than the average citizen.12 This is just one example, but it highlights the need to take account of particular characteristics and the limitations of producing representative results when extracting information from online users’ behaviour.
Given the popularity of mobile-cellular services, non-Internet-related mobile-network big data seems to have the widest socioeconomic coverage in the near term, and the greatest potential to produce relatively representative information globally, particularly in developing countries. By the end of 2014, the number of mobile-cellular subscriptions is expected to be nearing 7 billion, and the number of mobile-cellular subscriptions per 100 inhabitants is
expected to reach 90 per cent. Mobile data are already being utilized for research and policy-making, not only in developed but also in developing economies.
There are various examples of how mobile phone records have been used to identify socio-economic patterns and migration patterns, describe local, national and international societal ties, and forecast economic developments.13 Data are also being used to improve responsiveness in the event of natural disasters or disease outbreaks. Lu, Bengtsson and Holme (2012) used mobile call records to study the population displacements following Haiti’s 2010 earthquake, with a view to using such methods to improve the effectiveness of humanitarian relief operations immediately after a disaster. Call records have also been merged with epidemiological data to understand the spread of malaria in Kenya (Pindolia et al., 2012; Wesolowski et al., 2012a), and of cholera in Haiti after the 2010 earthquake (Bengtsson, Lu, Thorson, Garfield and von Schreeb, 2011) and in Côte d’Ivoire (Azman, Urquhart, Zaitchik and Lessler, 2013). Mobile network big data have been utilized to great effect in the area of transportation, helping to measure and model people’s movements (even in real time) and understand traffic flows (Wu et al., 2013).
It is evident from the examples given that big data from the ICT sector, and especially those available to telecommunication operators, have wide applicability for informing multiple public policy domains. Leveraging such data to complement official statistics and facilitate broader development will enable governments as well as development agencies to better serve their citizens and beneficiaries. Less use has thus far been made of telecommunication big data with a view to understanding its potential for producing additional information and statistics on the information society. In assessing that potential, including the potential for providing complementary

181
Measuring the Information Society Report 2014
information on the development of the information society, it is first important to better understand the type of data that can be made available.
5.3 Telecommunication data and their potential for big data analytics
Fixed and mobile telecommunication network operators, including Internet service providers (ISPs), are an important source of data and for the purpose of this chapter, all forms of telecommunication big data (either volume, velocity or variety) are being considered. Most telecommunication data can be considered as TGD,14 that is, the result of an action undertaken (such as making a call, sending an SMS, accessing the Internet or recharging a prepaid card).
Since the service with the widest coverage and greatest uptake and popularity is the mobile-cellular service, data from mobile operators have the greatest potential to produce representative results and reveal developmental insights on the population, including in developing countries and, increasingly, low-income areas. Not surprisingly, the big data for development initiatives (outlined in Section 2.2) have mainly drawn on mobile-network big data rather than on those from fixed-telephone operators or ISPs. Figure 5.2 illustrates some of the similarities and differences in the type of information that mobile-network operators, as opposed to fixed-telephone operators and ISPs, produce, and shows some of the additional insights, in particular in terms of the location and mobility information that mobile networks and services generate.
Telecommunication dataThe mobile telecommunication data that operators possess can be classified into different types, depending on the nature of the information
they produce. They include traffic data, service access detail records, location and movement data, device characteristics, customer details and tariff data. For a more detailed overview of these types of data, see Chapter 5 Annex.
To collect traffic data, operators use a range of metrics to understand and manage the traffic flowing through their networks, including the measurement of Internet data volumes, call, SMS and MMS volumes, and value-added service (VAS) volumes. Internet service providers can also use deep packet inspection (DPI),15 which is a special process for scanning data packages transiting the network.
Service access detail records, including call detail records (CDRs), are collected by operators whenever clients use a service. They are used to manage the infrastructure and for billing purposes, and include information on the time and duration of services used and the technology used, for example, for the mobile network (2G, 3G, etc.). These data are potentially also very useful for building a rich profile of customers, as outlined in this section.
Mobile networks capture a range of movement and location variables to identify user location and movement patterns. The degree of accuracy of this information depends on a number of factors, including the network used and device generation, and can be broadly classified into two different types: passive and active positioning data, with the latter providing more detailed and precise location information.
Since mobile user devices used to access mobile telecommunication services come with an international mobile station equipment identity (IMEI) number, operators can identify some device characteristics, including the handset make and model and type of technology (2G, 3G, LTE) employed. Mobile network operators can use the IMEI number to identify the specific mobile handset being used by a subscriber, which in turn can provide some insight as to that

Chapter 5. The role of big data for ICT monitoring and for development
182
Figure 5.2: An overview of telecom network data
Source: ITU, adapted from Naef et al. (2014).
Traffi
c da
ta
Fixed operator Mobile operator ISP
Data volume
Call volume
SMS/MMS volume
Erlang
DPI data
Timestamp of use
Contact network
Duration of use
Applicable charges
Handset type
Technology utilized (2G, 3G, DSL/ADSL, etc.)
Billing address
Passive positioning data (e.g. cell ID)
IMEI
Active positioning data (e.g. cell triangulation, GPS)
MAC address
Customer demographics (e.g. age, gender, national ID card number)
Billing address
Payment history (postpaid)
Billing address
Recharge history (prepaid)
Service order history
Tariff sheet
Serv
ice
acce
ss d
etai
l re
cord
sLo
catio
n
data
Devi
ce
char
act-
eris
tics
Cust
omer
de
tails
Tariff
da
ta
Transaction generated data Stored warehouse data

183
Measuring the Information Society Report 2014
subscriber’s purchasing power (see below for more details).
In addition, telecommunication operators hold various customer details that were captured during the customer registration process. These can include the customer’s name, age, gender, billing address and, in some cases, national identity card number. Customer details may also include a history of the services accessed, service option preferences as well as other details (as referred to in Chapter 5 Annex).
Finally, operators maintain tariff data in the form of billing records for their current and past services, from which information on a customer’s usage patterns and preferences can be extracted.
The information outlined above is used at the aggregate level to derive a range of indicators to provide operators with information on the uptake of different services and on their business performance and revenues (Box 5.3). The information is also an important tool for regulatory authorities and policy-makers as they
Box 5.3: How mobile operators currently use data to track service uptake, business performance and revenues
Operators use their TGD to monitor the uptake and penetration of particular services, identify market shares and monitor their business performance, as well as for reporting purposes. They can also track the extent to which different technologies are used, not just in terms of handset capabilities but also actual usage, enabling them, for example, to determine the number of active mobile-cellular and active mobile-broadband subscriptions.
On the basis of the detailed service-usage data collected, telecommunication operators can produce a range of detailed indicators relating to service consumption. For each customer, it is possible to determine the minutes of use (MoU), number of originating and terminating calls, SMS and MMS usage, data upload volumes, data download volumes, level of use of different VAS, and level of use of different OTT services. These data can be reported as averages (over time or for different categories of user), as well as at various levels of aggregation (again over time or for different categories of user). These measures are often key
performance indicators (KPIs), tracked and used in particular by operators, but also by regulators and at the international level.
Finally, service consumption data are used to produce revenue data and projections at various levels of disaggregation or aggregation. For example, the average revenue per user (ARPU) is a KPI for operators, which identify their most important customers on the basis of the revenue they generate for the company. Similarly, revenue projections are made not just at the level of a particular service,16 but also to identify the most important network elements. For example, mobile operators collect indicators on the revenue being generated at the base station level, often in real time. Collectively, these revenue-based metrics can also be used by the operator to ensure a higher QoS and higher bandwidth at those locations generating the most revenue. Mobile operators will, for instance, often associate revenue data with resource allocation to ensure that QoS at the base stations used by their premium customers is maintained at the highest possible level.
Source: ITU.
evaluate existing policies and establish new ones. At the international level, organizations such as ITU, but also consultancy firms and others, use aggregated revenue data to track and benchmark countries’ ICT developments, monitor the evolution of the information society and identify digital divides.
The telecom industry’s use of big data Telecommunication companies are actively seeking to intensify their use of big data analytics in order to improve existing services and create new ones. For operators, big data open up opportunities for better understanding of their customers, which in turn leads to improved sales and marketing opportunities. At the same time, big data can help optimize network operations and create new revenue streams and business lines, for example when selling data.
Customer profiling
Telecom operators capture a range of behavioural data about their customers.

Chapter 5. The role of big data for ICT monitoring and for development
184
Customer profiles include details about customers’ mobility patterns, social networks and consumption preferences. Collectively, these digital breadcrumbs enable operators to profile and segment their customers based on a variety of metrics (Figure 5.3). Depending on the country or region, there may be different privacy and data regulations governing the manner in which operators may keep and/or use such data. This being the case, the extent to which behavioural profiling is used by operators may vary greatly.
• Customer interests: these can be captured, or in some cases inferred, on the basis of usage levels (time spent and/or volume) for different VAS and OTT services. DPI can also be used to categorize interests based on sites visited (as opposed to content accessed). Sophisticated clickstream analyses from DPI data17 can also generate more finely-grained interest classifications.
• Socio-economic class: While customer details will often enable operators to classify their customers’ socio-economic status, such details are not always very reliable. Big data, on the other hand, can help to enhance that classification
by enabling analysis of the levels of consumption of different services, including on the basis of spending (often in relation to other services), types of device used, frequency of change of handset, and so on.
• Likelihood of churn: The churn rate is a measure of the number of customers leaving the network or a particular service offered by an operator. Understanding churn is crucial to operators for obvious reasons. Big data techniques can help operators understand churn better by enabling them to model the likelihood of customers leaving the network (or opting out of a given service) by focusing on the customer’s existing service usage behaviour.
• Level of influence of customers: Operators are keen to leverage service and technology diffusion among their subscribers with a view to marketing additional, customized services. This often calls for an understanding of the level of influence of each subscriber’s social networks, both on-network (i.e. within the same operator) as well as off-network (i.e.
Figure 5.3: Customer profiling using telecom big data
Source: ITU.
CUSTOMERINTERESTS
SOCIO-ECONOMIC
CLASS
LEVEL OFINFLUENCE OFCUSTOMERS
LIKELIHOODOF CHURN
MOBILITYPROFILE

185
Measuring the Information Society Report 2014
in competitor networks). By identifying a large number of off-net users in a customer’s network, operators may target the subscriber and/or the off-net users with promotions and incentives aimed at converting off-net connections into on-net users.
• Mobility profile: Mobile operators accord a high priority to identifying the locations most frequented by their customers, in order not only to ensure a high QoS in those areas, but also, more recently, to build mobility profiles of their customers that can be leveraged for location-based services.
Sophisticated customer profiling enables operators to personalize and market new services more effectively. For example, by understanding their customers’ relationships to their social networks (and their relative importance within them), operators are able to model the diffusion of services and create targeted promotions. Furthermore, social network insights can be used by an operator to market its services to the off-network contacts that are connected to its customers, or to reduce churn rates. In the Republic of Korea, for example, SK Planet, a subsidiary of SK Telecom, uses big data to help its parent company to cut churn and generate new revenue, and has used data mining to achieve a fourfold improvement in churn forecasting. The operator found that customers planning to quit their current package tend to use specific search phrases, such as “data plan” or “operator benefits”, at least three to seven days before taking action. When operators suspect that customers may be looking elsewhere, they may try to keep them by providing them with a tailored offer.18
Network planning and management
By analysing their networks in real time, operators can optimize routing and ensure QoS. The use of real-time DPI enables them to optimize traffic routes and details of traffic volumes, including the geospatial distribution of demand, and to plan and manage their networks more effectively
through optimal resource allocation. By utilizing geospatial information about their most active customers and high-revenue regions, operators can adapt their resource allocation to ensure that more resources are channelled into active locations. This is an area of great significance to operators as they seek to understand the demands placed on their networks by the use of popular OTT services.
New business lines
To increase revenue streams, operators may also seek to monetize the data they hold. The simplest way of doing this is to sell (anonymized) data to third parties. The customer insights obtained through the analysis of usage data can also help create new business lines, either through innovation (e.g. new types of VAS) or by partnering with other businesses, including credit-scoring and related financial services. One example is the US-based big data startup Cignifi,19 which obtains data from mobile operators and financial institutions to build credit profiles and evaluate customer creditworthiness (see Box 5.8). Cross-promotions with brick-and-mortar businesses are a potentially high-growth area in which the detailed mobility profiles available to operators are leveraged.
5.4 Big data from mobile telecommunications for development and for better monitoring
In 2013, the United Nations High-Level Panel of Eminent Persons on the Post-2015 Development Agenda called for a “data revolution” that draws on existing and new sources of data for the post-2015 development agenda (United Nations, 2013). In March 2014, the forty-fifth session of UNSC, the highest decision-making body for international statistical activities, presented a report on “big data and modernization of
Chapter 5. The role of big data for ICT monitoring and for development
186
statistical systems”, and proposed the creation of a big data working group at the global level (UNSC, 2013).20 Current uses of big data to complement official statistics are still exploratory, but there is a growing interest in this topic, as evidenced by the numerous initiatives being pursued by the United Nations, as well as by others, including the World Bank, OECD, Paris21 and NSOs.
There are many big data sources that can be used to monitor and assess development results. In a world where mobile telephony is increasingly ubiquitous, it is not surprising that mobile telecommunication big data have unique potential as a new data source, with high mobile-cellular penetration levels and the increasing use of mobile phones, even among the poorest and most deprived, making them particularly valuable by comparison with other types of telecommunication data. Indeed, when referring to the data revolution, the United Nations High-Level Panel cited the example of “mobile technology and other advances to enable real-time monitoring of development results”.
This section will present some of the existing (and growing) evidence for the role of mobile big data in achieving development goals in various policy areas, including disaster management and sustainable and economic development.
In addition to their use for development, telecommunication big data have potential as a source to enable monitoring of the information society, although they have yet to assume a critical role in complementing the official ICT statistics that are collected and used for that purpose. As the lead agency on global telecommunication and ICT statistics, however, ITU is exploring the potential of big data to complement its existing, and often limited, set of ICT statistics. This section presents a first attempt to help identify some of the areas in which mobile telecommunication big data could complement existing ICT indicators to provide a more complete, comprehensive and up-to-date picture of the state of today’s information society.
Mobile phone big data for develop-mentMobile data offer a view of an individual’s behaviour in a low-cost, high-resolution, real-time manner. Each time a user interacts with a mobile operator, many details of the interaction are captured, creating a rich dataset relating to the consumer. Topping up airtime, making calls and sending SMSs, downloading applications or using value-added services are all examples of interactions for which the time, location, device, user and other detailed information are captured in the operator’s system. From these interactions, information about identity, movement patterns, social relationships, finances and even ambient environmental conditions can be extracted. In addition to the fact that these data are uniquely detailed and tractable, the information captured cannot easily be derived from other sources on such a scale. The fact that the format of the data is relatively similar across different operators and countries creates a huge potential for the global scaling of any application found to have significant benefits. Box 5.4 illustrates the potential of mobile data for development in a number of different areas.
There have been a number of interesting research collaborations and some promising proof-of-concept studies, for example in the areas of disaster management and transportation planning, and for understanding socio-economic developments and societal structures.
Big data for disaster management and syndromic surveillance21
Mobility data collected immediately after a disaster can in many cases help emergency responders to locate affected populations and enable relief agencies to direct aid to the right locations (Lu, Bengtsson and Holme, 2012b).
One application of such mobility data is for syndromic surveillance, especially to model the spread of vector-borne22 and

187
Measuring the Information Society Report 2014
Box 5.4: Using mobile data for development
A recently published report (Cartesian, 2014) explores the potential of mobile data for development. It points to three primary types of analysis - ex-post evaluation, real-time measurement, and future predictions and planning - in a number of areas (including health, agriculture and economic development), and suggests that “the more predictive the analytics can be, the higher impact the analysis will have through the ability to anticipate future events or trends” (Figure Box 5.4).
The report further highlights that while there have been a number of interesting research collaborations and some promising proof-of-concept studies, no significant programme has yet been brought to a replicable scale. Future efforts will have to overcome a number of barriers to scale, including the development of models which protect user privacy while still allowing for the extraction of insights that can serve development purposes, particularly where those in most need, including low-income populations, are concerned.
Source: Naef et al. (2014).
Figure Box 5.4: Areas of highest potential impact across sectors
Evaluation and
assessment
Measurement and real-time
feedbackPrediction and planning
Financial services
Economic
development
Health
Agriculture
Commercial
Other
High Medium Low
Mobile
agentplacement
Algorithmic
fraud
detection
Social
network
analysis
marketing
Agent
monitoring
Enhanced
credit
Algorithmic
liquidity
needs
prediction
Income and
poverty
assessment
Mapping
social divides
GDP
estimates
through
mobile data
Migration
monitoring
Text analysis
economic
downturn
prediction
Text analysis
commodity
fluctuation
prediction
Assessment
of mobility
restrictions
Disease
containment
targeting
Migratory
p opulation
tracking
Predicting
outbreak
spread
Mobile data
to track food
assistance
delivery
Geo-targeted
links between
Ag suppliers/
purchasers
Pests, bad
harvest
Ag
yield/shock
predictions
Campaign
effectiveness
Social
network
delineated
market areas
Predictive
algorithms
to anticipate
prod. churn
Social
network
targeted
marketing
Post -disaster
refugee
reunification
Sentiment
analysis of
public
campaigns
Urban
planning
Mobile
disaster relief
targeting
High
frequency
surveys
Crime
detection
Social unrest
prediction
Ex-post Current Future
Pilot identified
money network
scoring
alerts
Impact level:
other communicable diseases. Pioneering research in Kenya combined passive mobile positioning data with malaria prevalence data to identify the source and spread of infections (Wesolowski et al., 2012b). Similar work in Haiti showed how mobile phone data was used to track the spread of cholera after the 2010 earthquake (Bengtsson et al., 2011, see Box 5.5).
The integration of mobility data from mobile networks with geographic information frameworks,23 supplemented with additional information, shows great potential for tracking the spread of vector-borne and other communicable diseases. This highlights the need to ensure that the response plan implemented after any disaster includes ensuring that any damaged mobile-network infrastructure is repaired as rapidly as possible.

Chapter 5. The role of big data for ICT monitoring and for development
188
Big data for better transportation planning
A data-centric approach to transportation management is already a reality in many developed economies. Transportation systems are being fed with sensor data from a multitude of sources such as loop detectors, axle counters, parking occupancy monitors, CCTV, integrated public transport card readers and GPS data derived not only from phones but also from public transport and private vehicles (Amini, Bouillet, Calabrese, Gasparini and Verscheure, 2011).
One advantage of mobile networks is that even the least developed mobile-network infrastructure generates passive positioning
data, which, despite its limited spatial accuracy (cell ID), has great potential for transportation planning. For example, IBM researchers used CDR data from mobile operator Orange to map out citizens’ travel routes in Abidjan, the largest city in Côte d’Ivoire, and show how data-driven insights could be used to improve the planning and management of transportation services, thereby reducing congestion (Berlingerio et al., 2013). By simply extending one bus route and adding four new ones, overall travel time was reduced by ten per cent. Passive mobile positioning data has also been used for transportation planning and management in Estonia (Ahas and Mark, 2005), and has provided reliable results in Sri Lanka (Lokanathan et al., 2014, see Box 5.6).
Box 5.5: How mobile-network data can track population displacements – an example from the 2010 Haiti earthquake
The Figure below shows the number of people estimated to have been in Port-au-Prince (PaP) on the day of the 2010 Haiti earthquake, but outside the capital 19 days later. The circles
represent the numbers of people who were displaced. This map was produced on the basis of mobile-network data to show the potential of big data in tracking population movements.
Source: Bengtsson et al. (2011).
Figure Box 5.5: Tracking mobility through mobile phones
Port-au-Prince (PaP)
Number ofpeopledisplacedafterearthquake

189
Measuring the Information Society Report 2014
Box 5.6: Leveraging mobile-network data for transportation and urban planning in Sri Lanka
Very similar findings between the results of an official household
survey assessing mobility patterns (right-hand map) with the
results of a big data analysis using mobile-phone data (left-hand
map) underscore the merits of big data. The image on the left,
based on mobile-phone data, depicts the relative population
density in Colombo city and its surrounding regions at 1300
hours on a weekday in 2013, compared to midnight the previous
day. While the yellow to red colouring shows areas in which the
density has increased relative to midnight, the blue colouring
depicts areas in which the density has decreased relative to midnight (the darker the blue, the greater the loss in density). The clear areas are those in which the overall density has not changed. The image reflects the movement of people from the outskirts of the city to its centre during the day.
An almost identical finding is to be seen in the map on the right, which depicts the major transportation transit points identified using a costly survey of 40 000 households to understand mobility patterns.
Source: Lokanathan et al. (2014).
Figure Box 5.6 : Mobile big data (left) versus official survey data (right)
Both passive and active positioning data are used to analyse traffic conditions, particularly in urban areas with higher base-station density. Active positioning data (especially GPS) produce higher precision in location data and are therefore the most useful. Operators may offer such specialized services (based on passive or active location data) either directly, or by providing data to third parties. Mobile network data are less expensive, are in real time and are less time-consuming to produce than survey data, particularly in urban and peri-urban areas where base-station density tends to be high.
In another example, the analysis of mobility flows between two Spanish cities derived from three different data sources – mobile-phone data, geolocated Twitter messages and the census – showed very similar results, and although the representativeness of the Twitter geolocated data was lower than the (real-time) mobile-phone and census data, the degrees of consistency between the population density profiles and mobility patterns detected by means of the three datasets were significant (Lenormand et al, 2014).
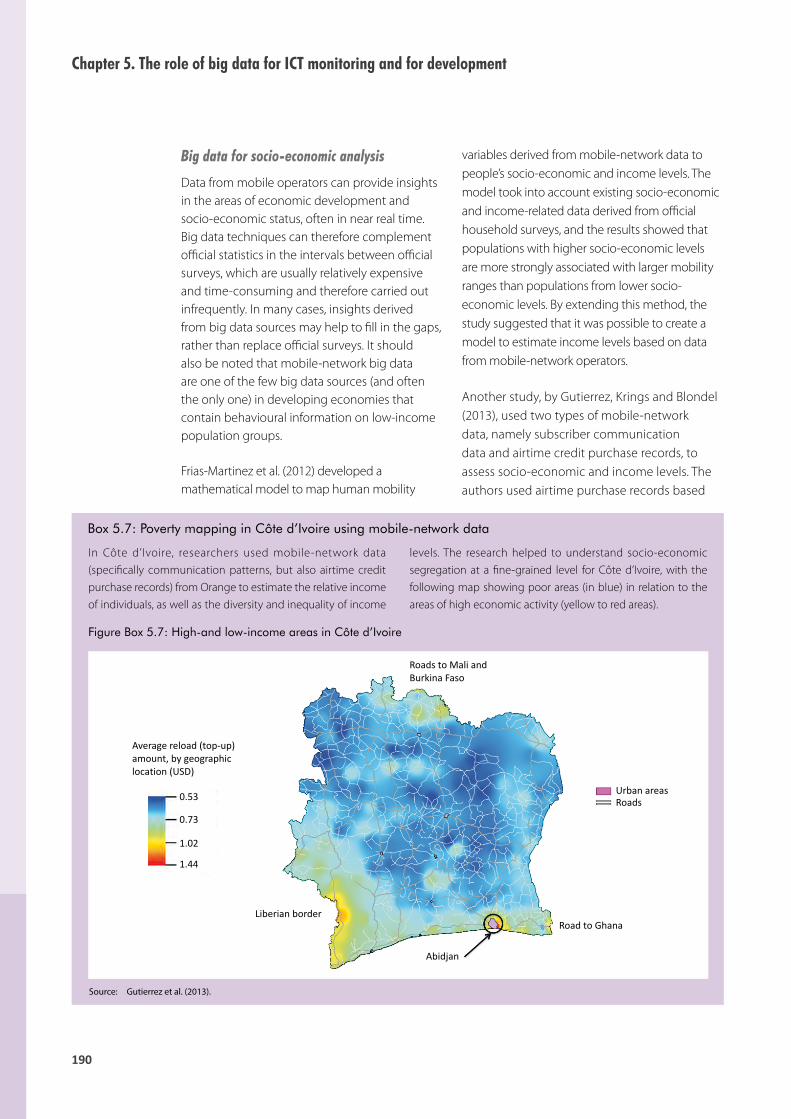
Chapter 5. The role of big data for ICT monitoring and for development
190
Big data for socio-economic analysis
Data from mobile operators can provide insights in the areas of economic development and socio-economic status, often in near real time. Big data techniques can therefore complement official statistics in the intervals between official surveys, which are usually relatively expensive and time-consuming and therefore carried out infrequently. In many cases, insights derived from big data sources may help to fill in the gaps, rather than replace official surveys. It should also be noted that mobile-network big data are one of the few big data sources (and often the only one) in developing economies that contain behavioural information on low-income population groups.
Frias-Martinez et al. (2012) developed a mathematical model to map human mobility
variables derived from mobile-network data to people’s socio-economic and income levels. The model took into account existing socio-economic and income-related data derived from official household surveys, and the results showed that populations with higher socio-economic levels are more strongly associated with larger mobility ranges than populations from lower socio-economic levels. By extending this method, the study suggested that it was possible to create a model to estimate income levels based on data from mobile-network operators.
Another study, by Gutierrez, Krings and Blondel (2013), used two types of mobile-network data, namely subscriber communication data and airtime credit purchase records, to assess socio-economic and income levels. The authors used airtime purchase records based
Box 5.7: Poverty mapping in Côte d’Ivoire using mobile-network data
In Côte d’Ivoire, researchers used mobile-network data (specifically communication patterns, but also airtime credit purchase records) from Orange to estimate the relative income of individuals, as well as the diversity and inequality of income
levels. The research helped to understand socio-economic segregation at a fine-grained level for Côte d’Ivoire, with the following map showing poor areas (in blue) in relation to the areas of high economic activity (yellow to red areas).
Source: Gutierrez et al. (2013).
Figure Box 5.7: High-and low-income areas in Côte d’Ivoire
Abidjan
Road to Ghana
Liberian border
Roads to Mali and
Burkina Faso
0.53
0.73
1.02
1.44
Average reload (top-up)
amount, by geographic
location (USD)
Urban areas
Roads

191
Measuring the Information Society Report 2014
on the assumption that users who make large purchases are more affluent than those who make multiple smaller purchases, as people with lower incomes will not have enough ready cash to make single purchases of large amounts of airtime credit. They combined this analysis with a study of users’ social networks, with two users being considered as connected if they communicated with each other at least once a month. Results showed that people tend to socialize with those who have a similar purchasing power (i.e. a similar income level).
Research suggests that operators have access to potentially valuable information that could help improve poverty mapping (See Box 5.7) and identify sudden events that depress the local economy (i.e. economic shocks). One of the challenges has to do with operator sensitivity regarding revenue data and the difficulty this poses for outside parties wishing to obtain such data.
The use of mobile-operator TGD can also foster financial inclusion by facilitating the provision of credit to the unbanked. In 2012, the Consultative Group to Assist the Poor (CGAP) and GSM Association (GSMA) estimated that close to 2 billion people had a mobile phone but no bank account. After analysing mobile consumption variables,
CGAP suggested that it was possible to identify the creditworthiness of the unbanked (Kumar and Muhota, 2012). For example, people who purchase airtime frequently and in a consistent manner demonstrate income predictability and an ability to plan ahead, which may be a positive indication of their ability to repay a loan. Conversely, people with prepaid accounts that are inactive or which regularly run out of credit would perhaps not repay a loan in a timely manner. A compelling example of how mobile big data can be used for the unbanked is Cignifi, a big data startup that uses the mobile phone records of poor people to assess their creditworthiness when they apply for a loan (Box 5.8).
Big data for understanding societal structures
Social-network studies relying on self-reporting relational data typically involve both a limited number of people and limited number of time points (usually one). As a result, social-network analysis has generally been confined to the examination of small population groups through a small number of snapshots of interaction patterns. By examining social communication patterns based on telecommunication data, it has become possible to obtain insights into societal structures on a scale that was previously unavailable. Mobile-phone records
Box 5.8: Using mobile-phone data to track the creditworthiness of the unbanked
Cignifi, a big data startup, has developed an analytic platform to provide credit and marketing scores for consumers, based on their mobile-phone data. The Cignifi business model is founded on the idea that “Mobile phone usage is not random – it is highly predictive of an individual consumer’s lifestyle and risk”.
Based on the behavioural analysis of each mobile-phone user – phone calls, text messages, data usage and, extrapolating from these, lifestyles – the company identifies patterns and uses them to generate individual credit risk profiles. This information could help many of the world’s unbanked to have access to insurance, credit cards and loans. Scores are dynamic and respond to changes in customer activity as the data are refreshed, usually every two weeks. In addition to updating a person’s
creditworthiness, the system also helps to identify a customer’s appetite for different products and inclination to churn.
The credit-scoring model is being tested in Tanzania and Brazil. In Brazil, Cignifi constructed 50 behavioural variables from 2.3 million prepaid mobile subscriptions and verified the findings from the model against historical lending data from approximately 40 000 borrowers using the mobile operator Oi’s lending business, Oi Paggo. The test showed that the model was an accurate predictor of default, with the score proving to be a useful complement to, although not a replacement for, the credit underwriting effort. Experian Microanalytics ran a similar trial in the Philippines (Kumar and Muhota, 2012).
Source: ITU, based on Cignifi.

Chapter 5. The role of big data for ICT monitoring and for development
192
have been used to study the geographic dispersion and cohesion of societies in relation to socio-economic boundaries by examining the geospatial distribution of societal ties in both developed and developing economies (Sobolevsky et al., 2013).
However, telecommunication data are also revolutionizing the study of societal structures at the micro level. Eagle et al. (2009) show that it is possible to assess friendship using data from mobile-network operators, and that the accuracy is high when compared with self-reported data. Leveraging these behavioural signatures to obtain an accurate characterization of relationships in the absence of survey data could also enable the quantification and prediction of macro and micro social-network structures that have thus far been unobservable.
Big data to monitor the information societyThere is a case to be made for analysing data captured by telecommunication operators in the interests of improving the current range of indicators used for monitoring the information society. An internationally-accepted and widely-adopted list of indicators is the core list of ICT indicators developed by the Partnership on Measuring ICT for Development, a multi-stakeholder initiative launched in 2004.24 This list includes, among others, the key-infrastructure, access and individual-use indicators that ITU collects and disseminates. Some of these indicators are amenable for augmentation using big data analytics.25
The core indicators on ICT infrastructure and access include indicators on mobile-cellular and mobile-broadband subscriptions, which remain some of the most widely used and internationally comparable telecommunication indicators produced for tracking the information society. One of the main issues with mobile-cellular and mobile-broadband subscription data is that they do not refer to unique subscriptions, or mobile
users. Since one person can have multiple subscriptions, or share a subscription with another person, it is not possible to determine how many individuals subscribe to, or use, the mobile service. It is often the case that countries with large numbers of prepaid subscriptions display relatively high penetration rates since prepaid cards can often be purchased at no initial cost and do not involve a recurring (monthly) cost. In countries with high interconnection charges, for example, multiple prepaid cards can help avoid high costs when making off-net calls. In addition, prepaid consumers do not usually cancel their account after ceasing to use a given network, making it important for operators to monitor the time during which a SIM card remains inactive. In June 2014, for example, GSMA estimated that, globally, the number of unique mobile subscriptions was just over 50 percent, whereas the number of connections per 100 population far exceeded 100 per cent.26
Survey-based data, for example on Internet users and mobile-phone users, do not entail the same issues as subscription data. They are collected through household surveys, directly from citizens, and their level of reliability is relatively high. The advantage of surveys is that they can go into more depth on the use of ICTs. For example, one of the core indicators reflects the types of online activity pursued by Internet users, and includes response categories such as seeking health information, obtaining information from government entities or participating in social networks. Survey-based data can also be broken down by individual characteristics, including gender, age, educational level and occupation, which substantially increase the data’s added value. However, the main challenge with these data is that they are not widely available (in particular, many developing countries do not yet collect data on individual use of, or household access to, ICTs), are relatively expensive to produce, and are much less timely than subscription data (often with a time lag of one year). Consequently, data on users of the information society and the types of online service they consume are limited, and in many

193
Measuring the Information Society Report 2014
cases outdated. Against this background, mobile networks and mobile big data could be used to identify alternative, less costly and faster ways of carrying out representative surveys (Box 5.9).
Given the shortcomings of existing administrative data from operators and survey data collected by NSOs, it is particularly interesting to assess some of the ways in which big data can be used to overcome the shortcomings of existing key ICT indicators and to provide additional insights into ICT access and use, user behaviour, activities and also the individual user. Big data could help in obtaining more granular information in several areas, and big data techniques could be applied to existing data to produce new insights. In particular, operators’ big data could produce information in the following areas:
Individual subscriber characteristics: Additional categorization across both time and space are possible for subscription indicators, and big data could provide additional information on gender, socio-economic status and user location. Information on gender or age, for example, could be derived from customer registration information (notwithstanding a number of challenges and privacy issues, as discussed later in Section 5.5). The socio-economic status of the person linked to a subscription could be derived from big data techniques applied to users’ consumption information, as well as other data contained in
customer registration information. In addition, the analysis of customers’ mobility patterns will often allow for an understanding of important locations (work and home being the two most important) and of the use of mobile services in rural versus urban areas. It would thus be possible to gain a more reliable and more granular understanding of service penetration across space on the basis of actual behaviour/activity, rather than of what customers may report through a survey.
Service activity and use: All subscription data could provide information as to location. In the case of fixed-telephone and fixed-broadband subscriptions, which are linked to an address through the billing information, it is possible to obtain information on the administrative division of subscribers, distinguish between urban and rural areas, and provide breakdowns by any kind of geographic categorization. Operators could track the types of service that a subscriber uses and the frequency and intensity of use of each of them. Similarly, when it comes to broadband access, operators can also potentially produce detailed information on the technology being used by the subscriber, as well as the associated speed and quality of access for each of the technologies used. Based on the household/individual details provided during the registration process, it could also be possible to provide more information on individual/household characteristics, or to link those characteristics to other (administrative) databases in order to
Box 5.9: Using mobile big data and mobile networks for implementing surveys
An important measurement for assessing the development of the information society is the extent to which households have access to ICTs. Given the need for continued recourse to surveys for collecting the corresponding data, and the declining response rates where traditional surveys are concerned (Groves, 2011), mobile operators could develop platforms to facilitate the collection of survey data. This could include targeting a wide variety of respondents covering the full spectrum of appropriate demographic profiles, followed by a process of extrapolation using big data analytics. In 2011, for example, UN Global Pulse
partnered with Jana,27 a mobile-technology company, to explore the feasibility of using mobile phones for the deployment of rapid global surveys on well-being.28 This requires, however, that the mobile users targeted for the survey match the requisite survey profile. For instance, if one of the requirements was for the survey to be representative of women, there would have to be some way to determine/infer the demographics of the targeted mobile-phone user. To that end, the World Bank has experimented with the use of mobile phones to conduct statistically representative monthly household surveys in Latin America and the Caribbean.29
Source: ITU.

Chapter 5. The role of big data for ICT monitoring and for development
194
create new information. Consumption patterns could also deliver additional information on the socio-economic status of the person/household linked to a subscription.
Particularly rich possibilities exist where data from mobile-cellular and mobile-broadband subscriptions are concerned, since they are linked to mobility profiles. The indicators for such subscriptions could be further broken down to understand the utilization of services – including voice, data and VAS – over time, and the intensity of use. Mobile operators are able to provide information not only on the different technologies (3G, LTE-Advanced, etc.), but also on the types of service that subscribers are using, and the frequency and intensity of that use. They could, therefore, potentially identify Internet and VAS usage patterns between rural and urban areas, and identify the kinds of application or webpage that mobile-Internet users access. Combined with individual subscriber characteristics, this information could provide new and rich insights into the digital divide and help understand usage patterns, including intensity of use, by gender, socio-economic status and also location.
Greater utilization of DPI could lead to additional insights that can help to classify access and intensity of use with respect to different Internet activities carried out by individuals. This information is currently collected only by countries that carry out household ICT surveys. In addition, mobile-operator data could be combined with customer information from popular online services, such as Facebook, Google or other, local (financial, social etc.) services to provide additional insights. This could be done by using probabilistic analyses to match the profiles developed using data from online services with customer profiles generated from analyses of mobile-operator data. This would require telecommunication operators, OTT providers and other Internet content providers to work together and share information.
This technique is, currently, probably the least developed one, also because of the lack of a
good ontology and of privacy issues. However, as operators seek to gain a better understanding of their customers in terms of the type of content they consume (as revealed through clickstream analyses), DPI may provide greater insights for measuring the information society. In addition, if websites could be individually classified in terms of the information they provide, then Internet-user activities, including their frequency and intensity, could be much better understood.
By applying big data techniques to survey data and administrative data from operators, new insights could be derived, in particular, in respect of the following:
Subscriptions versus subscribers: Big data techniques could help extrapolate the actual number of unique mobile subscribers or users, rather than just subscriptions, by comparing subscription numbers to user numbers derived from household surveys, and by taking into account usage patterns or data from popular Internet companies such as Google or Facebook. By linking data collected from different sources and combining subscription data and usage patterns, a correlation algorithm could be developed to reverse engineer approximate values for these indicators, in order to estimate user numbers in between surveys, and possibly in real time. This could be pursued in a similar way to the work done by Frias-Martinez and Virseda (2012) on estimating socio-economic variables using mobile-phone usage data, as described in greater detail at the beginning of this section. It is important to note here that, depending on such correlation techniques, big data methods only complement existing surveys rather than replacing them completely (see Section 5.5 for a further discussion of this).
In sum, relatively simple big data techniques can help analyse and provide complementary information on existing ICT data, and provide new insights into the measurement of the information society. This includes information on the use of different services and applications, intensity, frequency, and the geographic

195
Measuring the Information Society Report 2014
locations from which subscribers access ICT services and applications. All of these insights on subscribers could potentially be further disaggregated by different demographic and socio-economic profiles. However, all of them relate to subscriptions. Given multiple SIM usage and the fact that users will in many cases be using ICT services from more than one operator or device, additional techniques need to be leveraged if the insights articulated for subscribers are to be extended to unique individuals. Such techniques will often include combining data from surveys with big data to build new correlation and predictive analytic techniques.
Finally, it should be noted that the methods that could help improve the indicators on individual and household access and use could also be used to complement information on the use of ICTs in businesses, as well as the health and education sectors. In all cases, and for other big data for development projects, big data analysis cannot replace survey data, which is needed to build and test correlations and to validate big data results.
While the opportunities discussed above present what is analytically possible, data access and privacy considerations are complex and nuanced, and therefore place constraints on what is practically feasible or advisable. Section 5.5 discusses these challenges in greater detail.
5.5 Challenges and the way forward
Attempting to extract value from an exponentially growing data deluge of varying structure and variety comes with its share of challenges. The most pressing concerns are those associated with the standardization and interoperability of big data analytics, as well as with privacy and security. Addressing such privacy and other concerns with respect to data sharing and use is critical, and it is
important for big data producers and users to collaborate closely in that regard. This includes raising awareness about the importance and potential of producing new insights, and the establishment of public-private partnerships to exploit fully the potential of big data for development.
Data curation, standardization and continuityData curation and data preparation help to structure, archive, document and preserve data in a framework that will facilitate human understanding and decision-making. Traditional curation approaches do not scale with big data and require automation, especially since 85 per cent of big data are estimated to be unstructured (TechAmerica Foundation, 2012). Dealing with large heterogeneous data sets calls for algorithms that can understand the data shape while also providing analysts with some understanding of what the curation is doing to the data (Weber, Palmer and Chao, 2012).
Telecom network operators themselves have to contend with interoperability issues arising from the different systems (often from different vendors) they employ. It is not uncommon for operators to write customized mediation software to overcome potential inter-comparability issues among data from different systems. The problems are compounded when one has to take account of secondary third-party users that may seek to leverage the data. The framework used by an NSO to organize data would be different from that used by a network engineer or a marketing or business intelligence specialist. Naturally, telecom network operators have curated their data based on their needs. To be able to use telecom big data for development and monitoring, and to guarantee its continuity, the creation of a semantic framework would require greater consensus among the many diverse stakeholders involved (telecom operators, network equipment manufacturers, system developers, developmental practitioners and researchers, NSOs, etc.).

Chapter 5. The role of big data for ICT monitoring and for development
196
Accessing and storing data, and data philanthropyBig data for development is still in its nascent stages and, as such, comes with its share of challenges, not least of which is obtaining access to what is essentially private data. Private corporations would hesitate to share information on their clients and their business processes in case such sharing is illegal, precipitates a loss of user confidence and/or accidentally reveals competitive business processes. More importantly, companies will not share until there are incentives to do so. Until holders of big data become more comfortable about their release, it is going to be difficult for third-party research entities to gain access.
Researchers (mainly from developed countries, with some exceptions such as LIRNEasia) have recently succeeded in obtaining mobile-network big data, but it has taken them considerable time to build and leverage the necessary relationships with operators. Such privileged access is for the most part conditioned by lengthy legal agreements whose preparation requires major investments of time. All the parties to such agreements have to address the necessary parameters as to how data are to be used, including the manner in which they are to be anonymized and extracted, and with regard to time periods for access, etc. Even once agreements are in place, both researchers and operators face costs arising from the technical challenges associated with extraction of the data, on account of different curation approaches and problems relating to the interoperability of different systems.
Some mobile operators are taking tepid steps towards sharing data more publicly. Orange, for example, hosted a “Data for Development Challenge,” releasing an aggregated anonymized mobile dataset from Côte d’Ivoire to researchers and convening a conference at MIT in early 2013, where 84 papers from different researchers were presented. A follow-up conference, this time using Orange data from Senegal, is planned for
2015.30 In 2014, Telecom Italia initiated a similar challenge, making data from the territories of Milan and the Autonomous Province of Trento available to researchers for analysis.31 It has, however, gone one step further: in addition to releasing some of its own telecom datasets, it partnered with other data providers to curate and release additional big datasets containing weather, public and private transport, energy, event and social network data. In both the Orange and Telecom Italia cases, researchers had to go through an approval process in order to gain access.
Organizations such as UN Global Pulse are seeking to popularize the concept of “data philanthropy”, aimed at systematizing the regular and safe sharing of data by building on the precedents being created by the ad hoc activities outlined earlier. Such efforts by UN Global Pulse, as well as by other organizations such as LIRNEasia, that seek to bring different stakeholders to the same table, remain critical to the efforts being made to open up private-data stores in order to obtain actionable development insights.
There is a gap that needs to be addressed if large-scale pooling and sharing of such data are to become a reality. Cross-sector and cross-domain collaboration would benefit greatly from facilitators or intermediaries capable of addressing issues related to standardization and data-curation practices when pooling data from multiple sources. This facilitatory role may even be played by a third-party organization able to subsume regulatory and privacy burdens faced by data providers, effectively acting as a gatekeeper to ensure that data are used transparently and in a way that contributes to overall scientific knowledge generation, while ensuring that any safeguards that may be applicable in respect of private information are applied. Such an approach was taken recently by the pharmaceutical company Johnson and Johnson, which decided to share all of its clinical trial data. To facilitate the process, they hired Yale University’s Open Data Access (YODA) Project

197
Measuring the Information Society Report 2014
to act as gatekeepers (Krumholz, 2014). YODA undertakes the necessary scientific review of any proposals (from scientists around the world) to make use of the data and ensures that necessary privacy and data usage guidelines are followed.32
The question remains as to who is best placed to act as gatekeepers and standard-bearers when it comes to telecom network big data. Some have argued that NSOs are well placed to ensure that best practices are followed in the collection and representation of big data, and to provide a stamp of trust for potential third-party data seekers. Telecom operators, for their part, are mostly regulated by sector-specific regulators who can also have purview and dictate terms governing the privacy and data-reporting responsibilities of operators. Ultimately, however, the decision as to who takes on the gatekeeper and standardization function requires the confluence of multiple actors. It is here that organizations such as ITU, UN Global Pulse and others have a greater role to play in building an institutional model for data sharing and collaboration, in consultation with all stakeholders.
The sharing (subject to appropriate privacy protocols) of privately held data such as mobile-phone records can be mutually beneficial to both government and private sector. For example, mobile-network operators monitor and forecast their revenue at the cell-tower level. Emerging research in Africa shows how reductions in revenues, including airtime top-ups, could presage declines in income in specific regions. This could allow for targeted and timely policy actions by government to address the underlying problems, which would not be possible with the delayed insights provided by traditional statistics. Such a collaborative early-warning and early-action system shows how data sharing could be considered a business risk mitigation strategy for operators in emerging markets. However, such cooperation is predicated on opening up the currently privileged access that a few researchers and organizations have been given to mobile-operator datasets.
Finally, it should be noted that the emergence of big data is closely linked to advances in the ICT sphere, including the falling cost of data storage. Depending on the data volume, storage can still be costly, especially where privacy considerations pre-empt the use of specialized third-party cloud-based services. But as storage prices continue to fall, they are expected to be less of an issue.
Privacy and securityAs social scientists look towards private data sources, privacy and security concerns become paramount. To mitigate the potential risks, all stakeholders must see tangible benefits from such data sharing. These stakeholders include not just the public and private sectors, but also, significantly, the general public, who in many cases are the primary producers of such data through their activities. It is also the public that must ultimately decide on how the data they produce may be used. The World Economic Forum’s “Rethinking Personal Data” project has identified key trust challenges facing the personal data economy, and hosts consultations to deepen understanding of what type of trust frameworks are needed between individuals and the private and public sectors in today’s new data ecosystem.33 Discussions must address the individual’s privacy expectations, as well as those of private-sector stakeholders looking to protect their competitiveness. The most common approach to addressing this issue has been the rights-based approach. ITU, for example, has defined individual privacy as “the right of individuals to control or influence what information related to them may be disclosed” (ITU, 2006).34 Central to the rights-based privacy framework is the implicit or explicit existence of personal data that needs to be protected. OECD, for example, defines personal data as “any information relating to an identified or identifiable individual (data subject)” (OECD, 2013). The result of such an approach has been the policy of “inform and consent” practised by most companies to inform users of what data are

Chapter 5. The role of big data for ICT monitoring and for development
198
being collected and how they will be used. It has been argued, however, that in a big data world the “inform and consent” approach is woefully inadequate and impractical, and that a new approach is needed (Mayer-Schönberger and Cukier, 2013; WEF, 2013).
Firstly, user-privacy policies have morphed into long documents written in ‘legalese’ that most users can hardly comprehend and have little patience for reading in full. Secondly, in the big data paradigm, the greatest potential often lies in secondary uses, which may well manifest long after the data was originally collected. It is thus impractical for companies to have a priori knowledge of all the potential uses and to seek permission from the user every time such a new use is found. Given the volumes of data that individuals are now generating, companies would find themselves struggling to maintain meaningful control.
Of greater concern is how to articulate the privacy issues that may arise when data from one source is combined with data from other sources to reveal/infer new data and insights. This blurs the lines between personal and non-personal information, allowing seemingly non-personal data to be linked to an actual individual (Ohm, 2010). Digitized behavioural data crumbs may in fact greatly diminish personal privacy. The use of DPI, for example can technically reveal all of a user’s online activity. Going one step further, it is possible to understand a person’s needs, behaviours and preferences by using data-mining techniques on the digital breadcrumbs. For instance, a recent study showed how Facebook “likes” could accurately predict a range of behavioural attributes such as, inter alia, sexual orientation, ethnicity, religious and political views, and use of addictive substances (Kosinski, Stillwell and Graepel, 2013).
Data anonymization35 (i.e. methods designed to strip data of personal information), employed by computational social scientists, has been called into question (Narayanan and Shmatikov, 2008). A recent study of mobile CDRs for 1.5
million anonymized users covering a 15 month period showed how the authors were able to identify 90 per cent of the users with just four data points, and 50 per cent with just two points (de Montjoye, Hidalgo, Verleysen and Blondel, 2013). Although the actual real-world identities of the users were unknown, the authors point out that the data could in fact be de-anonymized completely by cross-referencing them with other data sources. The attendant privacy concerns about such cross-referencing are clear, and have to be taken seriously and addressed.
However such de-anonymization concerns remain, for the time being, somewhat premature for developing countries, mainly because the levels of ‘datafication’ in developing economies are still quite low. Where mobile-phone records are concerned, the large majority of connections in the developing world are prepaid, with minimal (if any) associated registration information. Security imperatives have increasingly prompted governments to require registration information, even for prepaid customers (GSMA, 2013b), but even with registrations becoming mandatory for prepaid connections, the registered user and the actual user may not be one and the same. Depending on the country, SIM resellers may pre-register the SIMs they sell under their own name, and SIMs that are registered by one family member may be used by other members of the same family. Sri Lankan operators, for example, see a great mismatch between the person registering a subscription and the person using it. The same may also be the case in many other developing countries.36
Irrespective, there is a consensus that there have to be safeguards in place, be they technological, conceptual, legal or, more likely, a combination of all three. These safeguards must also ensure that data are kept secure. Data breaches undermine consumer confidence and hinder efforts to exploit big data for the greater social good. Encryption, virtual private networks (VPNs), firewalls, threat monitoring and auditing are some potential technical solutions that are currently employed,
199
Measuring the Information Society Report 2014
but they need to be mainstreamed (Adolph, 2013). The paradigmatic shift required to address privacy has started, but it will be some time before a consensus is achieved on the most appropriate method(s). In response to the growing trend to unlock socio-economic value from the rising tide of big data, the World Economic Forum (WEF) initiated a global multi-stakeholder dialogue on personal data that advocated a principle-based approach, with the principles arising from a new approach that shifts governance from the data per se to its use; acknowledges the importance of context rather that treating privacy as a binary concept; and acknowledges the need for new tools to actively engage users, enabling them to make clear choices based on an actual value exchange (WEF, 2013).
Given the complexity of the questions related to privacy and data protection in a big data world, the danger is that these questions may take too long to resolve and further delay the potential use of big data for broader development. Hence, a balanced risk-based approach may be required in the context of what is under discussion here, i.e. the use of telecom big data for monitoring and development. This does still require the confluence of appropriate stakeholders. But as UN Global Pulse suggests, research into the use of big data for development can be “sandboxed”, with appropriate privacy protections imposed on researchers, while still ensuring that the broader privacy implications and solutions continue to be discussed and worked out.37
Veracity in data, analysis and results“Garbage in, garbage out”, or GIGO for short, is a computer science concept that refers to the fact that the veracity of the output of any logical process depends on the veracity of the input data. In the big data paradigm, it is easy to overlook that concept, given the expectation that when dealing with vast volumes of (often unstructured) data from a multitude of sources, “messiness” is to be expected. As Mayer-Schönberger and Cukier (2013) note, “What
we lose in accuracy at the micro level we gain in insight at the macro level.” This common conception can often be misleading. Data quality and their provenance do matter, and the question is important in establishing the generalizability of the big data findings.
Data provenance and data cleaning
Understanding data provenance involves tracing the pathways taken by data from the originating source through all the processes that may have mutated, replicated or combined the data that feed into the big data analyses. This is no simple feat. Nor, given the varied sources of data that are utilized, is it always as feasible as the scientific community would wish. However, at the very least it is important to understand some aspects of the origin of data. For example, the fact that some mobile-network operators choose to include the complete routing of a call that has been forwarded means that there may be multiple records in the CDRs for the same call. If that is not taken into consideration, the subsequent social network analysis could contain errors (overstating or understating tie strength, for example). While it may not be possible to establish data provenance as envisaged by scientists, it is at the very least important to understand the underlying processes that may have created the data.
Data cleaning remains a key part of the process to ensure data quality. It is important to verify that the quantitative and qualitative (i.e. categorical) variables have been recorded as expected. In a subsequent step, outliers must be removed, using decision-tree algorithms or other techniques. However, data cleaning itself is a subjective process (for example, one has to decide which variables to consider) and not a truly agnostic one as would be desirable, and is thus open to philosophical debate (Bollier, 2010).
Are the data representative?
Related to the question of data provenance is the issue of understanding the underlying

Chapter 5. The role of big data for ICT monitoring and for development
200
population whose behaviour has been captured. The large data sizes may make the sampling rate irrelevant, but they do not necessarily make it representative. Not everyone uses Twitter, Facebook or Google. For example, ITU estimates suggest that 40 per cent of the world’s population uses the Internet. In other words, more than four billion people globally are not yet using the Internet, and 90 per cent of them are from the developing world. Of the world’s three billion Internet users, two-thirds are from the developing countries. Even though mobile-cellular penetration is close to 100 per cent, this does not mean that every person in the world is using a mobile phone. This issue of representativeness is of high relevance when considering how telecommunication data may be used for monitoring and development. While the potential benefits to be gained from leveraging mobile-network operator data for monitoring and development purposes hinges on the large coverage, close to the actual population size, it is nevertheless not the whole population. Questions such as the extent of coverage of the poor, or the levels of gender representation among telecom users, are all valid considerations. While the registration information might provide answers, the reality is that the demographic information on telecom subscribers, for example, is not always accurate. With prepaid subscriptions being the norm in most of the developing world, the demographic information contained in mobile-operator records is practically useless, even with mandatory registration as discussed above.
The issue of sampling bias is best illustrated by the case of Street Bump, a mobile app developed by Boston City Hall. Street Bump uses a phone’s accelerometer to detect potholes while users of the app are driving around Boston and notifies City Hall. The app, however, introduces a selection bias since it is slanted towards the demographics of app users, who often hail from affluent areas with greater smartphone ownership (Harford, 2014). Hence, the “big” in big data does not automatically mean that issues such as measurement bias and methodology,
internal and external data validity and data interdependencies can be ignored. These are fundamental issues not just for “small data” but also for “big data” (Boyd and Crawford, 2012).
Behavioural change
Digitized online behaviour can be subject to self-censorship and the creation of multiple personas, so studying people’s data exhaust may not always give us insights into real-world dynamics. This may be less of an issue with TGD, where in essence the data artefact is itself a by-product of another activity. Telecom network big data, which mostly fall under this category, may be less susceptible to self-censorship and persona development, but the possibility of these phenomena cannot be ruled out. Nor is it inconceivable that users may stop using their mobiles, or even turn them off, in areas where they do not wish their digital footprint to be left behind. In a way, big data analyses of behavioural data are subject to a form of the Heisenberg uncertainty principle, whereby as soon as the basic process of an analysis is known, there may be concerted efforts to exhibit different behaviour and/or actions to change the outcomes (Bollier, 2010). For example, the famous Google page-rank algorithm has spawned an entire industry of organizations that claim to enhance website page rankings, and search-engine optimization (SEO)38 is now an established part of website development.
Changes in behaviour could also partially explain the declining veracity of Google Flu Trends (GFT), researchers having found influenza-like illness rates as reflected by Google searches to be no longer necessarily correlating with actual influenza virus infections (Ortiz et al., 2011). Recent research has shown that since 2009 (when GFT failed to reflect the non-seasonal influenza outbreak), infrequent updates have not improved the results and GFT has in fact persistently overestimated flu prevalence (Lazer, Kennedy, King and Vespignani, 2014). GFT does not and cannot know what factors contributed to the strong correlations found in its initial
201
Measuring the Information Society Report 2014
work. The point is that the underlying real-world actions of the population that turned to Google with its health queries, and which contributed to the original correlations identified by GFT, may in fact have changed over time, diminishing the robustness of the original algorithm. For example, the enthusiasm surrounding GFT may well have created rebound effects, with more and more people turning to Google with their broader health questions, thereby introducing additional search terms (due to different cultural norms and/or ground conditions) and collectively introducing biases for which GFT has been unable to account. Such potential problems could have been foreseen and resolved had the GFT method been more transparent (see Section 5.2).
Real-world context
Knowing and understanding the real-world context therefore remains important when considering big data analyses for monitoring purposes. Dr Nathan Eagle, a pioneer in the use of cellphone records to understand phenomena related to social development and public health, stresses the importance of weeding out false assumptions by conducting an a priori survey of even a small number of people. For example, in one instance, when CDR data from Rwanda showed low mobility in the wake of flooding, he theorized that this was due to an outbreak of cholera. A ground survey, however, revealed the true cause of the low mobility to be washed-out roads (David, 2013). A knowledge of ground conditions and context is also relevant when it comes to the generalizability of telecom-data analyses based on big data. For example, prior research had established a power-law distribution between the frequency of airtime recharges and average recharge amount.39 It was further found that the poor tended to top up more frequently but in smaller amounts by comparison with those higher up on the socio-economic ladder (UN Global Pulse, 2012). When researchers working with Sri Lankan mobile datasets attempted to use these findings to help them segregate their analyses for different socio-
economic groups, they were unable to do so. A survey of local context based on interviews with operators provided the reason: almost two-thirds of prepaid customers generally chose to recharge using scratch cards. Higher denomination scratch cards were not as readily available as those with lower denominations. Hence, anyone wanting to reload a higher amount often bought multiples of lower-denomination cards. After recharging with one card, the rest were kept aside for when the need arose. A lack of awareness of this local context would have led researchers to assume, mistakenly, that differing airtime-credit purchasing patterns among different socio-economic groups were not prevalent within the Sri Lankan population.
Causation versus correlation
It is easy to confuse correlation with causation in the big data paradigm, leading to the discovery of misleading patterns. As Google’s Chief Economist, Hal Varian, notes, “there are often more police in precincts with high crime, but that does not imply that increasing the number of police in a precinct would increase crime” (Varian, 2013b). Big data draws many of its techniques from machine learning, which is primarily about correlation and predictions.40 Big data are by their very nature observational and can measure only correlation and not causality. Supporters of big data have predicted the end of theory and hypothesis-testing, with correlation trumping causality as the most relevant method (Anderson, 2008; Mayer-Schönberger and Cukier, 2013). However, such predictions may be premature. The behavioural economist Sendhil Mullainathan notes that inductive science (i.e. the algorithmic mining of big data sources) will not drown out traditional deductive science (i.e. hypothesis testing), even in a big data paradigm. Among the three Vs in the traditional big data definition, volume and variety produce countervailing forces. More volume makes big data induction techniques easier and more effective, while more variety makes them harder and less effective. It is this variety issue that will ensure the need for explaining behaviour (i.e. deductive science)

Chapter 5. The role of big data for ICT monitoring and for development
202
rather than merely predicting it (Mullainathan, 2013).
Causal modelling is possible in a big data paradigm by conducting experiments. Telecom network operators themselves use such techniques when rolling out new services or, for that matter, for pricing purposes. The question, then, is how third-party researchers will be able to leverage operators’ systems in order to conduct such experiments. There is no simple answer to this, since these are proprietary systems and the issue will have to be addressed.
The role of traditional “small data” in verifi-cation
The documented failures of GFT also point to the importance of traditional statistics as corroborating evidence. For example, the true value of GFT is realized only through its pairing with “small data,” in this case the statistics collected by the Centers for Disease Control and Prevention (CDC). In fact, as Lazer et al. (2014) note, when combined with small data, “Greater value can be obtained by combining GFT with other near–real time health data.” Where data from mobile-network operators are used for syndromic surveillance, as in the case of malaria in Kenya (Wesolowski et al., 2012a), big data are most useful as a basis for encouraging timely investigation, rather than as a replacement for existing measures of disease activity. Even when engaging with the broader question of how telecommunication network data could be used for monitoring, surveys and supplemental datasets will remain important to sharpen the analyses and especially to verify the underlying assumptions. For instance, Blumenstock and Eagle (2012) ran a basic household survey against a randomized set of phone numbers prior to data anonymization to build a training dataset. This enabled them, for example, to understand variations in mobility, social networks and consumption among men and women, and between different socio-economic groups, which would not have been possible using only the call records. Similarly, Frias-Martinez and
Virseda (2012) needed census data to build their algorithms and provide training data for their algorithms to reverse engineer approximate survey maps. Official statistics will thus continue to be important to building the big data models and for periodic benchmarking so that the models can be fine-tuned to reflect ground realities.
Transparency and replicability
The issues with GFT also illustrate transparency and replicability problems with big data research. The fact that the original private data may in many cases not be available to everyone underscores the importance of opening up such private-data sources (in a manner that addresses potential privacy concerns) or of peer reviews that can hone and improve the analyses. Instead, consumers of such research have no option but to take the analysis and the results on faith. In the case of GFT, for example, the researchers, in their original Nature paper (Ginsberg et al., 2009), did not publish the original 45 search terms that had been used to make the correlation, rendering replicability impossible. Indeed, where methods are transparent they can be updated more effectively when ground realities change – something that could have prevented the problems with GFT.
Skills Engaging with and extracting value from big data calls for a combination of specialized skills in the areas of data mining, statistics and domain expertise, as well as data preparation, cleaning and visualization. NSOs may have deep statistical skills in house, but this is not enough when it comes to working with large volumes of big data calling for computer science and decision-analysis skills that are not emphasized in traditional statistical courses (McAfee and Brynjolfsson, 2012). NSOs recognize this shortcoming. In a recent global survey of NSOs from 200 economies, conducted by UNSC, respondents identified the development and

203
Measuring the Information Society Report 2014
retention of staff with the necessary skills as one of their main challenges, and identified intensive training and capacity development of their staff as a prerequisite to being able to exploit new big data sources (UNSC, 2013). Currently, there is a mismatch between the supply of and demand for talented individuals with the requisite broader skill sets, i.e. data scientists. McKinsey predicts that by 2018 the demand for data-savvy managers and analysts in the United States will amount to 450 000, whereas the supply will fall far short of this, at only 160 000 (Manyika et al., 2011). This suggests that organizations wishing to leverage big data for development will face competition from the private sector when seeking to attract the right talent. Unfortunately, developing countries, which stand to benefit the most from the use of telecommunication big data to complement official statistics, have a shortage of advanced analytical skills by comparison with developed economies. Until such time as systematic capacity development yields proper rewards, it will remain essential to import skills from outside (both local and international), despite the difficulties of attracting individuals with the right skill profiles.
The way forwardCurrent research suggests that new big data sources have great potential to complement official statistics and produce insightful information to foster development. In particular, the private sector, but also a number of development organizations, and governments have started to exploit this potential.
At the same time, this chapter argues that while there have been a number of research collaborations and promising proof-of-concept studies, no significant programme has yet been brought to a replicable scale. Future efforts to mainstream and derive full benefit from the use of big data will have to overcome a number of barriers. This includes the development of models which protect user privacy while still allowing for the extraction of insights that can
serve development purposes, in particular where developing countries are concerned. Very limited information is available on opportunities for using big data to complement official ICT statistics. Although this report highlights some of the big data sources and techniques that could be used, further research is needed to understand and confirm the usefulness of big data sources for monitoring the information society.
As with other official statistics, it is paramount for big data producers and big data users to collaborate and to initiate a dialogue to identify opportunities and understand needs and constraints. Since many of the big data sources lie within the private sector, close cooperation between NSOs, on the one hand, and telecommunication operators and Internet companies, including search engines and social networks, on the other, is necessary and could be institutionalized through public-private partnerships.
Operators and Internet companies
Business interests will naturally provide operators and Internet companies with the incentive to talk to commercial vendors of big data analytics. In addition, operators and Internet companies can benefit greatly from engagement with academia and researchers to understand how to leverage big data for different purposes. Such engagement will also broaden their understanding of the limitations and assist them in the development of new methodologies, algorithms and software techniques that can be repurposed for business-use cases. Indeed, where the applications of data use for development are concerned, operators also have an interest in maximizing the economic well-being of their customer base.
Operators and Internet companies need to take advantage of their existing customer relationships to elicit a greater understanding of consumer concerns and needs in relation to privacy. They are well placed to develop a

Chapter 5. The role of big data for ICT monitoring and for development
204
privacy framework, in consultation with other stakeholders.
Given their business concerns, operators and Internet companies may hesitate to pool and share their data with those from other sources (including from competitors), but this is something that is worth exploring. Combining big data sources has great potential to increase added value and produce new insights. There is scope for exploring established models for such pooling – for example, the sharing by banks of some of their customer data with credit bureaux.
Governments
Governments have different opportunities and different roles to play in the exploitation of big data for monitoring and development. They can use big data to identify areas where rapid intervention may be necessary, to track progress and make sure their decisions are evidence based, and to strengthen accountability. More and more governments are recognizing the importance of big data and have set up communities of practice and working groups to study their use and potential impact (UNSC 2013).
Governments should also facilitate the legislative changes that are required and take a lead in setting big data standards. To this end, national regulatory authorities (NRAs) and NSOs, in consultation with other national stakeholders, are best placed to lead the corresponding discussions and bring together the relevant stakeholders.
In particular, NSOs, given their legal mandate to collect and disseminate official statistics and set statistical standards, have an important role to play. They could become standards bodies and big data clearing houses that promote analytical best practices in relation to the use of big data for complementing official statistics and for development. Those standards, which NSOs are in the best position to enforce, would also have to encompass best practices in relation to data curation and metadata standards. To this end,
NSOs must also prioritize the upgrading of the in-house technical skills they require in order to handle big data, while at the same time investing in the necessary computational infrastructure.
As the main regulatory interface to the telecom sector, NRAs are well placed to co-champion the national discussion on how telecommunication big data may be leveraged for social good. Regulators have a role to play in facilitating the introduction of legislation that addresses privacy concerns while encouraging data sharing in a secure manner. The following recommendations were made in a recently published ITU draft paper (ITU, 2014):
• Establishing mechanisms to protect privacy: Regulators could develop a regulatory mechanism that would shift the focus of privacy protection from informed consent at the point of collecting personal data to accountable and responsible uses of personal data. This mechanism would foresee a well-resourced privacy regulator with the expertise and power to enforce such a use-based privacy protection mechanism. In return, data users would be permitted to reuse personal data for novel purposes where a privacy assessment indicates minimal privacy risks.
• Restricting the use of probabilistic predictions: While the use of big data can help better decision-making through probabilistic predictions, this information should not be used against citizens. Regulators should restrict the ways in which government agencies and others can utilize big data predictions.
• Fostering big data competition and openness: Regulators could foster big data competition in increasingly concentrated big data markets, including by ensuring that data holders allow others to access their data under fair and reasonable terms.

205
Measuring the Information Society Report 2014
International stakeholders
International stakeholders – including UN agencies and initiatives (such as ITU and UN Global Pulse), the Partnership on Measuring ICT for Development, ICT industry associations and producers of big data (Google, Facebook, etc.) – have an important role globally. More work is needed to understand fully the potential of big data and examine the challenges and opportunities related to big data in the ICT sector. To this end, the key international stakeholders have to work together to facilitate the global discussion on the use of big data.
UN Global Pulse, as one of the main UN initiatives exploring the use of big data, can do much to inform and motivate the discussion on global best practices and the use of big data for development.
Where using big data for monitoring the information society is concerned, new partnerships, including public-private partnerships between data providers and the ICT statistical community, including ITU, could be formed to explore new opportunities and address challenges, including in the area of international data comparability and standards.
As one of the main international bodies working on issues related to the telecommunication sector, ITU could leverage its position to facilitate global discussion on the use of telecom big data for monitoring the information society.
Together, ITU and UN Global Pulse could facilitate the work that needs to be done by NRAs and NSOs, through awareness raising and engagement on privacy frameworks, data sharing, and analytical global best practices. ITU could help reduce the transaction costs associated with obtaining telecommunication big data, for example by facilitating the standards-setting process. Standardized contracts for obtaining data access as well as standards on how the data are stored, collated and curated can collectively reduce the overall transaction costs of accessing and leveraging telecommunication big data for social good.
Academia, research institutes and develop-ment practitioners
The research into how telecom data may be used to aid broader development is being done mainly by academia, public and private research institutes and, to a lesser degree, development practitioners. This makes them important stakeholders in defining the state of the art with respect to leveraging big data for development. They, more than others, have been the first to engage with telecommunication operators with a view to using their data for development. They therefore understand the potential and challenges from multiple perspectives. Their collective experiences will be valuable as big data for development becomes mainstreamed.


207
Measuring the Information Society Report 2014
Chapter 5 Annex
The mobile-telecommunication data that operators possess can be classified into different types, depending on the nature of the information they produce. They include traffic data, service access detail records, location and movement data, device characteristics, customer details and tariff data.
Traffic dataOperators use a range of metrics to understand and manage the traffic flowing through their networks. These include:
• Data volume: both uplink and downlink volumes for Internet traffic can be captured at various levels of disaggregation down to the individual subscriber, or even to the level of a base station (in the case of a mobile operator) or local switch (in PSTN networks). These can be analysed to understand subscriber demand for data at both an individual level and at aggregate levels, and the understanding thus gained can be used for billing purposes and for network management.
• Erlang: a dimensionless metric used by mobile-network operators to understand the offered and utilized network load.41 Erlang data are used to understand the load on a base station at any given time.
• Call, SMS and MMS volumes are used for a variety of purposes from billing to customer relationship management, as well for network planning.
• Deep packet inspection42 (DPI) is used to scan the information that goes over a network. Operators employ DPI to varying degrees, and it is not always feasible for
the entire data stream to be captured and stored, owing to the storage requirements that would be needed and also to privacy concerns. Often only the header information, which includes originating and recipient Internet protocols (IPs), is captured for a variety of purposes, including to manage the network and understand the demand for particular applications and websites.
Service access detail records Whenever a user utilizes a telecommunication service, each access is recorded not only for infrastructure management but also for billing purposes. Depending on the type of service, the resulting records may be referred to as call detail records (CDRs), SMS/ MMS detail records, Internet access detail records, etc., and may include the following information:
• A timestamp of when the service was accessed.
• The duration of use of the service (for example, duration of a call).
• The numbers of all parties communicating (for example, a CDR would include the numbers of the originating and terminating parties).
• Applicable charges for the access.
• The type of handset used.
• The technology used (2G, 3G, etc.).
The most common use of such data is for basic billing purposes, in addition to which they can be used to build a rich profile of customers, as outlined in Section 5.3.

Chapter 5. The role of big data for ICT monitoring and for development
208
Location and movement data Mobile networks can, depending on their sophistication, capture a range of movement and location variables, which can be broadly classified into two different types: passive and active positioning data (see Annex Box 1).
Annex Box 1: Active versus passive positioning data
Passive positioning transaction generated data (TGD) is automatically generated by the network and captured in the operator’s logs for billing and network management purposes, to understand network load and to keep track of the handset in relation to its network elements. Active positioning data (which is of relevance only to mobile networks) is location and movement data that is captured in response to a specially initiated network query to locate a handset using either network or handset-based positioning methods. GPS location data can also be considered as active positioning data.
Active positioning data
Active positioning data can be generated using either device-centric or network-centric methods, as well as via satellite (i.e. GPS). The use of these methods has developed either in response to national regulations requiring operators to capture higher-precision location data, and/or to a business case for providing location-based services. The large-scale capture of such higher-resolution data is undertaken mainly by operators in developed economies. Operators in developing economies use some of these methods, but often on a case-by-case basis, and not for their entire subscriber base.43 However, this trend is currently changing, and an increasing number of regulators are considering mandating operators to collect higher-resolution location information.44 The table below lists some of the active positioning methods used by network operators.
Passive positioning data
Passive location data are contained in the subscriber’s registration information, which includes some form of mailing address (billing address in the case of postpaid). While fixed-telephone network operators have access only to static location data, mobile networks have much richer and dynamic location data.
CDRs, SMS detail records and Internet access records are the main sources of passive positioning data for mobile operators
and reside in their data warehouses. These records include the ID of the antenna (cell ID), which in turn has a geolocation, an azimuth (i.e. antenna orientation information) and an angular tilt.45 It is also possible to obtain such data in real time through data-mediation services, but these are not universally implemented.
Passive location data from the billing records are obviously sparse and generated only when the phone is used and when the network knows which cell a particular handset is currently connected to. However, many operators choose not to archive these data if they do not have a business case to justify the additional storage costs. Where they are archived, such cell-handoff data provide a time-stamped sequence of cells that the phone was attached to, and provides for a rich mobility profile as compared to the event-based billing records.
Passive positioning data based on cell IDs is inexpensive when compared to active positioning data, but the tradeoff lies in their lower precision, usually at the level of network cells. This lower-resolution location estimate can range from a few hundred metres in urban areas with a higher-density base station coverage, to a few kilometres, especially in rural areas with sparse coverage. Furthermore, handsets are not always served by the nearest antenna, for a variety of reasons associated with signal strength, topography and saturation loads at the nearest antenna during peak times. In addition, the nearest antenna may not be enabled for the network setting chosen by the user on the handset. For example, if the closest cell supports only 2G but the user has chosen to connect only to 3G networks, the handset will always connect to an antenna that supports 3G, even if it is further away. Despite these location errors or limitations that can occur in analyses using such passive location data, at an aggregate level (temporal and/or spatial) these data remain very valuable.
Source: ITU.
Device characteristicsAll mobile user devices used to access mobile telecommunication services come with an international mobile station equipment identity (IMEI) number. This 15 or 16 digit number is captured whenever a device is used to access

209
Measuring the Information Society Report 2014
Table Annex Box 1: Active positioning methods
Method Description
Cellular triangulation using angle of arrival (AoA)
The AoA method uses data from base stations that have been augmented with arrays of smart antennas. It is then possible to determine the location of a handset by triangulating known signal angles from at least two base stations. The location estimate varies from around 50 to 150m and is often towards the latter end, especially when handsets are far from the base stations.
Cellular triangulation using time of arrival (ToA)
This method uses the geo-coordinates of the cell and augments that position, by also factoring the distance to the handset inferred from the round-trip time of a signal from the antenna to the handset (using three different base stations for triangulation). This positioning method works best for cell areas with a radius greater than 500m, so it is more suited for rural and semi-urban areas with sparser antenna coverage.
GSM-GPS and assisted GPS (A-GPS)
Both of these utilize the network (mainly via triangulation from multiple base stations) to augment the satellite signal. They are particularly useful in locations and situations where there is interference in the satellite signal (e.g. inside buildings). Such location data have high spatial resolution, but are costly for operators to implement.
Enhanced observed time difference (E-OTD)
E-OTD is a device-centric positioning technique requiring the handset to make the necessary location calculation, based on the signals from three or more synchronized base stations. The accuracy of such techniques range from 50 to 125m
Note/Source: For more information regarding these methods, refer to CGALIES (2002).
telecommunication services. In addition to serving as a unique serial number for the handset, parts of it can reveal information on the handset make and model, type of technology (e.g. 2G, 3G, LTE), and it can be used for the collective categorization of handsets. Furthermore, devices used to access the Internet (mobile handsets, routers, modems) also have a unique identifier known as a media access control46 (MAC) address. Such identifiers can provide details of the device used to access the network. Mobile network operators can use the IMEI number to identify the specific mobile handset being used by a subscriber, and this in turn can provide some insight as to that subscriber’s purchasing power. See Section 5.3 for more details.
Customer detailsTelecom network operators capture various items of demographic data during the customer registration process. These can include the customer’s age, gender, billing address and national identity card number (where available). In addition, operators store the order history of when services were activated and/or deactivated,
specific service option preferences and the current account status, current international mobile subscriber identity47 (IMSI) number associated with the customer’s mobile number, MAC address of the customer’s access device, IMEI number, etc.
These details, when coupled with the customer’s service usage history, can collectively help build a rich customer/user and usage profile that the operator can leverage for a variety of purposes (see Section 5.3).
Tariff data Operators maintain the complete tariff sheet and billing records for their current and past services. This information, which associates a customer with his/her usage patterns and history, is important since operators often have customized plans not only for different categories of subscriber, but also for individual customers. Mobile operators can associate such data with traffic data to understand the revenue that is being generated by specific network elements (e.g. base stations), not only retrospectively, but also, possibly, in real time.

Chapter 5. The role of big data for ICT monitoring and for development
210
1 The report of the UN Secretary-General’s High-Level Panel of Eminent Persons on the post-2015 Development Agenda calls for a data revolution that “would draw on existing and new sources of data to fully integrate statistics into decision-making, promote open access to, and use of, data and ensure increased support for statistical systems.” This suggests that efforts to improve the availability of, and complement, official statistics have turned to the search for new data sources, including big data. In addition, the European Statistical System Committee (ESSC) in 2013 adopted the Scheveningen Memorandum on «Big Data and Official Statistics», which acknowledges that Big Data represents new opportunities and challenges for Official Statistics, and which encourages the European Statistical System and its partners to effectively examine the potential of Big Data sources, see: http://epp.eurostat.ec.europa.eu/portal/page/portal/pgp_ess/0_DOCS/estat/SCHEVENINGEN_MEMORANDUM%20Final%20version.pdf.
2 This term was first discussed in 1991, although the term then used was “transaction-generated information” (McManus, 1990)
3 For more information, see http://www.cityofboston.gov/doit/apps/streetbump.asp.
4 See http://www.donotpay.treas.gov/About.htm.
5 In Europe, the collection and processing of personal data or information is currently regulated by Directive 95/46/EC on the protection of individuals with regard to the processing of personal data and on the free movement of such data (Data Protection Directive)1 and Directive 2002/58/EC, as amended by Directive 2009/136/EC, on privacy and electronic communications (the ePrivacy Directive), which focuses more specifically on the processing of personal data in the electronic communications sector. Article 7 of the Data Protection directive establishes the principle of opt-in, according to which personal data cannot legitimately be processed without the consent of the data subject, except if necessary to preserve public order or morality, as well as to further the general interest of society or individuals. Building on this principle, Article 5 of the ePrivacy Directive further provides that the processing of personal data can be effected only with the consent of the data subject, who should be given clear and comprehensive information as to the manner and purpose of such processing, except where it is directly instrumental to the provision of a service which had been explicitly requested by the subject. See: http://policyreview.info/articles/analysis/big-data-big-responsibilities.
6 See https://www.google.org/denguetrends/.
7 A good example of this is the Conference Board Help Wanted OnLine (HWOL) data series that measures the number of new, first-time online jobs and jobs reposted from the previous month for over 16 000 Internet job boards, corporate boards and smaller job sites in the United States. More information can be found at http://www.conference-board.org/data/helpwantedonline.cfm.
8 See http://bpp.mit.edu/.
9 According to Peerreach.com, 20 per cent of Indonesia’s online population uses Twitter, the second highest ratio in the world. See http://www.ibtimes.com/twitter-usage-statistics-which-country-has-most-active-twitter-population-1474852.
10 See http://www.broadband.gov/qualitytest/about/.
11 ITU World Telecommunication/ICT Indicators database, 17th edition, 2014, available at: http://www.itu.int/en/ITU-D/Statistics/Pages/publications/wtid.aspx.
12 See http://blog.stephenwolfram.com/2013/04/data-science-of-the-facebook-world/.
13 Mobile phone records have been used to infer locations of economic activity within, and patterns of migration to, slum areas in Kenya (Wesolowski and Eagle, 2010) and internal migration in Rwanda (Joshua E. Blumenstock, 2012). Other work has sought to understand international societal ties in Rwanda (Joshua E. Blumenstock, 2011) and the effects of migration on societal ties in Portugal (Phithakkitnukoon, Calabrese, Smoreda and Ratti, 2011). Exploratory research in Latin America used mobile phone records to forecast the socio-economic levels of localities, thereby yielding approximate census maps (Frias-Martinez, Virseda-Jerez and Frias-Martinez, 2012). Mao, Shuai, Ahn and Bollen (2013) investigated the relationship between mobile phone usage and regional economic development in Côte d’Ivoire.
14 The term “metadata” is also used quite extensively to refer to TGD from telecommunication operators.
15 Deep packet inspection (DPI) is a process that utilizes specialized software to scan all of the data packets traversing a particular IP network. It can be employed by network operators (especially ISPs) to filter for malicious content (e.g. spam) or for understanding network traffic patterns with a view to optimizing their networks. For further information, see http://en.wikipedia.org/wiki/Deep_packet_inspection.
16 It should be noted that there is not a harmonized methodology for the allocation of revenues from bundled packages to each specific service. Taking into account the increasing trend towards the bundling of telecommunication services (e.g. double- and triple-play offers), revenue figures disaggregated per service are in most cases not comparable across operators and countries. For a more detailed discussion of this topic, see ITU (2014).
17 Clickstream analyses involve the collection of browsing histories in order to understand which sites were accessed, in what order and how much time was spent at each.
Endnotes

211
Measuring the Information Society Report 2014
18 Comments by SK Telecom CEO Jinwu So to Mobile Asia Expo attendees - http://www.lightreading.com/document.asp?doc_id=703298.
19 For more information on Cignifi, see their website at http://www.cignifi.com/.
20 The full report can be accessed at http://unstats.un.org/unsd/statcom/doc14/2014-11-BigData-E.pdf.
21 Syndromic surveillance refers to the collection and analysis of health data about a clinical syndrome that has a significant impact on public health, with the data in question being used to drive decisions about health policy and health education.
22 A vector-borne disease is a disease that is transmitted through an agent (person, animal or microorganism).
23 A geographic information framework is a representation framework that codes the components of geospatial data in a standardized manner so as to facilitate analyses and data exchange.
24 See http://www.itu.int/en/ITU-D/Statistics/Pages/intlcoop/partnership/default.aspx for more information regarding the partnership.
25 For the latest list of core ICT indicators refer to 2014 edition of the “Manual for Measuring ICT Access and Use by Households and Individuals available at http://www.itu.int/dms_pub/itu-d/opb/ind/D-IND-ITCMEAS-2014-PDF-E.pdf.
26 See https://gsmaintelligence.com.
27 Jana has integrated its systems with 237 mobile operators worldwide, giving them a reach of almost 2 billion subscribers, each of whom could be a potential survey respondent. For more information, see www.jana.com.
28 For more information regarding this project, see http://www.unglobalpulse.org/projects/global-snapshot-wellbeing-mobile-survey.
29 For more information regarding this project, see http://web.worldbank.org/WBSITE/EXTERNAL/EXTABOUTUS/ORGANIZATION/EXTHDNETWORK/0,,contentMDK:23154296~menuPK:2880846~pagePK:64159605~piPK:64157667~theSitePK:514426,00.html.
30 More information about the Data for Development (D4D) challenges using Orange data can be found at http://www.d4d.orange.com/home.
31 See http://www.telecomitalia.com/tit/en/bigdatachallenge/contest.html.
32 More information about the Yale University Open Data (YODA) project can be found at http://medicine.yale.edu/core/projects/yodap/index.aspx.
33 For more information, and to view the outcome reports of this project, see http://www.weforum.org/issues/rethinking-personal-data.
34 It should be noted that there is no single ITU definition of privacy, that the above definition is not universally accepted and that there are divergent views on the exact scope of the right.
35 Anonymization and security techniques are very rich. For further information, see, for example, El Emam, K. (2013).
36 Based on author interviews and conversations with operators in South Asia.
37 See, for example, http://www.unglobalpulse.org/privacy-and-data-protection for an understanding of the privacy protections UN Global Pulse imposes on its researchers.
38 SEO is an established marketing strategy whereby a website’s structure and content are optimized to make the site more visible to the webpage-indexing process of one or more search engines, thereby ensuring that the website and/or webpage appears higher up in the results of a search query.
39 In a power-law distribution, the functional relationships between two variables is such that the value of one variable varies as a power of the other.
40 See, for example, Anderson, C. (2008) and Halevey et al. (2009).
41 One Erlang could, for example, and depending on the operator, be equivalent to one person talking for 60 minutes or two people talking for 30 minutes each.
42 DPI is a process that utilizes specialized software to scan all of the data packets traversing a particular IP network. It can be employed by network operators (especially ISPs) to filter for malicious content (e.g. spam) or for understanding network traffic patterns with a view to optimizing their networks. For further information, see http://en.wikipedia.org/wiki/Deep_packet_inspection.
43 Based on interviews between LIRNEasia and operators in South and South-East Asia.
44 For example, the new Unified License that applies to all Indian operators requires mobile operators to include location details of mobile customers in the CDRs. This is in addition to the cell ID and would have to have an accuracy estimate of up to 50m within three years of the new licence coming into effect. For more information, see Chapter VIII, § 8.5, of the sample regulation on the Indian Department of Telecommunications website (http://dot.gov.in/sites/default/files/Unified%20Licence_0.pdf ).

Chapter 5. The role of big data for ICT monitoring and for development
212
45 Most network operators use multiple sectorized antennas on a single base station. When a sectorized antenna is placed on the base station it needs to be properly positioned. This includes setting the direction of the antenna (assuming a horizontal plane covering 360 degrees). This direction is known as azimuth. The angular tilt is the downward tilt (on a vertical plane) of the antenna. For more information, see http://en.wikipedia.org/wiki/Sector_antenna.
46 A media access control (MAC) address is a unique identifier that is assigned to network interfaces mostly by a hardware manufacturer. For example, the telecom operator captures the MAC address from a modem or router or handset that accesses its network and maintains the mapping of this network interface to a particular customer. For more information, see http://en.wikipedia.org/wiki/MAC_address.
47 An international mobile subscriber identity (IMSI) number is a 15-digit number unique to the particular SIM in a subscriber’s handset. The mobile operator’s system retains a mapping between an IMSI number and the particular mobile number assigned to a user. The IMSI conforms to Recommendation ITU-T E.212. For more information, see http://en.wikipedia.org/wiki/International_mobile_subscriber_identity.

213
Measuring the Information Society Report 2014
List of references
Arpce (2011), Agence de Régulation des Postes et des Communications Electroniques : Rapport d’activité 2011.
Ahas, R. and Mark, Ü. (2005), Location based services—new challenges for planning and public administration? Futures, 37(6), 547–561. doi:10.1016/j.futures.2004.10.012.
Amini, L., Bouillet, E., Calabrese, F., Gasparini, L. and Verscheure, O. (2011), Challenges and results in city-scale sensing. 2011 IEEE SENSORS Proceedings (pp. 59–61). IEEE. doi:10.1109/ICSENS.2011.6127189.
Anderson, C. (2008), The end of theory: the data deluge makes the scientific method obsolete. Wired Magazine, 16(7).
Askitas, N. and Zimmermann, K. F. (2009), Google econometrics and unemployment forecasting. Retrieved from: http://ftp.iza.org/dp4201.pdf.
Azman, A. S., Urquhart, E. A., Zaitchik, B. and Lessler, J. (2013), Using Mobile Phone Data to Supercharge Epidemic Models of Cholera Transmission in Africa: A Case Study of Côte d’Ivoire. Data for Development: Net Mobi 2013.
Bengtsson, L., Lu, X., Thorson, A., Garfield, R. and von Schreeb, J. (2011), Improved response to disasters and outbreaks by tracking population movements with mobile phone network data: a post-earthquake geospatial study in Haiti. PLoS Medicine, 8(8), e1001083. doi:10.1371/journal.pmed.1001083.
Berlingerio, M., Calabrese, F., Lorenzo, G. Di, Nair, R., Pinelli, F. and Sbodio, M. L. (2013), AllAboard: a system for exploring urban mobility and optimizing public transport using cellphone data. Data for Development: Net Mobi 2013.
Blumenstock, J. E. (2011), Using mobile phone data to measure the ties between nations. Proceedings of the 2011 iConference (pp. 195–202). New York, USA: ACM Press. doi:10.1145/1940761.1940788.
Blumenstock, J. E. (2012), Inferring patterns of internal migration from mobile phone call records: evidence from Rwanda. Information Technology for Development, 18(2), 107–125. doi:10.1080/02681102.2011.643209.
Blumenstock, J. E. and Eagle, N. (2012), Divided we call: Disparities in Access and Use of Mobile Phones in Rwanda. Information Technologies & International Development, 8(2), 1–16.
Bollier, D. (2010), The Promise and Peril of Big Data. Washington DC.
Bouckaert, J., Van Dijk, T. and Verboven, F. (2010), Access regulation, competition, and broadband penetration: An international study. Telecommunications Policy 34.11 (2010): 661-671.
Boyd, D. and Crawford, K. (2012), Critical questions for big data. Information, Communication & Society, 15(5), 662–679. doi:10.1080/1369118X.2012.678878
Broadband Commission (2013a), The State of Broadband 2013: Universalizing Broadband. Available at: http://www.broadbandcommission.org/Documents/bb-annualreport2013.pdf.
Broadband Commission (2013b), Planning for Progress: Why National Broadband Plans matter. Available at: http://www.broadbandcommission.org/documents/reportNBP2013.pdf.

References
214
Broadband Commission for Digital Development (2011), Broadband Targets for 2015. Available at: http://www.broadbandcommission.org/Documents/Broadband_Targets.pdf.
Brynjolfsson, E., Hitt, L. M. and Kim, H. H. (2011), Strength in Numbers: How Does Data-Driven Decisionmaking Affect Firm Performance? Retrieved from: http://papers.ssrn.com/sol3/papers.cfm?abstract_id=1819486.
Byrne, C. (2013), How The UN’s New Data Lab in Indonesia Uses Twitter to Preempt Disaster, Fast Company. Retrieved 19 March 2013 from: http://www.fastcolabs.com/3007178/open-company/how-uns-new-data-lab-indonesia-uses-twitter-preempt-disaster.
Caceres, N., Wideberg, J. P. and Benitez, F. G. (2007), Deriving origin–destination data from a mobile phone network. IET Intelligent Transport Systems, 1(1), 15. doi:10.1049/iet-its:20060020.
Calabrese, F., Di Lorenzo, G., Liu, L. and Ratti, C. (2011), Estimating origin-destination flows using mobile phone location data. IEEE Pervasive Computing, 10(4), 36–44. doi:10.1109/MPRV.2011.41.
CGALIES (2002), Report on implementation issues related to access to location information by emergency services (E112) in the European Union, Coordination group on access to Location Information for Emergency Services. European Commission, DG information society.
Calzada, J. and Martínez, F. (2014), Broadband prices in the European Union: Competition and commercial strategies. Information Economics and Policy, 27, 24-38.
CETIC.BR (2013), TIC Domicílios (2012), Pesquisa sobre o Uso das Tecnologias de Informação e Comunicação no Brasil. Coletiva de Imprensa, June 2013, São Paulo. Available at: http://www.cetic.br/usuarios/tic/2012/apresentacao-tic-domicilios-2012.pdf.
Choi, H. and Varian, H. (2009), Predicting initial claims for unemployment benefits. Retrieved from: http://static.googleusercontent.com/media/research.google.com/en//archive/papers/initialclaimsUS.pdf.
Choi, H. and Varian, H. (2012), Predicting the present with Google trends. Economic Record, 88, 2–9. doi:10.1111/j.1475-4932.2012.00809.x.
Cisco (2013), Cisco Visual Networking Index: Forecast and Methodology, 2012–2017, White Paper, May 2013. Available at: | http://www.cisco.com/c/en/us/solutions/collateral/service-provider/ip-ngn-ip-next-generation-network/white_paper_c11-481360.pdf.
Cisco (2014), Cisco Visual Networking Index: Global Mobile Data Traffic Forecast Update, 2013-2018, White Paper, February 2014. Available at: http://www.cisco.com/c/en/us/solutions/collateral/service-provider/visual-networking-index-vni/white_paper_c11-520862.pdf.
CCK (2010), Communications Commission of Kenya: Interconnection Determination No. 2 of 2010, August 2010. Available at: http://www.cck.go.ke/regulations/downloads/interconnection_determination_no2_2010.pdf.
CCK (2013), Communications Commission of Kenya: Quarterly sector statistics report, second quarter of the financial year 2013/2014 (Oct-Dec 2013). Available at: http://www.cck.go.ke/resc/downloads/Sector_Statistics_Report_Q2_201314.pdf.
David, T. (2013), Big Data from Cheap Phones. Technology Review, 116(3), 50–54.
De Montjoye, Y.-A., Hidalgo, C. a, Verleysen, M. and Blondel, V. D. (2013), Unique in the Crowd: The privacy bounds of human mobility. Scientific Reports, 3, 1376. doi:10.1038/srep01376.
Department of Census and Statistics Sri Lanka (2009), Computer Literacy Survey – 2009, December 2009. Available at: http://www.statistics.gov.lk/CLS/BuletinComputerLiteracy_2009.pdf.

215
Measuring the Information Society Report 2014
Eagle, N., Pentland, A. S. and Lazer, D. (2009), Inferring friendship network structure by using mobile phone data. Proceedings of the National Academy of Sciences of the United States of America, 106(36), 15274–8. doi:10.1073/pnas.0900282106l Emam, K (2013). Guide to the De-Identification of Personal Health Information, CRC Press, 2013.
European Commission (2013), E-Communications Household Survey, in Special Eurobarometer 396, November 2013. Available at: http://ec.europa.eu/digital-agenda/en/news/special-eurobarometer-396-e-communications-household-survey.
European Commission (2014), E-Communications and Telecom Single Market Household Survey. Special Eurobarometer 414, March 2014. Available at: http://ec.europa.eu/public_opinion/archives/ebs/ebs_414_en.pdf.
European Commission (2014a), Broadband access in the EU: situation at 1 July 2013. Working Document, COCOM 14-03, March 2014. Available at: http://ec.europa.eu/digital-agenda/en/news/broadband-access-eu-situation-1-july-2013.
Fink, C., Mattoo, A. and Rathindran, R. (2002), An assessment of telecommunications reform in developing countries. World Bank Policy Research Working Paper No. 2909.
Frias-Martinez, V. and Virseda, J. (2012), On the relationship between socio-economic factors and cell phone usage. In Proceedings of the Fifth International Conference on Information and Communication Technologies and Development - ICTD ’12 (p. 76). New York, New York, USA: ACM Press. doi:10.1145/2160673.2160684.
Frias-Martinez, V., Virseda-Jerez, J. and Frias-Martinez, E. (2012a), On the relation between socio-economic status and physical mobility. Information Technology for Development, 18(2), 91–106. doi:10.1080/02681102.2011.630312.
Frias-Martinez, V., Virseda-Jerez, J. and Frias-Martinez, E. (2012b), On the relation between socio-economic status and physical mobility. Information Technology for Development, 18(2), 91–106. doi:10.1080/02681102.2011.630312.
Giles, J. (2012), Computational social science: Making the links. Nature, 488(7412), 448–50. doi:10.1038/488448a.
Galpaya, H. (2011), Broadband in Sri Lanka: Glass Half Full or Half Empty? Washington, D.C: infoDev / World Bank. Available at: http://www.broadband-toolkit.org.
Galperin (2012), Prices and quality of broadband in Latin America: Benchmarking and trends, August 2012. Available at: http://www.udesa.edu.ar/files/AdmTecySociedad/12_ENG.pdf.
Ginsberg, J., Mohebbi, M. H., Patel, R. S., Brammer, L., Smolinski, M. S. and Brilliant, L. (2009), Detecting influenza epidemics using search engine query data. Nature, 457(7232), 1012–4. doi:10.1038/nature07634.
Groves, R. M. (2011), A possible data future for the observational social sciences. COSSA 30th Anniversary meeting, Washington, D.C.
Gruber, H. and Koutroumpis, P. (2013), Competition enhancing regulation and diffusion of innovation: The case of broadband networks. Journal of Regulatory Economics, 43.2 (2013): 168-195.
Gruber, H. and Verboven, F. (2001), The diffusion of mobile telecommunication services in the European Union. European Economic Review, 45, 577-588.
Grzybowski, L. (2005), Regulation of mobile telephony across the European Union: an empirical analysis. Journal of Regulatory Economics 28.1 (2005): 47-67.
GSMA and Deloitte (2013), Arab States Mobile Observatory 2013. Available at: http://www.gsma.com/publicpolicy/wpcontent/uploads/2012/03/GSMA_MobileObservatory_ArabStates2013.pdf.
GSMA (2013a), Country overview: Sri Lanka. Retrieved from: https://wiki.gsmaintelligence.com/gsma_kb/images/e/e0/Mobile_for_Development_Country_Overview_Sri_Lanka.pdf.
GSMA (2013b), The Mandatory Registration of Prepaid SIM Card Users, White Paper. Retrieved from: http://www.gsma.com/publicpolicy/wp-content/uploads/2013/11/GSMA_White-Paper_Mandatory-Registration-of-Prepaid-SIM-Users_32pgWEBv3.pdf.
References
216
Gual, J. and Trillas, F. (2004), Telecommunications policies: Determinants and impacts. CEPR Discussion Paper No. 4578.
Gutierrez, L. (2003), Regulatory governance in the Latin American telecommunications sector. Utilities Policy, 11, 225–240.
Gutierrez, L. and Berg, S. (2000), Telecommunications liberalization and regulatory governance: Lessons from Latin America. Telecommunications Policy, 24(10–11), 865–884.
Gutierrez, T., Krings, G. and Blondel, V. D. (2013), Evaluating socio-economic state of a country analyzing airtime credit and mobile phone datasets, 1–6. Retrieved from: http://arxiv.org/abs/1309.4496.
Harford, T. (2014), Big data: are we making a big mistake? Financial Times. pp. 7–11. Retrieved 28 March 2014 from: http://www.ft.com/intl/cms/s/2/21a6e7d8-b479-11e3-a09a-00144feabdc0.html#axzz2xKBWrRLJ.
IBM (2012), Analytics: The real-world use of big data. How innovative enterprises extract value from uncertain data. Retrieved from: http://public.dhe.ibm.com/common/ssi/ecm/en/gbe03519usen/GBE03519USEN.PDF.
IBM (2013), The Four V’s of Big Data. Retrieved from: http://www.ibmbigdatahub.com/sites/default/files/infographic_file/4-Vs-of-big-data.jpg.
ICT Qatar (2014), Qatar’s ICT landscape 2014 households and individuals. Available at: http://www.ictqatar.qa/en/documents/download/Qatar’s%20ICT%20Landscape%20Report%202014-Household%20and%20Individuals_12.pdf.
ITU (2006), Security in Telecommunications and Information Technology: An overview of issues and the deployment of existing ITU-T Recommendations for secure telecommunications. Retrieved from: http://www.itu.int/dms_pub/itu-t/opb/hdb/T-HDB-SEC.03-2006-PDF-E.pdf.
ITU (2009), Measuring the Information Society 2009. Available at: http://www.itu.int/ITU-D/ict/publications/idi/material/2009/MIS2009_w5.pdf.
ITU (2010), Monitoring the WSIS Targets a mid-term review. Available at: http://www.itu.int/ITU-D/ict/publications/wtdr_10/material/WTDR2010_ExecSum-en.pdf.
ITU (2011), Handbook for the collection of administrative data on Telecommunications/ICT. Available at: http://www.itu.int/en/ITU-D/Statistics/Pages/publications/handbook.aspx.
ITU (2011), Measuring the Information Society 2011. Available at: http://www.itu.int/ITU-D/ict/publications/idi/material/2011/MIS_2011_without_annex_5.pdf.
ITU (2012a), ICT adoption and prospects in the Arab region. Available at: http://www.itu.int/ITU-D/ict/publications/arab/2012/index.html.
ITU (2012b), Measuring the Information Society 2012. Available at: http://www.itu.int/en/ITU-D/Statistics/Documents/publications/mis2012/MIS2012_without_Annex_4.pdf.
ITU (2013), Big data: Big today, normal tomorrow. Retrieved from: http://www.itu.int/oth/T2301000022/en.
ITU (2013a), Measuring the Information Society 2013. Available at: http://www.itu.int/en/ITU-D/Statistics/Documents/publications/mis2013/MIS2013_without_Annex_4.pdf.
ITU (2013b), Trends in Telecommunication Reform 2013: Transnational aspects of regulation in a networked society. Available at: http://www.itu.int/pub/D-REG-TTR.14-2013.
ITU (2014), The world in 2014: ICT facts and figures. Available at: http://www.itu.int/en/ITU-D/Statistics/Documents/facts/ICTFactsFigures2014-e.pdf.
ITU (2014), ITU manual for Measuring ICT access and Use by Households and Individuals. Available at: http://www.itu.int/dms_pub/itu-d/opb/ind/D-IND-ITCMEAS-2014-PDF-E.pdf.

217
Measuring the Information Society Report 2014
ITU GSR discussion paper (2014), Big Data - Opportunity or Threat. Retrieved from: http://www.itu.int/en/ITU-D/Conferences/GSR/Documents/GSR2014/Discussion%20papers%20and%20presentations%20-%20GSR14/Session3_GSR14-DiscussionPaper-BigData.pdf.
Jones, S. (2012), Why “Big Data” is the fourth factor of production, Financial Times. Retrieved 27 December 2012 from: www.ft.com/intl/cms/s/0/5086d700-504a-11e2-9b66-00144feab49a.html.
Kosinski, M., Stillwell, D. and Graepel, T. (2013), Private traits and attributes are predictable from digital records of human behavior, 2–5. doi:10.1073/pnas.1218772110.
Koski, H. and Kretschmer, T. (2005), Entry, standards and competition: firm strategies and the diffusion of mobile telephony. Review of Industrial Organization 26.1 (2005): 89-113.
Krumholz, H. M. (2014), Give the data to the People,New York Times. Retrieved 2 February 2014 from: http://www.nytimes.com/2014/02/03/opinion/give-the-data-to-the-people.html?hp&rref=opinion&_r=1.
Kumar, K. and Muhota, K. (2012), Can Digital Footprints Lead to Greater Financial Inclusion? (pp. 1–4). Washington DC.
Laney, D. (2001), 3D data management: Controlling data volume, velocity and variety. Gartner, 6.
Lazer, D., Kennedy, R., King, G. and Vespignani, A. (2014), Big data. The parable of Google Flu: traps in big data analysis. Science (New York, N.Y.), 343(6176), 1203–5. doi:10.1126/science.1248506.
Lazer, D., Pentland, A., Adamic, L., Aral, S., Barabasi, A.-L., Brewer, D., Van Alstyne, M. (2009), Computational social science. Science (New York, N.Y.), 323(5915), 721–3. doi:10.1126/science.1167742.
Lenormand, M, Picornell, M., Cantu-Ros, O., Tugores, A., Louail, T., Herranz, R., Barthelemy, M., Frias-Martinez, E., Ramasco, J. Cross-checking different sources of mobility information, 2014.
Levy, B. and Spiller, P. (1994), The institutional foundations of regulatory commitment: A comparative analysis of telecommunications regulation. Journal of Law, Economics and Organization, 10(2), 201–246.
Levy, B. and Spiller, P. (1996), Regulations, institutions and commitment: Comparative studies of telecommunications, Cambridge, UK: Cambridge University Press.
Lokanathan, S., Silva, N. de, Kreindler, G., Miyauchi, Y. and Dhananjaya, D. (2014), Using mobile network big data for informing transportation and urban planning in Colombo.
Lu, X., Bengtsson, L. and Holme, P. (2012a), Predictability of population displacement after the 2010 Haiti earthquake. Proceedings of the National Academy of Sciences of the United States of America, 109(29), 11576–81. doi:10.1073/pnas.1203882109.
Lu, X., Bengtsson, L. and Holme, P. (2012b), Predictability of population displacement after the 2010 Haiti earthquake. Proceedings of the National Academy of Sciences of the United States of America, 109(29), 11576–81. doi:10.1073/pnas.1203882109.
Manyika, J., Chui, M., Brown, B., Bughin, J., Dobbs, R., Roxburgh, C. and Byers, A. H. (2011), Big data: The next frontier for innovation, competition, and productivity. Retrieved from: http://www.mckinsey.com/insights/mgi/research/technology_and_innovation/big_data_the_next_frontier_for_innovation.
Mao, H., Shuai, X., Ahn, Y.-Y. and Bollen, J. (2013), Mobile Communications Reveal the Regional Economy in Cote d’Ivoire. Data for Development: Net Mobi 2013.
Mayer-Schönberger, V. and Cukier, K. (2013), Big data: A revolution that will transform how we live, work, and think. Houghton Mifflin Harcourt.
McAfee, A. and Brynjolfsson, E. (2012), Big data: the management revolution. Harvard Business Review, 90(10), 60–6, 68, 128. Retrieved from: http://www.ncbi.nlm.nih.gov/pubmed/23074865.

References
218
McManus, T. E. (1990), Telephone transaction generated information: Rights and restrictions. Cambridge, MA. Retrieved from: http://www.pirp.harvard.edu/pubs_pdf/mcmanus/mcmanus-p90-5.pdf.
Mullainathan, S. (2013), What big data means for social science. HeadCon ’13 Part I. Retrieved from: http://edge.org/panel/headcon-13-part-i.
Naef, E., Muelbert, P., Raza, S., Frederick, R., Kendall, J. and Gupta, N. (2014), Using mobile data for development. Gates Foundation Whitepaper.
Narayanan, A. and Shmatikov, V. (2008), Robust de-anonymization of large sparse datasets. 2008 IEEE Symposium on Security and Privacy (sp 2008) (pp. 111–125). IEEE. doi:10.1109/SP.2008.33.
Nardotto, M., Valletti T. M. and Verboven F. (2012), Unbundling the incumbent: Evidence from UK broadband. Centre for Economic Policy Research, 2012.
North, D. (1990), Institutions, institutional change and economic performance. Cambridge, MA: Harvard University Press.
North, D. and Thomas, R. (1973), The rise of the western world: A new economic history. Cambridge, MA: Harvard University Press.
OECD (2001), Spectrum allocation: auctions and comparative selection procedures. DSTI/ICCP/TISP(2000)12/FINAL. Available at: http://www.oecd.org/dataoecd/9/43/27125982.pdf.
OECD (2013), The OECD Privacy Framework. Retrieved from: http://www.oecd.org/sti/ieconomy/oecd_privacy_framework.pdf.
Ofcom (2011), Measuring Mobile Broadband in the UK: performance delivered to PCs via dongles/datacards, September to December 2010, May 2011. Available at: http://stakeholders.ofcom.org.uk/binaries/research/telecoms-research/bbspeeds2010/Mobile_BB_performance.pdf.
Ofcom (2013), Ofcom Communications Market Report 2013, August 2013. Available at: http://stakeholders.ofcom.org.uk/binaries/research/cmr/cmr13/2013_UK_CMR.pdf.
Ohm, P. (2010), Broken promises of privacy: Responding to the surprising failure of anonymization. UCLA Law Review, 57(6).
Ortiz, J. R., Zhou, H., Shay, D. K., Neuzil, K. M., Fowlkes, A. L. and Goss, C. H. (2011), Monitoring influenza activity in the United States: a comparison of traditional surveillance systems with Google Flu Trends. PloS One, 6(4), e18687. doi:10.1371/journal.pone.0018687.
Partnership (2014), Final WSIS Targets Review: Achievements, Challenges and the Way Forward. Partnership on Measuring ICT for Development. Available at: http://www.itu.int/en/ITU-D/Statistics/Pages/publications/wsistargets2014.aspx.
Partnership UNSC (2011), Report of the Partnership on Measuring Information Communication Technology for Development, December 2011. Available at: http://unstats.un.org/unsd/statcom/doc12/2012-12-ICT-E.pdf.
Phithakkitnukoon, S., Calabrese, F., Smoreda, Z. and Ratti, C. (2011), Out of sight out of Mind-How Our Mobile Social Network Changes during Migration. 2011 IEEE Third Int’l Conference on Privacy, Security, Risk and Trust and 2011 IEEE Third Int’l Conference on Social Computing (pp. 515–520). IEEE. doi:10.1109/PASSAT/SocialCom.2011.11.
Pindolia, D. K., Garcia, A. J., Wesolowski, A., Smith, D. L., Buckee, C. O., Noor, A. M.,Tatem, A. J. (2012), Human movement data for malaria control and elimination strategic planning. Malaria Journal, 11(1), 205. doi:10.1186/1475-2875-11-205.
Ratti, C., Sobolevsky, S., Calabrese, F., Andris, C., Reades, J., Martino, M., Strogatz, S. H. (2010), Redrawing the map of Great Britain from a network of human interactions. PloS One, 5(12), e14248. doi:10.1371/journal.pone.0014248.
Ros, A. (1999), Does ownership or competition matter? The effects of telecommunications reform on network expansion and efficiency. Journal of Regulatory Economics, 1(15), 65–92.

219
Measuring the Information Society Report 2014
Ros, A. (2003), The impact of the regulatory process and price cap regulation in Latin American telecommunications markets. Review of Network Economics, 2(3), 270–286.
Simmering, J. E., Polgreen, L. A. and Polgreen, P. M. (2014), Web search query volume as a measure of pharmaceutical utilization and changes in prescribing patterns. Research in Social & Administrative Pharmacy : RSAP. doi:10.1016/j.sapharm.2014.01.003.
Sobolevsky, S., Szell, M., Campari, R., Couronné, T., Smoreda, Z. and Ratti, C. (2013), Delineating geographical regions with networks of human interactions in an extensive set of countries. PloS One, 8(12), e81707. doi:10.1371/journal.pone.0081707.
TechAmerica Foundation. (2012), Demystifying Big Data: A Practical Guide To Transforming The Business of Government. Retrieved from: http://www.techamerica.org/Docs/fileManager.cfm?f=techamerica-bigdatareport-final.pdf.
The White House (2014), Big Data: Seizing Opportunities, Preserving values. Executive Office of the President. Retrieved from: http://www.whitehouse.gov/sites/default/files/docs/big_data_privacy_report_5.1.14_final_print.pdf.
UN Global Pulse (2012), Taking the Global Pulse: Using New Data to Understand Emerging Vulnerability in Real-Time.
UN High-Level Panel (2013), A new global Partnership: Eradicate Poverty and Transform Economies through Sustainable Development. The Report of the High-Level Panel of Eminent Persons on the Post-2015 Development Agenda. Available at: http://www.post2015hlp.org/wp-content/uploads/2013/05/UN-Report.pdf.
UN-OHRLLS (2013), State of the Least Developed Countries 2013. Available at: http://unohrlls.org/custom-content/uploads/2013/10/State-of-the-LDCs-2013.pdf.
UNSC (2013), Report of the Secretary General on Big data and modernization of statistical systems.
UNSC (2014), Big data and modernization of statistical systems, December 2013. Available at: http://unstats.un.org/unsd/statcom/doc14/2014-11-BigData-E.pdf.
Van Damme, E. (2002), The European UMTS-auctions, European Economic Review, Volume 46, Issues 4-5, May 2002, pp. 846-858. doi: 10.1016/S0014-2921(01)00219-7.
Varian, H. R. (2013a), Beyond Big Data. NABE Annual Meeting. San Francisco, CA.
Varian, H. R. (2013b), Big Data: New Tricks for Econometrics.
Wallsten, S. (2001), An econometric analysis of telecom competition, privatization, and regulation in Africa and Latin America. Journal of Industrial Economics, 49(1), 1–19.
Wang, H., Calabrese, F., Di Lorenzo, G. and Ratti, C. (2010), Transportation mode inference from anonymized and aggregated mobile phone call detail records. 13th International IEEE Conference on Intelligent Transportation Systems (pp. 318–323). IEEE. doi:10.1109/ITSC.2010.5625188.
Ward, J. S. and Barker, A. (2013), Undefined By Data: A Survey of Big Data Definitions, 2. Databases. Retrieved from: http://arxiv.org/abs/1309.5821.
Waverman, L. and Koutroumpis, P. (2011), Benchmarking telecoms regulation: The Telecommunications Regulatory Governance Index (TRGI). Telecommunications Policy, 35, 450-468.
Weber, N. M., Palmer, C. L. and Chao, T. C. (2012), Current Trends and Future Directions in Data Curation Research and Education. Journal of Web Librarianship, 6(4), 305–320. doi:10.1080/19322909.2012.730358.
WEF (2013), Unlocking the Value of Personal Data: From Collection to Usage. Geneva, Switzerland. Retrieved from: http://www3.weforum.org/docs/WEF_IT_UnlockingValuePersonalData_CollectionUsage_Report_2013.pdf.
WEF (2014), The Global Information Technology Report 2014: Rewards and Risks of Big Data (B. Bilbao-Osorio, S. Dutta and B. Lanvin, Eds.).
References
220
Wesolowski, A. and Eagle, N. (2010), Parameterizing the Dynamics of Slums. AAAI Symposium on Aritificial Intelligence and Developmen (pp. 103–108).
Wesolowski, A., Eagle, N., Tatem, A. J., Smith, D. L., Noor, A. M., Snow, R. W. and Buckee, C. O. (2012a), Quantifying the impact of human mobility on malaria. Science (New York, N.Y.), 338(6104), 267–70. Doi:10.1126/science.1223467.
Wesolowski, A., Eagle, N., Tatem, A. J., Smith, D. L., Noor, A. M., Snow, R. W. and Buckee, C. O. (2012b), Quantifying the impact of human mobility on malaria. Science (New York, N.Y.), 338(6104), 267–70. doi:10.1126/science.1223467.
World Bank (2014), Ending poverty requires more than growth, Press release No. 2 014/434/DEC. Available at: http://www.worldbank.org/en/news/press-release/2014/04/10/ending-poverty-requires-more-than-growth-says-wbg.
Wu, W., Cheu, E. Y., Feng, Y., Le, D. N., Yap, G. E. and Li, X. (2013), Studying Intercity Travels and Traffic Using Cellular Network Data. Data for Development: Net Mobi 2013.
Xia, J. (2011), The third-generation-mobile (3G) policy and deployment in China: Current status, challenges, and prospects, Telecommunications Policy, Volume 35, Issue 1, February 2011, pp. 51-63. doi: 10.1016/j.telpol.2010.12.008.

221
Measuring the Information Society Report 2014
Annex 1. ICT Development Index (IDI) methodology
This annex outlines the methodology used to compute the IDI, and provides more details on various steps involved, such as the indicators included in the index and their definition, the imputation of missing values, the normalization procedure, the weights applied to the indicators and sub-indices, and the results of the sensitivity analysis.
1. Indicators included in the IDI
The selection of indicators was based on certain criteria, including relevance for the index objectives, data availability and the results of various statistical analyses such as the principal component analysis (PCA).1 The following 11 indicators are included in the IDI (grouped by the three sub-indices: access, use and skills).
a) ICT infrastructure and access indicatorsIndicators included in this group provide an indication of the available ICT infrastructure and individuals’ access to basic ICTs. Data for all of these indicators are collected by ITU.2
1. Fixed-telephone subscriptions per 100 inhabitants
Fixed-telephone subscriptions refers to the sum of active analogue fixed-telephone lines, voice-
over-IP (VoIP) subscriptions, fixed wireless local loop (WLL) subscriptions, ISDN voice-channel equivalents and fixed public payphones. It includes all accesses over fixed infrastructure supporting voice telephony using copper wire, voice services using Internet Protocol (IP) delivered over fixed (wired)-broadband infrastructure (e.g. DSL, fibre optic), and voice services provided over coaxial-cable television networks (cable modem). It also includes fixed wireless local loop (WLL) connections, which are defined as services provided by licensed fixed-line telephone operators that provide last-mile access to the subscriber using radio technology, when the call is then routed over a fixed-line telephone network (and not a mobile-cellular network). In the case of VoIP, it refers to subscriptions that offer the ability to place and receive calls at any time and do not require a computer. VoIP is also known as voice-over-broadband (VoB), and includes subscriptions through fixed-wireless, DSL, cable, fibre-optic and other fixed-broadband platforms that provide fixed telephony using IP.
2. Mobile-cellular telephone subscriptions per 100 inhabitants
Mobile-cellular telephone subscriptions refers to the number of subscriptions to a public mobile-telephone service which provides access to the public switched telephone network (PSTN) using cellular technology. It includes both the number of postpaid subscriptions and the number of active prepaid accounts (i.e. that have been

Annex 1. ICT Development Index (IDI) methodology
222
active during the past three months). It includes all mobile-cellular subscriptions that offer voice communications. It excludes subscriptions via data cards or USB modems, subscriptions to public mobile data services, private trunked mobile radio, telepoint, radio paging and telemetry services.
3. International Internet bandwidth (bit/s) per Internet user
International Internet bandwidth refers to the total used capacity of international Internet bandwidth, in megabits per second (Mbit/s). It is measured as the sum of used capacity of all Internet exchanges offering international bandwidth. If capacity is asymmetric, then the incoming capacity is used. International Internet bandwidth (bit/s) per Internet user is calculated by converting to bits per second and dividing by the total number of Internet users.
4. Percentage of households with a computer
A computer refers to a desktop computer, a laptop (portable) computer or a tablet or similar handheld computer. It does not include equipment with some embedded computing abilities, such as smart TV sets, and devices with telephony as a main function, such as mobile phones or smartphones. Household with a computer means that the computer is available for use by all members of the household at any time. The computer may or may not be owned by the household, but should be considered a household asset.3
Data are obtained by countries through national household surveys and are either provided directly to ITU by national statistical offices (NSO), or ITU carries out the necessary research to obtain them, for example from NSO websites. There are certain data limits to this indicator, insofar as estimates have to be calculated for many developing countries which do not yet collect ICT household statistics. Over time, as
more data become available, the quality of the indicator will improve.
5. Percentage of households with Internet access
The Internet is a worldwide public computer network. It provides access to a number of communication services, including the World Wide Web, and carries e-mail, news, entertainment and data files, irrespective of the device used (not assumed to be only a computer – it may also be a mobile telephone, tablet, PDA, games machine, digital TV, etc.). Access can be via a fixed or mobile network. Household with Internet access means that the Internet is available for use by all members of the household at any time.
Data are obtained by countries through national household surveys and are either provided directly to ITU by national statistical offices (NSO), or ITU carries out the necessary research to obtain them, for example from NSO websites. There are certain data limits to this indicator, insofar as estimates have to be calculated for many developing countries which do not yet collect ICT household statistics. Over time, as more data become available, the quality of the indicator will improve.
b) ICT use indicatorsThe indicators included in this group capture ICT intensity and usage. Data for all of these indicators are collected by ITU.4
1. Percentage of individuals using the Internet
Individuals using the Internet refers to people who used the Internet from any location and for any purpose, irrespective of the device and network used, in the last three months. It can be via a computer (i.e. desktop computer, laptop computer or tablet or similar handheld

223
Measuring the Information Society Report 2014
computer), mobile phone, games machine, digital TV, etc.). Access can be via a fixed or mobile network.
Data are obtained by countries through national household surveys and are either provided directly to ITU by national statistical offices (NSO), or ITU carries out the necessary research to obtain them, for example from NSO websites. There are certain data limits to this indicator, insofar as estimates have to be calculated for many developing countries which do not yet collect ICT household statistics. Over time, as more data become available, the quality of the indicator will improve.
2. Fixed (wired)-broadband subscriptions per 100 inhabitants
Fixed (wired)-broadband subscriptions refers to the number of subscriptions for high-speed access to the public Internet (a TCP/IP connection). High-speed access is defined as downstream speeds equal to, or greater than, 256 kbit/s. Fixed (wired) broadband includes cable modem, DSL, fibre and other fixed (wired)-broadband technologies (such as Ethernet LAN, and broadband-over-powerline (BPL) communications). Subscriptions with access to data communications (including the Internet) via mobile-cellular networks are excluded.
3. Wireless-broadband subscriptions per 100 inhabitants
Wireless-broadband subscriptions refers to the sum of satellite broadband, terrestrial fixed wireless broadband and active mobile-broadband subscriptions to the public Internet.
• Satellite broadband subscriptions refers to the number of satellite Internet subscriptions with an advertised download speed of at least 256 kbit/s. It refers to the retail subscription technology and not the backbone technology.
• Terrestrial fixed wireless broadband subscriptions refers to the number of terrestrial fixed wireless Internet subscriptions with an advertised download speed of at least 256 kbit/s. This includes fixed WiMAX and fixed wireless subscriptions, but excludes occasional users at hotspots and Wi-Fi hotspot subscribers. It also excludes mobile-broadband subscriptions where users can access a service throughout the country wherever coverage is available.
• Active mobile-broadband subscriptions refers to the sum of standard mobile-broadband subscriptions and dedicated mobile-broadband data subscriptions to the public Internet. It covers actual subscribers, not potential subscribers, even though the latter may have broadband-enabled handsets. Standard mobile-broadband subscriptions refers to active mobile-cellular subscriptions with advertised data speeds of 256 kbit/s or greater that allow access to the greater Internet via HTTP and which have been used to set up an Internet data connection using Internet Protocol (IP) in the past three months. Standard SMS and MMS messaging do not count as an active Internet data connection, even if the messages are delivered via IP. Dedicated mobile-broadband data subscriptions refers to subscriptions to dedicated data services (over a mobile network) that allow access to the greater Internet and which are purchased separately from voice services, either as a standalone service (e.g. using a data card such as a USB modem/dongle) or as an add-on data package to voice services which requires an additional subscription. All dedicated mobile-broadband subscriptions with recurring subscription fees are included regardless of actual use. Prepaid mobile-broadband plans require use if there is no monthly subscription. This indicator could also include mobile WiMAX subscriptions.

Annex 1. ICT Development Index (IDI) methodology
224
c) ICT skills indicatorsData on adult literacy rates and gross secondary and tertiary enrolment ratios are collected by the UNESCO Institute for Statistics (UIS).
1. Adult literacy rate
According to UIS, the Adult literacy rate is defined as “the percentage of population aged 15 years and over who can both read and write with understanding a short simple statement on his/her everyday life. Generally, ‘literacy’ also encompasses ‘numeracy’, the ability to make simple arithmetic calculations.” The main purpose of this indicator is “to show the accumulated achievement of primary education and literacy programmes in imparting basic literacy skills to the population, thereby enabling them to apply such skills in daily life and to continue learning and communicating using the written word. Literacy represents a potential for further intellectual growth and contribution to economic-socio-cultural development of society.”5
2. Gross enrolment ratio (secondary and tertiary level)
According to UIS, the Gross enrolment ratio is the “total enrolment in a specific level of education, regardless of age, expressed as a percentage of the eligible official school-age population corresponding to the same level of education in a given school-year.”
2. Imputation of missing data
A critical step in the construction of the index is to create a complete data set, without missing values. There are several imputation techniques that can be applied to estimate missing data.6 Each of the imputation techniques, like any other method
employed in the process, has its own strengths and weaknesses. The most important consideration is to ensure that the imputed data will reflect a country’s actual level of ICT access, usage and skills.
Given that ICT access and usage are both correlated with national income, hot-deck imputation was chosen as the method for imputing the missing data, where previous year data are not available to calculate the growth rates. Hot-deck imputation uses data from countries with “similar” characteristics, such as GNI per capita and geographic location. For example, missing data for country A were estimated for a certain indicator by first identifying the countries that have similar levels of GNI per capita and that are from the same region and an indicator that has a known relationship to the indicator to be estimated. For instance, Internet use data of country A was estimated by using Internet use data of country B from the same region with similar level of GNI per capita and similar level of fixed Internet and wireless-broadband subscriptions. The same logic was applied to estimate missing data for all indicators included in the index.
3. Normalization of data
Normalization of the data is necessary before any aggregation can be made in order to ensure that the data set uses the same unit of measurement. For the indicators selected for the construction of the IDI, it is important to transform the values to the same unit of measurement, since some values are expressed as a percentage of the population/of households, whereby the maximum value is 100, while other indicators can have values exceeding 100, such as mobile-cellular and wireless-broadband penetration or international Internet bandwidth (expressed as bit/s per user).
There are certain particularities that need to be taken into consideration when selecting the normalization method for the IDI. For example, in

225
Measuring the Information Society Report 2014
order to identify the digital divide, it is important to measure the relative performance of countries (i.e. the divide among countries). Second, the normalization procedure should produce index results that allow countries to track progress of their evolution towards an information society over time.
A further important criterion for the selection of the normalization method was to choose one that can be replicated by countries. Indeed, some countries have shown a strong interest in applying the index methodology at the national or regional level. Therefore, certain methods cannot be applied, for example those that rely on the values of other countries, which might not be available to users.
For the IDI, the distance to a reference measure was used as the normalization method. The reference measure is the ideal value that could be reached for each variable (similar to a goalpost). In all of the indicators chosen, this will be 100, except for four indicators:
• International Internet bandwidth per Internet user, which in 2013 ranges from 136 (bits/s/user) to almost 6 445 759. Values for this indicator vary significantly between countries. To diminish the effect of the huge dispersion of values, the data were first transformed to a logarithmic (log) scale. Outliers were then identified using a cut-off value calculated by adding two standard deviations to the mean of the rescaled values, resulting in a log value of 5.90.
• Mobile-cellular subscriptions, which in 2013 range from 5.6 to 304 per 100 inhabitants. The reference value for mobile-cellular subscriptions was reviewed and lowered to 120. This value (120) was derived by examining the distribution of countries based on their mobile-cellular subscriptions per 100 inhabitants value in 2013. For countries where postpaid is the predominant mode of subscriptions, 120 is the maximum value achieved, while in
countries where prepaid is dominant (57 per cent of all countries included in the IDI have more than 80 per cent prepaid subscriptions), 120 is also the maximum value that was reached by a majority of countries. It was therefore concluded that 120 is the ideal value that a country could reach irrespective of the type of mobile subscription that is predominant.
• Fixed-telephone subscriptions per 100 inhabitants, which in 2013 range from zero to 124. The same methodology was used to compute the reference value, resulting in a rounded value of 60 per 100 inhabitants
• Fixed (wired)-broadband subscriptions per 100 inhabitants. Values range from zero to 44.6 per 100 inhabitants in 2013. In line with fixed-telephone subscriptions, the ideal value was defined at 60 per 100 inhabitants.
After normalizing the data, the individual series were all rescaled to identical ranges, from 1 to 10. This was necessary in order to compare the values of the indicators and the sub-indices.
4. Weighting and aggregation
The indicators and sub-indices included in the IDI were weighted based on the PCA results obtained when the index was first computed.7 Annex Box 1.1 presents the weights for the indicators and sub-indices.
5. Calculating the IDI
Sub-indices were computed by summing the weighted values of the indicators included in the respective subgroup.
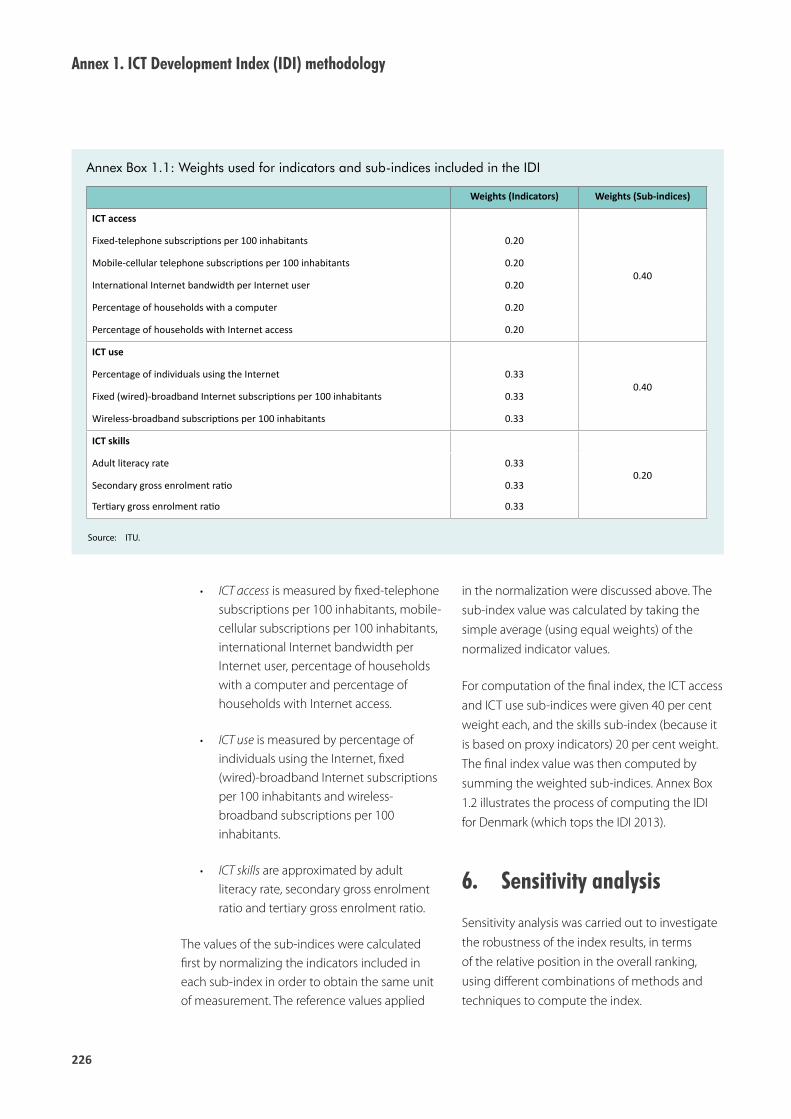
Annex 1. ICT Development Index (IDI) methodology
226
Annex Box 1.1: Weights used for indicators and sub-indices included in the IDI
Source: ITU.
Weights (Indicators) Weights (Sub-indices)
ICT access
0.40
Fixed-telephone subscriptions per 100 inhabitants 0.20
Mobile-cellular telephone subscriptions per 100 inhabitants 0.20
International Internet bandwidth per Internet user 0.20
Percentage of households with a computer 0.20
Percentage of households with Internet access 0.20
ICT use
0.40Percentage of individuals using the Internet 0.33
Fixed (wired)-broadband Internet subscriptions per 100 inhabitants 0.33
Wireless-broadband subscriptions per 100 inhabitants 0.33
ICT skills
0.20Adult literacy rate 0.33
Secondary gross enrolment ratio 0.33
Tertiary gross enrolment ratio 0.33
• ICT access is measured by fixed-telephone subscriptions per 100 inhabitants, mobile-cellular subscriptions per 100 inhabitants, international Internet bandwidth per Internet user, percentage of households with a computer and percentage of households with Internet access.
• ICT use is measured by percentage of individuals using the Internet, fixed (wired)-broadband Internet subscriptions per 100 inhabitants and wireless-broadband subscriptions per 100 inhabitants.
• ICT skills are approximated by adult literacy rate, secondary gross enrolment ratio and tertiary gross enrolment ratio.
The values of the sub-indices were calculated first by normalizing the indicators included in each sub-index in order to obtain the same unit of measurement. The reference values applied
in the normalization were discussed above. The sub-index value was calculated by taking the simple average (using equal weights) of the normalized indicator values.
For computation of the final index, the ICT access and ICT use sub-indices were given 40 per cent weight each, and the skills sub-index (because it is based on proxy indicators) 20 per cent weight. The final index value was then computed by summing the weighted sub-indices. Annex Box 1.2 illustrates the process of computing the IDI for Denmark (which tops the IDI 2013).
6. Sensitivity analysis
Sensitivity analysis was carried out to investigate the robustness of the index results, in terms of the relative position in the overall ranking, using different combinations of methods and techniques to compute the index.

227
Measuring the Information Society Report 2014
Annex Box 1.2: Example of how to calculate the IDI value
Note: *The ideal value for indicators a, b, c and g was computed by adding two standard deviations to the mean value of the indicator. ** To diminish the effect of the large number of outliers at the high end of the value scale, the data were first transformed to a logarithmic (log) scale. The ideal value of 787’260 bit/s per Internet user is equivalent to 5.90 if transformed to a log scale.
Source: ITU.
DENMARK
Indicators 2013
ICT access Ideal value*
a Fixed-telephone subscriptions per 100 inhabitants 60 37.4
b Mobile-cellular telephone subscriptions per 100 inhabitants 120 127.5
c International Internet bandwidth per Internet user** 787'260 261'221
d Percentage of households with a computer 100 93.1
e Percentage of households with Internet access 100 92.7
ICT use
f Percentage of individuals using the Internet 100 94.6
g Fixed (wired)-broadband Internet subscriptions per 100 inhabitants 60 40.2
h Wireless-broadband subscriptions per 100 inhabitants 100 107.5
ICT skills
i Adult literary rate 100 99.0
j Secondary gross enrolment ratio 100 124.7
k Tertiary gross enrolment ratio 100 79.6
Normalized values Formula Weight
ICT access
z1 Fixed-telephone subscriptions per 100 inhabitants a/60 0.20 0.62
z2 Mobile-cellular telephone subscriptions per 100 inhabitants b/120 0.20 1.00
z3 International Internet bandwidth per Internet user log(c)/5.90 0.20 0.92
z4 Percentage of households with a computer d/100 0.20 0.93
z5 Percentage of households with Internet access e/100 0.20 0.93
ICT use
z6 Percentage of individuals using the Internet f/100 0.33 0.95
z7 Fixed (wired)-broadband Internet subscriptions per 100 inhabitants g/60 0.33 0.67
z8 Wireless-broadband subscriptions per 100 inhabitants h/100 0.33 1.00
ICT skills
z9 Adult literary rate i/100 0.33 1.00
z10 Secondary gross enrolment ratio j/100 0.33 0.80
z11 Tertiary gross enrolment ratio k/100 0.33 0.99
Sub-indices Formula Weight
ICT access sub-index (L) y1+y2+y3+y4+y5 0.40 0.88
y1 Fixed-telephone subsriptions per 100 inhabitants z1*.20 0.12
y2 Mobile-cellular telephone subscriptions per 100 inhabitants z2*.20 0.20
y3 International Internet bandwidth per Internet user z3*.20 0.18
y4 Percentage of households with a computer z4*.20 0.19
y5 Percentage of households with Internet access z5*.20 0.19
ICT use sub-index (M) y6+y7+y8 0.40 0.87
y6 Percentage of individuals using the Internet z6*.33 0.32
y7 Fixed (wired)-broadband Internet subscriptions per 100 inhabitants z7*.33 0.22
y8 Wireless-broadband subscriptions per 100 inhabitants z8*.33 0.33
ICT skills sub-index (N) y9+y10+y11 0.20 0.93
y9 Adult literary rate z9*.33 0.33
y10 Secondary gross enrolment ratio z10*.33 0.27
y11 Tertiary gross enrolment ratio z11*.33 0.33
IDI ICT Development Index ((L*.40)+(M*.40)+(N*.20))*10 8.86

Annex 1. ICT Development Index (IDI) methodology
228
Potential sources of variation or uncertainty can be attributed to different processes employed in the computation of the index, including the selection of individual indicators, the imputation of missing values and the normalization, weighting and aggregation of the data.
Each of the processes or combination of processes affects the IDI value. A number of tests were carried out to examine the robustness of the IDI results (rather than the actual values). The tests computed the possible index values and country rankings for different combinations of the processes mentioned above. Results show that, while the computed index values change, the message remains the same. The IDI
was found to be extremely robust to different methodologies – with the exception of some countries, particularly countries in the “high” group.
The relative position of countries included in the “high” group (see Chapter 2) can change depending on the methodology used. Therefore, caution should be exercised when drawing conclusions based on the ranking of these countries. However, the relative position of countries included in the “low” group is in no way affected by the methods or techniques used, and the countries in this group ranked low in all index computations using different methodologies. This confirms the results conveyed by the IDI.
229
Measuring the Information Society Report 2014
1 Principal component analysis was used to examine the underlying nature of the data. A more detailed description of the analysis is available in the Annex 1 to the 2009 ‘Measuring the Information Society. The ICT Development Index’ report (ITU, 2009).
2 More information about the indicators is available in the ITU ‘Handbook for the collection of administrative data on telecommunications/ICT’ 2011, see ITU 2011 and the ITU “Manual for Measuring ICT Access and Use by Households and Individuals”, see ITU 2014.
3 This definition reflects the revisions agreed upon by the ITU Expert Group on ICT Household Indicators (EGH) at its meeting in Sao Paulo, Brazil, on 4-6 June 2013, see http://www.itu.int/en/ITU-D/Statistics/Documents/events/brazil2013/Final_report_EGH.pdf ). As some of the data used in the calculation of the IDI were collected before that meeting, however, the data may not necessarily reflect these revisions.
4 More information about the indicators is available in the ITU “Handbook for the collection of administrative data on telecommunications/ICT’” 2011, see ITU 2011b and the ITU “Manual for Measuring ICT Access and Use by Households and Individuals”, see ITU 2014.
5 UIS ‘Education Indicators: Technical Guidelines’, see http://www.uis.unesco.org/ev.php?ID=5202_201&ID2=DO_TOPIC.
6 See OECD and European Commission (2008).
7 For more details, see Annex 1 to ITU (2009).
Endnotes


231
Measuring the Information Society Report 2014
Annex 2. ICT price data methodology
1. Price data collection and sources
The price data presented in this report were collected in the fourth quarter of 2013. The data were collected through the ITU ICT Price Basket questionnaire, which was sent to the administrations and statistical contacts of all 193 ITU Member States in October 2013. Through the questionnaire, contacts were requested to provide 2013 data for fixed-telephone, mobile-cellular, fixed-broadband and mobile-broadband prices; the 2011 and 2012 prices were included for reference, where available. For those countries that did not reply, prices were collected directly from operators’ websites and/or through direct correspondence. Prices were collected from the operator with the largest market share, as measured by the number of subscriptions. Insofar as, for many countries, it is not clear which Internet service provider (ISP) has the dominant market share, preference was given to prices offered by the (former) incumbent telecommunication operator. In some cases, especially when prices were not clearly advertised or were described only in the local language, and when operators did not respond to queries, alternative operators were chosen. All prices were converted into USD using the IMF’s average annual rate of exchange for 2013 and into PPP$ using World Bank conversion factors. Prices are also presented as a percentage of countries’ monthly GNI per capita using GNI p.c. values from the World Bank (Atlas method) for 2013 or the latest available year adjusted with the international inflation rates. Prices for 2008, 2009, 2010, 2011 and 2012, which are also shown and used in this chapter,
were collected in previous years (always during the second half of the respective year), in national currencies, and converted using the average annual rates of exchange.
2. The ICT Price Basket (IPB)
The ICT Price Basket (IPB) is a composite basket that includes three price sets, referred to as sub-baskets: the fixed-telephone, mobile-cellular and fixed-broadband sub-baskets. The IPB is the value calculated from the sum of the price of each sub-basket (in USD) as a percentage of a country’s monthly GNI per capita, divided by three. The collection of price data from ITU Member States and the methodology applied for the IPB was agreed upon by the ITU Expert Group on Telecommunication/ICT Indicators (EGTI)1 and endorsed by the eighth World Telecommunication/ICT Indicators meeting held in November 2010 in Geneva, Switzerland.
The fixed-telephone sub-basket
The fixed-telephone sub-basket refers to the monthly price charged for subscribing to the public switched telephone network (PSTN), plus the cost of 30 three-minute local calls to the same (fixed) network (15 peak and 15 off-peak calls). It is calculated as a percentage of a country’s average monthly GNI per capita, and also presented in USD and PPP$.

Annex 2. ICT price data methodology
232
The fixed-telephone sub-basket does not take into consideration the one-time connection charge. This choice has been made in order to improve comparability with the other sub-baskets, which include only recurring monthly charges. If the monthly subscription includes free calls/minutes, then these are taken into consideration and deducted from the total cost of the fixed-telephone sub-basket.
The cost of a three-minute local call refers to the cost of a three-minute call within the same exchange area (local call) using the subscriber’s equipment (i.e. not from a public telephone). It thus refers to the amount the subscriber must pay for a three-minute call and not the average price for each three-minute interval. For example, some operators charge a one-time connection fee for every call or a different price for the first minute of a call. In such cases, the actual amount for the first three minutes of a call is calculated. Many operators indicate whether advertised prices include taxes or not. If they are not included, taxes are added to the prices, so as to improve the comparability between countries.2 The sub-basket does not take into consideration the price of a telephone set (see Annex Box 2.1).
The ICT Price Basket includes a sub-basket for fixed telephony because fixed-telephone access remains an important access technology in its own right in a large number of countries. Additionally, the conventional fixed-telephone line is used not only for dial-up Internet access, but also as a basis for upgrading to DSL broadband technology, which in 2013 still accounted for the majority of all fixed-broadband subscriptions. While more and more countries are moving away from narrowband/dial-up Internet access to broadband, dial-up Internet access still remains the only Internet access available to some people in developing countries. Since the IPB does not include dial-up (but only broadband) Internet prices, and since dial-up Internet access requires users to subscribe to a fixed-telephone line, the fixed-telephone sub-basket can be considered as
an indication for the price of dial-up Internet access.
The mobile-cellular sub-basket
The mobile-cellular sub-basket refers to the price of a standard basket of mobile monthly usage for 30 outgoing calls per month (on-net, off-net to a fixed line and for peak and off-peak times) in predetermined ratios, plus 100 SMS messages. It is calculated as a percentage of a country’s average monthly GNI per capita, and also presented in USD and PPP$. The mobile-cellular sub-basket is based on prepaid prices, although postpaid prices are used for countries where prepaid subscriptions make up less than 2 per cent of all mobile-cellular subscriptions.
The mobile-cellular sub-basket is largely based on, but does not entirely follow, the 2009 methodology of the OECD low-user basket, which is the entry-level basket with the smallest number of calls included (OECD, 2010b). Unlike the 2009 OECD methodology, which is based on the prices of the two largest mobile operators, the ITU mobile sub-basket uses only the largest mobile operator’s prices. Additionally, the ITU mobile-cellular sub-basket does not take into account calls to voicemail (which in the OECD basket represent 4 per cent of all calls), nor non-recurring charges, such as the one-time charge for a SIM card. The basket gives the price of a standard basket of mobile monthly usage in USD determined by OECD for 30 outgoing calls per month in predetermined ratios plus 100 SMS messages.4 The cost of national SMS is the charge to the consumer for sending a single SMS text message. Both on-net and off-net SMS prices are taken into account. The basket considers on-net and off-net calls as well as calls to a fixed telephone5 and, since the price of a call often depends on the time of day or week it is made, peak, off-peak and weekend periods are also taken into consideration. The call distribution is outlined in Table Annex 2.1.

233
Measuring the Information Society Report 2014
Annex Box 2.1: Rules applied in collecting fixed-telephone prices
1. The prices of the operator with the largest market share (measured by the number of fixed-telephone subscriptions) should be used.
2. Prices should be collected in national currency, including taxes.3
3. Only residential, single user prices should be collected. If prices vary between different regions of the country, the prices applying to the largest city (in terms of the population) should be provided. If that information is not available, the prices applying to the capital city should be reported. The selected city should be mentioned in a note in the monthly subscription indicator.
4. From all fixed-telephone plans meeting the above-mentioned criteria, the cheapest postpaid plan on the basis of 30 local calls (15 peak and 15 off-peak) of three minutes each should be selected. If there is a price distinction between residential and business tariffs, the residential tariff should be used.. If prices vary between different regions of the country, prices refer to those applied in the largest city (in terms of population). If that informtion is not available, the prices applying to the capital city are used.
5. In case operators propose different commitment periods, the 12-month plan (or the one closest to this commitment period) should be used. If the plan selected requires a longer commitment (i.e. above 12 months), this should be indicated in a note.
6. The same price plan should be used for collecting all the data specified. For example, if a given Plan A is selected for the fixed-telephone service, according to the criteria mentioned above, the elements in Plan A apply to the monthly subscription, and to the price per minute (peak and off-peak).
7. Prices should be collected for a regular (non-promotional) plan and should not include promotional offers or limited or restricted discounts (for example, only to students, or to existing customers, etc.).
8. Local calls refer to those made on the same fixed network (on-net) within the same exchange area.
9. Peak is the busiest time of the day, usually during working hours of weekdays. If there are different peak prices, the most expensive one during the daytime should be selected.
10. If there are different off-peak prices, then the one that is the cheapest before midnight should be used. If the only off-peak period is after midnight (valid during the night), then this should not be used. Instead, use the peak rate.
11. If no distinction is made between peak and off-peak prices, then the same price should be used for the peak and off-peak indicators.
12. For plans that include a certain number of minutes, the price advertised per additional minute should be used to calculate the price of a three-minute local call (i.e. the price per minute is not calculated based on the number of minutes included in the monthly subscription).
13. When the price per minute is not available, but rather per ‘units’ of a certain number of minutes are charged, the price per three minutes should be calculated and a note should be added, indicating the price per unit and the number of minutes included in the unit. For example, if the price is given per ‘units’ of two minutes, then the price for three minutes should be 2 times the price per ‘unit’.
14. With convergence, operators are increasingly providing multiple (bundled) services, such as voice telephony, Internet access and television reception, over their networks. They often bundle these offers into a single subscription. This can present a challenge for data collection, since it may not be possible to isolate the prices for one service. It is preferable to use prices for a specific service; but if this is not possible, then the additional services that are included in the price are specified in a note.
Source: ITU.
Prepaid prices were chosen because they are often the only payment method available to low-income users, who might not have a regular income and will thus not qualify for a
postpaid subscription. Rather than reflecting the cheapest option available, the mobile-cellular sub-basket therefore corresponds to a basic, representative (low-usage) package

Annex 2. ICT price data methodology
234
Annex Table 2.1: OECD mobile-cellular low-user call distribution (2009 methodology)
Note: N/A: Not applicable. Source: ITU, based on OECD (2010b).
To fixed On-net Off-net TOTALCall distribution by time of day
(%)
Call distribution (%) 17.0 56.0 26.0 100.0 100.0
Calls 5.2 16.9 7.9 30.0
Peak 2.4 7.8 3.6 13.8 46.0
Off-peak 1.5 4.9 2.3 8.7 29.0
Weekend 1.3 4.2 2.0 7.5 25.0
Duration (minutes per call) 2.0 1.6 1.7
Duration (total minutes of calls) 10.4 27.0 13.4 50.9 N/A
Peak 4.8 12.4 6.2 23.4 46.0
Off-peak 3.0 7.8 3.9 14.8 29.0
Weekend 2.6 6.8 3.4 12.7 25.0
Calls 30 calls per month
SMS 100 SMS per month (50 on-net, 50 off-net)
available to all customers. In countries where no prepaid offers are available, the monthly fixed cost (minus the free minutes of calls included, if applicable) of a postpaid subscription is added to the basket. To make prices comparable, a number of rules are applied (see Annex Box 2.2).
The fixed-broadband sub-basket
The fixed-broadband sub-basket refers to the price of a monthly subscription to an entry-level fixed-broadband plan. It is calculated as a percentage of a country’s average monthly GNI per capita, and also presented in USD and PPP$. For comparability reasons, the fixed-broadband sub-basket is based on a monthly data usage of (a minimum of ) 1 Gigabyte (GB). For plans that limit the monthly amount of data transferred by including data volume caps below 1 GB, the cost for the additional bytes is added to the sub-basket. The minimum speed of a broadband connection is 256 kbit/s.

235
Measuring the Information Society Report 2014
Annex Box 2.2: Rules applied in collecting mobile-cellular prices
1. The prices of the operator with the largest market share (measured by the number of subscriptions) should be used. If prices vary between different regions of the country, the prices refer to those applied in the largest city (in terms of population) or in the capital city.
2. Prices should be collected in national currency, including taxes.6
3. Prices refer to prepaid plans. Where the operator offers different packages with a certain number of calls and/or SMS messages included, the one that comes closest to the 30 calls and 100 SMS included is used. In countries where prepaid subscriptions account for less than 2 per cent of the total subscription base, postpaid prices may be used. In this case, the monthly subscription fee, plus any free minutes, will be taken into consideration for the calculation of the mobile-cellular sub-basket.
4. If per-minute prices are only advertised in internal units rather than in national currency, the price of the top-up/refill charge is used to convert internal units into national currency. If there are different refill prices, then the ‘cheapest/smallest’ refill card is used. If different refill charges exist depending on the validity period, the validity period for 30 days (or closest to 30 days) is used.
5. Prices refer to a regular (non-promotional) plan and exclude special or promotional offers, limited discounts or options such as special prices to certain numbers, or plans where calls can only be made during a limited number of (or on specific) days during the month.
6. If subscribers can chose “favourite” numbers (for family, friends, etc.) with a special price, this special price will not be taken into consideration, irrespective of the quantity of numbers involved.
7. Prices refer to outgoing local calls. If different rates apply for local and national calls, then the local rate is used. If charges apply to incoming calls, these are not taken into consideration.
8. If prices vary between minutes (1st minute = price A, 2nd minute = price B, 3rd minute = price C), the sum of the different prices is divided by the number of different prices (for example: price per minute = (A+B+C)/3).
9. If prices vary beyond three minutes, the average price per minute is calculated based on the first three minutes.
10. If there is a connection cost per call, then this is taken into consideration in the formula for the mobile-cellular sub-basket, based on 30 calls.
11. If there are different off-peak prices, then the one that is the cheapest before midnight is used. If the only off-peak period is after midnight, then this is not used. Instead, the peak price is used.
12. If there are different peak prices, the most expensive one during the daytime is used.
13. If there are different weekend prices, the price that applies Sundays during the daytime is used (or the equivalent day in countries where weekends are not on Sundays).
14. If there is no weekend price, the average peak and off-peak price that is valid during the week is used.
15. If peak and off-peak SMS prices exist, the average of both is used for on-net and off-net SMS.
16. If calls are charged by call or by hour (and not by the minute), the mobile-cellular sub-basket formula will be calculated on the basis of 30 calls or 50.9 minutes. Similarly, if calls are charged by call or by number of minutes for a specific network/time of the day, this will be taken into account for that particular network/time of the day.
17. Where monthly, recurring charges exist, they are added to the sub-basket.
Source: ITU.

Annex 2. ICT price data methodology
236
Annex Box 2.3: Rules applied in collecting fixed-broadband Internet prices
1. The prices of the operator with the largest market share (measured by the number of subscriptions) should be used.
2. Prices should be collected in national currency, including taxes.7
3. Only residential, single-user prices are collected. If prices vary between different regions of the country, the prices applying to the largest city (in terms of the population) should be provided. If that information is not available, the prices applying to the capital city are reported. The selected city should be mentioned in a note in the monthly subscription indicator.
4. From all fixed-broadband plans meeting the above-mentioned criteria, the cheapest one on the basis of a 1 GB monthly usage and an advertised download speed of at least 256 kbit/s should be selected. If there is a price distinction between residential and business tariffs, the residential tariff should be used.
5. In case operators propose different commitment periods, the 12-month plan (or the one closest to this commitment period) should be used. If the plan selected requires a longer commitment (i.e. above 12 months), this should be indicated in a note in the monthly subscription indicator. Furthermore, if there are different prices (for example, a discounted price for the first year, and a higher price as of the 13th month), then the price after the discount period should be selected (e.g. the price as of the 13th month). The discounted price charged during the initial period should be indicated in a note under the monthly subscription charge. The reason is that the initial price paid is considered a limited/discounted price, while the other is the regular price.
6. Prices should be collected for the fixed (wired)-broadband technology with the greatest number of subscriptions in the country (DSL, cable, etc.).
7. The same price plan should be used for collecting all the data specified. For example, if a given Plan A is selected for the fixed-broadband service, according to the criteria mentioned above, the elements in Plan A apply to the monthly subscription, the price of the excess charge, the volume of data that can be downloaded, etc.
8. Prices should be collected for regular (non-promotional) plan and should not include promotional offers or limited or restricted discounts (for example, only to students, or to existing customers, etc.).
9. With convergence, operators are increasingly providing multiple (bundled) services such as voice telephony, Internet access and television reception over their networks. They often bundle these offers into a single subscription. This can present a challenge for price data collection, since it may not be possible to isolate the prices for one service. It is preferable to use prices for a specific service (i.e. unbundled); if this is not possible, then the additional services that are included in the price plan should be specified in a note.
10. The cost of a fixed-telephone line should be excluded, if it can be used for other services as well. If a monthly rental for the physical line is not required (e.g. naked DSL), this should be mentioned in a note. If a monthly rental of a fixed-telephone line is required, this should also be explained in a note.
Source: ITU.
Where several offers are available, preference is given to the cheapest available connection that offers a speed of at least 256 kbit/s and 1 GB of data volume. If providers set a limit of less than 1 GB on the amount of data that can be transferred within a month, then the price per additional byte is added to the monthly price so as to calculate the cost of 1 GB of data per month. Preference should be given to the most widely used fixed (wired)-broadband technology
(DSL, cable, etc.). The sub-basket does not include installation charges, modem prices or telephone-line rentals that are often required for a DSL service. The price represents the broadband entry plan in terms of the minimum speed of 256 kbit/s, but does not take into account special offers that are limited in time or to specific geographic areas. The plan does not necessarily represent the fastest or most cost-effective connection since often the price for a

237
Measuring the Information Society Report 2014
higher-speed plan is cheaper in relative terms (i.e. in terms of the price per Mbit/s) (see Annex Box 2.3).
3. Mobile-broadband prices
In 2012, for the first time, ITU collected mobile-broadband prices through its annual ICT Price Basket Questionnaire.8 The collection of mobile-broadband price data from ITU Member States was agreed upon by the ITU Expert Group on Telecommunication/ICT Indicators (EGTI)9 in 2012, and revised in 2013 by EGTI in view of the lessons learned from the first data collection exercise. The revised methodology was endorsed by the eleventh World Telecommunication/ICT Indicators Symposium held in December 2013 in Mexico City, Mexico.
To capture the price of different data packages, covering prepaid and postpaid services, and supported by different devices (handset and computer), mobile-broadband prices were collected for two different data thresholds, based on a set of rules (see Annex Box 2.4).
For plans that were limited in terms of validity (less than 30 days), the price of the additional days was calculated and added to the base package in order to obtain the final price. Two possibilities exist, depending on the operator, for extending a plan limited in terms of data allowance (or validity). The customer: (i) continues to use the service and pays an excess usage charge for additional data10 or (ii) purchases an additional (add-on) package. Thus, for some countries, prices presented in this chapter reflect calculated prices of the base package plus an excess usage charge (e.g. a base package including 400 MB plus the price for 100 MB of excess usage for a monthly usage of 500 MB), or a multiplication of the base package price (e.g. twice the price of a 250 MB plan for a monthly usage of 500 MB).
The plans selected represent the least expensive offers that include the minimum amount of data for each respective mobile-broadband plan. The guiding idea is to base each plan on what customers would and could purchase given the data allowance and validity of each respective plan.

Annex 2. ICT price data methodology
238
Annex Box 2.4: Rules applied in collecting mobile-broadband prices11
1. Prices should be collected based on one of the following technologies: UMTS, HSDPA+/HSDPA, CDMA2000, and IEEE 802.16e. Prices applying to WiFi or hotspots should be excluded.
2. Prices should be collected in national currency, including taxes.
3. Only residential, single-user prices should be collected. If prices vary between different regions of the country, the prices applying to the largest city (in terms of population) or to the capital city should be provided.
4. Prices should be collected for both: a) handset-based mobile-broadband subscriptions and b) computer-based mobile-broadband subscriptions.
5. Mobile-broadband prices should be collected from the operator with the largest market share in the country, measured by the number of mobile-broadband subscriptions. If this information is not available, mobile-broadband prices should be collected from the mobile-cellular operator with the largest market share (measured by the number of mobile-cellular subscriptions) in the country.
6. Different operators can be chosen, for a different mobile-broadband service, if: a) there are differing market leaders for specific segments (postpaid, prepaid, computer-based, handset-based); b) there is no offer available for a specific sub-basket.
7. Prices should be collected for prepaid and postpaid services, for both handset and computer-based plans. If there are several plans, the plan satisfying the indicated data volume requirement should be used.
8. Where operators propose different commitment periods for postpaid mobile-broadband plans, the 12-month plan (or the closest to this commitment period) should be selected. A note should be added in case only longer commitment periods are offered.
9. Price data should be collected for the cheapest plan with a data volume allowance of a minimum of: i. 1 GB for USB/dongle (computer-based) subscriptions ii. 500 MB for handset-based subscriptions. The selected plan should not be the one with the cap closest to 500 MB or 1 GB, but include a minimum of 500 MB/1 GB. This means, for example, if an operator offers a 300 MB and an 800 MB plan, the 800 MB plan or twice the 300 MB plan (if the package can be purchased twice for a monthly capacity of 600 MB) should be selected for the 500 MB sub-sub-basket. The cheapest option should be selected. Data volumes should refer to both upload and download data volumes. If prices are linked to ‘hours of use’ and not to data volumes, this information should be added in a separate note. Note: ITU will most likely not be able to include these cases in a comparison.
10. A validity period of 30 days should be chosen. If this is not available, 15 days should be used. Offers with a validity of one day should be excluded.
11. Preference should be given to packages (including a certain data volume). Pay-as-you-go offers should be used when they are the cheapest option for a given basket or the only option available. If operators charge different pay-as-you-go rates depending on the time of the day (peak/off-peak), then the average of both should be recorded. If the off-peak rate is after midnight, it will not be taken into account.
12. Even if the plan is advertised as ‘unlimited’, the fine print should be carefully read since most often there are limits in the data volumes, either applied by throttling (limiting the speed) or by cutting the service.
13. Non-recurrent fees, such as installation/set-up fees are not collected.
14. Preference should be given to packages that are not bundled (with voice services, for example). If the plan chosen includes other services besides mobile-broadband access, these should be specified in a note.
15. Prices refer to a regular (non-promotional) plan and exclude promotional offers and limited discounts or special user groups (for example, existing clients). Special prices that apply to a certain type of phone (iPhone/Blackberry, iPad) should be excluded. Allowances during the night are not included..
Source: ITU.
239
Measuring the Information Society Report 2014
1 The Expert Group on Telecommunication/ICT Indicators (EGTI) was created in May 2009 with the mandate to revise the list of ITU supply-side indicators (i.e. data collected from operators), as well as to discuss outstanding methodological issues and new indicators. EGTI is open to all ITU members and experts in the field of ICT statistics and data collection. It works through an online discussion forum (http://www.itu.int/ITU-D/ict/ExpertGroup/default.asp) and face-to-face meetings. EGTI reports to the World Telecommunication/ICT Indicators Symposium (WTIS).
2 In some cases, it is not clear whether taxes are included or not and it was not possible to obtain this information from country contacts or operators; in such cases, the advertised price is used.
3 In some cases, it is not clear whether taxes are included or not and it was not possible to obtain this information from country contacts or operators; in such cases, the advertised price is used.
4 See OECD (2010b).
5 On-net refers to a call made to the same mobile network, while off-net and fixed-line refer to calls made to other (competing) mobile networks and to a fixed-telephone line, respectively.
6 In some cases, it is not clear whether taxes are included or not and it was not possible to obtain this information from country contacts or operators; in such cases, the advertised price is used.
7 In some cases, it is not clear whether taxes are included or not and it was not possible to obtain this information from country contacts or operators; in such cases, the advertised price is used.
8 Data for fixed-telephone, mobile-cellular and fixed-broadband have been collected since 2008 through the ITU ICT Price Basket Questionnaire, which is sent out annually to all ITU Member States/national statistical contacts.
9 See footnote 1.
10 Some operators throttle speeds after the data allowance included in the base package has been reached. Customers can then pay an excess usage charge in order to continue to have full-speed connections. In some cases, even throttled speeds are still considered broadband (i.e. equal to, or greater than, 256 kbit/s according to ITU’s definition).
11 These rules were presented to the Expert Group on Telecommunication/ICT Indicators (EGTI) in September 2012. In the 2013 revision, EGTI agreed that ITU should collect prepaid and postpaid prices, for both handset- and computer‐based services, with the following volume allowances: 1 GB for computer‐based and 500 MB for handset‐based usage. The EGTI proposals to measure mobile-broadband prices were endorsed by the eleventh World Telecommunication/ICT Indicators Symposium held in December 2013 in Mexico City, Mexico.
Endnotes


241
Measuring the Information Society Report 2014
Annex 3. Statistical tables of indicators used to compute the IDI

Annex 3. Statistical tables of indicators used to compute de IDI
242
Fixed-telephone subscriptions per 100 inhabitants
Mobile-cellular subscriptions per 100 inhabitants
International Internet bandwidth
Bit/s per Internet user
Percentage of households
with computer
Percentage of households with Internet access
Economy 2012 2013 2012 2013 2012 2013 2012 2013 2012 20131 Afghanistan 0.3 0.3 65.5 70.0 1’229 2’774 2.3 2.5 1.9 2.12 Albania 9.9 8.9 110.7 116.2 17'358 20'974 20.0 21.7 20.5 24.53 Algeria 8.4 1 8.0 1 97.5 102.0 17'824 26'275 24.2 26.0 19.4 23.84 Andorra 48.9 48.7 81.5 80.7 38'388 80'575 83.2 82.2 74.3 78.05 Angola 1.0 1.0 61.4 61.9 2'303 1'980 8.5 9.2 7.2 7.96 Antigua & Barbuda 37.2 36.8 143.0 1 127.1 97'620 108'237 56.1 56.1 48.2 48.27 Argentina 23.0 23.3 156.6 159.0 1 36'203 44'308 56.0 59.2 47.5 53.98 Armenia 19.7 19.4 111.9 112.4 40'374 55'146 38.9 40.1 34.5 35.69 Australia 45.4 2 44.3 2 105.6 2 106.8 60'407 67'099 83.0 83.5 79.0 83.0
10 Austria 39.9 3 39.4 3 160.5 156.2 95'959 128'492 81.3 80.9 79.3 80.911 Azerbaijan 18.5 4 18.7 4 108.8 107.6 39'640 45'243 45.0 52.0 46.8 51.512 Bahrain 22.7 21.8 161.2 165.9 18'108 25'856 92.7 1 93.0 79.0 1 82.013 Bangladesh 0.6 0.7 62.8 67.1 3'322 3'984 4.8 5.8 1 3.2 4.6 1
14 Barbados 50.6 52.3 123.3 108.1 39'844 52'042 69.2 69.1 62.9 66.715 Belarus 46.9 47.8 113.5 118.8 79'330 94'797 51.7 54.9 48.3 51.916 Belgium 41.9 41.3 5 111.3 3 110.9 2 183'250 201'873 80.3 81.9 77.7 80.017 Benin 1.6 1.5 83.7 93.3 2'399 3'153 4.2 4.5 2.4 2.918 Bhutan 3.6 5 3.5 6 75.6 4 72.2 3 3'287 2'750 16.4 19.1 11.6 15.519 Bolivia 8.4 8.2 90.4 5 97.7 4 4'985 9'009 1 29.5 2 31.7 10.7 2 11.520 Bosnia and Herzegovina 23.1 23.2 87.6 91.2 23'945 30'768 39.8 43.0 39.7 47.521 Botswana 8.0 6 8.6 7 153.8 6 160.6 5 6'509 6'597 12.3 13.5 9.1 10.622 Brazil 22.3 22.3 125.0 135.3 46'026 1 42'946 2 45.8 48.8 39.6 42.423 Brunei Darussalam 17.2 13.6 113.9 112.2 39'925 2 48'243 86.9 90.6 72.4 75.824 Bulgaria 29.3 26.9 7 148.1 145.2 6 90'770 107'238 52.3 54.9 50.9 53.725 Burkina Faso 0.9 0.8 60.6 66.4 1'812 3'150 3.4 4.0 2.8 3.226 Cambodia 3.9 7 2.8 128.5 133.9 13'618 9'301 6.3 9.3 2 2.1 5.527 Cameroon 3.4 3.6 60.4 70.4 2'863 3'166 8.3 8.9 3.5 4.528 Canada 50.7 8 49.7 80.1 78.4 105'065 115'948 84.1 83.6 81.5 82.629 Cape Verde 14.2 13.3 86.0 100.1 6'317 3 11'599 29.3 30.2 20.3 22.830 Central African Rep. 0.0 9 0.0 25.3 7 29.5 162 136 2.9 2.9 2.4 2.431 Chad 0.2 0.2 35.4 35.6 513 631 2.5 2.5 2.3 2.332 Chile 18.8 18.2 137.1 134.3 40'460 56'328 53.7 57.0 45.3 49.633 China 20.2 19.3 80.8 88.7 3'261 4'230 40.9 43.8 37.4 43.934 Colombia 15.0 14.8 102.9 104.1 20'372 4 76'054 3 38.4 3 42.2 3 32.1 35.7 2
35 Congo 0.3 0.4 5 98.8 104.8 204 184 4.3 4.6 1.3 1.636 Congo (Dem. Rep.) 0.1 0.0 30.6 43.7 725 539 4 1.3 1.6 1.3 1.637 Costa Rica 20.7 19.9 5 111.9 146.0 7 62'735 5 73'491 5 49.0 4 51.0 4 47.3 3 46.7 3
38 Côte d'Ivoire 1.4 1.3 91.2 95.4 16'950 22'718 2.3 2.3 1.3 1.539 Croatia 37.9 36.8 115.4 114.5 37'481 40'513 68.0 66.3 66.4 64.640 Cuba 10.8 11.0 14.9 17.7 158 405 11.3 12.7 3.8 3.441 Cyprus 33.1 30.6 98.4 95.2 70'054 63'378 69.7 70.3 61.8 64.742 Czech Republic 19.9 10 18.7 5 126.8 131.3 7 102'201 111'203 67.3 73.9 65.4 72.643 Denmark 41.1 37.4 130.3 127.5 176'203 261'221 92.3 93.1 92.0 92.744 Djibouti 2.3 2.4 24.7 28.0 11'960 10'250 15.5 16.8 5.1 6.145 Dominica 22.7 23.8 152.5 130.0 65'734 61'203 5 36.0 37.0 34.0 35.046 Dominican Rep. 11.0 4 11.3 4 86.9 88.4 16'281 16'944 6 22.1 24.5 14.4 18.647 Ecuador 14.9 11 15.2 106.2 111.5 31'804 5 29'767 1 32.2 35.7 22.5 28.348 Egypt 10.6 8.3 119.9 121.5 4'249 5'284 37.9 43.1 32.3 34.549 El Salvador 16.8 15.0 137.3 136.2 16'017 40'488 19.6 22.3 11.8 12.750 Eritrea 1.0 1.0 5.0 5.6 1'284 1'579 1.5 1.9 1.1 1.351 Estonia 34.7 33.1 160.4 8 159.7 26'684 29'130 75.5 80.0 75.0 80.352 Ethiopia 0.9 0.8 22.4 27.3 4'779 6'712 2.1 2.1 1.9 2.353 Fiji 10.1 8.5 98.2 101.1 9'232 6 14'299 2 31.7 34.2 24.4 26.754 Finland 16.4 13.9 172.3 171.7 8 161'279 172'175 87.6 88.7 86.8 89.255 France 62.1 60.8 97.4 98.5 85'525 141'511 81.0 81.6 80.0 81.756 Gabon 1.4 1.2 179.5 214.8 14'217 18'056 10.1 11.3 7.9 8.857 Gambia 3.6 3.5 85.2 100.0 2'117 7'184 7.4 7.4 6.7 7.658 Georgia 29.3 12 27.7 107.8 115.0 65'220 82'094 32.7 39.6 27.3 34.659 Germany 60.5 13 58.9 5 111.6 9 119.0 9 90'928 112'369 87.1 88.9 85.5 87.760 Ghana 1.1 1.0 101.0 108.2 3'668 5'207 36.6 5 36.6 5 31.8 4 31.8 4
61 Greece 49.1 47.9 120.1 116.8 65'292 7 84'810 56.8 59.5 53.6 56.362 Grenada 26.3 27.0 123.2 125.6 142'203 188'863 37.0 38.0 30.0 31.063 Guatemala 11.6 12.0 137.8 140.4 10'359 10'829 19.2 19.7 9.3 9.364 Guinea 0.0 0.0 48.8 63.3 2'051 2'490 2.1 2.1 1.3 1.465 Guinea-Bissau 0.3 0.3 63.1 74.1 3'220 2'934 2.3 2.3 1.6 1.866 Guyana 19.4 19.6 68.8 69.4 8'382 10'232 22.9 22.9 20.6 20.667 Honduras 7.7 7.6 92.9 10 95.9 4'868 9'954 7 15.1 20.1 13.2 16.468 Hong Kong, China 61.3 63.0 229.2 238.7 1'424'597 8 1'762'774 8 80.0 6 81.9 77.9 5 79.9 5
69 Hungary 29.7 29.9 116.1 116.4 15'622 24'891 71.4 73.1 68.6 71.570 Iceland 55.2 51.0 108.1 108.1 318'963 443'180 95.5 96.7 94.6 96.471 India 2.5 14 2.3 8 69.9 11 70.8 10 4'464 6 6'782 9 10.9 11.9 9.5 13.072 Indonesia 15.4 16.1 114.2 121.5 9'645 10'119 14.9 15.6 6.1 5.773 Iran (I.R.) 37.6 38.3 76.1 84.2 3'528 4'632 37.0 44.6 32.3 35.874 Ireland 43.9 15 44.0 9 107.2 102.8 99'722 132'296 82.7 83.6 81.1 82.475 Israel 47.0 44.8 10 120.7 122.8 58'205 100'455 80.4 85.0 70.7 71.176 Italy 35.6 16 34.3 11 159.7 12 158.9 73'547 89'750 67.1 71.1 62.9 68.977 Jamaica 9.1 8.9 98.0 13 100.4 32'064 32'310 28.5 30.5 21.3 23.578 Japan 50.5 17 50.4 12 108.7 14 115.2 11 30'086 39'211 76.2 76.2 86.2 6 86.279 Jordan 6.2 5.2 128.2 141.8 5'219 4'044 54.6 58.7 43.6 44.980 Kazakhstan 26.8 26.7 185.8 180.5 32'028 49'839 63.0 63.0 52.6 55.081 Kenya 0.6 0.5 71.2 70.6 23'711 49'860 10.8 10.8 11.5 14.282 Korea (Rep.) 61.4 61.6 109.4 111.0 25'823 30'306 82.3 80.6 97.3 98.183 Kyrgyzstan 8.9 8.3 124.2 121.4 12 3’876 3’858 17.6 20.0 7.2 7.7
Access indicators

243
Measuring the Information Society Report 2014
Fixed-telephone subscriptions per 100 inhabitants
Mobile-cellular subscriptions per 100 inhabitants
International Internet bandwidth
Bit/s per Internet user
Percentage of households
with computer
Percentage of households with Internet access
Economy 2012 2013 2012 2013 2012 2013 2012 2013 2012 201384 Lao P.D.R. 6.8 10 10.0 13 64.7 15 66.2 9'397 9 10'636 8.7 9.6 5.1 5.185 Latvia 24.3 23.4 112.1 136.6 59'738 68'069 69.5 71.7 68.7 71.686 Lebanon 18.7 18.0 80.8 80.6 18'445 10 15’443 79.7 87.9 64.0 66.287 Lesotho 2.5 2.8 75.3 86.3 6'330 5'920 5.9 6.4 3.7 4.388 Liberia 0.0 18 0.0 57.1 16 59.5 13 2'006 11 6'809 10 2.0 2.0 1.5 1.589 Lithuania 22.3 20.7 165.1 151.3 77'065 99'634 63.6 65.9 61.6 64.790 Luxembourg 50.9 19 50.5 14 145.4 148.6 4'244'992 12 6'445'759 11 92.1 94.3 93.1 94.591 Macao, China 29.2 20 28.0 15 289.8 304.0 62'095 13 79'683 12 82.6 81.9 82.5 82.692 Madagascar 1.1 1.1 39.4 36.1 493 448 2.9 3.7 2.7 3.793 Malawi 1.4 0.2 13 29.2 32.3 2'803 2'196 4.0 7 4.5 5.5 7 6.094 Malaysia 15.7 15.3 141.3 144.7 16'424 22'139 66.9 65.1 64.7 64.795 Maldives 6.8 6.5 165.6 181.2 25'479 54'510 67.2 71.9 34.3 39.496 Mali 0.8 0.7 98.4 129.1 5'292 5'893 7.7 9.3 2.5 3.097 Malta 53.7 53.9 124.4 129.8 642'269 1'204'629 78.3 80.3 77.5 78.898 Mauritania 1.7 21 1.4 16 106.0 17 102.5 14 3'042 2'571 3.7 4.0 3.4 4.399 Mauritius 28.2 29.2 119.9 123.2 18'845 24'438 44.9 48.5 39.2 44.5
100 Mexico 17.0 22 16.8 13 83.4 18 85.8 1 15'146 14 22'571 32.2 35.8 26.0 30.7101 Moldova 34.3 35.0 102.0 19 106.0 15 94'175 115'845 44.5 49.5 42.0 46.0102 Monaco 121.7 123.8 88.3 93.7 244'695 7 233'150 73.5 73.5 70.9 72.8103 Mongolia 6.3 6.2 120.7 124.2 94'295 59'708 30.3 8 34.3 14.0 8 14.0104 Montenegro 27.3 27.2 159.5 159.9 60'621 76'500 51.3 53.8 55.0 55.0105 Morocco 10.1 8.9 120.0 128.5 14'760 22'289 43.1 47.0 38.9 46.0106 Mozambique 0.3 0.3 34.9 48.0 2'046 2'867 5.9 6.7 4.7 4.6107 Myanmar 1.0 1.0 7.1 12.8 23'895 26'199 2.3 2.8 1.8 2.2108 Namibia 7.6 8.0 95.0 110.2 3'564 3'398 14.3 15.4 13.0 16.0109 Nepal 3.0 3.1 17 60.5 6 71.5 16 1'632 2'434 7.8 7.8 4.1 4.9110 Netherlands 43.0 42.5 18 118.0 113.7 17 193'291 234'975 94.5 95.2 93.5 94.6111 New Zealand 42.2 41.1 110.4 20 105.8 18 33'907 45'578 78.0 77.3 80.0 76.8 6
112 Nicaragua 5.0 10 5.3 5 97.7 21 112 7 24'725 32'595 9.9 10.9 7.4 9.4113 Niger 0.6 0.6 31.4 39.3 3'499 3'299 1.8 2.1 1.4 1.8114 Nigeria 0.2 23 0.2 19 66.8 73.3 451 758 7.1 8.4 6.3 7.8115 Norway 28.0 26.2 20 116.7 116.5 19 158'673 195'901 91.9 93.3 92.7 94.3116 Oman 9.2 9.7 159.3 154.7 8'948 33'976 72.0 82.9 6 59.8 80.1117 Pakistan 3.3 3.5 67.1 70.1 7'285 6'548 12.5 14.1 8.3 8.3118 Palestine 9.3 9.3 74.3 73.7 11'159 15'873 53.9 57.1 33.4 33.4119 Panama 15.0 15.2 5 163.4 163.0 7 55'169 14 54'291 37.1 39.3 30.5 31.5120 Paraguay 6.1 5.9 101.6 103.7 10'691 12'663 29.5 31.8 25.1 26.6121 Peru 11.4 11.3 98.0 22 98.1 8 13'094 18'140 29.9 32.0 20.2 22.1122 Philippines 3.6 3.2 105.5 104.5 44'885 57'605 16.9 18.7 18.9 22.9123 Poland 15.6 24 13.9 141.5 150.0 54'601 73'026 73.4 74.7 70.5 71.9124 Portugal 43.0 42.7 114.0 23 113.0 20 171'920 181'109 66.1 66.7 61.0 62.3125 Qatar 19.2 10 19.0 21 126.9 3 152.6 2 42'224 7 48'652 5 91.5 97.2 88.1 96.4126 Romania 21.4 21.8 105.0 24 105.6 21 125'638 136'597 56.7 61.2 53.8 58.1127 Russian Federation 29.5 28.5 145.3 25 152.8 22 27'420 41'246 67.0 69.7 59.1 67.2128 Rwanda 0.4 0.4 49.7 56.8 6'585 9'754 2.4 2.9 2.41 2.9129 Saudi Arabia 17.0 16.4 22 187.4 176.5 23 36'396 46'682 67.7 72.6 66.6 72.7130 Senegal 2.5 2.4 83.6 92.9 5'122 5'417 9.0 10.3 5.8 6.3131 Serbia 38.4 39.3 117.8 26 119.4 89'506 108'874 60.3 62.7 48.0 48.0132 Seychelles 22.7 23.4 147.8 147.3 15'606 23'646 51.9 59.3 41.9 50.6133 Singapore 37.5 36.4 7 152.1 27 155.6 24 405'306 6 580'727 2 85.0 86.0 7 84.0 86.0 7
134 Slovakia 17.9 17.7 111.9 113.9 11'969 11'779 78.8 80.1 75.4 77.9135 Slovenia 40.1 38.2 108.4 110.2 96'937 152'739 76.1 76.4 73.9 75.6136 Solomon Islands 1.5 1.4 55.0 57.6 3'614 4'822 5.1 5.5 4.2 4.2137 South Africa 9.3 9.2 130.6 147.5 3'445 3'720 23.6 25.8 33.9 9 39.4138 Spain 41.9 40.7 23 108.4 106.9 25 73'531 102'422 73.9 73.4 67.9 69.8139 Sri Lanka 16.3 6 12.7 24 91.6 95.5 5'995 15 4'964 13 15.0 16.4 10.3 12.7140 St. Kitts and Nevis 37.3 35.4 5 141.8 142.1 7 117'596 115'333 54.7 59.6 58.0 60.0141 St. Lucia 20.4 18.4 7 119.4 116.3 95'270 93'516 36.0 37.2 34.7 34.9142 St. Vincent and the Grenadines 17.7 25 17.4 116.1 114.6 577'211 16 527'482 14 62.3 66.6 49.7 54.1143 Sudan 1.1 1.1 74.4 72.9 1'703 7'634 14.0 15.3 29.3 29.3144 Suriname 16.2 15.8 106.5 127.3 173'164 201'607 30.7 9 33.8 17.3 10 19.0145 Swaziland 3.7 26 3.7 65.4 71.5 1'818 3'240 11.9 12.5 11.4 13.4146 Sweden 43.8 40.6 124.6 124.4 338'500 374'786 92.3 91.9 91.7 92.6147 Switzerland 59.0 57.9 5 132.1 133.8 7 220'142 314'129 85.8 86.6 90.0 91.8148 Syria 19.4 20.2 59.3 56.0 3'760 3'312 43.0 45.3 38.0 39.4149 Tanzania 0.4 0.3 57.0 55.7 3'974 6'460 3.2 3.4 3.3 3.7150 TFYR Macedonia 19.4 27 19.0 25 106.2 106.2 26 33'894 36'446 64.2 68.3 58.3 61.9151 Thailand 9.5 9.0 127.3 138.0 26'690 37'370 26.9 10 28.7 17.6 11 22.7 8
152 Trinidad & Tobago 21.4 21.7 140.8 144.9 18'442 7 17'156 61.0 65.0 40.0 45.0153 Tunisia 10.1 9.3 118.1 115.6 18'745 19'134 23.2 25.4 17.1 18.2154 Turkey 18.7 18.1 91.5 93.0 40'629 65'516 50.2 52.9 47.2 49.1155 Uganda 0.9 0.6 20 45.0 6 44.1 19 4'670 4'218 4.0 4.9 4.2 5.2156 Ukraine 26.8 26.2 130.3 138.1 49'818 52'883 40.5 40.5 35.6 43.7157 United Arab Emirates 21.4 22.3 149.6 171.9 32'445 52'325 85.2 90.2 72.0 76.1158 United Kingdom 52.9 52.9 124.8 123.8 291'319 352'583 87.2 88.2 86.8 88.4159 United States 43.5 42.2 5 96.0 95.5 7 63'285 64'089 78.9 11 80.0 74.8 12 77.3160 Uruguay 29.8 30.8 147.1 28 154.6 27 41'128 17 59'935 15 63.7 67.6 48.4 52.7161 Uzbekistan 6.9 6.9 71.0 29 74.3 959 1'809 8.0 9.3 9.6 9.5162 Venezuela 25.5 25.6 13 102.1 101.6 1 9'801 10'184 37.8 41.0 28.6 31.5163 Viet Nam 11.2 10.1 147.7 130.9 9'763 15'903 17.5 19.0 15.6 17.1164 Yemen 4.6 4.7 58.3 69.0 2'788 2'458 5.0 5.6 4.7 4.7165 Zambia 0.6 0.8 74.8 71.5 28 2'721 4'181 5.2 5.9 4.7 5.9166 Zimbabwe 2.2 2.1 91.9 96.3 2'643 3'461 6.5 7.0 4.9 5.3
Note: Data in italics refer to ITU estimates. For further notes, see p. 248.Source: ITU World Telecommunication/ICT Indicators database.

Annex 3. Statistical tables of indicators used to compute de IDI
244
Percentage of individuals using the Internet
Fixed (wired)-broadband subscriptions per100 inhabitants
Wireless-broadband subscriptions per 100 inhabitants
Economy 2012 2013 2012 2013 2012 20131 Afghanistan 5.5 5.9 0.0 0.0 0.4 1.22 Albania 54.7 60.1 5.1 5.8 18.8 28.23 Algeria 15.2 16.5 3.0 3.3 0.0 1 0.0 1
4 Andorra 86.4 94 34.3 34.6 1 40.2 52.35 Angola 16.9 19.1 0.2 0.2 7.2 12.56 Antigua & Barbuda 59 63.4 4.6 4.5 23.2 48.97 Argentina 55.8 59.9 12.5 13.9 2 16.4 19.8 2
8 Armenia 39.2 46.3 7.0 7.9 29.1 31.39 Australia 79.0 1 83.0 1 24.3 1 25.0 3 96.2 2 111.1 3
10 Austria 80.0 2 80.6 2 25.0 26.0 56.3 64.511 Azerbaijan 54.2 58.7 13.8 17.0 29.5 45.112 Bahrain 88 3 90.0 13.2 13.1 91.2 3 119.013 Bangladesh 5.8 6.5 3 0.4 0.6 0.5 0.514 Barbados 73.3 75.0 23.6 23.8 36.0 41.5 15 Belarus 46.9 4 54.2 4 26.9 2 29.8 33.3 46.016 Belgium 80.7 2 82.2 2 33.3 34.4 33.0 46.017 Benin 4.5 4.9 0.0 0.0 0.4 0.418 Bhutan 25.4 29.9 2.3 3 2.7 4 2.5 4 15.6 4
19 Bolivia 35.5 5 39.5 1.1 4 1.3 6.6 5 14.0 5
20 Bosnia and Herzegovina 65.4 67.9 10.6 11.8 12.2 6 23.9 6
21 Botswana 11.5 15.0 0.9 1.1 74.9 7 74.3 7
22 Brazil 48.6 6 51.6 9.2 10.1 5 33.7 52.0 8
23 Brunei Darussalam 60.3 64.5 4.8 5.7 7.6 6.524 Bulgaria 51.9 2 53.1 2 17.9 5 19.0 6 48.5 8 58.6 9
25 Burkina Faso 3.7 4.4 0.1 0.1 0.0 9.026 Cambodia 4.9 6.0 5 0.2 0.2 6.7 10.127 Cameroon 5.7 6.4 0.1 0.1 0.0 1.728 Canada 83.0 7 85.8 32.5 33.3 42.1 57.929 Cape Verde 34.7 37.5 4.0 4.3 23.0 42.630 Central African Rep. 3.0 3.5 0.0 0.0 0.0 0.131 Chad 2.1 2.3 0.2 0.1 0.0 0.032 Chile 61.4 8 66.5 12.3 12.3 28.3 35.633 China 42.3 45.8 6 12.7 13.6 16.9 21.434 Colombia 49.0 51.7 7 8.2 9.3 14.8 25.135 Congo 6.1 6.6 0.0 0.0 7 2.1 10.536 Congo (Dem. Rep.) 1.7 2.2 0.0 0.0 5.9 6.737 Costa Rica 47.5 9 46.0 8 9.3 9.7 7 54.6 9 72.3 10
38 Côte d'Ivoire 2.4 2.6 0.2 0.3 1.0 1.739 Croatia 61.9 2 66.7 2 20.7 21.5 53.9 66.140 Cuba 25.6 25.7 4 0.0 0.0 0.0 0.041 Cyprus 60.7 2 65.5 2 19.2 19.9 34.1 31.842 Czech Republic 73.4 2 74.1 2 16.4 17.0 7 52.1 10 54.4 11
43 Denmark 92.3 2 94.6 2 38.8 40.2 97.4 107.544 Djibouti 8.3 9.5 1.7 2.0 0.0 0.045 Dominica 55.2 59.0 11.9 14.8 0.0 0.046 Dominican Rep. 41.2 10 45.9 9 4.3 4.7 15.6 25.847 Ecuador 35.1 11 40.4 10 5.3 6.3 21.6 26.748 Egypt 44.0 12 49.6 4 2.8 3.3 27.9 31.149 El Salvador 20.3 23.1 11 3.8 4.5 5.5 7.550 Eritrea 0.8 0.9 0.0 0.0 0.0 0.051 Estonia 78.4 80.0 2 25.5 26.5 76.9 78.952 Ethiopia 1.5 1.9 0.0 0.3 4.4 4.953 Fiji 33.7 37.1 1.5 1.2 23.4 53.554 Finland 89.9 2 91.5 2 30.4 6 30.9 106.6 123.655 France 81.4 2 81.9 2 37.5 38.8 51.8 55.956 Gabon 8.6 9.2 0.3 0.5 0.0 0.557 Gambia 12.4 14.0 0.0 0.0 1.4 1.458 Georgia 36.9 43.1 4 9.0 10.2 8.9 11 17.459 Germany 82.3 2 84.0 2 33.7 34.6 8 40.6 12 44.8 12
60 Ghana 12.3 13 12.3 12 0.3 0.3 33.9 40.261 Greece 55.1 2 59.9 2 24.1 26.2 34.4 36.162 Grenada 32.0 35.0 15.2 17.0 0.0 0.863 Guatemala 16.0 19.7 1.8 7 1.8 9 4.5 13 6.264 Guinea 1.5 1.6 0.0 0.0 0.0 0.0 13
65 Guinea-Bissau 2.9 3.1 0.0 0.0 0.0 0.066 Guyana 33.0 33.0 3.7 4.6 0.1 0.167 Honduras 18.1 17.8 0.8 8 0.8 10 8.6 14 11.7 14
68 Hong Kong, China 72.9 14 74.2 13 31.2 30.8 83.2 95.469 Hungary 70.6 2 72.6 2 22.9 24.1 24.2 27.570 Iceland 96.2 2 96.5 2 34.3 35.1 70.9 74.771 India 12.6 15.1 1.2 9 1.2 11 2.4 3.2 15
72 Indonesia 14.7 15.8 1.2 1.3 31.6 36.073 Iran (I.R.) 27.5 31.4 4.0 5.6 1.3 15 2.5 16
74 Ireland 76.9 2 78.2 2 22.7 24.2 65.9 68.675 Israel 70.8 15 70.8 14 25.3 25.7 53.0 52.5 17
76 Italy 55.8 2 58.5 2 22.1 22.3 53.5 16 65.9 18
77 Jamaica 33.8 16 37.8 4.4 4.8 22.6 33.178 Japan 86.3 17 86.3 2 28.4 9 28.8 12 112.4 120.579 Jordan 41.0 44.2 2.8 2.8 11.3 17.880 Kazakhstan 53.3 54.0 9.8 11.6 42.5 56.681 Kenya 32.1 39.0 0.1 0.1 2.2 3.182 Korea (Rep.) 84.1 84.8 15 37.2 38.0 105.1 105.383 Kyrgyzstan 21.7 23.4 0.9 1.0 19.1 17 22.7
Use indicators

245
Measuring the Information Society Report 2014
Percentage of individuals using the Internet
Fixed (wired)-broadband subscriptions per100 inhabitants
Wireless-broadband subscriptions per 100 inhabitants
Economy 2012 2013 2012 2013 2012 201384 Lao P.D.R. 10.7 12.5 0.1 10 0.1 2.1 18 2.485 Latvia 73.1 2 75.2 2 23.3 24.7 58.2 61.286 Lebanon 61.2 70.5 9.7 10.0 28.3 43.087 Lesotho 4.6 5.0 0.1 0.1 7.5 11.588 Liberia 3.8 4.6 0.0 0.0 0.0 1.989 Lithuania 67.2 2 68.5 2 21.1 22.0 41.4 53.890 Luxembourg 91.9 2 93.8 2 32.4 33.5 80.6 19 80.5 19
91 Macao, China 61.3 18 65.8 15 26.0 26.8 288.7 303.492 Madagascar 2.1 2.2 0.0 0.1 0.4 0.593 Malawi 4.4 5.4 0.0 0.0 3.5 3.994 Malaysia 65.8 19 67.0 16 8.4 8.2 13.4 14.195 Maldives 38.9 44.1 5.3 5.8 25.3 26.296 Mali 2.2 2.3 0.0 0.0 0.7 1.897 Malta 68.2 2 68.9 2 31.1 32.8 35.0 41.298 Mauritania 5.4 6.2 0.2 0.2 13 3.6 20 5.699 Mauritius 35.4 20 39.0 11.2 12.5 22.9 29.2
100 Mexico 39.8 21 43.5 4 10.5 11 11.1 7.7 21 11.5101 Moldova 43.4 48.8 11.9 13.4 43.8 47.3102 Monaco 87.0 90.7 43.3 12 44.7 47.9 53.7103 Mongolia 16.4 22 17.7 3.7 4.9 18.4 24.7104 Montenegro 56.8 56.8 11.2 12.8 16.8 23.1105 Morocco 55.4 56.0 2.1 2.5 10.1 15.0106 Mozambique 4.8 5.4 0.1 0.1 1.8 1.7107 Myanmar 1.1 1.2 0.1 0.2 0.0 1.0108 Namibia 12.9 13.9 1.2 1.3 33.2 34.2109 Nepal 11.1 13.3 0.6 0.8 10.9 13.0110 Netherlands 92.9 2 94.0 2 39.8 40.1 14 61.3 62.3 20
111 New Zealand 82.0 1 82.8 27.8 29.2 65.9 81.9112 Nicaragua 13.5 15.5 1.7 2.2 7 1.0 1.3 10
113 Niger 1.4 1.7 0.0 0.0 0.6 0.9114 Nigeria 32.8 38.0 0.0 0.0 6.7 10.1115 Norway 94.6 2 95.1 2 36.3 36.4 15 84.8 86.5 21
116 Oman 60.0 66.5 17 2.1 2.6 50.9 68.9117 Pakistan 10.0 10.9 0.5 0.6 0.7 0.8118 Palestine 43.4 46.6 4.4 4.7 0.8 0.9119 Panama 40.3 23 42.9 7.8 11 7.7 7 25.3 22 25.2 22
120 Paraguay 29.3 6 36.9 18 1.2 1.6 6.0 5.6121 Peru 38.2 21 39.2 4 4.7 5.2 2.6 3.0122 Philippines 36.2 37.0 2.2 2.6 24.0 27.2123 Poland 62.3 2 62.8 2 15.6 13 15.6 63.6 59.5124 Portugal 60.3 2 62.1 2 22.5 23.8 32.8 36.7125 Qatar 69.3 19 85.3 16 9.0 14 9.9 16 61.8 23 76.8 23
126 Romania 45.9 2 49.8 2 16.1 15 17.3 17 27.0 37.7127 Russian Federation 63.8 61.4 19 14.5 16.6 52.8 60.2128 Rwanda 8.0 8.7 0.0 0.0 3.2 5.8129 Saudi Arabia 54.0 60.5 6.9 7.3 58.4 70.6130 Senegal 19.2 20.9 0.7 0.8 3.6 15.3131 Serbia 48.1 51.5 12.9 13.9 52.0 55.7132 Seychelles 47.1 50.4 11.0 12.9 8.6 10.3133 Singapore 72.0 24 73.0 20 25.4 25.7 11 126.1 136.6 24
134 Slovakia 76.7 2 77.9 2 14.7 15.5 39.7 54.9135 Slovenia 68.3 2 72.7 2 24.3 25.0 36.7 42.1136 Solomon Islands 7.0 8.0 0.4 0.3 6.5 8.0137 South Africa 41.0 48.9 2.1 3.1 25.2 28.7138 Spain 69.8 2 71.6 2 24.4 25.6 18 53.6 67.2 25
139 Sri Lanka 18.3 21.9 1.7 2.0 7.8 7.8140 St. Kitts and Nevis 79.3 80.0 24.3 24.5 19 0.0 5.5141 St. Lucia 34.8 1 35.2 13.6 13.7 19.1 17 32.7142 St. Vincent and the Grenadines 47.5 52.0 12.4 13.4 0.0 0.0 26
143 Sudan 21.0 1 22.7 0.1 0.1 20.5 26.8144 Suriname 34.7 37.4 5.5 6.9 15.0 24 13.1145 Swaziland 20.8 24.7 0.3 0.3 3.2 4.4146 Sweden 93.2 2 94.8 2 32.3 32.6 104.9 110.3147 Switzerland 85.2 25 86.7 21 40.1 43.0 39.6 44.3 27
148 Syria 24.3 26.2 1.1 1.6 1.7 3.2149 Tanzania 4.0 4.4 0.1 0.1 2.3 2.7150 TFYR Macedonia 57.4 2 61.2 13.7 16 15.7 14 25.1 39.4 21
151 Thailand 26.5 21 28.9 4 6.5 7.4 11.0 52.5152 Trinidad & Tobago 59.5 63.8 13.8 14.6 8.4 20.2153 Tunisia 41.4 43.8 4.9 4.8 15.9 26.1154 Turkey 45.1 26 46.3 2 10.6 11.2 26.7 32.3155 Uganda 14.7 16.2 0.1 9 0.1 7.4 25 8.6156 Ukraine 35.3 41.8 8.0 8.8 5.4 6.7157 United Arab Emirates 85.0 27 88.0 10.3 17 11.1 20 44.8 26 89.1 28
158 United Kingdom 87.5 2 89.8 2 34.4 18 35.7 21 77.0 27 87.2159 United States 79.3 28 84.2 28.5 19 28.5 22 89.7 93.6 17
160 Uruguay 54.5 21 58.1 16.6 20 21.1 32.5 28 43.5161 Uzbekistan 36.5 38.2 0.7 1.1 20.4 22.8162 Venezuela 49.1 54.9 6.7 7.3 2 4.8 3.8 2
163 Viet Nam 39.5 43.9 4.9 5.6 18.8 21.8164 Yemen 17.4 20.0 0.7 1.1 0.2 0.3165 Zambia 13.5 15.4 0.1 0.1 0.6 0.7166 Zimbabwe 17.1 18.5 0.5 0.7 28.1 37.8
Note: Data in italics refer to ITU estimates. For further notes, see p. 248.Source: ITU World Telecommunication/ICT Indicators database.

Annex 3. Statistical tables of indicators used to compute de IDI
246
Skills indicatorsGross enrolment ratio Adult
Seconday Tertiary literacy rateEconomy 2012 2013 2012 2013 2012 2013
1 Afghanistan 54.0 54.0 3.7 3.7 31.7 31.72 Albania 82.4 82.4 55.5 55.5 96.8 96.83 Algeria 97.6 97.6 31.5 31.5 72.6 72.74 Andorra 130.8 130.8 84.6 84.6 97.9 97.95 Angola 31.5 31.5 7.5 7.5 70.6 70.66 Antigua & Barbuda 105.4 105.4 23.5 23.5 99.0 99.07 Argentina 91.9 91.9 78.6 78.6 97.9 97.98 Armenia 95.9 95.9 46.0 46.0 99.6 99.69 Australia 135.5 135.5 86.3 86.3 99.0 99.0
10 Austria 97.7 97.7 72.4 72.4 99.0 99.011 Azerbaijan 100.3 100.3 20.4 20.4 99.8 99.812 Bahrain 95.5 95.5 33.5 33.5 94.6 94.613 Bangladesh 53.6 53.6 13.2 13.2 58.8 58.814 Barbados 104.7 104.7 60.8 60.8 99.0 99.015 Belarus 106.4 106.4 91.5 91.5 99.6 99.616 Belgium 107.3 107.3 70.8 70.8 99.0 99.017 Benin 47.7 47.7 12.4 12.4 28.7 28.718 Bhutan 73.9 73.9 9.5 9.5 52.8 52.819 Bolivia 77.3 77.3 37.7 37.7 94.5 94.520 Bosnia and Herzegovina 89.3 89.3 37.7 37.7 98.2 98.221 Botswana 81.7 81.7 7.4 7.4 86.7 86.722 Brazil 105.8 105.8 25.6 25.6 91.3 91.323 Brunei Darussalam 107.8 107.8 24.3 24.3 95.4 95.424 Bulgaria 93.1 93.1 62.7 62.7 98.4 98.425 Burkina Faso 25.9 25.9 4.6 4.6 28.7 28.726 Cambodia 45.0 45.0 15.8 15.8 73.9 73.927 Cameroon 50.4 50.4 11.9 11.9 71.3 71.328 Canada 103.4 103.4 66.6 66.6 99.0 99.029 Cape Verde 92.7 92.7 20.6 20.6 85.3 85.330 Central African Rep. 17.8 17.8 2.8 2.8 36.8 36.831 Chad 22.8 22.8 2.3 2.3 37.3 37.332 Chile 89.0 89.0 74.4 74.4 98.6 98.633 China 89.0 89.0 26.7 26.7 95.1 95.134 Colombia 92.8 92.8 45.0 45.0 93.6 93.635 Congo 53.7 53.7 10.4 10.4 79.3 79.336 Congo (Dem. Rep.) 43.3 43.3 8.2 8.2 61.2 61.237 Costa Rica 103.6 103.6 46.7 46.7 97.4 97.438 Côte d'Ivoire 24.3 24.3 4.5 4.5 41.0 41.039 Croatia 98.4 98.4 61.6 61.6 99.1 99.140 Cuba 90.2 90.2 62.5 62.5 99.8 99.841 Cyprus 95.3 95.3 45.9 45.9 98.7 98.742 Czech Republic 96.6 96.6 64.2 64.2 99.0 99.043 Denmark 124.7 124.7 79.6 79.6 99.0 99.044 Djibouti 43.8 46.2 4.9 4.9 94.2 94.245 Dominica 96.7 96.7 3.6 3.6 89.1 89.146 Dominican Rep. 75.9 75.9 34.2 34.2 90.2 90.947 Ecuador 86.8 86.8 38.9 38.9 91.6 93.348 Egypt 86.3 86.3 30.1 30.1 73.9 73.949 El Salvador 69.2 69.2 25.5 25.5 85.5 85.550 Eritrea 29.8 29.8 2.0 2.0 70.5 70.551 Estonia 107.1 107.1 76.7 76.7 99.9 99.952 Ethiopia 28.9 28.9 2.8 2.8 39.0 39.053 Fiji 88.3 88.3 16.1 16.1 95.1 95.154 Finland 107.7 107.7 93.7 93.7 99.0 99.055 France 109.7 109.7 58.3 58.3 99.0 99.056 Gabon 53.9 53.9 8.5 8.5 82.3 82.357 Gambia 57.5 57.5 3.4 3.4 52.0 52.058 Georgia 86.8 86.8 27.9 27.9 99.7 99.759 Germany 101.3 101.3 61.7 61.7 99.0 99.060 Ghana 58.2 61.1 12.2 12.2 71.5 71.561 Greece 107.9 107.9 114.0 114.0 97.4 97.462 Grenada 107.8 107.8 52.8 52.8 99.0 99.063 Guatemala 65.1 65.1 17.9 17.9 78.3 78.364 Guinea 38.1 38.1 9.9 9.9 25.3 25.365 Guinea-Bissau 34.5 34.5 2.6 2.6 56.7 56.766 Guyana 101.0 101.0 12.9 12.9 85.0 85.067 Honduras 73.1 73.1 20.4 20.4 85.4 85.468 Hong Kong, China 88.7 88.7 59.7 59.7 99.0 99.069 Hungary 101.6 101.6 59.6 59.6 99.4 99.470 Iceland 108.6 108.6 80.9 80.9 99.0 99.071 India 68.5 68.5 24.8 24.8 62.8 62.872 Indonesia 82.5 82.5 31.5 31.5 92.8 92.873 Iran (I.R.) 86.3 86.3 55.2 55.2 84.3 84.374 Ireland 119.1 119.1 71.2 71.2 96.7 96.775 Israel 101.7 101.7 65.8 65.8 97.8 97.876 Italy 100.7 100.7 62.5 62.5 99.0 99.077 Jamaica 88.6 88.6 30.8 30.8 87.5 87.578 Japan 101.8 101.8 61.5 61.5 99.0 99.079 Jordan 87.8 87.8 46.6 46.6 97.9 97.980 Kazakhstan 97.7 97.7 44.5 44.5 99.7 99.781 Kenya 60.1 60.1 4.0 4.0 72.2 72.282 Korea (Rep.) 97.2 97.2 98.4 98.4 99.0 99.083 Kyrgyzstan 88.2 88.2 41.3 41.3 99.2 99.2

247
Measuring the Information Society Report 2014
Gross enrolment ratio AdultSeconday Tertiary literacy rate
Economy 2012 2013 2012 2013 2012 201384 Lao P.D.R. 46.5 46.5 16.7 16.7 72.7 72.785 Latvia 97.7 97.7 65.1 65.1 99.9 99.986 Lebanon 74.0 74.0 46.3 46.3 89.6 89.687 Lesotho 53.3 53.3 10.8 10.8 75.8 75.888 Liberia 45.2 45.2 11.6 11.6 42.9 42.989 Lithuania 105.9 105.9 73.9 73.9 99.8 99.890 Luxembourg 101.0 101.0 18.2 18.2 94.4 94.491 Macao, China 96.5 96.5 64.0 64.0 95.6 95.692 Madagascar 38.0 38.0 4.2 4.2 64.5 64.593 Malawi 34.2 34.2 0.8 0.8 61.3 61.394 Malaysia 67.2 67.2 36.0 36.0 93.1 93.195 Maldives 72.3 72.3 13.2 13.2 98.4 98.496 Mali 44.5 44.5 7.5 7.5 33.6 33.697 Malta 86.3 86.3 41.2 41.2 92.4 92.498 Mauritania 26.8 26.8 5.1 5.1 45.5 45.599 Mauritius 95.9 95.9 40.3 40.3 89.2 89.2
100 Mexico 85.7 85.7 29.0 29.0 94.2 94.2101 Moldova 88.2 88.2 40.1 40.1 99.1 99.1102 Monaco 109.7 109.7 54.9 54.9 99.0 99.0103 Mongolia 103.5 103.5 61.1 61.1 98.3 98.3104 Montenegro 90.9 90.9 55.5 55.5 98.4 98.4105 Morocco 68.9 68.9 16.2 16.2 67.1 67.1106 Mozambique 25.9 25.9 4.9 4.9 50.6 50.6107 Myanmar 50.2 50.2 13.8 13.8 92.6 92.6108 Namibia 64.8 64.8 9.3 9.3 76.5 76.5109 Nepal 65.8 66.6 14.5 14.5 57.4 57.4110 Netherlands 129.9 129.9 77.3 77.3 99.0 99.0111 New Zealand 119.5 119.5 79.8 79.8 99.0 99.0112 Nicaragua 68.9 68.9 17.9 17.9 78.0 78.0113 Niger 15.9 15.9 1.8 1.8 15.5 15.5114 Nigeria 43.8 43.8 10.4 10.4 51.1 51.1115 Norway 111.1 111.1 74.1 74.1 99.0 99.0116 Oman 93.5 93.5 28.1 28.1 86.9 86.9117 Pakistan 36.6 36.6 9.5 9.5 54.7 54.7118 Palestine 82.8 82.8 49.1 49.1 95.9 95.9119 Panama 84.0 84.0 41.8 41.8 94.1 94.1120 Paraguay 69.6 69.6 34.5 34.5 93.9 93.9121 Peru 89.8 89.8 42.6 42.6 93.8 93.8122 Philippines 84.6 84.6 28.2 28.2 95.4 95.4123 Poland 97.7 97.7 73.2 73.2 99.8 99.8124 Portugal 112.9 112.9 68.9 68.9 94.5 94.5125 Qatar 111.6 111.6 12.1 12.1 96.7 96.7126 Romania 95.0 95.0 51.6 51.6 98.6 98.6127 Russian Federation 95.3 95.3 76.1 76.1 99.7 99.7128 Rwanda 31.8 31.8 7.2 7.2 65.9 65.9129 Saudi Arabia 114.3 116.2 50.9 50.9 94.4 94.4130 Senegal 41.0 41.0 7.6 7.6 52.1 52.1131 Serbia 91.7 91.7 52.4 52.4 98.2 98.2132 Seychelles 101.3 101.3 1.4 1.4 91.8 91.8133 Singapore 97.2 97.2 43.8 43.8 96.4 96.4134 Slovakia 93.9 93.9 55.1 55.1 99.5 99.5135 Slovenia 97.6 97.6 86.0 86.0 99.7 99.7136 Solomon Islands 48.4 48.4 16.1 16.2 98.7 98.7137 South Africa 101.9 101.9 15.8 15.8 93.7 93.7138 Spain 130.8 130.8 84.6 84.6 97.9 97.9139 Sri Lanka 99.3 99.3 17.0 17.0 91.2 91.2140 St. Kitts and Nevis 94.5 94.5 18.2 18.2 98.4 98.4141 St. Lucia 91.1 91.1 10.2 10.2 99.0 99.0142 St. Vincent and the Grenadines 100.9 100.9 18.2 18.2 99.0 99.0143 Sudan 37.0 37.0 15.1 15.1 73.4 73.4144 Suriname 85.4 85.4 12.1 12.1 94.7 94.7145 Swaziland 59.9 59.9 6.0 6.0 83.1 83.1146 Sweden 98.4 98.4 70.0 70.0 99.0 99.0147 Switzerland 96.3 96.3 55.6 55.6 98.7 98.7148 Syria 74.4 74.4 25.6 25.6 85.1 85.1149 Tanzania 35.0 35.0 3.9 3.9 67.8 67.8150 TFYR Macedonia 82.8 82.8 38.5 38.5 97.5 97.5151 Thailand 87.0 87.0 51.4 51.2 96.4 96.4152 Trinidad & Tobago 85.5 85.5 12.0 12.0 98.8 98.8153 Tunisia 91.1 91.1 35.2 35.2 79.7 79.7154 Turkey 86.1 86.1 69.4 69.4 94.9 94.9155 Uganda 27.6 27.6 9.1 9.1 73.2 73.2156 Ukraine 97.8 97.8 79.7 79.7 99.7 99.7157 United Arab Emirates 83.6 83.6 30.4 30.4 90.0 90.0158 United Kingdom 95.4 95.4 61.9 61.9 95.2 95.2159 United States 93.7 93.7 94.3 94.3 99.0 99.0160 Uruguay 90.3 90.3 63.2 63.2 98.4 98.4161 Uzbekistan 105.2 105.2 8.9 8.9 99.5 99.5162 Venezuela 85.4 85.4 78.1 78.1 95.5 95.5163 Viet Nam 77.2 77.2 24.6 24.6 93.5 93.5164 Yemen 46.9 46.9 10.3 10.3 66.4 66.4165 Zambia 45.5 45.5 2.4 2.4 61.4 61.4166 Zimbabwe 41.4 41.4 5.9 5.9 83.6 83.6
Note: Data in italics refer to ITU estimates. Source: ITU World Telecommunication/ICT Indicators database.

Annex 3. Statistical tables of indicators used to compute de IDI
248
Access indicatorsFixed-telephone subscriptions per 100 inhabitants, 2012:
1) Incl. 524 958 WLL subscriptions. 2) Incl. payphone, excl. VOIP. 3) Incl. ISDN channels measured in ISDNB channels equivalents. 4) Incl. VoIP. 5) Bhutan Telecom is the only service provider as of now in Bhutan. 6) By December. 7) Fixed and WLL. 8) Total access lines. 9) First trimester 2012. 5 431 registered subscriptions. 10) Estimate. 11) Incl. public payphones. 12) Decrease is caused by change in tariff policy of the biggest WLL operator. 13) Data excluding own (NRA) consumption. 14) Excl. voice-over-IP (VoIP) subscriptions, fixed wireless local loop (WLL) subscriptions, ISDN voice-channel equivalents. 15) Incl. PSTN lines, ISDN paths, FWA subscriptions, public payphones and VOIP subscriptions. 16) Incl. Telecom Italia access lines, ULL, Virtual ULL, Naked DSL, Wholesale line Rental, Fiber, Public Telephony. 17) The number of fixed public payphones is as of March 2012. 18) Fixed Wireless Local Loop. 19) Including digital lines. Without ISDN channels. 20) Excl. ISDN channels and fixed wireless subscriptions. 21) Incl. inactive subscriptions. 22) Preliminary.23) Refers to active Fixed Wired/Wireless lines. 24) POTS, ISDN BRA & ISDN PRA. 25) Decrease due to cleaning out of inactive accounts. 26) Excluding fixed wireless. 27) Excl. internal lines and WLR of incumbent.
Fixed-telephone subscriptions per 100 inhabitants, 2013 1) Incl. 420 000 WLL subscriptions. 2) Incl. payphone, excl. VOIP. 3) Incl. ISDN channels measured in ISDNB channels equivalents. 4) Incl. VoIP. 5) Estimate. 6) Bhutan Telecom is the only service provider as of now in Bhutan. 7) By December 2013. 8) Excl. voice-over-IP (VoIP) subscriptions, fixed wireless local loop (WLL) subscriptions, ISDN voice-channel equivalents. 9) Incl. PSTN lines, ISDN paths, FWA subscriptions, public payphones and VOIP subscriptions. 10) Total number of access paths. 11) Incl. Telecom Italia access lines, ULL, Virtual ULL, Naked DSL, Wholesale line Rental, Fiber, Public Telephony. 12) The number of fixed public payphones is as of March 2013. 13) Preliminary. 14) Incl. digital lines. Without including separate ISDN channels (abonnements au téléphone fixe). 15) Excl. ISDN channels and fixed wireless subscriptions. 16) Break in comparability. Only active subscriptions. Inactive subscriptions are: 45 609. 17) February 2013 NTA MIS. 18) Based on 2013Q3 data. 19) Refers to active Fixed Wired/Wireless lines. 20) Per June 2013. 21) Operators’ data. 22) Residential: 3.3 million; business: 1.4 million. 23) Q4 report. Definitive data (annual report) may change because quarterly reports use a smaller sample of operators than annual report. 24) Fixed and fixed-wireless subscriptions. 25) Excl. internal lines and WLR of incumbent. Data for the third quarter of 2013.
Mobile-cellular subscriptions per 100 inhabitants, 2012: 1) Numbers are down due to data cleanse. 2)ACMA Communications Report 2011-12. 2) incl. payphone, excl. VoIP. 3) Active subscriptions. 4) Bhutan Telecom and Tashi Cell are the only two service providers in Bhutan. 5) Activity criteria: voice or data communication in the last month. 6) December 2012. 7) Total number of subscriptions (including non-active): 2 082 589. 8) Excl. 2 720 698 prepaid cards that are used to provide Travel SIM/World Mobile service. 9) Excl. data-only SIM cards and M2M cards. 10) Decrease due to merge of second and third operators of the mobile market. 11) Incl. fixed wireless local loop (WLL) subscriptions. Drop is partly due to operators no longer including inactive subscriptions. 12) Incl. MNO and MVNO. 13) Decrease due to cancellation of subscriptions, since two operators merged. 14) December. Including PHS and data cards, undividable. 15) Decrease was due to registration of SIMs. 16) Figure obtained from all five mobile (GSM & CDMA) operators currently providing service in the country. 17) Incl. inactive subscriptions. 18) Preliminary. 19) Active subscriptions (87.85% total). 20) Measured using subscriptions active in the last 90 days. 21) Estimate. Incl. inactive. 22) Incl. data-only subscriptions (not possible to disaggregate the information at this point). 23) Break in comparability: excl. 226 827 M2M subscriptions. 24) Incl. active (in the last 6 months) prepaid accounts. 25) Registered SIM cards (incl. inactive): 261 887 751. 26) Break in comparability: from this year only counting prepaid subscriptions used in the last 90 days. 27) No differentiation between active and non-active subscriptions. 28) Incl. data dedicated subscriptions. 29) Decrease due to the closing of MTS.
Mobile-cellular subscriptions per 100 inhabitants, 2013: 1) Preliminary. 2) Active subscriptions. 3) Bhutan Telecom and Tashi Cell are the two service providers in Bhutan. 4) Activity criteria: voice or data communication in the last month. 5) By December 2013. 6) Incl. all mobile cellular subscriptions that offer voice communications, but excl. mobile data subscriptions (via data cards, USB modems and M2M cards). 7) Estimate. 8) Incl. data-only subscriptions. 9) Data based on NRA estimates. Excl. data-only SIM cards and M2M cards. 10) Incl. fixed wireless local loop (WLL) subscriptions. 11) Incl. PHS and data cards, undividable. 12) Active subscriptions (after clearing simcards that became inactive). 13) Figure obtained from all four mobile (GSM & CDMA) operators currently providing service in the country. 14) Break in comparability. Incl. only active subscriptions. 15) Active subscriptions (83.44% total). 16) February 2013 NTA MIS. 17) Based on 2013Q3 data. 18) Measured using subscriptions active in the last 90 days. 19) Per June 2013. 20) Excl. 463 646 M2M subscriptions. 21) Incl. active (in the last 6 months) prepaid accounts. 22) Registered SIM cards (incl. inactive): 277 744 809. 23) Pre-paid: 43.9 million; post-paid: 6.94 million. 24) No differentiation between active and non-active subscriptions. 25) Q4 report. Definitive data (annual report) may change because quarterly reports use a smaller sample of operators than annual report. 26) Data for the fourth quarter of 2013. 27) Incl. data dedicated subscriptions. 28) Reduction is due to implementation of sim cards registration.
International Internet bandwidth Bit/s per Internet user, 2012: 1) Refers to a survey conducted with the following companies: Global crossing, TIWS, Embratel e Globenet. 2) This is from one ISP only. No response received from other ISPs. 3) Symmetric. 4) Total installed capacity. 5) Purchased capacity. 6) By December 2012. 7) Estimate. 8) Activated external capacity. 9) Only ETL, LTC and LANIC. 10) Source: MOT. 11) Data obtained from nine service operators. 12) May 2012 purchased capacity. Lit capacity: 43 096 471 Mbit/s. 13) Incoming capacity; peak
Notes
249
Measuring the Information Society Report 2014
weekly incoming capacity, averaged over 4 weeks in December. 14) Preliminary. 15) SLT Data. 16) Refers to the total capacity of the international bandwidth. 17) Potential (installed) capacity.
International Internet bandwidth Bit/s per Internet user, 2013: 1) Purchased capacity. 2) As at December 2013. 3) Total installed capacity. 4) May be revised with comprehensive data from mobile broadbnad providers. 5) Estimate. 6) June. 7) Sum of incoming capacity of all ISPs in the country. 8) Activated external capacity. 9) By September 2013. 10) Data obtained from eight service operators. 11) 1st April 2013 purchased capacity. Lit capacity: 70 464 304 Mbit/s. 12) Incoming capacity, average peak incoming capacity for December. 13) Not update for 2013. 14) Refers to the total capacity of the international bandwidth. 15) Potential (installed) capacity.
Percentage of households with computer, 2012: 1) Estimated based on 2011 proportion of households with a computer and using annual growth rate of 3%. 2) Preliminary. 3) Refers to PC or laptop. 4) Data correspond to dwellings (not households). 5) Ghana Living Standards Survey 2012/2013. The estimate is based on households who own and/or have access to a desktop, laptop or tablet PCs. Sample weights have been applied. 6) Personal computer included desktop computer, laptop / notebook / netbook / tablet and palm top / Personal Digital Assistant (PDA), but excluded digital diary and electronic dictionary. 7) Estimate. 8) From Household Socio-Economic survey-2012. 9) Census data. 10) Computer includes the number of personal computer, Notebook, and PDA. 11) U.S. Census Bureau, table 4 :http://www.census.gov/hhes/computer/publications/2012.html.
Percentage of households with computer, 2013: 1) Labour Force Survey 2013. 2) Cambodia Inter-censal Population Survey. 3) Refers to PC, laptop or a tablet. 4) Data correspond to dwellings (not households). 5) Ghana Living Standards Survey 2012/2013. The estimate is based on households who own and/or have access to a desktop, laptop or tablet PCs. Sample weights have been applied. 6) Preliminary. 7) Estimated.
Percentage of households with Internet access, 2012: 1) Estimated based on 2011 proportion of households with internet and using estimated annual growth rate of 2.8%. 2) Preliminary. 3) Data correspond to dwellings (not households). 4) Ghana Living Standards Survey 2012/2013. The estimate is based on households who own and/or have access to internet. Sample weights have been applied. Not restricted to access at home. 5) Incl. desktop computer, laptop / notebook / netbook / tablet, but excluded palm top / Personal Digital Assistant (PDA) and other devices for Internet connection (e.g. smartphone, game console and e-book reader). 6) Accessing from personal computers. 7) Estimate based on 2011 Census Population Household Projection Estimates. 8) From Household Socio-Economic survey-2012. 9) Break in comparability: Refers to access at home, on cell phone or other mobile device and via mobile modem. 10) Census data. 11) Excl. households which didn’t know type of internet access 172 346 households. 12) U.S. Census Bureau, table 3 :http://www.census.gov/hhes/computer/publications/2012.htm].
Percentage of households with Internet access, 2013: 1) Labour Force Survey 2013. 2) Corresponds to all type of internet connections. 3) Data correspond to dwellings (not households). 4) Ghana Living Standards Survey 2012/2013. The estimate is based on households who own and/or have access to internet. Sample weights have been applied. Not restricted to access at home. 5) Included desktop computer, laptop / notebook / netbook / tablet, but excluded palm top / Personal Digital Assistant (PDA) and other devices for Internet connection (e.g. smartphone, game console and e-book reader).
Use indicatorsPercentage of individuals using the Internet, 2012:
1) 15 years and older. Last 12 months. 2) Users in the last 3 months. 3) Estimated based on 2011 Residential consumer survey result and TRA analysis of the growth. 4) Individuals aged 16 and over. 5) Preliminary. 6) In the last 3 months. Population 10+. 7) Residents of Canada 16 years of age or older excluding: Residents of the Yukon, Northwest Territories and Nunavut, Inmates of Institutions, Persons living on Indian Reserves, and Full time members of the Canadian Forces. 8) Estimated based on surveys’ results. Population age 5+. 9) In the last 3 months. Population 5+. 10) 12+ years. 11) Population 5+.Direct response from individuals 15 years and above. 12) The methodology depends basically on the number of internet users using hard indicators instead of data survey. 13) Ghana Living Standards Survey 2012/2013. The estimate is based on weighting households who use internet by the household size over the total estimated population. Sample weights have also been applied. The question was asked at household level. 14) All persons aged 10 and over. 15) Age 20+. In the last 3 months. 16) Individuals 14 years or older. 17) Break in comparability: population aged 15-74. 18) Individuals aged 3 and over. 19) Refers to total population. 20) Individuals aged 5 years and above. 21) Population 6 years and above. 22) From Household Socio-Economic survey. 23) Last 6 months. 24) Residents aged 7 years and above. 25) Last 6 months; individuals aged 14 and above: target population 6 282 000. 26) Individuals with age between 16 and 74 (According to the Eurostat recommendation). 27) Reference period for computer and Internet usage is 3 months only. 28) U.S. Census Bureau, Table 2 : http://www.census.gov/hhes/computer/publications/2012.htm].
Percentage of individuals using the Internet, 2013: 1) Individuals aged 15 years and over. 2) Population age 16-74. 3) Labour Force Survey 2013. 4) Individuals aged 6 and over. 5) Cambodia Inter-censal Population Survey 2013. 6) Permanent residents at the age of 6 or above. In the last 6 months. 7) population 5+. 8) Total population. In the last three months. 9) 12+ years. 10) Population 5+.Direct response from individuals 15 years and above. 11) In the last 12 months. Individuals aged 10 and above. 12) Ghana Living Standards Survey 2012/2013. The estimate is based on weighting households who use internet by the household size over the total estimated population.

Annex 3. Statistical tables of indicators used to compute de IDI
250
Sample weights have also been applied. The question was asked at household level. 13) All persons aged 10 and over. 14) Age 20+. In the last 3 months. 15) Individuals age 3 and above. 16) Refers to total population. 17) Individuals 5+. Excluding population living in workers’ camps. 18) Population age 10+ using internet in the last 3 months. 19) Individuals aged 15 to 72 years. 20) Estimated. Residents aged 7 years and above. 21) Last 6 months; individuals aged 14 and above: target population 6 370 000.
Fixed (wired)-broadband subscriptions per 100 inhabitants, 2012: 1) Internet Activity Survey, June. 2) Incl. fixed wireless broadband. 3) Fixed broadband in Bhutan is provided via ADSL/DSL networks only. 4) As of 2012 it includes also FTTH. 5) Expert assessment, based on the data provided by 89.1% of operators. 6) The figure is corrected. The previous figure was 1’636’700. 7) Only ADSL, excl. cable modem. 8) Speeds greater than, or equal to, 512 Kbps. 9) By December 2012. 10) Only ETL and LTC. 11) Preliminary. 12) Full VDSL. 13) Speeds equal to or greater than 144 kbit/s. 14) Operators data/ictQATAR estimate. 15) Incl. subscriptions at downstream speeds equal to, or greater than, 144 kbit/s (the number of subscriptions that are included in the 144-256 range is insignificant). 16) Q3. 17) Excl. 3203 WiMAX subscriptions. 18) Excl. corporate connections. 19) Data reflect subscriptions with associated transfer rates exceeding 200 kbps in at least one direction, consistent with the reporting threshold the FCC adopted in 2000. 20) Incl. ADSL and FTTH.
Fixed (wired)-broadband subscriptions per 100 inhabitants, 2013: 1) November 2013. 2) Preliminary. 3) Internet Activity Survey, June 2013. 4) Fixed broadband provided through ADSL/DSL and Fiber links. 5) Estimate, no specific data collected for ≥ 256 kbit/s. 6) CRC estimation as of 31.12.2013. 7) Estimate. 8) Data based on NRA estimates. 9) Only ADSL, excl. cable modem. 10) Speeds greater than, or equal to, 512 Kbps. 11) December 2013. These are the subscriptions with the minimum download speed of 512 kbps. This is as per the revised definition of Broadband in India with effect from 18th July 2013. 12) December. 13) ADSL and Leased lines. 14) Based on 2013Q3 data. 15) Per June 2013. 16) Operators’ data. 17) Incl. subscriptions at downstream speeds equal to, or greater than, 144 kbit/s (the number of subscriptions that are included in the 144-256 range is insignificant). 18) Q4 report. Definitive data (annual report) may change because quarterly reports use a smaller sample of operators than annual report. 19) Estimate. Refers to March 2013. 20) Excl. 3175 WiMAX subscriptions. 21) Excl. corporate connections. 22) 2013 data is an estimate as of June 30, 2013. Data reflect subscriptions with associated transfer rates exceeding 200 kbps in at least one direction, consistent with the reporting threshold the FCC adopted in 2000 .
Wireless-broadband subscriptions per 100 inhabitants, 2012: 1) Only fixed WiMAX subscriptions. 2) Internet Activity Survey, June. 3) Break in comparability: including all categories of mobile broadband. 4) Total number of EDGE/GPRS subscribers: 97 520. 5) Break in comparability: from this year incl. USB modems and dongles, mobile broadband (>256kbps at least in one direction up to HSPA+), WiMAX, Pre WiMAX, SID and satellite. 6) Change in definition, break in comparability. 7) High use of mobile phones to access the internet. 8) Incl. Home Box and RLANs. 9) Break in comparability, from this year incl. prepaid mobile-broadband subscriptions. 10) Incl. subscriptions to WiFi hotspots. 11) Methodology changed from ability to have mobile broadband to actual mobile broadband usage. 12) Satellite, BWA and active mobile subscriptions. 13) Estimate based on partial SIT data and ITU estimates. 14) Speeds greater than, or equal to, 512 Kbps. 15) Rightel (Tamin Telecom) has been given license to operate 3G services and started services from February 2011 (http://www.rightel.ir/). Data refer to the sum of fixed wireless broadband and active mobile-broadband subscriptions. 16) Incl. mobile broadband and WiMAX. 17) Estimate. 18) ETL and LTC. 19) Incl. narrowband connections. 20) Drop in mobile-broadband subscriptions because in 2011 the operator offered free Internet access for a limited amount of time so that many people used the free service. 21) Preliminary. 22) Mobile broadband only. Fixed wireless and satellite exist but data are not available. 23) Operators data/ictQATAR estimate. 24) Refers to active mobile-broadband subscriptions only. 25) Dec. 26) Incl. 4125165 active mobile-broadband subscriptions plus 3203 WiMAX subscriptions. Excl. satellite subscriptions. 27) Excl. satellite and fixed wireless. 28) Incl. mobile subscriptions with potential access.
Wireless-broadband subscriptions per 100 inhabitants, 2013: 1) Only fixed WiMAX subscriptions. 2) Preliminary. 3) Internet Activity Survey, June 2013. 4) Total number of EDGE/GPRS subscribers is 112 898. 5) Incl. LTE subscriptions from ENTEL. 6) Change in definition, break in comparability. 7) 2012 figures. Still auditing the 2013 figures. 8) Incl. WCDMA, LTE, dedicated mobile-broadband and fixed wireless. 9) CRC estimation as of 31.12.2013 .speeds equal to or greater than 144 kbit/s/. 10) Estimate. 11) Estimate .Incl. subscriptions to WiFi hotspots. 12) Satellite, BWA and active mobile subscriptions. 13) Incl. VSAT. 14) Speeds greater than, or equal to, 512 Kbps. 15) subscriptions with minimum download speed of 512 kbps. This is as per the revised definition of Broadband in India with effect from 18th July 2013. 16) Data refer to the sum of fixed wireless broadband and active mobile-broadband subscriptions. 17) 2013 data is an estimate as of June 30, 2013. 18) Incl. mobile broadband and WiMAX. 19) Estimate based on 1. Standard mobile subscriptions using data services 2. Dedicated data subscriptions 3. Add on data packages. 20) Based on 2013Q3 data. 21) Per June 2013. 22) Mobile broadband only. Fixed wireless and satellite exist but data are not available. 23) Operators’ data. 24) As at Dec 2013. 25) Q4 report. Definitive data (annual report) may change because quarterly reports use a smaller sample of operators than annual report. 26) Wireless Broadband services are not being offered in St. Vincent as yet. We anticipate that Mobile broadband and terrestrial fixed broadband services would be in place by the end of 2014. 27) OFCOM estimate. 28) Includes: active mobile-broadband subscriptions plus 3175 WiMAX.


International Telecommunication UnionTelecommunication Development Bureau
Place des NationsCH-1211 Geneva 20
Switzerland
www.itu.int
ISBN 978-92-61-14661-0 SAP id
9 7 8 9 2 6 1 1 5 2 9 1 8
3 9 4 6 4
Price: 86 CHF
Printed in SwitzerlandGeneva, 2014
Photo credits: Shutterstock
Measuring the Information
Society Report2014
Mea
surin
g th
e In
form
atio
n So
ciet
y Re
port
201
4