Measuring the Information Economy - OECD. · PDF fileICT are still under development. ......
94
ORGANISATION FOR ECONOMIC CO-OPERATION AND DEVELOPMENT Measuring the Information Economy
Transcript of Measuring the Information Economy - OECD. · PDF fileICT are still under development. ......
ORGANISATION FOR ECONOMIC CO-OPERATION AND DEVELOPMENT
Measuringthe Information Economy
Faux titre.fm Page 1 Thursday, October 10, 2002 8:37 AM
ORGANISATION FOR ECONOMIC CO-OPERATION AND DEVELOPMENT
Pursuant to Article 1 of the Convention signed in Paris on 14th December 1960, and which came intoforce on 30th September 1961, the Organisation for Economic Co-operation and Development (OECD)shall promote policies designed:
– to achieve the highest sustainable economic growth and employment and a rising standard ofliving in Member countries, while maintaining financial stability, and thus to contribute to thedevelopment of the world economy;
– to contribute to sound economic expansion in Member as well as non-member countries in theprocess of economic development; and
– to contribute to the expansion of world trade on a multilateral, non-discriminatory basis inaccordance with international obligations.
The original Member countries of the OECD are Austria, Belgium, Canada, Denmark, France,Germany, Greece, Iceland, Ireland, Italy, Luxembourg, the Netherlands, Norway, Portugal, Spain,Sweden, Switzerland, Turkey, the United Kingdom and the United States. The following countriesbecame Members subsequently through accession at the dates indicated hereafter: Japan(28th April 1964), Finland (28th January 1969), Australia (7th June 1971), New Zealand (29th May 1973),Mexico (18th May 1994), the Czech Republic (21st December 1995), Hungary (7th May 1996), Poland(22nd November 1996), Korea (12th December 1996) and the Slovak Republic (14th December 2000). TheCommission of the European Communities takes part in the work of the OECD (Article 13 of the OECDConvention).
© OECD 2002Permission to reproduce a portion of this work for non-commercial purposes or classroom use should be obtainedthrough the Centre français d’exploitation du droit de copie (CFC), 20, rue des Grands-Augustins, 75006 Paris,France, tel. (33-1) 44 07 47 70, fax (33-1) 46 34 67 19, for every country except the United States. In the United Statespermission should be obtained through the Copyright Clearance Center, Customer Service, (508)750-8400,222 Rosewood Drive, Danvers, MA 01923 USA, or CCC Online: www.copyright.com. All other applications forpermission to reproduce or translate all or part of this book should be made to OECD Publications, 2, rue André-Pascal,75775 Paris Cedex 16, France.
Faux titre.fm Page 2 Thursday, October 10, 2002 8:38 AM

MEASURING THE INFORMATION ECONOMY 2002 3
3
FOREWORD
The role of information and communication technologies (ICT) in economic growth and social change has receivedconsiderable attention in recent years, particularly in the debate on the “new economy”. The production, diffusion anduse of ICT vary considerably between and within countries, although they continue to spread and their economicimportance has grown over the 1990s. To focus the policy debate, especially in light of the recent “exuberance” andsubsequent crash in the market value of “dot.com” firms, reliable and comprehensive indicators are needed to trackdevelopments in new information technologies and understand their impact on our economies and societies.
As ICT has only been recognised as a major source of economic and social change in recent years, official statistics onICT are still under development. Over the past years, however, much progress has been made in developinginternationally comparable ICT statistics. International organisations, such as the OECD and Eurostat, together withstatistical offices in OECD member countries, have worked together to develop common definitions, commonmethods and common surveys of ICT. Over a very short time span, national statistical offices have made great stridestowards responding to the challenge and providing high-quality, timely ICT statistics.
Measuring the Information Economy 2002 (www.oecd.org/sti/measuring-infoeconomy)�relies on these official sourcesand builds mainly on the work of the OECD Working Party on Indicators for the Information Society (WPIIS).Chapter 1 describes the resources devoted to new information technologies, in terms of consumption, investment,innovative efforts or human resources. Chapter 2 looks at the size, growth and contribution of the ICT sector, asdefined by the OECD, to economic activity. Chapter 3 presents the latest international comparisons, based on officialsurveys of ICT diffusion in households, among individuals and in businesses recently developed by national statisticaloffices. Only a few years ago, internationally comparable official statistics measuring the level, growth andcomposition of electronic commerce transactions were not available. However, Chapter 4 indicates some interestingpatterns relating to the volume and nature of e-commerce transactions, based on OECD definitions and guidelines formeasurement in this area. By analysing the data currently available, this report highlights the areas in which muchprogress has been made in recent years. It also shows, however, that ICT statistics are not yet well developed in areassuch as ICT use by governments and in schools (Chapter 5).
Measuring the Information Economy 2002 offers new or improved measures for international comparisons.Methodological boxes discuss issues of measurement and international comparability and the annexes include theOECD definitions and guidelines behind the development of the indicators. Owing to the novelty of some of thedatabases and indicators, country comparisons should be interpreted with caution when absolute differences are small.In some cases, data provided by member countries have been combined with different data sources to estimate ICTindicators. For this reason, the statistics presented here may differ from figures contained in national reports and inprevious OECD publications.
Measuring the Information Economy 2002 is also available on line and provides easy access to individual sections, anelaborate data and metadata appendix and links to the databases used. The electronic version also gives users“clickable” access to the Excel spreadsheets containing the data used in charts and figures (seewww.oecd.org/sti/measuring-infoeconomy).
This volume was prepared by Alessandra Colecchia, Elena Anton-Zabalza, Andrew Devlin and Pierre Montagnier ofthe OECD’s Directorate for Science, Technology and Industry (DSTI). Dirk Pilat, Andrew Wyckoff and other OECDcolleagues offered guidance and commented on the draft.

4 MEASURING THE INFORMATION ECONOMY 2002
© OECD 20024
Measuring the Information Economy 2002 could not have been prepared, however, without the help of nationalstatistical agencies in all OECD member countries. In particular, the OECD would like to thank the experts whocontribute to the OECD Working Party on Indicators for the Information Society (WPIIS) for their valuable assistanceand guidance. Nevertheless, none of these individuals or organisations can be held responsible for the findings of thepublication.
This volume is published on the responsibility of the Secretary-General of the OECD.
MEASURING THE INFORMATION ECONOMY 2002 5
© OECD 2002 5
TABLE OF CONTENTS
CHAPTER I. RESOURCES FOR THE INFORMATION ECONOMY ......................................9Investment in ICT equipment and software .............................................................................10Consumption of and investment in ICT goods and services ....................................................12ICT patents...............................................................................................................................14Occupation and skills in the information economy..................................................................16
CHAPTER II. THE ICT SECTOR..............................................................................................19ICT producing sectors..............................................................................................................20Size and growth of the ICT sector............................................................................................22The contribution of the ICT sector to employment growth .....................................................24R&D in selected ICT industries ...............................................................................................26The contribution of the ICT sector to international trade.........................................................28ICT sector exports: share in total exports and composition .....................................................30ICT trade specialisation and comparative advantage`..............................................................32Foreign affiliates in the ICT sector ..........................................................................................34
CHAPTER III. ACCESS TO AND USE OF INFORMATION TECHNOLOGIES ..................37Telecommunications networks.................................................................................................38Internet infrastructure...............................................................................................................40Internet subscribers ..................................................................................................................42ICT access by households ........................................................................................................43Internet access by households ..................................................................................................44Use of the Internet by individuals ............................................................................................46Internet access and use by businesses ......................................................................................48Internet access and use by enterprise size and industry ...........................................................50Perceived barriers to Internet access and use in the business sector ........................................52The price of Internet access and use ........................................................................................56
CHAPTER IV. ELECTRONIC COMMERCE ...........................................................................59Infrastructure for electronic commerce ....................................................................................60Measuring electronic commerce transactions ..........................................................................61Internet and electronic commerce transactions ........................................................................62Internet and electronic commerce transactions by consumers .................................................66Internet transactions by product and cross-border ...................................................................68Drivers and inhibitors of Internet commerce ...........................................................................70
CHAPTER V. ICT IN EDUCATION AND GOVERNMENT...................................................75ICT in education.......................................................................................................................76ICT in government ...................................................................................................................78

6 MEASURING THE INFORMATION ECONOMY 2002
© OECD 20026
ANNEXES
Annex 1. The OECD definition of the ICT sector.......................................................................81Annex 2. The Product classification used to estimate ICT sector trade ......................................85Annex 3. The OECD model survey of ICT usage in the business sector ....................................87Annex 4. The OECD definitions of Internet and e-commerce transactions ................................89Annex 5. Main OECD databases used.........................................................................................91
FIGURES
1.1. ICT investment in OECD countries .............................................................................111.2. ICT investment by asset in OECD countries................................................................111.3. Software investment in OECD countries .....................................................................111.4. Investment in and consumption of ICT as a share of GDP ..........................................121.5. Share of consumption of ICT goods and services in total household consumption.....131.6. Share of ICT investment in total non-residential gross fixed capital formation ..........131.7. ICT patents as a percentage of total national patents filed at the EPO.........................151.8. Share of ICT patents filed at the EPO ..........................................................................151.9. Share of high and low skills within the ICT-related occupations in the
European Union and the United States.........................................................................171.10. High-skilled ICT workers and high-skilled workers in the European Union
and the United States....................................................................................................171.11. Computer workers in the European Union...................................................................17
2.1 Share of ICT-producing activities in the non-agriculture business sector....................212.2. Composition of ICT sector production.........................................................................212.3. Share of ICT value added in business sector value added............................................232.4. Share of ICT manufacturing in total manufacturing value added ................................232.5. Share of ICT services in total business services value added ......................................232.6. Employment in the ICT sector, selected OECD countries ...........................................242.7. The contribution of ICT services to business sector employment growth,
selected OECD countries .............................................................................................242.8. Share of ICT employment in business sector employment ..........................................252.9. Share of ICT manufacturing in manufacturing employment .......................................252.10. Share of ICT services in market services employment ................................................252.11. Business R&D expenditure by selected ICT manufacturing industries .......................272.12. Business R&D expenditure by selected ICT services industries..................................272.13. Share of ICT manufacturing in total R&D expenditure of the manufacturing sector ..272.14. Share of OECD countries in OECD-wide R&D expenditure in ICT manufacturing...272.15. ICT trade by area..........................................................................................................292.16. OECD 16 and ICT-related trade...................................................................................292.17. ICT manufacturing trade ..............................................................................................292.18. ICT sector trade balance...............................................................................................292.19. Composition of ICT sector exports, 1990-2000...........................................................302.20. Share of ICT sector exports in total merchandise exports............................................312.21. The composition of ICT sector exports, 2000..............................................................312.22. ICT export specialisation index....................................................................................332.23. ICT import propensity index ........................................................................................332.24. ICT intra-industry specialisation index ........................................................................332.25. Share of production (turnover) of foreign affiliates in computer manufacturing
(ISIC 30).......................................................................................................................35

MEASURING THE INFORMATION ECONOMY 2002 7
© OECD 2002 7
2.26. Share of production (turnover) of foreign affiliates in electronic equipmentmanufacturing (ISIC 32) ..............................................................................................35
2.27. Share of production (turnover) of foreign affiliates in the telecommunicationssector (ISIC 642) ..........................................................................................................35
2.28. Share of production (turnover) of foreign affiliates in computer-relatedservices (ISIC 72).........................................................................................................35
2.29. Relationship between share of production and employees of foreign affiliatesin computer manufacturing (ISIC 30) ..........................................................................36
2.30. Relationship between share of production and employees of foreign affiliatesin radio, TV and communications equipment (ISIC 32) ..............................................36
2.31. Share of R&D by foreign affiliates in office, accounting and computingmachinery (ISIC 30).....................................................................................................36
2.32. Share of R&D by foreign affiliates in radio, TV and communicationsequipment (ISIC 32).....................................................................................................36
3.1. Access paths per 100 inhabitants .................................................................................393.2. Broadband penetration rates in OECD countries .........................................................393.3. Number of Internet hosts per 1 000 inhabitants ...........................................................413.4. Web sites per 1 000 inhabitants....................................................................................413.5. Internet subscribers per 100 inhabitants.......................................................................423.6. Households Internet access by income level ................................................................443.7. Households with access to a home computer ...............................................................453.8. Households with access to the Internet ........................................................................453.9. Household access by type of service............................................................................453.10. Individuals using the Internet from any location..........................................................463.11. Individuals frequently using the Internet......................................................................463.12. Internet use by type of activity.....................................................................................473.13. Businesses with Internet access....................................................................................493.14. Businesses with home and third-party Web sites .........................................................493.15. Business Internet access by type of service..................................................................503.16. Business use of the Internet via broadband connection by firm size............................503.17. Internet penetration by size class..................................................................................513.18. Internet penetration by activity.....................................................................................513.19. Perceived barriers by businesses ..................................................................................533.20. Perceived cost barriers by businesses by firm size.......................................................543.21. Businesses lacking qualified personnel or know-how to use the Internet by firm size 543.22. Businesses facing security issues by firm size .............................................................553.23. Lack of perceived benefits from Internet use by sector ...............................................553.24. Price of leased lines in the OECD area ........................................................................573.25. Price of 40 hours of Internet use at peak times in PPP dollars.....................................573.26. Internet access prices and Internet hosts ......................................................................57
4.1. Internet commerce developments measured by the number of secure Web servers ....604.2. Distribution of e-commerce sales in European countries.............................................624.3. Businesses using the Internet for purchasing and selling.............................................634.4. Selling, delivering and paying over the Internet ..........................................................634.5. Internet purchases and sales by size class ....................................................................644.6. Internet purchases and sales by activity .......................................................................654.7. Individuals purchasing over the Internet ......................................................................674.8. Share of Internet sales by type of customer .................................................................674.9. Consumers’ Internet purchases by product ..................................................................694.10. Share of Internet sales in domestic and international markets .....................................69

8 MEASURING THE INFORMATION ECONOMY 2002
© OECD 20028
4.11. Business motivations for Internet commerce ...............................................................714.12. Barriers to Internet commerce faced by businesses .....................................................714.13. Small and large businesses facing barriers to Internet payments .................................724.14. Small and large businesses facing logistics barriers ....................................................724.15. Small and large businesses that find it too costly to develop and maintain an
e-commerce system......................................................................................................724.16. The nature of products is not suited for Internet sales..................................................73
5.1. Ratio of students to available computers in lower secondary education......................775.2. Percentage of lower secondary students using the available computers ......................775.3. Reasons for not using available computers in lower secondary schools......................775.4. Percentage of 15-year old students using a computer at school at least
a few times a week .......................................................................................................775.5. Government Internet access and Web sites in Australia ..............................................795.6. Internet and e-mail access in Canada’s public and private sectors ..............................795.7. Employees per PC in Japan’s central government .......................................................795.8. ICT use in the Finnish government ..............................................................................79
BOXES
1.1. Measuring investment in ICT equipment and software .........................................101.2. Measures of ICT consumption and investment – the OECD database
on purchasing power parities .................................................................................121.3. Patent indicators.....................................................................................................141.4. Measuring ICT-related skills..................................................................................16
2.1. International comparisons of ICT activities ...........................................................202.2. Measuring the contribution of the ICT sector to value added................................222.3. Measuring R&D expenditure in selected ICT industries .......................................262.4. Measuring ICT sector trade....................................................................................282.5. ICT specialisation indices ......................................................................................322.6. Activity of foreign affiliates...................................................................................34
3.1. Measuring the telecommunications network..........................................................383.2. Measuring the size and growth of the Internet.......................................................403.3. Measuring Internet access using information on subscribers.................................423.4. The comparability of household- and person-based indicators of Internet access
and use and the OECD model questionnaire on ICT usein households/by individuals..................................................................................43
3.5. Measuring ICT access and use by businesses: OECD efforts to improveinternational comparability ....................................................................................48
3.6. Measuring “perceived” barriers to ICT access and use in business surveys..........523.7. OECD Internet access price baskets ......................................................................56
4.1. Measuring electronic commerce: OECD definitions of Internet andelectronic transactions............................................................................................61
5.1. OECD statistics on education.................................................................................765.2. ICT in government .................................................................................................78
MEASURING THE INFORMATION ECONOMY 2002 9
Chapter I. Resources for the information economy
The contribution of the information economy to overall economic growth and performance is related to the amount of resourcesdevoted to new information technologies, whether in terms of consumption, investment or innovative efforts. This chapter looks first atthe share of information and communication technologies (ICTs) in total investment. Investment in ICT establishes the infrastructurefor the use of ICT and provides productive equipment and software to businesses, which helps raise labour productivity growth.Statistics on ICT investment are therefore an important indicator of the diffusion of ICT. While ICT investment has accelerated in mostOECD countries over the past decade, the pace of that investment differs widely. Data availability and measurement of ICT investmentbased on national accounts (SNA93) vary considerably across OECD countries, especially as regards measurement of investment insoftware, deflators applied, breakdown by institutional sector and temporal coverage (see Box 1.1).
Investment is only one component of final demand. A second indicator is the total resources countries devote to ICT, includingspending by both households and businesses, as well as the relative weight of ICT consumption and investment in GDP. ICTs aremainly investment goods and this is reflected in the large weight of ICT investment in total final demand. In some countries, however,household expenditure on ICT, mainly expenditure in telecommunication services, can represent a relatively important component,which, if not measured, could lead to underestimating the total contribution of ICT to the economy. Currently, national accounts are notalways sufficiently detailed to allow for the identification of both investment in and consumption of ICT goods and services. The secondindicator uses the OECD database on purchasing power parities (PPPs), which provides details on the components of finalexpenditure (see Box 1.2) and has a broader coverage of OECD countries.
ICTs are general-purpose technologies with the highest rate of innovation as measured by patents granted. ICTs are also enablingmany of the changes in business processes and innovation processes that help make other sectors more innovative. Amongindicators of ICT-related innovation are the numbers of ICT patents produced in OECD countries and their weight in overall innovation.While those indicators have some shortcomings (see Box 1.3), they highlight some important differences in the ICT-related patentingbehaviour of Europe, e.g. between larger and smaller European economies, as well as vis-à-vis the United States and Japan.
Human capital is a key policy area in the information economy, as it is required for innovation and growth. The measurement of stocksand flows of human resources for the information economy and of skills, their distribution among different economic activities and theeconomic effects of the acquisition or absence of certain skills are of significant concern for policy makers. Human resources and, inparticular, skills for the information economy are difficult to measure (see Box 1.4). The last indicators in this chapter seek to gauge thedistribution of ICT-related skills in Europe.
10 MEASURING THE INFORMATION ECONOMY 2002
Investment in ICT equipment and software
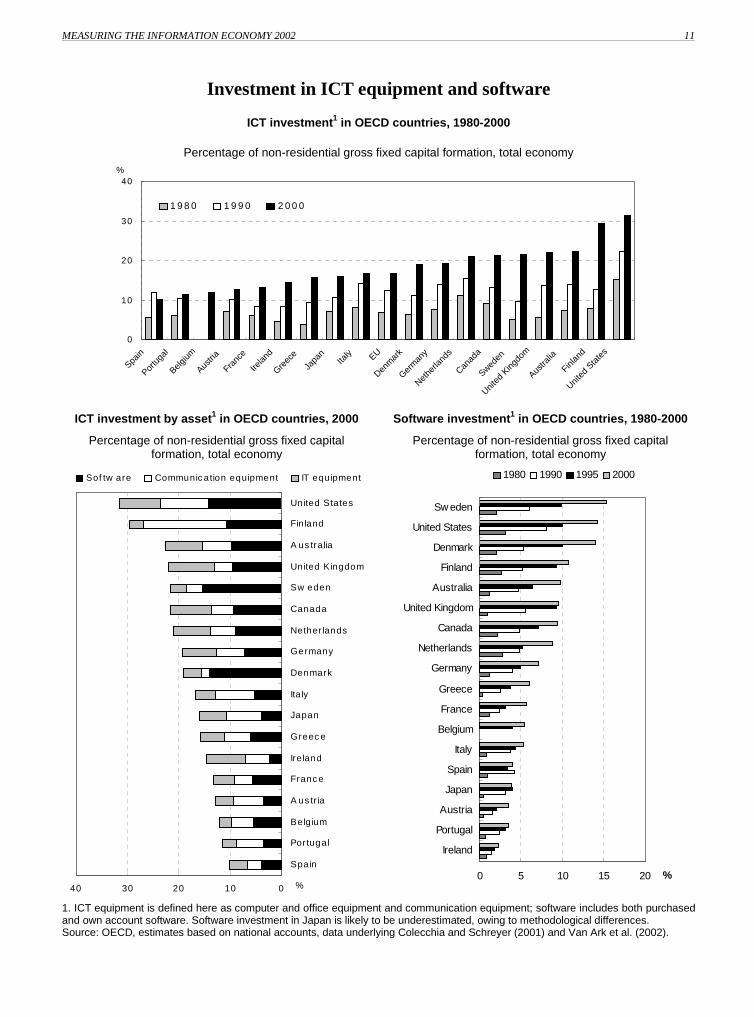
Investment in physical capital plays an importantrole in growth by expanding and renewing thecapital stock and enabling new technologies toenter the production process. Investment in ICThas been the most dynamic component of suchinvestment in recent years.
The data available for a number of OECDcountries show that investment in ICT rose fromless than 10% of total non-residential investment inthe business sector in the early 1980s to between10% and 35% in 2000. The share is particularlyhigh in the United States, Finland and Australia.
Investment in software was one of the mostdynamic areas. In the United States, it rose fromonly 3.0% of non-residential investment in 1980 to14.2% in 2000. Australia and Denmark alsoexperienced a rapid increase, but the UnitedKingdom and Japan showed little change from thelevel of the early 1990s.
By 2000, investment in software accounted forover 50% of the major ICT investment categoriesin Denmark and Sweden. Communicationsequipment was the most important area forinvestment in Austria, Finland, Italy, Japan andPortugal, while IT equipment was first in Ireland.
Real growth in ICT investment was particularlyrapid over the second half of the 1990s. Investmentin ICT equipment grew fastest, but the growth ofinvestment in software accelerated sharply in the1990s. Real growth in ICT investment has beenfuelled by a steady decline in the relative prices ofcomputer components. On the basis of harmonisedprice indices, constructed using the United Statesas a benchmark, the rate of decline in the price ofcomputers and office equipment increased from the1980s to the 1990s, even doubling in some cases(Colecchia and Schreyer, 2001).
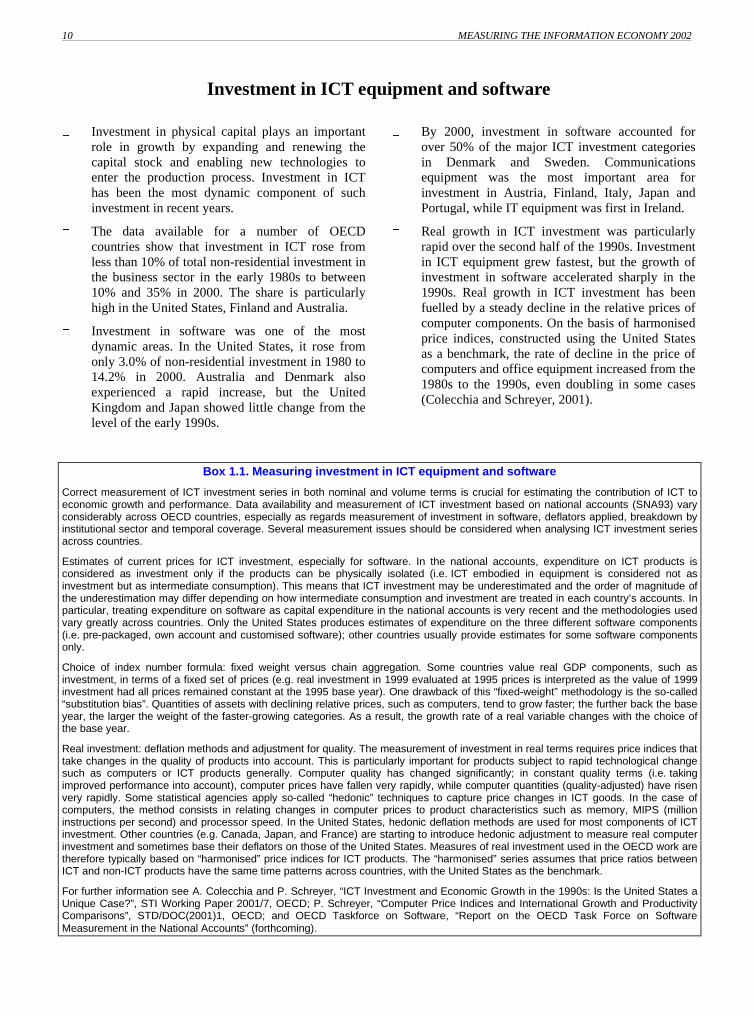
Box 1.1. Measuring investment in ICT equipment and software
Correct measurement of ICT investment series in both nominal and volume terms is crucial for estimating the contribution of ICT toeconomic growth and performance. Data availability and measurement of ICT investment based on national accounts (SNA93) varyconsiderably across OECD countries, especially as regards measurement of investment in software, deflators applied, breakdown byinstitutional sector and temporal coverage. Several measurement issues should be considered when analysing ICT investment seriesacross countries.
Estimates of current prices for ICT investment, especially for software. In the national accounts, expenditure on ICT products isconsidered as investment only if the products can be physically isolated (i.e. ICT embodied in equipment is considered not asinvestment but as intermediate consumption). This means that ICT investment may be underestimated and the order of magnitude ofthe underestimation may differ depending on how intermediate consumption and investment are treated in each country’s accounts. Inparticular, treating expenditure on software as capital expenditure in the national accounts is very recent and the methodologies usedvary greatly across countries. Only the United States produces estimates of expenditure on the three different software components(i.e. pre-packaged, own account and customised software); other countries usually provide estimates for some software componentsonly.
Choice of index number formula: fixed weight versus chain aggregation. Some countries value real GDP components, such asinvestment, in terms of a fixed set of prices (e.g. real investment in 1999 evaluated at 1995 prices is interpreted as the value of 1999investment had all prices remained constant at the 1995 base year). One drawback of this “fixed-weight” methodology is the so-called“substitution bias”. Quantities of assets with declining relative prices, such as computers, tend to grow faster; the further back the baseyear, the larger the weight of the faster-growing categories. As a result, the growth rate of a real variable changes with the choice ofthe base year.
Real investment: deflation methods and adjustment for quality. The measurement of investment in real terms requires price indices thattake changes in the quality of products into account. This is particularly important for products subject to rapid technological changesuch as computers or ICT products generally. Computer quality has changed significantly; in constant quality terms (i.e. takingimproved performance into account), computer prices have fallen very rapidly, while computer quantities (quality-adjusted) have risenvery rapidly. Some statistical agencies apply so-called “hedonic” techniques to capture price changes in ICT goods. In the case ofcomputers, the method consists in relating changes in computer prices to product characteristics such as memory, MIPS (millioninstructions per second) and processor speed. In the United States, hedonic deflation methods are used for most components of ICTinvestment. Other countries (e.g. Canada, Japan, and France) are starting to introduce hedonic adjustment to measure real computerinvestment and sometimes base their deflators on those of the United States. Measures of real investment used in the OECD work aretherefore typically based on “harmonised” price indices for ICT products. The “harmonised” series assumes that price ratios betweenICT and non-ICT products have the same time patterns across countries, with the United States as the benchmark.
For further information see A. Colecchia and P. Schreyer, “ICT Investment and Economic Growth in the 1990s: Is the United States aUnique Case?”, STI Working Paper 2001/7, OECD; P. Schreyer, “Computer Price Indices and International Growth and ProductivityComparisons”, STD/DOC(2001)1, OECD; and OECD Taskforce on Software, “Report on the OECD Task Force on SoftwareMeasurement in the National Accounts” (forthcoming).
MEASURING THE INFORMATION ECONOMY 2002 11
Investment in ICT equipment and software
ICT investment1 in OECD countries, 1980-2000
Percentage of non-residential gross fixed capital formation, total economy
0
10
20
30
40
Spain
Portu
gal
Belgium
Austri
a
Franc
e
Irelan
d
Greec
e
Japa
nIta
ly EU
Denm
ark
Germ
any
Nethe
rland
s
Canad
a
Sweden
United
King
dom
Austra
lia
Finlan
d
United
Sta
tes
1 9 8 0 1 9 9 0 2 0 0 0
%
ICT investment by asset1 in OECD countries, 2000
Percentage of non-residential gross fixed capitalformation, total economy
Software investment1 in OECD countries, 1980-2000
Percentage of non-residential gross fixed capitalformation, total economy
010203040
Spain
Portugal
Belgium
A us tr ia
Franc e
Ireland
Greec e
Japan
Ita ly
Denmark
Germany
Nether lands
Canada
Sw eden
United Kingdom
A us tralia
Fin land
United States
Sof tw are Communic ation equipment IT equipment
%0 5 10 15 20
Ireland
Portugal
Austria
Japan
Spain
Italy
Belgium
France
Greece
Germany
Netherlands
Canada
United Kingdom
Australia
Finland
Denmark
United States
Sw eden
%
1980 1990 1995 2000
1. ICT equipment is defined here as computer and office equipment and communication equipment; software includes both purchasedand own account software. Software investment in Japan is likely to be underestimated, owing to methodological differences.Source: OECD, estimates based on national accounts, data underlying Colecchia and Schreyer (2001) and Van Ark et al. (2002).
12 MEASURING THE INFORMATION ECONOMY 2002
Consumption of and investment in ICT goods and services
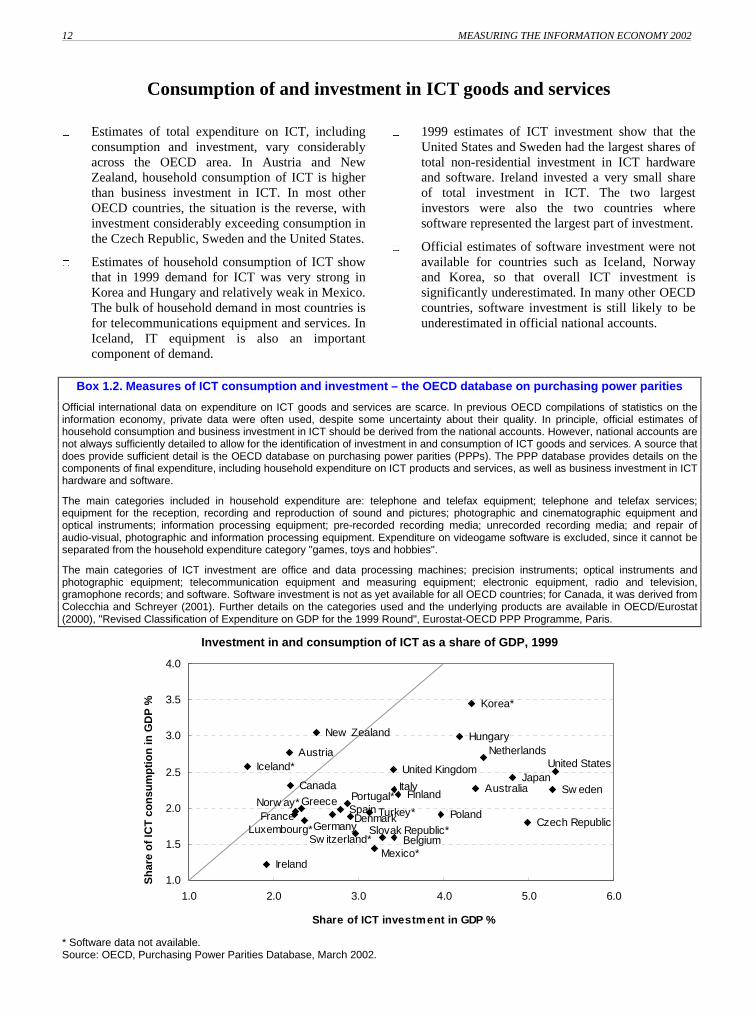
Estimates of total expenditure on ICT, includingconsumption and investment, vary considerablyacross the OECD area. In Austria and NewZealand, household consumption of ICT is higherthan business investment in ICT. In most otherOECD countries, the situation is the reverse, withinvestment considerably exceeding consumption inthe Czech Republic, Sweden and the United States.
Estimates of household consumption of ICT showthat in 1999 demand for ICT was very strong inKorea and Hungary and relatively weak in Mexico.The bulk of household demand in most countries isfor telecommunications equipment and services. InIceland, IT equipment is also an importantcomponent of demand.
1999 estimates of ICT investment show that theUnited States and Sweden had the largest shares oftotal non-residential investment in ICT hardwareand software. Ireland invested a very small shareof total investment in ICT. The two largestinvestors were also the two countries wheresoftware represented the largest part of investment.
Official estimates of software investment were notavailable for countries such as Iceland, Norwayand Korea, so that overall ICT investment issignificantly underestimated. In many other OECDcountries, software investment is still likely to beunderestimated in official national accounts.
Box 1.2. Measures of ICT consumption and investment – the OECD database on purchasing power parities
Official international data on expenditure on ICT goods and services are scarce. In previous OECD compilations of statistics on theinformation economy, private data were often used, despite some uncertainty about their quality. In principle, official estimates ofhousehold consumption and business investment in ICT should be derived from the national accounts. However, national accounts arenot always sufficiently detailed to allow for the identification of investment in and consumption of ICT goods and services. A source thatdoes provide sufficient detail is the OECD database on purchasing power parities (PPPs). The PPP database provides details on thecomponents of final expenditure, including household expenditure on ICT products and services, as well as business investment in ICThardware and software.
The main categories included in household expenditure are: telephone and telefax equipment; telephone and telefax services;equipment for the reception, recording and reproduction of sound and pictures; photographic and cinematographic equipment andoptical instruments; information processing equipment; pre-recorded recording media; unrecorded recording media; and repair ofaudio-visual, photographic and information processing equipment. Expenditure on videogame software is excluded, since it cannot beseparated from the household expenditure category "games, toys and hobbies".
The main categories of ICT investment are office and data processing machines; precision instruments; optical instruments andphotographic equipment; telecommunication equipment and measuring equipment; electronic equipment, radio and television,gramophone records; and software. Software investment is not as yet available for all OECD countries; for Canada, it was derived fromColecchia and Schreyer (2001). Further details on the categories used and the underlying products are available in OECD/Eurostat(2000), "Revised Classification of Expenditure on GDP for the 1999 Round", Eurostat-OECD PPP Programme, Paris.
Investment in and consumption of ICT as a share of GDP, 1999
Mexico*
United States
Canada
Korea*
Japan
New Zealand
Australia
Turkey*
Slovak Republic*
Poland
Hungary
Czech Republic
Sw itzerland*
Norw ay*
Iceland* United Kingdom
Sw edenFinlandPortugal*
Austria Netherlands
Luxembourg*
Italy
Ireland
FranceSpain
Greece
Denmark
BelgiumGermany
1.0
1.5
2.0
2.5
3.0
3.5
4.0
1.0 2.0 3.0 4.0 5.0 6.0
Share of ICT investment in GDP %
Sh
are
of
ICT
co
nsu
mp
tio
n in
GD
P %
* Software data not available.Source: OECD, Purchasing Power Parities Database, March 2002.

MEASURING THE INFORMATION ECONOMY 2002 13
Consumption of and investment in ICT goods and services
Share of consumption of ICT goods and services in total household consumption, 1999
0
1
2
3
4
5
6
7
Mex
ico
Irel
and
Tur
key
Sw
itzer
land
Gre
ece
Slo
vak
Rep
ublic
Pol
and
Bel
gium
Spa
in
Ger
man
y
Cze
ch R
epub
lic
Por
tuga
l
Fra
nce
Uni
ted
Sta
tes
Italy
Aus
tral
ia
Den
mar
k
Uni
ted
Kin
gdom
Can
ada
Nor
way
Japa
n
Fin
land
Icel
and
Luxe
mbo
urg
Sw
eden
Aus
tria
New
Zea
land
Net
herla
nds
Hun
gary
Kor
ea
Telephone and telefax equipment and services Audio-visual, photographic and information processing equipment
Share of ICT investment in total non-residential gross fixed capital formation, 1999
0
5
10
15
20
25
30
35
40
Icel
and*
Nor
way
*
Slo
vak
Rep
ublic
*
Irel
and
Luxe
mbo
urg*
Aus
tria
Por
tuga
l*
Gre
ece
Spa
in
Fra
nce
Pol
and
New
Zea
land
Den
mar
k
Sw
itzer
land
*
Ger
man
y
Kor
ea*
Mex
ico*
Cze
ch R
epub
lic
Japa
n
Tur
key*
Hun
gary
Bel
gium
Uni
ted
Kin
gdom
Can
ada
Italy
Aus
tral
ia
Fin
land
Net
herla
nds
Uni
ted
Sta
tes
Sw
eden
Office and data processing machinery Telecommunications equipmentSoftware Precision instruments
* Software data not available.Source: OECD, Purchasing Power Parities Database, March 2002.
14 MEASURING THE INFORMATION ECONOMY 2002
ICT patents
Patent-based statistics are widely used indicators ofthe output of inventive activity. During the 1990s,ICT patents grew at 10% in the OECD area, doublethe rate of total patent applications (5%). In 1998,ICT patents represented about 16% of total OECDpatent applications.
Over the 1990s, ICT patents increased much morerapidly in the European Union and the UnitedStates than in Japan, with average annual growthrates of 16%, 10% and 2%, respectively. Shares ofICT patents are higher in Japan and the UnitedStates than in the European Union; in 1998, aboutone in five Japanese patent applications were forICT, compared to about one in eight for theEuropean Union.
Shares of ICT patents are high in smaller OECDcountries, such as Finland, Iceland and Korea(which also have high ICT R&D expenditure). ICTpatents have also increased much more rapidly inNorway, Sweden and Denmark than in largercountries.
Almost 40% of total patent applications filed at theEuropean Patent Office (EPO) are from EUcountries, above the shares of the United States(34%) and Japan (21%). However, the EuropeanUnion’s share most likely overestimates its actualshare in world inventions owing to the “homeadvantage” factor, as patents taken at the EPOprimarily reflect the domestic markets of Europeancountries.
Box 1.3. Patent indicators
Patent data are readily available from patent agencies, and they contain much information (applicant, inventor, technology, claims,etc.). Patent indicators have some weaknesses, however. For instance, many inventions are not patented, and the propensity to patentdiffers across countries and industries. Another drawback is related to differences in patent regulations among countries that hamperinternational comparability. Changes in patent law may also affect patent time series. Finally, the distribution of patents according totheir value is skewed: many patents have no commercial application (hence little value), while a few have great value. It is thereforeimportant to rely on methods for counting patents that minimise statistical biases while conveying a maximum amount of information. Inparticular, four methodological choices have to be made.
• Geographical distribution of patents. Three main criteria can be used: i) counts by priority office (country where the first applicationis filed, before protection is extended to other countries); ii) counts by the inventor’s country of residence, which indicates theinventiveness of the local labour force; iii) counts by the applicant’s country of residence (the owner of the patent at the time ofapplication), which indicates control of the invention. The method most widely used is counts by the inventor’s country ofresidence.
• Patents with multiple inventors from different countries. Such patents can either be partly attributed to each country mentioned(fractional count) or fully attributed to every relevant country, thus generating multiple counting. It is better to use fractional countingprocedures.
• Reference date. The choice of one date, among the set of dates included in patent documents, is also important. The priority date(first filing worldwide) is the earliest and therefore closest to the invention date. Counts by application date introduce a bias owingto a one-year lag between residents and foreigners: the latter usually first file a patent application at their domestic office (thepriority office) and later in other countries. The lag increases to 2.5 years for Patent Co-operation Treaty (PCT) applications. Tomeasure inventive activity, patent time series should be computed with respect to the priority date.
• The increasing use of the PCT procedure. This is an option for future filing, which can eventually be exercised (transferred toregional or national offices such as the EPO or US Patent and Trademark Office) and become actual patent applications. Some40% of options are not exercised. When counting, it is inappropriate to mix PCT applications with other types. Since there is a lagof about three years between priority and publication of transfer, patent statistics would be out of date when published. To haverecent patents counts, one must estimate (“nowcast”) transfers before they are actually performed.
ICT patents include patents from any of the following classes of the International Patent Classification (IPC): computing, calculatingand counting (G06); information storage (G11); and electric communication technique (H04). Patent data reported here are based onpatent applications filed at the EPO.
For further information, see OECD (1994), “Using Patent Data as Science and Technology Indicators – Patent Manual”, Paris.

MEASURING THE INFORMATION ECONOMY 2002 15
ICT patents
ICT1 patents as a percentage of total national patents filed at the EPO, for priority years 1990, 1998
0
5
10
15
20
25
30
35
40
45
Finlan
d
Icelan
d
Korea
Nethe
rland
s
Japa
n
Sweden
Canad
a
United
Sta
tes
Irelan
d
United
King
dom
OECD
Hunga
ry
Franc
e
Turke
y
Austra
lia
Europ
ean
Union
Denm
ark
Norway
New Z
ealan
d
Germ
any
Poland
Belgium
Spain
Greec
e
Switzer
land
Austri
aIta
ly
Mex
ico
Portu
gal
Slovak
Rep
ublic
Luxe
mbo
urg
Czech
Rep
ublic
%
1998 1990
1. Classes of International Patent Classification: G06, G11 and H04.Source: OECD, Patent database, March 2002.
Share of ICT1 patents filed at the EPO, for priority year 1998
Japan21%
European Union39%
United States34%
Korea2%
Canada2%
Other2%
1. Classes of International Patent Classification: G06, G11 and H04.Source: OECD, Patent database, March 2002.
16 MEASURING THE INFORMATION ECONOMY 2002
Occupations and skills in the information economy
Indicators of skills required for the informationeconomy are of increasing importance to policymakers, especially because of growing ICT skillsshortages.
Generally, when new technologies are introducedinto the production process, demand drops forlow-skilled workers and rises for high-skilledworkers. However, not all ICT-related occupationsare high-skill. Also, adoption of ICT at firm leveldoes not necessarily translate into an increase inthe economy-wide demand for higher skills. Forexample, new technologies may replacemiddle-level managers, who are typicallyconsidered high-skilled workers.
The figures reported here are based on acomparison of data on occupations from the USCurrent Population Survey (CPS) with ISCO-88occupation data from the Eurostat Labour ForceSurvey. While the data are not strictly comparablein terms of levels, the distribution of high- andlow-skill ICT-related occupations in the UnitedStates and the European Union shows an
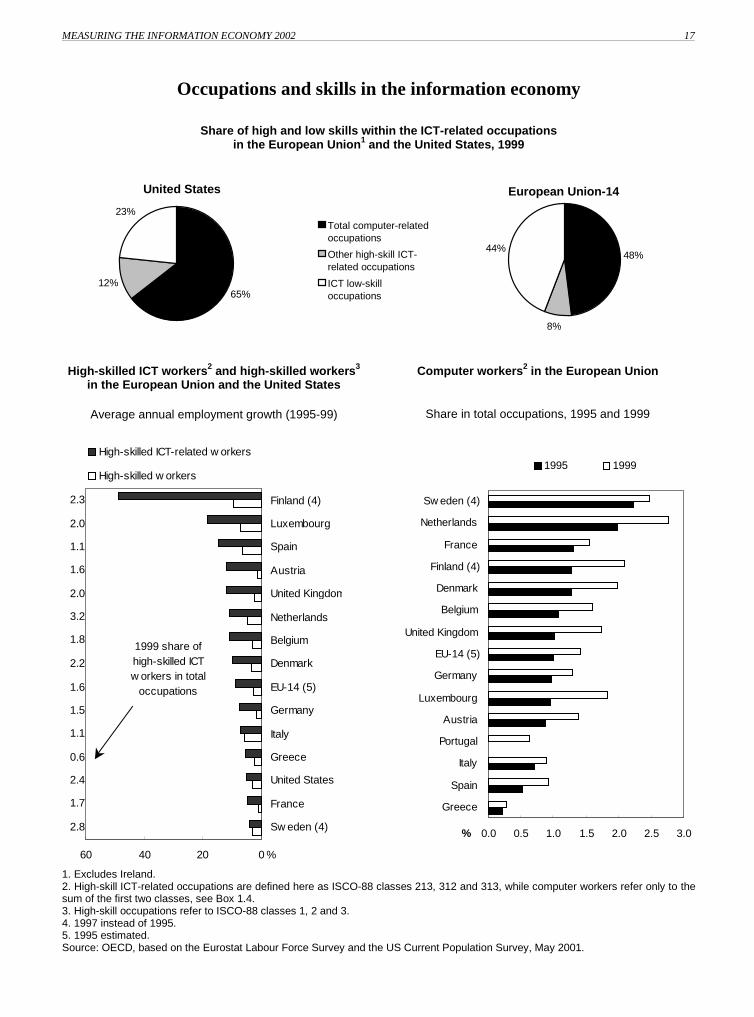
interesting pattern. Although the share of ICTworkers is growing everywhere, in 1999 the USICT workforce appeared to be relatively morehigh-skilled (77%) than that of the EuropeanUnion (56%). However, the European averagehides wide disparities.
High-skill ICT workers are the most rapidlygrowing component of high-skilled workers; overthe 1997-99 period, Finland had an annual growthrate of about 49%. In 1999, high-skilled ICTworkers represented between 0.6% and over 3% oftotal employment in EU member states. The EUaverage was 1.6% (about 2.4% in the UnitedStates). The shares were highest in the Netherlands(3.2%) and Sweden (2.8%) and lowest in Greece(0.6%) and Portugal (0.9%).
Computer workers represent the largest componentof high-skilled ICT workers. Over the 1995-99period, the gap in computer workers betweennorthern and southern European countriesappeared to be increasing.
Box 1.4. Measuring ICT-related skills
Skills are difficult to measure, and proxies are often used to capture observable characteristics such as educational attainment, on thesupply side, and occupations, on the demand side. While an international classification of occupations exists (ISCO-88, InternationalStandard Classification of Occupations, International Labour Office), there is no internationally agreed list of ICT-related occupations.An attempt was made here to match data on occupations from the US Current Population Survey (CPS) with ISCO-88-basedoccupation data from the Eurostat Labour Force Survey. Owing to data availability, only 3-digit ISCO-88 occupational classes could beselected. In order to compare US and European figures for 1999, in the absence of an official concordance between CPS andISCO-88, similar classes were selected from the CPS. Some of the low-skill ICT occupations were not included in the calculationsbecause they could not be matched to the ISCO-88 3-digit classification. These estimates of ICT-related occupations thereforeconstitute a lower bound. Another limitation of this type of data is that they are based on self-declared occupations.
For Europe, the high-skill ICT-related occupations (ISCO-88) selected were computing professionals (213, including computer systemsdesigners and analysts, computer programmers, computer engineers); computer associate professionals (312, includingphotographers and image and sound recording equipment operators, broadcasting and telecommunications equipment operators);optical and electronic equipment operators (313, including computer assistants, computer equipment operators, Industrial robotcontrollers). For low-skill ICT occupations, the only class that could be selected was electrical and electronic equipment mechanics andfitters (ISCO-88, 724). Computer workers are here defined as the sum of ISCO-88 213 and 312.
For the United States, data from the Current Population Survey (CPS), US Bureau of the Census, were used. High-skill ICToccupations include: computer systems analysts and scientists (64); operations and systems researchers and analysts (65); computerprogrammers (229); tool programmers, numerical control (233); electrical and electronic technicians (213); broadcast equipmentoperators (228); computer operators (308); peripheral equipment operators (309). Low-skill ICT occupations include: data processingequipment repairers (525); electrical power installers and repairers (577); telephone line installers and repairers (527); telephoneinstallers and repairers (529); electronic repairers, communications and industrial equipment (523). The US Standard OccupationalClassification (SOC) has now been revised (2000, see http://stats.bls.gov/soc/). The revised SOC will be used to classify responses tothe 2000 US Decennial Census.
MEASURING THE INFORMATION ECONOMY 2002 17
Occupations and skills in the information economy
Share of high and low skills within the ICT-related occupationsin the European Union1 and the United States, 1999
European Union-14
48%
8%
44%
United States
65%12%
23%Total computer-relatedoccupations
Other high-skill ICT-related occupations
ICT low-skilloccupations
High-skilled ICT workers2 and high-skilled workers3
in the European Union and the United States
Average annual employment growth (1995-99)
Computer workers2 in the European Union
Share in total occupations, 1995 and 1999
2.8
1.7
2.4
0.6
1.1
1.5
1.6
2.2
1.8
3.2
2.0
1.6
1.1
2.0
2.3
0204060
Sw eden (4)
France
United States
Greece
Italy
Germany
EU-14 (5)
Denmark
Belgium
Netherlands
United Kingdom
Austria
Spain
Luxembourg
Finland (4)
%
High-skilled ICT-related w orkers
High-skilled w orkers
1999 share of high-skilled ICT w orkers in total
occupations
0.0 0.5 1.0 1.5 2.0 2.5 3.0
Greece
Spain
Italy
Portugal
Austria
Luxembourg
Germany
EU-14 (5)
United Kingdom
Belgium
Denmark
Finland (4)
France
Netherlands
Sw eden (4)
%
1995 1999
1. Excludes Ireland.2. High-skill ICT-related occupations are defined here as ISCO-88 classes 213, 312 and 313, while computer workers refer only to thesum of the first two classes, see Box 1.4.3. High-skill occupations refer to ISCO-88 classes 1, 2 and 3.4. 1997 instead of 1995.5. 1995 estimated.Source: OECD, based on the Eurostat Labour Force Survey and the US Current Population Survey, May 2001.

19 MEASURING THE INFORMATION ECONOMY 2002
Chapter II. The ICT sector
There is no immediate reason why a country with a small or no ICT-producing industry, should not benefit from the positive effects ongrowth of new information technologies. Yet, the question of the role of the ICT-producing sector has been debated, in particular fromthe perspective of a comparison of European economies with that of the United States. What is the ICT sector? What is its size, howfast it is growing, what is its contribution to economic activity? How do OECD countries compare in terms of specialisation in ICTproduction?
In 1998, OECD member countries agreed on a definition of the ICT sector as a combination of manufacturing and services industriesthat capture, transmit and display data and information electronically (see Annex 1). One important feature of this definition, based onan international standard classification of activities (ISIC Rev. 3), is that it breaks the traditional ISIC dichotomy between manufacturingand services activities. While the production or distribution of ICT products can be found everywhere in the economy, the identificationof sectors whose main activity is to produce or distribute ICT products constitutes a first-order approximation of the "ICT sector".
The importance of the ICT sector has grown over time, especially in northern European countries, such as Finland, Sweden, Norway,the Netherlands and the United Kingdom. The composition of the ICT-producing industry varies considerably across OECD countries.Patterns of trade specialisation and comparative advantage seem to suggest the presence of economies of scale in ICT production.Finland and Sweden, for example, have built up their competitive advantage in this sector over the last few years by expanding theircommunication equipment sector. This might indicate that there is space for new entrants in ICT markets. Moreover, the relativespecialisation of some countries in ICT production depends heavily on the presence of foreign affiliates. This is the case for Irelandand Hungary, where a large portion of ICT production is due to foreign affiliates.
On average, Europe lags the United States in terms of specialisation in ICT production, but averages hide wide differences betweensmaller northern European countries and larger European countries. The latter lag in terms of ICT production, imports of embodiedICT technology and, possibly more importantly, R&D.
While the ICT sector still accounts for a relatively small share of OECD business sector GDP, about 10% in 2000, it can make arelatively large contribution to growth and productivity performance if it grows more rapidly than the rest of the economy. Few OECDcountries are specialised in the parts of the ICT sector that are characterised by very rapid technological progress, e.g. the productionof semiconductors and computers. This is not necessarily a problem for countries that do not produce such goods, since a substantialpart of the benefits of ICT production accrue to importing countries and to users, as these can benefit from cheap investment andconsumer goods.
The survey data collected from member countries, as well as methodological information about sources and methods used to collectthe data on the ICT sector, is being published for the first time in the electronic version of Measuring the Information Economy 2002(see�www.oecd.org/sti/measuring-infoeconomy���The data provided by member countries have then been combined with different data sources to estimate ICT aggregates compatible with national accounts totals. The estimates compatible with national accounts havebeen used to construct the figures for ICT-sector production, value added and employment in this chapter. For this reason, theindicators presented here may differ from figures contained in national reports and in previous OECD publications.

20 MEASURING THE INFORMATION ECONOMY 2002
© OECD 200220
ICT-producing sectors
National accounts estimates of production values,based on the OECD definition of ICT-producingindustries, show that ICT production as a share ofbusiness sector production (excluding agriculture)ranged between 4% and 15% in OECD countries in2000. Sweden and Finland became increasinglyspecialised in the production of communicationequipment, and almost doubled their share of ICTproduction in total production over the 1995-2000period.
When ICT manufacturing is compared to totalmanufacturing, Finland’s specialisation in ICTproduction is over 20%, Korea’s is 19%, andSweden’s is 17%, well above the shares for Japan(14%) and the United States (11% in 1999).
Overall the composition of ICT production differsacross OECD countries. Few are specialised in theparts of the ICT sector that are characterised byvery rapid technological progress, e.g. theproduction of semiconductors and computers.Some countries are specialised in themanufacturing of communication equipment (e.g.Finland, Korea, Mexico, Japan and Sweden). Othercountries have experienced a growing weight ofcomputer services in ICT production. This isespecially the case in Denmark, France, Italy, theNetherlands, Norway, and the United Kingdomwere computer services now account for over 30%of total ICT production.
Box 2.1. International comparisons of ICT activities
In 1998, OECD member countries agreed on a definition of the ICT sector as a combination of manufacturing and services industriesthat capture, transmit and display data and information electronically (see Annex 1). The existence of a widely accepted definition ofthe ICT sector is the first step towards comparisons across time and countries. The quality and comparability of the data collected atthe OECD has improved, and some member countries use their national classifications to provide more accurate measures of the ICTsector.
The capacity to provide data according to the OECD definition of the ICT sector is a function of the similarity between nationalclassifications and ISIC Rev. 3. While NACE, the European classification, matches ISIC at the required level of detail and provides aneven finer breakdown, specific concordances and estimates have to be provided for NAICS (Canada, the United States), ANZIC(Australia, New Zealand) and SIC (Japan). Table A.1 in Annex 1 shows the concordance between the ISIC Rev. 3 classes included inthe OECD definition of the ICT sector and the more detailed national classifications currently used by member countries to providedata to the OECD. While it is generally possible to calculate ICT manufacturing aggregates, a few problems remain for reaching thelevel of service industry detail required for the ICT sector definition. In particular:
(a) The treatment of ICT wholesale. In 1998 it was recommended that member countries identify and provide the part of the classattributable to the wholesaling of ICT products. National classifications are currently being used by a number of countries – albeit withvarying degrees of precision – to isolate ICT wholesale. The United States and Canada differ slightly in their definition of wholesale ofICT products. Australia uses a part-class procedure in which data on ICT specialist businesses are compiled. Australia excluded fromwholesale of machinery and equipment (ANZIC 4611) only the wholesale of farm and construction machinery.
(b) ISIC Rev. 3 class 6420 (Telecommunications services). For reasons of confidentiality, some countries are unable to separate datafor this class from data related to post and telecommunications. Germany, Greece and Turkey have very limited coverage in terms ofvariables and time series.
(c) Rental of office machinery and equipment. About one-third of countries are currently unable to provide data for ISIC class 7123.
The survey data collected from member countries, as well as methodological information about sources and methods used to collectthe data, are being published for the first time in the electronic version of Measuring the Information Economy 2002(www.oecd.org/sti/measuring-infoeconomy���The data provided by member countries have been combined with different data sources to estimate ICT aggregates compatible with national accounts totals. These have been used to construct the figures relating toproduction for the ICT sector, value added and employment in this publication. For this reason, the statistics presented here may differfrom figures contained in national reports and in previous OECD publications.

MEASURING THE INFORMATION ECONOMY 2002 21
© OECD 2002 21
ICT-producing sectors
Share of ICT-producing activities in the non-agriculture business sector,1 2000
Percentages
0
2
4
6
8
10
12
14
16
Finlan
d
Korea
*
Sweden
Japa
n*
United
King
dom
Franc
e
Mex
ico
Czech
Rep
ublic
Norway
*
Germ
any*
Nethe
rland
s
Austri
a
Denm
ark
Italy
Slovak
Rep
ublic
*
ICT services
ICT manufacturing
%
Composition of ICT sector production,2 2000
Percentage share
0%
25%
50%
75%
100%
Austra
lia (3
)
Austri
aCze
ch R
epub
licDen
mar
k
Finlan
d
Franc
eGer
man
y*
Italy
Japa
n*
Korea
*
Mex
icoNet
herla
nds
Norway
*Slov
ak R
epub
lic*
Sweden
United
King
dom
Computing equipment Radio, TV and communication equipmentOther ICT manufacturing Telecommunications servicesComputer services
* 1999 instead of 2000.1. Totals for the ICT-producing sector exclude production values in ICT wholesaling and ICT rental services.2. "Other ICT manufacturing" includes insulated wire and cable and precision instruments.3. 2000-01.Source: OECD estimates, based on national sources; STAN and National Accounts databases, August 2002.
22 MEASURING THE INFORMATION ECONOMY 2002
© OECD 200222
Size and growth of the ICT sector
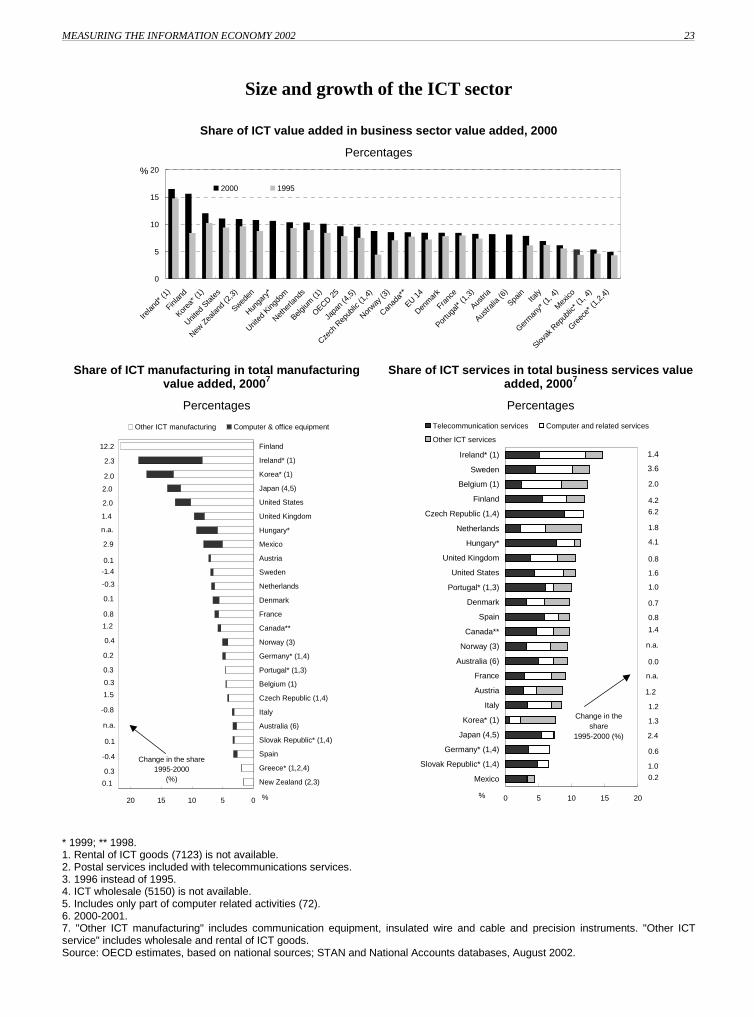
The importance of the ICT sector within OECDeconomies has been growing over the 1990s. Rapidgrowth is especially apparent in northern Europeancountries (Finland, Sweden, Norway, theNetherlands and the United Kingdom). In Finland,the ICT sector’s share of value added increased by7.2 percentage points over the 1995-2000 periodand now represents over 15% of total businessvalue added. On average, however, the ICT sectorstill accounts for a relatively small share of OECDbusiness-sector GDP. In 2000, ICT value addedrepresented between 5% and 16.5% of totalbusiness sector value added and the average sharein the OECD (25 countries) was about 9.7%, whilein the European Union reached 8.5%.
Ireland, Finland, Korea, Japan and Mexico arespecialised in the manufacture of ICT goods. InFinland, for example, ICT accounts for almost22% of total manufacturing value added. Exceptfor Ireland, where computing and office equipmentaccounts for over 10% of manufacturing valueadded, the largest contribution to economic activity
typically comes from the manufacture oftelecommunication equipment. ICT services, suchas telecommunication and computer services,generally constitute between 70% and 90% of totalICT sector value added.
Most OECD countries already have a well-developed telecommunication services sector,which is reflected in its sizeable contribution toICT sector value added. Hungary and the CzechRepublic, with the highest relative share oftelecommunication services, are reaping thebenefits of liberalisation reforms in the mid-1990s.At the same time, there is a noticeable increase inthe contribution of computer and related services,mainly software services. The share of computerand related services in business services valueadded was highest in Ireland (7% in 1999),Sweden (5.7% in 2000), and the United Kingdom(4.2% in 2000). Software consultancy accounts forbetween 60% and 80% of computer services.
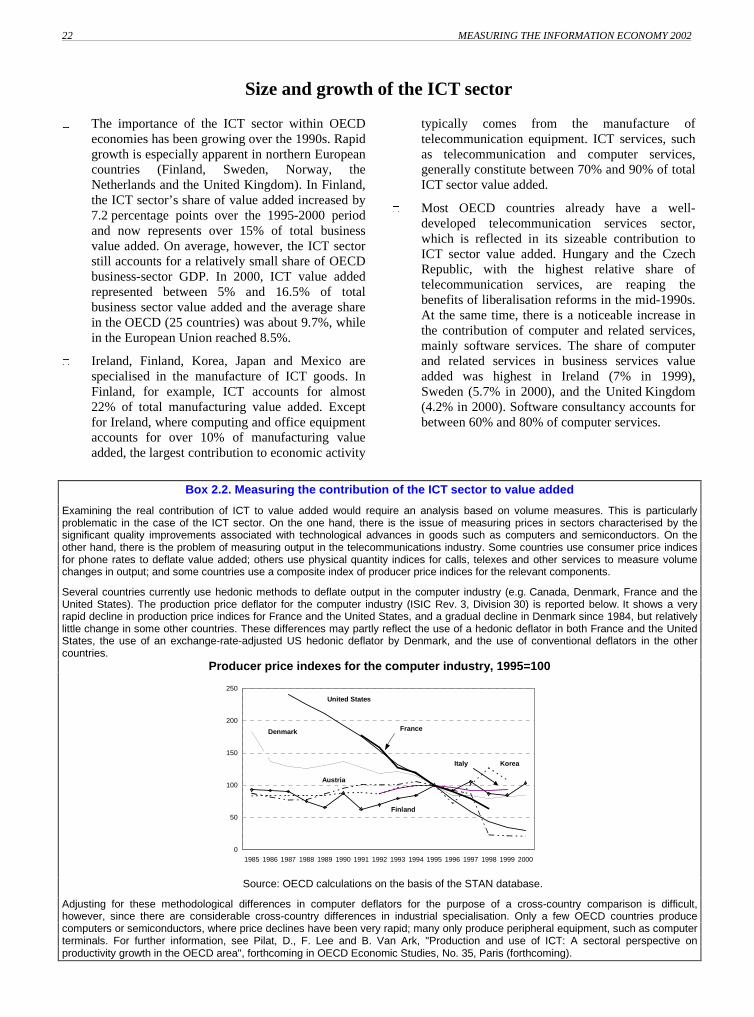
Box 2.2. Measuring the contribution of the ICT sector to value added
Examining the real contribution of ICT to value added would require an analysis based on volume measures. This is particularlyproblematic in the case of the ICT sector. On the one hand, there is the issue of measuring prices in sectors characterised by thesignificant quality improvements associated with technological advances in goods such as computers and semiconductors. On theother hand, there is the problem of measuring output in the telecommunications industry. Some countries use consumer price indicesfor phone rates to deflate value added; others use physical quantity indices for calls, telexes and other services to measure volumechanges in output; and some countries use a composite index of producer price indices for the relevant components.
Several countries currently use hedonic methods to deflate output in the computer industry (e.g. Canada, Denmark, France and theUnited States). The production price deflator for the computer industry (ISIC Rev. 3, Division 30) is reported below. It shows a veryrapid decline in production price indices for France and the United States, and a gradual decline in Denmark since 1984, but relativelylittle change in some other countries. These differences may partly reflect the use of a hedonic deflator in both France and the UnitedStates, the use of an exchange-rate-adjusted US hedonic deflator by Denmark, and the use of conventional deflators in the othercountries.
Producer price indexes for the computer industry, 1995=100
0
50
100
150
200
250
1985 1986 1987 1988 1989 1990 1991 1992 1993 1994 1995 1996 1997 1998 1999 2000
United States
Denmark
Finland
France
Austria
KoreaItaly
Source: OECD calculations on the basis of the STAN database.
Adjusting for these methodological differences in computer deflators for the purpose of a cross-country comparison is difficult,however, since there are considerable cross-country differences in industrial specialisation. Only a few OECD countries producecomputers or semiconductors, where price declines have been very rapid; many only produce peripheral equipment, such as computerterminals. For further information, see Pilat, D., F. Lee and B. Van Ark, "Production and use of ICT: A sectoral perspective onproductivity growth in the OECD area", forthcoming in OECD Economic Studies, No. 35, Paris (forthcoming).
MEASURING THE INFORMATION ECONOMY 2002 23
© OECD 2002 23
Size and growth of the ICT sector
Share of ICT value added in business sector value added, 2000
Percentages
0
5
10
15
20
Irelan
d* (1
)
Finlan
d
Korea
* (1)
United
Sta
tes
New Z
ealan
d (2
,3)
Sweden
Hunga
ry*
United
King
dom
Nethe
rland
s
Belgium
(1)
OECD 25
Japa
n (4
,5)
Czech
Rep
ublic
(1,4
)
Norway
(3)
Canad
a**
EU 14
Denm
ark
Franc
e
Portu
gal*
(1,3
)
Austri
a
Austra
lia (6
)
Spain
Italy
Germ
any*
(1, 4
)
Mex
ico
Slovak
Rep
ublic
* (1,
4)
Greec
e* (1
,2,4
)
2000 1995
%
Share of ICT manufacturing in total manufacturingvalue added, 20007
Percentages
Share of ICT services in total business services valueadded, 20007
Percentages
12.2
2.3
2.0
2.0
2.0
1.4
n.a.
2.9
0.1
-1.4
-0.3
0.1
0.8
1.2
0.4
0.2
0.3
0.3
1.5
-0.8
n.a.
0.1
-0.4
0.1
05101520
New Zealand (2,3)
Greece* (1,2,4)
Spain
Slovak Republic* (1,4)
Australia (6)
Italy
Czech Republic (1,4)
Belgium (1)
Portugal* (1,3)
Germany* (1,4)
Norway (3)
Canada**
France
Denmark
Netherlands
Sweden
Austria
Mexico
Hungary*
United Kingdom
United States
Japan (4,5)
Korea* (1)
Ireland* (1)
Finland
Other ICT manufacturing Computer & office equipment
%
0.3
Change in the share 1995-2000
(%)
%
0.2
1.0
2.4
0.6
1.3
1.2
1.2
n.a.
0.0
n.a.
1.4
0.8
0.7
1.0
1.6
4.1
0.8
1.8
6.2
4.2
2.0
3.6
1.4
0 5 10 15 20
Mexico
Slovak Republic* (1,4)
Germany* (1,4)
Japan (4,5)
Korea* (1)
Italy
Austria
France
Australia (6)
Norway (3)
Canada**
Spain
Denmark
Portugal* (1,3)
United States
United Kingdom
Hungary*
Netherlands
Czech Republic (1,4)
Finland
Belgium (1)
Sweden
Ireland* (1)
Telecommunication services Computer and related services
Other ICT services
%
Change in the share
1995-2000 (%)
* 1999; ** 1998.1. Rental of ICT goods (7123) is not available.2. Postal services included with telecommunications services.3. 1996 instead of 1995.4. ICT wholesale (5150) is not available.5. Includes only part of computer related activities (72).6. 2000-2001.7. "Other ICT manufacturing" includes communication equipment, insulated wire and cable and precision instruments. "Other ICTservice" includes wholesale and rental of ICT goods.Source: OECD estimates, based on national sources; STAN and National Accounts databases, August 2002.

24 MEASURING THE INFORMATION ECONOMY 2002
© OECD 200224
The contribution of the ICT sector to employment growth
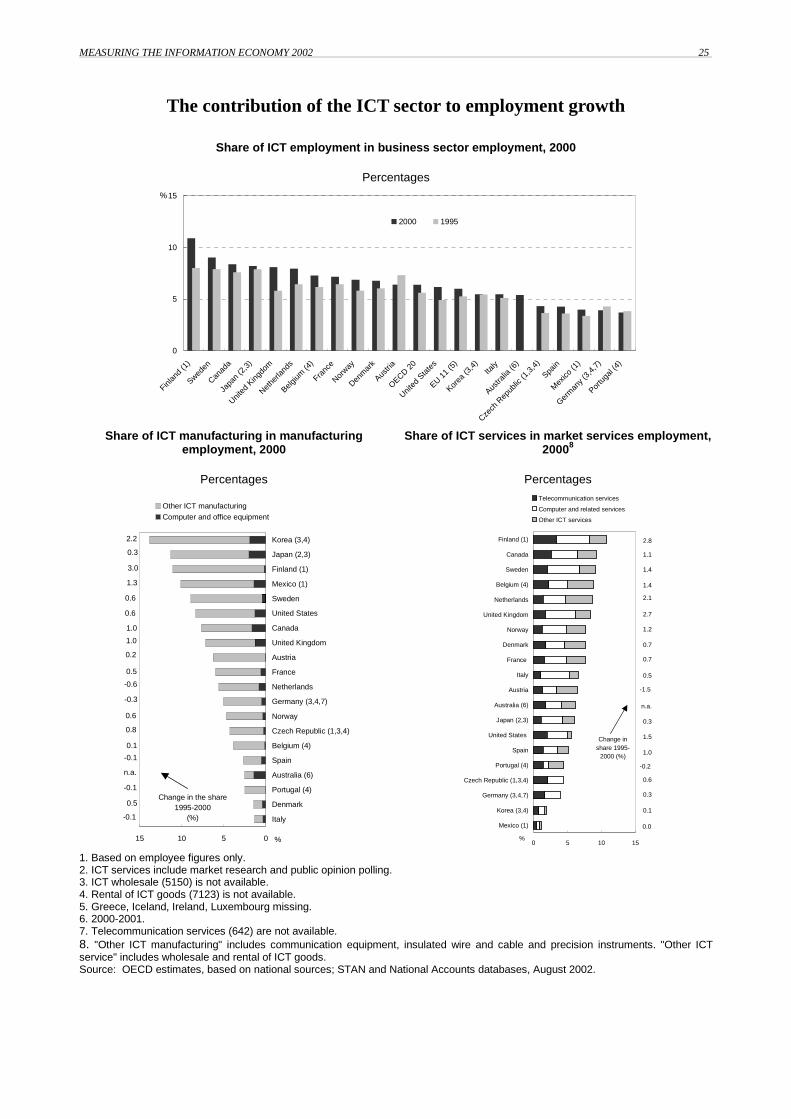
In 2000, the 20 OECD countries for whichestimates are available employed 16 millionpersons in the ICT sector, about 6.4% of totalbusiness employment. The United States and theEU (excluding Greece, Iceland, Ireland andLuxembourg) each represented 34% of this totaland Japan 18%.
The ICT sector has been a major source ofemployment growth. Over the 1995-2000 period,OECD-area employment in the sector grew byalmost 3 million persons, i.e. an average annualgrowth rate of over 4% a year, almost 3 times thatof overall business sector employment. ICTservices have been driving this growth;employment in the ICT manufacturing sector hasgenerally followed the declining trend of overallmanufacturing employment, albeit to a lesserextent. Exceptions are Finland and Mexico, whereICT manufacturing employment grew by over 9%a year, and Canada, the Czech Republic, theNordic countries, Spain and the United Kingdomwhere it grew between 3% and 5%.
Over the 1995-2000 period, ICT servicesemployment grew everywhere except in Austria.
The United Kingdom (10.5%), the Netherlands(10.2%), Finland (9.8%) and the United States(9.5%), the Czech Republic and Spain (7.3%)registered annual growth rates above the OECDaverage (6.3%). Employment in computer-relatedservices, mainly software services, was the mostdynamic component, growing by an average of11% a year in the OECD-20 area and by over 19%in the United Kingdom.
In 2000, the share of ICT employment in totalbusiness sector employment was higher than theOECD average in Finland (10.9%), Sweden(9.0%), Canada (8.4%), the Netherlands (8%), theUnited Kingdom and Japan (about 8.2%), Belgiumand France (about 7.3%).
Over the 1995-2000 period, the contribution ofICT manufacturing to total manufacturingemployment was stable in most OECD countries. Itvaries widely across the OECD area, ranging from13.8% in Korea to 1.3% in Italy. The average shareof ICT services employment in market services,instead, has grown over time to about 5.9% in theOECD-20 area in 2000.
Employment in the ICT sector, selected OECDcountries, 2000
Percentage share
The contribution of ICT services to business sectoremployment growth, selected OECD countries
Average annual growth rate 1995-2000, index 1995=100
United Kingdom
9%
Italy5%
Canada4%
Japan18%
France6%Germany
6%
United States34%
Korea4%
Nordic2
3%Other OECD1
11%
Total business
sector1.4%
ICT sector4.1%
ICT services6.3%
1.0
1.1
1.2
1.3
1.4
1995 1996 1997 1998 1999 2000
1. “Other OECD”: Australia, Austria, Belgium, Czech Republic, Mexico, the Netherlands, Spain and Portugal.2. Denmark, Finland, Norway and Sweden.Source: OECD estimates, based on national sources; STAN and National Accounts databases, August 2002.
MEASURING THE INFORMATION ECONOMY 2002 25
The contribution of the ICT sector to employment growth
Share of ICT employment in business sector employment, 2000
Percentages
0
5
10
15
Finlan
d (1
)
Sweden
Canad
a
Japa
n (2
,3)
United
King
dom
Nethe
rland
s
Belgium
(4)
Franc
e
Norway
Denm
ark
Austri
a
OECD 20
United
Sta
tes
EU 11
(5)
Korea
(3,4
)Ita
ly
Austra
lia (6
)
Czech
Rep
ublic
(1,3
,4)
Spain
Mex
ico (1
)
Germ
any (
3,4,
7)
Portu
gal (
4)
2000 1995
%
Share of ICT manufacturing in manufacturingemployment, 2000
Percentages
Share of ICT services in market services employment,20008
Percentages
-0.1
0.5
-0.1
n.a.
-0.1
0.1
0.8
0.6
-0.3
-0.6
0.5
0.2
1.0
1.0
0.6
0.6
1.3
3.0
0.3
2.2
051015
Italy
Denmark
Portugal (4)
Australia (6)
Spain
Belgium (4)
Czech Republic (1,3,4)
Norway
Germany (3,4,7)
Netherlands
France
Austria
United Kingdom
Canada
United States
Sweden
Mexico (1)
Finland (1)
Japan (2,3)
Korea (3,4)
Other ICT manufacturingComputer and office equipment
Change in the share 1995-2000
(%)
%
1.0
0.0
0.1
0.3
0.6
-0.2
1.5
0.3
n.a.
-1.5
0.5
0.7
0.7
1.2
2.7
2.1
1.4
1.4
1.1
2.8
0 5 10 15
Mexico (1)
Korea (3,4)
Germany (3,4,7)
Czech Republic (1,3,4)
Portugal (4)
Spain
United States
Japan (2,3)
Australia (6)
Austria
Italy
France
Denmark
Norway
United Kingdom
Netherlands
Belgium (4)
Sweden
Canada
Finland (1)
Telecommunication services
Computer and related services
Other ICT services
%
Change in share 1995-
2000 (%)
1. Based on employee figures only.2. ICT services include market research and public opinion polling.3. ICT wholesale (5150) is not available.4. Rental of ICT goods (7123) is not available.5. Greece, Iceland, Ireland, Luxembourg missing.6. 2000-2001.7. Telecommunication services (642) are not available.8. "Other ICT manufacturing" includes communication equipment, insulated wire and cable and precision instruments. "Other ICTservice" includes wholesale and rental of ICT goods.Source: OECD estimates, based on national sources; STAN and National Accounts databases, August 2002.

26 MEASURING THE INFORMATION ECONOMY 2002
© OECD 200226
R&D in selected ICT industries
The ICT sector invests heavily in R&D and ishighly innovative. In 2000, ICT manufacturingindustries accounted for more than a quarter oftotal manufacturing business R&D expenditure inmost OECD countries, and more than half inFinland, Korea and Ireland.
Data for 19 OECD countries show that, in 2000,business R&D expenditure in the ICTmanufacturing sector was approximatelyUSD 111 billion (current PPP dollars), while forthe ICT services industries, data for 14 OECDcountries show expenditure of at leastUSD 21 billion. The US ICT sector performs some50% of OECD-wide R&D spending by the ICTmanufacturing sector, followed by Japan withabout 21%.
In the 1990s, in countries with data for bothmanufacturing and services industries, ICT-relatedexpenditure on R&D generally expanded much
more rapidly in the services industries. Averageannual growth rates for ICT-related manufacturingR&D expenditure were about 6% but for ICT-related services they were about 14%.
For ICT industries, the ratio of R&D expenditureto GDP or to total business enterprise R&D canindicate the R&D specialisation of ICT industries.Finland, Korea and Sweden are relatively morespecialised than large countries in both ICTmanufacturing and services. Only Finlandallocated more than 1% of GDP to ICT-relatedmanufacturing R&D in 2000.
ICT-related R&D intensities of the large Europeaneconomies are well below those of the UnitedStates and Japan. The share of ICT-relatedmanufacturing R&D expenditure in GDP inGermany and France is about 0.3%, compared to0.6% and 0.7% in the United States and Japan,respectively.
Box 2.3 - Measuring R&D expenditure in selected ICT industries
The OECD definition of the ICT sector is largely based on the four-digit level of ISIC Rev. 3; however, data on R&D expenditure at thefour-digit level are scarce. Therefore, the ICT R&D indicators reported here are calculated at the two-digit level for selected ICTindustries and include the following ISIC Rev. 3 divisions:
• Manufacturing industries: 30 (Office, accounting and computing machinery); 32 (Manufacture of radio, television andcommunication equipment apparatus); and 33 (Manufacture of medical, precision and optical instruments, watches and clocks).
• Services industries: 64 (Post and communications); and 72 (Computer and related activities). Two major weaknesses exist withdata on R&D in services. In certain countries, the R&D surveys only give partial coverage of the service industries. Additionally, thedefinition of R&D is better suited to manufacturing industries than to services industries.
Data for R&D expenditure for selected ICT industries are from OECD’s Analytical Business Enterprise R&D expenditure (ANBERD)database, which is closer to product field than to enterprise level. ANBERD data are estimated by the OECD on the basis of officialbusiness enterprise R&D data (OFFBERD) and may differ significantly from official data.
For further information, see Research and Development Expenditure in Industry, OECD, Paris, 2002.
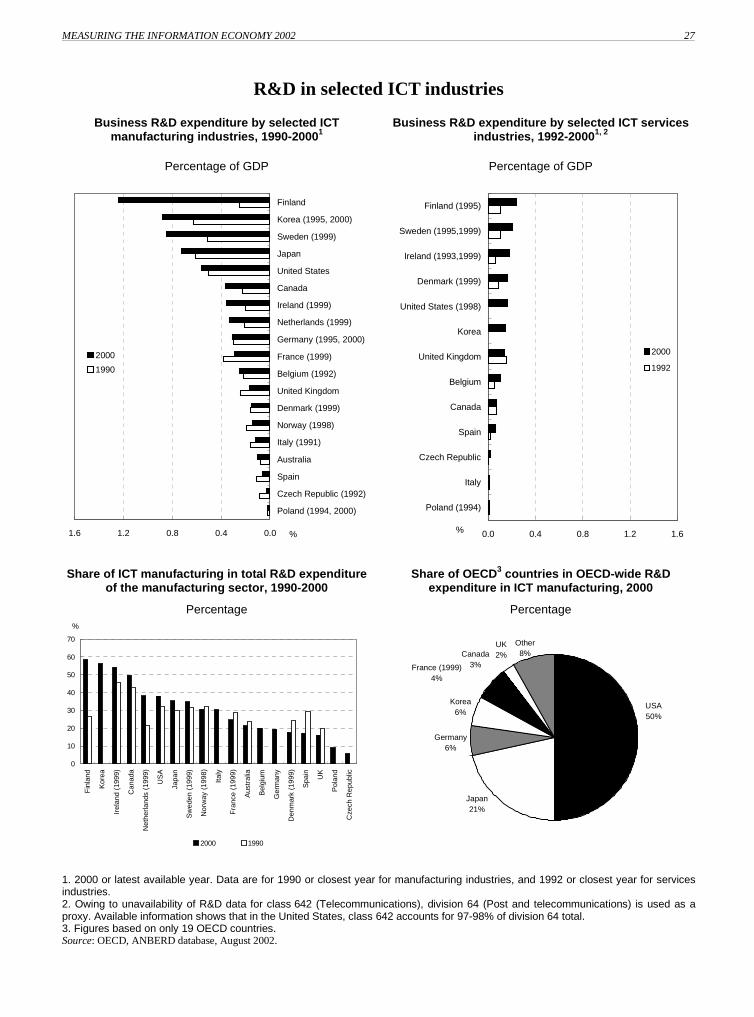
MEASURING THE INFORMATION ECONOMY 2002 27
© OECD 2002 27
R&D in selected ICT industries
Business R&D expenditure by selected ICTmanufacturing industries, 1990-20001
Percentage of GDP
Business R&D expenditure by selected ICT servicesindustries, 1992-20001, 2
Percentage of GDP
0.00.40.81.21.6
Poland (1994, 2000)
Czech Republic (1992)
Spain
Australia
Italy (1991)
Norway (1998)
Denmark (1999)
United Kingdom
Belgium (1992)
France (1999)
Germany (1995, 2000)
Netherlands (1999)
Ireland (1999)
Canada
United States
Japan
Sweden (1999)
Korea (1995, 2000)
Finland
%
2000
1990
0.0 0.4 0.8 1.2 1.6
Poland (1994)
Italy
Czech Republic
Spain
Canada
Belgium
United Kingdom
Korea
United States (1998)
Denmark (1999)
Ireland (1993,1999)
Sweden (1995,1999)
Finland (1995)
%
2000
1992
Share of ICT manufacturing in total R&D expenditureof the manufacturing sector, 1990-2000
Percentage
Share of OECD3 countries in OECD-wide R&Dexpenditure in ICT manufacturing, 2000
Percentage%
0
10
20
30
40
50
60
70
Fin
land
Kor
ea
Irel
and
(199
9)
Can
ada
Net
herla
nds
(199
9)
US
A
Japa
n
Sw
eden
(19
99)
Nor
way
(19
98)
Italy
Fra
nce
(199
9)
Aus
tral
ia
Bel
gium
Ger
man
y
Den
mar
k (1
999)
Spa
in
UK
Pol
and
Cze
ch R
epub
lic
2000 1990
Germany6%
Korea6%
France (1999)4%
Canada3%
Japan21%
USA50%
UK2%
Other8%
1. 2000 or latest available year. Data are for 1990 or closest year for manufacturing industries, and 1992 or closest year for servicesindustries.2. Owing to unavailability of R&D data for class 642 (Telecommunications), division 64 (Post and telecommunications) is used as aproxy. Available information shows that in the United States, class 642 accounts for 97-98% of division 64 total.3. Figures based on only 19 OECD countries.Source: OECD, ANBERD database, August 2002.
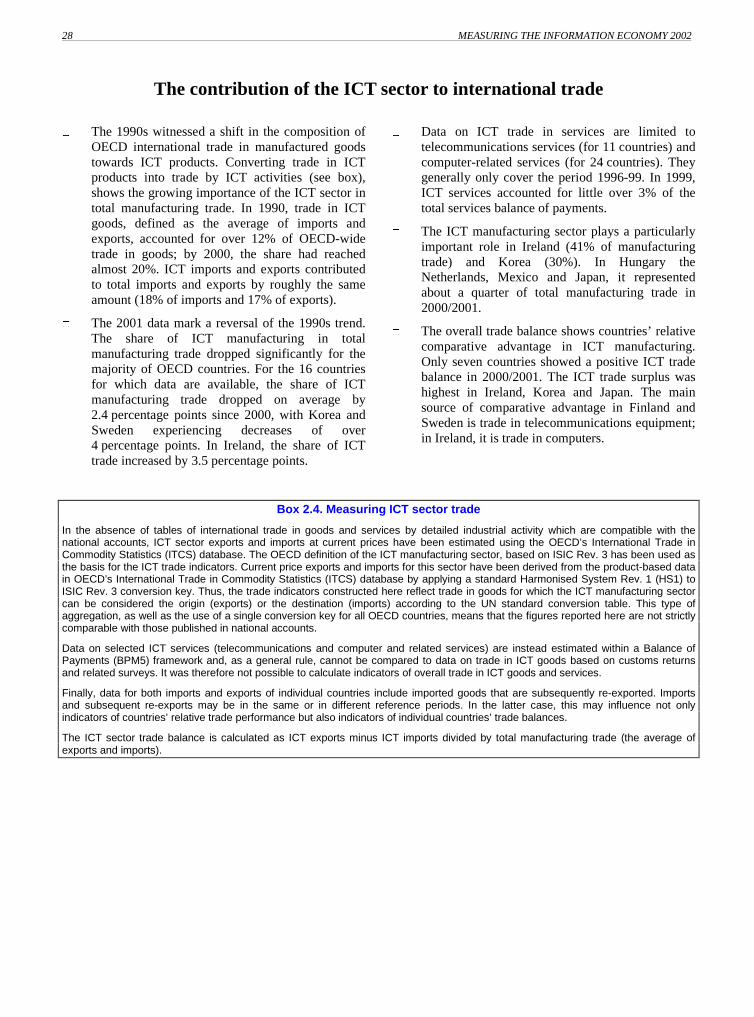
28 MEASURING THE INFORMATION ECONOMY 2002
© OECD 200228
The contribution of the ICT sector to international trade
The 1990s witnessed a shift in the composition ofOECD international trade in manufactured goodstowards ICT products. Converting trade in ICTproducts into trade by ICT activities (see box),shows the growing importance of the ICT sector intotal manufacturing trade. In 1990, trade in ICTgoods, defined as the average of imports andexports, accounted for over 12% of OECD-widetrade in goods; by 2000, the share had reachedalmost 20%. ICT imports and exports contributedto total imports and exports by roughly the sameamount (18% of imports and 17% of exports).
The 2001 data mark a reversal of the 1990s trend.The share of ICT manufacturing in totalmanufacturing trade dropped significantly for themajority of OECD countries. For the 16 countriesfor which data are available, the share of ICTmanufacturing trade dropped on average by2.4 percentage points since 2000, with Korea andSweden experiencing decreases of over4 percentage points. In Ireland, the share of ICTtrade increased by 3.5 percentage points.
Data on ICT trade in services are limited totelecommunications services (for 11 countries) andcomputer-related services (for 24 countries). Theygenerally only cover the period 1996-99. In 1999,ICT services accounted for little over 3% of thetotal services balance of payments.
The ICT manufacturing sector plays a particularlyimportant role in Ireland (41% of manufacturingtrade) and Korea (30%). In Hungary theNetherlands, Mexico and Japan, it representedabout a quarter of total manufacturing trade in2000/2001.
The overall trade balance shows countries’ relativecomparative advantage in ICT manufacturing.Only seven countries showed a positive ICT tradebalance in 2000/2001. The ICT trade surplus washighest in Ireland, Korea and Japan. The mainsource of comparative advantage in Finland andSweden is trade in telecommunications equipment;in Ireland, it is trade in computers.
Box 2.4. Measuring ICT sector trade
In the absence of tables of international trade in goods and services by detailed industrial activity which are compatible with thenational accounts, ICT sector exports and imports at current prices have been estimated using the OECD’s International Trade inCommodity Statistics (ITCS) database. The OECD definition of the ICT manufacturing sector, based on ISIC Rev. 3 has been used asthe basis for the ICT trade indicators. Current price exports and imports for this sector have been derived from the product-based datain OECD’s International Trade in Commodity Statistics (ITCS) database by applying a standard Harmonised System Rev. 1 (HS1) toISIC Rev. 3 conversion key. Thus, the trade indicators constructed here reflect trade in goods for which the ICT manufacturing sectorcan be considered the origin (exports) or the destination (imports) according to the UN standard conversion table. This type ofaggregation, as well as the use of a single conversion key for all OECD countries, means that the figures reported here are not strictlycomparable with those published in national accounts.
Data on selected ICT services (telecommunications and computer and related services) are instead estimated within a Balance ofPayments (BPM5) framework and, as a general rule, cannot be compared to data on trade in ICT goods based on customs returnsand related surveys. It was therefore not possible to calculate indicators of overall trade in ICT goods and services.
Finally, data for both imports and exports of individual countries include imported goods that are subsequently re-exported. Importsand subsequent re-exports may be in the same or in different reference periods. In the latter case, this may influence not onlyindicators of countries’ relative trade performance but also indicators of individual countries’ trade balances.
The ICT sector trade balance is calculated as ICT exports minus ICT imports divided by total manufacturing trade (the average ofexports and imports).

MEASURING THE INFORMATION ECONOMY 2002 29
© OECD 2002 29
The contribution of the ICT sector to international trade
ICT trade by area, 1990-20011,2
Share of total manufacturing trade
OECD 162 and ICT-related trade, 1990-2001
Index: 1995=100
10
15
20
25
30
1990 1991 1992 1993 1994 1995 1996 1997 1998 1999 2000 2001
Japan United StatesEU 12 OECD22OECD16
%
100
120
140
160
1995 1996 1997 1998 1999 2000 2001
Total merchandise
ICT manufacturingOECD 16
OECD 16
OECD 28
OECD 28
ICT manufacturing trade,1 2001 or latest year available
Share of total goods trade
ICT sector trade balance, 2001 or latest year available
0 10 20 30 40 50
Ireland
Korea
Hungary (3)
Netherlands (3)
Mex ic o (3)
Japan
Finland
United Kingdom
United States
OECD 28 (3)
EU 12 (3)
Sw eden
Germany (3)
A us tralia
Denmark (3)
Franc e
Cz ec h Republic (3)
Canada
Turkey (3)
A ustr ia (3)
Norw ay
Portugal (3)
Poland
Spain (3)
Greec e (3)
New Zealand (3)
Sw itz erland
Italy
Belgium
Slov ak Republic (3)
Ic eland
%- 1 0 - 5 0 5 1 0 1 5
Ir e la n d
K o r e a
Ja p a n
F in la n d
M e x ic o ( 3 )
H u n g a r y ( 3 )
S w e d e n
Un ite d K in g d o m
B e lg iu m
N e th e r la n d s ( 3 )
Fr a n c e
G e r ma n y ( 3 )
A u s tr ia ( 3 )
Ita ly
D e n m a r k ( 3 )
Un ite d S ta te s
S w itz e r la n d
S lo v a k Re p u b lic ( 3 )
Po r tu g a l ( 3 )
Cz e c h R e p u b lic ( 3 )
C a n a d a
S p a in ( 3 )
No r w a y
Po la n d
Ic e la n d
G r e e c e ( 3 )
Tu r ke y ( 3 )
Ne w Z e a la n d ( 3 )
A u s tr a lia
%
1. Average of imports and exports.2. EU 12 includes all European Union member states except Austria, Belgium and Luxembourg. OECD 28 includes all OECD membercountries except for the Slovak Republic and Luxembourg. OECD 22 includes member countries with complete data from 1990 to2000 and includes EU 12, Australia, Canada, Iceland, Japan, Mexico, New Zealand, Norway, Switzerland, Turkey and the UnitedStates. OECD 16 includes member countries with data from 1994 to 2001 and covers Australia, Belgium, Canada, Finland, France,Iceland, Ireland, Italy, Japan, Korea, Norway, Poland, Sweden, Switzerland, United Kingdom and the United States.3. 2000 data.Source: OECD, ITCS and STAN databases, August 2002.

30 MEASURING THE INFORMATION ECONOMY 2002
© OECD 200230
ICT sector exports: share in total exports and composition
Relative to other sectors, the ICT sector is highlyglobalised. In 2001, Ireland reported the highestshare of ICT sector exports in total merchandiseexports (40%). In contrast, Iceland was the countrywith the smallest share of ICTs in totalmerchandise exports (0.2%).
Generally, OECD countries with large ICT sectorexports’ share at the end of the decade also hadlarge exports at the beginning. However, Mexico,Finland and the Netherlands rapidly increased theirICT sector exports during the 1990s. Japan andItaly were the only countries where the share ofICT sector exports was lower in 2001 than in 1990.
In the OECD area, the composition of ICT sectorexports changed somewhat over the past decade.
The share of office and computing machinery fellfrom 39% in 1990 to 31% in 2000, while the shareof radio, TV and communication equipmentincreased from about 44% in 1990 to just under56% in 2000.
The composition of ICT sector exports also differsconsiderably. In Hungary and Ireland, computerequipment (contained within the office andcomputing machinery class) represents the bulk ofICT sector exports. In contrast, Finland andSweden’s ICT sector exports are almostcompletely composed of communicationequipment.
Composition of ICT sector exports, 1990-2000
Share of total OECD merchandise exports
0
10
20
30
40
50
60
1990 1991 1992 1993 1994 1995 1996 1997 1998 1999 2000
ISIC 30 - Office & computing machinery ISIC 313 - Insulated wire and cable
ISIC 32 - Radio, TV & communication equipment ISIC 3312+3313 - ICT scientific instruments
%
Source: OECD, ITCS and STAN databases, August 2002.
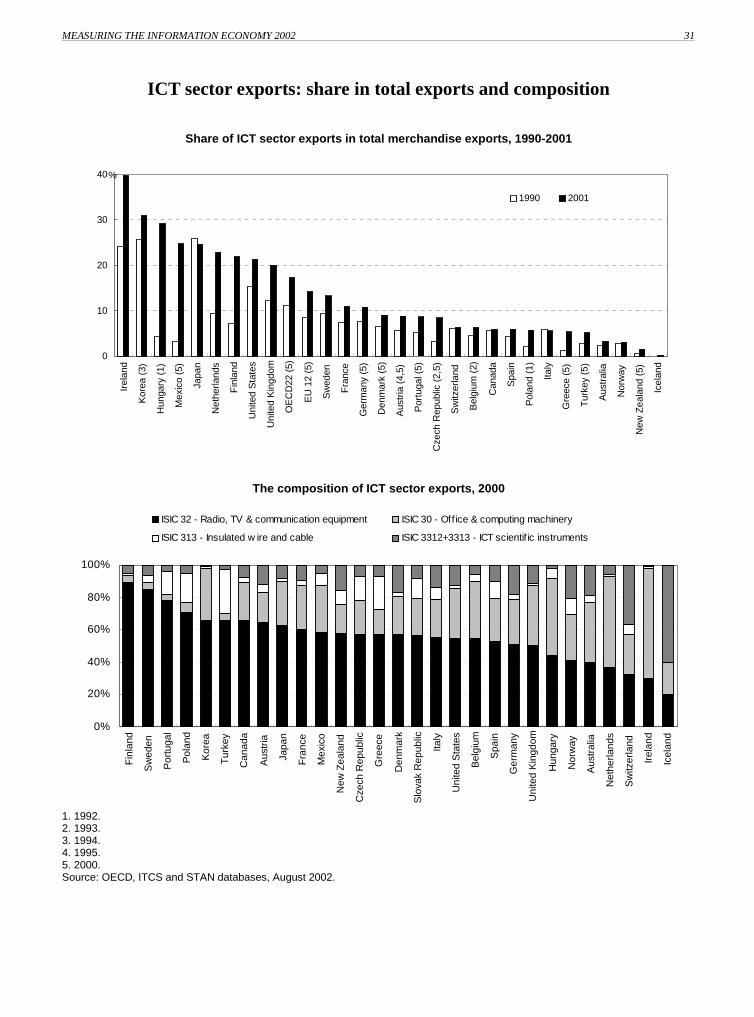
MEASURING THE INFORMATION ECONOMY 2002 31
© OECD 2002 31
ICT sector exports: share in total exports and composition
Share of ICT sector exports in total merchandise exports, 1990-2001
0
10
20
30
40
Irel
and
Kor
ea (
3)
Hun
gary
(1)
Mex
ico
(5)
Japa
n
Net
herla
nds
Fin
land
Uni
ted
Sta
tes
Uni
ted
Kin
gdom
OE
CD
22 (
5)
EU
12
(5)
Sw
eden
Fra
nce
Ger
man
y (5
)
Den
mar
k (5
)
Aus
tria
(4,
5)
Por
tuga
l (5)
Cze
ch R
epub
lic (
2,5)
Sw
itzer
land
Bel
gium
(2)
Can
ada
Spa
in
Pol
and
(1)
Italy
Gre
ece
(5)
Tur
key
(5)
Aus
tral
ia
Nor
way
New
Zea
land
(5)
Icel
and
1990 2001
%
The composition of ICT sector exports, 2000
0%
20%
40%
60%
80%
100%
Fin
land
Sw
eden
Por
tuga
l
Pol
and
Kor
ea
Tur
key
Can
ada
Aus
tria
Japa
n
Fra
nce
Mex
ico
New
Zea
land
Cze
ch R
epub
lic
Gre
ece
Den
mar
k
Slo
vak
Rep
ublic
Italy
Uni
ted
Sta
tes
Bel
gium
Spa
in
Ger
man
y
Uni
ted
Kin
gdom
Hun
gary
Nor
way
Aus
tral
ia
Net
herla
nds
Sw
itzer
land
Irel
and
Icel
and
ISIC 32 - Radio, TV & communication equipment ISIC 30 - Off ice & computing machinery
ISIC 313 - Insulated w ire and cable ISIC 3312+3313 - ICT scientif ic instruments
1. 1992.2. 1993.3. 1994.4. 1995.5. 2000.Source: OECD, ITCS and STAN databases, August 2002.
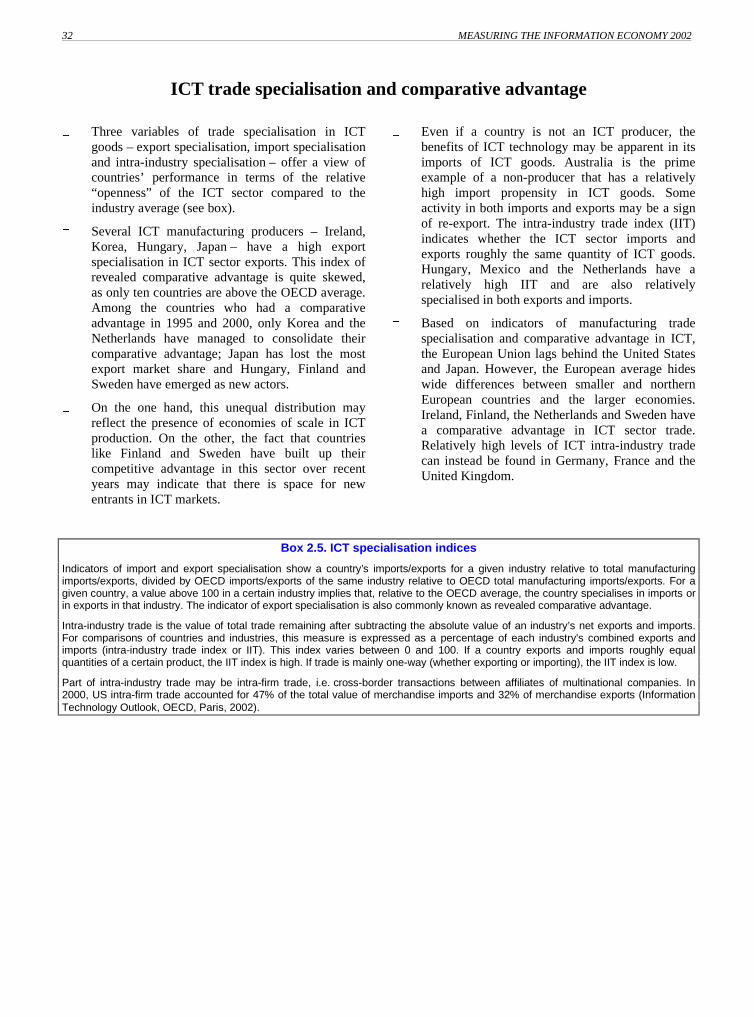
32 MEASURING THE INFORMATION ECONOMY 2002
© OECD 200232
ICT trade specialisation and comparative advantage
Three variables of trade specialisation in ICTgoods – export specialisation, import specialisationand intra-industry specialisation – offer a view ofcountries’ performance in terms of the relative“openness” of the ICT sector compared to theindustry average (see box).
Several ICT manufacturing producers – Ireland,Korea, Hungary, Japan – have a high exportspecialisation in ICT sector exports. This index ofrevealed comparative advantage is quite skewed,as only ten countries are above the OECD average.Among the countries who had a comparativeadvantage in 1995 and 2000, only Korea and theNetherlands have managed to consolidate theircomparative advantage; Japan has lost the mostexport market share and Hungary, Finland andSweden have emerged as new actors.
On the one hand, this unequal distribution mayreflect the presence of economies of scale in ICTproduction. On the other, the fact that countrieslike Finland and Sweden have built up theircompetitive advantage in this sector over recentyears may indicate that there is space for newentrants in ICT markets.
Even if a country is not an ICT producer, thebenefits of ICT technology may be apparent in itsimports of ICT goods. Australia is the primeexample of a non-producer that has a relativelyhigh import propensity in ICT goods. Someactivity in both imports and exports may be a signof re-export. The intra-industry trade index (IIT)indicates whether the ICT sector imports andexports roughly the same quantity of ICT goods.Hungary, Mexico and the Netherlands have arelatively high IIT and are also relativelyspecialised in both exports and imports.
Based on indicators of manufacturing tradespecialisation and comparative advantage in ICT,the European Union lags behind the United Statesand Japan. However, the European average hideswide differences between smaller and northernEuropean countries and the larger economies.Ireland, Finland, the Netherlands and Sweden havea comparative advantage in ICT sector trade.Relatively high levels of ICT intra-industry tradecan instead be found in Germany, France and theUnited Kingdom.
Box 2.5. ICT specialisation indices
Indicators of import and export specialisation show a country’s imports/exports for a given industry relative to total manufacturingimports/exports, divided by OECD imports/exports of the same industry relative to OECD total manufacturing imports/exports. For agiven country, a value above 100 in a certain industry implies that, relative to the OECD average, the country specialises in imports orin exports in that industry. The indicator of export specialisation is also commonly known as revealed comparative advantage.
Intra-industry trade is the value of total trade remaining after subtracting the absolute value of an industry’s net exports and imports.For comparisons of countries and industries, this measure is expressed as a percentage of each industry's combined exports andimports (intra-industry trade index or IIT). This index varies between 0 and 100. If a country exports and imports roughly equalquantities of a certain product, the IIT index is high. If trade is mainly one-way (whether exporting or importing), the IIT index is low.
Part of intra-industry trade may be intra-firm trade, i.e. cross-border transactions between affiliates of multinational companies. In2000, US intra-firm trade accounted for 47% of the total value of merchandise imports and 32% of merchandise exports (InformationTechnology Outlook, OECD, Paris, 2002).
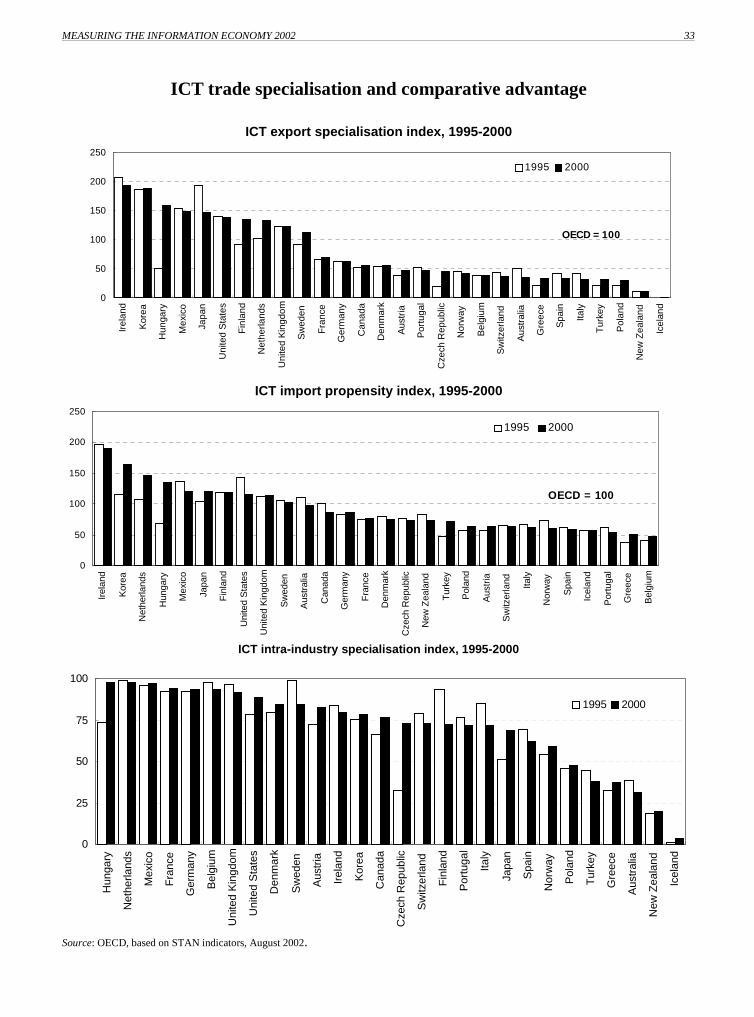
MEASURING THE INFORMATION ECONOMY 2002 33
© OECD 2002 33
ICT trade specialisation and comparative advantage
ICT export specialisation index, 1995-2000
OECD = 100
0
50
100
150
200
250
Irel
and
Kor
ea
Hun
gary
Mex
ico
Japa
n
Uni
ted
Sta
tes
Fin
land
Net
herla
nds
Uni
ted
Kin
gdom
Sw
eden
Fra
nce
Ger
man
y
Can
ada
Den
mar
k
Aus
tria
Por
tuga
l
Cze
ch R
epub
lic
Nor
way
Bel
gium
Sw
itzer
land
Aus
tral
ia
Gre
ece
Spa
in
Italy
Tur
key
Pol
and
New
Zea
land
Icel
and
1995 2000
ICT import propensity index, 1995-2000
OECD = 100
0
50
100
150
200
250
Irel
and
Kor
ea
Net
herla
nds
Hun
gary
Mex
ico
Japa
n
Fin
land
Uni
ted
Sta
tes
Uni
ted
Kin
gdom
Sw
eden
Aus
tral
ia
Can
ada
Ger
man
y
Fra
nce
Den
mar
k
Cze
ch R
epub
lic
New
Zea
land
Tur
key
Pol
and
Aus
tria
Sw
itzer
land Ita
ly
Nor
way
Spa
in
Icel
and
Por
tuga
l
Gre
ece
Bel
gium
1995 2000
ICT intra-industry specialisation index, 1995-2000
0
25
50
75
100
Hun
gary
Net
herla
nds
Mex
ico
Fra
nce
Ger
man
y
Bel
gium
Uni
ted
Kin
gdom
Uni
ted
Sta
tes
Den
mar
k
Sw
eden
Aus
tria
Irel
and
Kor
ea
Can
ada
Cze
ch R
epub
lic
Sw
itzer
land
Fin
land
Por
tuga
l
Italy
Japa
n
Spa
in
Nor
way
Pol
and
Tur
key
Gre
ece
Aus
tral
ia
New
Zea
land
Icel
and
1995 2000
Source: OECD, based on STAN indicators, August 2002.

34 MEASURING THE INFORMATION ECONOMY 2002
© OECD 200234
Foreign affiliates in the ICT sector
Since the mid-1980s and the increase inglobalisation, foreign direct investment has beencentral to industrial restructuring. Most firms havefound the establishment of an affiliate to be aparticularly effective way of penetrating markets.As data on foreign direct investment data do notcapture this phenomenon directly, indicators on theactivities of foreign affiliates provide importantcomplementary information.
In the ICT sector, the role of foreign affiliatesvaries considerably, depending on the part of thesector concerned. In computer manufacturing(ISIC 30), almost all production in Ireland andHungary is due to foreign affiliates, while in theUnited States and Germany, only a small share ofproduction is attributable to foreign affiliates.
Foreign affiliates also make a strong contributionto the manufacturing of electronic equipment(ISIC 32). Hungary and Ireland are again thecountries with the largest share (almost 90%), butthe United Kingdom also has a very high share offoreign multinationals. In the Netherlands, Finlandand Sweden, foreign affiliates account for only asmall share of the production of electronicequipment, possibly owing to the strong positionof domestic firms in these markets.
In the telecommunications sector (ISIC 642),foreign affiliates play a minor role in almost all
OECD countries, Hungary and Portugal beingexceptions. This partly reflects the degree ofliberalisation of telecommunications markets – forinstance the limits that were, until recently,imposed by many countries on foreign investment.In 1998, foreign affiliates in Ireland and Italyaccounted for 0% of production in this sector.
In the other major ICT service sector, computerservices (ISIC 72), foreign affiliates play a moresubstantial role. The share of foreign affiliates isrelatively high in Belgium, Norway and the UnitedKingdom, but very low in Turkey and the UnitedStates.
For manufacturing segments of the ICT sector,there is a close link between the shares of foreignaffiliates in employment and in production. In mostcases, the share of production is slightly higher, anindication that, on average, the labour productivityof foreign affiliates is somewhat higher than that ofdomestic firms.
Foreign affiliates also account for a considerableshare of R&D in the ICT sector, particularly inIreland. In large OECD countries, such as Franceand the United Kingdom, a considerable share ofR&D in ICT manufacturing is due to foreignaffiliates, a sign that many firms are establishingR&D laboratories outside their home countries.
Box 2.6 - Activity of foreign affiliates
The possession of 10% of a company’s voting shares or voting power is considered to indicate the existence of a direct relationshipand influence over the management of the firm in question.
The ownership of a majority of ordinary shares (more than 50%) or voting power on the board of directors implies control and theability to shape a company’s activities. Variables such as turnover, number of employees or exports are attributed in full to thecontrolling investor.
The term “foreign affiliate” is restricted to majority-owned foreign affiliates. Accordingly, the geographical origin of a foreign affiliate isdefined as the country of the parent company if it holds, directly or indirectly, more than 50% of the affiliate’s voting shares.
However, the majority-holding criterion is not used for the United States and Hungary, as these countries include minority foreign-owned firms in their statistics.

MEASURING THE INFORMATION ECONOMY 2002 35
© OECD 2002 35
Foreign affiliates in the ICT sector
Share of production (turnover) of foreign affiliates incomputer manufacturing (ISIC 30), 1998
Share of production (turnover) of foreign affiliates inelectronic equipment manufacturing (ISIC 32), 1998
0
20
40
60
80
100
Irel
and
Hun
gary
(2)
Uni
ted
Kin
gdom
(1)
Italy
(1)
Net
herla
nds
Fin
land
(2)
Fra
nce
Sw
eden
Ger
man
y
Uni
ted
Sta
tes
(1)
%
0
20
40
60
80
100
Hun
gary
(2)
Irel
and
Uni
ted
Kin
gdom
(1)
Nor
way
Fra
nce
Italy
(1)
Ger
man
y
Tur
key
Cze
ch R
epub
lic (
2)
Uni
ted
Sta
tes
(1)
Net
herla
nds
Fin
land
(2)
Sw
eden
%
Share of production (turnover) of foreign affiliates inthe telecommunications sector (ISIC 642), 1998
Share of production (turnover) of foreign affiliates incomputer-related services (ISIC 72), 1998
0
10
20
30
40
50
60
70
Hun
gary
Por
tuga
l
Uni
ted
Sta
tes
(1)
Sw
eden
(1)
Uni
ted
Kin
gdom
(1)
Net
herla
nds
(1)
Fin
land
Aus
tria
Pol
and
Fra
nce
Cze
ch R
epub
lic
Irel
and
(1)
Italy
(1)
0 0
%
0
10
20
30
40
Bel
gium
(1)
Uni
ted
Kin
gdom
(1)
Nor
way
(1)
Fin
land
Cze
ch R
epub
lic
Net
herla
nds
(1)
Hun
gary
Pol
and
Sw
eden
(1)
Irel
and
(1)
Fra
nce
Por
tuga
l
Italy
(1)
Aus
tria
Uni
ted
Sta
tes
(1)
Tur
key
(3)
%
1. 1997.2. 1999.3. 1994.Source: OECD, Activities of Foreign Affiliates (AFA) and Foreign Affiliates Trading Services (FATS) databases.

36 MEASURING THE INFORMATION ECONOMY 2002
© OECD 200236
Foreign affiliates in the ICT sector
Relationship between share of production andemployees of foreign affiliates in computer
manufacturing (ISIC 30), 1998
Relationship between share of production andemployees of foreign affiliates in radio, TV and
communications equipment (ISIC 32), 1998
France
Ireland
Hungary2
Germany
Sw eden
Finland2
United Kingdom1
Netherlands
0
10
20
30
40
50
60
70
80
90
100
0 20 40 60 80 100
Share of foreign affiliate production
Sha
re o
f em
ploy
ees
in fo
reig
n af
filia
tes
United Kingdom1
Turkey
Norw ay
Ireland
Czech Republic2
NetherlandsSw eden
France
Germany
Hungary2
Finland2
0
10
20
30
40
50
60
70
80
90
100
0 20 40 60 80 100
Share of foreign affiliate production
Sha
re o
f em
ploy
ees
in fo
reig
n af
filia
tes
Share of R&D by foreign affiliates in office,accounting and computing machinery (ISIC 30), 1998
Share of R&D by foreign affiliates in radio, TV andcommunications equipment (ISIC 32), 1998
0
20
40
60
80
100
Irel
and
(1)
Can
ada
Uni
ted
Kin
gdom
Fra
nce
Sw
eden
Net
herla
nds
Sha
re in
nat
iona
l tot
al
0
20
40
60
80
100
Irel
and
(1)
Uni
ted
Kin
gdom
(2)
Pol
and
(2)
Fra
nce
Cze
ch R
epub
lic (
2)
Tur
key
Can
ada
Uni
ted
Sta
tes
(1)
Net
herla
nds
Sw
eden
Sha
re in
nat
iona
l tot
a l
1. 1997 data.2. 1999 data.Source: OECD, Activities of Foreign Affiliates (AFA) and Foreign Affiliates Trading Services (FATS) databases.

MEASURING THE INFORMATION ECONOMY 2002 37
© OECD 2002 37
Chapter III. Access to and use of information technologies
The contribution of the information economy to economic growth and performance also depends on the way new informationtechnologies are used by individuals and businesses. Greater use of ICT in the production process may, for example, help raise theoverall efficiency of the use of capital and labour, e.g. by reducing inventories and transaction costs. For technologies based onnetworks, such as the Internet, the more people who are connected, the greater the potential benefits of the network owing to spillovereffects. Statistics on the diffusion of new information technologies are therefore important for helping to evaluate the extent to whichtheir use has an impact on overall economic performance. Also, the growing interest of policy makers in issues such as universalaccess, the digital divide, consumer trust and privacy protection has raised demand for indicators on access to and use of ICT.
Access is a prerequisite to the use of the technology. The first indicators in this chapter compare developments in telecommunicationnetworks. Others focus more specifically on the size and growth of Internet infrastructure. The 1990s have witnessed extremelydynamic expansion in telecommunication networks, although differences among OECD countries remain and depend partly on therelative pricing structure and the level of competition for a particular access technology.
For international comparisons of ICT usage statistics, important issues are still to be addressed (see Boxes 3.4 and 3.5), but nationalstatistical offices have made tremendous progress in providing high-quality and timely indicators of ICT use. This chapter presents thelatest international comparisons based on official surveys of ICT diffusion in households, among individuals and in businesses thatwere recently developed by national statistical offices under the aegis of the OECD (see Box 3.4 and Annex 2).
To help to explain differences in the intensity of use of new technologies across countries, this chapter also relies on indicators ofbarriers to the use of information technology. Answers on perceived barriers and on their evaluation are inevitably qualitative in natureand need to be used with caution in international comparisons (see Box 3.6). Nevertheless, they can be of great interest to policymakers. For example, indicators of barriers can help for monitoring issues of digital divide, point to potential bottlenecks related to thetechnology or lack of appropriate skills and help address concerns about security and logistics.
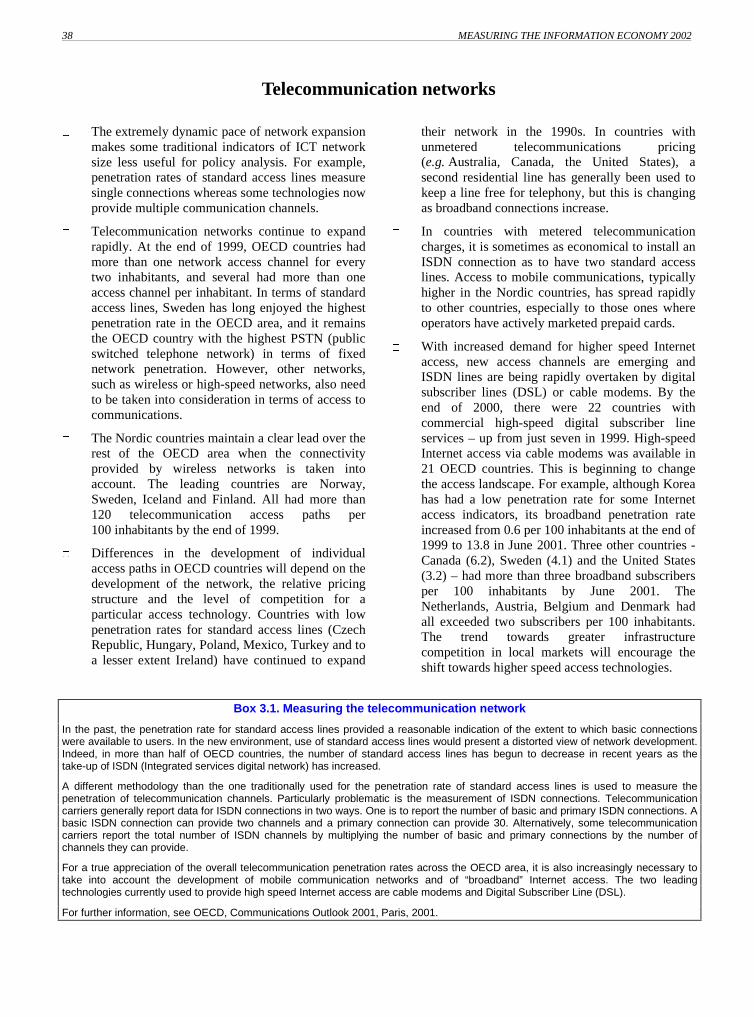
38 MEASURING THE INFORMATION ECONOMY 2002
© OECD 200238
Telecommunication networks
The extremely dynamic pace of network expansionmakes some traditional indicators of ICT networksize less useful for policy analysis. For example,penetration rates of standard access lines measuresingle connections whereas some technologies nowprovide multiple communication channels.
Telecommunication networks continue to expandrapidly. At the end of 1999, OECD countries hadmore than one network access channel for everytwo inhabitants, and several had more than oneaccess channel per inhabitant. In terms of standardaccess lines, Sweden has long enjoyed the highestpenetration rate in the OECD area, and it remainsthe OECD country with the highest PSTN (publicswitched telephone network) in terms of fixednetwork penetration. However, other networks,such as wireless or high-speed networks, also needto be taken into consideration in terms of access tocommunications.
The Nordic countries maintain a clear lead over therest of the OECD area when the connectivityprovided by wireless networks is taken intoaccount. The leading countries are Norway,Sweden, Iceland and Finland. All had more than120 telecommunication access paths per100 inhabitants by the end of 1999.
Differences in the development of individualaccess paths in OECD countries will depend on thedevelopment of the network, the relative pricingstructure and the level of competition for aparticular access technology. Countries with lowpenetration rates for standard access lines (CzechRepublic, Hungary, Poland, Mexico, Turkey and toa lesser extent Ireland) have continued to expand
their network in the 1990s. In countries withunmetered telecommunications pricing(e.g. Australia, Canada, the United States), asecond residential line has generally been used tokeep a line free for telephony, but this is changingas broadband connections increase.
In countries with metered telecommunicationcharges, it is sometimes as economical to install anISDN connection as to have two standard accesslines. Access to mobile communications, typicallyhigher in the Nordic countries, has spread rapidlyto other countries, especially to those ones whereoperators have actively marketed prepaid cards.
With increased demand for higher speed Internetaccess, new access channels are emerging andISDN lines are being rapidly overtaken by digitalsubscriber lines (DSL) or cable modems. By theend of 2000, there were 22 countries withcommercial high-speed digital subscriber lineservices – up from just seven in 1999. High-speedInternet access via cable modems was available in21 OECD countries. This is beginning to changethe access landscape. For example, although Koreahas had a low penetration rate for some Internetaccess indicators, its broadband penetration rateincreased from 0.6 per 100 inhabitants at the end of1999 to 13.8 in June 2001. Three other countries -Canada (6.2), Sweden (4.1) and the United States(3.2) – had more than three broadband subscribersper 100 inhabitants by June 2001. TheNetherlands, Austria, Belgium and Denmark hadall exceeded two subscribers per 100 inhabitants.The trend towards greater infrastructurecompetition in local markets will encourage theshift towards higher speed access technologies.
Box 3.1. Measuring the telecommunication network
In the past, the penetration rate for standard access lines provided a reasonable indication of the extent to which basic connectionswere available to users. In the new environment, use of standard access lines would present a distorted view of network development.Indeed, in more than half of OECD countries, the number of standard access lines has begun to decrease in recent years as thetake-up of ISDN (Integrated services digital network) has increased.
A different methodology than the one traditionally used for the penetration rate of standard access lines is used to measure thepenetration of telecommunication channels. Particularly problematic is the measurement of ISDN connections. Telecommunicationcarriers generally report data for ISDN connections in two ways. One is to report the number of basic and primary ISDN connections. Abasic ISDN connection can provide two channels and a primary connection can provide 30. Alternatively, some telecommunicationcarriers report the total number of ISDN channels by multiplying the number of basic and primary connections by the number ofchannels they can provide.
For a true appreciation of the overall telecommunication penetration rates across the OECD area, it is also increasingly necessary totake into account the development of mobile communication networks and of “broadband” Internet access. The two leadingtechnologies currently used to provide high speed Internet access are cable modems and Digital Subscriber Line (DSL).
For further information, see OECD, Communications Outlook 2001, Paris, 2001.
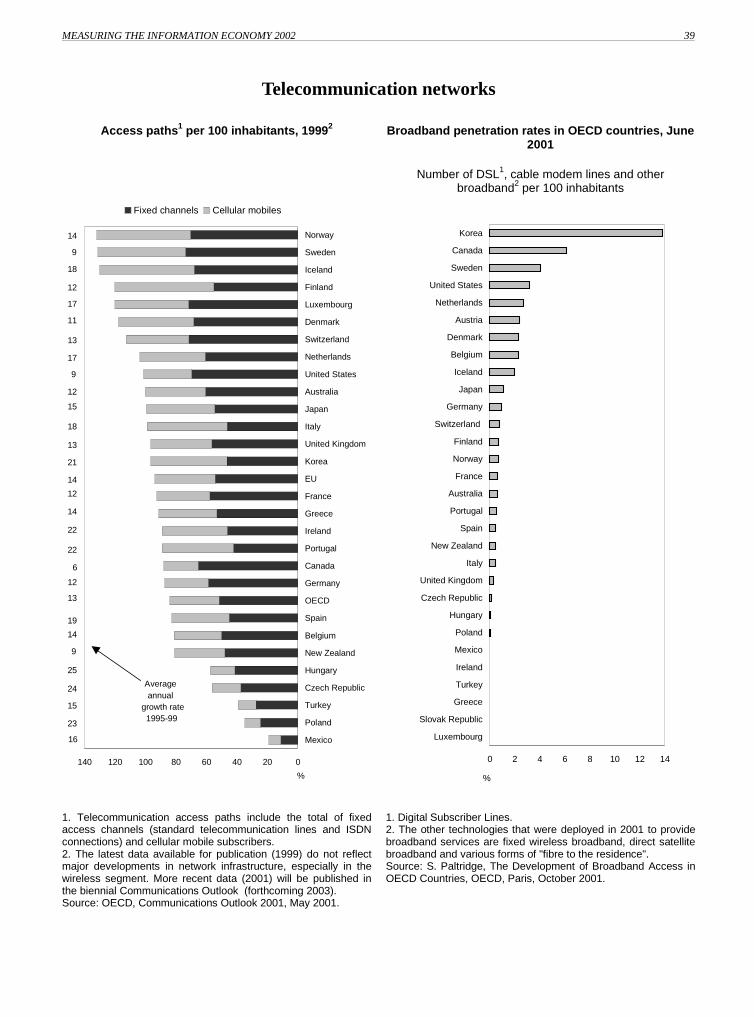
MEASURING THE INFORMATION ECONOMY 2002 39
© OECD 2002 39
Telecommunication networks
Access paths1 per 100 inhabitants, 19992 Broadband penetration rates in OECD countries, June2001
Number of DSL1, cable modem lines and otherbroadband2 per 100 inhabitants
16
23
15
24
25
9
14
19
13
12
6
22
22
14
12
14
21
13
18
15
12
9
17
13
11
17
12
18
9
14
020406080100120140
Mexico
Poland
Turkey
Czech Republic
Hungary
New Zealand
Belgium
Spain
OECD
Germany
Canada
Portugal
Ireland
Greece
France
EU
Korea
United Kingdom
Italy
Japan
Australia
United States
Netherlands
Switzerland
Denmark
Luxembourg
Finland
Iceland
Sweden
Norway
Fixed channels Cellular mobiles
Average annual
growth rate 1995-99
%
0 2 4 6 8 10 12 14
Luxembourg
Slovak Republic
Greece
Turkey
Ireland
Mexico
Poland
Hungary
Czech Republic
United Kingdom
Italy
New Zealand
Spain
Portugal
Australia
France
Norway
Finland
Switzerland
Germany
Japan
Iceland
Belgium
Denmark
Austria
Netherlands
United States
Sweden
Canada
Korea
%
1. Telecommunication access paths include the total of fixedaccess channels (standard telecommunication lines and ISDNconnections) and cellular mobile subscribers.2. The latest data available for publication (1999) do not reflectmajor developments in network infrastructure, especially in thewireless segment. More recent data (2001) will be published inthe biennial Communications Outlook (forthcoming 2003).
1. Digital Subscriber Lines.2. The other technologies that were deployed in 2001 to providebroadband services are fixed wireless broadband, direct satellitebroadband and various forms of "fibre to the residence".Source: S. Paltridge, The Development of Broadband Access inOECD Countries, OECD, Paris, October 2001.
Source: OECD, Communications Outlook 2001, May 2001.

40 MEASURING THE INFORMATION ECONOMY 2002
© OECD 200240
Internet infrastructure
The Internet continues to grow at an extremely fastpace. By July 2001, the number of Internet hosts inthe OECD area reached 112 million, up from82 million in July 2000.
The number of hosts per 1 000 population gives anindication of the relative development of Internetinfrastructure in various countries. In July 2001,the OECD average was 101 hosts per1 000 inhabitants; the EU average was 53 hosts per1 000 inhabitants. The United States is far ahead ofthe other OECD countries, with more than272 hosts per 1 000 inhabitants in July 2001. Othercountries with over 150 hosts per 1 000 inhabitantsare Finland (183), Canada (183), Iceland (180) andSweden (177). By way of contrast, Mexico andTurkey had 5 and 4 hosts per 1 000 inhabitants,respectively.
While the Nordic countries have among the highestpenetration rates, between July 2000 and July 2001Poland was the only country to double itspenetration rate. Austria, Germany, Japan, Spainand Sweden all experienced a growth rateexceeding 70%. The unweighted average growthrate in 2001 for OECD countries was 60%. Even
among the leading countries, recent growth rateshave been uneven. Thus, large gaps betweencountries remain.
While the number of Internet hosts gives anindication of the size of the Internet, the number ofactive Web sites provides information oncountries’ relative development of Internet content.The United States leads Web site hosting, with12.6 million Web sites in July 2000. Germanyranks second, hosting 1.8 million Web sites in July2000. The United Kingdom (1.4 million) was theonly other country with more than 1 million Websites.
In terms of number of Web sites per capita, therewere 17.5 Web sites per 1 000 inhabitants acrossthe OECD region and 12.7 per 1 000 across theEuropean Union in July 2000. The United Stateshad the highest penetration of Web sites in July2000, with 46.5 per 1 000 inhabitants. Norway(30.4), Canada (24.7), the United Kingdom (24.2),Germany (22) and Denmark (21) were the othercountries with more than 20 Web sites per1 000 inhabitants.
Box 3.2. Measuring the size and growth of the Internet
The number of Internet hosts is one of the most commonly used indicators of Internet growth. It includes any computer systemconnected to the Internet (via full-time or part-time, direct or dial-up connections), although some systems may not be accessibleowing to technologies such as firewalls. Hosts can thus be thought of as an indicator of the minimum size of the public Internet.
Surveys of Internet hosts are undertaken by several entities. Every six months, Network Wizards, on behalf of the Internet Software Consortium (ISC), carries out the longest running host survey. RIPE conducts monthly surveys of Internet hosts for countries in theirregion. A third source of statistics is NetSizer’s Internet Sizer from Telcordia Technologies which provides daily updates of the number of Internet hosts based on a random sample of IP addresses throughout the day. Telcordia provides hosts by country as well as bytop-level and second-level domains. Hosts by country are computed by redistributing the hosts with three-letter domains (e.g. .com,.net, etc.) to individual countries and then adding them to the hosts by two-letter country domains.
Netcraft surveys Web servers in order to provide information about the software used on computers connected to the Internet. Thedata can be used to estimate the number of active Web sites under each domain, as well as the number of Web sites in each countryby distributing gTLD and ccTLD registrations according to the country allocation of IP address blocks.
� A host is a domain name that has an IP (Internet Protocol) address “record” associated with it.
� Internet Protocol (IP) addresses are the numbers used to identify computers, or other devices, on a TCP/IP network.
� Servers are computers that host World Wide Web content.
� A top-level domain name (TLD) can either be a country code (for example .be stands for Belgium) or one of the generic top leveldomains (a so-called gTLD such as .com, .org, .net).
For more information, see OECD, Communications Outlook 2001.
.

MEASURING THE INFORMATION ECONOMY 2002 41
© OECD 2002 41
Internet infrastructure
Number of Internet hosts per 1 000 inhabitants, July1997-July 2001
gTLDs adjusted1
Web sites per 1 000 inhabitants, July 2000
0.2
0.4
100
67
0.9
0.04
5
1.4
0.5
1.7
0.4
1.5
0.5
0.6
3.7
0.6
17.7
3.7
5.4
0.1
2.1
1.4
0.9
0.2
0.2
0.2
0.1
0.5
0.04
0.5
0.5
0100200300
Turkey
Mexico
Slovak Republic
Korea
Poland
Portugal
Greece
Czech Republic
Hungary
Spain
France
Italy
Ireland
Japan
Germany
EU
Belgium
United Kingdom
Austria
Switzerland
OECD
Australia
Denmark
New Zealand
Netherlands
Norway
Sweden
Canada
Iceland
Finland
United States
0 50000 100000 150000 2000001997 2001
Share in total OECDInternet hosts
%
0 10 20 30 40 50
Mexico
Turkey
Greece
Japan
Portugal
Poland
Hungary
Spain
Ireland
France
Czech Republic
Belgium
Italy
Korea
Finland
Luxembourg
Australia
New Zealand
Austria
EU
Switzerland
Netherlands
OECD
Iceland
Sweden
Denmark
Germany
United Kingdom
Canada
Norway
United States
%
1. Global top-level domains (gTLDs) are distributed to country oflocation.Source: OECD, Information Technology Outlook 2002; OECDcalculations based on Netsizer (www.netsizer.com), July 2002.
Source: OECD, Communications Outlook 2001; OECDcalculations based on Netcraft (www.netcraft.com), May 2001.
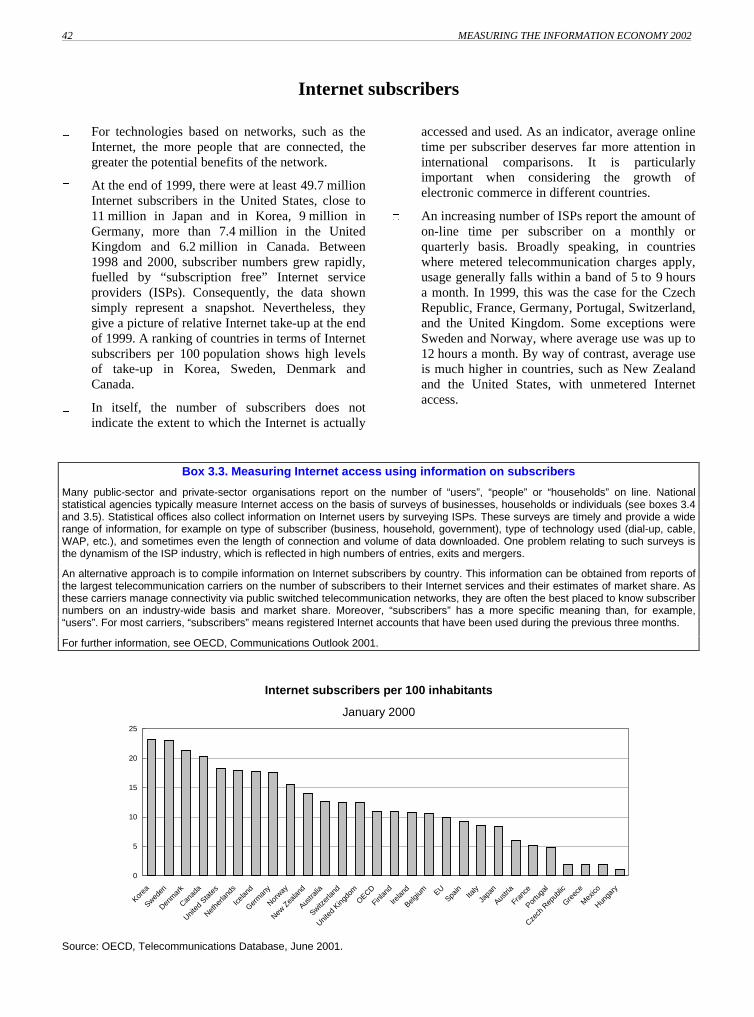
42 MEASURING THE INFORMATION ECONOMY 2002
© OECD 200242
Internet subscribers
For technologies based on networks, such as theInternet, the more people that are connected, thegreater the potential benefits of the network.
At the end of 1999, there were at least 49.7 millionInternet subscribers in the United States, close to11 million in Japan and in Korea, 9 million inGermany, more than 7.4 million in the UnitedKingdom and 6.2 million in Canada. Between1998 and 2000, subscriber numbers grew rapidly,fuelled by “subscription free” Internet serviceproviders (ISPs). Consequently, the data shownsimply represent a snapshot. Nevertheless, theygive a picture of relative Internet take-up at the endof 1999. A ranking of countries in terms of Internetsubscribers per 100 population shows high levelsof take-up in Korea, Sweden, Denmark andCanada.
In itself, the number of subscribers does notindicate the extent to which the Internet is actually
accessed and used. As an indicator, average onlinetime per subscriber deserves far more attention ininternational comparisons. It is particularlyimportant when considering the growth ofelectronic commerce in different countries.
An increasing number of ISPs report the amount ofon-line time per subscriber on a monthly orquarterly basis. Broadly speaking, in countrieswhere metered telecommunication charges apply,usage generally falls within a band of 5 to 9 hoursa month. In 1999, this was the case for the CzechRepublic, France, Germany, Portugal, Switzerland,and the United Kingdom. Some exceptions wereSweden and Norway, where average use was up to12 hours a month. By way of contrast, average useis much higher in countries, such as New Zealandand the United States, with unmetered Internetaccess.
Box 3.3. Measuring Internet access using information on subscribers
Many public-sector and private-sector organisations report on the number of “users”, “people” or “households” on line. Nationalstatistical agencies typically measure Internet access on the basis of surveys of businesses, households or individuals (see boxes 3.4and 3.5). Statistical offices also collect information on Internet users by surveying ISPs. These surveys are timely and provide a widerange of information, for example on type of subscriber (business, household, government), type of technology used (dial-up, cable,WAP, etc.), and sometimes even the length of connection and volume of data downloaded. One problem relating to such surveys isthe dynamism of the ISP industry, which is reflected in high numbers of entries, exits and mergers.
An alternative approach is to compile information on Internet subscribers by country. This information can be obtained from reports ofthe largest telecommunication carriers on the number of subscribers to their Internet services and their estimates of market share. Asthese carriers manage connectivity via public switched telecommunication networks, they are often the best placed to know subscribernumbers on an industry-wide basis and market share. Moreover, “subscribers” has a more specific meaning than, for example,“users”. For most carriers, “subscribers” means registered Internet accounts that have been used during the previous three months.
For further information, see OECD, Communications Outlook 2001.
Internet subscribers per 100 inhabitants
January 2000
0
5
10
15
20
25
Korea
Sweden
Denm
ark
Canad
a
United
Stat
es
Nethe
rland
s
Icelan
d
Germ
any
Norway
New Z
ealan
d
Austra
lia
Switzer
land
United
King
dom
OECD
Finlan
d
Irelan
d
Belgium EU
Spain
Italy
Japa
n
Austri
a
Franc
e
Portu
gal
Czech
Rep
ublic
Greec
e
Mex
ico
Hunga
ry
Source: OECD, Telecommunications Database, June 2001.

MEASURING THE INFORMATION ECONOMY 2002 43
© OECD 2002 43
ICT access by households
Recent progress in methodological and statisticalwork has led to a range of new indicators on accessto and use of ICT technologies by households andindividuals. This work has also contributed togreater international comparability of the statistics(see Box 3.4).
Personal computers are still the main device usedby households to access the Internet. In mostcountries for which data are available, more than40% of all households now have computers.
While keeping in mind differences in surveymethodologies and household structure, there isstill a noticeable gap among countries. InDenmark, Switzerland and Sweden over 60% of
households have a computer, while in Turkey andMexico only 11-12% of households have a one.For Turkey, the figures refer only to households inurban areas; the average penetration rate ofcomputers would be even lower if households inrural areas were surveyed. In France, Italy, Spainand Italy, the average penetration rate of computersis 30%.
The availability of home computers is increasingboth in countries with already high penetrationrates (an average percent increase of 10% from2000 to 2001) and those lagging. This is notably inthe United Kingdom and Portugal, where computerpenetration rates increased by 11 and 12percentage points, respectively, in 2001.
Box 3.4. The comparability of household- and person-based indicators of Internet access and use and theOECD model questionnaire on ICT use in households/by individuals
Over a very short period of time, national statistical offices have made great progress in providing high-quality, timely indicators of ICTuse. From an international perspective, the major drawback of official ICT use statistics is that they are still based on differentstandards and measure rapidly changing behaviour at different points in time. Most countries use existing surveys, such as labourforce, time use, household expenditure or general social surveys. Others rely on special surveys. A first issue for internationalcomparability is to address differences in the timeliness, scope and coverage of indicators.
Another important issue for international comparability is the choice between households or individuals as the survey unit. Householdsurveys generally provide information on both the household and the individuals in the household. Person-based data typically provideinformation on the number of individuals with access to a technology, those using the technology, the location from which they use itand the purpose of use. Statistics on ICT use by households may run into problems of international comparability because of structuraldifferences in the composition of households (similarly, differences in countries’ industrial structure affect comparability of ICT usestatistics in business). On the other hand, statistics on individuals may use different age groups, and age is an important determinantof ICT use. Household- and person-based measures yield different figures in terms of both levels and growth rates. The examplebelow uses US data referring to households and individuals aged three years and more (see �������������� �� ��������������������������� ��� �������� �� � ������� �� ��� �����. Such differences complicate international comparisons and makebenchmarking exercises based on a single indicator of Internet access or use quite misleading, since the ranking of countries changesaccording to the indicator used.
Household- and person-based measures of Internet access and use
3041.5
35.7 32.722.326.2
44.446.7
Householdsaccess
Persons withhome access
Persons usinghome access
Persons usingfrom anylocation
1998 2000
The OECD Working Party on Indicators for the Information Society (WPIIS) is currently addressing these issues of internationalcomparability and working on a model survey on ICT use in households/by individuals. The proposal, led by Australia, consists inmeasuring a core set of indicators which incorporates core country requirements. As in the case of the model questionnaire on the useof ICT and e-commerce in businesses (see Annex 3), additional components of the questionnaire can be added over time astechnologies, usage practices and policy interests change.
At the moment, five core modules are proposed for inclusion in the model questionnaire: Household access to computers and theInternet; Household barriers to adoption of the Internet; Use of computers and the Internet: location and frequency of use; Purposeand nature of activities on the Internet; Internet-commerce details, with questions on Internet purchases by location, frequency ofpurchase, type of goods purchased, Internet payments and barriers to purchase online.

MEASURING THE INFORMATION ECONOMY 2002 44
© OECD 200244
Internet access by households
Internet access in households is soaringeverywhere, especially in Portugal where theaccess rate grew by 125% between 2000 and 2001.Notable also is the increase registered in the UnitedKingdom, where household Internet penetrationincreased by 110% in the same period, and inMexico, albeit from a very small base, from 2.8%in 1999 to 6.2% in 2001. In Japan, following astrong increase in 1999-2000 (74%), the latest dataon households Internet access register only amodest increase of 3% between 2000 and 2001.
Overall households Internet access is highest inNorthern Europe and North America, wherepenetration rates in 2001 ranged between 40% and60%, and lower in continental and SouthernEurope (below 30%).
The propensity of households to access the Internetonce they possess a home computer differs acrosscountries. It is highest in Sweden, the UnitedKingdom and the United States, where 80-90% ofhouseholds with a computer have Internet access.Countries with a larger share of home computershave also a greater propensity to have Internetaccess, but there are some exceptions. In Belgium45% of households had a computer in 1999, but
only about 13% had access to the Internet. In Italyand Ireland in 2000, the share of households withcomputers was lower (about 30%) and householdInternet access rates higher (about 20%).
Households can access the Internet via differenttypes of services. Indicators of the quality ofaccess, in terms of the speed and capacity of theinfrastructure, are of great interest since they pointto differences in the potential use of newtechnologies across countries. So far, data for avery few countries show that most households stilluse dial-up rather than high-speed access theInternet. Canada is a notable exception, with over60% of households using cable modem services toaccess the Internet.
Internet penetration in households is stronglyaffected by household income. Relatively highoverall rates of Internet access might hide arelatively uneven distribution of access inhouseholds with different income levels. Availabledata show that the difference between Internetaccess in households belonging to the lowest andhighest income quartiles is highest in the UnitedKingdom and North America and lowest inDenmark.
Households Internet access by income level,1 2001 or latest available year
Households with Internet access as a percentage of all households
0
20
40
60
80
100
UnitedKingdom
2001-2002
UnitedStates2000
Canada Finland Australia2000
Germany NewZealand
Netherlands1999
Switzerland2000
France Turkey2000 (2)
Denmark
%
Households Internet access First income quartile Fourth income quartile
1. For the United Kingdom, first and last deciles instead of quartiles, for Germany and New Zealand, first and last income brackets.2. Households in urban areas only.Source: OECD, ICT database, August 2002.

MEASURING THE INFORMATION ECONOMY 2002 45
© OECD 2002 45
Internet access by households
Households with access to a home computer, 2000 and 2001
Percentage of all households
0
10
20
30
40
50
60
70
80
Denm
ark (
1)
Switzer
land
Sweden
Korea
United
Sta
tes
Canad
a
Austra
lia
Germ
any
Finlan
d (1
)
Japa
n
United
King
dom
(2)
New Z
ealan
d
Belgium
(3)
Portu
gal
Austri
a
Franc
e
Irelan
dSpa
inIta
ly
Turke
y (4)
Mex
ico (3
,5)
% 2000 2001
Households with access to the Internet, 6 2000 and2001
Percentage of all households
Household access by type of service, 2001
Percentage of households with Internet access
Denmark (1)
United States
Canada
Sweden
Netherlands
United Kingdom (2)
Finland (1)
New Zealand
Switzerland
Japan (1)
Australia
Germany
Ireland
Austria
Italy
Portugal
France
Belgium (3)
Turkey (4)
Mexico (3,5)
%010203040506070
2001 2000
0 20 40 60 80 100
Other broadband service
DSL
Cable modem
High speed access
Dial-up
High speed access
Dial-up
Dial-up
Cable modem
Dial-up
Cable modem
%
Canada
Portugal
Switzerland (2000)
United Kingdom (2002)
United States
1. Beginning of 2002.2. March 2001-April 2002 (financial year) instead of 2001.3. 1999 instead of 2000.4. Households in urban areas only.5. For 1999, households in urban areas with more than 15 000 inhabitants only.6. Internet access via any device except for Denmark, the Netherlands, Ireland, Austria, France and Turkey where Internet access isvia a home computer.Source: OECD, ICT database, August 2002.

46 MEASURING THE INFORMATION ECONOMY 2002
© OECD 200246
Use of the Internet by individuals
The share of adults using the Internet from anylocation is also increasing rapidly, and more thansixty percent of the adult population now use theInternet in Sweden (76%), Finland (64%),Denmark (62%), and Canada (61%). Denmarkaside, the share of Internet users is highest in thosecountries with a relatively lower average Internetprice basket over the 1995-2000 period.
The frequency with which individuals use theInternet varies considerably across countries, withalmost 90% of users being frequent users (at leastonce a week) in the Nordic countries, theNetherlands and Austria. The share of frequentusers drops to one fourth to one third in the case ofMexico, France and Canada. Overall, less thanfifty percent of users are daily users.
Individuals using the Internet do so mainly forcommunication purposes (receiving and sending e-mails) or to find information about goods and
prices. But even in countries where over 70% ofindividuals search for prices online, only 20 to 40percent purchase over the Internet.
In most cases downloading digitised goods, such asnews, games, music and free software is the mostcommon activity. In Portugal, for example, over50% of individuals download digitised goods whileonly 9% purchases over the Internet.
The Internet is also used to access online services,especially banking services, notably in Finland,where 64% of individuals reported having used theInternet to carry out banking transactions in 2001.Use of the Internet to interact with publicauthorities is especially common in Denmark andFinland; over 50% of individuals reported usingthe Internet for that purpose, compared to only 8%in France. Finally, 30% of people in Canada andPortugal report that they carry out on-line jobsearches.
Individuals1 using the Internet from any location, 2000 and 2001
Percentage of all individuals
0
20
40
60
80
Sweden
Finlan
d (2
)
Denm
ark (
2)
Canad
a
United
Sta
tes
Nethe
rland
s
United
King
dom
(2)
Austra
lia
Franc
e
Austri
aIta
ly
Turke
y (3)
Mex
ico
% 2000 2001
Individuals1 frequently using the Internet, 2001
Percentage of all individuals
0
20
40
60
80
Sweden
Finlan
d (2
)
Denm
ark (
2)
Canad
a (4
)
Nethe
rland
s
United
King
dom
(2)
Austra
lia (4
)
Franc
e
Austri
a (4
)
Italy
(4)
Turke
y (3,
4)
Mex
ico
Individuals using the Internet
Individuals using the Internet dailyIndividuals using the Internet at least once a w eek
%
1. Age cut-off: 16 years and older except for Canada and Finland (15+), Italy (11+), Austria (6+), Mexico and the Netherlands (12+)and Australia and Turkey (18+).2. Beginning of 2002 instead of 2001.3. Individuals belonging to households in urban areas.4. 2000 instead of 2001.Source: OECD, ICT database, August 2002.
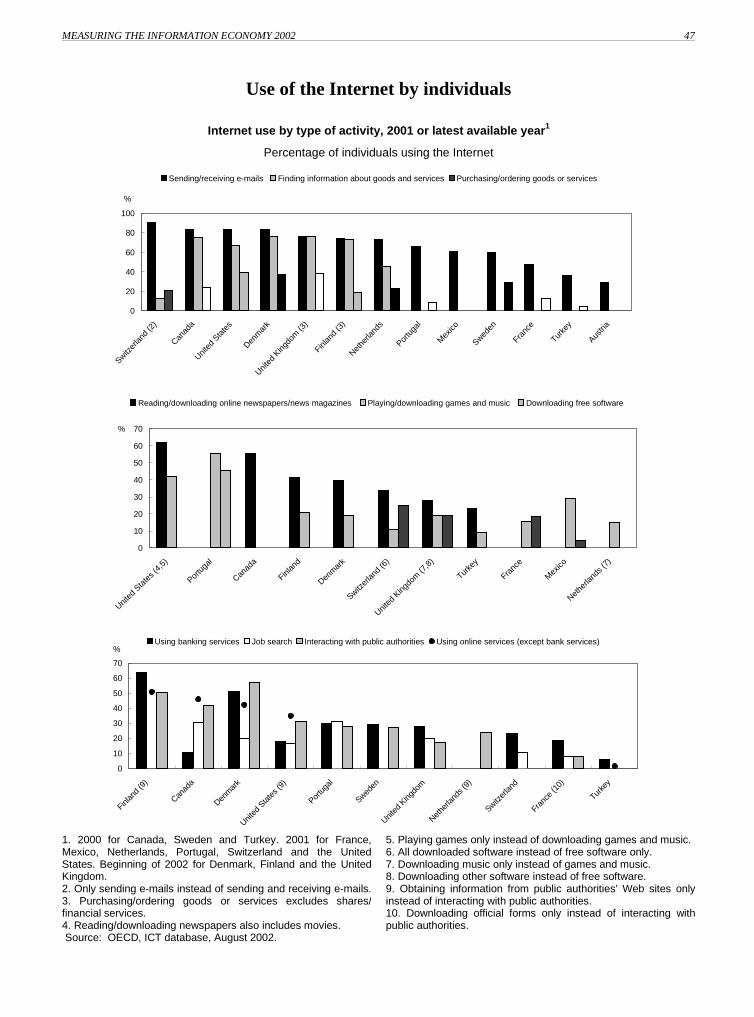
MEASURING THE INFORMATION ECONOMY 2002 47
© OECD 2002 47
Use of the Internet by individuals
Internet use by type of activity, 2001 or latest available year1
Percentage of individuals using the Internet
0
20
40
60
80
100
Switzer
land
(2)
Canad
a Unit
ed S
tate
s
Denm
ark
United
King
dom
(3)
Finlan
d (3
)Net
herla
nds
Portu
gal
Mex
ico
Sweden
Franc
e
Turke
y
Austri
a
%
Sending/receiving e-mails Finding information about goods and services Purchasing/ordering goods or services
0
10
20
30
40
50
60
70
United
Sta
tes (
4,5)
Portu
gal
Canad
a
Finlan
d
Denm
ark
Switzer
land
(6)
United
King
dom
(7,8
)
Turke
y
Franc
e
Mex
ico
Nethe
rland
s (7)
%
Reading/downloading online newspapers/news magazines Playing/downloading games and music Downloading free software
0
10
20
30
40
50
60
70
Finlan
d (9
)
Canad
a
Denm
ark
United
Sta
tes (
9)
Portu
gal
Sweden
United
King
dom
Nethe
rland
s (9)
Switzer
land
Franc
e (1
0)
Turke
y
%Using banking services Job search Interacting with public authorities Using online services (except bank services)
1. 2000 for Canada, Sweden and Turkey. 2001 for France,Mexico, Netherlands, Portugal, Switzerland and the UnitedStates. Beginning of 2002 for Denmark, Finland and the UnitedKingdom.2. Only sending e-mails instead of sending and receiving e-mails.3. Purchasing/ordering goods or services excludes shares/financial services.4. Reading/downloading newspapers also includes movies. Source: OECD, ICT database, August 2002.
5. Playing games only instead of downloading games and music.6. All downloaded software instead of free software only.7. Downloading music only instead of games and music.8. Downloading other software instead of free software.9. Obtaining information from public authorities’ Web sites onlyinstead of interacting with public authorities.10. Downloading official forms only instead of interacting withpublic authorities.
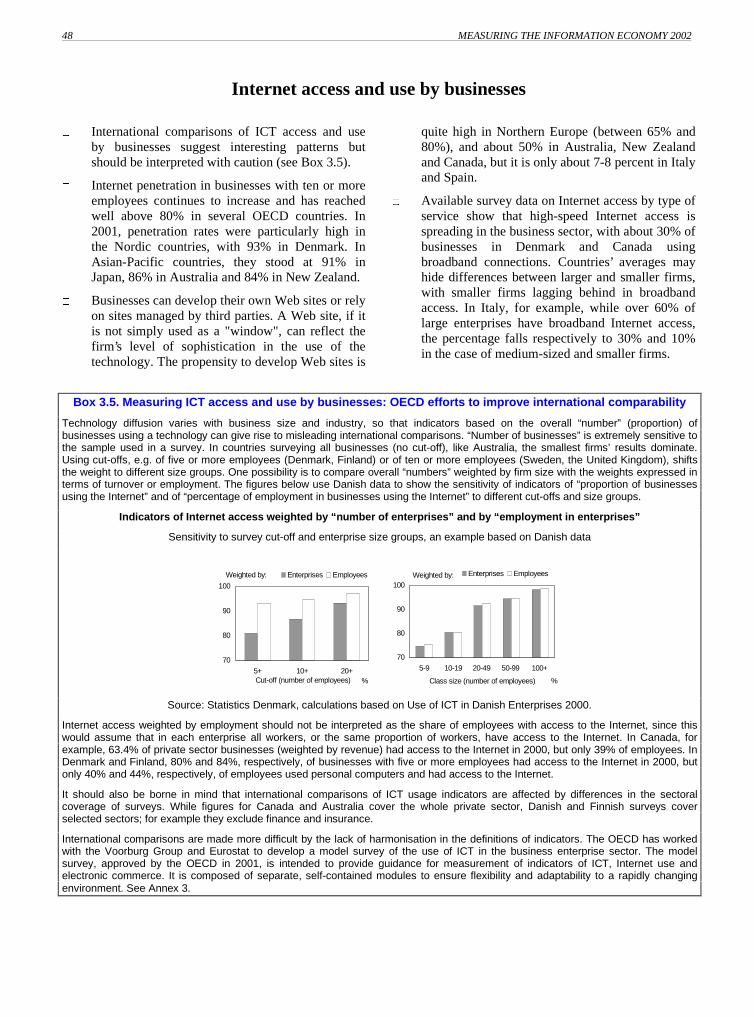
48 MEASURING THE INFORMATION ECONOMY 2002
© OECD 200248
Internet access and use by businesses
International comparisons of ICT access and useby businesses suggest interesting patterns butshould be interpreted with caution (see Box 3.5).
Internet penetration in businesses with ten or moreemployees continues to increase and has reachedwell above 80% in several OECD countries. In2001, penetration rates were particularly high inthe Nordic countries, with 93% in Denmark. InAsian-Pacific countries, they stood at 91% inJapan, 86% in Australia and 84% in New Zealand.
Businesses can develop their own Web sites or relyon sites managed by third parties. A Web site, if itis not simply used as a "window", can reflect thefirm’s level of sophistication in the use of thetechnology. The propensity to develop Web sites is
quite high in Northern Europe (between 65% and80%), and about 50% in Australia, New Zealandand Canada, but it is only about 7-8 percent in Italyand Spain.
Available survey data on Internet access by type ofservice show that high-speed Internet access isspreading in the business sector, with about 30% ofbusinesses in Denmark and Canada usingbroadband connections. Countries’ averages mayhide differences between larger and smaller firms,with smaller firms lagging behind in broadbandaccess. In Italy, for example, while over 60% oflarge enterprises have broadband Internet access,the percentage falls respectively to 30% and 10%in the case of medium-sized and smaller firms.
Box 3.5. Measuring ICT access and use by businesses: OECD efforts to improve international comparability
Technology diffusion varies with business size and industry, so that indicators based on the overall “number” (proportion) ofbusinesses using a technology can give rise to misleading international comparisons. “Number of businesses” is extremely sensitive tothe sample used in a survey. In countries surveying all businesses (no cut-off), like Australia, the smallest firms’ results dominate.Using cut-offs, e.g. of five or more employees (Denmark, Finland) or of ten or more employees (Sweden, the United Kingdom), shiftsthe weight to different size groups. One possibility is to compare overall “numbers” weighted by firm size with the weights expressed interms of turnover or employment. The figures below use Danish data to show the sensitivity of indicators of “proportion of businessesusing the Internet” and of “percentage of employment in businesses using the Internet” to different cut-offs and size groups.
Indicators of Internet access weighted by “number of enterprises” and by “employment in enterprises”
Sensitivity to survey cut-off and enterprise size groups, an example based on Danish data
70
80
90
100
5+ 10+ 20+Cut-off (number of employees) %
Enterprises Employees
70
80
90
100
5-9 10-19 20-49 50-99 100+
Class size (number of employees) %
Enterprises Employees Weighted by: Weighted by:
Source: Statistics Denmark, calculations based on Use of ICT in Danish Enterprises 2000.
Internet access weighted by employment should not be interpreted as the share of employees with access to the Internet, since thiswould assume that in each enterprise all workers, or the same proportion of workers, have access to the Internet. In Canada, forexample, 63.4% of private sector businesses (weighted by revenue) had access to the Internet in 2000, but only 39% of employees. InDenmark and Finland, 80% and 84%, respectively, of businesses with five or more employees had access to the Internet in 2000, butonly 40% and 44%, respectively, of employees used personal computers and had access to the Internet.
It should also be borne in mind that international comparisons of ICT usage indicators are affected by differences in the sectoralcoverage of surveys. While figures for Canada and Australia cover the whole private sector, Danish and Finnish surveys coverselected sectors; for example they exclude finance and insurance.
International comparisons are made more difficult by the lack of harmonisation in the definitions of indicators. The OECD has workedwith the Voorburg Group and Eurostat to develop a model survey of the use of ICT in the business enterprise sector. The modelsurvey, approved by the OECD in 2001, is intended to provide guidance for measurement of indicators of ICT, Internet use andelectronic commerce. It is composed of separate, self-contained modules to ensure flexibility and adaptability to a rapidly changingenvironment. See Annex 3.
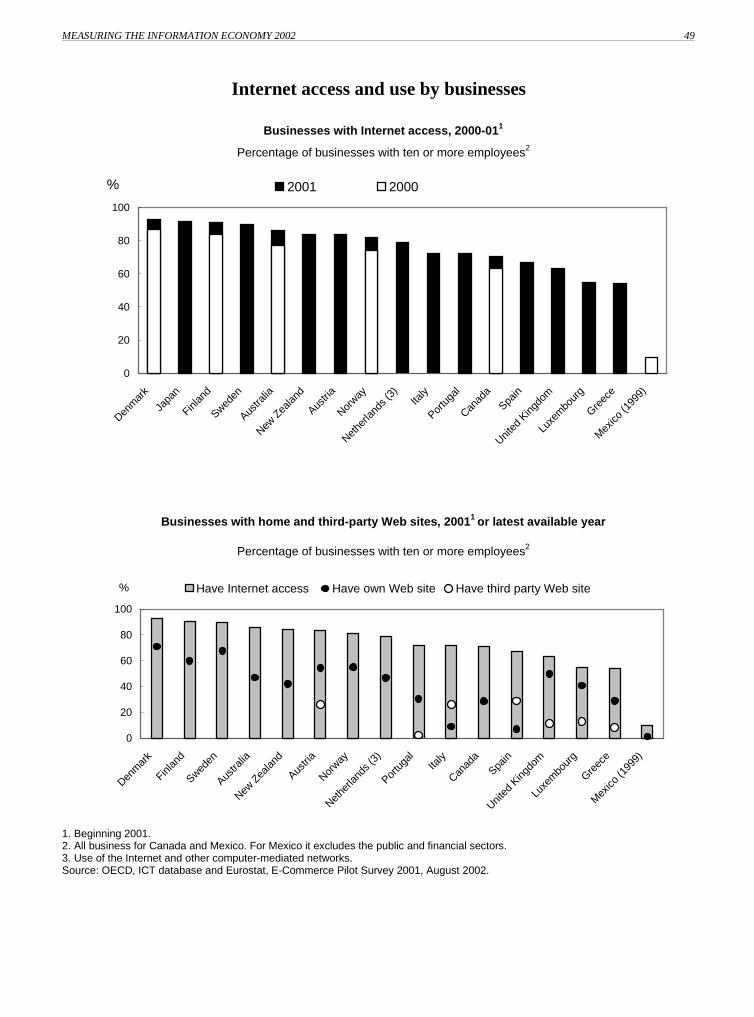
MEASURING THE INFORMATION ECONOMY 2002 49
© OECD 2002 49
Internet access and use by businesses
Businesses with Internet access, 2000-011
Percentage of businesses with ten or more employees2
0
20
40
60
80
100
Denm
ark
Japa
n
Finlan
d
Sweden
Austra
lia
New Z
ealan
d
Austri
a
Norway
Nethe
rland
s (3)
Ita
ly
Portu
gal
Canad
aSpa
in
United
King
dom
Luxe
mbo
urg
Greec
e
Mex
ico (1
999)
% 2001 2000
Businesses with home and third-party Web sites, 20011 or latest available year
Percentage of businesses with ten or more employees2
0
20
40
60
80
100
Denm
ark
Finlan
d
Sweden
Austra
lia
New Z
ealan
d
Austri
a
Norway
Nethe
rland
s (3)
Portu
gal
Italy
Canad
a
Spain
United
King
dom
Luxe
mbo
urg
Greec
e
Mex
ico (1
999)
% Have Internet access Have own Web site Have third party Web site
1. Beginning 2001.2. All business for Canada and Mexico. For Mexico it excludes the public and financial sectors.3. Use of the Internet and other computer-mediated networks.Source: OECD, ICT database and Eurostat, E-Commerce Pilot Survey 2001, August 2002.
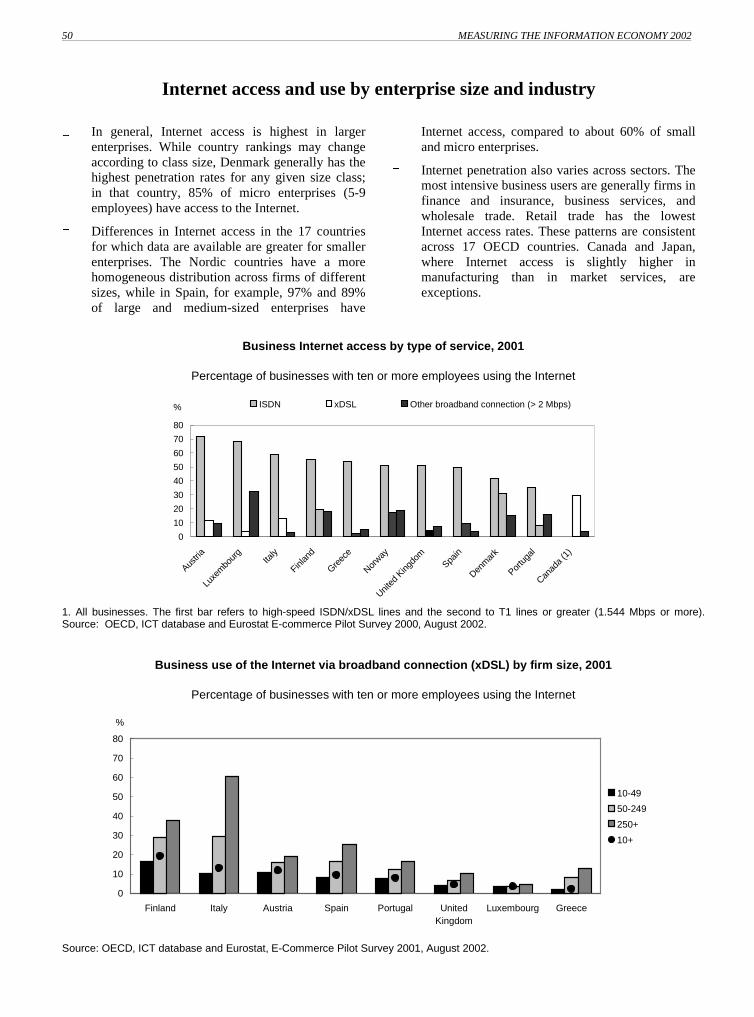
50 MEASURING THE INFORMATION ECONOMY 2002
© OECD 200250
Internet access and use by enterprise size and industry
In general, Internet access is highest in largerenterprises. While country rankings may changeaccording to class size, Denmark generally has thehighest penetration rates for any given size class;in that country, 85% of micro enterprises (5-9employees) have access to the Internet.
Differences in Internet access in the 17 countriesfor which data are available are greater for smallerenterprises. The Nordic countries have a morehomogeneous distribution across firms of differentsizes, while in Spain, for example, 97% and 89%of large and medium-sized enterprises have
Internet access, compared to about 60% of smalland micro enterprises.
Internet penetration also varies across sectors. Themost intensive business users are generally firms infinance and insurance, business services, andwholesale trade. Retail trade has the lowestInternet access rates. These patterns are consistentacross 17 OECD countries. Canada and Japan,where Internet access is slightly higher inmanufacturing than in market services, areexceptions.
Business Internet access by type of service, 2001
Percentage of businesses with ten or more employees using the Internet
0
10
20
30
40
50
60
70
80
Austri
a
Luxe
mbo
urg
Italy
Finlan
d
Greec
e
Norway
United
King
dom
Spain
Denm
ark
Portu
gal
Canad
a (1
)
% ISDN xDSL Other broadband connection (> 2 Mbps)
1. All businesses. The first bar refers to high-speed ISDN/xDSL lines and the second to T1 lines or greater (1.544 Mbps or more).Source: OECD, ICT database and Eurostat E-commerce Pilot Survey 2000, August 2002.
Business use of the Internet via broadband connection (xDSL) by firm size, 2001
Percentage of businesses with ten or more employees using the Internet
0
10
20
30
40
50
60
70
80
Finland Italy Austria Spain Portugal UnitedKingdom
Luxembourg Greece
%
10-49
50-249
250+
10+
Source: OECD, ICT database and Eurostat, E-Commerce Pilot Survey 2001, August 2002.

MEASURING THE INFORMATION ECONOMY 2002 51
© OECD 2002 51
Internet access and use by enterprise size and industry
Internet penetration by size class, 2001 or latest available year
Percentage of businesses using the Internet
0
20
40
60
80
100
Japa
n (1
)
Finlan
d
Sweden
Denm
ark
Austra
lia
New Z
ealan
d
Austri
a
Norway
Nethe
rland
s (2)
Italy
Portu
gal
Canad
a (3
)
Spain
United
King
dom
Luxe
mbo
urg
Greec
e
Mex
ico (4
)
%
5-9
10-49
50-249
250+
10+
1. Businesses with 50 or more employees; 50-99 employees instead of 50-249 and 100 or more employees instead of 250 or more.2. Internet and other computer-mediated networks; 50-199 employees instead of 50-249.3. All businesses; 1-9 employees instead of 5-9, 20-49 instead of 10-49, 50-99 instead of 50-249, 100-249 instead of 250 or more.4. Businesses with 21 or more employees; 21-100 employees instead of 10-49, 101-250 instead of 50-249, 151-1000 instead of 250 ormore.Source: OECD, ICT database and Eurostat E-commerce Pilot Survey 2001, August 2002.
Internet penetration by activity, 2001 or latest available year
Percentage of businesses using the Internet
0
20
40
60
80
100
Denmark Japan (1) Finland Sweden Australia New Zealand Austria Norway
%
0
20
40
60
80
100
Portugal Italy Canada (2) Spain Netherlands(3)
UnitedKingdom
Germany Luxembourg Greece Mexico (4)
%
Retail trade Manufacturing
Wholesale trade Real estate, renting and business services
Finance and insurance Wholesale and retail trade
All
1. Businesses with 50 or more employees.2. All businesses.3. Internet and other computer-mediated networks.4. Businesses with 21or more employees, 1999.Source: OECD, ICT database and Eurostat E-commerce Pilot Survey 2001, August 2002.

52 MEASURING THE INFORMATION ECONOMY 2002
© OECD 200252
Perceived barriers to Internet access and use in the business sector
Analysis of barriers to the use of informationtechnology is of interest to policy makers, butinternational comparisons based on qualitative dataneed to be interpreted with caution (see Box 3.6).
Indicators of perceived barriers to the use of theInternet show that lack of network security to be isthe main obstacle for all European businesses.Analysis by firm size reveals that larger firms tendto rate security issues as very important more thansmaller ones. This may be partly due to the factthat “security” is often perceived as a barrier whenthe technology is actually used (see Box 3.6).
Perhaps surprisingly, costs of access to and use ofthe Internet generally receive the lowest ranking in
all countries. On average, smaller firms attributegreater importance to costs than larger ones. Thereare exceptions, however. In Portugal, Luxembourgand Greece, larger firms finds costs to be relativelymore important. This may be due to the weight ofnon-user firms, which are likely to be smaller firmsin those countries (see Box 3.6).
Lack of perceived benefits may partly explaindifferences in Internet diffusion across sectors.Overall, wholesale and retail trade appears to bethe sector with least scope for using the Internet,while “lack of perceived benefits” does not seem tobe a very important barrier in the financial sector.
Box 3.6. Measuring "perceived" barriers to ICT access and use in business surveys
While information about perceived barriers may not traditionally be collected as part of official statistical surveys, it is important forpolicy makers. For example, indicators on barriers can help monitoring issues of digital divide, potential bottlenecks related to thetechnology, lack of appropriate skills, or concerns about security and logistics. Answers on perceived barriers and on their evaluation(e.g. no importance - some importance - much importance) are inevitably qualitative in nature and limit the use of these indicators forpurposes of international comparisons. Nevertheless they can be useful for detecting common obstacles to the diffusion of newinformation technologies and may be used with other types of quantitative indicators to explain differences in the intensity of use ofnew technologies across countries.
International comparisons based on such qualitative information need to be interpreted with caution. The perception of barriers seemsto vary with the type of respondent. Baldwin and Lin (“Impediments to Advanced Technology Adoption for Canadian Manufacturers”,Statistics Canada Working Paper No. 173, 2001) show that in the Canadian manufacturing sector impediments are reported morefrequently among technology users than non-users and more frequently among innovating firms than non-innovators. A similar patternalso appears for survey tabulations of barriers by type of respondent (e.g. by Internet and non-Internet users). A given barrier toInternet use may be interpreted as a "perceived" barrier by a non-Internet user and as an "experienced" barrier by an Internet user.One might expect some types of barriers, such as lack of perceived benefits and loss of working time, as being greater barriers amongnon-users than users. Interestingly, in Norway, the barrier "lack of security" has increased importance over time and it is much higherfor Internet users than non-Internet users (see table below), i.e. those who have experienced "lack of security" give it greaterimportance. If this is the case in all countries, international comparisons of barriers may show that "lack of security" is a greater barrierin countries that are intensive users of the Internet (although those are probably the countries that are more equipped with securesystems). However, this may simply be due to the weight of non-users in different countries, rather than to differences in the degree of"security" of the environment.
Perceived barriers by respondent: an example based on Norwegian survey data
Barriers judged to be very important
1999 2000 2001 1999 2000 2001
Expense on hardware and programmes 6 6 10 11 11 10
Expense on home pages development and maintenance 12 9 13 13 13 13
Internet access charges too high 5 10 8 6 7 7
Lacking qualification of personnel/lack of specific know-how 3 4 3 2 3 3
Lack of perceived benefits for the company … 19 7 … 8 6
Lost working time because of irrelevant surfing 15 22 11 9 8 8
Data communication too slow or unstable 4 8 10 8 10 9
Lack of security (viruses, hackers) 14 16 26 28 29 35
% of non Internet users that judge this barrier very important
% of Internet users that judge this barrier very important

MEASURING THE INFORMATION ECONOMY 2002 53
© OECD 2002 53
Perceived barriers to Internet access and use in the business sector
Perceived barriers by businesses, 2000
Percentage of computer users with ten or more employees
0 10 20 30 40 50 60
Portugal
Austria
Italy
United Kingdom
Finland
Spain
Sweden
Denmark
Luxembourg
Greece
Spain
Portugal
Italy
Sweden
United Kingdom
Austria
Luxembourg
Greece
Finland
Denmark
Finland
Portugal
United Kingdom
Austria
Spain
Greece
Luxembourg
Italy
Denmark
Sweden
United Kingdom
Portugal
Spain
Denmark
Austria
Luxembourg
Italy
Greece
Portugal
Spain
Sweden
United Kingdom
Austria
Finland
Luxembourg
Italy
Denmark
Greece
%
Lacking qualification of personnel / lack of specific know how
Costs to make it available too high
Lack of security (viruses, hackers)
Data communications too slow or unstable
Internet access charges too high
Source: Eurostat E-commerce Pilot Survey, 2001.

54 MEASURING THE INFORMATION ECONOMY 2002
© OECD 200254
Perceived barriers to Internet access and use in the business sector
Perceived cost barriers by businesses by firm size, 2000
Percentage of computer users
0
5
10
15
20
25
30
35
% Businesses with 10-49 employees Businesses with 250 or more employees
Austria Denmark Finland Greece Italy Luxembourg Portugal Sweden Spain United Kingdom
Costs to make it available too high Internet access charges too high
Businesses lacking qualified personnel or know-how to use the Internet by firm size, 2000
Percentage of computer users
0
5
10
15
20
25
30
35
Finlan
d
Portu
gal
United
King
dom
Austri
aSpa
in
Denm
ark
Greec
e
Luxe
mbo
urg
Italy
% 10-49 50-249 250+
Source: Eurostat E-commerce Pilot Survey, 2001.

MEASURING THE INFORMATION ECONOMY 2002 55
© OECD 2002 55
Perceived barriers to Internet access and use in the business sector
Businesses facing security issues by firm size, 2000
Percentage of computer users
0
10
20
30
40
50
60
70
Austri
a
Denm
ark
Spain
Finlan
d
Greec
eIta
ly
Luxe
mbo
urg
Portu
gal
Sweden
United
King
dom
% 10-49 50-249 250+
Lack of perceived benefits from Internet use by sector1
Percentage of computer users with ten or more employees
0
5
10
15
20
25
30
35
40
Hotels
and r
estau
rants
Comm
erce
Man
ufactu
ring
Trans
port
and c
omm
unica
tions
Comm
erce
Financ
ial se
ctor
Trans
port
and c
omm
unica
tions
Hotels
and r
estau
rants
Trans
port
and c
omm
unica
tions
Financ
ial se
ctor
Comm
erce
Real E
state
Comm
erce
Real E
state
Financ
ial se
ctor
Hotels
and r
estau
rants
Comm
erce
Financ
ial se
ctor
%Spain Finland
UnitedKingdom Portugal Austria Italy Denmark Luxembourg Greece
1. The sector in which the largest share of firms considers "lack of perceived benefits" to be a very important barrier (left bar) and thesector in which the smallest share of firms ranks it as important (right bar).Source: Eurostat E-commerce Pilot Survey, 2001.

56 MEASURING THE INFORMATION ECONOMY 2002
© OECD 200256
The price of Internet access and use
For consumers as for businesses, a significantbarrier appears to be cost of access.
Increased competition in the telecommunicationsindustry has been driving down these costs. Forexample, prices of leased lines, which provide theinfrastructure for business-to-business electroniccommerce, have fallen significantly in recentyears, particularly since 1998, followingwidespread liberalisation in the communicationsector in Europe. However, large price differencesremain. The Nordic countries have the lowestcharges, at about one-quarter of the OECDaverage. Elsewhere, the least expensive countriesare Switzerland, Luxembourg, Ireland, Germany,and the United States. At the other end of thespectrum, the Czech and Slovak Republics havecharges of at least twice the OECD average.
Another barrier to ICT diffusion is the cost ofInternet access for consumers. Prices continue todiffer widely and are among the largest for anycommunication service. Price differences forconsumer access reflect the fixed and variabletelephone charges set by telecommunications
firms, but also the fees charged by the leadingInternet service providers (ISPs).
For 40 hours of Internet access, at peak andoff-peak times, differences in Internet access costfor consumers are even more noticeable. At peaktimes, countries which traditionally have hadunmetered local calls – Australia, Canada, Mexico,New Zealand, the United States – are among theleast expensive. Turkey, where a call allowance isincluded in the line rental, is also inexpensive.
Price differences seem to affect Internet take-up,with prices in the previous year affecting theInternet take-up for the current year. Countrieswith lower average access prices over the period1995-2000, such as Canada, Finland and theUnited States, typically have more Internet hoststhan those with high average prices. Other factorsalso matter. Korea now has low average prices forconsumer access but has traditionally hadexpensive leased line connection for business. Thisappears to be reflected in a high subscriberpenetration but a low host penetration.
Box 3.7. OECD Internet access price baskets
Leased lines (private lines in North America) provide the infrastructure for business-to-business electronic commerce. They give usersthat need to transport high volumes of traffic lower prices than the public switched telephone network (PSTN) and control over theirtelecommunication facilities and traffic. The basket of national leased lines includes total charges (excluding taxes) for leased lines thatcan carry two megabits of information per second.
For consumers and small businesses, the most significant cost for engaging in electronic commerce is the price of local communicationaccess. The OECD basket includes the line rental, public switched telephony network (PSTN) usage charges and the ISP fee. The linerental charge is used to balance the fact that countries that traditionally did not charge for local calls had higher fixed charges, whereasthose that did had lower ones. The use of a fixed charge does not imply that customers would need an additional line, as mostresidential customers use their PSTN line to access Internet services. In addition, some of the prices shown for a defined durationinclude further amounts of online time. This is the case for countries with unmetered access or packages that include large amounts ofonline time.
The comparisons use the prices in place as of 15 September 2000 for the largest telecommunication carrier in each country. Changesthat had been announced but were not yet available are not included.
� Fixed charge: the monthly line rental for residential users.
� Usage charge: the price of local telephone calls (or special rates for Internet access) to an ISP for residential users.
� ISP charge: the price of Internet access from the largest telecommunication operator.
� Peak and off-peak times: the price of local calls at 11:00 hours (peak) and at 20:00 hours (off-peak) during weekdays.
For further information, see OECD, Communications Outlook 2001, Paris, 2001.
.

MEASURING THE INFORMATION ECONOMY 2002 57
© OECD 2002 57
The price of Internet access and use
Price of leased lines in the OECD area,May 2002
Charges for a basket of national leased lines of2 megabits per second, OECD average = 100
Price of 40 hours of Internet use at peak times,August 2001, in PPP dollars
OECD Internet access basket for 40 hours at peak timesusing discounted PSTN rates1
01 0 02 0 03 0 0
C z e c h R e p u b lic
S lo v a k R e p u b lic
K o r e a
N e w Z e a la n d
H u n g a r y
M e x ic o
P o la n d
J a p a n
A u s t r a lia
C a n a d a
P o r t u g a l
S p a in
It a ly
T u r k e y
N e t h e r la n d s
G r e e c e
U n it e d K in g d o m
F r a n c e
A u s t r ia
B e lg iu m
U n it e d S t a t e s
G e r m a n y
Ir e la n d
N o r w a y
L u x e m b o u r g
S w it z e r la n d
D e n m a r k
S w e d e n
Ic e la n d
0 5 0 1 0 0 1 5 0 2 0 0
H u n g a r y
C z e c h R e p
B e lg iu m
L u x e m b o u r g
P o la n d
P o r t u g a l
N e t h e r la n d s
Ir e la n d
S w e d e n
S p a in
O E C D
S w it z e r la n d
A u s t r ia
E U
It a ly
G r e e c e
F r a n c e
Ic e la n d
N o r w a y
J a p a n
D e n m a r k
M e x ic o
N e w Z e a la n d
G e r m a n y
U K
F in la n d
A u s t r a lia
C a n a d a
T u r k e y
K o r e a
U n it e d S t a t e s
F i x e d te l e p h o n e c h a r g eT e l e p h o n e u s a g e c h a r g eIn te r n e t s e r v i c e p r o v i d e r
1. In some countries ISP and PSTN usage charges are bundled and included under the ISP charge.Source: OECD, Telecommunications Database, June 2002.
Internet access prices and Internet hosts1
OECD
Spain
Australia
Belgium
Austria
Canada
Czech Republic
Denmark
Finland
France
Germany
Greece Hungary
Iceland
IrelandItaly
Japan
KoreaLuxembourg
Mexico
NetherlandsNew Zealand
Norway
Poland Portugal
Sweden
Switzerland
Turkey
United Kingdom
United States
0
50
100
150
200
250
300
20 30 40 50 60 70 80 90 100
Average price for 20 hours Internet access 1995-2000, in PPP dollars
Internet hosts per 1 000 inhabitants (July 2001)
1. Internet access costs include VAT and cover both peak and off-peak.Source: OECD; Telcordia Technologies: www.netsizer.com, May 2001.

MEASURING THE INFORMATION ECONOMY 2002 59
© OECD 2002 59
Chapter IV. Electronic commerce
Only a few years ago, internationally comparable official statistics measuring the level, growth and composition of electronic commercetransactions were not available. Today national statistical offices are gradually implementing OECD definitions and guidelines formeasurement in this area. While comparisons still need to take into account differences in the type of definition used in surveys and intheir coverage (see Box 4.1 and Annex 4), available data show some interesting patterns.
To date, the Internet is still mainly used for marketing purposes. Its use for other purposes varies according to the business’s positionin the value chain, with, on average, twice as many businesses using Internet for purchases as for sales.
Aggregate patterns hide sector-specific and size-specific differences in the propensity to carry out transactions. Overall, however,Internet transactions still account for a very small share of total sales, mainly take place among businesses and are largely domestic.
To help explain differences in the rate of e-commerce uptake across countries, this chapter also relies on indicators of barriers toInternet commerce. As noted in Chapter 3, data on barriers are qualitative in nature and need to be used with caution when makinginternational comparisons.
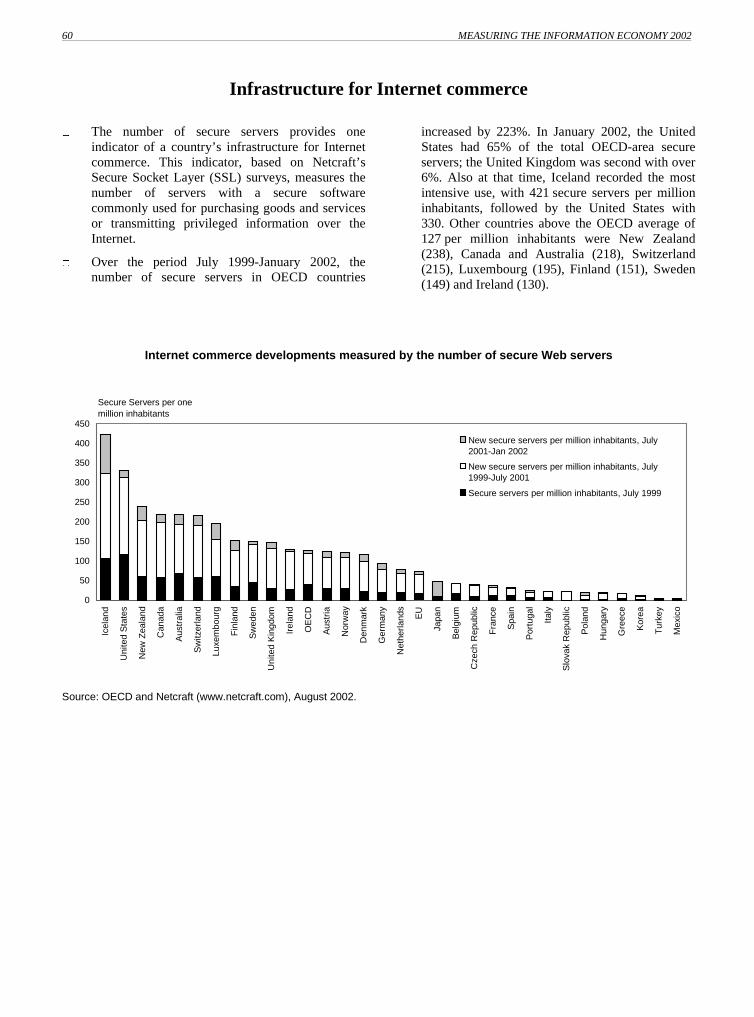
60 MEASURING THE INFORMATION ECONOMY 2002
© OECD 200260
Infrastructure for Internet commerce
The number of secure servers provides oneindicator of a country’s infrastructure for Internetcommerce. This indicator, based on Netcraft’sSecure Socket Layer (SSL) surveys, measures thenumber of servers with a secure softwarecommonly used for purchasing goods and servicesor transmitting privileged information over theInternet.
Over the period July 1999-January 2002, thenumber of secure servers in OECD countries
increased by 223%. In January 2002, the UnitedStates had 65% of the total OECD-area secureservers; the United Kingdom was second with over6%. Also at that time, Iceland recorded the mostintensive use, with 421 secure servers per millioninhabitants, followed by the United States with330. Other countries above the OECD average of127 per million inhabitants were New Zealand(238), Canada and Australia (218), Switzerland(215), Luxembourg (195), Finland (151), Sweden(149) and Ireland (130).
Internet commerce developments measured by the number of secure Web servers
0
50
100
150
200
250
300
350
400
450
Icel
and
Uni
ted
Sta
tes
New
Zea
land
Can
ada
Aus
tral
ia
Sw
itzer
land
Luxe
mbo
urg
Fin
land
Sw
eden
Uni
ted
Kin
gdom
Irel
and
OE
CD
Aus
tria
Nor
way
Den
mar
k
Ger
man
y
Net
herla
nds
EU
Japa
n
Bel
gium
Cze
ch R
epub
lic
Fra
nce
Spa
in
Por
tuga
l
Italy
Slo
vak
Rep
ublic
Pol
and
Hun
gary
Gre
ece
Kor
ea
Tur
key
Mex
ico
Secure Servers per one million inhabitants
New secure servers per million inhabitants, July2001-Jan 2002
New secure servers per million inhabitants, July1999-July 2001
Secure servers per million inhabitants, July 1999
Source: OECD and Netcraft (www.netcraft.com), August 2002.
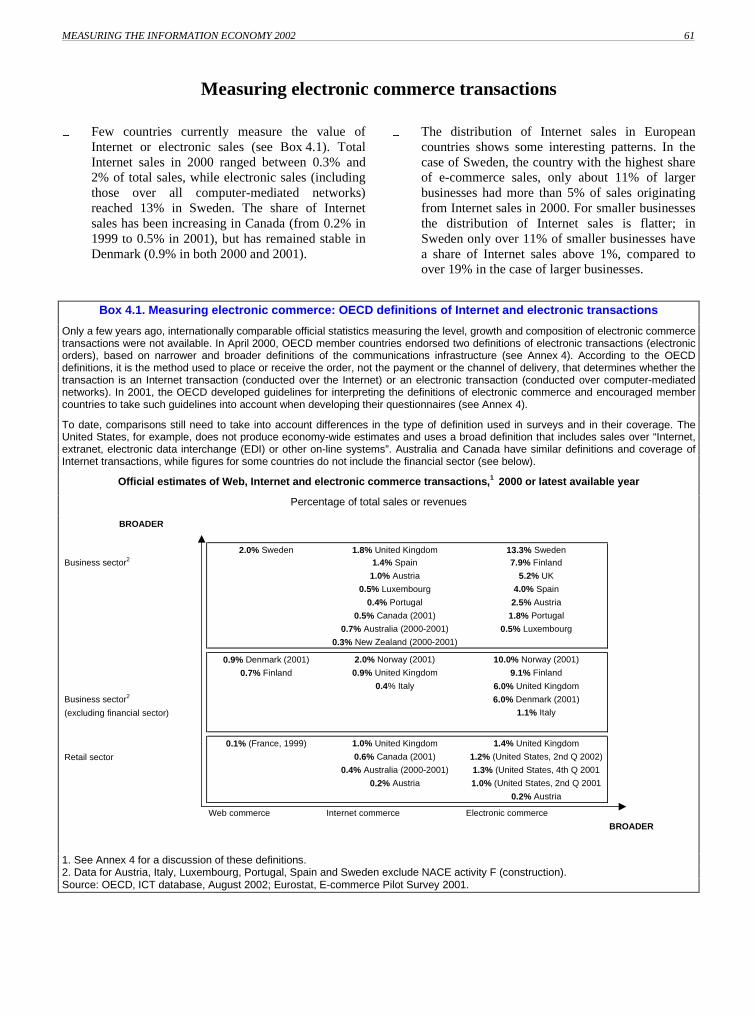
MEASURING THE INFORMATION ECONOMY 2002 61
© OECD 2002 61
Measuring electronic commerce transactions
Few countries currently measure the value ofInternet or electronic sales (see Box 4.1). TotalInternet sales in 2000 ranged between 0.3% and2% of total sales, while electronic sales (includingthose over all computer-mediated networks)reached 13% in Sweden. The share of Internetsales has been increasing in Canada (from 0.2% in1999 to 0.5% in 2001), but has remained stable inDenmark (0.9% in both 2000 and 2001).
The distribution of Internet sales in Europeancountries shows some interesting patterns. In thecase of Sweden, the country with the highest shareof e-commerce sales, only about 11% of largerbusinesses had more than 5% of sales originatingfrom Internet sales in 2000. For smaller businessesthe distribution of Internet sales is flatter; inSweden only over 11% of smaller businesses havea share of Internet sales above 1%, compared toover 19% in the case of larger businesses.
Box 4.1. Measuring electronic commerce: OECD definitions of Internet and electronic transactions
Only a few years ago, internationally comparable official statistics measuring the level, growth and composition of electronic commercetransactions were not available. In April 2000, OECD member countries endorsed two definitions of electronic transactions (electronicorders), based on narrower and broader definitions of the communications infrastructure (see Annex 4). According to the OECDdefinitions, it is the method used to place or receive the order, not the payment or the channel of delivery, that determines whether thetransaction is an Internet transaction (conducted over the Internet) or an electronic transaction (conducted over computer-mediatednetworks). In 2001, the OECD developed guidelines for interpreting the definitions of electronic commerce and encouraged membercountries to take such guidelines into account when developing their questionnaires (see Annex 4).
To date, comparisons still need to take into account differences in the type of definition used in surveys and in their coverage. TheUnited States, for example, does not produce economy-wide estimates and uses a broad definition that includes sales over “Internet,extranet, electronic data interchange (EDI) or other on-line systems”. Australia and Canada have similar definitions and coverage ofInternet transactions, while figures for some countries do not include the financial sector (see below).
Official estimates of Web, Internet and electronic commerce transactions,1 2000 or latest available year
Percentage of total sales or revenues
BROADER
2.0% Sweden 1.8% United Kingdom 13.3% SwedenBusiness sector2 1.4% Spain 7.9% Finland
1.0% Austria 5.2% UK
0.5% Luxembourg 4.0% Spain
0.4% Portugal 2.5% Austria
0.5% Canada (2001) 1.8% Portugal
0.7% Australia (2000-2001) 0.5% Luxembourg
0.3% New Zealand (2000-2001)
0.9% Denmark (2001) 2.0% Norway (2001) 10.0% Norway (2001)
0.7% Finland 0.9% United Kingdom 9.1% Finland
0.4% Italy 6.0% United Kingdom
Business sector2 6.0% Denmark (2001)
(excluding financial sector) 1.1% Italy
0.1% (France, 1999) 1.0% United Kingdom 1.4% United Kingdom
Retail sector 0.6% Canada (2001) 1.2% (United States, 2nd Q 2002)
0.4% Australia (2000-2001) 1.3% (United States, 4th Q 2001
0.2% Austria 1.0% (United States, 2nd Q 2001
0.2% Austria
Web commerce Internet commerce Electronic commerce
BROADER
1. See Annex 4 for a discussion of these definitions.2. Data for Austria, Italy, Luxembourg, Portugal, Spain and Sweden exclude NACE activity F (construction).Source: OECD, ICT database, August 2002; Eurostat, E-commerce Pilot Survey 2001.

62 MEASURING THE INFORMATION ECONOMY 2002
© OECD 200262
Internet and electronic commerce transactions
The Internet is still mainly used for marketingpurposes and its use for other purposes variesaccording to the business’s position in the valuechain (customer or supplier). For 16 countries forwhich both Internet purchasing and Internet salesdata are available, purchasing is more commonthan selling. Except in Greece and Luxembourg,63-93% of businesses with more than tenemployees reported using the Internet. However,only one in eight on average reported makingInternet sales. On average, twice as manybusinesses use Internet for purchases as for sales.
Among firms that use the Internet, only a fewdistribute goods and services on line or offerinteractive electronic payment capability. Ananalysis of the use of computer networks in USmanufacturing plants in mid-2000 revealed verylimited use of Internet applications to integratetransaction-related business processes. Some plantsthat do not accept on-line orders accept on-linepayments, while some plants that reported no on-line orders provided on-line customer support.About 34% of manufacturing plants reportedhaving purchased on line, while only 9% paid online. Although firms may not pay on line forsecurity reasons, 29% of those that did, did notpurchase on line (US Department of Commerce,2001). In European countries, up to 8% of
businesses delivered digitised products and/orreceived payments over the Internet in 2000.
The relation between Internet use and size is acomplex one. Not only is business size industry-specific, i.e. what may be a small enterprise in oneindustry may be a large one in another, but Internetuse for transactions is industry-specific as well.Data broken down by class size show that smallerbusinesses that use the Internet appear to haveroughly the same propensity to sell over theInternet as larger ones in Australia, Denmark andSweden. Use of the Internet for purchases seems tobe more sensitive to firm size across all countries.
The propensity to carry out Internet purchases andsales is higher in services than in manufacturing,and financial services, business services andwholesale trade are generally the most intensiveusers. Internet orders are most frequent in thefinance and insurance industry in Australia,Norway, Spain, Sweden and the United Kingdom,and the business services industry also has highrates of Internet commerce. In Denmark andFinland, the business services industry reportedapproximately every second order to be an Internetorder. In Australia, Canada, the Netherlands andNew Zealand, the propensity to buy or sell over theInternet seems to be more equally distributedacross sectors.
Distribution of e-commerce sales in European countries, 2000
Percentage of businesses for any given country whose sales over the Internet as a share of total sales are higher than1%, 2%, 5%, 10%, 25% or 50% in larger and smaller businesses
Businesses with more than 250 employees
0
5
10
15
20
25
> 1% > 2% > 5% > 10% > 25% > 50%
% Businesses with 10-49 employees
0
5
10
15
20
25
> 1% > 2% > 5% > 10% > 25% > 50%
%
The shaded area represents Internet sales distributions in European countries for every Internet sales interval. In the case of largerbusinesses a maximum of 10.6% of businesses (in Sweden) had more than 5% of sales originating from Internet sales in 2000, whilea maximum of 1.2% of businesses (in Denmark) had Internet sales whose value was more than 50% of overall sales. In the case ofsmaller businesses the distribution of Internet sales is flatter with over 11% of businesses only having a share of Internet sales greaterthan 1%, compared to over 19% in the case of larger businesses (in Sweden).Source: OECD, based on Eurostat, E-commerce Pilot Survey 2001.

MEASURING THE INFORMATION ECONOMY 2002 63
© OECD 2002 63
Internet and electronic commerce transactions
Businesses using the Internet for purchasing and selling, 20011
Percentage of businesses with ten or more employees
0
20
40
60
80
100
Denm
ark
Japa
n (2
)
Finlan
d
Sweden
Austra
lia
New Z
ealan
d
Austri
a
Norway
Nethe
rland
s (3)
Ita
ly
Portu
gal
Canad
a (4
)
Spain
United
King
dom
(5)
Luxe
mbo
urg
Greec
e
%
Businesses using the Internet
Businesses receiving orders over the Internet
Businesses ordering over the Internet
Note: The results of the Eurostat survey are based on a selection of industries which changes slightly across countries. The mainsectors covered are manufacturing, wholesale and retail trade, hotels and restaurants, transport, storage and communications,financial intermediation, real estate, renting and business activities. The surveys of Denmark, Italy, Finland and Norway do not coverfinancial intermediation; those of Denmark, the Netherlands, Finland, the United Kingdom and Norway also cover construction;Denmark and Norway also survey personal services.1. Beginning of 2001 for Internet use, purchases and sales refer to 2000, except for Canada where purchases and sales refer to2001 and for Denmark and Norway where Internet use refers to 2002 and purchases and sales refer to 2001.2. All businesses with 50 and more employees.3. Use, orders received and placed refer to Internet and other computer-mediated networks.4. All businesses.5. Orders received and placed over the Internet and other computer-mediated networks.Source: OECD, ICT database, August 2002; Eurostat, E-commerce Pilot Survey 2001.
Selling, delivering and paying over the Internet, 2000
Percentage of Internet users
0
5
10
15
20
25
30
Denm
ark
Norway
Sweden
Finla
nd
Austra
lia (2
000-
2001
)
Austri
a
Luxe
mbo
urg
Greec
e
Spain
Portu
gal
Italy
% Sales Delivery of digitised products Receiving on-line payments
Source: OECD, ICT database, August 2002; Eurostat, E-Commerce Pilot Survey 2001.

64 MEASURING THE INFORMATION ECONOMY 2002
© OECD 200264
Internet and electronic commerce transactions
Internet purchases and sales by size class, 2000
Percentage of businesses in each size class
80 60 40 20 0 20 40 60 80
0-4
5-9
10-19
20-49
50-99
100+
10-49
50-249
250+
0
1-9
10-19
20-49
50-99
100-299
300-499
500+
10-49
50-249
250+
5-9
10-49
50-249
250+
10-49
50-249
250+
10-49
50-249
250+
50-99
100+
%
Sales Purchases
Australia (2000-2001)
Canada (2001)
Austria
Finland
Greece
Denmark
Italy
Japan1
80 60 40 20 0 20 40 60 80
10-49
50-249
250+
5-9
10-49
50+
10-49
50-249
250 and more
10-49
50-249
250+
10-49
50+
1-4
5-9
10-49
50-249
250+
10-49
50-249
250+
10-49
50-249
250-999
1 000 and more
%
Sales Purchases
Spain
Norway
United Kingdom2
Sweden
Portugal
Netherlands2
Luxembourg
New Zealand (2000-2001)
1. All businesses with 50 or more employees.2. Orders received or placed over the Internet and other computer-mediated networks.Source: OECD, ICT database, August 2002; Eurostat, E-Commerce Pilot Survey 2001.

MEASURING THE INFORMATION ECONOMY 2002 65
© OECD 2002 65
Internet and electronic commerce transactions
Internet purchases and sales by activity, 2000
Percentage of businesses in each activity class
100 80 60 40 20 0 20 40 60 80 100
TOT
RT
MAN
WH
FI
TOT
MAN
WH&RT
FI
TOT
RT
FI
WH
MAN
TOT
MAN
WH&RT
TOT
WH&RT
MAN
WH&RT
TOT
MAN
FI
WH&RT
TOT
MAN
WH&RT
TOT
FI
MAN
WH
RT
%
Sales Purchases
Australia(2000-2001)
Austria
Canada (2001)1
Denmark
Finland
Germany
Greece
Italy
Japan2
100 80 60 40 20 0 20 40 60 80 100
TOT
MAN
WH&RT
FI
TOT
FI
MAN
WH&RT
TOT
WH
FI
RT
MAN
TOT
RT
MAN
WH
FI
TOT
MAN
FI
WH
RT
TOT
MAN
WH&RT
FI
TOT
RT
MAN
WH
FI
TOT
MAN
WH&RT
FI
%
Sales Purchases
Luxembourg
Netherlands3
New Zealand (2000-2001)
Norway
Portugal
Spain
United Kingdom3
Sweden
Note: TOT (total economy); FI (finance and insurance); RT (retail trade); WH (wholesale trade), MAN (manufacturing).1. All businesses.2. Businesses with 50 or more employees.3. Orders received or placed over the Internet and other computer-mediated networks.Source: OECD, ICT database, August 2002; Eurostat, E-commerce Pilot Survey 2001.
66 MEASURING THE INFORMATION ECONOMY 2002
© OECD 200266
Internet and electronic commerce transactions by consumers
Although transactions among businesses representthe bulk of electronic commerce, most attentionhas focused on business-to-consumer Internetsales. Since household expenditure in OECDcountries typically accounts for over half of totaldomestic demand, this is not surprising. Moreover,the growing interest of policy makers in issuessuch as consumer trust and privacy protection inthe on-line environment has raised demand forindicators of consumers’ on-line transactions.
The share of Internet users buying over the Internetis generally quite low and varies widely. It ishighest in Denmark, Sweden, United Kingdom andUnited States, where about 38% of individualsusing the Internet ordered products in 2001,followed by Canada (24%) and the Netherlands(20%). It is lowest in Mexico, where only 0.6% ofInternet users purchase over the Internet. Withabout one in six Internet users purchasing goodsover the Internet in Finland and Australia, there isstill a potential for a marked increase in Internetsales, especially since over 50% of households inthose countries has access to a computer.
Some countries have started to collect statistics onthe proportion or volume of business-to-consumerInternet transactions. Generally, less than 30% ofInternet sales are to households, although the sharevaries considerably, ranging from about 30% inFinland and Luxembourg to only a little over 1%in Singapore in 2000 (Infocomm DevelopmentAuthority, 2000). In the United Kingdom, thefinancial sector accounts for most Internet sales tohouseholds; if these sales are excluded, householdInternet sales drop from 0.36% to 0.1%. In Canada,the finance and insurance sector accounted for 8%of total business-to-consumer transactions in 2001.Retail enterprises had the largest volume of
transactions to consumers (30%), followed bywholesale trade (19%) and transportation andwarehousing (13%). Manufacturing enterprises hadthe largest share of business-to-business Internettransactions (22%).
As it is difficult to estimate business-to-consumerelectronic transactions, retail transactions over theInternet are often used as proxies. The Canadian e-commerce survey, which produces estimates ofInternet business-to-consumer transactions acrossall sectors of the economy, shows that only abouthalf of Internet sales in the retail sector go toconsumers. Internet retail sales are still a verysmall share of total retail trade sales, ranging from0.1% in France to just over 1% in the UnitedKingdom. Retail sales in Canada doubled from1999 to 2000, with the average value of an Internetsale remaining relatively unchanged at CAD 121(USD 75) (Statistics Canada, 2001).
The US Department of Commerce has publishedquarterly data on on-line retail sales since the lastquarter of 1999. Internet retail trade grew rapidlyboth in volume and as a share of total retail trade in1999-2001; its share increased from 0.70% in thefourth quarter of 1999 to 1.2% in the fourth quarterof 2000 and to 1.3% in the fourth quarter 2001. E-commerce retail sales in the second quarter of 2002accounted for 1.2% of total sales, a decrease fromthe 1.3% of the previous quarter but an increaseover the 1.0% of the second quarter 2001. The totalvalue of on-line retail sales (USD 35.9 billion in2001) should be considered as a lower bound, ascertain categories that are included in othersurveys, such as on-line travel services, financialbrokers and dealers and ticket sales agencies, areexcluded.

MEASURING THE INFORMATION ECONOMY 2002 67
© OECD 2002 67
Internet and electronic commerce transactions by consumers
Individuals purchasing over the Internet, 2001 or latest available year
Percentage of all individuals
0
20
40
60
80
Sweden
Finlan
d (1
)
Denm
ark (
1)
Canad
a (2
)
United
Sta
tes
Nethe
rland
s
United
King
dom
(1)
Austra
lia (2
)
Franc
e
Portu
gal
Italy
(2)
Turke
y (2,
3)
Mex
ico
%Individuals using the Internet
Individuals ordering goods or services over the Internet
1. 2002 instead of 2001.2. 2000 instead of 2001.3. Individuals belonging to households in urban areas.Source: OECD, ICT database, August 2002.
Share of Internet sales by type of customer, 2000 or latest available year
0% 20% 40% 60% 80% 100%
Singapore
Korea (2001)
Portugal
Austria
Norway (2001)
Sweden
United Kingdom
Denmark (2001)
Canada (2001)
Finland
Luxembourg
Households Public sector
Enterprises Public Sector and enterprises
Source: OECD, ICT database, August 2002; Eurostat, E-commerce Pilot Survey 2001.

68 MEASURING THE INFORMATION ECONOMY 2002
© OECD 200268
Internet transactions by product and cross-border
The products that sell the best over the Internet arenot necessarily the same across countries, sincethey reflect not only the nature of the product –digitised products such as music, books andsoftware are easier to sell and distribute over theInternet – but also consumer tastes and habits.
Computer products represent the biggest shares inthe United States, Japan and Korea. In France,clothing accounts for about 30% of consumerpurchases over the Internet. Digitised productssuch as music, computer software and magazinesalso represent a relatively important source ofrevenue. In 1999 in France, CDs and DVDs werethe top-selling items over the Internet andrepresented almost 40% of the total value ofInternet sales. In the Netherlands in 2000, CDsmade up 23% and DVDs a further 4% of Internetsales (De digitale economie 2001). In Australia,three products (books, music and computersoftware) accounted for 45% of householdspending over the Internet.
Statistical offices have started to collect statisticson the share of firms’ turnover originating fromsales abroad. Such statistics are hard to collect atpresent, mainly because the volume of sales abroadmay not yet be statistically significant. It is alsodifficult to identify where buyers and sellers arephysically located. In Australia, 90% of businesseswith a Web site have a site hosted only inAustralia; 5% have a site hosted only overseas andthe remaining 5% have a site hosted both inAustralia and overseas (Australian Bureau ofStatistics, 2000).
Available statistics show that Internet sales aremainly domestic. To understand why, it isnecessary to break down sales by industry,destination and type of customer (business orhousehold). In Canada, for example, professional,scientific and technical services are most likely tohave Internet sales to customers outside Canada,with 56% of the total value of their Internet salesabroad. In the accommodation and food servicesindustry and the arts, entertainment and recreationindustry more than 50% of the value of Internetsales were also to customers abroad. Overall inCanada, manufacturing, transport, wholesale tradeand retail trade accounted for 60% of total Internetsales in 2001. In sum, while 16.6% of total Internet
sales are to customers outside Canada, theirindustry composition is highly skewed. Wholesaletrade and retail trade account for over a quarter ofInternet sales, but their propensity to export is low,at 13.6% and 3.2% of all sales, respectively.
In Eurostat’s E-commerce Pilot Survey, salesabroad are broken down by destination within andoutside Europe. Initial results for nine Europeancountries indicate that European companies mainlysell over the Internet to locations within Europe.This may partly reflect the overall (intra-Europe)tendency of European trade. In Austria, Denmarkand Finland, exports to Europe represent between55% and 63% of total exports of goods. Thisroughly coincides with the ratio of intra-EuropeanInternet exports to total exports in Finland (56%)and Denmark (63%), while it is a bit higher forAustria (73%). The share of international Internetsales is particularly small in the United Kingdom,at only 0.05% of total sales in the sectors surveyed;the air transport industry has the highest propensityto export abroad, with 0.7% of total sales (ONS,2001).
The available data do not allow for breakingInternet exports down by type of customer to knowwhether business-to-consumer Internet transactionsare more “international” in nature than business-to-business transactions. It is also difficult forconsumers to know where a firm or a Web site isphysically located, or whether a firm’s location andthat of its Web site coincide. Moreover, even ifbusiness-to-consumer transactions have a higherpropensity to be “international”, Internet sales involume terms are more likely to be domestic,owing to the weight of business-to-businesstransactions.
Statistics on international Internet purchases drawnfrom household surveys or surveys of individualsmight help but rarely exist as yet. In Australia,50% of adults purchasing over the Internet buyonly from Australian Web sites, 32% only fromoverseas Web sites and 18% from both. Singaporereports that business-to-consumer sales aredominated by overseas customers, with particularlylarge shares of customers in Malaysia, Thailand,Japan and the United States (InfocommDevelopment Authority, 2000).

MEASURING THE INFORMATION ECONOMY 2002 69
© OECD 2002 69
Internet transactions by product and cross-border
Consumers’ Internet purchases by product, 2000
0% 10% 20% 30% 40% 50% 60% 70% 80% 90% 100%
Finland
Canada
United Kingdom
France
Japan
United States
Korea
Australia (1) B&M M&V
B&M
B&M
B&M
M&V
Tr
M&V
M&V
M&V
SW
SW
SW
SW
Other
Other
Other
Other
Other
Other
Other
Other
Comp
Comp
CL
Aut
CL
CL
HW
Elec Tr
Tr
Tr
RE
Note: Aut (Automotive); Comp (Computer and related products); CL (Clothing/ jewellery/ accessories); M&V (Music and videos); Elect(Electronic telecommunication equipment); RE (Real estate); HW (Computer hardware); B&M (Books/magazines); SW (Computersoftware); Tr (Travel).1. Proportions of all adults purchasing or ordering over the Internet for private use.Sources: ABS, 2001; Statistics Canada, 2000; INSEE, 2001; Statistics Finland, 2001; ECOM in collaboration with the METI, Japan,2001; Korea National Statistical Office, 2001, US Bureau of the Census, 1999.
Share of Internet sales in domestic and international markets, 2000 or latest available year
0% 20% 40% 60% 80% 100%
United Kingdom
Norway (2001)
Finland
Austria
Spain
Denmark (2001)
Sweden
Canada (2001)
Italy
Luxembourg
Abroad European Union Domestic
Source: OECD, ICT database, August 2002; Eurostat, E-commerce Pilot Survey 2001.

70 MEASURING THE INFORMATION ECONOMY 2002
© OECD 200270
Drivers and inhibitors of Internet commerce
One source of differences in countries’implementation of electronic commerce and in theimpact of electronic transactions on businessperformance and productivity is the extent towhich firms incorporate the technologystrategically into their business processes. Firmscarrying out transactions on line may seek greaterefficiency, or speed, in their business processes orproduction-related efficiency, i.e. reduction oftransaction costs or of the costs of intermediateinputs by reaching out to more efficient suppliers.Other firms may adopt e-commerce technologies todevelop new business practices and change theirway of interacting in the marketplace. Still othersimplement e-commerce technologies as a result ofpressures from customers and suppliers or simplyto remain competitive.
In terms of motivation, recent data for Europeancountries show that reaching new/more customersand geographical market expansion represent about30% and improving efficiency about 50%. Fear oflosing market share accounts for 20% at most. Forall, reaching new/more customers is generallyregarded as the leading motivation for engaging ine-commerce.
Statistical surveys can also be used to measurebarriers to electronic commerce transactions. Thebarriers and policy issues differ, depending onwhether the transactions involved are business-to-business or business-to-consumer. For the former,existing transaction models or tight links withcustomers and suppliers along the value chain maydiscourage businesses from introducing newmodels. Questions about the security or reliabilityof complex systems that can link all customers andsuppliers may also enter as a factor. Business-to-consumer transactions, instead, are typicallyhampered by concerns about security of payment,the possibility of redress in the on-lineenvironment and privacy of personal data. Otherfactors with considerable impact on thedevelopment of on-line consumer transactions areease and cost of access, convenience of shoppingon line and the appeal of customisation.
For countries for which data are available, theleading reason cited by businesses for not
conducting transactions electronically was a viewthat electronic commerce was not suited to thenature of their business. In Canada, amongbusinesses that did not buy or sell over the Internet,56% believed that their goods or services did notlend themselves to Internet transactions; 36%preferred to maintain their current business model.In Sweden, Finland, Italy and Spain, 40% to 50%of businesses with computers consider their goodsand services not to be well suited to e-commerce.This perceived barrier to Internet sales seems to bemore relevant for real estate services and lessrelevant for financial services. An insufficientcustomer base can also be a reason for businessesnot to embrace e-commerce, especially in Italywhere 35% of businesses perceived this to be animportant barrier.
In Canada a small share of enterprises that did notcarry out Internet commerce felt that security was aconcern (14%) or that the cost of development andmaintenance was too high (12%) (StatisticsCanada, 2001). In Europe, instead, major perceivedissues are security of payments, uncertainty incontracts and cost of development andmaintenance of an e-commerce system.
Security issues regarding handling of payments arenot surprising given the very small percentage ofsites that ensure secure transactions. These issuesare perceived to be most critical by smaller andmedium-sized enterprises in Italy, Spain, Austria,the United Kingdom, Finland and Greece. Largerbusinesses in Europe seem instead to be moreconcerned than smaller ones about logistics or costissues related to Internet commerce.
Many individuals in Australia, Turkey and theUnited States cited “lack of interest or no use forthe Internet” as a reason for not having Internetaccess at home. Security concerns are also asignificant barrier. In Australia, 29% of individualscited security as the primary reason for not makinga purchase over the Internet. Singapore users citedfear of fraud as the leading reason (InfocommDevelopment Authority of Singapore, 2000).

MEASURING THE INFORMATION ECONOMY 2002 71
© OECD 2002 71
Drivers and inhibitors of Internet commerce
Business motivations for Internet commerce, 2000
Percentage of businesses using a computer with 10 or more employees
0%
10%
20%
30%
40%
50%
60%
70%
80%
90%
100%
Austria Germany Greece Italy Luxembourg Portugal Spain Sw eden
Rel
ativ
e sh
are
Reaching new /more customers Geographic expans ion of market Speed of processing
Improvement of service quality Cost reductions Simpler business processes
Fear of losing market shares
Barriers to Internet commerce faced by businesses, 2000
Percentage of businesses using a computer with 10 or more employees
0
10
20
30
40
50
60
Italy Spain Austria Finland Greece Denmark Luxembourg Sweden UnitedKingdom
Portugal
%
Uncertainty in payments Uncertainty concerning contracts, terms of delivery and guarantees
Cost of developing and maintaining an e-commerce system Logistic problems
Barriers to Internet commerce faced by businesses, 2000
Percentage of businesses using a computer with 10 or more employees
0
10
20
30
40
50
60
Spain Finland Sweden Italy Austria UnitedKingdom
Portugal Greece Denmark Luxembourg
%
Consideration for existing channels of sales
Goods and services available not suitable for sales by e-commerce
Stock of (potential) customers too small
Source: Eurostat, E-commerce Pilot Survey 2001.
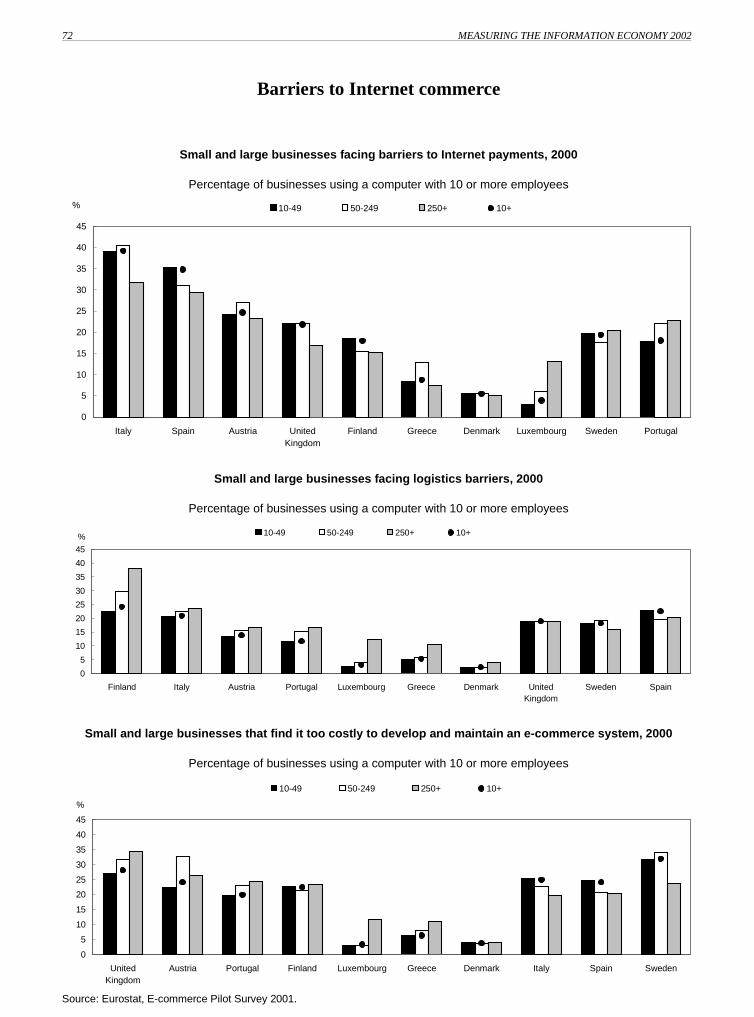
72 MEASURING THE INFORMATION ECONOMY 2002
© OECD 200272
Barriers to Internet commerce
Small and large businesses facing barriers to Internet payments, 2000
Percentage of businesses using a computer with 10 or more employees
0
5
10
15
20
25
30
35
40
45
Italy Spain Austria UnitedKingdom
Finland Greece Denmark Luxembourg Sweden Portugal
% 10-49 50-249 250+ 10+
Small and large businesses facing logistics barriers, 2000
Percentage of businesses using a computer with 10 or more employees
0
5
10
15
20
25
30
35
40
45
Finland Italy Austria Portugal Luxembourg Greece Denmark UnitedKingdom
Sweden Spain
% 10-49 50-249 250+ 10+
Small and large businesses that find it too costly to develop and maintain an e-commerce system, 2000
Percentage of businesses using a computer with 10 or more employees
0
5
10
15
20
25
30
35
40
45
UnitedKingdom
Austria Portugal Finland Luxembourg Greece Denmark Italy Spain Sweden
%
10-49 50-249 250+ 10+
Source: Eurostat, E-commerce Pilot Survey 2001.

MEASURING THE INFORMATION ECONOMY 2002 73
© OECD 2002 73
Barriers to Internet commerce
The nature of products is not suited for Internet sales, 2000
Percentage of businesses using a computer with 10 or more employees
0 10 20 30 40 50 60 70
Real estate
Commerce
Transport and communications
Manufacturing
Hotels and restaurants
Real estate
Manufacturing
Commerce
Transport and communications
Hotels and restaurants
Financial sector
Hotels and restaurants
Real estate
Commerce
Manufacturing
Transport and communications
Financial sector
Manufacturing
Commerce
Real estate
Transport and communications
Hotels and restaurants
Real estate
Commerce
Manufacturing
Financial sector
Transport and communications
Hotels and restaurants
%
United Kingdom
Finland
Spain
Austria
Italy 0 10 20 30 40 50 60 70 80
Transport and communications
Real estate
Commerce
Manufacturing
Financial sector
Hotels and restaurants
Hotels and restaurants
Real estate
Commerce
Manufacturing
Transport and communications
Commerce
Hotels and restaurants
Real estate
Manufacturing
Commerce
Hotels and restaurants
Transport and communications
Financial sector
Financial sector
Transport and communications
Commerce
Hotels and restaurants
Real estate
Manufacturing
%
Luxembourg
Greece
Germany
Denmark
Portugal
Source: Eurostat, E-commerce Pilot Survey 2001.

MEASURING THE INFORMATION ECONOMY 2002 75
© OECD 2002 75
Chapter V. ICT in education and government
Previous chapters have explored the diffusion of ICT among individuals and businesses. This chapter uses available indicators basedon official statistics to describe the uptake of new technologies in schools and public administrations.
The contribution of the information economy to overall economic growth assumes that the population has the skills needed to use thetechnology. Access to ICT in schools and use of ICT in education are extremely important for raising ICT awareness and fordeveloping an ICT skills base in the economy. For this reason, it is useful to monitor ICT developments in education systems. The firstindicators in this chapter make use of international studies undertaken at the OECD to compare some basic indicators of studentaccess to and use of computers.
ICT also affects governments by improving responsiveness, increasing efficiency and enhancing governance practices. Governmentscan encourage the diffusion of ICT through their supply of on-line services and their own use of new technologies. For these reasons,Member countries have expressed much interest in measuring and comparing government use of ICT. Unfortunately, there are as yetno harmonised official statistics on e-government in OECD countries., Therefore, this chapter only presents indicators for a limitednumber of countries. One of the problems with collecting internationally comparable statistics in this area is the heterogeneity ofgovernment units both within and across countries. Government organisations are quite varied in size and function, ranging from verysmall entities to huge government departments, hence it is difficult to harmonise the unit to be surveyed. With the increase in interestin the measurement of e-government, more official data will be collected over the coming years and hopefully a certain degree ofcomparability will be achieved.
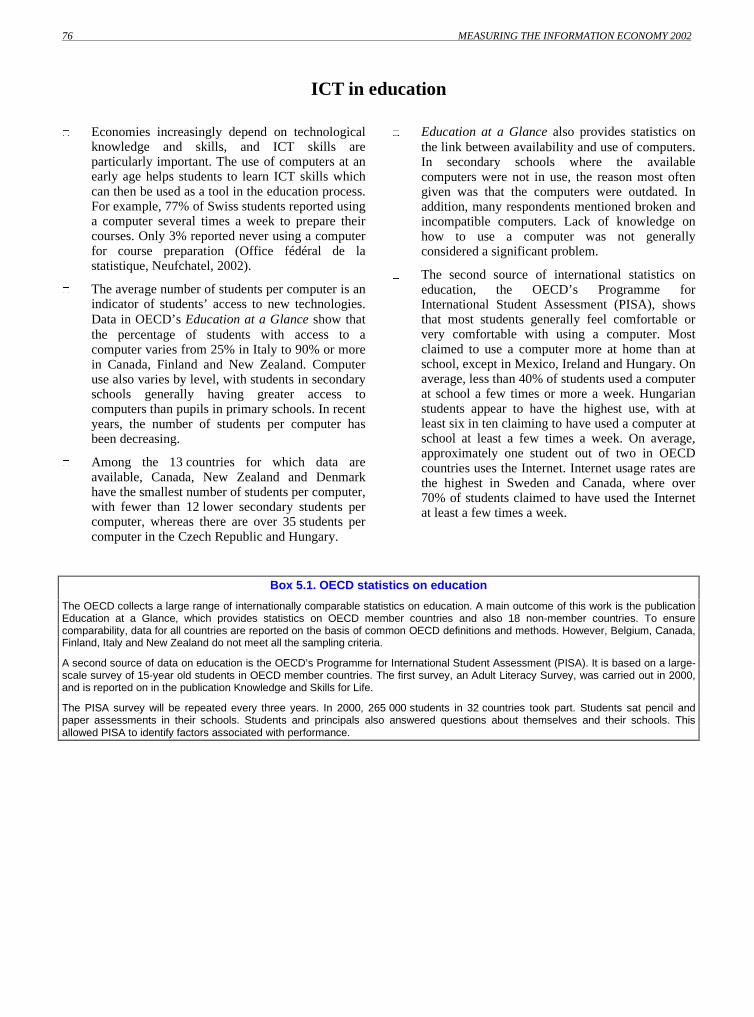
76 MEASURING THE INFORMATION ECONOMY 2002
© OECD 200276
ICT in education
Economies increasingly depend on technologicalknowledge and skills, and ICT skills areparticularly important. The use of computers at anearly age helps students to learn ICT skills whichcan then be used as a tool in the education process.For example, 77% of Swiss students reported usinga computer several times a week to prepare theircourses. Only 3% reported never using a computerfor course preparation (Office fédéral de lastatistique, Neufchatel, 2002).
The average number of students per computer is anindicator of students’ access to new technologies.Data in OECD’s Education at a Glance show thatthe percentage of students with access to acomputer varies from 25% in Italy to 90% or morein Canada, Finland and New Zealand. Computeruse also varies by level, with students in secondaryschools generally having greater access tocomputers than pupils in primary schools. In recentyears, the number of students per computer hasbeen decreasing.
Among the 13 countries for which data areavailable, Canada, New Zealand and Denmarkhave the smallest number of students per computer,with fewer than 12 lower secondary students percomputer, whereas there are over 35 students percomputer in the Czech Republic and Hungary.
Education at a Glance also provides statistics onthe link between availability and use of computers.In secondary schools where the availablecomputers were not in use, the reason most oftengiven was that the computers were outdated. Inaddition, many respondents mentioned broken andincompatible computers. Lack of knowledge onhow to use a computer was not generallyconsidered a significant problem.
The second source of international statistics oneducation, the OECD’s Programme forInternational Student Assessment (PISA), showsthat most students generally feel comfortable orvery comfortable with using a computer. Mostclaimed to use a computer more at home than atschool, except in Mexico, Ireland and Hungary. Onaverage, less than 40% of students used a computerat school a few times or more a week. Hungarianstudents appear to have the highest use, with atleast six in ten claiming to have used a computer atschool at least a few times a week. On average,approximately one student out of two in OECDcountries uses the Internet. Internet usage rates arethe highest in Sweden and Canada, where over70% of students claimed to have used the Internetat least a few times a week.
Box 5.1. OECD statistics on education
The OECD collects a large range of internationally comparable statistics on education. A main outcome of this work is the publicationEducation at a Glance, which provides statistics on OECD member countries and also 18 non-member countries. To ensurecomparability, data for all countries are reported on the basis of common OECD definitions and methods. However, Belgium, Canada,Finland, Italy and New Zealand do not meet all the sampling criteria.
A second source of data on education is the OECD’s Programme for International Student Assessment (PISA). It is based on a large-scale survey of 15-year old students in OECD member countries. The first survey, an Adult Literacy Survey, was carried out in 2000,and is reported on in the publication Knowledge and Skills for Life.
The PISA survey will be repeated every three years. In 2000, 265 000 students in 32 countries took part. Students sat pencil andpaper assessments in their schools. Students and principals also answered questions about themselves and their schools. Thisallowed PISA to identify factors associated with performance.
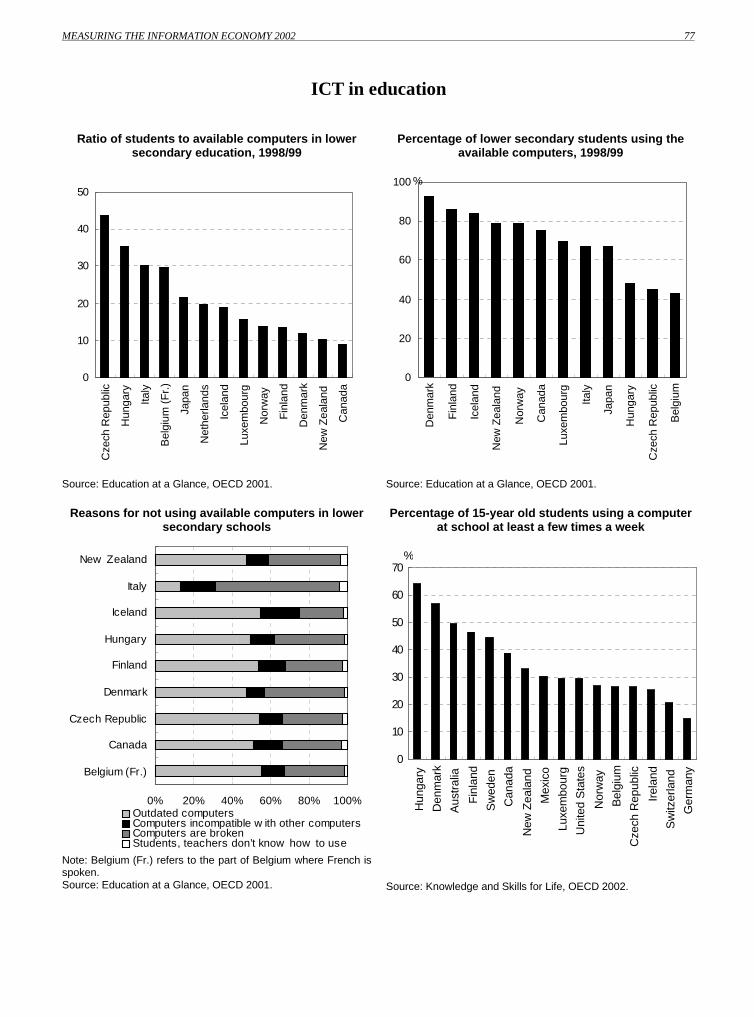
MEASURING THE INFORMATION ECONOMY 2002 77
© OECD 2002 77
ICT in education
Ratio of students to available computers in lowersecondary education, 1998/99
Percentage of lower secondary students using theavailable computers, 1998/99
0
10
20
30
40
50
Cze
ch R
epub
lic
Hun
gary
Italy
Bel
gium
(F
r.)
Japa
n
Net
herla
nds
Icel
and
Luxe
mbo
urg
Nor
way
Fin
land
Den
mar
k
New
Zea
land
Can
ada
Source: Education at a Glance, OECD 2001.
0
20
40
60
80
100
Den
mar
k
Fin
land
Icel
and
New
Zea
land
Nor
way
Can
ada
Luxe
mbo
urg
Italy
Japa
n
Hun
gary
Cze
ch R
epub
lic
Bel
gium
%
Source: Education at a Glance, OECD 2001.
Reasons for not using available computers in lowersecondary schools
Percentage of 15-year old students using a computerat school at least a few times a week
0% 20% 40% 60% 80% 100%
Belgium (Fr.)
Canada
Czech Republic
Denmark
Finland
Hungary
Iceland
Italy
New Zealand
Outdated computersComputers incompatible w ith other computersComputers are brokenStudents, teachers don’t know how to use
Note: Belgium (Fr.) refers to the part of Belgium where French isspoken.Source: Education at a Glance, OECD 2001.
0
10
20
30
40
50
60
70
Hun
gary
Den
mar
k
Aus
tral
ia
Fin
land
Sw
eden
Can
ada
New
Zea
land
Mex
ico
Luxe
mbo
urg
Uni
ted
Sta
tes
Nor
way
Bel
gium
Cze
ch R
epub
lic
Irel
and
Sw
itzer
land
Ger
man
y
%
Source: Knowledge and Skills for Life, OECD 2002.

78 MEASURING THE INFORMATION ECONOMY 2002
© OECD 200278
ICT in government
The Internet gives governments the opportunity tooffer public services and to provide informationand policies more efficiently. The more publicservices can be delivered through electronic media,such as the Internet, the larger the potentialsavings. Processing documents, such as licences,or collecting taxes electronically are examples ofsuch possibilities.
Few countries currently provide official data onICT in government, however. The AustralianBureau of Statistics conducted a survey ofgovernment use of IT in 1997/98 and again in1999/2000. The earlier results showed that thelarger the government department or agency, themore likely it was to have Internet access and aWeb site or home page.
Statistics Canada surveyed Internet and e-mailaccess in the public and private sectors in 2000 andfound that public sector enterprises were more
likely to have a Web page. Use of e-mail and theInternet was also more prevalent among employeesin the public sector.
Statistics published by the Japanese StatisticsBureau show that the number of employees per PCin the Japanese central government fell from 1.5 in1996 to 0.8 in 2000. There is considerablevariation across government functions, however. In2000, local branch offices of the centralgovernment still had, on average, 1.5 employeesper PC, whereas facilities and institutes (such asnational universities) had 0.5 employee per PC.
Data from Statistics Finland suggest that the use ofICT increased significantly from 1995 to 2000.Access for civil servants increased from 36% to85%, the share of government PCs withmultimedia capability increased from 5% in 1995to 42% in 2000, and in 2000 10% of allgovernment PCs were laptops.
Box 5.2. ICT in government
Governments in member countries recognise the benefits of ICT, in particular for enhancing good governance practices, being moreresponsive and governing more effectively. However statistics on ICT use in government are scarce. Countries such as Australia,Canada, Denmark, Finland, Japan, and the United Kingdom are collecting data on government use of ICT but, because of differencesin the focus and timing of the surveys and the phrasing of the questions, the data currently available are not always internationallycomparable. It will only become possible to draw valid international comparisons when agreement is reached on core indicators in thisarea.

MEASURING THE INFORMATION ECONOMY 2002 79
© OECD 2002 79
ICT in government
Government Internet access and Web sites inAustralia, 1997/98
Internet and e-mail access in Canada’s public andprivate sectors, 2000
0
20
40
60
80
100
1-19 20-99 100-499 500-999 1000-4999
5000+
Persons employed
% Internet access Web site/home page
Source: Australian Bureau of Statistics (1999), "Government Useof Information Technology", 8119.0, Canberra.
0
20
40
60
80
100
Publicsector -Internet
Privatesector -Internet
Publicsector -e-mail
Privatesector -e-mail
Public Private
%
Employees with access to Firms with a Web site
Source: Statistics Canada (2001), "Electronic Commerce andTechnology Use", Connectedness Series, Ottawa, September.
Employees per PC in Japan’s central government, FY1996-2000
ICT use in the Finnish government, 1995 and 2000
0
0.5
1
1.5
2
2.5
3
3.5
1996 1997 1998 1999 2000
Local branch officesMinistries and agenciesTotal central governmentFacilities and institutes
Source: Administrative Management Bureau (2001), BasicSurvey on the Progress of Government ICT Use, Tokyo.
0
20
40
60
80
100
Civil servants w ithaccess to Internet
Share of PCs w ithmultimedia
Share of laptops
1995 2000
%
Source: Statistics Finland (2001), On the Road to the FinnishInformation Society III, Helsinki.


MEASURING THE INFORMATION ECONOMY 2002 81
© OECD 2002 81
ANNEX 1. THE OECD DEFINITION OF THE ICT SECTOR
In 1998, OECD member countries agreed to define the ICT sector as a combination of manufacturing and servicesindustries that capture, transmit and display data and information electronically. This definition, based on aninternational standard classification of activities (ISIC Rev. 3), was considered to be a first step towards obtainingsome initial measurements of ICT sector core indicators.
The principles underlying the definition are the following:
For manufacturing industries, the products of a candidate industry:
• Must be intended to fulfil the function of information processing and communication including transmissionand display.
• Must use electronic processing to detect, measure and/or record physical phenomena or control a physicalprocess.
For services industries, the products of a candidate industry:
• Must be intended to enable the function of information processing and communication by electronic means.
The ISIC Rev. 3 classes included in the definition are:
Manufacturing: 3000 – Office, accounting and computing machinery; 3130 – Insulated wire and cable; 3210 –Electronic valves and tubes and other electronic components; 3220 – Television and radio transmitters and apparatusfor line telephony and line telegraphy; 3230 – Television and radio receivers, sound or video recording or reproducingapparatus and associated goods; 3312 – Instruments and appliances for measuring, checking, testing, navigating andother purposes, except industrial process equipment; 3313 – Industrial process equipment.
Services: 5150 – Wholesaling of machinery, equipment and supplies (if possible only the wholesaling of ICT goodsshould be included); 7123 – Renting of office machinery and equipment (including computers); 6420 –Telecommunications; 72 – Computer and related activities.
The OECD’s 1998 activity-based definition of ICT was reviewed in April 2002. It was decided that, although thisdefinition gives only a first approximation of the ICT sector, it should not be changed at this stage; rather itsimplementation should be improved with the help of more detailed national classifications. This decision is subject toreconsideration at a later date and in the context of the major revision of ISIC to be undertaken in 2007. The onlyminor modification to the OECD ICT sector definition is to take into account the split of ISIC 5150 (Wholesaling ofmachinery, equipment and supplies) that was introduced in the ISIC Rev. 3.1 of 2002, i.e. class 5151, “Wholesale ofcomputers, computer peripheral equipment and software”, and class 5152, “Wholesale of electronic andtelecommunication parts and equipment".
One important feature of the OECD ICT sector definition is that it breaks the traditional ISIC dichotomy betweenmanufacturing and services activities. Activities producing or distributing ICT products can be found everywhere inthe economy. Moreover, by identifying the key sectors whose main activity is producing or distributing ICT products,this definition constitutes a first order approximation of the "ICT producing sector". In 1998, it was recognised that anactivity-based definition should be complemented by an ICT products classification. Mapping products to activitieswould allow a more precise quantification of ICT-related production, value added and employment, both within thecore ICT sectors and in other sectors of the economy. The OECD is currently working on an ICT productsclassification.
82 MEASURING THE INFORMATION ECONOMY 2002
© OECD 200282
The existence of a widely accepted definition of the ICT sector is the first step towards comparisons across time andcountries. However, the definition is not yet consistently applied. Table A.1 shows the concordance between ISICRev. 3 ICT sector classes and national classifications used by member countries to report business survey data on theICT sector (gross fixed capital formation, employment, production, value added, wages and salaries). Tables with corebusiness survey statistics on the ICT sector, as well as detailed metadata on every country and variable, will bepublished in the electronic version of Measuring the Information Economy 2002 (www.oecd.org/sti/measuring-infoeconomy).
The ICT sector business survey data provided by member countries have been combined with different data sources toestimate ICT aggregates compatible with national accounts totals. For this reason, the charts presented in Measuringthe Information Economy 2002 are based on data that may differ from figures contained in national reports and inprevious OECD publications.
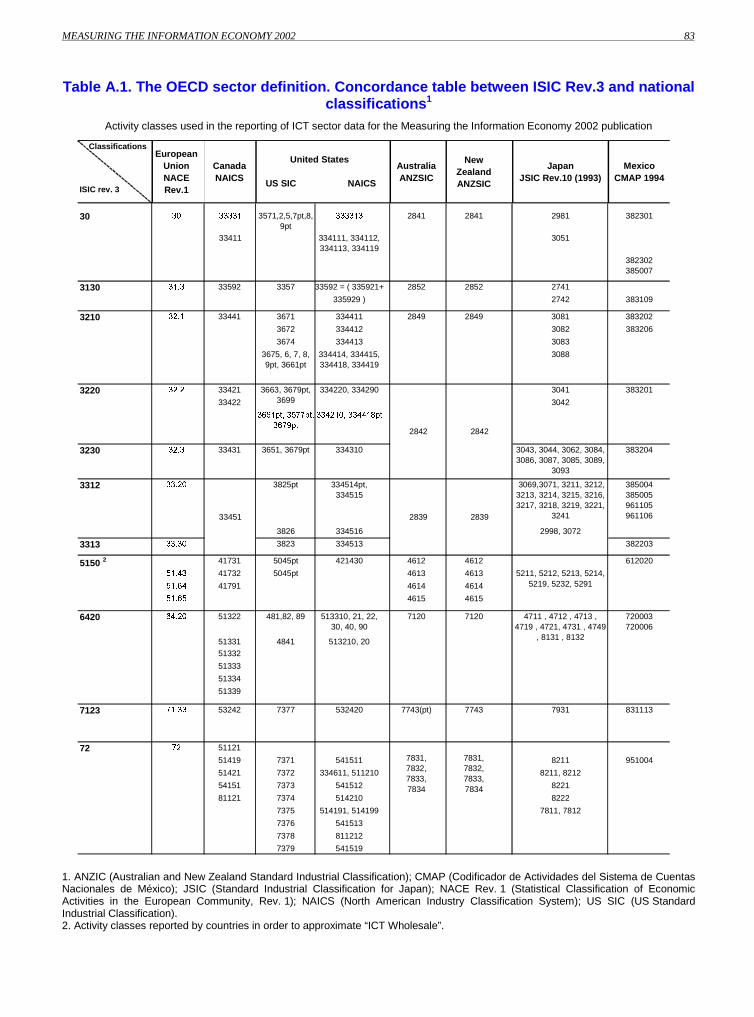
MEASURING THE INFORMATION ECONOMY 2002 83
© OECD 2002 83
Table A.1. The OECD sector definition. Concordance table between ISIC Rev.3 and nationalclassifications1
Activity classes used in the reporting of ICT sector data for the Measuring the Information Economy 2002 publication
Classifications
ISIC rev. 3
European UnionNACE Rev.1
CanadaNAICS
�
AustraliaANZSIC
New ZealandANZSIC
JapanJSIC Rev.10 (1993)
MexicoCMAP 1994
30 �� 3571,2,5,7pt,8,9pt
������ 2841 2841 2981 382301
334111, 334112, 334113, 334119
3051
382302 385007
3130 ���� 33592 3357 33592 = ( 335921+ 2852 2852 2741
335929 ) 2742 383109
3210 ���� 33441 3671 334411 2849 2849 3081 383202
3672 334412 3082 383206
3674 334413 3083
3675, 6, 7, 8, 9pt, 3661pt
3088
3220 ���� 33421 334220, 334290 3041 383201
33422 3042
��������������� ��
��������������
3230 ���� 33431 3651, 3679pt 334310
3312 ����� 3825pt 334514pt, 334515
3069,3071, 3211, 3212, 3213, 3214, 3215, 3216, 3217, 3218, 3219, 3221,
3241
385004 385005 961105 961106
3826 334516 2998, 3072
3313 ����� 3823 334513 382203
5150 2 41731 5045pt 421430 4612 4612 612020
����� 41732 5045pt 4613 4613
����� 41791 4614 4614
����� 4615 4615
6420 ����� 51322 481,82, 89 513310, 21, 22, 30, 40, 90
7120 7120
51331 4841 513210, 2051332
51333
51334
51339
7123 ����� 53242 7377 532420 7743(pt) 7743 7931 831113
72 �� 51121
51419 7371 541511 8211 951004
51421 7372 334611, 511210 8211, 8212
54151 7373 541512 8221
81121 7374 514210 8222
7375 514191, 514199 7811, 7812
7376 541513
7378 811212
7379 541519
5211, 5212, 5213, 5214, 5219, 5232, 5291
334414, 334415, 334418, 334419
383204
720003 720006
4711 , 4712 , 4713 , 4719 , 4721, 4731 , 4749
, 8131 , 8132
2839 283933451
7831,7832,7833,7834
7831,7832,7833,7834
United States
US SIC NAICS
2842
�����
33411
2842
3663, 3679pt, 3699
3043, 3044, 3062, 3084, 3086, 3087, 3085, 3089,
3093
1. ANZIC (Australian and New Zealand Standard Industrial Classification); CMAP (Codificador de Actividades del Sistema de CuentasNacionales de México); JSIC (Standard Industrial Classification for Japan); NACE Rev. 1 (Statistical Classification of EconomicActivities in the European Community, Rev. 1); NAICS (North American Industry Classification System); US SIC (US StandardIndustrial Classification).2. Activity classes reported by countries in order to approximate “ICT Wholesale”.

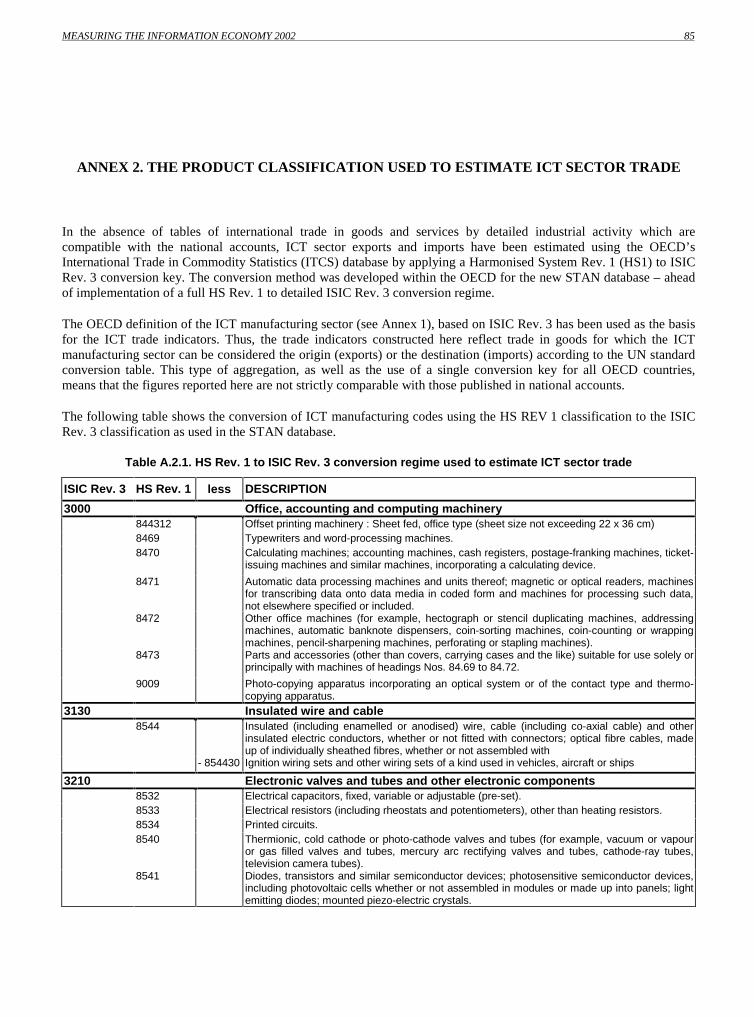
MEASURING THE INFORMATION ECONOMY 2002 85
© OECD 2002 85
ANNEX 2. THE PRODUCT CLASSIFICATION USED TO ESTIMATE ICT SECTOR TRADE
In the absence of tables of international trade in goods and services by detailed industrial activity which arecompatible with the national accounts, ICT sector exports and imports have been estimated using the OECD’sInternational Trade in Commodity Statistics (ITCS) database by applying a Harmonised System Rev. 1 (HS1) to ISICRev. 3 conversion key. The conversion method was developed within the OECD for the new STAN database – aheadof implementation of a full HS Rev. 1 to detailed ISIC Rev. 3 conversion regime.
The OECD definition of the ICT manufacturing sector (see Annex 1), based on ISIC Rev. 3 has been used as the basisfor the ICT trade indicators. Thus, the trade indicators constructed here reflect trade in goods for which the ICTmanufacturing sector can be considered the origin (exports) or the destination (imports) according to the UN standardconversion table. This type of aggregation, as well as the use of a single conversion key for all OECD countries,means that the figures reported here are not strictly comparable with those published in national accounts.
The following table shows the conversion of ICT manufacturing codes using the HS REV 1 classification to the ISICRev. 3 classification as used in the STAN database.
Table A.2.1. HS Rev. 1 to ISIC Rev. 3 conversion regime used to estimate ICT sector trade
ISIC Rev. 3 HS Rev. 1 less DESCRIPTION
3000 Office, accounting and computing machinery844312 Offset printing machinery : Sheet fed, office type (sheet size not exceeding 22 x 36 cm)8469 Typewriters and word-processing machines.8470 Calculating machines; accounting machines, cash registers, postage-franking machines, ticket-
issuing machines and similar machines, incorporating a calculating device.
8471 Automatic data processing machines and units thereof; magnetic or optical readers, machinesfor transcribing data onto data media in coded form and machines for processing such data,not elsewhere specified or included.
8472 Other office machines (for example, hectograph or stencil duplicating machines, addressingmachines, automatic banknote dispensers, coin-sorting machines, coin-counting or wrappingmachines, pencil-sharpening machines, perforating or stapling machines).
8473 Parts and accessories (other than covers, carrying cases and the like) suitable for use solely orprincipally with machines of headings Nos. 84.69 to 84.72.
9009 Photo-copying apparatus incorporating an optical system or of the contact type and thermo-copying apparatus.
3130 Insulated wire and cable8544 Insulated (including enamelled or anodised) wire, cable (including co-axial cable) and other
insulated electric conductors, whether or not fitted with connectors; optical fibre cables, madeup of individually sheathed fibres, whether or not assembled with
- 854430 Ignition wiring sets and other wiring sets of a kind used in vehicles, aircraft or ships
3210 Electronic valves and tubes and other electronic components8532 Electrical capacitors, fixed, variable or adjustable (pre-set).8533 Electrical resistors (including rheostats and potentiometers), other than heating resistors.8534 Printed circuits.8540 Thermionic, cold cathode or photo-cathode valves and tubes (for example, vacuum or vapour
or gas filled valves and tubes, mercury arc rectifying valves and tubes, cathode-ray tubes,television camera tubes).
8541 Diodes, transistors and similar semiconductor devices; photosensitive semiconductor devices,including photovoltaic cells whether or not assembled in modules or made up into panels; lightemitting diodes; mounted piezo-electric crystals.
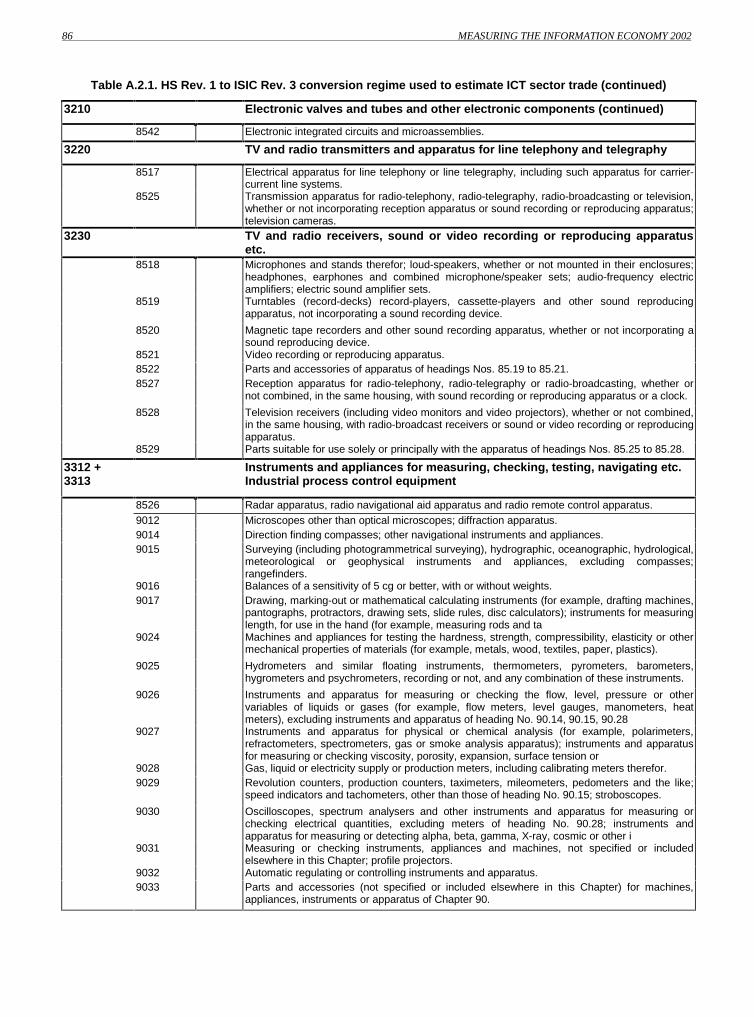
86 MEASURING THE INFORMATION ECONOMY 2002
© OECD 200286
Table A.2.1. HS Rev. 1 to ISIC Rev. 3 conversion regime used to estimate ICT sector trade (continued)
3210 Electronic valves and tubes and other electronic components (continued)
8542 Electronic integrated circuits and microassemblies.
3220 TV and radio transmitters and apparatus for line telephony and telegraphy
8517 Electrical apparatus for line telephony or line telegraphy, including such apparatus for carrier-current line systems.
8525 Transmission apparatus for radio-telephony, radio-telegraphy, radio-broadcasting or television,whether or not incorporating reception apparatus or sound recording or reproducing apparatus;television cameras.
3230 TV and radio receivers, sound or video recording or reproducing apparatusetc.
8518 Microphones and stands therefor; loud-speakers, whether or not mounted in their enclosures;headphones, earphones and combined microphone/speaker sets; audio-frequency electricamplifiers; electric sound amplifier sets.
8519 Turntables (record-decks) record-players, cassette-players and other sound reproducingapparatus, not incorporating a sound recording device.
8520 Magnetic tape recorders and other sound recording apparatus, whether or not incorporating asound reproducing device.
8521 Video recording or reproducing apparatus.8522 Parts and accessories of apparatus of headings Nos. 85.19 to 85.21.8527 Reception apparatus for radio-telephony, radio-telegraphy or radio-broadcasting, whether or
not combined, in the same housing, with sound recording or reproducing apparatus or a clock.
8528 Television receivers (including video monitors and video projectors), whether or not combined,in the same housing, with radio-broadcast receivers or sound or video recording or reproducingapparatus.
8529 Parts suitable for use solely or principally with the apparatus of headings Nos. 85.25 to 85.28.
3312 +3313
Instruments and appliances for measuring, checking, testing, navigating etc.Industrial process control equipment
8526 Radar apparatus, radio navigational aid apparatus and radio remote control apparatus.9012 Microscopes other than optical microscopes; diffraction apparatus.9014 Direction finding compasses; other navigational instruments and appliances.9015 Surveying (including photogrammetrical surveying), hydrographic, oceanographic, hydrological,
meteorological or geophysical instruments and appliances, excluding compasses;rangefinders.
9016 Balances of a sensitivity of 5 cg or better, with or without weights.9017 Drawing, marking-out or mathematical calculating instruments (for example, drafting machines,
pantographs, protractors, drawing sets, slide rules, disc calculators); instruments for measuringlength, for use in the hand (for example, measuring rods and ta
9024 Machines and appliances for testing the hardness, strength, compressibility, elasticity or othermechanical properties of materials (for example, metals, wood, textiles, paper, plastics).
9025 Hydrometers and similar floating instruments, thermometers, pyrometers, barometers,hygrometers and psychrometers, recording or not, and any combination of these instruments.
9026 Instruments and apparatus for measuring or checking the flow, level, pressure or othervariables of liquids or gases (for example, flow meters, level gauges, manometers, heatmeters), excluding instruments and apparatus of heading No. 90.14, 90.15, 90.28
9027 Instruments and apparatus for physical or chemical analysis (for example, polarimeters,refractometers, spectrometers, gas or smoke analysis apparatus); instruments and apparatusfor measuring or checking viscosity, porosity, expansion, surface tension or
9028 Gas, liquid or electricity supply or production meters, including calibrating meters therefor.9029 Revolution counters, production counters, taximeters, mileometers, pedometers and the like;
speed indicators and tachometers, other than those of heading No. 90.15; stroboscopes.
9030 Oscilloscopes, spectrum analysers and other instruments and apparatus for measuring orchecking electrical quantities, excluding meters of heading No. 90.28; instruments andapparatus for measuring or detecting alpha, beta, gamma, X-ray, cosmic or other i
9031 Measuring or checking instruments, appliances and machines, not specified or includedelsewhere in this Chapter; profile projectors.
9032 Automatic regulating or controlling instruments and apparatus.9033 Parts and accessories (not specified or included elsewhere in this Chapter) for machines,
appliances, instruments or apparatus of Chapter 90.
MEASURING THE INFORMATION ECONOMY 2002 87
© OECD 2002 87
ANNEX 3. THE OECD MODEL SURVEY OF ICT USAGE IN THE BUSINESS SECTOR
Since 1999, the WPIIS has worked with the Voorburg Group (the United Nations City Group on Service Statistics)and Eurostat to develop a model questionnaire on the use of ICT goods and services in the business enterprise sector.The activity was led by the statistical offices of the Nordic countries (Denmark, Finland, Iceland, Norway andSweden), which were the first to establish a project for a common set of guidelines to measure ICT usage inenterprises.
After two years of sharing and testing, a model questionnaire on ICT usage in the business sector was approved by theOECD in 2001 [DSTI/ICCP/IIS(2001)1/REV1]. The questionnaire is intended to provide guidance for themeasurement of indicators of ICT, Internet use and electronic commerce, and is composed of separate, self-containedmodules to ensure flexibility and adaptability to a rapidly changing environment. While the use of “core” modulesmakes measurement on an internationally comparable basis possible, additional modules can be added to respond toevolving or country-specific policy needs. The five core modules in the current version of the OECD modelquestionnaire are:
A. General information about ICT systems. These questions relate to the type of computer-mediated devices,applications or networks used in the enterprise. They also measure the extent to which employees use personalcomputers (PCs) and the Internet in their daily work.
B. Use of the Internet. The module first focuses on the type of connection used and its speed. It then turns to thebusiness processes for which the Internet is used. At this stage, the indicators mainly relate to information- andcommunication-intensive activities (e.g. information search, banking and financial activities, etc.) and to businessprocesses that involve transactions over the Internet. A distinction is made, and separate questions are asked about,processes relating to purchases (the enterprise as a customer) and sales (the enterprise as a provider) of goods andservices. In the case of selling-related activities, the indicators are restricted to the functionality of the enterprise’sWeb site in order to focus on innovative ways of marketing, managing information, selling and providing paymentfacilities and other interactive services to customers.
C and D. Electronic commerce: Internet transactions and electronic transactions via EDI and other computer-mediated networks. Drawing on OECD work to define and measure electronic commerce (see the box on thedefinitions of electronic transactions), the questionnaire contains two modules on electronic commerce transactions.Module C measures indicators for Internet sales and purchases. Questions relating to the monetary amount of thetransactions or their breakdown by customer and geographical destination, are expressed in terms of percentage oftotal sales or purchases in order to maximise the response rate. In general, statistical offices will be able to use thatinformation to provide estimates of the monetary amount of the electronic transactions. EDI (electronic datainterchange) and other computer-mediated networks are traditionally used to conduct electronic transactions.Module D aims at better monitoring the development of new forms of sales by separating the turnover of Internetsales from that of other types of computer-mediated networks. The scope of EDI should be restricted to proprietaryEDI and EDIFACT. Ideally, EDI transactions transported over the Internet and in the HTML-based format, XML,should be included in module C (electronic commerce via the Internet). This would allow countries to monitor themigration towards Internet technologies and the substitution between computer-mediated transactions and Internettransactions.
E. Barriers to the use of the Internet to sell goods and services, and barriers to the use of the Internet and ICT ingeneral. While information about perceived barriers may not traditionally be collected as part of official statisticalsurveys, it is important for policy makers. For example, indicators on barriers can help in monitoring issues of digitaldivide, potential bottlenecks related to the technology, lack of appropriate skills, or concerns about security andlogistics. Answers about perceived barriers and their evaluation (e.g. no importance – some importance – muchimportance) are inevitably qualitative in nature and limit the use of these indicators for purposes of international

88 MEASURING THE INFORMATION ECONOMY 2002
© OECD 200288
comparisons. Nevertheless, they can aid in detecting common obstacles to the diffusion of new informationtechnologies and may be used with other types of quantitative indicators to explain differences in the intensity of useof new technologies across countries.
The questions presented in the OECD model questionnaire mainly take a qualitative approach to the need forinternationally comparable ICT usage statistics. The questions primarily focus on the use of ICT, especially theInternet, as a tool and on the barriers to its use. At the moment, the model does not contain questions on the impact ofICT use on enterprises’ organisation, production processes and skills, or quantitative questions such as investment inICT goods and services. This is because the model has been designed to cover a core set of initial indicators related tothe “readiness” and “intensity” of use of ICT and to limit the response burden. As the diffusion and impact of ICTincrease, and as experience is gained in the measurement of internationally comparable indicators, new modulescovering “impact” and quantitative indicators will be tested and added to the questionnaire. The modules related to“readiness” and “intensity” of use of ICT will need to be revised and updated to take into account the emergence ofnew technologies and ICT-related services.

MEASURING THE INFORMATION ECONOMY 2002 89
ANNEX 4. THE OECD DEFINITIONS OF INTERNET AND E-COMMERCE TRANSACTIONS
In April 2000, OECD member countries endorsed two definitions of electronic transactions (electronic orders), basedon narrower and broader definitions of the communications infrastructure. According to the OECD definitions, themethod by which the order is placed or received, not the payment or the channel of delivery, determines whether thetransaction is an Internet transaction (conducted over the Internet) or an electronic transaction (conducted overcomputer-mediated networks). In 2001, the OECD developed guidelines for interpreting the definitions of electroniccommerce and encouraged member countries to take such guidelines into account when developing theirquestionnaires.
Table A.4.1. The OECD definition of electronic commerce transactions and guidelines for their application
E-commerce transactions
OECD definitionsGuidelines for the interpretation f the definitions (WPIIS proposal April 2001)
BROAD definition
An electronic transaction is the sale or purchase of goods or services, w hether betw een businesses, households, individuals, governments, and other public or private organisations, conducted over computer-mediated networks . The goods and services are ordered over those netw orks, but the payment and the ultimate delivery of the good or setrvice may be conducted on or off-line.
Include: orders received or placed on any online application used in automated transactions such as Internet applications, EDI, Minitel or interactive telephone systems.
NARROW definition
An Internet transaction is the sale or purchase of goods or services, w hether betw een businesses, households, individuals, governments, and other public or private organisations, conducted over the Internet.The goods and services are ordered over those netw orks, but the payment and the ultimate delivery of the good or setrvice may be conducted on or off-line.
Include: orders received or placed on any Internet application used in automated transactions such as Web pages, Extranets and other applications that run over the Internet, such as EDI over the Internet, Minitel over the Internet, or over any other Web enable application regardless of how the Web is accessed (e.g. through a mobile or a TV set, etc.). Exclude: orders received or placed by telephone, facsimile or conventional e-mail.
Although OECD member countries have agreed on two definitions of electronic commerce transactions and on somegeneral guidelines for their interpretation, several issues remain open and continue to be discussed. The definitions andguidelines will be reviewed in light of their statistical feasibility. Some of the issues still to be debated relate todefinitional issues and some to the structure of member countries’ data collection programmes. They include:
� How to measure electronic commerce transactions in the financial sector. Ideally, one would collect only thevalue of fees on those transactions. Some countries avoid the problem by not surveying the sector (e.g. theNordic countries), but this poses a problem of differences in survey coverage.
� Assuming that organisations will not necessarily know the value of electronic commerce transactionsundertaken on their behalf, how to capture this information. For example, the Canadian 2000 survey excludessales of an organisation’s goods and services by agents as well as those for which the respondent is an agent.
90 MEASURING THE INFORMATION ECONOMY 2002
� What income concept to use to produce an indicator on electronic commerce sales as a ratio of total sales,e.g. operating revenue, turnover, sales. Should it vary according to the sector for which transactions aremeasured?
Examples of issues relating to the structure of countries’ data collection programmes are:
� Relatively few businesses or households may currently engage in electronic commerce, so the absolute numbersappearing in samples of businesses or households are likely to be small.
� Some key industries may consist of a small number of businesses, making it difficult to publish statistics that donot disclose confidential information.
� Recently, many businesses have entered and exited electronic commerce activities and changed the nature ofthose activities relatively quickly when looked at in the light of the rate at which governments update thebusiness registers from which they draw their samples.
� Many electronic commerce transactions of interest occur within businesses, but data collection programmestypically focus on transactions between and not within businesses.
Survey vehicles differ in coverage (sector and firm sampling) as well as in timing. Some business surveys are based onenterprises, some on establishments (this adds the problem of double counting the value of transactions whencalculating a total). Values of purchases measured from household surveys raise the problem that the personinterviewed responds on behalf of other individuals in the household. Even purchases measured by surveys ofindividuals require the choice of a common reference period for the transaction.
MEASURING THE INFORMATION ECONOMY 2002 91
© OECD 2002 91
ANNEX 5. MAIN OECD DATABASES USED
DATABASES MAINTAINED BY THE DIRECTORATE FOR SCIENCE, TECHNOLOGY ANDINDUSTRY (DSTI)
Industrial structure and performance
STAN: The database for Industrial Analysis provides analysts and researchers with a comprehensive tool foranalysing industrial performance at a relatively detailed level of activity across countries. It includes annual measuresof output, labour input, investment and international trade which allow users to construct a wide range of indicatorsfocused on areas such as productivity growth, competitiveness and general structural change. The industry listprovides sufficient details to enable users to highlight high-technology sectors and is compatible with those used inrelated OECD databases.
STAN is primarily based on member countries’ annual National Accounts by activity tables and uses data from othersources, such as national industrial surveys/censuses, to estimate any missing detail. Since many of the data points inSTAN are estimated, they do not represent the official member country submissions.
The latest version of STAN is based on the International Standard Industrial Classification (ISIC) Rev. 3 and has beenexpanded to cover all activities (including services) and a wider range of variables - it has effectively been mergedwith the OECD’ s International Sectoral Database (ISDB) which is no longer updated. Further details on STAN areavailable on the Internet at: www.oecd.org/sti/stan.
Publication: STAN is available on line on SourceOECD (www.sourceoecd.org). It is updated on a rolling basis(i.e. new tables are posted as soon as they are ready) rather than published as an annual snapshot, in order to improvetimeliness.
Science and technology
R&D and TBP: The R&D database contains the full results of the OECD surveys on R&D expenditure andpersonnel from the 1960s. The TBP database presents information on the technology balance of payments. Thesedatabases serve, inter alia, as the raw material for both the ANBERD and MSTI databases.
Publication: OECD (2001), Basic Science and Technology Statistics: 2000 Edition. Annual on CD-ROM (a printededition is also available every two years).
MSTI: The Main Science and Technology Indicators database provides a selection of the most frequently usedannual data on the scientific and technological performance of OECD member countries and seven non-membereconomies (China, Israel, Romania, the Russian Federation, Singapore, Slovenia, Chinese Taipei). The indicators,expressed in the form of ratios, percentages, growth rates, cover resources devoted to R&D, patent families,technology balance of payments and international trade in highly R&D-intensive industries.
Publication: OECD (2002), Main Science and Technology Indicators 2002/1. Biannual. Also available on CD-ROM.
92 MEASURING THE INFORMATION ECONOMY 2002
© OECD 200292
ANBERD: The Analytical Business Enterprise Research and Development database is an estimated databaseconstructed with a view to creating a consistent data set that overcomes the problems of international comparabilityand time discontinuity associated with the official business enterprise R&D data provided to the OECD by its membercountries. ANBERD contains R&D expenditures for the period 1987-2000, by industry (ISIC Rev. 3), for 19 OECDcountries.
Publication: OECD (2002), Research and Development Expenditure in Industry, 1987-2000. Annual. Also availableon diskette.
Patent database: This database contains patents filed at the largest national patent offices – European Patent Office(EPO); US Patent and Trademark Office (USPTO); Japanese Patent Office (JPO) – and other national or regionaloffices. Each patent is referenced by: patent numbers and dates (publication, application and priority); names andcountries of residence of the applicants and of the inventors; and technological categories, using the national patentclassification as well as the International Patent Classification (IPC). The compiled indicators mainly refer to singlepatent counts in a selected patent office, as well as counts of “triadic” patent families (patents filed at the EPO, theUSPTO and the JPO to protect a single invention).
The series are published on a regular basis in OECD, Main Science and Technology Indicators.
Globalisation and international trade
AFA: The Activities of Foreign Affiliates database presents detailed data on the performance of foreign affiliates in themanufacturing industry of OECD countries (inward and outward investment). The data indicate the increasing importance offoreign affiliates in the economies of host countries, particularly in production, employment, value added, research anddevelopment, exports, wages and salaries. AFA contains 18 variables broken down by country of origin and by industrial sector(based on ISIC Rev. 3) for 18 OECD countries.
Publication: OECD, Measuring Globalisation: The Role of Multinationals in OECD Economies, 2001 Edition. Vol. I:Manufacturing. Biennial.
FATS: This database gives detailed data on the activities of foreign affiliates in the services sector of OECD countries (inwardand outward investment). The data indicate the increasing importance of foreign affiliates in the economies of host countries and ofaffiliates of national firms implanted abroad. FATS contains five variables (production, employment, value added, imports andexports) broken down by country of origin (inward investments) or implantation (outward investments) and by industrial sector(based on ISIC Rev. 3) for 19 OECD countries.
Publication: OECD, Measuring Globalisation: The Role of Multinationals in OECD Economies, 2001 Edition. Vol. II: Services.Biennial.
Bilateral Trade (BTD): This database for industrial analysis includes detailed trade flows by manufacturing industry between a setof OECD declaring countries and a selection of partner countries and geographical regions. Data are presented in thousands ofUSD at current prices, and cover the period 1988-2000. The data have been derived from the OECD database International Tradeby Commodities Statistics (ITCS - formerly Foreign Trade Statistics or FTS). Imports and exports are grouped according to thecountry of origin and the country of destination of the goods. The data have been converted from product classification schemes toan activity classification scheme based on ISIC Rev. 3, that matches the classification currently used for the OECD’s STAN,Input-Output tables and ANBERD databases.
Publication: OECD (forthcoming), Bilateral Trade Database, 2002. Only available on diskette.
Information and communication technology (ICT)
Telecommunications: This database is produced in association with the biennial Communications Outlook. Itprovides time-series data covering all OECD countries, where available, for the period 1980-2000. It contains bothtelecommunication and economic indicators.
Publication: OECD (2001), Telecommunications Database 2001. Only available on diskette and CD-ROM.

MEASURING THE INFORMATION ECONOMY 2002 93
© OECD 2002 93
ICT: Work is under way to develop a database on ICT supply and ICT usage statistics. Statistics on employment,value added, production, wages and salaries, number of enterprises, R&D, imports and exports for the ICT sector arebeen collected following the OECD ICT sector definition based on ISIC Rev. 3.
Publication: OECD (2002), Measuring the Information Economy, 2002. Selected indicators of ICT usage and supplyare contained in the Science, Technology and Industry Scoreboard, 2001. Freely available as a Web book with"clickable" access to the data used in charts and figures at: www.oecd.org/sti/statistical-analysis.
Further details on these databases are available on the Internet at:http://www.oecd.org/EN/statistics/0,,EN-statistics-54-1-no-no-no-0,00.html.
Table A.5.1. Current country coverage of main DSTI databases used in this publication
Industry Science & technology Globalisation ICTSTAN R&D TBP MSTI ANBERD Patents AFA FATS BTD Telecom.
Australia ✓ ✓ ✓ ✓ ✓ ✓ ✓
Austria ✓ ✓ ✓ ✓ ✓ ✓ ✓ ✓
Belgium ✓ ✓ ✓ ✓ ✓ ✓ ✓ ✓ ✓
Canada ✓ ✓ ✓ ✓ ✓ ✓ ✓ ✓ ✓
Czech Republic ✓ ✓ ✓ ✓ ✓ ✓ ✓ ✓ ✓
Denmark ✓ ✓ ✓ ✓ ✓ ✓ ✓
Finland ✓ ✓ ✓ ✓ ✓ ✓ ✓ ✓ ✓ ✓
France ✓ ✓ ✓ ✓ ✓ ✓ ✓ ✓ ✓ ✓
Germany ✓ ✓ ✓ ✓ ✓ ✓ ✓ ✓ ✓ ✓
Greece ✓ ✓ ✓ ✓ ✓
Hungary ✓ ✓ ✓ ✓ ✓ ✓ ✓
Iceland ✓ ✓ ✓ ✓ ✓
Ireland ✓ ✓ ✓ ✓ ✓ ✓ ✓ ✓
Italy ✓ ✓ ✓ ✓ ✓ ✓ ✓ ✓ ✓ ✓
Japan ✓ ✓ ✓ ✓ ✓ ✓ ✓ ✓ ✓ ✓
Korea ✓ ✓ ✓ ✓ ✓ ✓ ✓
Luxembourg ✓ ✓ ✓ ✓ ✓ ✓
Mexico ✓ ✓ ✓ ✓ ✓ ✓ ✓ ✓
Netherlands ✓ ✓ ✓ ✓ ✓ ✓ ✓ ✓ ✓ ✓
New Zealand ✓ ✓ ✓ ✓ ✓ ✓
Norway ✓ ✓ ✓ ✓ ✓ ✓ ✓ ✓ ✓
Poland ✓ ✓ ✓ ✓ ✓ ✓ ✓ ✓ ✓
Portugal ✓ ✓ ✓ ✓ ✓ ✓ ✓ ✓
Slovak Republic ✓ ✓ ✓ ✓ ✓
Spain ✓ ✓ ✓ ✓ ✓ ✓ ✓ ✓
Sweden ✓ ✓ ✓ ✓ ✓ ✓ ✓ ✓ ✓ ✓
Switzerland ✓ ✓ ✓ ✓ ✓ ✓
Turkey ✓ ✓ ✓ ✓ ✓ ✓ ✓
United Kingdom ✓ ✓ ✓ ✓ ✓ ✓ ✓ ✓ ✓ ✓
United States ✓ ✓ ✓ ✓ ✓ ✓ ✓ ✓ ✓ ✓

OECD PUBLICATIONS, 2, rue André-Pascal, 75775 PARIS CEDEX 16
PRINTED IN FRANCE
(00 2002 29 1 P) – No. 81855 2002
Faux titre.fm Page 3 Thursday, October 10, 2002 8:39 AM