Measuring the Impact of Urban Services 1... · Urban Services Initiative – Matchmaking Conference...
45
Urban Services Initiative – Matchmaking Conference Cape Town, January 10, 2013 Measuring the Impact of Urban Services Iqbal Dhaliwal Director of Policy, J-PAL Department of Economics, MIT
Transcript of Measuring the Impact of Urban Services 1... · Urban Services Initiative – Matchmaking Conference...

Urban Services Initiative – Matchmaking Conference Cape Town, January 10, 2013
Measuring the Impact of Urban Services
Iqbal Dhaliwal Director of Policy, J-PAL
Department of Economics, MIT

1. About J-PAL
2. What is Impact? Why should we care about measuring impact? How do you really measure impact?
3. Steps in a Randomized Impact Evaluation
4. When is an RCT Suitable (or Not)?
5. Additional Resources and Q&A
2
Outline – Measuring Impact of Urban Services

3

J-PAL started in 2003 as a Center at MIT’s Economics Dept. – now over 350 projects at J-PAL Regional Offices and at Partner Organization IPA
4
Bangladesh, Ghana, Kenya, Liberia, Malawi, Mali, Mexico, Mongolia, Morocco, Peru,
Philippines, Sierra Leone, Uganda, Zambia

J-PAL’s Research is Led by it’s 80+ Affiliated Professors from 40 Universities using Randomized Evaluations to Assess the Impact of Development Programs
5

Many Development Organizations Actively Support Randomized Impact Evaluations
6

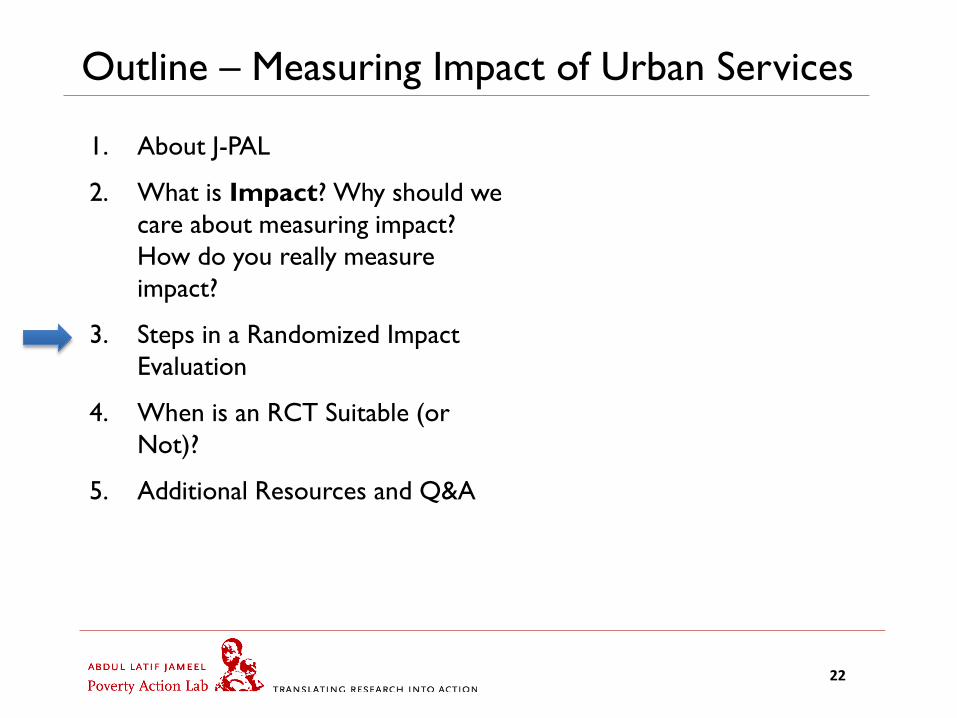
1. About J-PAL
2. What is Impact? Why should we care about measuring impact? How do you really measure impact?
3. Steps in a Randomized Impact Evaluation
4. When is an RCT Suitable (or Not)?
5. Additional Resources and Q&A
7
Outline – Measuring Impact of Urban Services

What is Impact and Why Do We Care?
What is Impact? • Causal effect of a program, policy, or a funding decision on an outcome of
interest
Why do we care about Measuring Impact? • Increases Accountability of the Program
• Did the program do what it was supposed to?
• Improves Development Policy • What is the most effective way to achieve an outcome? • What are the reasons for success or failure? • Institutionalize learning and facilitate replications and scale-up
• Ultimate Goal • Bigger impact on poverty due to more effective programs • More funding commitment for these proven programs
What are the Key Inputs into Program/Policy Design at your Organization?
• Do you use “impact estimates”? Describe some…
8

9
• Nearly 2 million children die each year from diarrhea
• 3.2 episodes of diarrhea per child under 5
• 20% all child deaths (under 5 years old) are from diarrhea
A Real Example: Diarrhea is a Big Public Health Problem in Both Urban and Rural Areas

So How do we Reduce Diarrhea?
10
• Infrastructure improvements: piped water • Improve existing water sources to reduce
contamination • Increase demand and supply of Chlorine
treatment: • Free chlorine dispensers at the
source • Free chlorine delivered to homes
• Changing behavior: • Education on sanitation and health,
e.g. Hand washing promotion • Free soap to overcome barriers
• Improve Sanitation Infrastructure

But How Do You Know Which of These Interventions Will Work the Best?
Either Look at Existing Evidence or Do a Pilot and Conduct:
1. Anecdotal evidence (people presented to you on visits)
2. Qualitative Surveys (ask local people on surprise visits)
3. Before-After difference in diarrhea
4. Simple Comparison: Measure diarrhea in villages that got the program vs. one that did not?
5. Difference in Difference of those with Program and without
6. Regression Analysis
7. Randomized Evaluations
11
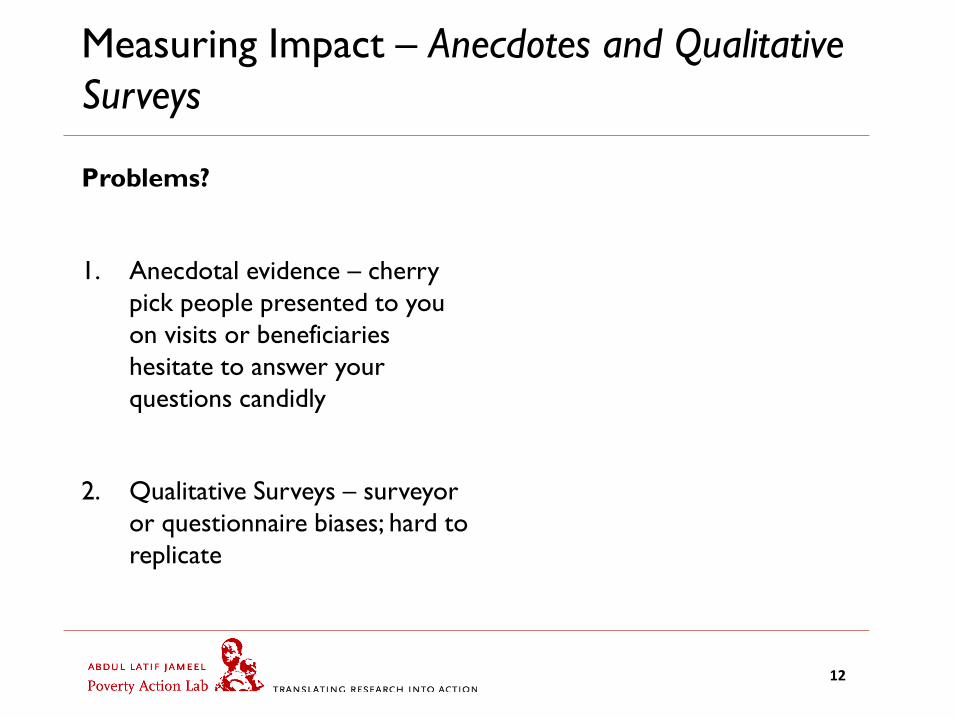
Measuring Impact – Anecdotes and Qualitative Surveys
Problems?
1. Anecdotal evidence – cherry pick people presented to you on visits or beneficiaries hesitate to answer your questions candidly
2. Qualitative Surveys – surveyor or questionnaire biases; hard to replicate
12

Measuring Impact – Compare Outcomes “Before” to “After” a Program is Introduced
What is the Impact here?
– Potential Problems?
How do you disaggregate impact of other things?
• New, cleaner water source by government (e.g. piped water)
• WHO campaign to increase awareness
13
0%
10%
20%
30%
40%
50%
60%
70%
Before Program After Program
Incidence Proportion

Measuring Impact – Simple Difference between outcomes with “Program” vs. “No Program”
What is the Impact here?
– Potential Problems?
Selection Bias in how district was chosen
• Minister’s district
• Efficient administrator
• Poor history (previous pandemic)
• Remote / Rural
• Close to state capital
14
0%
10%
20%
30%
40%
50%
60%
70%
NeighboringDistrict-1
NeighboringDistrict-2
Program District
Incidence Proportion

Regression Analysis
Statistical Tool
– Potential Problems?
Requires Data on Observable and Unobservable Variables:
• District Topology
• Quality of district administration
• Motivation of local health staff
• Citizen Involvement
15
0 10 20 30 40 50 60 70
Inci
denc
e Pr
opor
tion
Percentage of Population that is Poor

Impact is defined as a comparison between:
1. the outcome some time after the program has
been introduced
2. the outcome at that same point in time had the program not been introduced
The ”counterfactual”
16
All these Methods attempt to Measure Impact – But what exactly is impact?

What is Impact?
17
Time
Prim
ary
Out
com
e
(Dia
rrhe
a Ca
ses)
Intervention

What is Impact?
18
Time
Intervention
Prim
ary
Out
com
e
(Dia
rrhe
a Ca
ses)

What is Impact?
19
Time
Intervention
Prim
ary
Out
com
e
(Dia
rrhe
a Ca
ses)

How should we measure impact?
20
Impact is defined as a comparison between:
1. the outcome some time after the program has been introduced
--and--
2. the outcome at that same point in time had the program not been introduced (the “counterfactual”)
Problem: Counterfactual cannot be observed
Solution: We need to “mimic” or construct the
counterfactual

Randomized Evaluations are a powerful tool to measure impact as they use the Comparison Group as counterfactual
• Before the program starts, eligible individuals are randomly assigned (via LOTTERY) to two groups.
Treatment Group
Comparison Group =
GROUPS ARE STATISTICALLY IDENTICAL BEFORE PROGRAM
• Two groups continue to be identical, except for treatment • Later, compare outcomes (health, test scores) between the two groups. • Any differences between the groups can be attributed to the program.
21
1. About J-PAL
2. What is Impact? Why should we care about measuring impact? How do you really measure impact?
3. Steps in a Randomized Impact Evaluation
4. When is an RCT Suitable (or Not)?
5. Additional Resources and Q&A
22
Outline – Measuring Impact of Urban Services

Evaluation
Program Evaluation
Impact Evaluation
Monitoring
Monitoring and Evaluation – What are They and How are they Different?
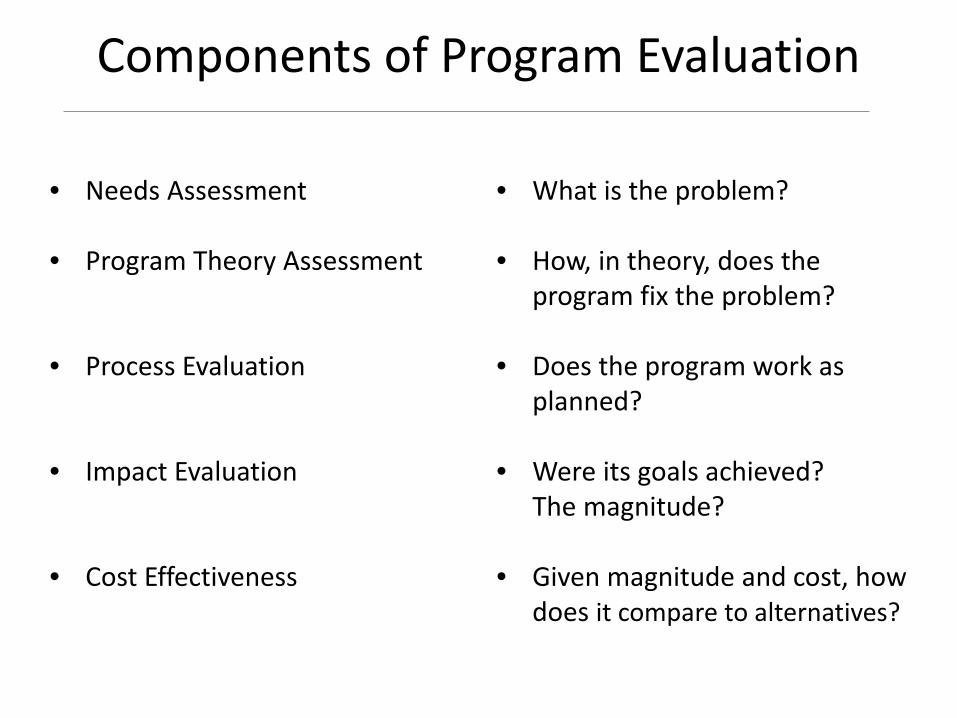
Components of Program Evaluation
• Needs Assessment
• Program Theory Assessment
• Process Evaluation
• Impact Evaluation
• Cost Effectiveness
• What is the problem?
• How, in theory, does the program fix the problem?
• Does the program work as planned?
• Were its goals achieved? The magnitude?
• Given magnitude and cost, how does it compare to alternatives?

Step-1: Needs Assessment
• > 3.2 episodes of diarrhea per child under 5 • 20% child (under 5) deaths from diarrhea • 43% Kenyans gets drinking water from springs • Landowners have no incentive to improve the sanitation due to free access • Water often contaminated by surface rainwater runoff • Contamination is spread to population • People reluctant to change habits (hand washing or chlorination), so low uptake for these “point of use” interventions.
25

Step-2: Program Theory Assessment
Proposed Program: Encase Spring Source in Concrete BEFORE AFTER
26

Step-2: Program Theory Assessment
Proposed Program: Encase Spring Source in Concrete Contaminated Water is Primary Source of Illness -> -> Concrete Encasing Reduces E.Coli contamination -> -> There is sufficient water available at this Source -> -> People Choose to Collect Water only at this Source -> -> There is clean method of extracting water -> -> There is no Recontamination of water at home -> -> Reduced Diarrhea -> -> Improved long-run Health Outcomes.
27

Many Benefits of Close Partnership Between Implementer and Evaluator at Design Stage
Impact Evaluations NOT a forensic audit of whether a program worked or not but a partnership to improve program at all stages:
• Proposed evaluations can help secure project funding
• Often Independent funding for evaluation – no cost to implementer
• Many rounds of pre-pilots (surveys and program) help identify design improvements and pre-empt problems
• Design multiple interventions to compare variations in program
28

Step-3: Process Evaluations Help in Ensuring Output and Outcome are on Track
• Typical Questions: • Material Delivered? • Encasing constructed • People collecting water?
• Baseline and other surveys provide invaluable information • Qualitative surveys provide objective and continuous feedback • Course corrections based on midline surveys • Use endline data to change program before scale up
29

Step-4: Impact Assessment
• Primary Outcome: • Did spring protection reduce diarrhea cases? • Was the duration of diarrhea sickness lesser?
• Distributional Questions: • What was the impact for households with good vs. bad sanitation practices?
• Long Term Outcomes (if planned): • Impact on health – children’s weight • Impact on education – attendance and learning
30

Randomly sample from area of interest
Measuring Impact Requires Comparison with Counterfactual

Randomly sample from area of interest
Randomly assign to treatment and control
Random Sampling and Random Assignment
Randomly sample from both treatment and control

Spring Cleaning Sample
Target Population
(200)
Not in evaluation
(0)
Evaluation Sample
(200)
Total Population
(562 springs)
Random Assignment
Year 2 (50)
Years 3,4 (100)
Year 1 (50)

• 66% reduction in source water e coli concentration
• 24% reduction in household E coli concentration
• 25% reduction in incidence of diarrhea
Impact of the Program Measured by Evaluation

Intervention Impact on Diarrhea
Spring protection (Kenya) 25% reduction in diarrhea incidence for ages 0-3
Step-5: Making Policy From Evidence – Cost Effectiveness and Scale-Ups

Intervention Impact on Diarrhea
Spring protection (Kenya) 25% reduction in diarrhea incidence for ages 0-3
Source chlorine dispensers (Kenya) 20-40% reduction in diarrhea
Home chlorine distribution (Kenya) 20-40% reduction in diarrhea
Hand-washing (Pakistan) 53% drop in diarrhea incidence for children under 15 years old
Piped water in (Urban Morocco) 0.27 fewer days of diarrhea per child per week
Step-5: Making Policy From Evidence – Cost Effectiveness and Scale-Ups

Cost Effectiveness Analysis Compares Programs With Similar Goal but from Different Contexts and Times
37
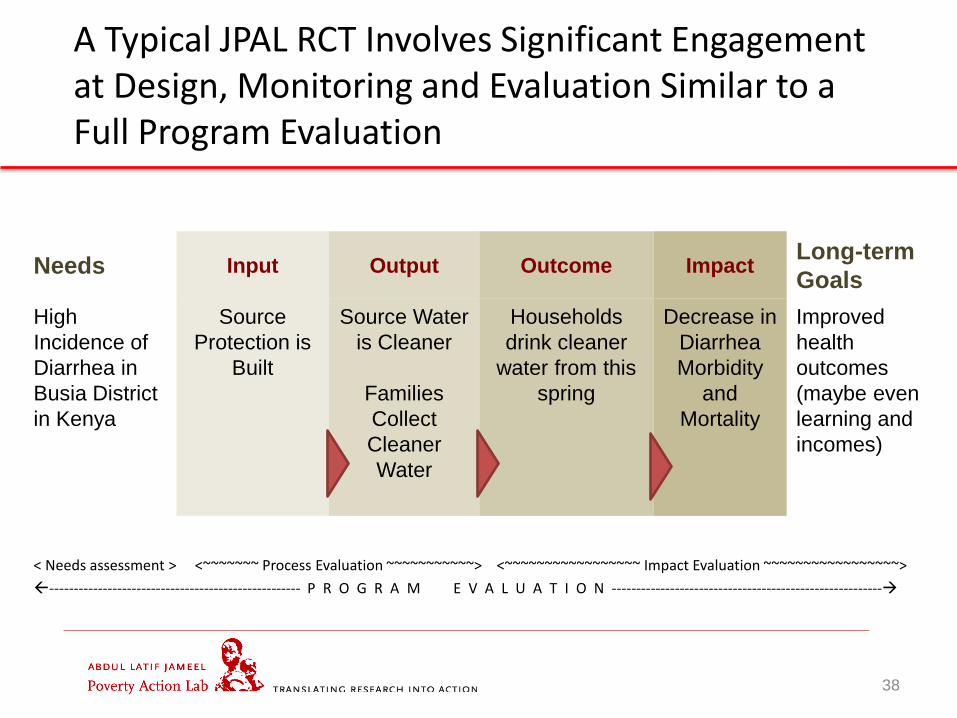
A Typical JPAL RCT Involves Significant Engagement at Design, Monitoring and Evaluation Similar to a Full Program Evaluation
38
< Needs assessment > <~~~~~~~ Process Evaluation ~~~~~~~~~~~> <~~~~~~~~~~~~~~~~~ Impact Evaluation ~~~~~~~~~~~~~~~~~> ---------------------------------------------------- P R O G R A M E V A L U A T I O N --------------------------------------------------------
Needs Input Output Outcome Impact Long-term Goals
High Incidence of Diarrhea in Busia District in Kenya
Source Protection is
Built
Source Water is Cleaner
Families Collect Cleaner Water
Households drink cleaner
water from this spring
Decrease in Diarrhea Morbidity
and Mortality
Improved health outcomes (maybe even learning and incomes)

1. About J-PAL
2. What is Impact? Why should we care about measuring impact? How do you really measure impact?
3. Steps in a Randomized Impact Evaluation
4. When is an RCT Suitable (or Not)?
5. Additional Resources and Q&A
39
Outline – Measuring Impact of Urban Services

When to do a Randomized Evaluation?
• When there is an important question you want/need to know the answer to – Common program with not much
evidence – Uncertainty about which alternative
strategy to use – Key question that underlies a lot of
different programs – About to roll out a big new program,
important design questions

When to do a Randomized Evaluation?
Timing - not too early and not too late
• Test once basic kinks have been taken out – sure this is the state of the program that
would be scaled up – No point in using rigorous evaluation to find
problems in management and logistics – No point if a simple process evaluation
could uncover the exact same facts
• Before rolled out on a major scale – Then it is too late to have a control group – If found ineffective, the money will have
already been wasted

When to do a Randomized Evaluation?
• When there is an important question you want/need to know the answer to
• Timing - not too early and not too late
• Have Time, Money and Expertise to Do it Right

• Program is premature and still requires considerable “tinkering” to work well
• Project is on too small a scale to randomize into two “representative groups”
• If a positive impact has been proven using rigorous methodology and resources are sufficient to cover everyone
• After the program has already begun and you are not expanding elsewhere
• If you have weak or no monitoring to ensure that outputs or outcomes are being achieved
When NOT to do a Randomized Evaluation?

1. About J-PAL
2. What is Impact? Why should we care about measuring impact? How do you really measure impact?
3. Steps in a Randomized Impact Evaluation
4. When is an RCT Suitable (or Not)?
5. Additional Resources and Q&A
44
Outline – Measuring Impact of Urban Services
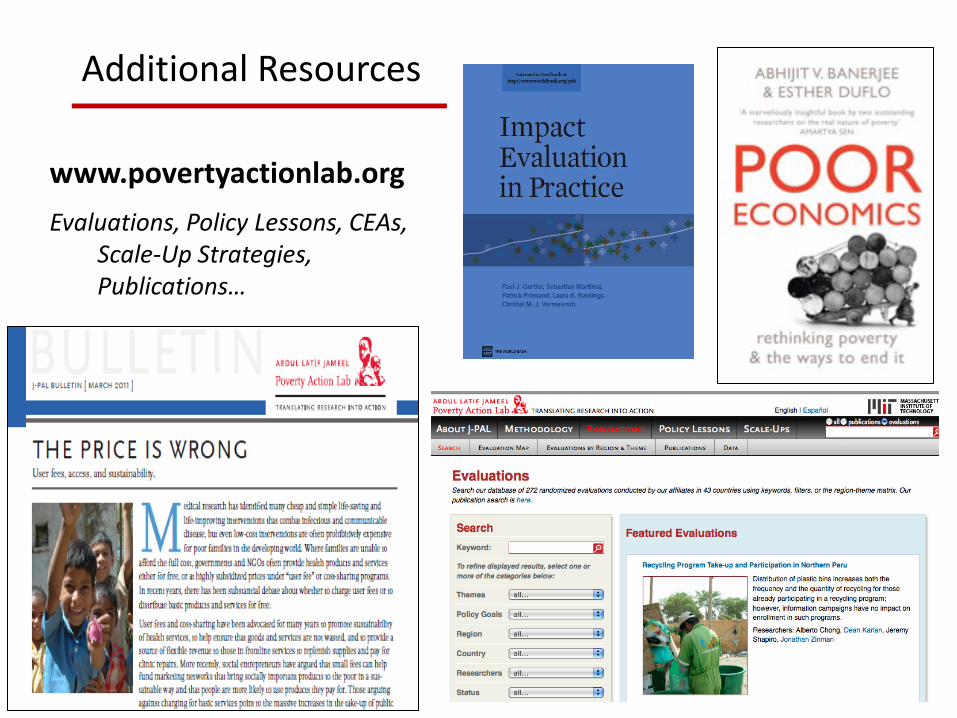
Additional Resources
www.povertyactionlab.org Evaluations, Policy Lessons, CEAs,
Scale-Up Strategies, Publications…
45