Measuring Financial Inclusion in Urban India-a Cross-Sectional ...
36
Measuring Financial Inclusion in Urban India-a Cross-Sectional Examination of Financial Depth A case study of Bangalore Urban District J A N A F O U N D A T I O N
Transcript of Measuring Financial Inclusion in Urban India-a Cross-Sectional ...

Measuring Financial Inclusion in Urban India-a Cross-Sectional Examination of Financial DepthA case study of Bangalore Urban District
J A N A F O U N D A T I O N


Table Of Figures
Table Of Tables
Abbreviations
Executive Summary
Chapter 2: Slicing The Depth Of Financial InclusionOverview Of The Enterprise Sector
Credit Supply In Bangalore Urban District
Slicing The Credit To GDP Ratio In BUD
Credit To GDP Ratio For Micro And Small Enterprises
Chapter 3: Micro-entrepreneur Study In Janalakshmi’s FootprintFootprint Census
Sampling
Description Of Survey Data
Access To Credit
Future Credit Needs
Barriers: Formalization
Implications For Policy
Appendix
1
1
2
3
88
10
10
12
1515
15
16
20
21
22
24
27
contents

Table of FiguresFigure 1: Illustration of Credit and GDP Break-up Figure 2: Footprint Survey Description- Legal Form Figure 3: Footprint Survey- Bank Accounts Figure 4: Footprint Survey- Sources for Capex Loans Figure 5: Footprint Survey- Sources for Working Capital Loans Figure 6: Footprint Survey: Formalization- I.T Returns Filed Figure 7: Footprint Survey Formalization: Book of Accounts Maintained
Table of Tables Table 1: Occupation Type
Table 2: Distribution of Type of Enterprises (NIC Codes)
1

BUD
CCFS
C-GDP
DES
EC
IFC
I T
MSME
MSE
ME
NSSO
RBI
SIDBI
UCB
Bangalore Urban District
Committee on Comprehensive Financial Services
for Small Businesses and Low Income Households
Credit to GDP
Department of Economics and Statistics
Economic Census
International Finance Corporation
Income Tax
Micro, Small and Medium Enterprises
Micro and Small Enterprises
Micro Enterprises
National Sample Survey Office
Reserve Bank of India
Small Industries Development Bank of India
Urban Cooperative Bank
ABBREVIATIONS
2

EXECUTIVE SUMMARY
The Committee for Comprehensive Financial
Services to Small Businesses and Low Income
Households (CCFS) established under the Reserve
Bank of India (RBI) envisions that every low income
household and small business would have
convenient access to credit from formally regulated
lenders, taking into account the pricing and risk
considerations underlying specific segments.
The mandate of the Committee is to undertake an
assessment of all aspects of financial inclusion
and propose a concrete way forward for financial
inclusion by the year 2017. To this effect, a
workshop under the aegis of the CCFS was
organized in Bangalore on November 11th 2013 to
examine the indicators used to measure financial
inclusion. The workshop focused on introducing a
third measure of financial inclusion in addition to
the indicators currently used (Box 1).
The proposed third measure of financial inclusion
disaggregates the credit to GDP (C-GDP) ratio by
verticals- micro, small and medium enterprises in
order to understand the main drivers of this
indicator.
Box 1: The indicators of financial
inclusion can be broadly classified
under ‘breadth’ indicators that
measure number of deposit
accounts with commercial banks
per 1,000 adults and number of
loan accounts with commercial
banks per 1,000 adults and
‘depth’ measures that include
deposit-GDP or credit-GDP ratios
70% of micro-enterprises have a bank account but only 5% have access to term loans from banks and 1% to working capital loans from banks
CHAPTER 1
3 Measuring Financial Inclusion in Urban India -a Cross-Sectional Examination of Financial Depth

The main thrust of the workshop was to look at
financial inclusion in the context of urban areas,
where unlike a rural set up, most of the infrastruc-
ture and players needed to bridge the demand and
supply gap are already present. In that sense,
cracking the financial inclusion problem in urban
India is a proximately realizable goal.
The workshop focused on Bangalore Urban District
(BUD) as a case study. BUD provides an ideal setting
to disaggregate the drivers of the C-GDP ratio by
MSE verticals. The district is the largest contributor
to Karnataka’s economy and contributes 2% out of
Karnataka’s contribution to India’s GDP of 6%. It is
therefore expected that the overall C-GDP ratio of
this economically robust district would be good,
providing an ideal context to disaggregate this
indicator.
As expected, it was observed that the overall C-GDP
ratio for BUD was 1.46, suggesting the district as a
whole fared well on the measure of financial
inclusion. However, upon disaggregation, the C-GDP
ratio for the micro sector and MSE sector as a
whole was found to be much lower: 0.62 and 0.88
respectively.
This exercise in BUD underscores the importance of
adding a third measure of financial inclusion. The
drivers of C-GDP ratio in BUD are mostly large
enterprises and using the district level C-GDP ratio
as an indicator to measure financial inclusion is
likely to the true drivers of the measure.
Since the thrust of the workshop was primarily
urban financial inclusion using BUD as a case study,
Jana Foundation conducted a survey (henceforth
Footprint Survey) for the purpose of the workshop
focusing on key themes related to access to credit
for micro-enterprises.
The survey itself was part of a larger census
(henceforth Jana Census) undertaken by Jana
Foundation in one area of Bangalore’s Central
Business Districts (CBD). The Jana Census revealed
the presence of a large segment of enterprises that
are vendors on streets or footpaths.
The Credit to GDP Ratio is 146% for Bangalore Urban as a whole. When broken by verticals, it is only 62% for the Micro sector and 88% for the MSE sector.
4Measuring Financial Inclusion in Urban India -a Cross-Sectional Examination of Financial Depth

The observations from the Jana Census raises
questions regarding the definition, classification and
enumeration of micro-enterprises (MEs). When
compared to the enterprise data from the official
Economic Census (EC) of 2005-06 in BUD, the
administrative data appears to underestimate the
size of the ME sector and omits the enumeration of
street vendors, a sizable percentage of enterprises
in BUD.
The Jana survey provides an in depth understanding
of access to credit issues for micro-enterprises.
Saliently, it revealed that while a substantial
percentage (~70%) of MEs had access to bank
accounts, very few of them had access to credit for
term loans (5.43%) and working capital (~1%).
The study found a large extent of informality among
survey respondents. 87% of the respondents had
never filed income tax returns,
65% maintained no book of accounts and 63% of
them had no enterprise registration of any form.
The lack of formalization can pose significant
barriers to accessing formal sources of finance. Not
surprisingly, a majority of respondents accessed
informal sources of finance for their credit needs.
This raises the question of whether it is prudent for
providers of credit to innovate and work around
formalization barriers or if the policy focus should
be on encouraging enterprises to formalize.
One of the concerns that was raised during the
workshop was the paucity of granular data related
to financial inclusion that would enable the addition
of a third measure of financial inclusion. Where data
was not available, assumptions were made to
calculate indicators or credit demand estimates. For
example, the data from the lead bank of Bangalore
included information only for the top six banks in
the region. Similarly, GDP data at a district level is
not available at a granular level for a number of
industry sectors. One of the ways forward for policy
that emerged during the workshop was to set up a
dedicated cell in the RBI that would be the custodi-
an of all data pertaining to financial inclusion.
High level of informality among micro-enterprises. ~90% with no income tax returns; 67% with no books of accounts; 65% with no form of enterprise registration
1| Refer Box 6- Closing Remarks of Dr. Nachiket Mor
1
5 Measuring Financial Inclusion in Urban India -a Cross-Sectional Examination of Financial Depth

Some of the other policy implications that emerged
from the workshop are:
- Developing a new classification system for
micro-enterprises that includes segments like
street/footpath vendors and the tail end of the ME
distribution.
- Focus on both the demand and supply side to
improve access to finance. On the supply side,
efforts include moving from a bank dominated
approach to a more inclusive approach that
accommodates other financial providers. On the
demand side, policy focus should be on incentives
to dismantle ME’s reluctance to formalize.
The report is organized as follows.
Chapter 2 disaggregates the C-GDP ratio for BUD
and chapter 3 elaborates findings from the Jana
survey.
6Measuring Financial Inclusion in Urban India -a Cross-Sectional Examination of Financial Depth

Box 2: Workshop Opening Remarks
Dr. Nachiket Mor (Chairman, CCFS) opened his remarks by outlining the
mandate of the committee and the motivation for the workshop. He
observed that India had already made a great deal of innovation in
terms of institutional design required for financial inclusion. However he
touched upon some areas of concern as to whether these institutions were
performing the roles they were designed for and if the problem of financial
exclusion was exacerbated by the lack of coordination among these
institutions.
With respect to the measure of financial inclusion, Dr. Mor opined that at a
district and sub-district level, while the overall financial depth might be quite
high, the extent of ‘verticalization’ can be a matter of concern. Urban areas
have a financial depth of close to 100% but this could well have been
accounted by a small number of large firms.
Mr. R.K Dubey (CMD, Canara Bank) highlighted the important role played by
MSME in poverty alleviation, economic growth and employment generation.
Sharing lessons from the ground, he noted that KYC norms were a barrier to
financial inclusion, especially for migrant populations. He also highlighted
problems with the BC model and stated that the current remuneration paid
to BCs was too low to retain them. He proposed the creation of a subsidiary
of the bank exclusively for financial inclusion that would employ the BCs. He
also recommended the government to be more proactive in the mobile
banking arena, citing the success story of financial inclusion through mobile
banking in Kenya.
Mr. Ramesh Ramanathan (Chairman of Jana Group and Member of CCFS)
provided an overview of the enterprise economy in India. He expressed
concern that the growth of enterprises in India has largely been fuelled by
enterprises with less than ten employees. He highlighted the informal nature
of employment in India noting that 350 million out of 450 million strong
workforce in India lie outside the formal enterprise sector. Touching on the
nature of financing, he observed that 90% of the enterprises in India are
self-financed, up from 80% in 1998-99. He opined that while the credit to GDP
is a good depth indicator, there was a need to extend it and look at the
substructure of the economy. He expressed concern over the lack of
availability of high quality data with respect to financial inclusion, especially
with government sources. He noted that the current Economic Census itself
could be missing enterprises like street enterprises and vendors, which make
about 23% of all enterprises in Bangalore Urban District.
7 Measuring Financial Inclusion in Urban India -a Cross-Sectional Examination of Financial Depth

Slicing the Depth of Financial Inclusion
CHAPTER 2
This chapter focuses on disaggregating the C-GDP
ratio for BUD. It provides a description of the credit
supplied to the district, GDP at the district level and
the method used to arrive at the C-GDP ratio by
verticals.
Overview of the Enterprise SectorIn 2004-05, the Economic Census data pegged the
number of Indian enterprises at 42 million, out of
which about 40% of enterprises were urban. From
the year 1998-99 to 2005-06, the number of
enterprises grew by 11 million, 10 million of which
came from enterprises with less than 5 employees.
Accounting for an annual growth of 5%, the number
of enterprises is expected to rise to about 65 million
by year 2014. It is likely that micro-enterprises
would account for the largest share of the growth in
terms of numbers. Micro-enterprises are the
bulwark of the Indian economy.
Another related characteristic of the Indian
Enterprise sector is the informal nature of
employment. India has a labor force of 450 million
workers, of which only 100 million are employed in
what is recognized as the enterprise sector. This
leaves the majority of 350 million workers outside
the ambit of the formal enterprise sector. The 1000
listed companies in India employ only 1% of the
working population. Owing to the informal nature
of most of India’s enterprise sector, it is not
surprising that 90% of enterprises are self-financed.
Out of the 10% of the enterprises that do use
external sources of financing, only 3.25% borrow
from banks.
Bangalore Urban District, the focus of this report
accounts for 15.8% of Karnataka state’s population
and 15.2% of the workforce. Bangalore also is the
8Measuring Financial Inclusion in Urban India -a Cross-Sectional Examination of Financial Depth

largest contributor to not only the state’s economy,
accounting for 32% of the GSDP, it also accounts for
2% of India’s GDP when Karnataka’s contribution is
6%. The GDDP of BUD is 1, 28,168 Crores in current
prices in 2013.
BUD has a robust MSME sector in terms of
employment, accounting for 28% of the Karnataka’s
workforce. About 30% of all investments in the
state’s MSME flows to MSMEin BUD.
Box 3: Computation of GDP at a District Level
The paucity of granular data limits the computation of GDDP.
The information in this box is intended to shed some light on
the computation of GDP at a district level. As per the
guidelines laid down by the Department of Economics and
Statistics, GDDP is estimated using three approaches:
Production, Income and Expenditure. Different approaches
are used to calculate income from different sectors of the
economy. For example, income from agriculture is calculated
through the production approach while income from
construction and forestry are calculated through the
expenditure method.
The database for estimation of DDP is not satisfactory for
any state. The methodology for estimates has been devel-
oped, discussed and debated but the process has not been
attempted-owing to the poor quality of data. The Central
Statistics Office follows a combination of the income and
‘value-added’ approach in estimating the GDP at the state
level. The approach for various sectors is based on the
availability of data. GDP of agricultural sector is estimated
from the aggregate value of production for all the crops
produced within a district in a given year. For the remaining
sectors, a district level index has been developed using the
production approach—allocated in proportion to the district
wise workforce and relevant indicators. This index is then
used to distribute the State GDP across the districts.
9 Measuring Financial Inclusion in Urban India -a Cross-Sectional Examination of Financial Depth
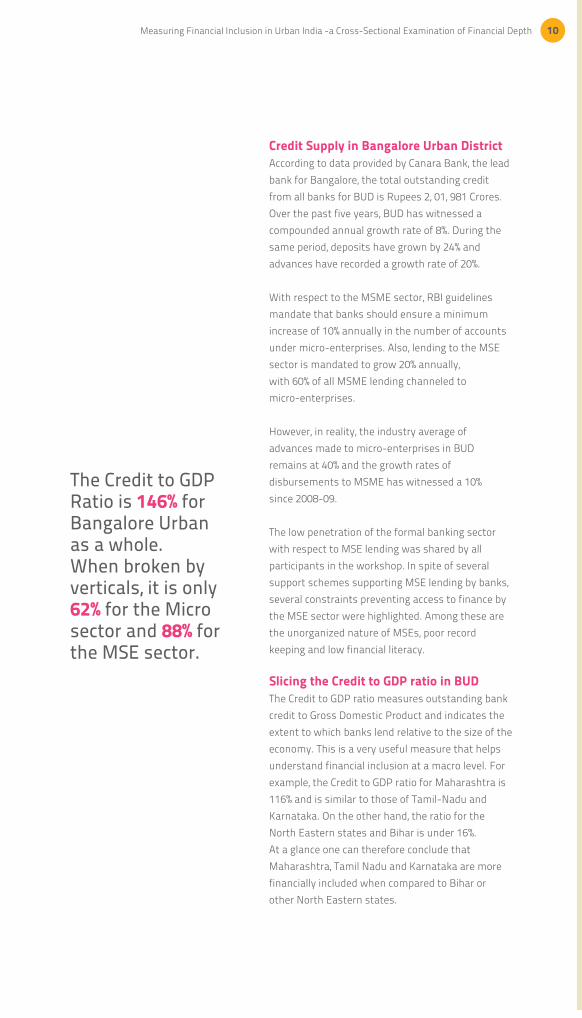
Credit Supply in Bangalore Urban DistrictAccording to data provided by Canara Bank, the lead
bank for Bangalore, the total outstanding credit
from all banks for BUD is Rupees 2, 01, 981 Crores.
Over the past five years, BUD has witnessed a
compounded annual growth rate of 8%. During the
same period, deposits have grown by 24% and
advances have recorded a growth rate of 20%.
With respect to the MSME sector, RBI guidelines
mandate that banks should ensure a minimum
increase of 10% annually in the number of accounts
under micro-enterprises. Also, lending to the MSE
sector is mandated to grow 20% annually,
with 60% of all MSME lending channeled to
micro-enterprises.
However, in reality, the industry average of
advances made to micro-enterprises in BUD
remains at 40% and the growth rates of
disbursements to MSME has witnessed a 10%
since 2008-09.
The low penetration of the formal banking sector
with respect to MSE lending was shared by all
participants in the workshop. In spite of several
support schemes supporting MSE lending by banks,
several constraints preventing access to finance by
the MSE sector were highlighted. Among these are
the unorganized nature of MSEs, poor record
keeping and low financial literacy.
Slicing the Credit to GDP ratio in BUDThe Credit to GDP ratio measures outstanding bank
credit to Gross Domestic Product and indicates the
extent to which banks lend relative to the size of the
economy. This is a very useful measure that helps
understand financial inclusion at a macro level. For
example, the Credit to GDP ratio for Maharashtra is
116% and is similar to those of Tamil-Nadu and
Karnataka. On the other hand, the ratio for the
North Eastern states and Bihar is under 16%.
At a glance one can therefore conclude that
Maharashtra, Tamil Nadu and Karnataka are more
financially included when compared to Bihar or
other North Eastern states.
The Credit to GDP Ratio is 146% for Bangalore Urban as a whole. When broken by verticals, it is only 62% for the Micro sector and 88% for the MSE sector.
10Measuring Financial Inclusion in Urban India -a Cross-Sectional Examination of Financial Depth

While the measure depicts financial inclusion at a
macro level, it sheds no light on the substructure of
the economy. Rather, it may serve to mask the real
drivers of financial inclusion in states or districts
where the ratio is high. Looking at a credit-GDP ratio
greater than 100%, it is possible to wrongly conclude
that a state or district fares well on financial
inclusion.
Credit GDP
Retail
Large Enterprise
Medium Enterprise
Small Enterprise
Micro Enterprise
Large Enterprise
Medium Enterprise
Small Enterprise
Micro Enterprise
Figure 1: Illustration of Credit and GDP Break-up
11 Measuring Financial Inclusion in Urban India -a Cross-Sectional Examination of Financial Depth

It is therefore crucial to slice this depth by verticals-
by micro, small and medium enterprises to shed
light on who the drivers of the credit to GDP ratio
are. It may well be that micro and small enterprises
contribute to a significant share of GDP but get
relatively little bank credit.
The following section slices the credit to GDP ratio
using available data for Bangalore Urban District
and uses assumptions where granular data is not
available. One of the challenges with slicing the
depth ratio by verticals for Bangalore Urban is the
paucity of data at a more granular level. Credit data
is available only for the top six banks in Bangalore
and GDP data is not available at a district level.
Credit to GDP Ratio for Micro and Small Enterprises:Credit to GDP for Bangalore Urban: In 2013, the
Gross District Domestic Product (GDDP) for
Bangalore Urban in current prices is Rupees 1,
28,168 Crores . The level of outstanding credit for all
banks in Bangalore Urban, accounting for 1608
branches is Rupees 2, 01,981 Crores. The credit to
GDP ratio for Bangalore on the whole is therefore
146%. Unsurprisingly, this shows the district as a
whole fares well on the depth indicator.
Credit to GDP for MSE in Bangalore Urban: The ratio
is brink down for the micro and small enterprise
sectors as follows. The total outstanding credit
from the top six banks in 2013 to the MSME sector
is Rupees 9,899 Crores. This accounts for about 70%
of the total credit extended to the MSME sector.
Therefore the total credit disbursed to the MSME
sector in Bangalore Urban district is about Rupees
14,141 Crores. According to the lead bank data, the
proportion of credit disbursed to the micro and
small enterprise sectors is 25.15% and 45%, bringing
the outstanding credit disbursed to these sectors
Rupees 3,557 Crores and Rupees 6,361 Crores
Respectively.
On the GDP side, the contribution of the MSE sector
to GDP is 8.72%. Assuming this percentage holds
true for Bangalore Urban and further assuming that
the proportion of micro and small enterprises to
6
5
4
3
12Measuring Financial Inclusion in Urban India -a Cross-Sectional Examination of Financial Depth

gross output in urban areas is 51.2% and 48.4%
respectively, the contribution of micro sector to GDP
is Rupees 5,721 Crores and the contribution of the
small enterprise sector to GDP is Rupees 5,452
Crores.
The Credit to GDP Ratios are highlighted in the table
below:
From the table it can be seen that though the credit
to GDP ratio of Bangalore is 1.46, the credit to GDP
ratio of micro is 0.62 and the MSE sector overall is
0.88. This verticalization exercise for Bangalore
Urban District demonstrates the necessity to
disaggregate the credit to GDP ratio by micro and
small enterprise verticals and unmask the asym-
metries underlying its structure.
Bangalore Urban
Micro Sector
Small Sector
MSE Sector
Total Outstanding Credit (Crores of Rupees)
2,01,981.00
3,557.14
6,361.43
9,918.57
GDP Contribution (Crores of Rupees)
1,28,168.00
5,721.10
5452.90
11174.00
Credit to GDP Ratio
1.46
0.62
1.16
0.88
7
3| DES Data4| Source: Lead Bank, Bangalore (Canara Bank)5| Source: Lead Bank, Bangalore (Canara Bank)6| Press release, Ministry of MSME: http://pib.nic.in/newsite/erelease.aspx?relid=828607| MSME Report
13 Measuring Financial Inclusion in Urban India -a Cross-Sectional Examination of Financial Depth

Box 4: Workshop Presentations with Data for Estimating C-GDP Ratio.
Mr. Karupasamy (Executive Director of RBI), highlighted the role played by
Urban Co-operative Banks (UCB) in MSME lending in BUD. He stated that
the UCBs constituted 3.8% of the total banking system in terms of
advances made. He stated that Karnataka had the largest number of
UCBs in the country and all districts in the state had UCBs, but their
penetration remained poor. Outlining the structure of UCBs, he noted that
these banks were self-financed- they could accept deposits from the
general public but lending could be made only to members. With respect
to problems faced by the UCBs, he noted that governance issues contin-
ued to hinder the growth of the sector. He also noted that the UCBs’
conservative attitude and technological backwardness were concerns.
Mr. S.S Bhat (General Manager for Financial Inclusion, Canara Bank
Bangalore), represented the Lead Bank of BUD. He noted that the
mandate of Canara Bank as a lead bank did not include the metropolitan
region, only peripheral areas. He noted a limitation of the Crisil Inclusix
Index, stating that it did not capture the asymmetry of banking locations-
BUD might have a large number of banks but they might all be concen-
trated in one location. Presenting data for BUD, he stated that the total
advances made to the district was 2,01,981 crores. He presented data for
the six largest banks in BUD and the advances they made to the MSME
sector. He noted that Canara Bank runs 53 self-employment training
institutes to encourage entrepreneurship.
Mr. K Sathianandan (General Manager, SIDBI) outlined the role SIDBI
played in the development of the MSME sector, pointing out that there
had been a decline in credit lending to MSME over the previous financial
year. He stated that the level of advances made by SIDBI to MSME in
Karnataka totaled Rs. 65, 953 crores as of March 2013.
Mr. Narasimha Phani (Directorate of Economics and Statistics) presented
data pertaining to the GDDP of BUD. He presented the methodology used
to calculate GDDP and estimated it at 1, 28, 168 Crores. He highlighted
Bangalore’s contribution to the GDP of Karnataka and India but noted
that there was paucity of granular data which limits the estimation of
GGDP at a district level.
Mr. T. Baskaran (Deputy Director General, NSSO) presented data
pertaining to BUD’s contribution to state and national GDP. He also
provided highlights of the data from Annual Survey of Industries, noting
that 53% of Karnataka’s factories are located in Bangalore. With respect
to MSME, he noted that the sector employs 23 lakh people in Karnataka
and enterprises in BUD employ 28% of all employment provided by MSME
in Karnataka.
14Measuring Financial Inclusion in Urban India -a Cross-Sectional Examination of Financial Depth
Micro-Entrepreneur Study in Janalakshmi’s Footprint
CHAPTER 3
The workshop used Bangalore Urban District as a
case study to understand aspects of financial
inclusion for micro-enterprises in an urban context.
Jana Foundation conducted the Footprint Survey of
micro-enterprises to get a deeper understanding of
the following: 1) current credit access for M.Es 2)
future credit needs and 3) barriers related to access
to finance.
Current credit access addressed questions related
to use of bank accounts and sources of credit used
for term loans and working capital. Future credit
needs addressed business plans of M.Es over the
next two years, how they planned to finance them
and the size of loans that they would need to fulfill
these needs. Barriers to finance addressed
questions related to formalization. This included
the absence of book of accounts, income tax
returns and other paper work essential to obtain
credit.
Footprint CensusThe Footprint Survey was conducted in the
footprint of one of Janalakshmi’s branches located
in Bangalore city’s Central Business Districts (CBD).
The survey itself was part of a larger Footprint
Census conducted by Janalakshmi that spatially
maps the entire 31sqkm area around the S.R Nagar
branch. The census covered all enterprises exclud-
ing large franchises, shopping malls and large retail
chains. It included street vendors, both stationary
and mobile. The number of enterprises in the
31sqkm was 13,177 (Refer Box 5).
15 Measuring Financial Inclusion in Urban India -a Cross-Sectional Examination of Financial Depth

SamplingThe Jana Census area was divided into 104 grids,
each covering approximately 0.3 sqkm. Using
spatial maps from the Jana Census, the areas were
segregated by density yielding areas with dense
concentration of enterprises, moderate concentra-
tion and areas that were sparsely populated with
enterprises. The areas were then proportionally
sampled based on density to arrive at a random
sample of 1019 enterprises.
Description of survey dataThe description of enterprises is presented in the
sections below:
Type of enterpriseThe top six occupations and their composition are
presented in Table 1 below:
As Table 1 shows, three of the top six enterprises in
the sample engage in retail trade. The top six
enterprises types also account for nearly 80% of all
enterprises in the sample.
Table 2 in the Appendix compares the distribution of
enterprises in the Footprint Survey with the
Economic Census data 2005-06 for the same wards
that are covered in the Footprint Survey. It is
observed that in the survey data, the vendors of
food and beverages accounts for 41.71% of enter-
prises whereas in the EC data this accounts for only
14.4%. The Footprint Survey covers street vendors,
which the Economic Census data does not.
From Table 2, it can also be seen that three out of
the top five enterprise types in the survey match
Occupation Type
Retail Food/Beverages-Specialized
Other Special Retail
Retail Food Non-Specialized
Textiles/Footwear/Clothing
Cigarette/Beedi Manufacture
Motor Vehicle Repair
NIC Code
5220
5239
5211
5232
1600
5020
%
41.71
10.50
9.62
8.44
7.07
2.94
Cum %
41.71
52.21
61.83
70.26
77.33
80.27
FOOTPRINT SURVEY
Table 1: Type of Enterprises
16Measuring Financial Inclusion in Urban India -a Cross-Sectional Examination of Financial Depth

the top three enterprise types in the Economic
Census 2005-06 for the whole of BUD.
The type of enterprises in the Footprint Survey
account for 51% of the type of enterprises found in
the Economic Census data.
Enterprise Size
The sample is predominantly made up of enterpris-
es with two or lesser employees, accounting for
over 90% of the enterprises. All enterprises in the
sample have less than six employees.
Comparing this with the Economic Census data, it is
seen that about 92% of the enterprises in Bangalore
Urban district have less than six employees.
# of employees
0
1
2
3
4
5
6
Percentage
53.74
26.06
13.62
2.61
2.61
0.99
0.36
Cumulative %
53.74
79.80
93.42
96.03
98.65
99.64
100.00Table 3: Enterprise Size- Number of Employees
17 Measuring Financial Inclusion in Urban India -a Cross-Sectional Examination of Financial Depth

Legal Form98.2% of the Footprint Sample consists of
proprietary enterprises (Figure 2). Proprietary
enterprises account for 84.21% of all enterprises in
the Bangalore Urban Economic Census data. The
higher representation of proprietary enterprises in
the footprint sample data is because of the
sampling strategy that excluded large retail
franchises, government offices, NGOs etc. that are
covered by the Economic Census.
From Table 3 and Figure 2, it is observed that the
dominant type of enterprises both in the Footprint
Sample and the Economic Census are small
proprietary enterprise.
1.6 %
98.2 %
Propreitorships
Partnerships
Legal Form
Figure 2: Footprint Survey Description- Legal Form
18Measuring Financial Inclusion in Urban India -a Cross-Sectional Examination of Financial Depth

Box 5: Is the Economic Census Capturing all Micro-Enterprises?
The Economic Census pegs the total number of enterprises at
2,56,643 in Bangalore Urban District in year 2005-06. If an annual
growth rate of 5% is assumed, the total number of enterprises in
Bangalore Urban in the year 2013 is estimated to be 3,79,179 units.
The map above illustrates the spatial distribution of micro-enterpris-
es in the S.R Nagar branch found in the Jana Footprint Census. The
total area under consideration is 31 square kilometers and this was
found to have 13,177 micro-enterprises. The density on average is
therefore 425 units per square kilometer. If an assumption is made
that within Bangalore’s municipal boundaries (750 square kilome-
ters), the density of micro-enterprises is 80% of that in the central
business district (CBD); and further that the remaining urban areas
(1440 square kilometers) have 50% of the density of CBD, the number
of enterprises in Bangalore can be estimated to be 5,61,085 units.
The type of units found in the Footprint Survey maps only to 50% of
the type of enterprises found in the Economic Census data, raising
the question of whether there are a close to a million micro-enter-
prises in Bangalore Urban district.
Most notably, one of the segments excluded from the Economic
Census enumeration are footpath vendors or vendors without
permanent premises. This forms a substantial portion of the Foot-
print Survey data (24.5%).
The Economic Census data therefore likely underestimates the size
and estimates of credit demand of micro-enterprises.
19 Measuring Financial Inclusion in Urban India -a Cross-Sectional Examination of Financial Depth

Access to Credit
As seen from Figure 3, a large proportion of
respondents have a bank account.
However, as illustrated in Figure 4 and Figure 5, the
percentage of respondents who actually have
access to credit from banks is considerably low. The
percentage of respondents who reported accessing
public or private banks for term loans was 5%. The
percentage of respondents who reported accessing
public banks for working capital was 0.5%. None of
the respondents reported accessing private banks
for working capital needs.
70% of micro-enterprises have a bank account but only 5% have access to term loans from banks and 1% to working capital loans from banks
600
400
200
0Yes
Have Bank Account? (n=766)
No
69.70%
30.30%
Chit Fund
1.3%5%3.7%2%
21%
16.2%
18.6%
17.7%
9.63%
Money LenderFriends
Self FinancedFamily / Relatives
Private Banks
Multiple Sources
Finance Companies
State / Public Banks
Sources Used for Capex Loans in last two years (n=457)
Figure 3: Footprint Survey- Bank Accounts
Figure 4: Footprint Survey- Sources for Capex Loans
20Measuring Financial Inclusion in Urban India -a Cross-Sectional Examination of Financial Depth

31.3%
20.8%
11.4%
5%
5%0.5%
17.5% Chit Fund
Money Lender
Family / Relatives
Private Banks
Friends
Self Financed
Finance Companies
State / Public Banks
Sources Used for Working Capital Loans in last two years (n-395)
Future Credit NeedsOver three quarters of respondents reported plans
to expand existing businesses or start new
businesses in the next two years. Of these, 90% had
plans to take loans from external sources.
33.5% reported they preferred public sector banks
and 10% stated a preference for loans from private
banks. These show a considerably higher
percentage of respondents preferring banks
compared to the percentage of respondents who
actually accessed these source in the past.
Over two years, the average credit requirement for
micro-enterprises in the sample was Rupees
4,39, 911. Using the projected number of micro-
enterprises from the Footprint Census (Refer Box 4),
the total number of micro-enterprises requiring
credit over the next two years is 4,20,813.
Therefore, the total estimated credit demand for all
micro-enterprises in Bangalore Urban District is
Rupees 18,907 Crores.
The estimated credit demand for micro-enterprises in BUD is Rupees 18,907 Crores
Figure 5: Footprint Survey- Sources for Working Capital Loans
21 Measuring Financial Inclusion in Urban India -a Cross-Sectional Examination of Financial Depth

Barriers: FormalizationCompared to the percentage of respondents who
actually accessed banks for term loans and working
capital credit in the past, a greater share of
respondents reported that they preferred these
sources for future business plans.
This suggests that there are barriers that prevent
access to credit from formal sources like banks.
One of the hypothesized barriers to accessing
formal sources of credit is the lack of formalization
in micro-enterprises. This implies that micro-
enterprises often operate in the informal or
unorganized sector and lack documents and clear
titles that are usually required to access loans from
formal sources. The following figures highlight the
lack of formalization in micro-enterprises:
89.8%
33.2%
66.7%
8.4%
1%
1%
Last Year
Year Before Last
Yes
No
Some Years Back
Never
I.T Returns Filed?
Book of Accounts Maintained?
Figure 6: Footprint Survey: Formalization- I.T Returns Filed
Figure 7: Footprint Survey Formalization: Book of Accounts Maintained
22Measuring Financial Inclusion in Urban India -a Cross-Sectional Examination of Financial Depth

Similarly, about 65% of micro-enterprises have no
form of enterprise registration.
In conclusion, the micro-entrepreneur footprints
study highlights the following:
- There is a flourishing micro-enterprise sector in
BUD with significant credit needs and most likely
not captured by the Economic Census.
- A large percentage of micro-entrepreneurs use
informal sources of credit despite having bank
accounts.
- A significant share of respondents report
preferring loans from public and private banks.
- Micro-enterprises have low levels of formalization
evidenced by lack of records, books of accounts or
income tax returns.
23 Measuring Financial Inclusion in Urban India -a Cross-Sectional Examination of Financial Depth

Implications for Policy
Micro and small enterprises will remain the
bulwark of the Indian economy. A look at India’s
enterprises reveals not only the dominance of MSE
as an enterprise structure, but also an expansive
informal sector in which these enterprises dwell.
To underscore the pervasiveness of the informal
sector, the formal sector accounts for the
employment of only 100 million individuals, leaving
the remaining 350 million of India’s working
age population outside the sphere of what is
considered the enterprise economy.
The RBI instituted the Committee for Financial
Inclusion for Small Businesses and Low Income
Households to assess all aspects of financial
inclusion and propose a concrete way forward for
financial inclusion by the year 2017. To this effect, a
workshop under the aegis of the CCFS was
organized in Bangalore on November 11th 2013 to
examine the indicators used to measure financial
inclusion. The workshop focused on introducing a
third measure of financial inclusion in addition to
the indicators currently used.
A study of Bangalore Urban district’s enterprise
economy underscored the necessity to add a third
measure of financial inclusion that disaggregates
the depth measure. The overall good C-GDP ratio of
Bangalore Urban was 1.46, an overall good indica-
tion of financial inclusion. However, when this
measure was disaggregated by verticals, the ratio
was much lower for micro and MSE sector- 0.62
and 0.88 respectively.
The Census of micro-enterprises conducted in
Bangalore by Jana Foundation highlighted concerns
with how micro enterprises were enumerated in
Economic Census. The Jana Census estimates the
number of micro-enterprises in BUD at 5,61,085.
However, the Economic Census data estimate is
24Measuring Financial Inclusion in Urban India -a Cross-Sectional Examination of Financial Depth

3,79,179 enterprises, underestimating the number
of micro-enterprises in BUD. This was largely due to
the exclusion of street vendors who form a
substantial percentage of enterprises in urban
areas. There is therefore a need for a new classifica-
tion system of nano, micro and small enterprises
(NSME) that covers street vendors and the tail end
of micro-enterprises.
The survey of MSE in Janalakshmi’s footprint further
revealed that the low C-GDP ratio for ME was
despite the large demand for credit (Rs. 18,907
Crores) from the micro sector. This underscores the
importance of adding a third indicator of financial
inclusion that disaggregates the C-GDP ratio in a
state or district by verticals.
The study found a large extent of informality among
survey respondents. 90% of the respondents never
filed income taxes, 67% maintained no book of
accounts and 65% had no enterprise registration of
any form.
The lack of formalization can pose significant
barriers to accessing formal sources of finance. Not
surprisingly, a majority of respondents accessed
informal sources of finance for their credit needs.
This raises the question of whether it is prudent for
providers of credit to innovate and work around
formalization barriers or if the policy focus should
be on encouraging enterprises to formalize.
These observations imply that there are large gaps
in the demand for and supply of credit to the MSE
sector and that these gaps are largely structural.
Policy efforts will have to be both demand and
supply side. Supply side efforts include policy and
regulatory changes. For example, the RBI’s current
approach which is bank dominated will need to
accommodate other players in the financial
inclusion space. On the demand side, incentives
need to be provided to NSMEs to dismantle their
reluctance to formalize. Local governments could
play an important role in the development of this
sector through the powers bestowed on them
through the Shops and Establishments Act. The
boxes below highlight policy implications further.
High level of informality among micro-enterprises. ~90% with no income tax returns; 67% with no books of accounts; 65% with no form of enterprise registration
25 Measuring Financial Inclusion in Urban India -a Cross-Sectional Examination of Financial Depth

Box 6: Concluding remarks from Mr. Ramesh Ramanathan
(Chairman, Jana Group)
In his concluding remarks, Mr. Ramesh Ramanathan, Chairman of the Jana
Group observed that the institutional form needs to change from a
‘Bank-only’ to a ‘Bank-and’ model. He also noted that the ease-of-do-
ing-business metrics need to be extended to the micro and small enterprises
as well. He outlined three possible steps and recommendations for taking
the agenda of the workshop forward:
1) Completing the study of MSEs in Bangalore Urban and calculation of the
financial inclusion metric for Bangalore
2) He recommended that the CCFS report address policy issues like
institutional agnosticism, addition of the disaggregated depth metric as a
measure of financial inclusion as well as addressing demand side challenges
like formalization.
3) He also recommended the creation of a cell within the RBI who will be the
custodians of granular data on financial inclusion. Policy decisions and
initiatives in future would be driven by data.
Box 7: Concluding remarks from Dr. Nachiket Mor (Chairman CCFS)
Dr. Mor summarized the proceedings of the workshop with the following
observations. On the demand side, he noted that formalization of SME would
be a difficult challenge as there was likely a large ‘metal overhead’ amongst
enterprise owners operating in the informal sector to formalize. On the
supply side, he noted that lessons from around the world suggest local
community banks did well in servicing the needs of SME. He noted however
that governance would be challenge with community based banks. He
suggested that an alternate route would be to strengthen existing agent
based models like the Pygmy Bank model proposed by Canara Bank. He
remarked that the weakness in the NBFC-MFI sector stems from the
absence of full service institutions- most of these institutions specialize in
the delivery of particular types of credit that are characterized by high
frequencies and small amounts. Dr. Mor opined that the use of credit
bureaus was a good path to move forward but there were regulatory gaps
that needed to be addressed. For example, he noted that Urban Co-operative
Banks and Regional Rural Banks were not required to report to credit
bureaus, leaving out many products like the Kisan Credit Cards from the
ambit of credit bureaus. He also suggested that development of better
second hand markets could provide an answer to lack of collateral as a
barrier to accessing credit.
26Measuring Financial Inclusion in Urban India -a Cross-Sectional Examination of Financial Depth

Typ
e o
f En
terp
rise
Ret
ail s
ale
of f
oo
d, b
ever
ages
an
d t
ob
acco
in s
pec
ializ
ed
sto
res
Oth
er re
tail
sale
in s
pec
ializ
ed
sto
res
Ret
ail s
ale
in n
on
-sp
ecia
lized
st
ore
s w
ith
foo
d
Ret
ail s
ale
of t
exti
les,
clo
thin
g,
foo
twea
r an
d le
ath
er g
oo
ds
Man
ufa
ctu
re o
f to
bac
co
pro
du
cts
Mai
nte
nan
ce a
nd
rep
air
of
mo
tor
veh
icle
s
Ret
ail s
ale
of h
ou
seh
old
ap
plia
nce
s, a
rtic
les
and
eq
uip
men
t
Oth
er b
usi
nes
s ac
tivi
ties
Oth
er s
ervi
ce a
ctiv
itie
s
Was
hin
g a
nd
(dry
-) c
lean
ing
of
text
ile a
nd
fur
pro
du
ts
NIC
Co
de
5220
5239
5211
5232
1600
5020
5233
7499
9309
9301
Foo
tpri
nt
Surv
eyEC
Dat
a: J
ana
Cen
sus
War
ds
(200
5-06
)EC
Dat
a: F
ull
Ban
gal
ore
Urb
an (2
005-
06)
%
41.7
1
10.5
0
9.62
8.44
7.07
2.94
2.94
2.75
2.45
1.57
%
41.7
1
52.2
1
61.8
3
70.2
6
77.3
3
80.2
7
83.2
2
85.9
7
88.4
2
89.9
9
Typ
e o
f En
terp
rise
Ret
ail s
ale
of f
oo
d, b
ever
ages
an
d t
ob
acco
in s
pec
ializ
ed
sto
res
Oth
er b
usi
nes
s ac
tivi
ties
Oth
er re
tail
sale
in s
pec
ializ
ed
sto
res
Mai
nte
nan
ce a
nd
rep
air
of
mo
tor
veh
icle
s
Ret
ail s
ale
of t
exti
les,
clo
thin
g,
foo
twea
r an
d le
ath
er g
oo
ds
Sale
, mai
nte
nan
ce a
nd
rep
air
of m
oto
rcyc
les
and
rela
ted
p
arts
an
d a
cces
sori
es
Fin
ish
ing
of t
exti
le e
xclu
din
g
khad
i/h
and
loo
m
Oth
er n
on
-sto
re re
tail
sale
[in
clu
din
g n
etw
ork
mar
keti
ng
]
Sale
of m
oto
r ve
hic
le p
arts
an
d
acce
sso
ries
Ho
tels
; cam
pin
g s
ites
etc
.
NIC
Co
de
5220
7499
5239
5020
5232
5040
1712
5259
5030
5510
%
14.4
2
6.65
4.93
4.12
3.78
3.15
3.09
2.94
2.72
2.49
%
14.4
2
21.0
7
26
30.1
2
33.9
37.0
5
40.1
4
43.0
8
45.8
48.2
9
Typ
e o
f En
terp
rise
Ret
ail s
ale
of f
oo
d, b
ever
ages
an
d t
ob
acco
in s
pec
ializ
ed
sto
res
Oth
er re
tail
sale
in s
pec
ializ
ed
sto
res
Ret
ail s
ale
of t
exti
les,
clo
thin
g,
foo
twea
r an
d le
ath
er g
oo
ds
[incl
Oth
er b
usi
nes
s ac
tivi
ties
Fin
ish
ing
of t
exti
le e
xclu
din
g
khad
i/h
and
loo
m
Res
tau
ran
ts, b
ars
and
can
teen
s
Ret
ail s
ale
in n
on
-sp
ecia
lized
st
ore
s w
ith
foo
d, b
ever
ages
or
tob
acco
pre
do
min
atin
g
Ret
ail s
ale
of h
ou
seh
old
ap
plia
nce
s, a
rtic
les
and
eq
uip
men
t
Tele
com
mu
nic
atio
ns
Ho
tels
; cam
pin
g s
ites
an
d o
ther
p
rovi
sio
n o
f sh
ort
-sta
y
NIC
Co
de
5220
5239
5232
7499
1712
5520
5211
5233
6420
5510
%
15.3
4
5.99
5.47
4.67
2.89
2.43
2.41
2.21
2.12
2.00
%
46.9
7
63.5
9
54.3
88.7
4
7.03
71.3
4
30.3
9
56.5
76.4
68.9
1
Tabl
e 2:
Dis
trib
utio
n of
Typ
e of
Ent
erpr
ises
(NIC
Cod
es)
Appe
ndix
27 Measuring Financial Inclusion in Urban India -a Cross-Sectional Examination of Financial Depth

Wo
rks
ho
p A
ge
nd
a a
nd
Lis
t o
f S
pe
ak
ers
Ro
le
Ove
rvie
w o
f Ban
gal
ore
's e
con
om
y
Sup
ply
Sid
e
Dat
a
Clo
sin
g R
emar
ks
Tim
e
12.3
0-1.
30
1.30
-1.4
0
1.40
-1.5
0
1.50
-2.0
0
2.00
-2.1
5
2.15
-2.3
0
2.30
-2.4
5
2.45
-3.0
0
3.00
-3.1
5
3.15
-3.3
0
3.30
-3.4
5
4.30
-4.4
0
4.40
-4.5
0
4.50
-5.0
0
5.00
-5.2
0
5.20
-5.4
0
5.40
-6.0
0
Bri
ef D
escr
ipti
on
Intr
od
uct
ion
an
d C
on
text
Op
enin
g R
emar
ks
Defi
nin
g t
he
Pro
ble
m
Ban
gal
ore
Urb
an, d
istr
ict-
wis
e G
DP-
tre
nd
lin
es, c
om
po
siti
on
Stru
ctu
re o
f Ban
gal
ore
Urb
an e
nte
rpri
se e
con
om
y an
d t
ren
ds
Cre
dit
flo
ws
in B
ang
alo
re U
rban
- ch
ang
e in
th
e la
st 1
0 ye
ars
and
bre
ak-u
p
Cre
dit
wit
h re
spec
t to
Ban
gal
ore
Urb
an M
SMEs
Cre
dit
of U
rban
Co
-op
erat
ive
Ban
ks in
Ban
gal
ore
's u
rban
dis
tric
ts
Defi
nit
ion
s an
d a
vaila
ble
dat
a o
n v
erti
cals
Eco
no
mic
Co
ntr
ibu
tio
n a
nd
Cre
dit
Nee
ds
Surv
ey re
sult
s fr
om
MSE
for
Ban
gal
ore
Urb
an L
oca
tio
n
Vert
ical
Ch
alle
ng
es o
f Fin
anci
al D
epth
Mea
sure
men
ts- S
ize
and
Cau
salit
y Po
ssib
iliti
es
Op
en D
iscu
ssio
n
Way
forw
ard
Spea
ker,
Org
aniz
atio
n
Lun
ch
Dr.
Nac
hik
et M
or,
Cen
tral
Bo
ard
Mem
ber
, RB
I
Mr.
R. K
. Du
bey
, CM
D, C
anar
a B
ank
Mr.
Ram
esh
Ram
anat
han
, Jan
a G
rou
p
Mr.
Nar
asim
ha
Pan
i, D
irec
tora
te o
f Eco
no
mic
s an
d S
tati
stic
s, G
ove
rnm
ent
of K
arn
atak
a
Mr.
T. B
aska
ran
, Nat
ion
al S
amp
le S
urv
ey O
ffice
Mr.
S. S
. Bh
at, C
anar
a B
ank
Mr.
K. S
ath
ian
and
an, S
mal
l In
du
stri
es D
evel
op
men
t B
ank
of I
nd
ia
Mr.
Kar
up
pas
amy,
Urb
an C
o-o
per
ativ
e B
anks
Tea
Mr.
Shya
m S
un
dar
, Min
istr
y o
f MSM
E
Mr.
Arb
ind
Sin
gh
, Nat
ion
al A
sso
ciat
ion
of S
tree
t Ven
do
rs o
f In
dia
Dr.
Gay
atri
Ram
nat
h, J
ana
Fou
nd
atio
n
Mr.
Ram
esh
Ram
anat
han
, Jan
a G
rou
p
Op
en D
iscu
ssio
n
Dr.
Nac
hik
et M
or,
Cen
tral
Bo
ard
Mem
ber
, RB
I
Hig
h t
ea
28Measuring Financial Inclusion in Urban India -a Cross-Sectional Examination of Financial Depth


Jana Foundation, 34/1-1, Langford Road, Shanthi Nagar, Bangalore - [email protected]