"Measuring the Benefit of Federal Tax Expenditures Used by Small ...
59
Measuring the Benefit of Federal Tax Expenditures Used by Small Business by John O’Hare Mary Schmitt Judy Xanthopoulos Quantria Strategies, LLC Luray, VA 22835 for under contract number SBAHQ-12-Q-0043 Release Date: November 2013 This report was developed under a contract with the Small Business Administration, Office of Advocacy, and contains information and analysis that were reviewed by officials of the Office of Advocacy. However, the final conclusions of the report do not necessarily reflect the views of the Office of Advocacy.
Transcript of "Measuring the Benefit of Federal Tax Expenditures Used by Small ...

Measuring the Benefit of Federal Tax Expenditures Used by Small Business
by
John O’Hare
Mary Schmitt Judy Xanthopoulos
Quantria Strategies, LLC Luray, VA 22835
for
under contract number SBAHQ-12-Q-0043
Release Date: November 2013
This report was developed under a contract with the Small Business Administration, Office of Advocacy, and contains information and analysis that were reviewed by officials of the Office of Advocacy. However, the final conclusions of the report do not necessarily reflect the views of the Office of Advocacy.
ii
CONTENTS EXECUTIVE SUMMARY ..................................................................................................... 1
I. OVERVIEW OF TAX EXPENDITURES ...................................................................... 4
A. Small Businesses by Entity ....................................................................................... 6
B. Conceptual Issues...................................................................................................... 8
1. Defining Tax Expenditures .................................................................................... 8
2. JCT vs. OTA Tax Expenditure Estimates – .......................................................... 9
3. Measuring Tax Expenditures ............................................................................... 10
II. MEASURING TAX EXPENDITURES ........................................................................ 12
A. Methodology for Small Business Measures ........................................................... 12
1. Modeling Small Business Tax Expenditures ....................................................... 12
2. Data Limitations and Measurement Problems..................................................... 13
III. ESTIMATES OF TAX EXPENDITURES BY ENTITY FOR SMALL BUSINESSES ........................................................................................................................ 15
A. Sole Proprietorships ................................................................................................ 18
B. Partnerships ............................................................................................................. 19
C. S Corporations ........................................................................................................ 21
D. C Corporations ........................................................................................................ 22
IV. CONCLUSIONS......................................................................................................... 23
REFERENCES ...................................................................................................................... 24
APPENDIX A – TECHNICAL DESCRIPTION OF QUANTRIA METHODOLOGY ...... 34
APPENDIX B – SUPPORTING DATA AND DETAILED EMPIRICAL ESTIMATES ... 38
APPENDIX C – LITERATURE REVIEW ........................................................................... 44

iii
LIST OF TABLES
Table 1 – Summary of Largest Tax Expenditures for all Businesses and Small Businesses, Fiscal Year 2013 ...................................................................................................... 2
Table 2 – Ten Largest Tax Expenditures Affecting All Businesses, Selected Years ............. 6 Table 4 – Summary of Largest Tax Expenditures for Small Businesses, By Entity Type,
Fiscal Year 20131 .................................................................................................. 15 Table 5 – Summary of Largest Tax Expenditures for Sole Proprietorships Classified as
Small Businesses, Fiscal Year 2013 ...................................................................... 18 Table 6 – Summary of Largest Tax Expenditures for Partnerships Classified as Small
Businesses, Fiscal Year 2013 ................................................................................ 20 Table 7 – Summary of Largest Tax Expenditures for S Corporations Classified as Small
Businesses, Fiscal Year 2013 ................................................................................ 21 Table 8 – Summary of Largest Tax Expenditures for C Corporations Classified as Small
Businesses, Fiscal Year 2013 ................................................................................ 22 Table 9 – Tax Expenditure Estimates for Small Businesses by Entity Type, Fiscal Year 2013 .................................................................................................... 38
1
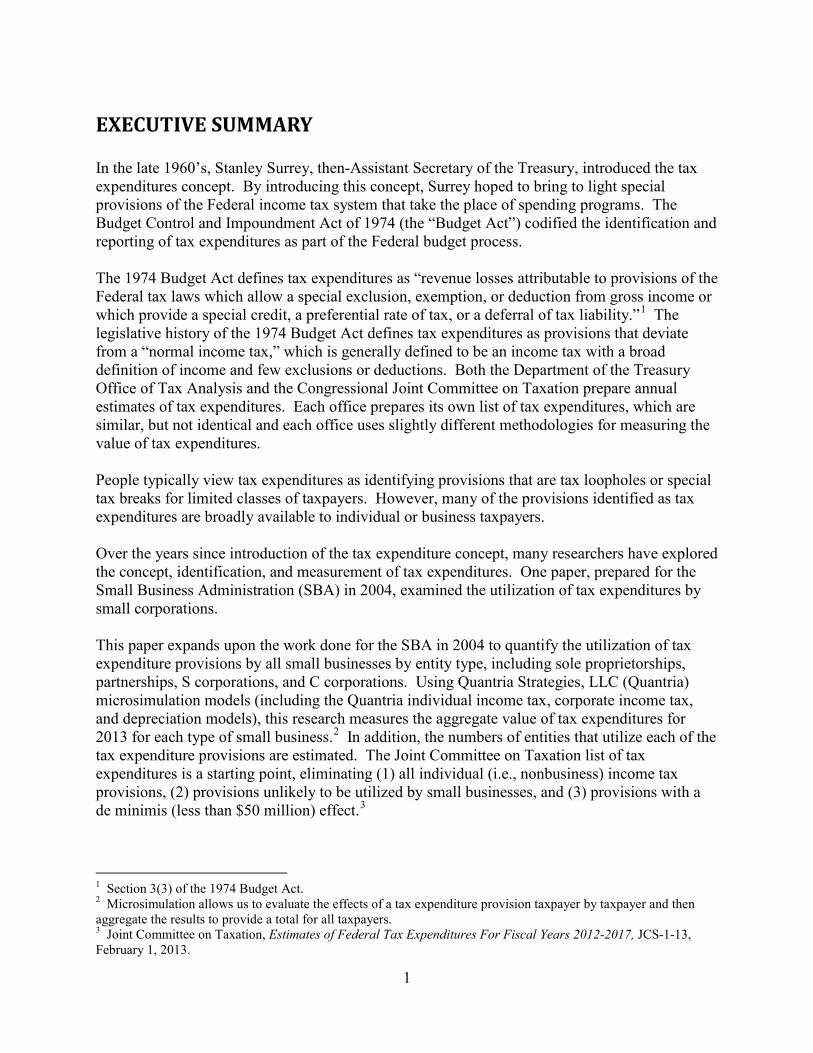
EXECUTIVE SUMMARY In the late 1960’s, Stanley Surrey, then-Assistant Secretary of the Treasury, introduced the tax expenditures concept. By introducing this concept, Surrey hoped to bring to light special provisions of the Federal income tax system that take the place of spending programs. The Budget Control and Impoundment Act of 1974 (the “Budget Act”) codified the identification and reporting of tax expenditures as part of the Federal budget process. The 1974 Budget Act defines tax expenditures as “revenue losses attributable to provisions of the Federal tax laws which allow a special exclusion, exemption, or deduction from gross income or which provide a special credit, a preferential rate of tax, or a deferral of tax liability.”1 The legislative history of the 1974 Budget Act defines tax expenditures as provisions that deviate from a “normal income tax,” which is generally defined to be an income tax with a broad definition of income and few exclusions or deductions. Both the Department of the Treasury Office of Tax Analysis and the Congressional Joint Committee on Taxation prepare annual estimates of tax expenditures. Each office prepares its own list of tax expenditures, which are similar, but not identical and each office uses slightly different methodologies for measuring the value of tax expenditures. People typically view tax expenditures as identifying provisions that are tax loopholes or special tax breaks for limited classes of taxpayers. However, many of the provisions identified as tax expenditures are broadly available to individual or business taxpayers. Over the years since introduction of the tax expenditure concept, many researchers have explored the concept, identification, and measurement of tax expenditures. One paper, prepared for the Small Business Administration (SBA) in 2004, examined the utilization of tax expenditures by small corporations. This paper expands upon the work done for the SBA in 2004 to quantify the utilization of tax expenditure provisions by all small businesses by entity type, including sole proprietorships, partnerships, S corporations, and C corporations. Using Quantria Strategies, LLC (Quantria) microsimulation models (including the Quantria individual income tax, corporate income tax, and depreciation models), this research measures the aggregate value of tax expenditures for 2013 for each type of small business.2 In addition, the numbers of entities that utilize each of the tax expenditure provisions are estimated. The Joint Committee on Taxation list of tax expenditures is a starting point, eliminating (1) all individual (i.e., nonbusiness) income tax provisions, (2) provisions unlikely to be utilized by small businesses, and (3) provisions with a de minimis (less than $50 million) effect.3
1 Section 3(3) of the 1974 Budget Act. 2 Microsimulation allows us to evaluate the effects of a tax expenditure provision taxpayer by taxpayer and then aggregate the results to provide a total for all taxpayers. 3 Joint Committee on Taxation, Estimates of Federal Tax Expenditures For Fiscal Years 2012-2017, JCS-1-13, February 1, 2013.
2
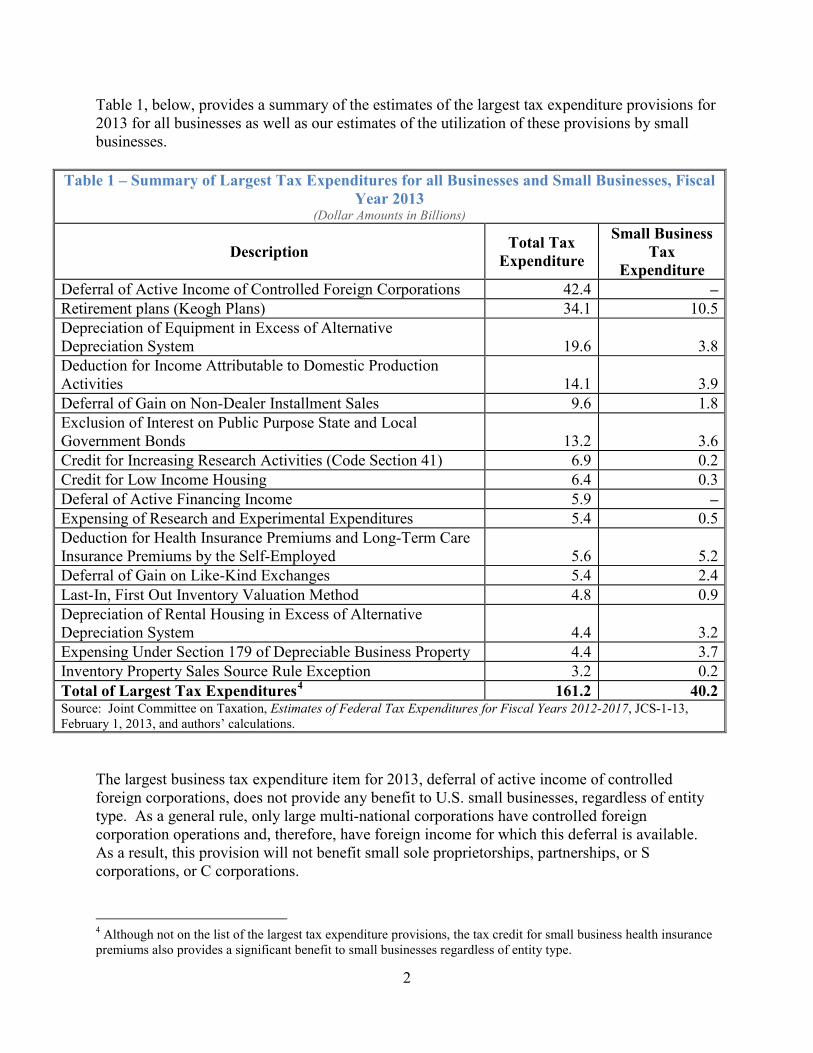
Table 1, below, provides a summary of the estimates of the largest tax expenditure provisions for 2013 for all businesses as well as our estimates of the utilization of these provisions by small businesses.
Table 1 – Summary of Largest Tax Expenditures for all Businesses and Small Businesses, Fiscal Year 2013
(Dollar Amounts in Billions)
Description Total Tax Expenditure
Small Business Tax
Expenditure Deferral of Active Income of Controlled Foreign Corporations 42.4 – Retirement plans (Keogh Plans) 34.1 10.5 Depreciation of Equipment in Excess of Alternative Depreciation System 19.6 3.8 Deduction for Income Attributable to Domestic Production Activities 14.1 3.9 Deferral of Gain on Non-Dealer Installment Sales 9.6 1.8 Exclusion of Interest on Public Purpose State and Local Government Bonds 13.2 3.6 Credit for Increasing Research Activities (Code Section 41) 6.9 0.2 Credit for Low Income Housing 6.4 0.3 Deferal of Active Financing Income 5.9 – Expensing of Research and Experimental Expenditures 5.4 0.5 Deduction for Health Insurance Premiums and Long-Term Care Insurance Premiums by the Self-Employed 5.6 5.2 Deferral of Gain on Like-Kind Exchanges 5.4 2.4 Last-In, First Out Inventory Valuation Method 4.8 0.9 Depreciation of Rental Housing in Excess of Alternative Depreciation System 4.4 3.2 Expensing Under Section 179 of Depreciable Business Property 4.4 3.7 Inventory Property Sales Source Rule Exception 3.2 0.2 Total of Largest Tax Expenditures4 161.2 40.2 Source: Joint Committee on Taxation, Estimates of Federal Tax Expenditures for Fiscal Years 2012-2017, JCS-1-13, February 1, 2013, and authors’ calculations.
The largest business tax expenditure item for 2013, deferral of active income of controlled foreign corporations, does not provide any benefit to U.S. small businesses, regardless of entity type. As a general rule, only large multi-national corporations have controlled foreign corporation operations and, therefore, have foreign income for which this deferral is available. As a result, this provision will not benefit small sole proprietorships, partnerships, or S corporations, or C corporations.
4 Although not on the list of the largest tax expenditure provisions, the tax credit for small business health insurance premiums also provides a significant benefit to small businesses regardless of entity type.

3
Of the largest tax expenditure provisions utilized by all businesses in 2013, small businesses will utilize approximately $40 billion out of a total of $161 billion. The estimates indicate that small businesses will utilize approximately 25 percent of the largest business tax expenditure provisions in 2013. The treatment of retirement plans (Keogh plans) and the deduction for self-employed health insurance premiums and long-term care insurance premiums provide a significant benefit to small sole proprietorships, partnerships, and S corporations. The tax expenditure for retirement plans of C corporations benefits employees rather than C corporations, so these amounts are not treated as business tax expenditures. In addition, the deduction for self-employed health insurance premiums and long-term care insurance premiums does not apply to C corporations, so the provision provides no benefit to small C corporations.5 Several of the largest tax expenditure provisions, including the deduction for income attributable to domestic production activities, the deduction for equipment in excess of the alternative depreciation system, the section 179 expensing provision, and the deduction for depreciation of rental housing in excess of the alternative depreciation system all provide important benefits for small businesses regardless of entity type. These provisions provide benefits designed to encourage U.S. domestic manufacturing and investment in depreciable assets. From a small business perspective, the size of the tax expenditure estimates can be a misleading measure of the importance of these provisions to small businesses. In some cases, tax expenditure provisions provide other benefits not measured by the numerical value of the estimates. In other cases, the tax expenditure estimate may overstate the value of the provision. For example, section 179 expensing allows small businesses to expense a limited amount of investment in equipment and tangible property, rather than requiring them to calculate depreciation deductions under a complicated system. The tax expenditure estimate does not account for the simplification benefits that accrue to small businesses that use this provision. In addition, section 179 expensing is a deferral provision. This means that the taxpayer must recapture the benefits of expensing when they dispose of the eligible property. The recapture amount often appears outside the budget window for purposes of measuring the tax expenditure. In addition to ignoring the simplifying nature of section 179, the tax expenditure estimates overstate the tax benefits of the provision.
5 Although not on the list of the largest tax expenditure provisions, the tax credit for small business health insurance premiums also provides a significant benefit to small businesses regardless of entity type.
4
I. OVERVIEW OF TAX EXPENDITURES Tax expenditures are provisions in the tax law designed to benefit specific groups of taxpayers. They are similar to spending programs but generally do not involve direct federal outlays. Rather, they work through the income tax system, taking the form of special credits, exemptions, deductions, exclusions and preferential rates. In some cases, these tax provisions have a limited scope and are not available to all taxpayers. By design, most tax expenditures provide incentives for taxpayers to engage in, or increase their contribution to, activities in which they ordinarily would not engage in the absence of the provision. For example, some of largest tax expenditures involve incentives for home ownership (e.g., the mortgage interest and property tax deductions), investment (e.g., accelerated cost recovery for equipment and structures), healthcare (e.g., exclusion for employer-provided insurance) and research (e.g., expensing of research and experimental expenditures). Critics of tax expenditures sometimes refer to them as “loopholes in the tax law” that benefit particular industries or interest groups at the expense of other taxpayers who cannot avail themselves of the same benefits. The result, the critics say, is a system where certain segments of the taxpaying population have an unfair advantage. Recent discussions of tax reform have focused on repealing most tax expenditures as part of an effort to create a simpler and fairer tax system. However, most tax expenditures remain part of the tax code for specific reasons and with particular objectives (e.g., increased investment) and removing these provisions could cause unintended economic disruption. The view that advocates for widespread repeal of all tax expenditures ignores the potential economic consequences that could accompany such a move. For instance, tax provisions that accelerated the timing over which many businesses may recover the cost of eligible investment generate significant behavioral responses. These provisions stimulate investment activity and in their absence create an impediment to investment by implicitly increasing the cost of the investment.6 Further, many do not understand some of the theoretical issues presented by the identification and measurement of tax expenditures. Since Stanley Surrey introduced the original concept of tax expenditures in the 1960’s, researchers have generated significant academic literature and policy debate about whether the approach represents the best measure of the so-called “loopholes” in the tax code, and whether alternative definitions of tax expenditures would be more meaningful and accurate.7 Simply identifying a tax provision as a tax expenditure does not automatically mean the provision is a loophole that facilitates tax avoidance. In many cases, the provision represents an incentive to stimulate certain economic activity. 6 These issues are particularly true for smaller businesses because, by design, most business tax expenditures seek to lower the cost of capital and increase investment. Repealing these provisions could reduce investment and dampen economic growth. Further, these tax provisions may account for a disproportionately high percentage of a small business’ operating income. 7 See the discussion of this issue in the literature review in Appendix C.
5
In addition, the standard approach to measuring tax expenditures generally overstates the revenue associated with repealing the provision. In many cases, policymakers will consider selected provisions and suggest that repealing these tax expenditures will increase revenue to the Federal government by the sum of the individual provisions. 8 As explained later in this section (refer to Section B.), tax expenditures differ significantly from revenue estimates by omitting the behavioral response that would likely accompany repeal of the provision. In addition, if multiple tax expenditure provisions were repealed as part of the same tax legislation, it is likely that the combination of the tax changes would create interaction effects. In most cases, when considering the interaction of the provisions, the total revenue change is less than the sum of the separate provisions. Table 2 shows the ten largest tax expenditures affecting businesses for 2 periods, 1987 to 1991 and 2011 to 2015.9 Because preparation of the estimates for tax expenditures occurred prior to the Congressional action on the Tax Reform Act of 1986 (TRA), the earlier estimates (1987 to 1991) reflect the tax law in place prior to 1986.10 The TRA was arguably the most comprehensive overhaul of the Federal income tax to date. The tax expenditures in place prior to enactment of TRA represent the high-water mark for tax expenditures as a percentage of the U.S. economy. Relative to the size of the U.S. economy, the combined impact of all tax expenditures reached its highest level, 9 percent of gross domestic product (GDP), in 1986.11 The TRA made sweeping changes to many of these provisions, phasing out, repealing, or limiting the availability of many of the provisions shown in the first part of Table 2.12 Tax reform enacted that year eliminated some tax expenditures and subsequently, tax expenditures declined to about 6 percent of GDP. For comparison, Table 2 presents the most recent estimates (2011 to 2015) of the largest tax expenditures affecting all businesses. While the composition of the list varies between the two periods, most tax expenditures for businesses for both periods seek to lower the cost of capital and increase investment (e.g., accelerated cost recovery, inventory valuation methods). While Table 2 provides a sense of the most important tax expenditures for all businesses, the central focus of this research is to provide estimates of the impact of tax expenditures on small 8 Altshuler and Dietz (2008) note that the interaction between tax expenditure provisions raises a significant issue that is routinely ignored, that is, a list of tax expenditure provisions cannot be summed to determine a total estimate for a group of tax expenditure provisions. Researchers and people interested in the policy implications of tax expenditures frequently sum tax expenditure estimates to provide a “total” tax expenditure estimate. However, researchers have calculated that the summing of tax expenditure estimates typically overstates the magnitude of these estimates by 17.5 percent (Hungerford, 2006) or 25 percent (U.S. Government Accountability Office, 2005). The overstatement of tax expenditure estimates when summed typically represents a larger problem for individual tax expenditures than for tax expenditures primarily utilized by corporations. 9 By far, individuals receive the largest benefit from tax expenditures, receiving more than 80 percent of the combined total of all tax expenditures. Over the past 10 years, most of the growth in tax expenditures has accrued to individuals. 10 Public Law 99–514, 100 Stat. 2085, enacted October 22, 1986. 11 Baneman, D., et al., “Curbing Tax Expenditures,” Tax Policy Center, January 30, 2010. 12 The Congress made sweeping changes to the prior law tax system to achieve fairness, efficiency, and simplicity.

6
Table 2 – Ten Largest Tax Expenditures Affecting All Businesses, Selected Years
(Nominal Dollars in Billions) Rank Description Benefit
Fiscal Years 1987 to 1991† 1 Investment Tax Credit $227.1 2 Accelerated Depreciation on Equipment 82.5 3 Accelerated Depreciation on Structures Other Than Rental Housing 55.1 4 Completed Contract Rules 27.2 5 Non-Recognition on Gain of Property Distributions in Liquidation 26.1 6 Expensing of Research and Development Expenditures 18.0 7 Capital Gains Treatment of Certain Income 14.5 8 Expensing of Exploration and Development Costs (Oil and Gas) 14.2 9 Reduced Rates on First $100,000 of Corporate Taxable Income 50.1
10 Deduction of Unpaid Losses of Property and Casualty Insurance Companies 9.5
Fiscal Years 2013 to 2017‡ 1 Deferral of Active Income of Controlled Foreign Corporations 265.7 2 Deduction for Income Attributable to Domestic Production Activities 78.2 3 Deferral of Gain on Like-Kind Exchanges 47.3 4 Deferral of Gain on Non-Dealer Installment Sales 44.8 5 Credit for Low-Income Housing 36.5 6 Expensing of Research and Experimental Expenditures 33.8 7 Last-In, First-Out Inventory Method 26.5 8 Credit for Increasing Research Activities (Code Section 41) 22.0 9 Expensing Under Section 179 of Depreciable Business Property 21.1
10 Depreciation of Rental Housing in Excess of Alternative Depreciation System 21.0
†Estimates of Federal Tax Expenditures for Fiscal Years 1987 to 1991, Joint Committee on Taxation, March 1, 1986, JCS-7-86. ‡Estimates of Federal Tax Expenditures for Fiscal Years 2012 to 2017, Joint Committee on Taxation, February 1, 2013, JCS-1-13.
businesses. This distinction is important because, despite the fact that small businesses may only account for a small percentage of the total tax expenditures, these incentives may account for a disproportionately high percentage of their operating income.
A. Small Businesses by Entity Official estimates of tax expenditures break out the benefits by whether the recipients are “Individuals” or “Corporations.” However, this dichotomy ignores the fact that most small businesses in the United States organize as sole proprietorships, partnerships, and S corporations and the benefits of many of the tax expenditures used by these entities are attributable to
7
individuals. To the authors’ knowledge, no study to date has tried to estimate the utilization and impact of tax expenditures for small businesses by entity type.13 The standard of what constitutes a small business for data collection purposes varies depending upon the use of the data. For example, there are different definitions of small businesses for Federal contracting purposes and Federal tax purposes. There is no uniform and consistent definition; rather, different definitions may be based on the (1) number of employees, (2) business receipts, or (3) business assets. For purposes of this study, we have identified small businesses organized as pass-through entities as businesses with less than $10 million in gross receipts. For purposes of the study, small businesses organized as C corporations are businesses with less than $10 million in assets. Small businesses in the United States organize according to five different legal structures:
▪ Sole Proprietorships – A sole proprietor is an individual who runs an unincorporated business on his or her own.
▪ Partnerships – A partnership is a group of entities (e.g., individuals or businesses) that
organize to do business together. Each partner contributes money, property, labor, or skill and shares in the profits of the business.
▪ C Corporations – C corporations form when prospective shareholders exchange money,
property, or both in exchange for capital stock of the corporation. Shareholders receive the return on C corporation investment through dividends or capital gains realized when the shareholder sells his or her stock in the corporation.
▪ S Corporations – S corporations are small business corporations that receive the benefits
of limited liability like C corporations, but can elect Federal tax status as a pass-through entity.
▪ Limited Liability Company (LLC) – Limited liability companies are relatively new
business structures authorized under state law. Owners of an LLC, like a corporation, have limited personal liability, but other features of an LLC function more like a partnership, such as the flow-through treatment of LLC owner income. Most LLCs organize as partnerships for federal tax purposes, although a small percentage of LLCs organize as sole proprietorships.14
Table 3 shows small businesses in the U.S. distributed by entity type for 2010, the most recent year that data are available from the Internal Revenue Service (IRS).
13 The most comprehensive look at tax expenditure utilization by small business is The Impact of Tax Expenditure Policies on Incorporated Small Businesses, Innovation & Information Consultants, Inc., 2004. As the title shows, the study only looks at incorporated businesses, or C corporations. 14 A single person LLC whose sole owner is an individual files an individual income tax return with Schedule C, E, or F. A single person LLC whose sole owner is a corporation includes its income and expenses on the corporation’s tax return.

8
Table 3 – Number of Business Returns by Entity Type, 2010
Entity Type Small
Businesses [millions]
All Businesses
[millions] C Corporations 0.9 1.7 S Corporations 2.4 4.1 Partnerships (including LLCs) 2.3 3.2 Non-Farm Sole Proprietorships 23.0 23.0 Total Businesses (excluding farms) 28.6 32.0 Source: IRS Statistics of Income, 2010.
About 89 percent of small businesses organize as sole proprietorships and report their taxable income, deductions, credits and tax liability on Form 1040 (Schedule C).15 Similarly, partnerships and S corporations, because they are pass-through entities, also report their taxable income on Form 1040 (Schedule E). Small businesses that organize as C corporations report their business income and taxes on Form 1120. Therefore, understanding the complete picture of the use and impact of tax expenditures on small businesses requires examining each entity type and the tax advantages afforded each under the tax law.
B. Conceptual Issues 1. Defining Tax Expenditures – Tax expenditures are a measure of the tax benefits provided to various groups of taxpayers and sectors of the economy. Tax expenditures measure the tax benefit actually provided to taxpayers by any reductions in income tax liabilities that result from special tax provisions or regulations. Tax scholars refer to these special tax provisions as tax expenditures because they consider these special provisions to be analogous to direct outlay programs. In other words, outlays and tax expenditures are alternative means of accomplishing similar budget policy objectives. The Congressional Budget and Impoundment Control Act of 1974 (the Budget Act) defines a tax expenditure as revenue losses attributable to provisions of the Federal tax laws which allow a special exclusion, exemption, or deduction from gross income or which provide a special credit, a preferential rate of tax, or a deferral of tax liability.16 The legislative history of the Budget Act indicates that the appropriate measure of tax expenditures is relative to a normal income tax structure (also known as the normal income tax law). Identifying tax provisions as tax expenditures means first considering a broad concept of
15 The percentage of taxable small businesses that organize as sole proprietorships is derived from the Quantria Strategies, LLC individual income tax microsimulation model. 16 Congressional Budget and Impoundment Control Act of 1974 (Pub. L. No. 93-344), sec. 3(3).

9
income, one larger in scope than income concepts defined in general U.S. income tax principles.17 The staff of the Joint Committee on Taxation (JCT) state “the decision to classify provisions as tax expenditures is made on the basis of a broad concept of income that is larger in scope than ‘income’ as defined under general U.S. income tax principles.”18 For individual income taxes, the JCT staff uses a very broad definition of tax expenditures that includes most tax benefits. In general, the JCT staff treats only the following provisions as part of the normal income tax structure: one personal exemption for each taxpayer and one for each dependent, the standard deduction, the existing tax rate schedule, and deductions for investment and employee business expenses. Thus, the JCT staff treats any other tax benefits for individual taxpayers as tax expenditures. For the corporate income tax, the JCT staff treats only the highest corporate marginal income tax rate as part of the normal income tax. 2. JCT vs. OTA Tax Expenditure Estimates – The staff of the JCT and Department of Treasury Office of Tax Analysis (OTA) prepare annual estimates of tax expenditures. The Budget Act requires the staffs to prepare these estimates.19 In their annual report on tax expenditures, the JCT staff says, “tax expenditure analysis can help both policymakers and the public to understand the actual size of government, the uses to which government resources are put, and the tax and economic policy consequences that follow from the implicit or explicit choices made in fashioning legislation.”20
Because of the subjective nature of the tax expenditure definition, the JCT and OTA tax expenditure estimates differ in several respects.21 First, JCT measures each tax expenditure as the difference between tax liability under current law and the tax liability that would result if the tax expenditure provision were repealed and taxpayers were allowed to take advantage of any of the remaining tax expenditure provisions that apply to the income or the expenses associated with the repealed tax expenditure. On the other hand, the OTA measures the tax expenditure as the difference between current law tax liability and the tax liability that would occur if the tax expenditure were repealed and taxpayers could not use any other tax expenditures. Second, the JCT and OTA have different provisions that are considered part of a normal income tax. The JCT staff definition results in a larger number of items defined as tax expenditures. For example, the cash method is treated as a tax expenditure by the JCT, but not by the OTA. In addition, due to the presentation of the provisions, the JCT list of tax expenditures will vary from the OTA list even for items that both agree are tax expenditures. The JCT and OTA tax expenditure estimates also differ because (1) the estimates use differing data sources, (2) the estimates are measured against different revenue baselines, (3) the estimates 17 The list of tax expenditures varies over time so this determination requires a degree of subjectivity and judgment. 18 Joint Committee on Taxation, Estimates of Federal Tax Expenditures for Fiscal Years 2012-2017, JCS-1-13, February 1, 2013, p. 2. 19 The Congressional Budget and Impoundment Control Act of 1974 (P.L. 93-344) requires the CBO to prepare tax expenditure estimates, but historically, the staff of the Joint Committee on Taxation assumed responsibility for preparing the estimates. 20 Joint Committee on Taxation (2013), supra. 21 See Joint Committee on Taxation (2013), supra, pgs. 20-22.

10
span slightly different sets of years, (4) the JCT estimates exclude de minimis amounts (defined as less than $50 million over a five fiscal year period), and (5) the JCT formally incorporates negative tax expenditures (i.e., tax expenditures that result in taxpayers having a worse result than under a normal income tax). This study’s approach to estimating the effects of tax expenditure provisions on small businesses mirrors the approach that is used by JCT to estimate the total effects of the tax expenditure provisions. Data from the IRS Statistics of Income are used to the extent available. Provisions for which IRS data are not available rely on data sources that provide information relevant to the industry or firm behavior, thereby providing a sense of the small businesses’ use of the tax expenditure provisions. The starting point for the analysis relies on the estimates of tax expenditures published by the JCT staff for fiscal year 2013. Because the JCT staff prepares the official revenue estimates of legislation considered by the Congress, the JCT tax expenditure provisions will likely be a starting point for any consideration of legislation to repeal some or all of the tax expenditure provisions. 3. Measuring Tax Expenditures – Tax expenditure estimates differ significantly from revenue estimates. Tax expenditures measure the difference between the tax liability under present law and the tax liability from recalculating taxes without the benefit of the special tax provision. Tax expenditure estimates assume that taxpayer behavior remains unchanged for estimating purposes. This assumption simplifies the calculation and conforms the tax expenditure estimate to budget outlays. However, unlike tax expenditure estimates, all revenue estimates include anticipated taxpayer behavior. Three features distinguish tax expenditure calculations from revenue estimates. Considering the repeal of a tax expenditure provision, the revenue estimate calculation:
incorporates the effects of taxpayer behavioral changes anticipated in response to the repeal of a tax provision;
considers the short-term timing of tax payments rather than focusing on changes in the reported tax liabilities of taxpayers;22 and
considers changes in such other Federal taxes as FICA, excise taxes, estate and gift taxes.
In each case, the tax expenditure calculation does not include any of these effects. Consequently, many policymakers mistakenly view repeal of tax expenditure provisions as an indicator of the revenue raising potential. In many cases, the revenue estimate of repealing a special tax provision produces considerably less revenue compared to the tax expenditure
22 Revenue estimates incorporate the timing of tax payments based on the Federal government’s fiscal years (as opposed to the taxpayer’s fiscal year, which conforms to the calendar year in most cases). The revenue estimate for repeal of a provision would show a smaller revenue gain in the first fiscal year than in subsequent fiscal years. Revenue estimates also reflect some delays in the timing of the revenue gains from (1) taxpayer tendency to postpone or forgo changes in tax withholding and estimated tax payments and (2) transition relief not captured in a tax expenditure calculation.

11
estimate because the tax expenditure estimate does not consider these timing effects and behavioral responses of the affected taxpayers. Also noteworthy is that revenue estimates will consider effective dates and transition relief contained in legislation to repeal tax expenditure provisions as well as interactions with other provisions, which could further affect the potential revenue raised. For these reasons, attempts to sum the estimates of a number of different tax expenditure provisions tends to overstate the impact of these provisions because the summing will not account for potential interaction effects. Specifically, Altshuler and Dietz (2008) note that researchers and people interested in the policy implications of tax expenditures routinely ignore these interaction effects. As a result, researchers and people interested in the policy implications of tax expenditures frequently sum tax expenditure estimates to provide a “total” tax expenditure estimate. However, researchers have calculated that the summing of tax expenditure estimates typically overstates the magnitude of these estimates by 17.5 percent (Hungerford, 2006) or 25 percent (U.S. Government Accountability Office, 2005).23 This research provides sums of the largest tax expenditure provisions utilized by small businesses by entity type. These sums are provided because the summing of tax expenditures provides a way to compare the tax expenditure estimates across entity types and provides an estimate of the relative utilization of tax expenditures.
23 The overstatement of tax expenditure estimates when summed typically represents a larger problem for individual tax expenditures than for tax expenditures primarily utilized by corporations.
12
II. MEASURING TAX EXPENDITURES
A. Methodology for Small Business Measures
1. Modeling Small Business Tax Expenditures – To measure properly the benefit of a tax expenditure as it applies to a single taxpayer, one must perform two calculations. The first calculation considers the tax liability of the taxpayer with the tax expenditure in place. The second calculation considers the tax liability after removing the tax expenditure. The difference in tax liability is the value of the tax expenditure and measures the value of the provision, as defined as the change in tax liability, for this particular taxpayer. Because different businesses face varying tax circumstances, notwithstanding the presence of tax expenditures, microsimulation is usually the preferred tool used to measure the aggregate effect and impact of tax expenditures and their effect on different groups of taxpayers. In microsimulation, the analysis calculates aggregate results from the “bottom up,” by adding the tax changes calculated separately for individual taxpayers. This research relies principally on Quantria Strategies, LLC’s individual income tax simulation model to calculate the utilization and value of major tax expenditure programs that affect sole proprietorships, partnerships (including LLCs) and S corporations. The basis of the model is a stratified random sample of individual tax returns filed by U.S. taxpayers. To this dataset are added demographic, employment and labor force information from the Current Population Survey (CPS) by way of a robust statistical matching algorithm.24 A fundamental component of the model is a computer program that performs detailed calculations of the tax liability of each taxpayer given the tax law and parameters (e.g., tax rates and brackets) in place for the current year of analysis. While the information available on the public use files (PUF) is quite extensive, there are likely to be cases where data that are more specific are necessary to calculate accurately the value of certain tax expenditures. For these situations, statistical imputation methods fill in the necessary detail. Many of the tax expenditures affecting small businesses have a minimal or negligible effect on tax liability and to keep the scope of this research manageable and accessible, the analysis does not include these provisions.25 Many tax expenditures express the current-law benefit of depreciation and expensing of property, plant and equipment relative to the timing of the deductions under the Alternative Depreciation System.26 This dynamic component of the estimate is captured by relying on Quantria’s depreciation model. This model simulates the aggregate investment flows and 24 The algorithm used here is termed “constrained statistical matching.” This approach is so-named because all the records on both files appear in the final dataset. 25 In addition, the data will not support the calculation of many small or negligible tax provisions. Omitting these items is not believed to affect the results. 26 There is an alternative depreciation system, under which depreciation deductions occur over periods longer than under Modified Accelerated Cost Recovery System (MACRS) using the straight-line method.

13
calculates the resulting depreciation deductions under both tax systems to obtain the value of the tax expenditure. The value of tax expenditures for those small businesses organized as C corporations is calculated using, both published IRS data contained in the Corporate Source Book (CSB) and Corporate Statistics of Income (SOI). These calculations are augmented with simulation results of corporate tax liability obtained from Quantria’s corporate income tax model. Because the Quantria model relies on the public filings (i.e., 10-Ks) of the Standard and Poor’s 500, the results of the simulations are not directly extensible to small businesses. Nevertheless, the model is used to fine-tune the results derived from the CSB and SOI. The following sections present results of the tax expenditure calculations separately, by entity type. Tax expenditure estimates are calculated for tax year 2013, with the current tax laws in place. To arrive at these estimates, the underlying data are extrapolated or “aged” to hit aggregate control totals reported by the IRS and with macroeconomic forecasts provided by the Congressional Budget Office (CBO). By relying on microsimulation to calculate the value of specific tax expenditures, accurate estimates of the tax benefits are obtained. Because of the diversity in small businesses, this approach captures the different tax situation faced by otherwise identical firms. Additionally, the approach allows the identification of the different entity types that comprise small businesses and the different tax laws they face. 2. Data Limitations and Measurement Problems – Tax expenditure analysis inherently faces challenges relating to data availability and measurement. Year to year differences to tax expenditure estimates may reflect changes in the law. For example, changes in income tax rates will affect tax expenditure estimates in years after the rate changes take effect. The JCT identifies a number of tax expenditures for which quantification is not available. In some cases, these provisions would require information from a source (such as a foreign government) not likely to provide the required information. In other cases, insufficient reporting of activities makes it impossible to estimate the size of certain tax expenditure provisions with any certainty. The JCT staff identified 32 tax expenditure provisions for which quantification is not available in their most recent tax expenditure estimates.27 For purposes of the analysis in this paper, any tax expenditure for which the JCT staff indicates that quantification is not available are ignored. A 2013 study by the Government Accountability Office (GAO) identified some of the challenges that exist when trying to evaluate the use of tax expenditure provisions.28 GAO estimated that information with respect to nearly $500 billion of the $1 trillion tax expenditures is available on tax forms filed with the Internal Revenue Service (IRS). This suggests that evaluating systematically certain provisions is a difficult task, requiring additional resources beyond the IRS data. 27 Joint Committee on Taxation (2013), supra. 28 United States Government Accountability Office. Tax Expenditures. IRS Data Available for Evaluations are Limited. GAO-13-479, April 2013.

14
An additional challenge exists because some tax expenditure provisions do not involve information that would be readily available from a specified data source. For example, the tax expenditure provision to allow the use of cash accounting in lieu of accrual accounting is not readily available from tax data. In some cases, the tax expenditure estimates rely on statistics for income, deductions, and expenses from prior years, requiring an analysis of multiple years of data. For example, accelerated depreciation tax expenditure estimates measure the tax benefits of depreciation under current law compared to the depreciation deductions that would occur in the current year if investments in the current year and all prior years assume the taxpayer claimed depreciation expenses under the alternative depreciation system.

15
III. ESTIMATES OF TAX EXPENDITURES BY ENTITY FOR SMALL BUSINESSES Table 4, below, provides a summary of our estimates of the largest tax expenditures for small businesses by entity types. The table shows that different tax expenditures are important for different forms of small business. Table 4 includes only the 16 provisions for which the 2013 tax expenditure estimates exceed $500 million in total for all small business entities. Excluded from the list are certain provisions that provide significant benefits for certain types of entities or entities operating in specific industries, but for which the 2013 total tax expenditure estimate does not exceed $500 million (see Table 9 in Appendix B). Examples of the types of provisions that are excluded from the list of the largest tax expenditures for small businesses in Table 4, but provide significant benefits to certain types of entities includes the following items: The credit for employer-paid FICA taxes on tips, which totals $482 million for all small business entities for 2013, with 88.4
percent of the benefits going to small partnerships ($180 million) and small S corporations ($246 million); The expensing of research and experimental expenditures, which totals $479 million for all small business entities for 2013,
with 80.8 percent of the benefits going to small C corporations ($387 million); and The special tax rate for qualified timber gains, which totals $475 million for all small business entities for 2013, with 85.9
percent of the benefits going to small sole proprietorships ($237 million) and small S corporations ($171 million). Thus, the tax expenditures in Table 4 represent the most commonly utilized tax expenditures by small businesses.29
Table 4 – Summary of Largest Tax Expenditures for Small Businesses, By Entity Type, Fiscal Year 20131 [amounts in billions; numbers in thousands]
Tax Expenditure Item
Sole Proprietors Partnerships S Corporations C Corporations Total Amount for All Entities
Total Amount
Number of Entities
Total Amount
Number of Entities
Total Amount
Number of
Entities
Total Amount
Number of Entities
Retirement plans (Keogh Plans) 0.234 1,087.5 3.632 324.6 6.665 158.2 n/a n/a 10.531 Exclusion of interest on state and local private activity bonds 0.546 315.2 3.020 272.9 1.840 279.9 0.600 8.7 6.006 Deduction for health insurance premiums and long-term care insurance premiums by the self-employed 1.878 3,178.0 1.323 617.9 1.989 953.4 n/a n/a 5.190
29 Refer to Table 9 in Appendix B for a more complete picture of tax expenditure use by specific types of entities or by entities in a specific industry.

16
Table 4 – Summary of Largest Tax Expenditures for Small Businesses, By Entity Type, Fiscal Year 20131 [amounts in billions; numbers in thousands]
Tax Expenditure Item
Sole Proprietors Partnerships S Corporations C Corporations Total Amount for All Entities
Total Amount
Number of Entities
Total Amount
Number of Entities
Total Amount
Number of
Entities
Total Amount
Number of Entities
Expensing under section 179 of depreciable business property 0.268 1,440.2 2.361 434.3 1.920 862.0 0.072 12.8 4.621 Deduction for income attributable to domestic production activities 0.377 462 2.083 434.3 1.269 923.6 0.204 15.7 3.933 Depreciation for equipment in excess of alternative depreciation system 0.203 – 0.228 – 0.724 –
2.676 – 3.832
Exclusion of interest on public purpose State and local government bonds 0.335 787.9 1.851 545.8 1.127 466.6 0.320 2.7 3.633 Depreciation of rental housing in excess of alternative depreciation system 0.826 1,800.3 0.454 434.3 1.920 862.0 0.072 12.8 3.272 Exclusion of investment income on life insurance and annuity contracts 0.483 3,184.7 1.093 1,845.8 0.881 1,298.1 0.502 – 2.959 Deferral of gain on like-kind exchanges 0.295 278.3 0.667 157.7 0.538 128.0 0.911 9.8 2.411 Deferral of gain on non-dealer installment sales 0.000 (*) 1.148 489.7 0.152 101.7 0.511 56.8 1.811 Tax credit for small businesses purchasing employer health insurance 0.541 63.0 0.382 83.9 0.574 60.7 0.300 778.0 1.797 Cash accounting, other than agriculture 0.088 1,098.6 0.436 566.6 0.501 775.6 n/a n/a 1.025 Last-in, first-out inventory method 0.015 54.4 0.272 315.4 0.272 234.1 0.306 56.0 0.865 Exemption from imputed interest rules 0.048 89.5 0.238 23.1 0.273 20.7 0.158 (*) 0.717 Income recognition rule for gain or loss from section 1256 contracts (*) 309.2 0.605 438.1 0.027 142.2 (*) (*) 0.630 Total Largest Tax Expenditures for Small Businesses: 6.137 19.793 20.672 6.632 53.234
Total, All Tax Expenditures for Small Business 6.747 21.030 21.242 8.536 57.555 (*) less than $50 million. n/a = Not applicable. 1 Items are included in the list of the largest tax expenditures if the 2013 total tax expenditure estimate for all small business entities exceeds $.5 billion.
17
Several of the largest tax expenditure provisions for small businesses are limited to sole proprietorships, partnerships, and S corporations. Among these provisions are the deduction for health insurance premiums and long-term care insurance premiums for self-employed individuals, the retirement plan provisions (Keogh plans), and the cash method of accounting. With respect to the self-employed health insurance and long-term care insurance premium deduction and the provisions relating to Keogh plans, these provisions are intended to provide treatment for self-employed individuals that is comparable to the treatment provided to employees of corporations. The current Administration references approximately 18 provisions that have been enacted to provide tax relief to small businesses. This list includes provisions to encourage investment activity (accelerated cost recovery and reduced capital gains rates for certain taxpayers), several incentives to encourage hiring (tax credits), provisions to reduce compliance burdens for small businesses, tax rate reductions, and several provisions to defray the cost of employee benefits (health care credits and deductibility of self-employed health).30 Many of these targeted small business provisions were temporary in nature and expired before 2013. While beneficial to small businesses for a temporary period, many of these provisions do not coincide with the tax expenditures that are permanent provisions of the tax code. The utilization of tax expenditures is not linear across entity types. It is estimated that small partnerships ($21.030 billion in total tax expenditures for 2013) and small S corporations ($21.242 billion in total tax expenditures for 2013) utilize approximately 73 percent of all small business tax expenditures ($57.555 billion) in 2013. However, this statistic is likely more reflective of the relative incomes attributable to these entities than to the nature of the tax expenditures. The largest tax expenditure provisions utilized by small businesses are different from the largest tax expenditures utilized by all businesses. For example, the single largest large business tax expenditure in 2013 is the deferral of active income of controlled foreign corporations, which totals $42.4 billion in 2013, but provides no benefit to small businesses.31 In fact, the cost of this single tax expenditure for large multinational corporations represents nearly 74 percent of the value of the total tax expenditures utilized by all small businesses ($57.555 billion) for 2013. The following sections review the largest tax expenditures by small business entity type for 2013. Some of these provisions are not available to all small business entities (e.g., the self-
30 Provisions widely cited include: 100 percent bonus depreciation (Small Business Jobs Act available for 2010; Tax Relief Act of 2010 available for 2011); tax cuts for businesses hiring someone out of work for at least 2 months (Hiring Incentives to Restore Employment Act); tax credit to hire unemployed veterans (VOW to Hire Heroes Act); Work Opportunity Tax Credit (2011 Veterans Opportunity Act); health care tax credit for small businesses; increased expensing to $500,000 for 2010 and 2011; 0 percent capital gains rates for key small business investments for 2010; temporary reduction in recognition period for built-in gains tax; 5-year carryback for qualified small business losses; double the deduction for startup expenses (temporary increase from $5,000 to $10,000, but subsequently made permanent); self-employed health deduction to 100 percent for 2010; permit businesses to deduct mobile phone expenses; limited penalties for tax errors capped at 75 percent of error amount; special rule for long term contract accounting (previous 9 provisions enacted as part of the Small Business Jobs Act); temporary payroll tax exemption (expired); lower estimated tax payments from 100 percent to 90 percent (Recovery Act); AMT relief (numerous bills); and extending middle-class tax cuts (purported to help 97 percent of small business owners). 31 Joint Committee on Taxation (2013), supra.
18
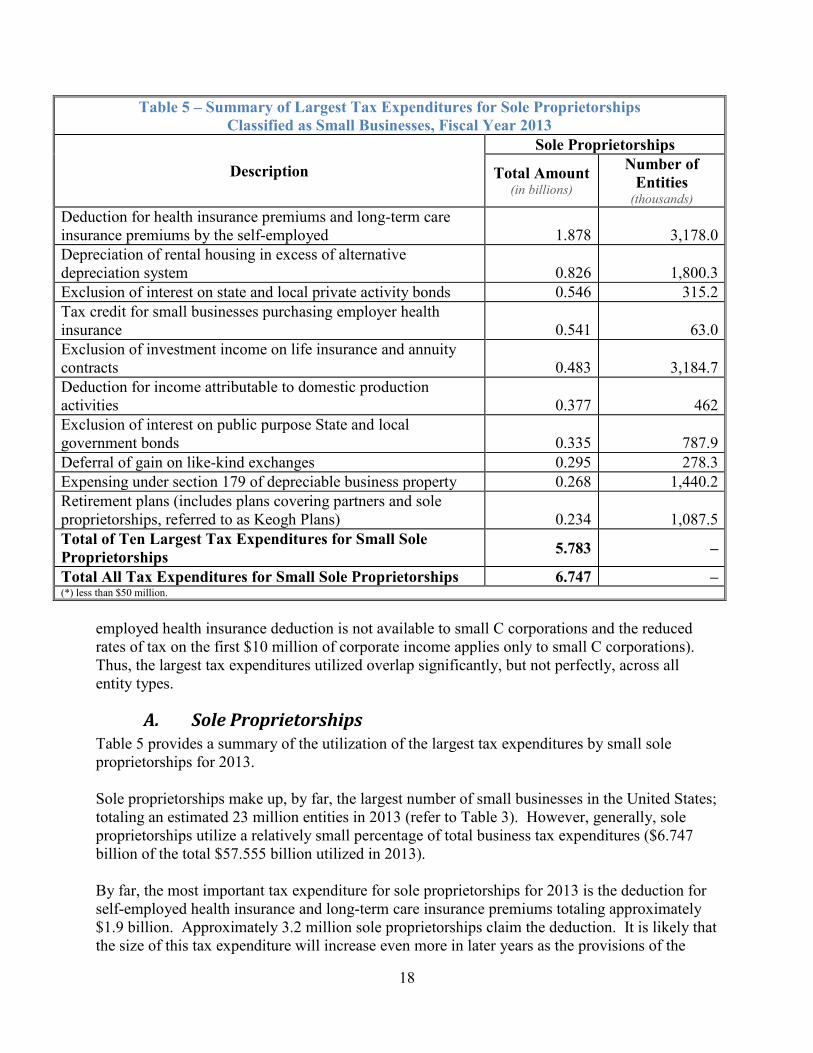
Table 5 – Summary of Largest Tax Expenditures for Sole Proprietorships Classified as Small Businesses, Fiscal Year 2013
Description
Sole Proprietorships
Total Amount (in billions)
Number of Entities
(thousands) Deduction for health insurance premiums and long-term care insurance premiums by the self-employed 1.878 3,178.0 Depreciation of rental housing in excess of alternative depreciation system 0.826 1,800.3 Exclusion of interest on state and local private activity bonds 0.546 315.2 Tax credit for small businesses purchasing employer health insurance 0.541 63.0 Exclusion of investment income on life insurance and annuity contracts 0.483 3,184.7 Deduction for income attributable to domestic production activities 0.377 462 Exclusion of interest on public purpose State and local government bonds 0.335 787.9 Deferral of gain on like-kind exchanges 0.295 278.3 Expensing under section 179 of depreciable business property 0.268 1,440.2 Retirement plans (includes plans covering partners and sole proprietorships, referred to as Keogh Plans) 0.234 1,087.5 Total of Ten Largest Tax Expenditures for Small Sole Proprietorships 5.783 –
Total All Tax Expenditures for Small Sole Proprietorships 6.747 – (*) less than $50 million.
employed health insurance deduction is not available to small C corporations and the reduced rates of tax on the first $10 million of corporate income applies only to small C corporations). Thus, the largest tax expenditures utilized overlap significantly, but not perfectly, across all entity types.
A. Sole Proprietorships Table 5 provides a summary of the utilization of the largest tax expenditures by small sole proprietorships for 2013. Sole proprietorships make up, by far, the largest number of small businesses in the United States; totaling an estimated 23 million entities in 2013 (refer to Table 3). However, generally, sole proprietorships utilize a relatively small percentage of total business tax expenditures ($6.747 billion of the total $57.555 billion utilized in 2013). By far, the most important tax expenditure for sole proprietorships for 2013 is the deduction for self-employed health insurance and long-term care insurance premiums totaling approximately $1.9 billion. Approximately 3.2 million sole proprietorships claim the deduction. It is likely that the size of this tax expenditure will increase even more in later years as the provisions of the

19
Affordable Care Act begin to take effect in 2014. In addition, the Affordable Care Act contains a tax credit for small businesses purchasing health insurance, which is also important to small sole proprietorships, providing approximately $540 million in 2013 to approximately 63,000 sole proprietorships. Tax expenditures relating to business investment are also important to sole proprietorships. The deduction for income attributable to domestic production activities provides approximately $380 million in benefits for 2013 to 462,000 small sole proprietorships. Tax expenditures relating to depreciable property are also important to small sole proprietorships. The deduction for section 179 expensing provides approximately $270 million in benefits for 2013 to more than 1.4 million sole proprietorships. The deduction for depreciation of rental housing in excess of the alternative depreciation system provides approximately $826 million in benefits in 2013 to 1.8 million sole proprietorships. These provisions encourage sole proprietorships to invest in U.S. manufacturing activities and equipment. In addition to the direct benefits of section 179 expensing, there are indirect benefits from this provision. Section 179 expensing allows eligible taxpayers to claim deductions for purchases of business equipment in the year the equipment is purchased (up to a dollar limit) in lieu of recovering these costs through complicated depreciation deductions. Thus, there are indirect benefits from section 179 expensing that are not captured in the tax expenditure benefits, such as the reduced costs of compliance with respect to business equipment purchases. The exclusion of interest on private activity bonds ($546 million) and on state and local government bonds ($335 million) provide almost $900 million of benefits to small sole proprietorships in 2013. These provisions were utilized by approximately 315,000 and 788,000 small sole proprietorships, respectively.
B. Partnerships Table 6 provides a summary of the utilization of tax expenditures by small partnerships for 2013. For 2013, approximately 2.4 million small partnerships will conduct business in the United States (refer to Table 3). Small partnerships utilized many of the same tax expenditure provisions utilized by small sole proprietorships. As with small sole proprietorships, the deduction for health insurance and long-term care insurance premiums of the self-employed and the provisions relating to Keogh plans provide significant benefits to small partnerships. For 2013, the provisions relating to Keogh plans provide more than $3.6 billion of benefits to approximately 325,000 small partnerships. The self-employed health and long-term care insurance premium deduction provides more than $1.3 billion of benefits to approximately 620,000 small partnerships. Although not on the list of the largest tax expenditures, the tax credit for small businesses purchasing employer health insurance provides approximately $380 million of benefits to 84,000 small partnerships in 2013 (see Table 4).

20
Table 6 – Summary of Largest Tax Expenditures for Partnerships Classified as Small Businesses, Fiscal Year 2013
Description
Partnerships
Total Amount (in billions)
Number of Entities
(thousands) Retirement plans (Keogh Plans) 3.632 324.6 Exclusion of interest on state and local private activity bonds 3.020 272.9 Expensing under section 179 of depreciable business property 2.361 434.3 Deduction for income attributable to domestic production activities 2.083 434.3 Exclusion of interest on public purpose State and local government bonds 1.851 545.8 Deduction for health insurance premiums and long-term care insurance premiums by the self-employed 1.323 617.9 Deferral of gain on non-dealer installment sales 1.148 489.7 Exclusion of investment income on life insurance and annuity contracts 1.093 1,845.8 Deferral of gain on like-kind exchanges 0.667 157.7 Income recognition rule for gain or loss from section 1256 contracts 0.605 438.1 Depreciation for rental housing in excess of alternative depreciation system 0.454 434.3 Total of Ten Largest Tax Expenditures for Small Partnerships 18.237 – Total All Tax Expenditures for Small Partnerships 21.030 – The exclusion of interest from private activity bonds ($3.020 billion) and from state and local government bonds ($1.851 billion) provide nearly $5 billion in benefits for 2013 to 273,000 and 546,000 small partnerships, respectively. Several of the largest tax expenditures provide important benefits to small partnerships, including the deduction for income attributable to domestic production activities ($2.1 billion) utilized by approximately 434,000 small partnerships and the deferral of gain on non-dealer installment sales ($1.1 billion) utilized by approximately 490,000 small partnerships, and the self-employed health insurance deduction ($1.3 billion) utilized by approximately 618,000 small partnerships. Another provision with important benefits for small partnerships, the income recognition rule for gain or loss from section 1256 contracts, provides approximately $600 million in benefits for 2013 to 438,000 small partnerships.

21
C. S Corporations Table 7 provides a summary of the utilization of tax expenditures by small S corporations for 2013.
Table 7 – Summary of Largest Tax Expenditures for S Corporations Classified as Small Businesses, Fiscal Year 2013
Description
S Corporations
Total Amount (in billions)
Number of Entities
(thousands) Retirement plans (Keogh Plans) 6.665 158.2 Deduction for health insurance premiums and long-term care insurance premiums by the self-employed 1.989 953.4 Expensing under section 179 of depreciable business property 1.920 862.0 Depreciation of rental housing in excess of alternative depreciation system 1.920 862.0 Exclusion of interest on state and local private activity bonds 1.840 279.9 Deduction for income attributable to domestic production activities 1.269 923.6 Exclusion of interest on public purpose State and local government bonds 1.127 466.6 Exclusion of investment income on life insurance and annuity contracts 0.881 1,298.1 Tax credit for small businesses purchasing employer health insurance 0.574 60.7 Deferral of gain on like-kind exchanges 0.538 128.0 Total of Ten Largest Tax Expenditures for Small S Corporations 18.723 – Total All Tax Expenditures for Small S Corporations 21.242 – The largest single tax expenditure for 2013 for small S corporations is the provision relating to retirement plans, totaling $6.665 billion and utilized by approximately 158,000 small S corporations. As with small sole proprietorships and partnerships, the provisions relating to health insurance are also important to small S corporations. The self-employed health insurance deduction provides approximately $1.99 billion of benefits to small S corporations in 2013. The tax credit for small businesses purchasing health insurance provides $574 million of benefits for 2013. The deduction for income attributable to domestic production activities provides approximately $1.3 billion of benefits to small S corporations in 2013. Certain of the depreciation provisions

22
are also important to small S corporations, with the deduction for depreciation in excess of the alternative depreciation system providing approximately $1.9 billion of benefits and the section 179 expensing provision providing approximately $1.1 billion of benefits. The exclusion of interest on private activity bonds and on state and local government bonds provides $1.8 billion and $1.1 billion of benefits in 2013 to 280,000 and 467,000 small S corporations, respectively.
D. C Corporations Table 8 provides a summary of the largest tax expenditures utilized by small C corporations for 2013.
Table 8 – Summary of Largest Tax Expenditures for C Corporations Classified as Small Businesses, Fiscal Year 2013
Description
C Corporations
Total Amount (in billions)
Number of Entities
(in thousands) Depreciation for equipment in excess of alternative depreciation system 2.676 – Deferral of gain on like-kind exchanges 0.911 9.8 Exclusion of interest on state and local private activity bonds 0.600 8.7 Deferral of gain on non-dealer installment sales 0.511 56.8 Exclusion of investment income on life insurance and annuity contracts 0.502 – Expensing of research and experimental expenditures 0.387 56.8 Exclusion of interest on public purpose State and local government bonds 0.320 2.7 Last-in, first-out inventory method 0.306 56.0 Tax credit for small businesses purchasing employer insurance 0.300 778.0 Reduced rates on first $10 million of corporate taxable income 0.252 63.3 Total of Ten Largest Tax Expenditures for Small C Corporations 6.765 – Total All Tax Expenditures for Small C Corporations 8.536 – Small C corporations do not show utilization of the self-employed health insurance deduction and the retirement plan provisions as part of the business tax expenditure estimates. However, the employees of C corporations are entitled to favorable tax treatment with respect to their employer-provided health insurance and employer-provided retirement savings contributions.
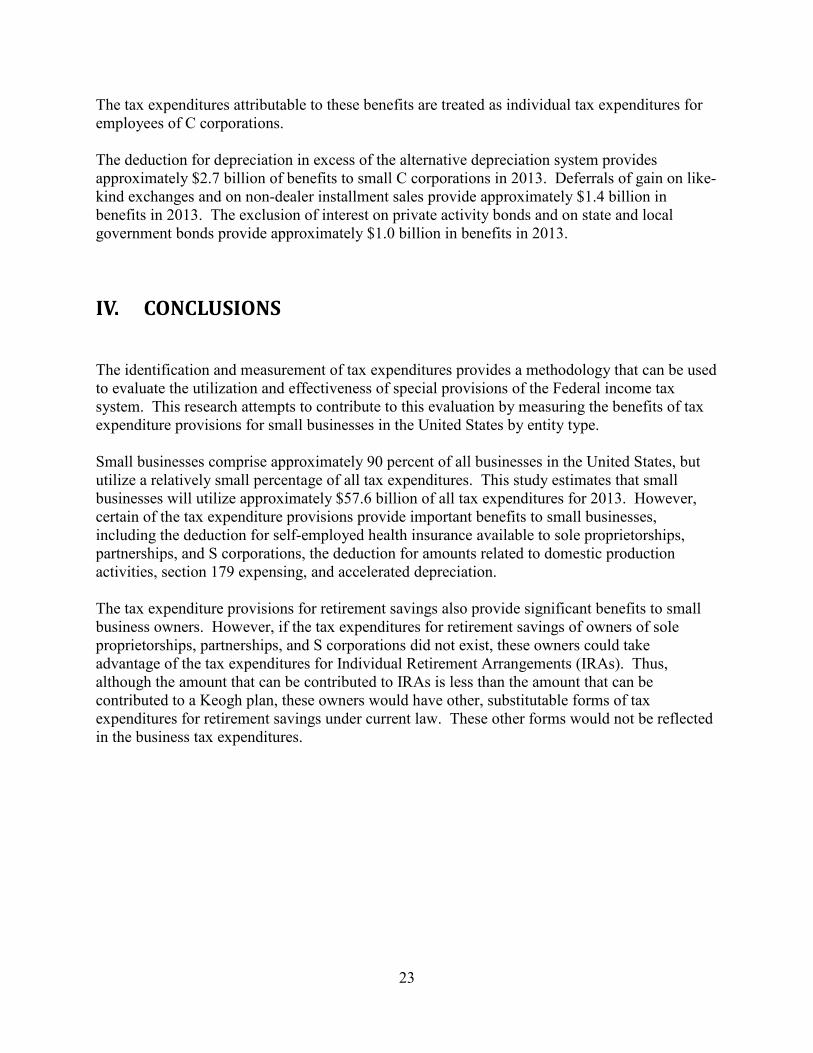
23
The tax expenditures attributable to these benefits are treated as individual tax expenditures for employees of C corporations. The deduction for depreciation in excess of the alternative depreciation system provides approximately $2.7 billion of benefits to small C corporations in 2013. Deferrals of gain on like-kind exchanges and on non-dealer installment sales provide approximately $1.4 billion in benefits in 2013. The exclusion of interest on private activity bonds and on state and local government bonds provide approximately $1.0 billion in benefits in 2013.
IV. CONCLUSIONS
The identification and measurement of tax expenditures provides a methodology that can be used to evaluate the utilization and effectiveness of special provisions of the Federal income tax system. This research attempts to contribute to this evaluation by measuring the benefits of tax expenditure provisions for small businesses in the United States by entity type. Small businesses comprise approximately 90 percent of all businesses in the United States, but utilize a relatively small percentage of all tax expenditures. This study estimates that small businesses will utilize approximately $57.6 billion of all tax expenditures for 2013. However, certain of the tax expenditure provisions provide important benefits to small businesses, including the deduction for self-employed health insurance available to sole proprietorships, partnerships, and S corporations, the deduction for amounts related to domestic production activities, section 179 expensing, and accelerated depreciation. The tax expenditure provisions for retirement savings also provide significant benefits to small business owners. However, if the tax expenditures for retirement savings of owners of sole proprietorships, partnerships, and S corporations did not exist, these owners could take advantage of the tax expenditures for Individual Retirement Arrangements (IRAs). Thus, although the amount that can be contributed to IRAs is less than the amount that can be contributed to a Keogh plan, these owners would have other, substitutable forms of tax expenditures for retirement savings under current law. These other forms would not be reflected in the business tax expenditures.

24
REFERENCES This list represents a relatively comprehensive list of papers on the topic of tax expenditures, particularly papers that relate to the identification and measurement of tax expenditures. Many, but not all, of these papers are cited in this paper. Some of the papers relate primarily to individual income tax expenditures, which are not the subject of this paper. Ackerman, Deena and Gerald Auten. Tax Expenditures for Noncash Charitable Contributions.
National Tax Journal, 64 (2, Part 2), June 2011. Altshuler, Roseanne and Robert Dietz. Tax Expenditure Estimation and Reporting: A Critical
Review. NBER Working Paper No. 14263, November 2008. Altshuler, Roseanne and Robert Dietz. Reconsidering Tax Expenditure Estimation. National
Tax Journal, 64 (2, Part 2), June 2011. Bakija, Jon and Bradley T. Heim. How Does Charitable Giving Respond to Incentives and
Income? New Estimates From Panel Data. National Tax Journal, 64 (2, Part 2), June 2011.
Baneman, Daniel, Joseph Rosenberg, Eric Toder, and Roberton Williams. Curbing Tax
Expenditures. Tax Policy Center, Urban Institute and Brookings Institution, January 30, 2012.
Bartlett, Bruce. The End of Tax Expenditures As We Know Them? 92 Tax Notes 413 (2001). Bartlett, Bruce. The Flawed Concept of Tax Expenditures. National Center for Policy Analysis,
February 13, 2002. Bartlett, Bruce. Misunderstanding Tax Expenditures and Tax Rates. Tax Notes, November 22,
2010. Batchelder, Lily and Eric Toder. Government Spending Undercover. Spending Programs
Administered by the IRS. Center for American Progress, April 2010. Bittker, Boris. Accounting for Federal “Tax Subsidies” in the National Budget. 22 National
Tax Journal 244 (1969). Bradford, David. Reforming Budgetary Language. NBER Working Paper No. 8500, 2001. Buckley, John L. Tax Expenditure Reform: Some Common Misconceptions. Tax Notes, July 18,
2011.

25
Burman, Leonard E. and Marvin M. Phaup. Could Reducing Tax Expenditures Tame the Federal Debt? Scholars Strategy Network, October 2012. Accessed at www.scholarstrategynetwork.org.
Burman, Leonard E., Christopher Geissler, and Eric J. Toder. How Big are Total Individual
Income Tax Expenditures and Who Benefits From Them? American Economic Review 98(2): 79-83, 2008.
Burman, Leonard E., Christopher Geissler, and Eric Toder. The Growth, Distribution, and
Opportunity Cost of Individual Income Tax Expenditures. For presentation at the American Social Science Associations Annual Meeting, Draft – December 29, 2007.
Burman, Leonard. Is the Tax Expenditure Concept Still Relevant? National Tax Journal, 56,
September 2003. Burman, Leonard. Tax Expenditures, the Size and Efficiency of Government, and Implications
for Budget Reform. National Bureau of Economic Research NBER Working Paper No. 17268, August 2011.
Burton, Mark and Kerrie Sadiq. Tax Expenditure Management A Critical Assessment.
Cambridge University Press: Cambridge, 2013. Caperton, Richard W. and Sima J. Gandhi. America’s Hidden Power Bill. Examining Federal
Energy Tax Expenditures. Center for American Progress, April 2010. Carroll, Robert, David Joulfaian, and James Mackie. Income versus Consumption Tax Baselines
for Tax Expenditures. National Tax Journal, 64 (2, Part 2), June 2011. Committee on the Budget, United States Senate. Tax Expenditures: Compendium of
Background Material on Individual Provisions. S. Prt. 112-45, 112th Cong., 2d Session, December 2012.
Congressional Budget Office. The Distribution of Major Tax Expenditures in the Individual
Income Tax System. May 2013. Congressional Budget Office. The Effects of Tax Reform on Tax Expenditures. March 1988. Congressional Budget Office. Tax Expenditures: Budget Control Options and Five-Year Budget
Projections for Fiscal Years 1983-1987. November 1982. Davie, Bruce F. Tax Expenditures in the Federal Excise Tax System. National Tax Journal
47(1), 39-62, March 1994. Eissa, Nada and Hilary Hoynes. Redistribution and Tax Expenditures: The Earned Income Tax
Credit. National Tax Journal, 64 (2, Part 2), June 2011.

26
Faricy, Christopher G. The Politics of Private Social Welfare in America: Political Parties and Tax Expenditures. Journal of Politics 73(1): 74-83, 2011.
Feldstein, Martin, Daniel Feenburg, and Maya MacGuineas. Capping Individual Tax
Expenditure Benefits. National Bureau of Economic Research, Working Paper 16921, April 2011.
Fichtner, Jason and Jacob Feldman. When are Tax Expenditures Really Spending? Tax
Expenditures and Lessons From the Tax Reform Act of 1986. Mercatus Center, George Mason University, Working Paper No. 11-45, November 2011.
Fiekowsky, Seymour. The Relation of Tax Expenditures to the Distribution of the “Fiscal
Burden.” Canadian Taxation, 2, 1980. Fleming, J. Clifton and Robert J. Peroni. Can Tax Expenditure Analysis Be Divorced From a
Normative Tax Base? A Critique of the “New Paradigm” and Its Denouement. Virginia Tax Review, Vol 30:13, 2010.
Fleming, J. Clifton and Robert J. Peroni. Reinvigorating Tax Expenditure Analysis and the
International Dimension. 27 Virginia Tax Review 101, 196-197 (2008). Forman, Jonathan Barry. Why Don’t We Repeal Most Tax Expenditures? Journal of Tax
Practice and Procedure, August-September 2006. Forman, Jonathan Barry. Would a Social Security Tax Expenditure Budget Make Sense? Public
Budgeting and Financial Management, 5, 1993, pp. 311-335. Furchtgott-Roth, Diana. How Tax Expenditures Hurt the Economy -- And What to Do About It.
Manhattan Institute for Policy Research, Issue 2012, No. 9, April 2012. Gandhi, Sima J. Audit the Tax Code: Doing What Works for Tax Expenditures. Center for
American Progress, 8, April 2010. Gandhi, Sima J. Cracking the Code: A Closer Look at Tax Expenditure Spending. Center for
American Progress, 2, March 2010. Gist, John R. Spending Entitlements and Tax Entitlements. AARP Public Policy Institute
#2007-10, May 2007. Gravelle, Jane G. and Thomas L. Hungerford. The Challenge of Individual Income Tax Reform:
An Economic Analysis of Tax Base Broadening. Congressional Research Service, R42435, March 22, 2012.
Gruber, Jonathan. The Tax Exclusion for Employer-Sponsored Health Insurance. National Tax
Journal, 64 (2, Part 2), June 2011.

27
Guthrie, Susan J. and James R. Hines Jr. U.S. Defense Contracts During the Tax Expenditure Battles of the 1980s. National Tax Journal, 64 (2, Part 2), June 2011.
Hanlon, Seth. Six Principles for Tax Expenditure Reform. Common-Sense Guidelines for
Policymakers as They Tackle Badly Needed Reform of Hidden Tax Code Spending. Center for American Progress, October 2011.
Hanlon, Seth and Michael Ettlinger. Cut Spending in the Tax Code. Wasteful Spending in the
Tax Expenditure Budget is Fertile Ground for Deficit Reduction. Center for American Progress, March 2011.
Haselswerdt, Jake and Brandon Bartels. Comparing Attitudes Toward Tax Breaks and Spending:
Evidence from a Survey Experiment, presented at the Social Science History Association Annual Meeting (November 17, 2011) and the DC-Area American Politics Workshop (January 9, 2012).
Horpedahl, Jeremy and Brandon M. Pizzola. A Trillion Little Subsidies: The Economic Impact
of Tax Expenditures in the Federal Income Tax Code. Mercatus Center, George Mason University, October 24, 2012.
Howard, Christopher. The Hidden Welfare State: Tax Expenditures and Social Policy in the
United States. Princeton, NJ: Princeton University Press, 1997. Huang, Chye-Ching and Hannah Shaw. New Analysis Shows “Tax Expenditures” Overall Are
Costly and Regressive. Center on Budget and Policy Priorities, February 23, 2009. Hungerford, Thomas L. Tax Expenditures and the Federal Budget. Congressional Research
Service, June 1, 2011. Hungerford, Thomas L. Tax Expenditures: Good, Bad, or Ugly? Tax Notes Vol. 113, No. 4,
October 23, 2006. Hungerford, Thomas L. Tax Expenditures: Trends and Critiques. Congressional Research
Service, RL33641, September 13, 2006. The Impact of Tax Expenditure Policies on Incorporated Small Businesses. Innovation &
Information Consultants, Inc., for the Small Business Administration Office of Advocacy. SBAHQ-02-Q-0027, April 2004.
Internal Revenue Service, Office of the National Taxpayer Advocate. 2010 Annual Report to the
Congress. Evaluate the Administration of Tax Expenditures. Johnson, Calvin H. Measure Tax Expenditures by Internal Rate of Return. Tax Notes, April 15,
2013.

28
Joint Committee on Taxation, United States Congress. Background Information on Tax Expenditure Analysis and Historical Survey of Tax Expenditure Estimates. JCX-15-11, March 9, 2011.
Joint Committee on Taxation, United States Congress. Estimates of Federal Tax Expenditures
for Fiscal Years 2008-2012. JCS-2-08, October 31, 2008. Joint Committee on Taxation, United States Congress. Estimates of Federal Tax Expenditures
for Fiscal Years 2009-2013. JCS-1-10, January 11, 2010. Joint Committee on Taxation, United States Congress. Estimates of Federal Tax Expenditures
for Fiscal Years 2012-2017. JCS-1-13, February 1, 2013. Joint Committee on Taxation, United States Congress. A Reconsideration of Tax Expenditure
Analysis. JCX-37-08, May 12, 2008. Judging Tax Expenditures. Spending Programs Buried within the Nation’s Tax Code Need to be
Reviewed. Citizens for Tax Justice, November 13, 2009. Kahn, Douglas and Jeffrey Lehman. Tax Expenditure Budgets: A Critical View. 54 Tax Notes
1661, 1992. Kleinbard, Edward. Tax Expenditure Framework Legislation. USC Center in Law, Economics,
and Organization Research Paper No. C10-1, USC Legal Studies Research Papers No. 10-1. National Tax Journal, 63(2), 353-382, June 2010.
Kleinbard, Edward. The Congress Within the Congress: How Tax Expenditures Distort our
Budget and Our Political Processes. USC Center in Law, Economics, and Organization Research Paper No. C10-4, USC Legal Studies Research Paper No. 10-4. 36 Ohio Northern L. Rev. 1 (2010).
Kleinbard, Edward. The Hidden Hand of Government Spending. CATO Institute, Regulation,
Fall 2010. Kleinbard, Edward. Rethinking Tax Expenditures. Address by Edward Kleinbard, Chief of
Staff, Joint Committee on Taxation to Chicago-Kent College of Law Federal Tax Institute, May 1, 2008.
Kleinbard, Edward. You’re a Socialist Too. September 24, 2009.
http://www.cbpp.org/files/klienbard_oped.pdf Kong, Allison L. Westfahl. The Effects of Federal Tax Expenditure Policy on the States. State
Tax Notes, 58(7), November 15, 2010.
29
Lenain, Patrick, Bob Hagemann, and David Carey. Restoring Fiscal Sustainability in the United States, Economics Department Working Paper No. 806. Organization for Economic Co-operation and Development, ECO/WKP(2010)62, October 22, 2010.
Lurie, Ithai Z. and Shanthi P. Ramnath. Long-Run Changes in Tax Expenditures for 401(k)-Type
Retirement Plans. National Tax Journal 64(4), December 2011. Mandel, Daniel. Tax Expenditures and Social Policy: A Primer. In Smart Subsidy for
Community Development, a joint publication of the Federal Reserve Bank of Boston and the Aspen Institute, July 2011.
Marr, Chuck and Brian Highsmith. Reforming Tax Expenditures Can Reduce Deficits While
Making the Tax Code More Efficient and Equitable. Center on Budget and Policy Priorities, April 15, 2011.
Marron, Donald B. How Large Are Tax Expenditures? A 2012 Update. Tax Notes, April 9,
2012. Marron, Donald and Eric Toder. Measuring Leviathan: How Big is the Federal Government?
Presentation at Starving the Hidden Beast: New Approaches to Tax Expenditure Reform, Loyola Law School, Los Angeles, January 14, 2011.
Marron, Donald B. Spending in Disguise. National Affairs, Issue No. 8, Summer 2011. McIntyre, Michael J. A Solution to the Problem of Defining a Tax Expenditure. U.C. Davis Law
Review, 14, 1980. Metcalf, Gilbert E. Assessing the Federal Deduction for State and Local Tax Payments.
National Tax Journal, 64 (2, Part 2), June 2011. Metcalf, Gilbert E. Using Tax Expenditures to Achieve Energy Policy Goals. National Bureau
of Economic Research Working Paper 13753, January 2008. McMahon, Martin Jr. Taxing Tax Expenditures? Tax Notes, February 14, 2011, pp. 775-791. Minarik, Joseph J. Tax Expenditures in OECD Countries. Organisation for Economic Co-
operation and Development, October 30, 2008. Neubig, Thomas S. and David Joulfaian. The Tax Expenditure Budget Before and After the Tax
Reform Act of 1986. Department of the Treasury, OTA Paper 60, October 1988. Office of Management and Budget, U.S. Government. The Budget of the United States
Government, Fiscal Year 1983 – Special Analyses G-5. 1982. Office of Management and Budget, U.S. Government. The Budget of the United States
Government, Fiscal Year 2014 – Analytical Perspectives, 16. Tax Expenditures. 2013.

30
Oldenski, Lindsay. Searching for Structure in the Federal Excise Tax System: An Excise Tax
Expenditure Budget. National Tax Journal, 57, September 2004, pp. 613-637. Polackova, Hana Brixi, Christian Valendue, and Zhicheng Swift, eds. (2004). Tax Expenditure:
Shedding Light on Government Spending Through Taxation. Washington, DC: World Bank.
Pew’s Tax Expenditure Database. Subsidyscope, an Initiative of the Pew Charitable Trusts.
http://subsidyscope.org/tax_expenditures/summary/. Polsky, Gregg D. Rationally Cutting Tax Expenditures. University of Louisville Law Review
50, 643-657, 2012. Poterba, James M. Introduction: Economic Analysis of Tax Expenditures. National Tax Journal,
64(2, Part 2): 451-458, 2011. Poterba, James M. and Arturo Ramirez Verdugo. Portfolio Substitution and the Revenue Cost of
the Federal Income Tax Exemption for State and Local Government Bonds. National Tax Journal, 64 (2, Part 2), June 2011.
Poterba, James M. and Todd Sinai. Revenue Costs and Incentive Effects of the Mortgage Interest
Deduction for Owner-Occupied Housing. National Tax Journal, 64 (2, Part 2), June 2011.
Pozen, David E. Hidden Foreign Aid. Florida Tax Review, 8 (6), 641-680, 2007. Economic Analysis of Tax Expenditures. National Tax Journal, 62, (2, part 2), June 2011. Rogers, Allison and Eric Toder. Trends in Tax Expenditures, 1985-2016. Tax Policy Center,
Urban Institute and Brookings Institution, September 16, 2011. Roin, Julie. Truth in Government: Beyond the Tax Expenditure Budget. University of Chicago,
John M. Olin Law & Economics Working Paper No. 168, 2002. Saez, Emmanuel. The Optimal Treatment of Tax Expenditures. Journal of Public Economics 88
(2004) 2657-2684. Shaviro, Dan. Rethinking Tax Expenditures and Fiscal Language. New York University School
of Law, Public Law and Legal Theory Research Paper No. 72, Center for Law and Business Working Paper No. CLB 03-20 September 2003.
Stein, Norman. Pension Plans and Tax Expenditures: A Reply to Professor Zelinsky’s “Defense
of the Status Quo.” 9 Am. J. Tax Policy 155 (1991).

31
Sugin, Linda. Tax Expenditure Analysis and Constitutional Decisions. Hastings Law Journal 50, 407-474, 1998-1999.
Sugin, Linda. Tax Expenditures, Reform, and Distributive Justice. Columbia Journal of Tax
Law, Vol. 3:1, 2011. Sunley, Emil. Tax Expenditures in the United States: Experience and Practice, in Hana
Pulackova Brixi, Christian M.A. Valenduc, and Zhicheg Li Swift, eds., Tax Expenditures – Shedding Light on Government Spending Through the Tax System, 2004.
Surrey, Stanley. The Federal Tax System -- Current Activities and Future Possibilities. Speech
before the Boston Economic Club, May 15, 1968. Surrey, Stanley. Pathways to Tax Reform. Cambridge, MA: Harvard University Press, 1973. Surrey, Stanley and Paul McDaniel. Tax Expenditures. Cambridge, MA: Harvard University
Press, 1985. Surrey, Stanley and William Hellmuth. The Tax Expenditure Budget – Response to Professor
Bittker. 22 National Tax Journal 528, 1969. Surrey, Stanley. The Tax Expenditure Concept and the Budget Reform Act of 1974. Boston
College Law Review, Vol. 17, Issue 5, No. 5, June 1, 1976. Surrey, Stanley. Tax Incentives as a Device for Implementing Government Policy. 83 Harvard
Law Review 705 (1970). Surrey, Stanley. The U.S. Income Tax System -- The Need for a Full Accounting. Speech before
Money Marketeers, November 15, 1967. Swift, Zhicheng Li. Managing the Effects of Tax Expenditures on National Budgets. World
Bank Policy Research Working Paper no. 3927, May 2006. Tax Expenditures in OECD Countries. Organisation for Economic Co-operation and
Development, 2010. The End of Tax Expenditures as We Know Them? IRET Policy Bulletin No. 84, June 13, 2001. Thuronyi, Victor. Tax Expenditures: A Reassessment. 1988 Duke L.J. 11 (1988). Toder, Eric. The Changing Composition of Tax Incentives: 1980-1999. National Tax
Association – Proceedings of the 91st Annual Conference, 1998: 411-420. Toder, Eric J., Benjamin H. Harris, and Katherine Lim. Distributional Effects of Tax
Expenditures. Schwartz Center for Tax Policy Analysis, The Tax Policy Center (Urban Institute and Brookings Institution), 2012.

32
Toder, Eric and Daniel Baneman. Distributional Effects of Individual Tax Expenditures: An
Update. Tax Policy Center, Urban Institute and Brookings Institution, February 2012. Toder, Eric. Evaluating Tax Incentives as a Tool for Social and Economic Policy. In Bad
Breaks All Around: Report of the Century Foundation Working Group on Tax Expenditures, New York: Century Foundation Press, 2002.
Toder, Eric J. Tax Cuts or Spending -- Does it Make a Difference? National Tax Journal, 53,
2000. Toder, Eric J. Tax Expenditures and Tax Reform: Issues and Analysis. Presented at National
Tax Association Meetings, November 19, 2005. United States Government Accountability Office. Community Development. Limited
Information on the Use and Effectiveness of Tax Expenditures Could Be Mitigated Through Congressional Attention. GAO-12-262, February 2012.
United States Government Accountability Office. Corporate Tax Expenditures. Information on
Estimated Revenue Losses and Related Federal Spending Programs. GAO-13-339, March 2013.
United States Government Accountability Office. Tax Expenditures: Background and
Evaluation Criteria and Questions. GAO-13-167SP, November 29, 2012. United States Government Accountability Office. Tax Expenditures: IRS Data Available for
Evaluations Are Limited. GAO-13-479, April 2013. United States Government Accountability Office. Tax Expenditures Represent a Substantial
Federal Commitment and Need to be Reexamined. GAO-05-0690, September 2005. United States Government Accountability Office. Tax Policy. Factors for Evaluating Expiring
Tax Provisions. GAO-12-760T, June 8, 2012. United States Government Accounting Office. Tax Expenditures Deserve More Scrutiny. GAO-
94-122, June 1994. United States Department of the Treasury. 1968 Report of the Secretary of the Treasury,
Excerpts from remarks by Assistant Secretary Surrey, November 15, 1967, before The Money Marketeers, on the U.S. income tax system – the need for a full accounting: and Treasury Department Report “The Tax Expenditure Budget: A Conceptual Analysis.” Pgs. 322-340
United States Department of the Treasury, Internal Revenue Service, Office of the Taxpayer
Advocate. National Taxpayer Advocate 2012 Annual Report to the Congress. December 31,2012.
33
Weisbach, David A. and Jacob Nussim. The Integration of Tax and Spending Programs. Yale
Law Journal, 113, 2004. Weisbach, David A. Tax Expenditures, Principal-Agent Problems, and Redundancy.
Washington University Law Review, 84:1823-1860, 2006. Xanthopoulos, Judy and Mary M. Schmitt. Retirement Savings and Tax Expenditure Estimates.
American Society of Pension Professionals and Actuaries, April 2012. Zelinsky, Edward A. Are Tax “Benefits” Constitutionally Equivalent to Direct Expenditures?
Harvard Law Review 112(2): 379-433, 1998. Zelinsky, Edward A. The Counterproductive Nature of Tax Expenditure Budgets. 137 Tax
Notes 12, December 17, 2012. Zelinsky, Edward A. Do Tax Expenditures Create Framing Effects? Virginia Tax Review
24(4): 797-834, 2005. Zelinsky, Edward A. James Madison and Public Choice at Gucci Gulch: A Procedural Defense
of Tax Expenditures and Tax Institutions. Yale Law Review 105(2): 1165-1207, 1993. Zelinsky, Edward A. Qualified Plans and Identifying Tax Expenditures: A Rejoinder to
Professor Stein. 9 Am. J. of Tax Policy 257 (1991). Zelinsky, Edward A. Winn and the Inadvisability of Constitutionalizing Tax Expenditure
Analysis. Yale Law Journal Online (121), 25, May 1, 2011.

34
APPENDIX A – TECHNICAL DESCRIPTION OF QUANTRIA METHODOLOGY Tax Expenditure Provisions Included in Analysis While official tax expenditure estimates provide a breakdown between the individual income tax and the corporate income tax, this breakdown is inadequate for an analysis that proposes to examine the impact of tax expenditures on all small businesses. Because many small businesses (i.e., sole proprietorships, partnerships, and S corporations) are not subject to the corporate income tax, any analysis that attempts to measure the effects of tax expenditures on all small businesses must take into account the business tax effects incorporated in the individual income tax expenditure estimates. Therefore, as an initial step, each tax expenditure identified by the Joint Committee on Taxation was reviewed and categorized depending upon whether it is a business-related tax expenditure or purely a tax expenditure relating to the individual income tax. For example, the tax expenditure estimates for section 179 expensing include an estimate for the corporate tax effects as well as the individual income tax effects. The next step involved eliminating tax expenditures that are either (1) unlikely to involve small businesses or (2) likely to have a de minimis effect for small businesses. For example, the tax expenditure relating to the special rules for interest-charge domestic international sales corporations was excluded because it is unlikely to be utilized by small businesses. Similarly, the special tax rate for nuclear decommissioning reserve funds was excluded because the likely small business tax expenditure effect would likely be de minimis. Also identified were tax expenditures that have both individual and business components (such as the exclusion of interest for state and local government private activity bonds) because the analysis must allocate the tax expenditure estimate into the individual and business components. Negative tax expenditures that have a business tax component were also identified. Identifying Data Sources The study utilized public use data from the Statistics of Income published by the Internal Revenue Service as our primary data source for the estimation of the effects of tax expenditures on small businesses. The available data depends, in part, on the entity type. For sole proprietorships, most of the necessary information is contained on Schedule C and the Public Use File (PUF) contains the following information in addition to the taxpayer’s regular income, deductions and credits:
▪ Net receipts; ▪ Cost of goods sold or other operations; ▪ Other business income; ▪ Depreciation; ▪ Insurance; ▪ Mortgage interest;

35
▪ Other interest; ▪ Office expense; ▪ Net wages; and ▪ Total deductions.
For partnerships (including LLCs) and S corporations, the necessary data are contained on Schedule E:
▪ Total rents received; ▪ Total royalties received; ▪ Rent expense: mortgage interest; ▪ Rent/royalty expense: other interest; ▪ Royalty depletion; ▪ Rental depreciation; ▪ Rent net income or loss; ▪ Royalty net income or loss; ▪ Deductible rental loss; ▪ Rent/royalty net income; ▪ Rent/royalty net loss; ▪ Total passive income (partnerships and S corporations only); ▪ Total non-passive income (partnerships and S corporations only); ▪ Total passive loss (partnerships and S corporations only); ▪ Total non-passive loss (partnerships and S corporations only); ▪ Partnership Section 179 expense deduction; ▪ Combined partnership and S corporation net income or loss; and ▪ S corporation Section 179 expense deduction.
For other tax expenditure items, the PUF contains information on the General Business Credit (Form 3800):
▪ Investment; ▪ Work opportunity tax credit; ▪ Alcohol used as fuel; ▪ Research and experimentation; and ▪ Tentative general business credit.
An analysis of IRS line count data provided information on both the number of returns and total amount claimed on a wide variety of forms filed with the Internal Revenue Service as part of an individual, partnership, or corporate (including S corporation) income tax return to supplement other available information. For example, the PUF contains information on the general business credit claimed on Form 3800. However, separate tax forms are filed for many of the credits that are included in the totals for the general business credit. The line count data enabled a better estimate of the total amount allocable to specific tax credits included in the general business credit.

36
Tax return data will not yield information with respect to every tax expenditure provision. Many of these provisions will have a de minimis effect with respect to small businesses, making the lack of information less important. However, some tax expenditure provisions for which data are not available could have measurable effects. For example, measuring the value of the tax expenditure relating to the use of cash accounting will require data and information not reported in tax return data. An April 2013 GAO report noted the difficulty in identifying tax return data relating to the utilization of tax expenditure provisions.32 GAO found that, of 163 tax expenditure items identified by the Treasury Department for 2011, 102 or 63 percent were not on a tax return, information return, or other tax form or were on a tax form but did not have a separate line item. GAO found that IRS data are available with respect to approximately $500 billion of the $1 trillion total of Treasury tax expenditure estimates. Microsimulation Models This research relies principally on Quantria Strategies, LLC’s individual income tax simulation model to calculate the utilization and value of major tax expenditure programs that affect sole proprietorships, partnerships (including LLCs) and S corporations. The tax calculator serves as the heart of a tax model. The calculator performs the actual tax simulations, and is the place where the economic assumptions, tax data, and tax law interact to produce the final output of the model. The microsimulation model relies on micro-units of data (in this case, tax filers and non-filers) which are evaluated through a tax calculator consisting of different tax law scenarios, and the results of these computations are stored for each individual unit and then aggregated into the appropriate level of the tax return. The tax policy parameters are the primary source of structural policy changes in the tax law. Tax parameters are specialized programming variables or macro substitutions that allow the model to adjust the tax calculator without altering the underlying tax law (programming) code. The Federal tax calculator allows the user to model a wide variety of policy proposals and construct accurate forecasts that are sufficient to develop revenue estimates and tax expenditure estimates. A common tax model structure allows for comparisons from a baseline scenario (Plan X) as compared to an alternate structure (Plan Y). This study’s model uses such a structure to model policy alternatives against each other in an “X-Y” conceptual framework, as well as how to incorporate taxpayer behavior utilizing elasticity assumptions and marginal tax rates. The tax calculator is primarily a static tax model that operates on a single year at any given time. The structure allows the user to model different years within a common time frame as established under the economic forecasting and optimization routine. The model incorporates limited elements of dynamic behavior, but not dynamic microsimulation. 32 Refer to Government Accountability Office IRS Data 2013.

37
The calculator incorporates tax parameters for all dollar-denominated aspects of current tax law (e.g., exemptions, deductions, or income thresholds), for percentages (tax rates, credit percentages, or phase-outs), switches (eligibility requirements for some filing statuses), indexing (adjustments to amounts via inflation), and other policy prescriptions as needed. Microsimulation requires a robust data set at a disaggregated level to allow the calculation of individual tax liability under current (and/or proposed) legislation. The basis of the model is a stratified random sample of individual tax returns filed by U.S. taxpayers. To this dataset, we add demographic, employment and labor force information from the CPS by way of a robust statistical matching algorithm.33 A fundamental component of the model is a computer program that performs detailed calculations of the tax liability of each taxpayer given the tax law and parameters (e.g., tax rates and brackets) in place for the current year of analysis. While the information available on the PUF is quite extensive, there are likely to be cases where data that are more specific are necessary to calculate accurately the value of certain tax expenditures. For these situations, we rely on statistical imputation methods to fill in the necessary detail. Many of the tax expenditures affecting small businesses have a minimal or negligible effect on tax liability and to keep the scope of this research manageable and accessible, the analysis does not include these provisions.34 Many tax expenditures express the current-law benefit of depreciation and expensing of property, plant and equipment relative to the timing of the deductions under the Alternative Depreciation System.35 Therefore, we capture this dynamic component of the estimate by relying on Quantria’s depreciation model. This model simulates the aggregate investment flows and calculates the resulting depreciation deductions under both tax systems to obtain the value of the tax expenditure. In order to calculate the value of tax expenditures for those small businesses organized as C corporations, we relied on both published IRS data contained in the Corporate Source Book and Corporate Statistics of Income. We adjust all data from the CSB to eliminate S corporations, where necessary. In addition, we augmented these calculations with simulation results of corporate tax liability obtained from Quantria’s corporate income tax model. Because the Quantria model relies on the public filings (i.e., 10-Ks) of the Standard and Poor’s 500, the results of the simulations are not directly extensible to small businesses. Nevertheless, we will use the model to fine tune the results derived from the CSB and SOI.
33 The algorithm we rely on is termed “constrained statistical matching.” This approach is so-named because all the records on both files appear in the final dataset. 34 In addition, the data will not support the calculation of many small or negligible tax provisions. We do not believe omitting these items will affect the results. As part of our final report, we will provide a comprehensive list of tax expenditures and suggest how, if at all, our results might change if they were included. 35 There is an alternative depreciation system, under which depreciation deductions occur over periods longer than under MACRS using the straight-line method.

38
APPENDIX B – SUPPORTING DATA AND DETAILED EMPIRICAL ESTIMATES
Table 9 – Tax Expenditure Estimates for Small Businesses by Entity Type, Fiscal Year 2013 (Amounts in Billions; Numbers in Thousands)
Item
Sole Proprietorships Partnerships S Corporations C Corporations Total Amount,
All Entities Total Amount
Number of
Entities
Total Amount
Number of Entities
Total Amount
Number of Entities
Total Amount
Number of Entities
POSITIVE TAX EXPENDITURES USED BY BUSINESSES, EXCLUDING DE MINIMIS ITEMS AND ITEMS UNLIKELY TO BE USED BY SMALL BUSINESSES
Depreciation for equipment in excess of ADS 0.203 – 0.228 – 0.724 – 2.676 – 3.832 Deduction for income attributable to domestic production activities 0.377 462.0 2.083 434.3 1.269 923.6 0.204 15.7 3.933 Retirement plans (includes plans covering partners and sole proprietors, sometimes referred to as "Keogh plans) 0.234 1,087.5 3.632 324.6 6.665 158.2 n/a n/a 10.531 Deferral of gain on non-dealer installment sales 0.000 (*) 1.148 489.7 0.152 101.7 0.511 56.8 1.811 Credit for low-income housing 0.062 98.7 0.034 130.3 0.144 96.9 0.112 14.3 0.352 Credit for increasing research activities (Code section 41) 0.003 4.8 0.048 12.9 0.048 14.6 0.111 14.3 0.210 Expensing of research and experimental expenditures 0.002 3.6 0.045 9.7 0.045 10.9 0.387 56.8 0.479 Deduction for health insurance premiums and long-term care insurance premiums by the self-employed 1.878 3,178.0 1.323 617.9 1.989 953.4
– –
5.190 Last-in, first-out inventory method 0.015 54.4 0.272 315.4 0.272 234.1 0.306 56.0 0.865 Depreciation of rental housing in excess of alternative depreciation system 0.826 1,800.3 0.454 434.3 1.920 862.0 0.072 12.8 3.200 Expensing under section 179 of depreciable business property 0.268 1,440.2 2.361 434.3 1.099 1,231.4 0.063 11.8 3.728 Reduced rates on first $10,000,000 – – – – – – 0.252 63.3 0.252

39
Table 9 – Tax Expenditure Estimates for Small Businesses by Entity Type, Fiscal Year 2013 (Amounts in Billions; Numbers in Thousands)
Item
Sole Proprietorships Partnerships S Corporations C Corporations Total Amount,
All Entities Total Amount
Number of
Entities
Total Amount
Number of Entities
Total Amount
Number of Entities
Total Amount
Number of Entities
of corporate taxable income Inventory property sales source rule exception – – – – – – 0.233 46.8 0.233 Tax credit for small businesses purchasing employer insurance 0.542 63.0 0.382 83.9 0.574 60.7 0.300 778.0 1.798 Credits for electricity production from renewable resources (section 45) (*) (*) (*) (*) (*) (*) 0.026 14.3 0.026 Credit for employer-paid FICA taxes on tips 0.041 75.6 0.180 100.7 0.246 66.8 0.015 14.3 0.482 Excess of percentage over cost depletion, fuels (*) (*) (*) (*) (*) (*) (*) (*) (*) Cash accounting, other than agriculture 0.088 1,098.6 0.436 566.6 0.501 775.6 - - 1.025 Expensing of exploration and development costs, fuels 0.007 126.2 0.114 39.8 0.019 10.9 0.059 66.1 0.199 Income recognition rule for gain or loss from section 1256 contracts (*) 309.2 0.603 438.1 0.027 142.2 (*) (*) 0.630 New markets tax credit (*) (*) (*) (*) (*) (*) 0.017 14.3 0.017 Credit for orphan drug research (*) (*) (*) (*) (*) (*) 0.013 14.3 0.013 Completed contract rule (*) (*) (*) (*) (*) (*) 0.015 14.3 0.015 Election to expense 50 percent of qualified property used to refine liquid fuels
– – – – – – 0.002 3.9 0.002
Lower of cost or market inventory method 0.000 (*) 0.029 43.4 0.045 61.6 0.036 26.8 0.110 Credit for rehabilitation of historic structures 0.035 19.7 0.080 26.1 0.065 24.2 0.007 14.3 0.187 Credit for plug-in electric vehicles 0.001 12.6 0.024 19.9 0.024 8.8 0.006 14.3 0.055 Energy credits (sec. 48) 0.004 9.9 0.076 26.1 0.013 9.7 0.007 14.3 0.100
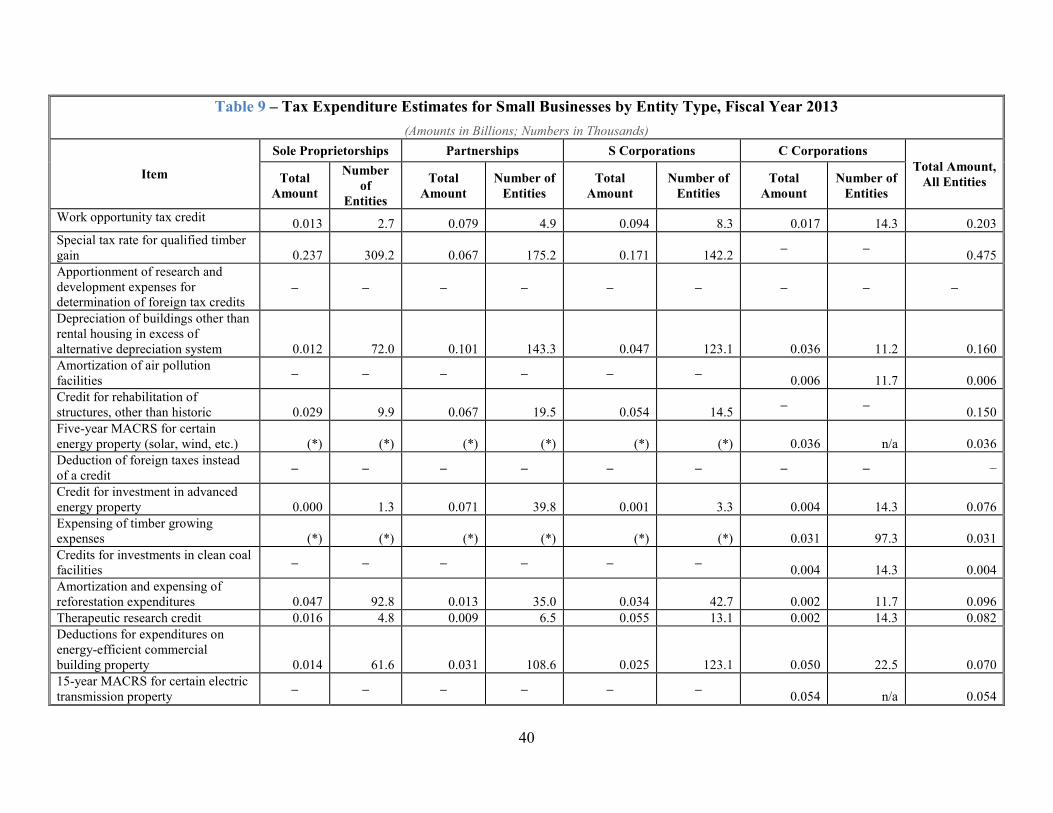
40
Table 9 – Tax Expenditure Estimates for Small Businesses by Entity Type, Fiscal Year 2013 (Amounts in Billions; Numbers in Thousands)
Item
Sole Proprietorships Partnerships S Corporations C Corporations Total Amount,
All Entities Total Amount
Number of
Entities
Total Amount
Number of Entities
Total Amount
Number of Entities
Total Amount
Number of Entities
Work opportunity tax credit 0.013 2.7 0.079 4.9 0.094 8.3 0.017 14.3 0.203 Special tax rate for qualified timber gain 0.237 309.2 0.067 175.2 0.171 142.2 – – 0.475 Apportionment of research and development expenses for determination of foreign tax credits
– – – – – – – – –
Depreciation of buildings other than rental housing in excess of alternative depreciation system 0.012 72.0 0.101 143.3 0.047 123.1 0.036 11.2 0.160 Amortization of air pollution facilities – – – – – – 0.006 11.7 0.006 Credit for rehabilitation of structures, other than historic 0.029 9.9 0.067 19.5 0.054 14.5 – – 0.150 Five-year MACRS for certain energy property (solar, wind, etc.) (*) (*) (*) (*) (*) (*) 0.036 n/a 0.036 Deduction of foreign taxes instead of a credit – – – – – – – – –
Credit for investment in advanced energy property 0.000 1.3 0.071 39.8 0.001 3.3 0.004 14.3 0.076 Expensing of timber growing expenses (*) (*) (*) (*) (*) (*) 0.031 97.3 0.031 Credits for investments in clean coal facilities – – – – – – 0.004 14.3 0.004 Amortization and expensing of reforestation expenditures 0.047 92.8 0.013 35.0 0.034 42.7 0.002 11.7 0.096 Therapeutic research credit 0.016 4.8 0.009 6.5 0.055 13.1 0.002 14.3 0.082 Deductions for expenditures on energy-efficient commercial building property 0.014 61.6 0.031 108.6 0.025 123.1 0.050
22.5 0.070
15-year MACRS for certain electric transmission property – – – – – – 0.054 n/a 0.054
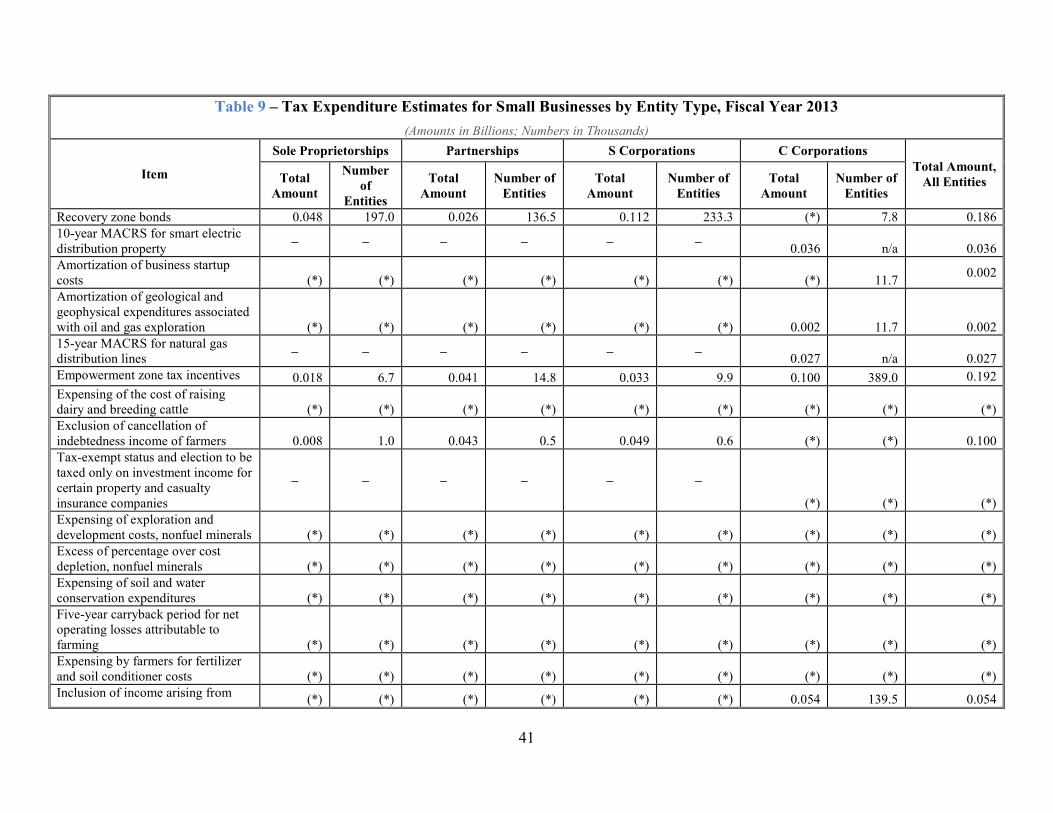
41
Table 9 – Tax Expenditure Estimates for Small Businesses by Entity Type, Fiscal Year 2013 (Amounts in Billions; Numbers in Thousands)
Item
Sole Proprietorships Partnerships S Corporations C Corporations Total Amount,
All Entities Total Amount
Number of
Entities
Total Amount
Number of Entities
Total Amount
Number of Entities
Total Amount
Number of Entities
Recovery zone bonds 0.048 197.0 0.026 136.5 0.112 233.3 (*) 7.8 0.186 10-year MACRS for smart electric distribution property – – – – – – 0.036 n/a 0.036 Amortization of business startup costs (*) (*) (*) (*) (*) (*) (*) 11.7 0.002
Amortization of geological and geophysical expenditures associated with oil and gas exploration (*) (*) (*) (*) (*) (*) 0.002 11.7 0.002 15-year MACRS for natural gas distribution lines – – – – – – 0.027 n/a 0.027 Empowerment zone tax incentives 0.018 6.7 0.041 14.8 0.033 9.9 0.100 389.0 0.192 Expensing of the cost of raising dairy and breeding cattle (*) (*) (*) (*) (*) (*) (*) (*) (*) Exclusion of cancellation of indebtedness income of farmers 0.008 1.0 0.043 0.5 0.049 0.6 (*) (*) 0.100 Tax-exempt status and election to be taxed only on investment income for certain property and casualty insurance companies
– – – – – –
(*) (*) (*) Expensing of exploration and development costs, nonfuel minerals (*) (*) (*) (*) (*) (*) (*) (*) (*) Excess of percentage over cost depletion, nonfuel minerals (*) (*) (*) (*) (*) (*) (*) (*) (*) Expensing of soil and water conservation expenditures (*) (*) (*) (*) (*) (*) (*) (*) (*) Five-year carryback period for net operating losses attributable to farming (*) (*) (*) (*) (*) (*) (*) (*) (*) Expensing by farmers for fertilizer and soil conditioner costs (*) (*) (*) (*) (*) (*) (*) (*) (*) Inclusion of income arising from (*) (*) (*) (*) (*) (*) 0.054 139.5 0.054
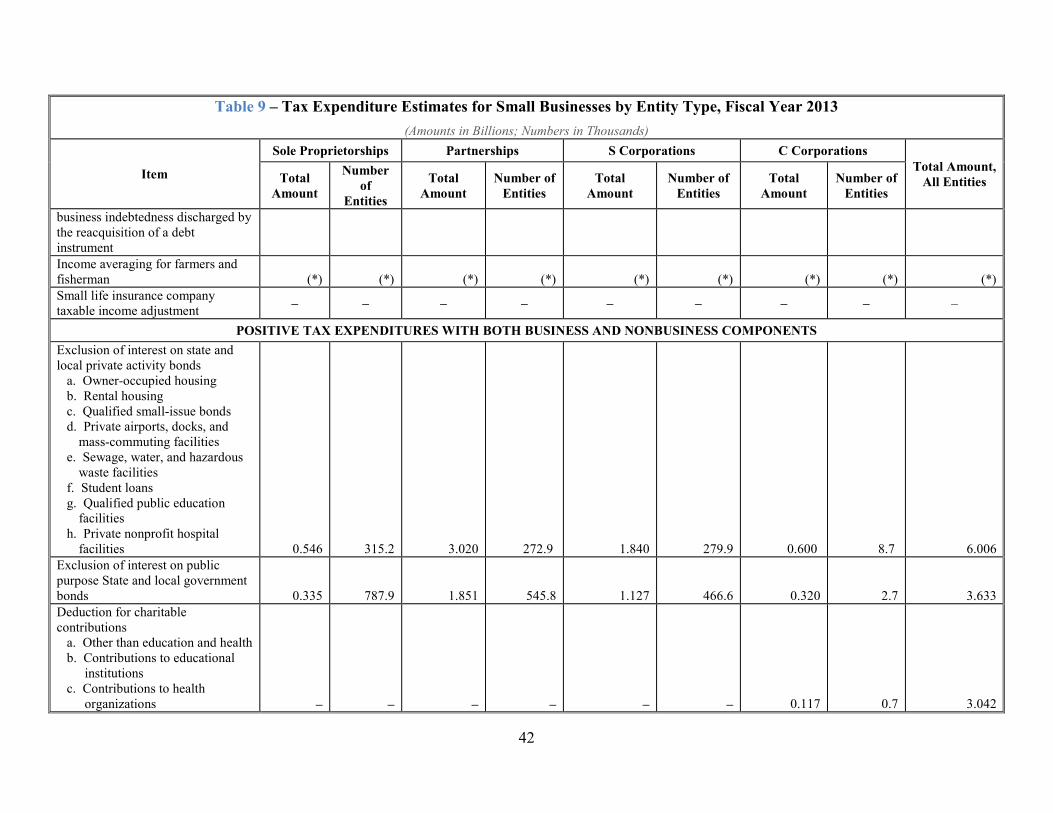
42
Table 9 – Tax Expenditure Estimates for Small Businesses by Entity Type, Fiscal Year 2013 (Amounts in Billions; Numbers in Thousands)
Item
Sole Proprietorships Partnerships S Corporations C Corporations Total Amount,
All Entities Total Amount
Number of
Entities
Total Amount
Number of Entities
Total Amount
Number of Entities
Total Amount
Number of Entities
business indebtedness discharged by the reacquisition of a debt instrument Income averaging for farmers and fisherman (*) (*) (*) (*) (*) (*) (*) (*) (*) Small life insurance company taxable income adjustment – – – – – – – – –
POSITIVE TAX EXPENDITURES WITH BOTH BUSINESS AND NONBUSINESS COMPONENTS Exclusion of interest on state and local private activity bonds
a. Owner-occupied housing b. Rental housing c. Qualified small-issue bonds d. Private airports, docks, and
mass-commuting facilities e. Sewage, water, and hazardous
waste facilities f. Student loans g. Qualified public education
facilities h. Private nonprofit hospital
facilities 0.546 315.2 3.020 272.9 1.840 279.9
0.600
8.7 6.006 Exclusion of interest on public purpose State and local government bonds 0.335 787.9 1.851 545.8 1.127 466.6 0.320 2.7 3.633 Deduction for charitable contributions
a. Other than education and health b. Contributions to educational
institutions c. Contributions to health
organizations – – – – – – 0.117 0.7 3.042

43
Table 9 – Tax Expenditure Estimates for Small Businesses by Entity Type, Fiscal Year 2013 (Amounts in Billions; Numbers in Thousands)
Item
Sole Proprietorships Partnerships S Corporations C Corporations Total Amount,
All Entities Total Amount
Number of
Entities
Total Amount
Number of Entities
Total Amount
Number of Entities
Total Amount
Number of Entities
Deferral of gain on like-kind exchanges 0.295 278.3 0.667 157.7 0.538 128.0 0.911 9.8 2.411 Exemptions from imputed interest rules 0.048 89.5 0.238 23.1 0.273 20.7 0.158 (*) 0.717 Exclusion of investment income on life insurance and annuity contracts 0.483 3,184.7 1.093 1,845.8 0.881 1,298.1 0.502 2.959 Credit for holders of qualified zone academy bonds 0.002 7.9 0.011 27.3 0.012 23.3 0.028 (*) 0.053 Qualified school construction bonds 0.010 39.4 0.048 54.6 0.055 46.7 0.009 (*) 0.122
NEGATIVE BUSINESS TAX EXPENDITURES Net alternative minimum tax attributable to net operating loss limitation (*) (*) (*) (*) (*) (*) (*) (*) (*) Deferral of taxation on acquisition of stock under incentive stock option plans (*) (*) (*) (*) -0.255 1,250.0 -0.044 68.5 -0.295 Deferral of taxation on employee stock purchase plans (*) (*) (*) (*) -0.085 650.0 -0.058 32.5 -0.143 Disallowance of deduction for excess parachute payments - - - - - - -0.019 60.7 -0.019 Limits on deductible compensation - - - - - - -0.029 111.3 -0.029 (*) less than $50 million.

44
APPENDIX C – LITERATURE REVIEW36
A. History of the Tax Expenditure Concept 1. Stanley Surrey’s Vision – Then Treasury Secretary Stanley Surrey originally introduced the concept of tax expenditures in 1967. In a speech on November 15, 1967, Asst. Secretary Surrey discusses the rationale for identifying and quantifying tax expenditures.37 In his speech, Asst. Secretary describes the problem as follows:
“Through deliberate departures from accepted concepts of net income and through various special exemptions, deductions, and credits, our tax system does operate to affect the private economy in ways that are usually accomplished by expenditures – in effect to produce an expenditure system in tax language.”38
Surrey argued that the absence of line items in the budget for tax expenditures had several consequences, including (1) lessening public understanding of significant segments of tax policies, (2) excluding tax expenditures from close scrutiny when reductions in Federal expenditures are considered, (3) resulting in treatment of changes to tax expenditures as “tax reform” rather than “expenditure control.”39 Surrey proposed identifying and quantifying tax expenditures in the Federal budget based on a system that classified these expenditures along customary budgetary lines – e.g., national defense, international affairs and finance, agriculture, natural resources, etc. The Treasury Department prepared a conceptual analysis of the so-called tax expenditure budget in 1968.40 Section 202(f) of the Congressional Budget and Impoundment Control Act of 1974 requires the CBO to submit to the House and Senate Budget Committees a report on the levels of tax expenditures under current law.41 The staff of the Joint Committee on Taxation had begun to prepare tax expenditure estimates prior to enactment of the Congressional Budget Act and continued to do so after enactment of the Act. This responsibility is consistent with the Joint Committee on Taxation’s statutory responsibility to prepare official revenue estimates for the use of the Congress with respect to all proposed revenue legislation. Current law also requires the President’s Budget to include “the level of tax expenditures under existing law in the tax expenditures budget…for the fiscal year for which the budget is submitted, considering projected economic factors and changes in the existing levels based on
36 This literature review provides a brief overview of the history of tax expenditures, issues that have been raised with the identification and measurement of tax expenditures, and issues relevant to this study. A complete review of all of the literature that has been written on tax expenditures exceeds the scope of this paper. 37 See Surrey, Stanley S., Excerpts from remarks before the Money Marketeers on The U.S. Income Tax System – the Need for a Full Accounting, November 15, 1967, in U.S. Department of the Treasury. 1968 Report of the Secretary of the Treasury on the State of Finances for the Fiscal Year Ended June 30, 1968, Washington, DC: Government Printing Office, 1969, Pgs. 322-326. 38 Ibid, p. 323. 39 Ibid. 40 Ibid. 41 See Committee on the Budget, United States Senate. Budget Process Law Annotated, 1993 Edition. 103rd Cong., 1st Sess., S. Prt. 103-49, October 1993.

45
proposals in the budget.”42 The Treasury Department Office of Tax Analysis staff typically prepares the President’s tax expenditure estimates. The following definition of a tax expenditure applies for both the President’s and Congressional Budget purposes:
“The term ‘tax expenditures’ means those revenue losses attributable to provisions of the Federal tax laws which allow a special exclusion, exemption, or deduction from gross income or which provide a special credit, a preferential rate of tax, or a deferral of tax liability.”43
While the same statutory definition of a tax expenditure applies both for the President’s and Congressional budget purposes, variations exist both in items identified as tax expenditures and how those tax expenditures are estimates. These variations are discussed in some detail below. 2. Surrey’s Tax Expenditure Concept – Surrey and McDaniel (1985) in an early treatise on tax expenditures define the tax expenditure concept as follows:
“The tax expenditure concept posits that an income tax is composed of two distinct elements. The first element consists of structural provisions necessary to implement a normal income tax, such as the definition of net income, the specification of accounting rules, the determination of the entities subject to tax, the determination of the rate schedule and exemption levels, and the application of the tax to international transactions. The second element consists of the special preferences found in every income tax. These provisions, often called tax incentives or tax subsidies, are departures from the normal tax structure and are designed to favor a particular industry, activity, or class or persons. They take many forms, such as permanent exclusions from income, deductions, deferrals of tax liabilities, credits against tax, or special rates. Whatever their form, these departures from the normative tax structure represent government spending for favored activities or groups, effected through the tax system rather than through direct grants, loans, or other forms of government assistance” (Surrey and McDaniel 1985, 3).
3. Joint Committee on Taxation Tax Expenditure Definition – The Joint Committee staff describes tax expenditures estimates as a measure of the economic benefits of special provisions provided through the tax laws.44 The Joint Committee staff notes that the legislative history of the Budget Act suggests that tax expenditures should be defined by reference to a normal income tax structure.45 However, the Budget Act legislative history did not define a “normal income tax structure.” As a result, the Joint Committee staff exercises judgment in identifying those provisions that are deemed to be an exception to a normal income tax structure.
42 See The President’s Budget in 31 U.S.C. sec. 1105(a)(15). 43 Sec. 3(3) of the Congressional Budget and Impoundment Control Act of 1974. 44 Joint Committee on Taxation, Estimates of Federal Tax Expenditures for Fiscal Years 2012-2017, JCS-1-13, January 2013. 45 Ibid.

46
The Joint Committee staff begins with the assumption that the normal income tax structure starts with a broad concept of income that is more inclusive than the definition of income defined under general U.S. income tax purposes. As a result, the Joint Committee staff interprets a normal income tax structure to include the following provisions:
1. With respect to the individual income tax, the existing tax rate structure, one personal exemption for the taxpayer and each dependent, the standard deduction, and deductions for investment and employee business expenses; and
2. With respect to the treatment of capital cost recovery for businesses (whether or not incorporated), cost recovery under the alternative depreciation system (Internal Revenue Code sec. 168(g)), which provides for straight-line recovery over tax lives that are longer than those provided under the current-law accelerated depreciation system;
3. The accrual method of accounting, the concept of economic performance to test whether liabilities are deductible, and the general concept of matching income and expenses for businesses (whether or not incorporated);
4. Carryback and carryforward of net operating losses for businesses (whether or not incorporated); and
5. With respect to corporations, the maximum marginal corporate income tax rate.46 The Joint Committee staff also identifies provisions of the Federal income tax system that provide treatment less favorable than the treatment under a “normal” income tax system.47 The Joint Committee staff refers to these provisions as “negative tax expenditures.” Examples of negative tax expenditures include the denial of the deduction for certain executive compensation and the treatment of excess parachute payments (a form of compensation paid pursuant to an employment contract to an executive departing from a firm). Because a normal income tax system would allow businesses to deduct all ordinary and reasonable business expenses, these provisions provide “less favorable treatment” than would be provided under a “normal” income tax system.
B. Issues in the Identification and Measurement of Tax Expenditures 1. Other Taxes and Tax Expenditures – The current-law definition of tax expenditures applies only with respect to income taxes. Other types of taxes, such as excise taxes, could also have special provisions like special rates or exclusion, but the statutory definition of tax expenditures does not apply to these provisions. Thus, some have argued that the concept should be extended beyond the income tax system to other types of Federal taxes, including excise taxes, payroll taxes, and estate and gift taxes. The President’s Budget for fiscal year 1994 (Office of Management and Budget 1993) raised the possibility of extending the tax expenditure analysis to other types of taxes. The Office of Management and Budget (OMB) report states the following:
“The tax expenditure analysis could also be extended beyond the income and transfer taxes to include payroll and excise taxes. The exclusion of certain forms
46 Ibid. 47 Ibid.

47
of compensation from the wage base, for instance, reduces payroll taxes, as well as income taxes. Payroll exclusions are complex to analyze, however, because they also affect social insurance benefits. Certain targeted excise tax provisions might also be considered tax expenditures. In this case challenges include determining an appropriate baseline” (Office of Management and Budget 1993, 1).
Burton and Sadiq (2013) note that a consequence of limiting the definition of tax expenditures to the income tax system means that substantial tax breaks are largely ignored. Burton and Sadiq argue that expanding the definition of tax expenditures outside of the income tax could assist such broader public policy objectives as assessing the overall performance of a taxation system measured against a defined ideal tax system. Others have proposed specific expansions of the tax expenditure concept to other types of taxes. For example, Forman (1993) examined expanding the concept of tax expenditures to payroll and excise taxes. Davie (1994) attempted to apply tax expenditure analysis to the Federal excise tax system and identified 244 provisions in the excise tax system that would be analogous to the tax expenditures in the income tax system. He noted that Stanley Surrey discussed the possibility of identifying tax expenditures in the excise tax system in 1973. A 2011 Joint Committee on Taxation review of tax expenditure concepts noted that, prior to 2003, the President’s budget reviewed and tabulated estate and gift provisions that could be considered tax expenditures (JCT 2011). 2. Appropriate Base for Measuring Tax Expenditures – One of the primary criticisms of the tax expenditure concept is the “normal income tax” that is presumed to be the “correct” base for identifying and measuring tax expenditures. The tax base used for identifying tax expenditures under current methodology utilizes the Haig-Simons comprehensive income tax as a starting point with adjustments (Joint Committee on Taxation 2008). From the time that the tax expenditure concept was first introduced by Stanley Surrey, researchers have criticized the use of the “normal income tax” as the base for measuring tax expenditures. In 1969, Professor Boris Bittker argued against the subjective nature of the “normal income tax,” and stated “any system of income taxation is an aggregation of decisions about a host of structural issues that the Haig-Simons definition does not even purport to settle” (Bittker 1969). Bittker stated that tax expenditures derived from such a subjective baseline could not be expected to achieve consensus. Thuronyi (1988) suggests that it would be more productive to identify tax provisions that are “substitutable” – in other words, provisions whose significant purposes might be better achieved through a direct expenditure. However, Thuronyi also recognized that there would be subjectivity to his “substitutable tax provision” analysis, just as there is subjectivity in the identification of tax expenditures by reference to a normative income tax.

48
Kahn and Lehman (1992) note that the tax expenditure budgets claim to identify situations in which Congress has deviated from a “normal” or “correct” tax system. As Kahn and Lehman note “the very statement of the tax exposes its Achilles heel. It assumes the existence of one true, ‘correct,’ ‘normative’ rule of federal income taxation that should be applied to any given transaction” (Kahn and Lehman 1992, 1661). A 2010 Organisation of Economic Co-operation and Development (OECD) report discusses the problem of identifying the benchmark tax base for purposes of identifying and measuring tax expenditures. The report cites Dirk-Jan Kraan, who wrote that the choice of a benchmark tax system “is rooted in different views of the normative tax base. The normative tax base is the monetary sum in the hands of private households to which the tax ought to be applied...the definition of the normative tax base is a very political exercise. For this reason, attempts in the past to define tax expenditures in the normative tax base...have not been very successful” (Tax Expenditures in OECD Countries 2010, 17). Further, the report notes “tax expenditures in this sense are deviations from the benchmark tax. The benchmark has no normative significance. Deviations from it in order to arrive at the normative tax base may be perfectly appropriate” (Tax Expenditures in OECD Countries 2010, 17). Bartlett (2010) argues that, rather than a normal income tax, the better tax base for measuring tax expenditures might be a consumption tax base, stating that the Haig-Simons model might be an ideal approach from a distributional standpoint, but would not be the appropriate base from an economic growth perspective. Burman (2011) also discusses this issue, noting that the Administration’s budget for fiscal year 2003 argued that the growing presence of tax-deferred savings vehicles might suggest a change in the definition of the normal tax base to remove the treatment of tax-favored savings from the definition of tax expenditures. Xanthopoulos and Schmitt (2012) raised this issue as well, noting “many academics question whether the appropriate base is a broad income tax base, a consumption tax base, or a hybrid tax base (e.g., a tax base that begins with an income tax, but includes some elements of a consumption tax)” and that “…retirement savings contributions do not fit the tax expenditure definition under a consumption tax base and, arguably, under a hybrid tax base.” In 2008, then JCT Chief of Staff Ed Kleinbard proposed a new approach to classifying tax provisions as tax expenditures (Kleinbard 1988). Kleinbard states “driven off track by seemingly endless debates about what should and should not be included in the ‘normal’ tax base, tax expenditure analysis today does not advance either of the two goals that inspired its original proponents: clarifying the aggregate size and application of government expenditures, and improving the Internal Revenue Code.” Following this speech, the JCT published a pamphlet outlining a revised approach to tax expenditure analysis (Joint Committee on Taxation 2008). In October 2008, the Joint Committee on Taxation issued its first pamphlet using the revised methodology (Joint Committee on Taxation Estimates 2008). In January 2010, the Joint Committee reverted back to its prior methodology for providing tax expenditure estimates (Joint Committee on Taxation 2010). Even those who may not quarrel with the “normal income tax” as the base for tax expenditures find problems with how the normal income tax is interpreted. Burman (2011) notes that the concept of normal income tax utilized by the JCT and Treasury includes a classic corporate

49
income tax with no offset for double taxation, despite the fact that economic theory would suggest that corporate income should be taxed only once at the shareholder level. Thus, the taxation of dividends in the current income tax system should theoretically be treated as a negative tax expenditure. Burman (2011) also noted the anomalous treatment of expensing and accelerated depreciation (treated as tax expenditures), and the taxation of capital gains upon realization (treated as part of the normal income tax and, therefore, not a tax expenditure), since both convey tax benefits to take advantage of the time value of money. Xanthopoulos and Schmitt (2012) point out the current law treatment of tax expenditures even raises inconsistencies with the treatment of different deferral provisions. While unrealized capital gains are not treated as a tax expenditure, unrealized retirement savings are treated as tax expenditures, even though many retirement savings contributions are invested in assets that would give rise to capital gains if held directly. 3. Present-Value Estimates for Tax Expenditures – The issue of measuring tax expenditures on a cash flow or present value basis goes hand-in-hand with the discussion of the appropriate tax base for measuring tax expenditure. While the JCT estimates are present only on a cash-flow basis, the Administration’s tax expenditure analysis typically includes a cash-flow analysis and an alternative measure of tax expenditures that represent a deferral of taxation on a present-value basis (OMB, 2013). As the analysis acknowledges “although such estimates [cash basis estimates] are useful as a measure of cash flows into the Government, they do not accurately reflect the true economic cost of these provisions” (OMB 2013, 242). The analysis states that “in the case of a newly enacted deferral provision, a cash-based estimate can overstate the real effect on receipts to the Government because the newly deferred taxes will ultimately be received” (OMB 2013, 242). The analysis also notes that providing present-value estimates for some tax expenditures is consistent with the Federal budget treatment of credit programs, in which direct loans and guarantees in a given year affect future cash flows. Others have pointed out that the traditional cash flow basis for measuring tax expenditures overstates the effects of deferral provisions relative to other types of tax expenditures. One paper states that “measuring tax expenditures that provide for deferral on a present-value basis and other tax expenditures on a cash basis would enable policymakers to make a[n] ...‘apples to apples’ comparison for estimates of tax expenditures. The current method of measuring tax expenditures on a cash-flow basis overstates the value of the deferral for pension contributions relative to other tax expenditure provisions” (Xanthopoulos and Schmitt 2012, 11). Lurie and Ramnath (2011) also raise this issue with respect to retirement savings. They note that the cash-flow measure of tax expenditures can overstate or understate the true cost of retirement savings contributions if there large differences between cohorts, such as plan adoption rates and population size. They state “as policymakers increasingly look to tax expenditures for new sources of tax revenue, a long-run approach for analyzing provisions, particularly those that stem from deferral, becomes more important” (Lurie and Ramnath 2011, 1028).

50
A Congressional Budget Office (2013) report on the distribution of major tax expenditures in the individual income tax system also discusses the issue of present-value estimates with respect to the exclusion for retirement savings contributions and earnings. As part of their analysis, CBO stated “in CBO’s estimation, the tax expenditure for net pension contributions and earnings measured as the present value of one year’s retirement contributions would be roughly 10 percent lower than the tax expenditure measured in the traditional way” (CBO 2013, 24). 4. Issues with Tax Expenditure Estimation – People often use tax expenditure estimates as a measure of the potential revenue gained from repealing specific tax expenditures provisions. However, for a variety of reasons, tax expenditure estimates can vary significantly from a revenue estimate for repeal of a tax expenditure provision. As Buckley (2011) states “the large tax expenditure cost estimates have created unrealistic expectations about the potential revenue that could be raised through tax expenditure reform (Buckley 2011, 256). People often sum the tax expenditure estimates to calculate a “total” for all estimates. However, this approach will generally result in the overstatement of the size of total tax expenditures. For example, Kleinbard (2010) quotes a Congressional Research Service calculation from October 2008 that the JCT tax expenditure estimates sum to $1.2 trillion, but notes in a footnote that the JCT does not sum tax expenditures because there are important interactive effects across different tax expenditure items. Further, tax expenditure estimates do not equal revenue estimates for the repeal of tax expenditure provisions. The Joint Committee on Taxation (JCT 2013) identifies a number of ways in which tax expenditure estimates differ from revenue estimates. First, tax expenditure estimates do not incorporate taxpayer behavioral effects that are likely to occur in response to the repeal of a tax expenditure provision. These types of behavioral effects include utilization of alternative tax law provisions if a tax expenditure provision is repealed. Second, tax expenditure estimates measure changes in tax liability, whereas revenue estimates measure changes in Federal receipts, and there may be timing differences between the two measures. Third, the repeal of some tax expenditure provisions would also alter Federal payroll tax receipts, which would not be included in the tax expenditure estimates. Finally, the revenue estimate for repeal of a tax expenditure provision would take into account effective date and transition rule effects that would not be incorporated in a tax expenditure estimate. Altshuler and Dietz (2008) point out that tax expenditure estimates fail to incorporate assumptions about changes in taxpayer behavior, including so-called micro-dynamic responses that allow taxpayers to respond to changes in after-tax prices and other tax-related incentives as well as macroeconomic feedback effects. As a result, a tax expenditure estimate for a specific provision typically results in larger effects than a revenue estimate for repeal of the provision. Altshuler and Dietz provide an example of this effect with respect to the exclusion from income for employer-paid life insurance. JCT tax expenditure estimates for this provision were approximately $2.7 billion per year in 2009, 2010, and 2011. However, revenue estimates for repeal of the provision during the same time period were $2.1 billion (2009), $2.2 billion (2010), and $2.3 billion (2012). This variation in estimates represents the taxpayer behavioral responses incorporated in the revenue estimate.

51
Alshuler and Dietz also note that there is a notable exception to this general rule of disregarding behavioral effects in tax expenditure estimates because these estimates do take account of what is referred to as “tax form behavior,” such as the decision to itemize deductions or not. The JCT and Treasury assume that the standard deduction is part of a normal income tax. Thus, the magnitude of some tax expenditure estimates will be smaller because some taxpayers are assumed to claim the standard deduction, rather than to itemize deductions. Altshuler and Dietz point out that the tax form behavior effect results in the tax expenditure estimates for relatively large provisions generate relatively larger tax expenditure effects than smaller provisions because of the effects of the standard deduction, creating an inherent bias in the tax expenditure estimates. Another problem identified by Altshuler and Dietz with tax expenditure estimation relates to the effects of expiring tax provisions. Altshuler and Dietz (2008) note that the interaction of tax expenditure provisions raises a significant issue that is routinely ignored, that is, a list of tax expenditure provisions cannot be summed to determine a total estimate for a group of tax expenditure provisions. Researchers and people interested in the policy implications of tax expenditures frequently sum tax expenditure estimates to provide a “total” tax expenditure estimate. However, researchers have calculated that the summing of tax expenditure estimates typically overstates the magnitude of these estimates by 17.5 percent (Hungerford 2006) or 25 percent (U.S. Government Accountability Office 2005). The overstatement of tax expenditure estimates when summed represents a larger problem for individual tax expenditures than for tax expenditures primarily utilized by corporations because of the effects of tax form behavior discussed above. Alshuler and Dietz also identify the interaction effects on tax expenditure estimates of the alternative minimum tax (AMT). The effects of the AMT can result in the sum of two related tax expenditure provisions (e.g., the itemized deduction for state and local income tax and for property taxes) producing a larger tax expenditure estimate than the estimate for each provision calculated separately. Interaction effects present one of the biggest problems with tax expenditure estimates. Burman, Geissler, and Toder (2008) found that the tax expenditure estimate for the sum of income exclusion provisions (e.g., life insurance, retirement savings, and other item) in 2007 was six percent larger than the sum of the individual tax expenditure estimates. Buckley (2011) identifies another issue with tax expenditure estimates, which occurs because some of the major tax expenditures are calculated by comparing what will be claimed in the current year compared to what would be claimed if the “normal tax law” were in effect for the current year and all prior years. Buckley uses accelerated depreciation as an example. Accelerated depreciation deductions are recaptured in later years in the form of smaller depreciation deductions, but the tax expenditure estimate for accelerated depreciation does not include the effect of the depreciation recapture. A revenue estimate for the repeal of accelerated depreciation would be larger than the tax expenditure estimate because it would include the

52
denial of the accelerated deduction for future investments as well as the depreciation recapture with respect to old investments.48 The Century Foundation Working Group on Tax Expenditures recommended a number of changes to the reporting of tax expenditure information, including: (1) annual estimates of the cost of all tax expenditures together and groups by budget category, taking into account the interactions among separate tax expenditure items, (2) historical trends in tax expenditures, using a consistent estimating methodology over time, (3) information about the distribution of tax expenditure benefits for all tax expenditures as a group and for large, separate individual income tax expenditures, and (4) periodic reviews of tax expenditures on a five-year cycle, with some reviews published each year (Bad Breaks 2002). 5. Distribution of Tax Expenditures – The JCT annual tax expenditure pamphlet includes distribution by income class of selected individual tax expenditures, including: (1) the itemized deduction for medical expenses, (2) the real estate tax deduction, (3) the deduction for state and local income, sales, and personal property taxes, (4) the charitable contribution deduction, (5) the child care credit, (6) the earned income credit, (7) the exclusion for some Social Security and Railroad Retirement benefits, (8) the child tax credit, (9) the education credits, (10) the student loan interest deduction, (11) the mortgage interest deduction, and (12) the negative tax expenditure for the phase-out of the personal exemption for regular income tax and denial of the personal exemption and the standard deduction for AMT purposes (Joint Committee on Taxation 2013). A recent Congressional Budget Office (2013) paper examines the distribution of major tax expenditures in the individual income tax system, including: (1) the exclusion from income for employer-sponsored health insurance, (2) the exclusion from income for net pension contributions and earnings, (3) the exclusion for capital gains on assets transferred at death, (4) the exclusion for a portion of Social Security and Railroad Retirement benefits, (5) the itemized deduction for certain taxes paid to state and local governments, (6) the deduction for mortgage interest payments, (7) the deduction for charitable contributions, (8) preferential tax rates for capital gains and dividends, (9) the earned income tax credit, and (10) the child tax credit. CBO found that the distribution of these tax expenditures are unevenly distributed across income quintiles, with more than half of the tax expenditure benefits accruing to households in the top quintile and 17 percent going to households in the top one percent.
C. Scrutiny of Tax Expenditures 1. Negative Connotations of Items That Are Tax Expenditures – Stanley Surrey did not intend the original concept of tax expenditures to provide a negative connotation. Rather, his intent was to provide scrutiny for provisions that achieve goals indirectly that could have been achieved directly through a spending program. In their 1985 book, Surrey and McDaniel (1985) stated that “the classification of an item as a tax expenditure does not in itself make that item either a desirable or undesirable provision.” 48 This analysis assumes that the repeal of accelerated depreciation applies with respect to all investments (old and new).

53
However, the identification of an item as a tax expenditure generally carries a negative connotation, particularly among individuals who are not tax policy experts. As Burten and Sadiq (2013, 1) note: “at first blush, the concept of a tax expenditure is beguilingly simple. For present purposes it is sufficient to note that a tax expenditure is generally understood to be a ‘tax break’ allowed to a taxpayer or a limited group of taxpayers...They have previously been known in the United States as ‘tax preferences.’ A layman may refer to them as ‘loopholes’ or ‘escapes from tax.’” In a recent article, Buckley (2011) notes that “it is easier to deplore tax expenditures in principle than to actually address them in legislation, particularly when the debate is dominated by some common misconceptions. Too often the term ‘special interest loopholes’ has been used as a synonym for tax expenditures. Yet a review of the largest tax expenditures indicates that few are special interest provisions, and most survived the scrutiny of TRA 1986” (Buckley 2011, 256). 2. Size of Tax Expenditures – Many commentators have written about the size of the tax expenditure budget. A recent OECD study noted that “another distinguishing feature of the U.S. income tax system is the scale and scope of tax expenditures, which reduce the tax base and substantially complicate compliance” (Lenain et al., 2010). Lenain et al. noted that, in 2008, the value of tax expenditures approximately equaled total Federal personal income tax receipts in that year. Looking at other countries, Lenain found that U.S. tax expenditures as a percentage of total personal income tax receipts were second only to Canada and, at 29.36 percent, significantly exceeded other countries for which similar data were available including Germany (2.91 percent), Korea (10.09 percent), the Netherlands (2.74 percent), Spain (3.86 percent), and the United Kingdom (13.47 percent). Most of the largest tax expenditures provide benefits related to the individual income tax. Baneman et al. (2012) estimate that business-related tax expenditures total approximately 0.8 percent of GDP per year, whereas personal tax expenditures total approximately 6 percent of GDP. As a percentage of total tax expenditures, Rogers and Toder (2011) estimate that business tax expenditures in 2013 represent 12.6 percent of total tax expenditures compared to 23.0 percent in 1985 (prior to enactment of the Tax Reform Act of 1986, which reduced tax expenditures overall). Rogers and Toder also estimate that corporate tax expenditures represent 10.9 percent of total tax expenditures in 2013. Buckley (2011) notes that, in 2008, approximately eight percent of tax expenditures benefited corporations even though corporate income tax receipts equaled approximately 25 percent of individual income tax receipts. Buckley states that the small corporate share of tax expenditures provides evidence that it is not accurate to state that there are hundreds of billions of dollars of special interest tax expenditure provisions. 3. Review of Tax Expenditures – In proposing the identification and quantification of tax expenditures, Surrey intended to ensure that tax provisions that are similar to spending programs would face special scrutiny. Certainly, the annual publication of the tax expenditure budget has achieved this goal over the years.

54
Periodically, the Senate Committee on the Budget prepares a compendium on tax expenditures prepared by the Congressional Research Service (Committee on the Budget, 2012). For each tax expenditure, this compendium includes the tax expenditure’s revenue cost, legal authorization, description of the provision and its impact, the rationale for the provision when it was adopted, an assessment of the provision and a bibliography relating to the provision. The Government Accountability Office (GAO) has conducted a variety of studies relating to tax expenditures, often at the request of Members of Congress interested in reviewing the provisions. In a 1994 study, GAO noted that studies had raised questions about the effectiveness, efficiency, and equity of some tax expenditures, which was troublesome because tax expenditures do not overtly compete with spending provisions in the annual budget process (United States Government Accounting Office 1994). A 2005 GAO report examined growth in tax expenditures between 1974 and 2004, finding that the number of tax expenditures had more than doubled from 67 to 146 (United States Government Accountability Office 2005).49 The GAO analyzed Treasury estimates of tax expenditures and concluded that the sum of revenue losses, after adjustment for inflation, tripled over the period from $240 billion to approximately $730 billion. The report states “since 1981 when outlay-equivalent estimates were first available, the sum of the outlay-equivalent estimates for tax expenditures has been similar in magnitude to discretionary spending, and this sum exceeded total discretionary spending for more years during the last decade (United States Government Accountability Office 2005, 4-5). GAO has issued three reports on tax expenditures in 2013. The first report (United States Government Accountability Office Tax Expenditures 2013) develops a framework for use in evaluating the effectiveness of tax expenditure provisions. The framework identifies criteria and analytical questions that could be used to help policymakers evaluate the effectiveness of tax expenditures. The report notes that the Government Performance and Results Act (GPRA) Modernization Act of 2010 (GPRAMA) established a process for providing a more crosscutting and integrated approach to improving government performance, including the scrutiny of tax expenditures. The broad categories of questions included in the GAO framework for review of tax expenditures include the following:
1. What is the tax expenditure’s purpose and is it being achieved? 2. Even if its purpose is achieved, is the tax expenditure good policy? 3. How does the tax expenditure relate to other Federal programs? 4. What are the consequences for the Federal budget of the tax expenditure? 5. How should evaluation of the tax expenditure be managed?
In its second 2013 report, GAO undertook a review of corporate tax expenditures (United States Government Accountability Office Corporate Tax Expenditures 2013). The study found that Treasury identified 80 corporate tax expenditures resulting in $181 billion of revenue losses.
49 The JCT showed a significant increase in the number of tax expenditure provisions from 2007 to 2008, which resulted from expanded breakouts of tax expenditure provisions that had previously been listed as a single provision. See Figure 5 in Joint Committee on Taxation, Present Law and Historical Overview of the Federal Tax System, JCX-1-11, January 18, 2011.

55
GAO found further than 56 of the 80 corporate tax expenditures are also utilized by individual taxpayers, such as sole proprietors, partners of partnerships, and shareholders of S corporations and that these tax expenditures resulted in $122.4 billion in revenue losses attributable to the individual income tax. GAO found that, while corporate tax expenditures span a majority of budget functions, 81 percent of the estimated $181 billion in revenue losses was concentrated in the areas of international affairs and housing and commerce budget areas. The third 2013 GAO report examined the difficulty in evaluating tax expenditures due to a lack of data relating to utilization (United States Government Accountability Office IRS Data 2013). GAO found that inadequate data are available to evaluate $492 billion of estimated tax expenditures, representing nearly half of all tax expenditures. Included in these amounts are $102 billion of tax expenditures that are not reflected on IRS tax forms, such as the exclusion of interest on life insurance, and $390 billion of tax expenditures that are on IRS tax forms, but do not have their own line items, such as the credit for holding clean renewable energy bonds which is combined with other items in a single line on a tax form. 4. Small Business Tax Expenditures – Only one prior paper has examined the effects of tax expenditures utilized by small businesses. In research funded by the Small Business Administration (SBA) (SBA 2004), Innovation and Information Consultants examined whether incorporated small businesses have a competitive advantage or disadvantage with respect to ten identified tax expenditures, including the following: Accelerated depreciation Graduated corporate income tax rates Exclusion of interest on state and local government debt Extraterritorial income exclusion Deferral of income from controlled foreign corporations Inventory property sales source rule exception U.S. possessions tax credit R&D tax credit Expensing of R&D Low income housing tax credit Foreign tax credit50 Deduction for travel and entertainment expenses
In cases in which necessary data were not available, the study conducted case studies of three industries (Pharmaceutical Preparation Industry, the Wired Telecommunications Carriers Industry, and the Computer Systems Design Services Industry). The report’s findings included the following:
1. Small firms benefit from certain tax expenditure provisions, but by a smaller amount than large firms;
50 The report notes that the foreign tax credit is not treated as a tax expenditure because it represents a provision designed to eliminate double taxation of income. However, the study included this provision because of the magnitude of the provision and its interaction with other provisions of the Internal Revenue Code.

56
2. Small firms obtain a significant benefit from the partial deduction for travel and entertainment expenses;
3. Small firms do not benefit significantly from tax expenditure provisions relating to research and development;
4. Accelerated depreciation is the most significant tax expenditure for small businesses in terms of dollar impact and the section 179 expensing deduction helps level the playing field for small businesses; and
5. Foreign tax credits favor large firms relative to small firms. While the study provides useful information on the effects of tax expenditures on incorporated small businesses, it fails to measure the effects of tax expenditures on other types of small businesses, including sole proprietorships, partnerships, and S corporations, which are not subject to the corporate income tax.