Measuring project management inputs throughout … ·...
16
Measuring project management inputs throughout capital project delivery Sungmin Yun a , Jiyong Choi b , Daniel P. Oliveira a , Stephen P. Mulva a , Youngcheol Kang c , ⁎ a Construction Industry Institute, University of Texas at Austin, 3925 West Braker Lane (R4500), Austin, TX, 78729, USA b Department of Civil, Architectural, and Environmental Engineering, University of Texas at Austin, 301, E. Dean Keeton St. Stop C1752, Austin, TX 78712, USA c Department of Global Construction, The University of Seoul, 163 Seoulsiripdae-ro, Dongdaemun-gu, Seoul, 02504, South Korea Received 19 January 2016; received in revised form 24 May 2016; accepted 2 June 2016 Abstract Despite continuous efforts into benchmarking over the last decades, few have focused on management efforts of project organizations who are involved in managing the capital project. This study presents a phase-based framework and 10 input measures for measuring project management efforts in a capital project. The measures are planning, organizing, leading, controlling, design efficiency, human resources, quality, sustainability, supply chain, and safety. This study quantifies and assesses the inputs and further sorts the results by industry sectors and project phases. The analyses show that traditional functions tend to have more consistent implementation than construction-specific functions. The results indicate that infrastructure sector tends to exert fewer and less consistent efforts than building and industrial sectors. This study contributes a new benchmarking framework and is the first to quantify project management inputs of a capital project systematically. Additionally, phase-focused and phase-wide benchmarking applications of the input measures are also discussed and provided. © 2016 Elsevier Ltd, APM and IPMA. All rights reserved. Keywords: Project management input; Phase-based benchmarking; Leading indicator; Project organization; 10-10 program 1. Introduction Over the past two decades, benchmarking has played a significant role as a strategic process that enables construction firms to create competitiveness by continuously improving their performance (McCabe, 2008). Continuous research efforts in benchmarking studies have produced several effective measures to evaluate the performance outcomes of capital projects (Chan and Chan, 2004; Costa et al., 2006; Cox et al., 2003; Lee et al., 2005; Ramirez et al., 2004; Yeung et al., 2009, 2013). Most benchmarking methods adopt an approach that tracks ex-post lagging performance indicators focusing on cost, schedule, changes, safety, and productivity. Since these indicators are usually only obtained after project completion, they do not provide managers a chance to make changes to the performance or results of their projects while they are still ongoing (Beatham et al., 2004; Costa et al., 2006). In addition, benchmarking models have not paid much attention to evaluating organizational or human resources changes as performance indicators in firms executing a capital project. However, the recent global economic recession has moti- vated construction firm owners and contractors to diagnose their ongoing projects at more detailed levels and proactively react to create better project outcomes. The traditional benchmarking approach, based on lagging indicators, has been found to be an unsatisfactory tool for management of capital projects in complex, uncertain project environments. Therefore, it was recognized that the industry needed a new benchmarking approach with leading indicators while projects are ongoing. Such a tool can provide early warnings, identify potential problems, and establish action plans to remedy and improve them (Yeung et al., 2013). The Construction Industry Institute (CII) has developed a phase-based benchmarking ⁎ Corresponding author. E-mail address: [email protected] (Y. Kang). www.elsevier.com/locate/ijproman http://dx.doi.org/10.1016/j.ijproman.2016.06.004 0263-7863/00 © 2016 Elsevier Ltd, APM and IPMA. All rights reserved. Available online at www.sciencedirect.com ScienceDirect International Journal of Project Management 34 (2016) 1167 – 1182
Transcript of Measuring project management inputs throughout … ·...

Available online at www.sciencedirect.com
ScienceDirect
www.elsevier.com/locate/ijpromanInternational Journal of Project Management 34 (2016) 1167–1182
Measuring project management inputs throughout capitalproject delivery
Sungmin Yun a, Jiyong Choi b, Daniel P. Oliveira a, Stephen P. Mulva a, Youngcheol Kang c,⁎
a Construction Industry Institute, University of Texas at Austin, 3925 West Braker Lane (R4500), Austin, TX, 78729, USAb Department of Civil, Architectural, and Environmental Engineering, University of Texas at Austin, 301, E. Dean Keeton St. Stop C1752, Austin, TX 78712, USA
c Department of Global Construction, The University of Seoul, 163 Seoulsiripdae-ro, Dongdaemun-gu, Seoul, 02504, South Korea
Received 19 January 2016; received in revised form 24 May 2016; accepted 2 June 2016
Abstract
Despite continuous efforts into benchmarking over the last decades, few have focused on management efforts of project organizations who areinvolved in managing the capital project. This study presents a phase-based framework and 10 input measures for measuring project managementefforts in a capital project. The measures are planning, organizing, leading, controlling, design efficiency, human resources, quality, sustainability,supply chain, and safety. This study quantifies and assesses the inputs and further sorts the results by industry sectors and project phases. Theanalyses show that traditional functions tend to have more consistent implementation than construction-specific functions. The results indicate thatinfrastructure sector tends to exert fewer and less consistent efforts than building and industrial sectors. This study contributes a new benchmarkingframework and is the first to quantify project management inputs of a capital project systematically. Additionally, phase-focused and phase-widebenchmarking applications of the input measures are also discussed and provided.© 2016 Elsevier Ltd, APM and IPMA. All rights reserved.
Keywords: Project management input; Phase-based benchmarking; Leading indicator; Project organization; 10-10 program
1. Introduction
Over the past two decades, benchmarking has played asignificant role as a strategic process that enables constructionfirms to create competitiveness by continuously improving theirperformance (McCabe, 2008). Continuous research efforts inbenchmarking studies have produced several effective measuresto evaluate the performance outcomes of capital projects (Chanand Chan, 2004; Costa et al., 2006; Cox et al., 2003; Lee et al.,2005; Ramirez et al., 2004; Yeung et al., 2009, 2013). Mostbenchmarking methods adopt an approach that tracks ex-postlagging performance indicators focusing on cost, schedule,changes, safety, and productivity. Since these indicators areusually only obtained after project completion, they do notprovide managers a chance to make changes to the performance
⁎ Corresponding author.E-mail address: [email protected] (Y. Kang).
http://dx.doi.org/10.1016/j.ijproman.2016.06.0040263-7863/00 © 2016 Elsevier Ltd, APM and IPMA. All rights reserved.
or results of their projects while they are still ongoing (Beatham etal., 2004; Costa et al., 2006). In addition, benchmarking modelshave not paid much attention to evaluating organizational orhuman resources changes as performance indicators in firmsexecuting a capital project.
However, the recent global economic recession has moti-vated construction firm owners and contractors to diagnosetheir ongoing projects at more detailed levels and proactivelyreact to create better project outcomes. The traditionalbenchmarking approach, based on lagging indicators, hasbeen found to be an unsatisfactory tool for management ofcapital projects in complex, uncertain project environments.Therefore, it was recognized that the industry needed a newbenchmarking approach with leading indicators while projectsare ongoing. Such a tool can provide early warnings, identifypotential problems, and establish action plans to remedy andimprove them (Yeung et al., 2013). The Construction IndustryInstitute (CII) has developed a phase-based benchmarking

1168 S. Yun et al. / International Journal of Project Management 34 (2016) 1167–1182
framework, called the 10-10 program to address such issues. Itevaluates processes and practices, as well as the organizationsand their people participating in capital project delivery at thephase level, using multi-dimensional tracking aspects (Kang etal., 2014; Yun et al., 2016).
This paper presents a phase-based framework and indicatorsof project management inputs to evaluate project managementefforts throughout capital project delivery. 10 project manage-ment inputs include planning, organizing, leading, controlling,design efficiency, human resources, quality, sustainability,supply chain, and safety. These inputs can be measured in thephase-based framework, which help project managers identifythe project status and establish corrective action plans. This studythus aims: 1) to develop a phase-based framework and inputmeasures for measuring project management efforts; 2) to assessproject management inputs by industry sectors and projectphases; and 3) to discuss applications of the input measures incapital project benchmarking. This approach enables construc-tion executives and project managers to identify impendingproblems and to take proactive steps in subsequent phases of anongoing project. Furthermore, the benchmarks allow a projectmanager to identify which project management inputs arevulnerable throughout capital project delivery.
2. Research background
Leading indicators are fundamental characteristics and/orevents found throughout capital project delivery that reflect orpredict project health. If recognized in a timely manner, leadingindicators enable proactive management to influence projectoutcomes (Choi et al., 2006). Leading indicators can be definedas “the measurements of processes, activities, and conditionsthat define performance and can predict future results” (Hinzeand Hallowel, 2013). Thus, they can play the followingsignificant roles in project management: 1) predict the futureperformance of the measured process, 2) present opportunitiesto change practices accordingly, and 3) allow future decisionsrelated to subsequent processes based on the outcomes ofprecedent processes (Choi et al., 2006).
Over the last decade, many research efforts have been made toidentify leading indicators and their application for performancemeasurement throughout capital project delivery (Almahmoud etal., 2012; Amaratunga et al., 2002; Choi et al., 2006; Jaafari,2007; Sarshar et al., 2004). Most attempted to identify leadingindicators among critical success factors or key performanceindicators that influence project outcomes. However, it is difficultfor managers to use these traditional measures to gain insightsthat enable performance improvements on ongoing projects, asthere is no systematic approach to applying leading indicators toproactive project management.
On the other hand, several proactive approaches have existed tolink leading indicators with performance outcomes by measuringthe state of the project to create better project outcomes(Almahmoud et al., 2012; Amaratunga et al., 2002; Choi et al.,2006; Jaafari, 2007; Sarshar et al., 2004). One such effortintroduced a business process diagnostic tool for constructionprojects from the facilities management perspective. It developed a
step-wise process for assessing construction process capability(Amaratunga et al., 2002; Sarshar et al., 2004). The frameworkidentified key processes tomeasure that indicated capacitymaturitylevels. Another approach identified leading indicators as projecthealth indicators (PHIs) and developed a tool to forecast potentialrisks affecting project outcomes (Choi et al., 2006). This approachinitially identified 181 potential leading indicators throughbrainstorming, and then refined and finally confirmed 43 leadingindicators that had statistical relationships to project outcomes.The leading indicators were categorized as CII practices, andthey include alignment, change management, constructability,contracting, quality management, safety practices, project controls,and team building. Jaafari (2007) developed a diagnostic toolsetdesigned to check the health of a project and program that focusedon the capabilities andmanagement approaches influencing projectsuccess. The toolset mainly consisted of business, strategic, andproject implementation assessments. The business and strategiccriteria focused on customers and markets, stakeholders, technol-ogy, facility design and operational requirements, supply chainsystems, learning and innovation, finance, project deliverysystems, risks, and due diligence. The project implementationcriteria included governance and leadership, engineering, detailsand specifications, procurement, transportation and warehousing,planning and control, team performance, information and commu-nications management, quality management, offsite management,and risk management. Based on the results from Jaafari's (2007)study, Almahmoud et al. (2012) adopted the concept of a projecthealth check (PHC) and developed a framework identifying 67leading indicators under 9 core management functions for capitalproject delivery. The core management functions to identifyleading indicators consisted of 1) governance and leadership,2) engineering, detailed designs, and specifications, 3) procure-ment, 4) planning and control, 5) team performance, 6) informationand communication management, 7) quality management, 8)offsite management, and 9) risk management.
Despite these research efforts, the proposed frameworks sharea common fundamental limitation in application to real capitalproject delivery. Although the existing benchmarking frame-works provided a holistic strategy to management at the projectlevel, managers could not use the results for ongoing projects.Moreover, although the early stages of capital project deliveryhave a high impact on project outcomes, the frameworks in theprevious studies tended to focus on project execution, particularlythe construction phase. The industry has expressed a need for analternative approach that provides timely information so thatmanagement efforts and the project's status can be evaluated atthe phase level while the project is ongoing. To meet thisdemand, this study develops a phase-based framework andidentifies leading indicators for measuring project managementinputs throughout capital project delivery.
3. Research method
3.1. Conceptual framework
This study developed a conceptual framework to measureproject management efforts throughout capital project delivery

1169S. Yun et al. / International Journal of Project Management 34 (2016) 1167–1182
as shown in Fig. 1. For benchmarking through capital projectdelivery, it is necessary to build a comprehensive frameworkthat can be applied to various capital industry sectors andproject phases. It enables to evaluate and compare projectmanagement efforts from the same point of view. Therefore, theframework consists of industry sector, project phase, andmeasurement criteria as project management inputs in capitalproject delivery. It was designed to cover all project phases forvarious types of capital projects including the industrial,building, and infrastructure sectors. The project phases usedin this research include Front End Planning/Programming(FEP), Engineering/Design (referred to as Engineering hereaf-ter), Procurement, Construction, and Startup/Commissioning(referred to as Startup hereafter). Project phases have differingclassifications depending on the project type. For example, FEPin industrial and infrastructure projects is called programmingin building projects. As a matter of course, the project phases'definitions, activities, and timeframes are slightly different byindustry type, but are very similar to each other. This studyfollows the project phases and their major activities establishedby CII (Choi et al., 2015).
The phase-based framework was designed to support repeatedevaluations of the project management efforts in each projectphase. The framework design accommodates both phase-focusedand phase-wide assessments. The phase-focused assessment is ananalysis that evaluates project management efforts within aspecific phase and is compared to the same phase of other similarprojects. The phase-wide assessment is a cross-phase analysis totrack project management efforts over time and to compare them
Fig. 1. Conceptual framework for meas
to preceding or subsequent phases. This multi-dimensionalframework maximizes the benchmarking benefits by integratingperformance and progress measurement.
3.2. Identification of leading indicators
The authors undertook an extensive literature review to identifypotential leading indicators. The process included evaluation ofother CII resources such as the previous benchmarking question-naires and research reports. Academic resources identifyingleading indicators or critical success factors affecting projectperformance were also reviewed (Almahmoud et al., 2012; Choi etal., 2006; Chong et al., 2009; Chua et al., 1999; Fernández-Sánchez and Rodríguez-López, 2010; Hastak et al., 1996; Hwangand Lim, 2012; Jaafari, 2007; Parfitt and Sanvido, 1993; Pinto andSlevin, 1987; Ugwu and Haupt, 2007; Zwikael, 2009). Theresearch team also reviewed publications from industry practi-tioners, including various white papers from different industries aswell as publications from selected construction consultingcompanies such as Independent Project Analysis (IPA) and ePM,to identify leading indicators that measure project managementefforts in construction project delivery.
Input from industry experts was gathered at various CIIactivities and events in late 2012 and early 2013. CII holds theirBoard of Advisors (BoA) meeting twice annually. The boardmembers are senior managers representing their organizationsto oversee CII and commit resources to CII activities. Duringthe BoA meeting in April 2013, a roundtable discussion washeld with more than 60 board members attending the session to
uring project management inputs.

1170 S. Yun et al. / International Journal of Project Management 34 (2016) 1167–1182
specifically address leading indicators and to capture the typesof metrics they need to support their capital project delivery.During this session, the participants discussed the commoninput and output measures used in their industry sectors.
After an extensive review of these sources, the authorsidentified 228 initial leading indicators. The leading indicatorswere revised by the CII BoA members, the CII PerformanceAssessment Committee (PAC), and the CII Performance Assess-ment Community of Practice (PACOP)members. Experts reportedmore than 20 years of industry experience on average. Manyworked as estimators, project managers, and benchmarkinganalysts within their companies, or had expertise in performanceassessment and benchmarking. Through a facilitated process, theyreviewed the initial sets of potential leading indicators, mergedsome similar indicators, and evaluated their importance. Thisyielded the final identification of 120 leading indicators.
3.3. Linkage between leading indicator and project managementinputs
The 10-10 program has benchmarking as its primary goal,and 120 leading indicators are too many for that purpose. Coreproject management functions are restricted to those influenc-ing project outcomes.
Based on the literature review of crucial process, activity, andcondition measurements predicting future results and affectingperformance outcomes, the research team identified 10 inputmeasures. These measures incorporate leading indicators associ-ated with core project management functions: planning, organiz-ing, leading, controlling, design efficiency, human resources,quality, sustainability, supply chain, and safety.
Table 1 summarizes the core project management functionsthat are considered input measures and their descriptions withrelevant studies that examined the relationships between the inputmeasures and performance outcomes or project success. The 10input measures are divided into two groups. The basic manage-ment measures include planning, organizing, leading, andcontrolling, and represent fundamental functions commonlyidentified as critical factors affecting project outcomes acrossindustries. The remaining six measures are construction-specificmeasures used to assess processes and practices in constructionprojects. The research team believed that considering bothbusiness and construction perspectives in all project phases fromplanning to startup is a relevant and balanced approach to evaluateproject management efforts.
Each leading indicator was linked to one ormore of the 10 inputmeasures corresponding to core project management functions, asshown in Fig. 2. The links were drafted by the CII research teamand validated by CII PAC and PACOP members at multiplerounds of meetings and conference calls. The framework allowedfor the linkage between leading indicators and input measures to beidentified differently, depending on characteristics of industrysectors and project phases. Since each link connects to differentphases and industry sectors, the wording for each leading indicatorwas carefully reviewed and revised. Some links led to longdiscussions because certain input measures are correlated. All linksbetween leading indicators and input measures are listed in
Appendix A; note that some leading indicators are linked tomultiple input measures, whereas some are linked to only one.
3.4. Questionnaire development
The project benchmarking questionnaires incorporate theleading indicators derived from the comprehensive literaturereview and input from industry experts. This study created 15industry-specific and phase-specific questionnaires with differentnumbers and types of questions customized for the industrial,building, and infrastructure sectors and their five project phases tomeasure performance throughout capital project delivery. Onaverage, each questionnaire has 50 to 60 questions to evaluate theleading indicators in each phase. The phase-based design enabledthe research team to shorten the questionnaire so industrypractitioners could spend less time in gathering and inputtingproject data. The approach to include essential, relevant elementsfacilitated participation in the 10-10 program.
The questionnaire also contains subjective measures askingabout personal judgment or perceptions. As such, various types ofquestions were used to query the level of project managementefforts including yes/no, single/multiple selections, numericopen-ended, and 7 Likert scale ranging from “strongly agree” to“strongly disagree.” The 10-10 questionnaires are available fromthe website of the CII 10-10 Performance Assessment Campaign(at http://10-10program.org/resource.htm). It has long been arguedthat researchers should carefully consider the use of subjectivemeasures because of the risk of measurement bias from thedifferences between respondents' personal perceptions (Chan andChan, 2004; Hughes et al., 2004; Muckler and Seven, 1992;Rothstein, 1989). Statement-based assessment is often criticizedbecause of potential inconsistency in responses due to respon-dents' subjective perceptions. Hence, most studies that measureperformance adopt quantitative and objective measures to evaluateperformance outcomes. Subjective and objective measures can becomplementary however, particularly for evaluating projectsuccess (Hughes et al., 2004). To minimize potential biases causedby subjective measurement, this study measures leading indicatorsbased on multiple responses gathered from project team membersand stakeholders involved in a project. This effort is expected tominimize potential biases and their misleading effects on thequantified scores of input measures. Moreover, this approachillustrates the extent to which project team members andstakeholders are aligned throughout construction project delivery.
The survey questionnaires are slightly different by threeindustry sectors to reflect their natures and different terminol-ogies, but most questions are the same across the industry.Although only few questions are slightly different, inputmeasure score is aggregated by weighted individual questionscores. Therefore, the input measure scores can be comparablein different industries.
3.5. Quantification of project management inputs
Prior to data collection, it was necessary to establish adetailed procedure for quantifying the input measure scorecorresponding to each project management input. The

Table 1Definition of project management inputs and their impacts.
PM input Description Impact to project outcomes Sources
Planning The work a manager performs to predetermine acourse of action
▪ Effective planning leads to improve capitalproject performance in terms of cost,schedule, operational characteristics, andpredictability of project outcomes.
▪ Planning helps develop and identify knownor key critical restraints and interfaces,thereby reducing the chance of unexpectedoccurrences that threaten project progress.
Dumont et al. (1997), Gibson et al. (2006);Yun et al. (2012b); Zwikael (2009)
Organizing The work a manager performs to arrange andrelate work to be done so people can perform itmost effectively
▪ Organizing project teams to have collaborateculture and aligned objectives are significantto increase productivity, which lead toperformance improvement.
▪ Appropriate organizing efforts enable com-plimentary use of available skills, highlyintegrated teamwork to achieve projectsuccess.
Ankrah et al. (2009), Cook and Hancher(1990), Janz (1999), Kraft and Chinowsky(2003), Ochieng and Price (2009), Smith andOffodile (2008), Yun et al. (2012a)
Leading The work a manager performs to cause peopleto take effective action
▪ There is significant relationship betweenproject leader's qualification and leadershipstyle and project performance.
▪ The leader behavior such as communicat-ing project goals, setting high standards andexpectations in strongly associated withperceptions of team and project perfor-mance such as cost and schedule.
Dainty et al. (2003), Dukerich and Ammeter(1998), Nwachukwu (1996), Olomolaiye(1990), Thamhain (2004)
Controlling The work a manager performs to assess andregulate work in progress and completed
▪ Project control, observing and reporting onactual performance against expected, is amajor factor for the success of project deliveryand influences to cost, schedule, and quality.
▪ Effective project controls are essential inadministering the fundamental project deliv-ery elements of time, cost, risk, and change.
Nahapiet and Nahapiet (1985); Olawale andSun (2010), Pinto and Slevin (1987)
Design efficiency Practice to optimize the design in its use ofmaterial quantities to provide maximumcapacity at minimum cost
▪ Effective design contributes to enhancingproject value by reducing overdesign.
▪ Inefficient design, related to disproportionateamount of material waste, containment ofmuch greater amount or higher quality ofmaterials, leads to poor project performance.
O'Connor et al. (2007), O'Connor and Singh(2009)
Human resources Function related with adequate staffing of projectteam with a minimum amount of staff turnover,appropriate training, and improving capabilityof the people involved in a capital project,with a minimum amount of staff turnover andappropriate training, and measures if people arecapable of achieving project goals.
▪ Human resource issues such as unqualifiedstaff, inadequate training, and inexperi-enced management are one of major causesof project failures.
▪ Critical human resource issues in construc-tion industry are to make appropriate staffingwhich is to allocate qualified staffs in rightplace and right timing, to train them properly,and to minimize amount of staff turnoverduring execution to achieve project goalsefficiently and effectively.
Belout (1998), Belout and Gauvreau (2004),Loosemore et al. (2003), Tabassi et al. (2012)
Quality Quality measures if the project team is strictlyconforming to project requirements. Analyzesif programs are pursued to assure the deliveryof material goods as intended.
▪ Contractors who use Total Quality Manage-ment (TQM) reported higher customersatisfaction, improved schedule performance,improved relationships with architect/engi-neering firms and reduced rework
▪ Costs associated with rework were as high as12% of the total project costs and required asmuch as 11% of the total project workinghours.
Arditi and Gunaydin (1997), Hoonakker et al.(2010)
Sustainability Sustainability evaluates steps taken by theproject team to reduce the environmentalimpact of the project during construction andoperation.
▪ Green projects are more costly than con-ventional projects because of additionalregulations green projects need to follow.
▪ Because of their complexity, green projectsneed to have more planning efforts forbetter project outcomes.
Chong et al. (2009), Fernández-Sánchez andRodríguez-López (2010), Kang et al. (2013),Kats et al. (2003), Nalewaik and Venters(2008), Ugwu and Haupt (2007)
(continued on next page)
1171S. Yun et al. / International Journal of Project Management 34 (2016) 1167–1182
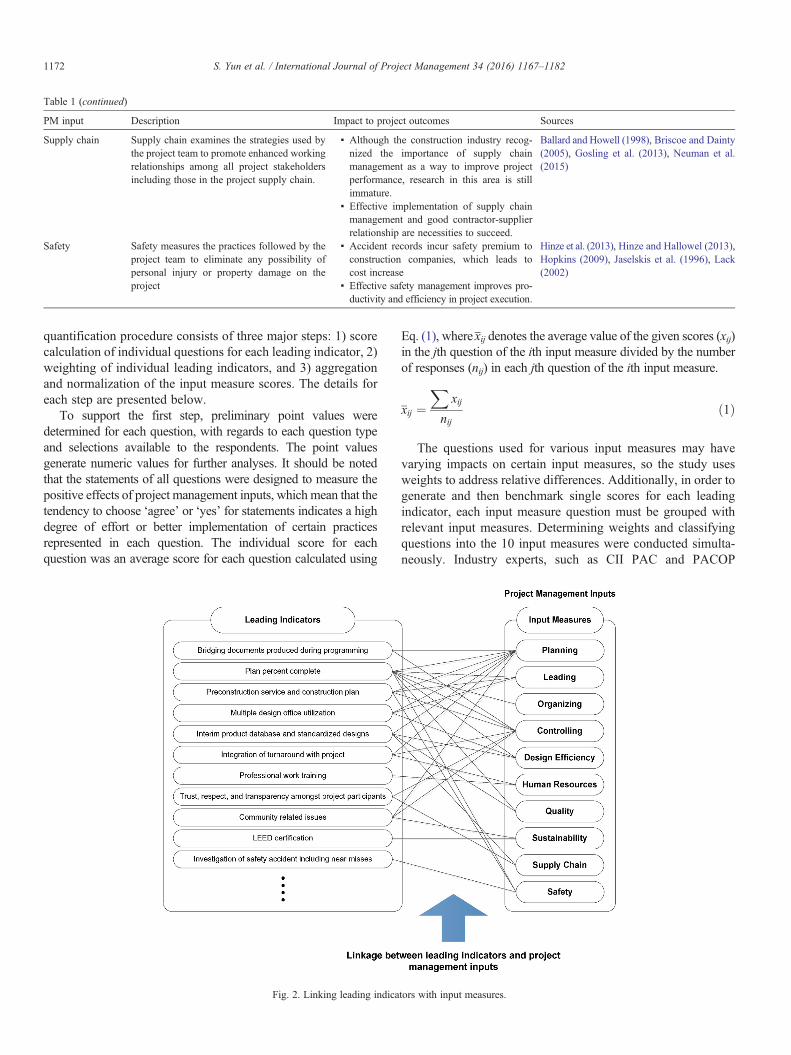
Table 1 (continued)
PM input Description Impact to project outcomes Sources
Supply chain Supply chain examines the strategies used bythe project team to promote enhanced workingrelationships among all project stakeholdersincluding those in the project supply chain.
▪ Although the construction industry recog-nized the importance of supply chainmanagement as a way to improve projectperformance, research in this area is stillimmature.
▪ Effective implementation of supply chainmanagement and good contractor-supplierrelationship are necessities to succeed.
Ballard and Howell (1998), Briscoe and Dainty(2005), Gosling et al. (2013), Neuman et al.(2015)
Safety Safety measures the practices followed by theproject team to eliminate any possibility ofpersonal injury or property damage on theproject
▪ Accident records incur safety premium toconstruction companies, which leads tocost increase
▪ Effective safety management improves pro-ductivity and efficiency in project execution.
Hinze et al. (2013), Hinze and Hallowel (2013),Hopkins (2009), Jaselskis et al. (1996), Lack(2002)
1172 S. Yun et al. / International Journal of Project Management 34 (2016) 1167–1182
quantification procedure consists of three major steps: 1) scorecalculation of individual questions for each leading indicator, 2)weighting of individual leading indicators, and 3) aggregationand normalization of the input measure scores. The details foreach step are presented below.
To support the first step, preliminary point values weredetermined for each question, with regards to each question typeand selections available to the respondents. The point valuesgenerate numeric values for further analyses. It should be notedthat the statements of all questions were designed to measure thepositive effects of project management inputs, which mean that thetendency to choose ‘agree’ or ‘yes’ for statements indicates a highdegree of effort or better implementation of certain practicesrepresented in each question. The individual score for eachquestion was an average score for each question calculated using
Fig. 2. Linking leading indica
Eq. (1), where xij denotes the average value of the given scores (xij)in the jth question of the ith input measure divided by the numberof responses (nij) in each jth question of the ith input measure.
xij ¼X
xij
nijð1Þ
The questions used for various input measures may havevarying impacts on certain input measures, so the study usesweights to address relative differences. Additionally, in order togenerate and then benchmark single scores for each leadingindicator, each input measure question must be grouped withrelevant input measures. Determining weights and classifyingquestions into the 10 input measures were conducted simulta-neously. Industry experts, such as CII PAC and PACOP
tors with input measures.

1173S. Yun et al. / International Journal of Project Management 34 (2016) 1167–1182
members, evaluated each leading indicator associated with eachinput measure on 3-point Likert scales ranging from high (3),medium (2), to low (1). Based on the experts' assessments, theaverage weighted score for each leading indicator wascalculated and then normalized by each input measure, thusleading to the final determination of the weights and linksbetween questions and input measures. The weights were usedto calculate the weighted individual question score bymultiplying the score and weight. The weighted scores wereaggregated to produce a single value. Thus, the score for theinput measure was calculated using Eq. (2), where yi denotesthe score of the ith input measure (yi), xmax ⋅ j denotes themaximum value of initial score in the jth question associatedwith each individual leading indicator, and wij denotes theweight of the jth question of the ith input measure.
yi ¼X
xij � wij
� �X
xmax� j � wij
� �� 100 ð2Þ
3.6. Data collection
The CII initiated the 10-10 Performance Assessment Cam-paign to collect data in August 2013 through online surveyquestionnaires. The CII distributed invitations for online surveyto 143 CII member companies, and asked for 10 phase-basedproject data each company. The companies include owners,contractors, and suppliers that lead the global constructionindustry. As of July 2015, a total of 1638 survey responses of794 phase-based project data have been collected from 88companies. CII assigned a PA account manager to each of theparticipating companies. Account managers are responsible forinvestigating ambiguous data points and validating the submitteddata. They verify and clean up the data during the course of datavalidation.
Table 2 summarizes the database by phase and industrytype. Most submitted data belong to industrial projects.Because of the significantly different types of data, therewere limitations in the ability to conduct certain analyses byindustry sector. It is expected that more analyses will bepossible as more data come in from the building andinfrastructure sectors. FEP has the largest number of datapoints by phase, and the data for the four phases except Startupare relatively equally distributed.
Table 2Summary of CII 10-10 program database.
Industrial Buildin
Project phase N Percent N
Front end planning/programming 156 78.4% 24Design/engineering 137 73.7% 28Procurement 123 82.6% 12Construction 130 71.0% 38Startup/commissioning 54 70.1% 16Total 600 75.6% 118
4. Assessing project management inputs in project phases
Project management inputs were assessed by industry sectorand project phase using the quantified project management inputsbased on descriptive and experimental research approaches.Industry norm assessment applied a descriptive research approachto investigation of the current states of project management effortsmade in capital projects in terms of industry sector and projectphase. Industry sector assessment used an experimental researchapproach for hypothesis testing if the level of each projectmanagement input is different by industry sector through anAnalysis of Variance method.
4.1. Industry norms assessment
This study assessed project management inputs across sectorsand phases according to the phase-based framework formeasuring project management efforts throughout capital projectdelivery, as shown in Table 3. The mean values (M) of the 10input measures represent the levels of project management inputand the standard deviation (SD) values show the variances oftheir distributions. The ranks for the input measures werecalculated to highlight management efforts that received thegreatest attention by the project team in each project phase.
Over all, the basic management functions of planning, leading,organizing, and controlling have higher mean values and lowerstandard deviation than construction-specific functions acrossindustry sectors and project phase. This is because projectmanagement traditionally uses these core functions widely.Among them, organizing has the higher mean score and lowerstandard deviation, particularly in owner-driven phases such asfront end planning and startup. This means that the project teamusually put the greatest effort into organizing among the variousproject participants involved throughout capital project delivery.
On the other hand, the levels of effort in construction-specificfunctions varied across different project phases. Amongthem, design efficiency, sustainability, and supply chain inputsshowed lower levels of effort and higher variance than otherconstruction-specific functions across the project phases. This isprobably because the construction industry by comparison putsgreater emphasis on quality and safety. Notably, sustainabilityhad the lowest mean values and the highest variance in mostphases. This implies that sustainability input has not yet beenfully defined in capital project delivery, so it varies widely amongproject organizations.
g Infrastructure Total
Percent N Percent N Percent
12.1% 19 9.5% 199 100%15.1% 21 11.3% 186 100%8.1% 14 9.4% 149 100%20.8% 15 8.2% 183 100%20.8% 7 9.1% 77 100%14.9% 76 9.6% 794 100%

Table 3ANOVA results of input measures by industry sector and project phase.
Project phase Input measure Industrial Building Infrastructure ANOVA
Mean SD Rank Mean SD Rank Mean SD Rank F Sig.
Front end planning/programming Planning 66.3 14.0 6 65.9 10.9 4 57.9 14.6 5 2.978 0.053Organizing 75.8 12.9 1 69.2 11.2 2 69.9 16.6 1 3.776 0.025Leading 72.6 13.0 2 73.0 10.6 1 67.7 14.9 2 1.183 0.309Controlling 69.2 13.2 4 67.4 10.2 3 63.7 14.2 4 1.503 0.225Design efficiency 63.4 24.4 8 53.0 23.5 9 47.2 17.7 9 4.871 0.009Human resources 71.9 13.4 3 61.9 11.1 7 64.8 19.6 3 6.705 0.002Quality 64.3 16.9 7 65.9 10.6 5 54.9 18.1 6 2.776 0.065Sustainability 55.8 23.9 10 52.4 21.8 10 42.9 18.7 10 2.700 0.070Supply chain 59.7 16.1 9 63.6 14.6 6 52.2 20.1 7 2.620 0.075Safety 68.0 21.2 5 59.1 20.5 8 51.4 13.6 8 5.770 0.004
Engineering/design Planning 65.8 12.2 7 62.3 13.6 5 58.9 20.0 7 2.822 0.062Organizing 72.9 13.3 2 67.7 14.7 3 69.0 18.8 3 2.014 0.136Leading 72.5 12.8 3 69.7 15.3 2 73.1 17.9 1 0.534 0.587Controlling 67.6 12.9 5 64.6 14.7 4 67.0 16.6 4 0.571 0.566Design efficiency 67.8 15.7 4 59.1 14.4 8 56.6 23.1 8 6.389 0.002Human resources 66.7 13.5 6 61.8 15.3 6 64.6 19.8 5 1.395 0.251Quality 65.2 14.3 8 59.6 14.6 7 53.1 20.6 9 6.400 0.002Sustainability 46.1 21.6 10 50.0 23.3 10 38.5 21.5 10 1.640 0.197Supply chain 59.6 16.9 9 53.9 18.9 9 59.1 22.2 6 1.194 0.305Safety 79.1 19.9 1 79.5 22.4 1 71.9 25.7 2 0.705 0.496
Procurement Planning 65.1 15.2 7 72.8 14.3 5 66.9 12.8 7 1.385 0.254Organizing 72.0 14.2 2 78.4 17.2 3 75.1 11.5 3 1.238 0.293Leading 71.7 15.0 3 79.7 15.4 2 78.0 12.3 2 2.411 0.093Controlling 66.4 16.5 6 71.5 16.2 7 68.6 12.3 5 0.585 0.558Design efficiency 84.3 19.5 1 92.1 14.2 1 89.1 18.7 1 1.053 0.352Human resources 66.6 16.7 5 72.0 19.2 6 68.1 14.7 6 0.490 0.614Quality 64.7 19.4 8 70.0 15.4 8 60.6 12.6 9 0.746 0.476Sustainability 49.6 26.2 10 62.4 19.8 10 44.0 27.9 10 1.654 0.195Supply chain 62.3 17.6 9 65.3 18.5 9 65.1 12.9 8 0.286 0.752Safety 67.7 21.4 4 77.4 19.2 4 71.3 18.5 4 1.090 0.339
Construction Planning 71.9 15.0 4 77.1 9.8 3 77.4 11.1 3 2.762 0.066Organizing 75.8 12.0 2 79.1 8.7 2 80.9 8.8 1 2.411 0.093Leading 73.1 13.7 3 75.0 9.6 4 76.9 12.1 5 0.798 0.452Controlling 69.3 12.1 5 71.1 8.8 6 73.6 9.7 8 1.219 0.298Design efficiency 65.1 15.9 9 67.1 10.8 9 77.7 8.8 2 5.092 0.007Human resources 68.7 12.5 6 70.4 8.5 7 74.0 10.8 7 1.513 0.223Quality 67.6 14.4 8 67.9 9.5 8 69.3 10.3 10 0.119 0.888Sustainability 68.2 18.9 7 65.5 22.1 10 70.9 16.4 9 0.491 0.613Supply chain 63.3 21.4 10 71.4 12.7 5 74.3 13.0 6 4.115 0.018Safety 83.9 9.7 1 80.7 10.6 1 77.3 8.5 4 3.975 0.020
Startup/commissioning Planning 77.4 15.9 4 75.0 14.3 4 76.0 10.2 6 0.164 0.849Organizing 81.4 14.6 1 79.2 14.6 2 80.1 10.5 4 0.157 0.855Leading 77.2 14.6 5 75.3 16.0 3 83.2 8.4 1 0.727 0.487Controlling 77.0 13.7 6 72.5 16.3 5 82.9 10.2 2 1.397 0.254Design efficiency 80.6 20.7 3 81.8 19.3 1 72.4 21.2 7 0.561 0.573Human resources 75.9 13.7 7 69.2 16.2 8 76.7 15.5 5 1.376 0.259Quality 75.1 17.1 8 72.1 19.6 6 71.7 12.1 8 0.264 0.769Sustainability 69.1 15.8 9 65.6 16.7 9 69.2 15.3 9 0.296 0.745Supply chain 63.1 17.9 10 51.6 16.9 10 69.1 16.3 10 3.367 0.040Safety 80.7 17.8 2 71.8 15.9 7 80.8 10.5 3 1.735 0.184
1174 S. Yun et al. / International Journal of Project Management 34 (2016) 1167–1182
Interestingly, leading shows the highest levels of effort inthe engineering phase in the infrastructure sector, while safetyis the highest in other industry sectors. This is probably due tothe fact that infrastructure projects are generally led by publicowners such as government agencies, and the owner'sleadership is stronger particularly in the engineering phasecompared to other industry sectors. Another interesting findingis that safety has the lowest standard deviation for theconstruction phase, which also had very high mean values in
all industry sectors. This implies that safety is a primary focusand that it is a consistently managed input in the constructionphase.
4.2. Industry sector assessment
The study conducted Analysis of Variance (ANOVA) teststo assess if the means of project management inputs aredifferent among industry sectors in each project phase, as

1175S. Yun et al. / International Journal of Project Management 34 (2016) 1167–1182
summarized in Table 3. The null hypothesis of the ANOVA testfor industry sector assessment is that industry norm of projectmanagement input is the same for all industry sectors. Thealternative hypothesis is that the industry norm is not the samefor all industry sectors. Post hoc comparisons were alsoconducted using the Tukey's HSD (honest significant differ-ence) test to determine which pair of industry sectors issignificantly different among combinations, as demonstrated inTable 4. Tukey's HSD test is a single-step multiple comparisonprocedure and statistical test that is performed in conjunctionwith ANOVA (post-hoc analysis) to detect a pairwisecomparison with means that are significantly different fromeach other at a 0.05 significance level. Prior to the analyses, thedataset of input measure scores was refined by removingoutliers. Then, the authors checked and verified the three basicassumptions: independence, normality, and homogeneity of thevariance of the residuals. The ANOVA and Tukey's HSD testswere conducted using IBM SPSS software.
Design efficiency was found to show significant difference byindustry sectors in the front end planning (F = 4.871; p = 0.009),engineering (F = 6.389; p = 0.002), and construction phase(F = 5.092; p = 0.007). As the results from the post hoccomparisons, the mean score of design efficiency for theindustrial sectors (M = 63.4, SD = 24.4) was found to besignificantly different and higher than that of infrastructure(M = 47.2, SD = 17.7) in the front end planning phase. In the
Table 4Post hoc comparison results using Tukey HSD test of significant input measures.
Project phase Input measure Industry sector(I)
Front end planning Organizing IndustrialIndustrialBuilding
Design efficiency IndustrialIndustrialBuilding
Human resources IndustrialIndustrialBuilding
Safety IndustrialIndustrialBuilding
Engineering Design efficiency IndustrialIndustrialBuilding
Quality IndustrialIndustrialBuilding
Construction Design efficiency IndustrialIndustrialBuilding
Supply chain IndustrialIndustrialBuilding
Safety IndustrialIndustrialBuilding
Startup Supply chain IndustrialIndustrialBuilding
engineering phase, the mean score for the industrial sector (M =67.8, SD = 15.7) was significantly different and higher than thebuilding (M = 59.1, SD = 14.4) and the infrastructure sectors(M = 56.6, SD = 23.1), respectively. In the construction phase,the mean score for infrastructure (M = 77.7, SD = 8.8) wassignificantly different and higher than the industrial (M = 65.1,SD = 15.9), and the building sectors (M = 67.1, SD = 10.8),respectively.
On the other hand, significant differences were found amongindustry sectors for safety between the front end planning (F =5.770; p = 0.004), and construction (F = 3.975; p = 0.020)phases. Post hoc test results show that that the mean score forthe industrial (M = 68.0, SD = 21.2) was significantly differentand higher than for the infrastructure (M = 51.4, SD = 13.6)sector in the front end planning phase. In the constructionphase, the mean score for the industrial sector (M = 83.9,SD = 9.7) was significantly different and higher than forinfrastructure (Mean = 77.3, SD = 8.5).
Interestingly, there is significant different among industrysectors for organizing (F = 3.776; p = 0.025), and humanresources (F = 6.705; p = 0.002) in the front end planning phase.However, post hoc comparisons show that the mean score for theindustrial sector (M = 71.9, SD = 13.4) was significantly differentand higher than for infrastructure (Mean = 61.9, SD = 11.1).However, no significant results were found for organizing on posthoc comparison at the 0.05 significant level.
Industry sector(J)
Mean diff.(I-J)
S.E. Sig.
Building 6.7 2.9 0.056Infrastructure 5.9 3.4 0.197Infrastructure −0.7 4.2 0.984Building 10.3 5.3 0.131Infrastructure 16.2 6.1 0.023Infrastructure 5.9 7.6 0.722Building 9.9 3.0 0.004Infrastructure 7.1 3.5 0.115Infrastructure −2.9 4.4 0.788Building 8.9 4.6 0.132Infrastructure 16.6 5.6 0.009Infrastructure 7.7 6.8 0.497Building 8.6 3.4 0.033Infrastructure 11.1 3.9 0.012Infrastructure 2.5 4.8 0.861Building 5.6 3.1 0.179Infrastructure 12.1 3.6 0.003Infrastructure 6.5 4.4 0.310Building −2.0 2.7 0.732Infrastructure −12.6 4.0 0.005Infrastructure −10.6 4.4 0.047Building −8.1 3.6 0.063Infrastructure −11.0 5.3 0.096Infrastructure −2.9 5.9 0.875Building 3.2 1.8 0.187Infrastructure 6.6 2.7 0.040Infrastructure 3.4 3.0 0.499Building 11.4 5.0 0.065Infrastructure −6.0 7.1 0.674Infrastructure −17.4 8.0 0.080

1176 S. Yun et al. / International Journal of Project Management 34 (2016) 1167–1182
In summary, most of the significant differences in projectmanagement inputs by industry sector were found to be inconstruction-specific functions. In addition, it was found thatthe infrastructure sector had lower and more inconsistent levelsof management efforts compared to the industrial and buildingsectors. It is possible that the construction-specific functions arenot fully matured, and thus this represents an opportunity wherethe infrastructure sector could improve capital project perfor-mance and create future competitive advantage.
5. Discussion of benchmarking applications of input measures
Project management inputs were measured according to thephase-based framework. These benchmarks were established todeliver early warning indicators and to provide proactive strategiesin order to improve organizational performance in each projectphase for subsequent phases and future projects. This paperpresents two potential applications for use of the input measuresform the benchmarking standpoint, as illustrated in Figs. 3 and 4.Specifically, the framework supports assessment of the inputmeasures at the phase-focused level, as well as the phase-widelevel.
Fig. 3 demonstrates a phase-specific distribution using the 10input measures in the industrial engineering phase using a radarchart, which is generally used for the control of qualityimprovement to display the performance metrics of an ongoing
Fig. 3. Phase-specific distribution of input m
program (Bamford, 2005). The distribution for the 10 inputmeasures shown in Fig. 3 depicts the four performance quartiles,and the mean across each phase. A higher value indicates betterperformance in these measures. The first quartile is composed of25% of the projects with the worst performance and the fourthquartile is populated with the 25% with best performance. Thesecond quartile indicates the median of the distribution. The dottedline indicates mean values of project management inputs in theindustrial engineering phase.
The phase-specific distribution of input measures enablesindustry practitioners to identify vulnerable project managementinputs in a given phase. The phase-focused assessment can beconducted to identify which project management input is higher orlower compared to industry norms. Fig. 3 shows that safetyreceived the greatest level of effort (Mean = 79.1) among projectmanagement inputs, while sustainability (Mean = 46.0) had theleast. The data also supports conclusions as to which projectmanagement inputs are less mature compared to others, because ofthe greater distribution of results. Fig. 3 shows that designefficiency and sustainability are probably less mature amongdifferent project organizations because the quartile ranges arebroader than other inputs.
Fig. 4 illustrates the distribution of organizing inputs foreach project phase in industrial projects. This distribution canbe used for phase-wide assessment of project managementinputs. Phase-wide assessment enables industry practitioners to
easures in industrial engineering phase.

Fig. 4. Phase-wide distribution of organizing input in industrial projects.
1177S. Yun et al. / International Journal of Project Management 34 (2016) 1167–1182
identify which project phase is vulnerable for a given inputmeasure and to determine proactive strategies to improveperformance in subsequent phases or the same phase in a futureproject. This type of assessment can utilize an input measure asan early warning indicator predicting performance in subse-quent phases.
For example, the phase-wide distribution of the organizinginput in Fig. 4 depicts four performance quartiles, and the meanvalue of each phase. Fig. 4 shows that the level of organizingefforts in industrial projects is worse in engineering andprocurement, and then improves during the construction phase.The mean value for organizing input is the lowest in theprocurement phase, while it is the highest in startup phase.
6. Conclusions
This paper presents a new approach to evaluate projectmanagement efforts made by a project team during capital projectdelivery. Using 794 phase-level data collected using theframework, this study assessed project management inputs byindustry sectors and project phases. The analyses revealed severalinteresting findings. First, the traditional business managementfunctions of planning, leading, organizing, and controlling tend tohave more consistent implementation compared to the newer andconstruction-specific management functions of sustainability anddesign efficiency. Second, when comparing the five phases, thestartup phase tends to have higher management efforts than the
others. This study is incapable of explaining and validating thisfinding and future research should further investigate it. Third,when comparing the three industry sectors, the study finds that theinfrastructure sector tends to exert the lowest and most inconsistentmanagement efforts. Assuming that the 10 input measuresinvestigated in this study have positive impacts on projectperformance, this sector has the most room to improve projectperformance.
This study's major contribution is CII's new benchmarkingframework. Although significant research efforts have been madeto identify project inputs presumably influencing capital projectperformance, no empirical evidence existed to quantitativelyevaluate how they operate in the construction industry. Further-more, there has been no systemic approach to application of theseproject management inputs to phase-based benchmarking in theevaluation of capital project performance.With the framework andcollected data, this study has provided a comparison of the inputsfor various project phases and industry sectors, and to the best ofthe authors' knowledge, this is the first study to do so in theconstruction industry.
This study also provides a solid basis for multiple futurestudies using the framework introduced in this study. Forexample, future research could focus on investigating relation-ships between project management inputs and project outcomessuch as cost and schedule performance. The correlationsbetween project inputs and outputs will be very useful forpractitioners to better understand which management functions

1178 S. Yun et al. / International Journal of Project Management 34 (2016) 1167–1182
to emphasize, to improve certain types of project performance.CII plans to use the benchmarking framework to link variousCII resources such as research products and implementationtools based on the linkage between leading indicators and inputmeasures. Industry practitioners will be able to benchmarkperformance while delivering the project and identify the inputmeasures to focus on. The 10-10 program will directly guidethem to the relevant CII knowledge to establish proactivestrategies for their ongoing projects.
Despite multiple contributions, this study has some limita-tions. Most of the project data submitted to date in the 10-10Program have come from industrial projects (75.6%). Additionaldata are necessary to evaluate project management efforts more
Leading indicators
Project planningAlignment of project execution plan with project objectivesBridging documents produced during programmingFront end planning processImplementation of project execution planPeer reviews during project planningPlan percent completeProject planning resourcesState-gate processClear definition of project objectives and prioritiesInternal stakeholders' involvementProject stakeholder alignmentProject team alignmentUnderstanding owner's goals and objectivesPPMOF evaluationModularizationOffsite fabricationPreassemblyPrefabrication
Design optimizationConstructability in engineering/designConstructability planInvolvement of construction manager during engineering/designPreconstruction service and constructability planEngineering/design deliverables' accuracyEngineering/design deliverables' timelinessInterim product database and standardized designsMultiple design office utilization
Procurement and material managementEffective site materials managementMaterial management planProcurement plan considering market conditionsProcurement plan addressing local content requirementsProcurement strategy and planProcurement on time, without damage, and per design specificationOn-time delivery of equipment and bulk materialsOn-time delivery of major equipmentAdjustment of procurement and vender schedulesSupplier quality surveillance programPreferred supplier selection
Appendix A. Linkage between leading indicators and project m
reliably for building and infrastructure projects. As dataaccumulates, it will be possible to generate more comparisonsby industry sector and project phase. More data will enable toconduct more rigorous statistical approaches such as factoranalysis to re-investigate the linkage between input measures andleading indicators. An enriched data set will provide a solidfoundation for diagnosing and investigating project managementefforts at a more detailed level than was possible in this study. Inaddition, the project data might have hierarchical nature since thedata are probably collected from some branches, within branchesof companies, and within the companies. Therefore, furtheranalysis will be conducted to examine project management inputsusing the hierarchical design.
Project management inputs
PN LD OG CT DE HR QL SA SC SF
XX XX XX X X X
X XX X X X X X XX X X XX XX X XX X X X X X X X X
X X X X XX XX X XX X X X X X X X X XX X X X X X XX X X X X X XX X X X X X XX X X X X X X
X X X XX X XX XX X X X
X X XX X X
X X X XX X X
X X X X XX X
X X X XX X X XX X X X X
X X XX XX X
X X X XX X X X
X X X X
anagement inputs

(continued)
Project management inputs
Leading indicators PN LD OG CT DE HR QL SA SC SF
ConstructionEffectiveness of work planning and scheduling XWork packaging X X X X X X XWorkface planning/last planner X X X X X X X
Facility startup and operationImplementation of startup/commissioning plan X X X XIncorporation of startup/commissioning plan with operations and maintenance philosophy X X XIntegration of construction with operation XIntegration of turnaround with project X X XPre-task planning in startup/commissioning X X XStartup/commissioning processes and systems X XStartup/commissioning process X
Human resource managementOngoing craft training programs X X X X X X XProfessional work training XProject manager's decision quality XProject team's competency X X XAdequate craft labor's availability and competency X X X XExtensive Labor disruption X X XForeman to craft ratio X X XSubcontractors' craft worker availability X X X
Project organization and managementClear roles and responsibility of project team members X X X XEffective communication among project stakeholders X XEffective communication of startup/commissioning objectives X XOpen and effective communication among project team members X XProject meeting effectiveness X XProject team member's authority X XStartup/commissioning team member's authority X XTrust, respect and transparency among project participants X XEffective team integration X XLongstanding partnering arrangement between owner and primary contractor X X X XSubcontractor prequalification X X X X X X XAdequate staffing of project management team X XInvolvement of owner's project manager in front end planning X X XInvolvement of construction manager X X X X XInvolvement of cost engineer X X XInvolvement of engineering manager/architect X X X X XInvolvement of lead scheduler X XNumber and quality of engineering/design personnel X XOriginal primary contractor's continuity XOwner's level of involvement X X X XTeam member turnover X X X XWorking relationship between owner and contractor X X X XLeadership commitment to worker's compensation X XLeadership's effective communication XManagement team leaders' open mindedness XInterface management between project stakeholders X XAppropriate resource allocation X X X
Business and project processesCompletion of punch list items on time and cost X XCost of quality consideration XCustomer's satisfaction XMeeting startup/commissioning quality X X X XQuality management system X XEffective problem solving mechanism X XChange management process XChange of major project objectives X X X X XProactive change management process XType of changes occurred X X
(continued on next page)
Appendix A (continued)
1179S. Yun et al. / International Journal of Project Management 34 (2016) 1167–1182

(continued)
Project management inputs
Leading indicators PN LD OG CT DE HR QL SA SC SF
Project controlAppropriate contingency establishment X XProject cash flow management XProject control system XWork process and system X X X X X
Risk managementAppropriate risk allocation X X X X XProject team involvement in risk assessment process X X XRisk assessment process in project planning X X X X
Safety, health, and environmentDaily safety toolbox meetings XEffective communication of safety objectives XEffective safety training and orientation X XInvestigation of safety accident including near misses XRegular safety audit or observations XSafety management procedures X X XSafety personnel to worker ratio X X XStartup/commissioning-specific safety plan X XSubstance abuse testing X X X X X X XCommunity relation issues X X XCooperation and coordination among external stakeholders X X X X X X X X XEnvironmental impact assessment X X X X XInitial site or facility condition verification X X X X X X XLand and right-of-way acquisition in timely manner X X X X X X X XLEED certification XLife cycle cost analysis and considerations X X XNational, regional, and local compliance requirements X X X X X X X X XRegulatory requirement, permitting, and environmental issues X X X X X X XSustainability consideration X X
Information Management and TechnologyInformation accessibility X X XBuilding information model use X X
Note: PL: Planning; LD: Leading; OG: Organizing; CT: Controlling; DE: Design efficiency; HR: Human resources; QL: Quality; SA: Sustainability; SC: SupplyChain; SF: Safety.
Appendix A (continued)
1180 S. Yun et al. / International Journal of Project Management 34 (2016) 1167–1182
References
Almahmoud, E.S., Doloi, H.K., Panuwatwanich, K., 2012. Linking project healthto project performance indicators: multiple case studies of constructionprojects in Saudi Arabia. Int. J. Proj. Manag. 30, 296–307. http://dx.doi.org/10.1016/j.ijproman.2011.07.001.
Amaratunga, D., Sarshar, M., Baldry, D., 2002. Process improvement infacilities management: the SPICE approach. Bus. Process. Manag. J. 8,318–337. http://dx.doi.org/10.1108/14637150210434982.
Ankrah, N.A., Proverbs, D., Debrah, Y., 2009. Factors influencing the cultureof a construction project organisation. Eng. Constr. Archit. Manag. 16,26–47. http://dx.doi.org/10.1108/09699980910927877.
Arditi, D., Gunaydin, H.M., 1997. Total quality management in the constructionprocess. Int. J. Proj. Manag. 15, 235–243. http://dx.doi.org/10.1016/S0263-7863(96)00076-2.
Ballard, G., Howell, G., 1998. What Kind of Production Is Construction. Proc.6 Th Annual Conf. Int'l. Group for Lean Construction. Presented at the 6thAnnual Conf. Int'l. Group for Lean Construction, pp. 13–15.
Bamford, J., 2005. Implementing quality: a practical guide to tools andtechniques. Int. J. Oper. Prod. Manag. 25, 1034. http://dx.doi.org/10.1108/01443570510619518.
Beatham, S., Anumba, C., Thorpe, T., Hedges, I., 2004. KPIs: a criticalappraisal of their use in construction. Benchmark. Int. J. 11, 93–117. http://dx.doi.org/10.1108/14635770410520320.
Belout, A., 1998. Effects of human resource management on project effectivenessand success: toward a new conceptual framework. Int. J. Proj. Manag. 16,21–26. http://dx.doi.org/10.1016/S0263-7863(97)00011-2.
Belout, A., Gauvreau, C., 2004. Factors influencing project success: the impactof human resource management. Int. J. Proj. Manag. 22, 1–11. http://dx.doi.org/10.1016/S0263-7863(03)00003-6.
Briscoe, G., Dainty, A., 2005. Construction supply chain integration: an elusivegoal? Supply Chain Manag Int. J. 10, 319–326. http://dx.doi.org/10.1108/13598540510612794.
Chan, A.P.C., Chan, A.P.L., 2004. Key performance indicators for measuringconstruction success. Benchmark. Int. J. 11, 203–221. http://dx.doi.org/10.1108/14635770410532624.
Choi, J., Anderson, S.D., Kim, S.J.T., 2006. Forecasting Potential Risksthrough Leading Indicators to Project Outcome (Research Report No. 220-11). Construction Industry Institute, Austin, Texas.
Choi, J., Yun, S., Mulva, S.P., Oliveira, D., Kang, Y., 2015. A Multi-PerspectiveAssessment Method for Measuring Leading Indicators in Capital ProjectBenchmarking. Proceedings of ICSC15. Presented at the C. ICSC15 – TheCanadian Society for Civil Engineering's 5th International/11th ConstructionSpecialty Conference http://dx.doi.org/10.14288/1.0076367.
Chong, W.K., Kumar, S., Haas, C.T., Beheiry, S.M., Coplen, L., Oey, M., 2009.Understanding and interpreting baseline perceptions of sustainability inconstruction among civil engineers in the United States. J. Manag. Eng. 25,143–154. http://dx.doi.org/10.1061/(ASCE)0742-597X(2009)25:3(143).

1181S. Yun et al. / International Journal of Project Management 34 (2016) 1167–1182
Chua, D., Kog, Y., Loh, P., 1999. Critical success factors for different projectobjectives. J. Constr. Eng. Manag. 125, 142–150. http://dx.doi.org/10.1061/(ASCE)0733-9364(1999)125:3(142).
Cook, E.L., Hancher, D.E., 1990. Partnering: contracting for the future. J. Manag.Eng. 6, 431–446. http://dx.doi.org/10.1061/(ASCE)9742-597X(1990)6:4(431).
Costa, D., Formoso, C., Kagioglou, M., Alarcón, L., Caldas, C., 2006.Benchmarking initiatives in the construction industry: lessons learned andimprovement opportunities. J. Manag. Eng. 22, 158–167. http://dx.doi.org/10.1061/(ASCE)0742-597X(2006)22:4(158).
Cox, R.F., Issa, R.R.A., Ahrens, D., 2003. Management's perception of keyperformance indicators for construction. J. Constr. Eng. Manag. 129,142–151. http://dx.doi.org/10.1061/(ASCE)0733-9364(2003)129:2(142).
Dainty, A.R.J., Cheng, M.-I., Moore, D.R., 2003. Redefining performance measuresfor construction project managers: an empirical evaluation. Constr.Manag. Econ.21, 209–218. http://dx.doi.org/10.1080/0144619032000049737.
Dukerich, J.M., Ammeter, A.P., 1998. Identifying Success Factors for HighPerformance Work Teams (Research Report No. 134-11). ConstructionIndustry Institute, Austin, TX.
Dumont, P.R., Gibson Jr., G.E., Fish, J.R., 1997. Scope management usingproject definition rating index. J. Manag. Eng. 13, 54–60. http://dx.doi.org/10.1061/(ASCE)0742-597X(1997)13:5(54).
Fernández-Sánchez, G., Rodríguez-López, F., 2010. A methodology to identifysustainability indicators in construction project management—applicationto infrastructure projects in Spain. Ecol. Indic. 10, 1193–1201. http://dx.doi.org/10.1016/j.ecolind.2010.04.009.
Gibson, G.E., Wang, Y.-R., Cho, C.-S., Pappas, M.P., 2006. What is preprojectplanning, anyway? J. Manag. Eng. 22, 35–42. http://dx.doi.org/10.1061/(ASCE)0742-597X(2006)22:1(35).
Gosling, J., Naim, M., Towill, D., 2013. Identifying and categorizing thesources of uncertainty in construction supply chains. J. Constr. Eng. Manag.139, 102–110. http://dx.doi.org/10.1061/(ASCE)CO.1943-7862.0000574.
Hastak, M., Halpin, D.W., Vanegas, J., 1996. COMPASS—new paradigm forproject cost control strategy and planning. J. Constr. Eng. Manag. 122,254–264. http://dx.doi.org/10.1061/(ASCE)0733-9364(1996)122:3(254).
Hinze, J., Hallowel, M., 2013. Going Beyond Zero Using Safety LeadingIndicators (Research Report No. 284-11). Construction Industry Institute,Austin, TX.
Hinze, J., Thurman, S., Wehle, A., 2013. Leading indicators of constructionsafety performance. Saf. Sci. 51, 23–28. http://dx.doi.org/10.1016/j.ssci.2012.05.016.
Hoonakker, P., Carayon, P., Loushine, T., 2010. Barriers and benefits of qualitymanagement in the construction industry: an empirical study. Total Qual.Manag. Bus. Excell. 21, 953–969. http://dx.doi.org/10.1080/14783363.2010.487673.
Hopkins, A., 2009. Thinking about process safety indicators. Saf. Sci. 47,460–465. http://dx.doi.org/10.1016/j.ssci.2007.12.006.
Hughes, S.W., Tippett, D.D., Thomas, W.K., 2004. Measuring project successin the construction industry. Eng. Manag. J. 16, 31–37. http://dx.doi.org/10.1080/10429247.2004.11415255.
Hwang, B., Lim, E., 2012. Critical success factors for key project players andobjectives: case study of Singapore. J. Constr. Eng. Manag. 139, 204–215.http://dx.doi.org/10.1061/(ASCE)CO.1943-7862.0000597.
Jaafari, A., 2007. Project and program diagnostics: a systemic approach. Int.J. Proj. Manag. 25, 781–790. http://dx.doi.org/10.1016/j.ijproman.2007.05.008.
Janz, B.D., 1999. Self-directed teams in IS: correlates for improved systemsdevelopment work outcomes. Inf. Manag. 35, 171–192. http://dx.doi.org/10.1016/S0378-7206(98)00088-3.
Jaselskis, E.J., Anderson, S.D., Russel, J.S., 1996. Strategies for achievingexcellence in construction safety performance. J. Constr. Eng. Manag. 122,61–70. http://dx.doi.org/10.1061/(ASCE)0733-9364(1996)122:1(61).
Kang, Y., Kim, C., Son, H., Lee, S., Limsawasd, C., 2013. Comparison ofpreproject planning for green and conventional buildings. J. Constr. Eng.Manag. 139, 04013018. http://dx.doi.org/10.1061/(ASCE)CO.1943-7862.0000760.
Kang, Y., Dai, J., Mulva, S., Choi, J., 2014. The 10-10 PerformanceAssessment Campaign: New Theories Regarding the Benchmarking of
Capital Project Performance. Construction Research Congress 2014@sConstruction in a Global Network. ASCE, 2344, p. 2335.
Kats, G., Alevantis, L., Berman, A., Mills, E., Perlman, J., 2003. The Costs andFinancial Benefits of Green Buildings. Rep. California's Sustain. Build.Task Force USA.
Kraft, E., Chinowsky, P.S., 2003. The effect of construction organizationmanagement practices on project success. Bridges 10, 69.
Lack, R.W., 2002. Modern management principles and their application tosafety and health. Saf. Health Asset Prot. Manag. Essent.
Lee, S.-H., Thomas, S.P., Tucker, R.L., 2005. Web-based benchmarking systemfor the construction industry. J. Constr. Eng. Manag. 131, 790–798. http://dx.doi.org/10.1061/(ASCE)0733-9364(2005)131:7(790).
Loosemore, M., Dainty, A., Lingard, H., 2003. Human Resource Managementin Construction Projects: Strategic and Operational Approaches. SponPress, London ; New York.
McCabe, S., 2008. Benchmarking in Construction. John Wiley & Sons.Muckler, F.A., Seven, S.A., 1992. Selecting performance measures: “objective”
versus “subjective” measurement. Hum. Factors J. Hum. Factors Ergon.Soc. 34, 441–455. http://dx.doi.org/10.1177/001872089203400406.
Nahapiet, H., Nahapiet, J., 1985. The Management of Construction Projects:Case Studies from the USA and UK. Chartered Institute of Building.
Nalewaik, A., Venters, V., 2008. Costs and benefits of building green. AACEInt. Trans. DE21.
Neuman, Y., Alves, T.d.C.L., Walsh, K.D., Needy, K.L., 2015. Quantitativeanalysis of supplier quality surveillance practices in EPC projects. J. Constr.Eng. Manag. 141, 04015039. http://dx.doi.org/10.1061/(ASCE)CO.1943-7862.0001023.
Nwachukwu, G.O.C., 1996. Management leadership: the key to effectiveproject management (EPM) functions in the Nigerian construction industry.Quant. Surv. 23, 18–24.
O'Connor, J.T., Singh, I.P., 2009. Maximize Engineering Value (ResearchReport No. 245-11). Construction Industry Insititute, Austin, Texas.
O'Connor, J.T., O'Brien, W.J., Jarrah, R.T., Wallner, B., 2007. Planning,Facilitating, and Evaluating Design Effectiveness (Research Report No.233-11). Construction Industry Insititute, Austin, TX.
Ochieng, E.G., Price, A.D., 2009. Framework for managing multiculturalproject teams. Eng. Constr. Archit. Manag. 16, 527–543. http://dx.doi.org/10.1108/09699980911002557.
Olawale, Y.A., Sun, M., 2010. Cost and time control of construction projects:inhibiting factors and mitigating measures in practice. Constr. Manag. Econ.28, 509–526. http://dx.doi.org/10.1080/01446191003674519.
Olomolaiye, P.O., 1990. An evaluation of the relationships between bricklayers'motivation and productivity. Constr. Manag. Econ. 8, 301.
Parfitt, M.K., Sanvido, V.E., 1993. Checklist of critical success factors forbuilding projects. J. Manag. Eng. 9, 243–249. http://dx.doi.org/10.1061/(ASCE)9742-597X(1993)9:3(243).
Pinto, J.K., Slevin, D.P., 1987. Critical factors in successful projectimplementation. IEEE Trans. Eng. Manag. EM-34, 22–27. http://dx.doi.org/10.1109/TEM.1987.6498856.
Ramirez, R.R., Alarcon, L.F.C., Knights, P., 2004. Benchmarking system forevaluating management practices in the construction industry. J. Manag.Eng. 20.
Rothstein, J.M., 1989. On defining subjective and objective measurements.Phys. Ther. 69, 577–579.
Sarshar, M., Haigh, R., Amaratunga, D., 2004. Improving project processes:best practice case study. Constr. Innov. 4, 69–82. http://dx.doi.org/10.1108/14714170410815015.
Smith, A.D., Offodile, O.F., 2008. Strategic importance of team integrationissues in product development processes to improve manufacturability.Team Perform. Manag. Int. J. 14, 269–292. http://dx.doi.org/10.1108/13527590810898527.
Tabassi, A.A., Ramli, M., Bakar, A.H.A., 2012. Effects of training andmotivation practices on teamwork improvement and task efficiency: thecase of construction firms. Int. J. Proj. Manag. 30, 213–224. http://dx.doi.org/10.1016/j.ijproman.2011.05.009.
Thamhain, H.J., 2004. Linkages of project environment to performance: lessonsfor team leadership. Int. J. Proj. Manag. 22, 533–544. http://dx.doi.org/10.1016/j.ijproman.2004.04.005.

1182 S. Yun et al. / International Journal of Project Management 34 (2016) 1167–1182
Ugwu, O.O., Haupt, T.C., 2007. Key performance indicators and assessmentmethods for infrastructure sustainability—a South African constructionindustry perspective. Build. Environ. 42, 665–680. http://dx.doi.org/10.1016/j.buildenv.2005.10.018.
Yeung, J.F.Y., Chan, A.P.C., Chan, D.W.M., 2009. A computerized model formeasuring and benchmarking the partnering performance of constructionprojects. Autom. Constr. 18, 1099–1113. http://dx.doi.org/10.1016/j.autcon.2009.07.003.
Yeung, J.F.Y., Chan, A.P.C., Chan, D.W.M., Chiang, Y.H., Yang, H., 2013.Developing a benchmarking model for construction projects in Hong Kong.J. Constr. Eng. Manag. 139, 705–716. http://dx.doi.org/10.1061/(ASCE)CO.1943-7862.0000622.
Yun, S., O'Brien, W.J., Mulva, S.P., 2012a. A Quantitative Approach forMeasuring Managerial Interfaces in the Development of a Capital Project.Construction Research Congress 2012. American Society of CivilEngineers, pp. 1410–1419.
Yun, S., Suk, S.-J., Dai, J., Mulva, S.P., 2012b. Quantification of Front EndPlanning Input Parameters in Capital Projects. Construction ResearchCongress 2012. American Society of Civil Engineers, pp. 2499–2509.
Yun, S., Choi, J., de Oliveira, D.P., Mulva, S.P., 2016. Development ofperformancemetrics for phase-based capital project benchmarking. Int. J. Proj.Manag. 34, 389–402. http://dx.doi.org/10.1016/j.ijproman.2015.12.004.
Zwikael, O., 2009. Critical planning processes in construction projects. Constr.Innov. 9, 372–387.