Measuring MOSFET properties - Gary Tuttle's ISU web...
20
EE 230 MOSFETs – 1 Measuring MOSFET properties First, we might like to see a set of i D -v DS curves, using v GS as a parameter. This gives a nice “text-book” view of the MOSFET characteristics, but is not helpful for extracting the device parameters. To obtain device parameters, we need to isolate certain aspects of the device behavior in order to easily extract the parameters that might be used in a SPICE model for the MOSFET. One type of measurement that helps in extracting parameters is the plot. 0 1 2 3 4 5 0 1 2 3 4 5 6 7 8 I D (mA) V DS (V) V GS = 4 V V GS = 5 V V GS = 3 V 0 0.5 1 1.5 2 2.5 0 1 2 3 4 5 6 (I D ) 1/2 (mA) V GS (V) NMOS off NMOS in saturation K 1/2 V T i D - v GS
Transcript of Measuring MOSFET properties - Gary Tuttle's ISU web...

EE 230 MOSFETs – 1
Measuring MOSFET propertiesFirst, we might like to see a set of iD-vDS curves, using vGS as a parameter. This gives a nice “text-book” view of the MOSFET characteristics, but is not helpful for extracting the device parameters.
To obtain device parameters, we need to isolate certain aspects of the device behavior in order to easily extract the parameters that might be used in a SPICE model for the MOSFET. One type of measurement that helps in extracting parameters is the plot.
0
1
2
3
4
5
0 1 2 3 4 5 6 7 8
I D (m
A)
VDS
(V)
VGS
= 4 V
VGS
= 5 V
VGS
= 3 V
0
0.5
1
1.5
2
2.5
0 1 2 3 4 5 6
(I D)1/
2 (mA)
VGS
(V)
NMOS off
NMOS insaturation
K1/2
VT
�iD � vGS

EE 230 MOSFETs – 2
Family of iD – vDS curves.This measurement is conceptually very simple. First set the gate voltage to some value, which sets source-end concentration of the inversion layer. Then sweep through a range of drain voltages, measuring the current at each. Then set a new gate voltage and sweep the drain voltages again. Repeat for as many different gate voltages as desired.
This is easily done with the B1500A semiconductor analyzer. In fact, it is one of the standard, built-in set-ups.
VGS
VDS
ammeter
+–
+–
iD
sweep 2
sweep 1

EE 230 MOSFETs – 3
iD – vDS measurementIf the analyzer is off, power it up, and, once it is booted, launch the EasyEXPERT software.
Choose the discrete category and then choose the specific “FET Id-Vd” set up.

EE 230 MOSFETs – 4
iD – vDS measurement - NMOSThe next page shows the basic measurement set up: SMU1 is the drain, SMU2 is the source, and SMU3 is the gate. We are assuming an n-channel transistor as indicated by the polarity setting, so all voltages will be positive. Set the drain and gate voltage as desired. (The values shown below are a reasonable starting point.)

EE 230 MOSFETs – 5
iD – vDS measurement - NMOSConnect the transistor to the SMUs. In this case, we are measuring the body-connected NMOS from the CD4007 MOS array. Drain: pin 8 to SMU 1. Source: pin 7 to SMU 2. Gate: pin 6 to SMU 3. (Check the date sheet.)

EE 230 MOSFETs – 6
iD – vDS measurement - NMOSHit the run button, and the analyzer should run through the measurement and make a plot. Click the “Autoscale” icon to scale the plot to a nice size. Save the data in whatever form you like - an image of the plot or csv data to plotted in Excel. (Explained in the diode tutorial.)

EE 230 MOSFETs – 7
iD – vDS measurement - PMOSA PMOS measurement is just as easy. The only change that is required is to switch the polarity to “Pch". The analyzer then knows that all of the voltages should be negative. So unless you need a different range for the gate and drain voltages, you can leave everything else the same.
change this

EE 230 MOSFETs – 8
iD – vDS measurement - PMOSOf course, you must connect the PMOS to the SMUs. In this case, we are measuring the body-connected PMOS from the CD4007 MOS array. Drain: pin 13 to SMU 1. Source: pin 14 to SMU 2. Gate: pin 6 to SMU 3.
EE 230 MOSFETs – 9
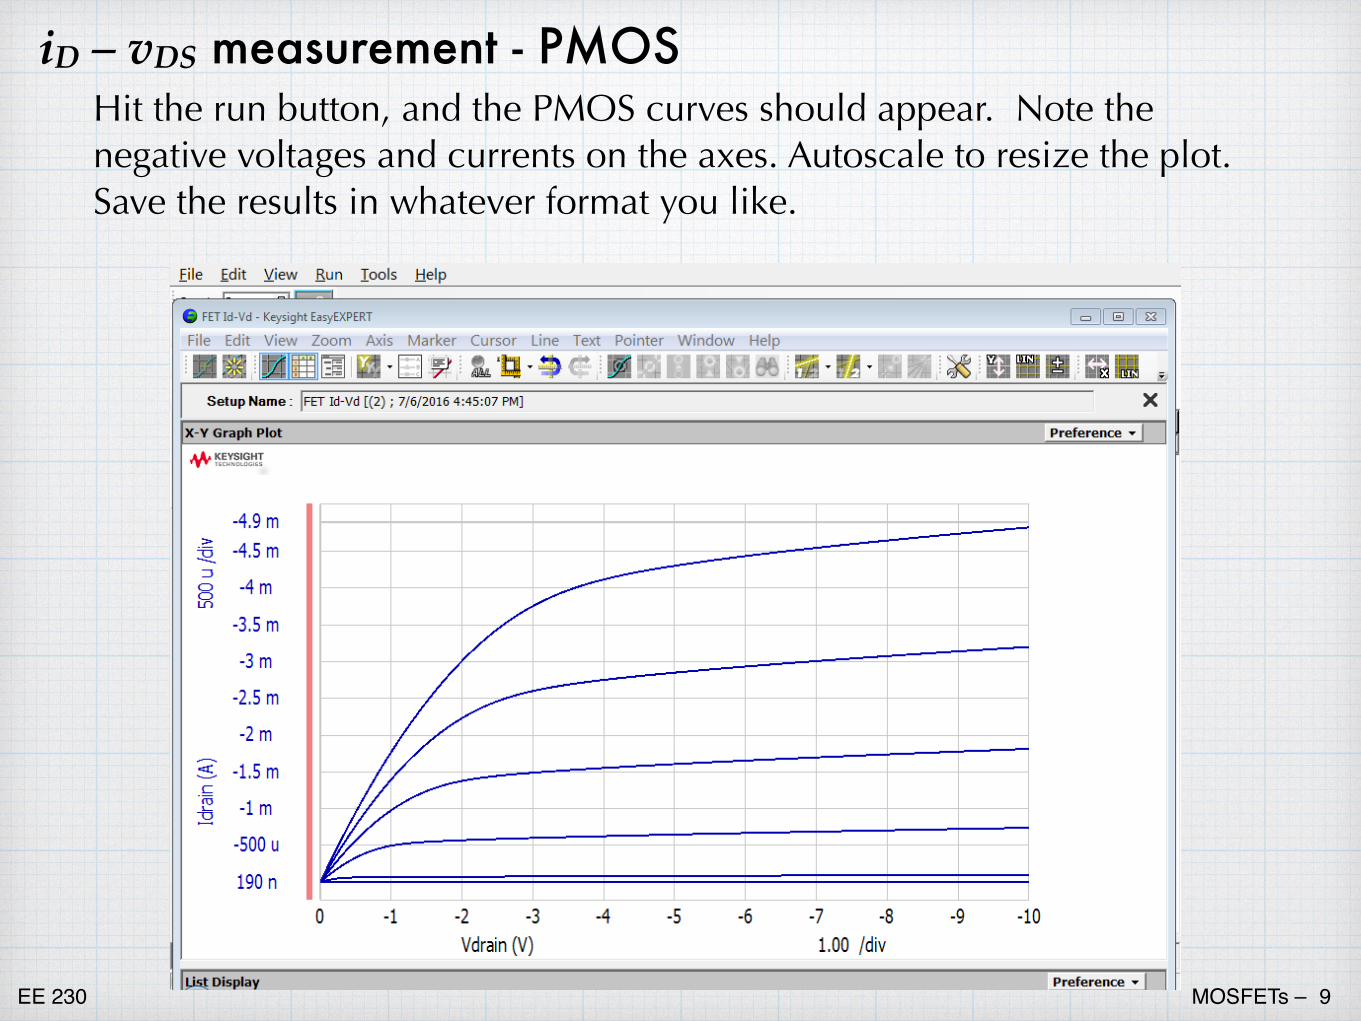
iD – vDS measurement - PMOSHit the run button, and the PMOS curves should appear. Note the negative voltages and currents on the axes. Autoscale to resize the plot. Save the results in whatever format you like.

EE 230 MOSFETs – 10
iD – vGS measurement - NMOSTo obtain the curve needed to extract VT and K, we use the same basic measurement set up, with some slight modifications. First, we fix the value of VDS at a value that will guarantee that the MOS is in saturation. Then we sweep the gate voltage while measuring the drain current.
VGS
VDS
ammeter
+–
+–
iD
sweep 1
fixed
To make sure that then MOS stays in saturation, the fixed value of VDS should bigger than (or at least equal to) any value of VGS in the sweep. So setting VDS equal to the maximum of VGS should work nicely.

EE 230 MOSFETs – 11
0
1
2
3
4
5
0 1 2 3 4 5 6
I D (mA)
VGS
(V)
NMOS off
NMOS insaturation
0
0.5
1
1.5
2
2.5
0 1 2 3 4 5 6
(I D)1/
2 (mA)
VGS
(V)
NMOS off
NMOS insaturation
K1/2
VT
iD – vGS measurement - NMOSThe basic sweep will give a plot of iD versus vGS. To extract the parameters easily, we prefer to use the square-root of the current.
iD = K (vGS � VT)2 �
iD =�K (vGS � VT)
The analyzer will do all of this, but there is no pre-programmed set up. So we will need “roll our own”, which is still easy to do. In the process, we will learn how to build our own measurement set ups.

EE 230 MOSFETs – 12
iD – vGS measurement - NMOSTo get started, go back do the measurement set up screen. Select the “Classic Test” tab on the left and then choose “I-V Sweep” option.

EE 230 MOSFETs – 13
Start with the “Channel” tab along top of the window. Here, we set up the function of the SMUs. The four SMUs are listed. You can give names to the voltage and current for each. You can also specify the mode of each (voltage source, current source, or common). Finally, you can specify if it will be changing (variable) or constant.

EE 230 MOSFETs – 14
Set up the SMUs as shown below. SMU1 is the drain connection. It will be a voltage source (measuring current) and will have constant value. SMU2 is the MOS source and will serve as ground (common). SMU3 is the gate connection. It will be a swept voltage source, and so it will have the VAR1 function.
EE 230 MOSFETs – 15
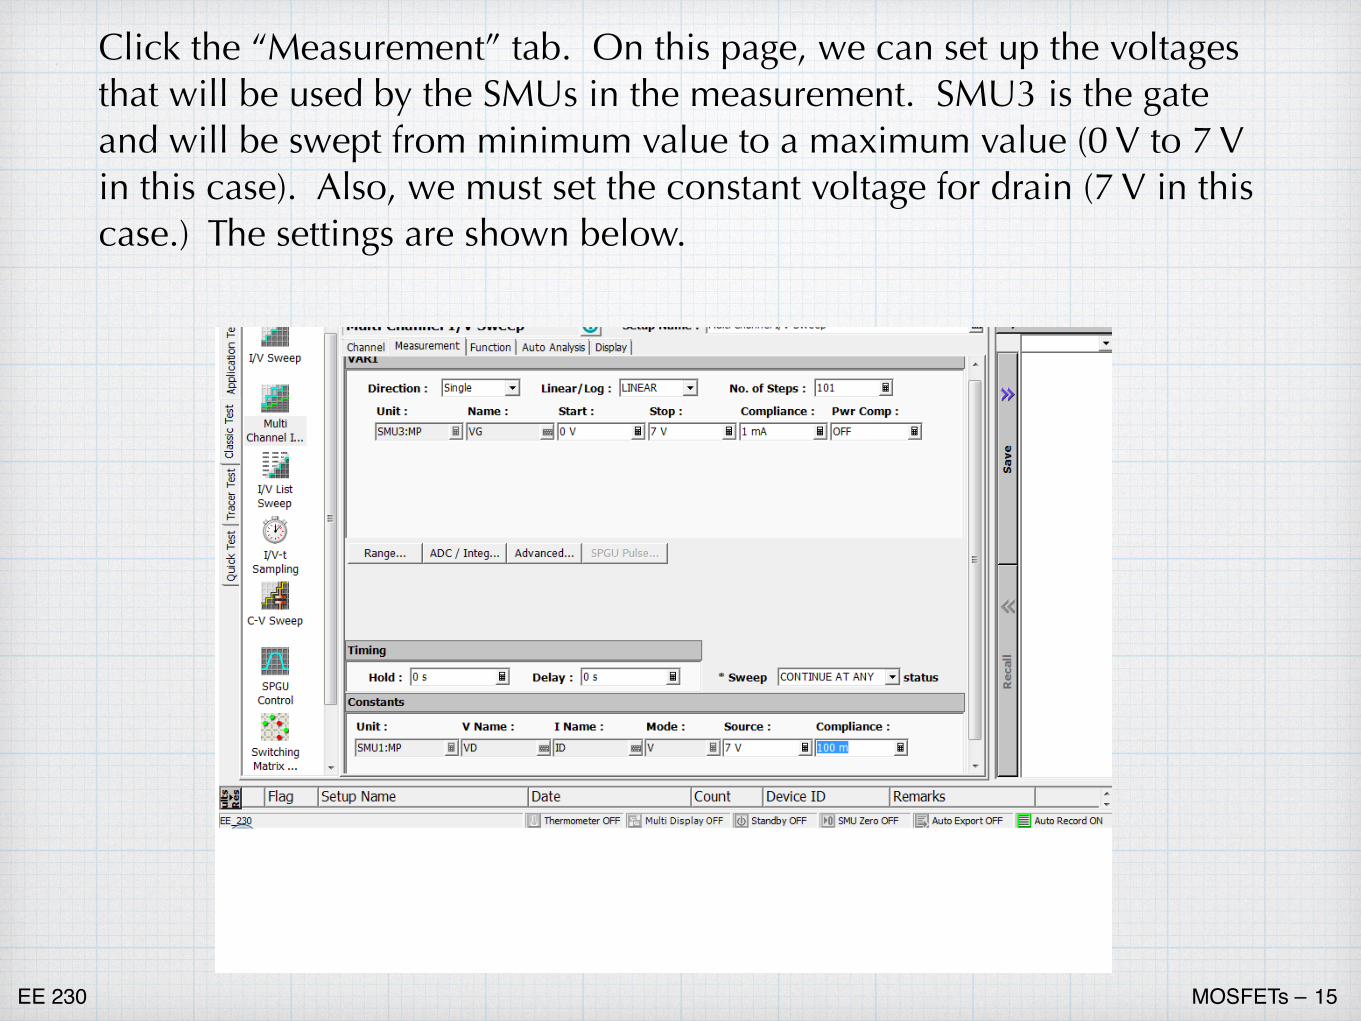
Click the “Measurement” tab. On this page, we can set up the voltages that will be used by the SMUs in the measurement. SMU3 is the gate and will be swept from minimum value to a maximum value (0 V to 7 V in this case). Also, we must set the constant voltage for drain (7 V in this case.) The settings are shown below.

EE 230 MOSFETs – 16
Click the “Function” tab. On this page, we can define a non-standard function that can be used in a plot. We want to use the square-root of ID for the y-axis, so define that here. Give the function a name. (The specific name is not important.) The units are also not important, but you can enter something if you want. The most important thing is the definition. Type in sqrt(ID). Note that the variable you enter here must match the name you gave the drain current previously on the channel page.

EE 230 MOSFETs – 17
Almost there. Finally, click the “Display” tab to get the page where the plot can be defined. The x-axis should be gate voltage, so enter that, along with the limits used in the set up ( 0V to 7V). The y-axis will be the square-root function that we defined earlier. Click “Add” to add an axis. Choose the “Y1” option, and then select the previously defined function. the limits are not important, since we don’t know what values the measurement will produce. (We can always autoscale after the fact.)

EE 230 MOSFETs – 18
Now that everything is set up for the measurement, we can connect the actual device. (The connections are the same as for the iD-vDS measurements done earlier. See slide 5.) Then click the “Run” button. If all is set up properly, you should get a plot of the square-root function versus the swept gate voltage. Click the “Autoscale” icon and you might see something like the graph below.

EE 230 MOSFETs – 19
The first thing we note is that the curve is not ideal. There is not a sharp kink at the threshold voltage – the transition is somewhat gradual. Also the “on” curve is not a perfect line. (Devices are not ideal!)
We could just “eyeball” the threshold transition and the slope. However, the analyzer has some tools to help us be more quantitative. First turn on the marker and move it to point on the curve above the threshold, as shown below.
marker
EE 230 MOSFETs – 20
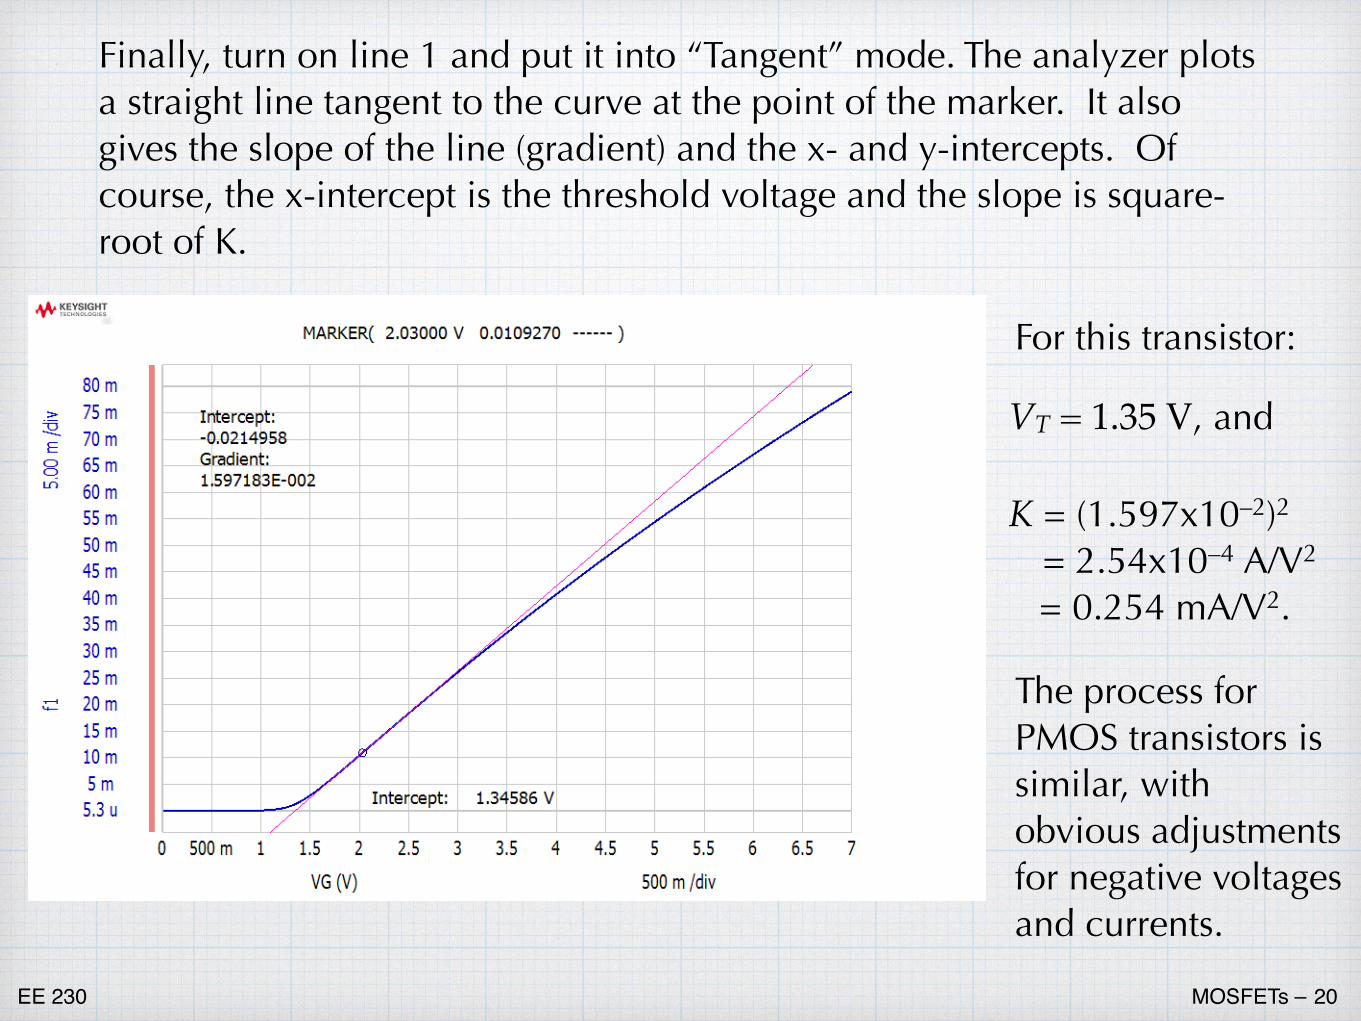
Finally, turn on line 1 and put it into “Tangent” mode. The analyzer plots a straight line tangent to the curve at the point of the marker. It also gives the slope of the line (gradient) and the x- and y-intercepts. Of course, the x-intercept is the threshold voltage and the slope is square-root of K.
For this transistor:
VT = 1.35 V, and
K = (1.597x10⁻²)2
= 2.54x10⁻⁴ A/V2 = 0.254 mA/V2.
The process for PMOS transistors is similar, with obvious adjustments for negative voltages and currents.