MEASURING FINANCIAL PERFORMANCE IN...
75
MEASURING FINANCIAL PERFORMANCE IN INFRASTRUCTURE June 2006 Infrastructure Department Europe and Central Asia Region
Transcript of MEASURING FINANCIAL PERFORMANCE IN...

MEASURING FINANCIAL PERFORMANCE IN
INFRASTRUCTURE
June 2006 Infrastructure Department Europe and Central Asia Region

Abbreviations and Acronyms % Percent ACRP Average cost-recovery price Bank The World Bank Group CEE Central and Eastern Europe CIS Commonwealth of Independent States Cu.m Cubic meter ECA Europe and Central Asia (Region), The World Bank Group ECSIE Infrastructure Unit, ECA Region, The World Bank Group EU European Union FSU Former Soviet Union FSU-LI FSU low income countries FSU-MI FSU middle income countries FY Fiscal Year GDP Gross Domestic Product GWh Giga Watt hours IAP Infrastructure Action Plan IMF International Monetary Fund INFVP Infrastructure Vice Presidency, The World Bank Group IRF International Road Federation IRTAD International Road Traffic and Accident Database km Kilometers kWh Kilo watt hours lpcd Liters per capita per day m3 Cubic meters MDG Millennium Development Goals mcm Thousand cubic meters Mcm Million cubic meters MWh Mega watt hours n.a. Not available O&M Operations and maintenance OECD Organization for Economic Cooperation and Development PSO Public Service Obligation Contracts REDI Recent Economic Developments in Infrastructure SEE South East Europe TU Traffic unit TUDTR Transport and Urban Development Department, The World Bank Group UIC International Union of Railways UK United Kingdom US$ United States dollars USc United States cents USSR Union of Soviet Socialist Republics Veh. Vehicle WAET Weighted Average End-user Tariff

ACKNOWLEDGEMENTS This report has been based on information from a variety of sources including publicly available information and information available to the World Bank as a result of studies commissioned by the Bank, undertaken by Bank staff or otherwise provided to the Bank. The World Bank has used the most up to date data available in preparing this report. This report was prepared by a team from the Infrastructure Department of the Europe and Central Asia Region of the World Bank under the guidance and supervision of Lee Travers (Sector Manager, ECSIE). Task team members comprised: Jane Ebinger, Alexander Danilenko, Maka Lomaia, Subramaniam Janakiram, Soumya Chattopadhyay, Sanjay Sinha, Cem Alkan, Alfiya Mirzagalyamova, Josephine Kida, Bonita Brindley, and Larisa Marquez. This report benefited from review, comments and input from: Paul Amos, Michel Audige, Alex Bakalian, Ani Balabanyan, Cecilia Briceno-Garmendia, Bojan Borojevic, Jean-Charles Crochet, Mark Davis, Istvan Dobozi, Anca Dumitrescu, Ben Eijbergen, Lev Freinkman, Katherina Gassner, Sandu Ghidirim, Ellen Hamilton, Richard Hamilton, Marat Iskakov, Serdar Japbarov, Peter Johansen, Peter Kelly, David Kennedy, Henri Kerali, Iftikhar Khalil, Anupam Khanna, Sunja Kim, Elena Klochan, Martha Lawrence, Astrid Manroth, Farid Mamedov, Joseph Melitauri, Yuri Miroshnichenko, Celestin Monga, James Moose, Ana Otilia Nutu, Eric Petersen, Silvia Poghinu, Taras Pushak, Cesar Quieroz, Lulin Radulov, Marianne Fay, Peter Roberts, Gevorg Sargsyan, Raghuveer Sharma, George Tharakan, Peter Thomson, Cordula Thum, Gleb Zinoviev, and many others who spent time making this review possible.

TABLE OF CONTENTS
EXECUTIVE SUMMARY .................................................................................................................................I 1. MEASURING HIDDEN COSTS IN INFRASTRUCTURE .............................................................................. 1 Sector Overview............................................................................................................................................ 1 The Hidden Costs Calculator Model............................................................................................................. 1 Data Availability and Quality ....................................................................................................................... 3 Structure of the Review ................................................................................................................................ 3 2. FINANCIAL PERFORMANCE IN THE ENERGY SECTOR.......................................................................... 3 Overview of Energy Consumption Patterns.................................................................................................. 4 Hidden Costs - Overall Trends: The Power Sector...................................................................................... 5 Hidden Costs - Overall Trends:The Natural Gas Sector............................................................................. 13 3. FINANCIAL PERFORMANCE IN THE WATER SECTOR ......................................................................... 18 Water Access, Abstraction, and Consumption............................................................................................ 20 Hidden Costs – Overall Trends................................................................................................................... 22 Other Factors Providing Insight to Financial Performance......................................................................... 32 4. FINANCIAL PERFORMANCE IN THE TRANSPORT SECTOR.................................................................. 33 Rail Sector................................................................................................................................................... 33 Factors Influencing Financial Performance ................................................................................................ 35 Road Sector................................................................................................................................................. 40 Factors Influencing Financial Performance ................................................................................................ 42 ANNEX 1. CALCULATING HIDDEN COSTS IN THE ENERGY AND WATER SECTORS.............................. 50 ANNEX 2. DATA SOURCES, AVAILABILITY, AND DEFINITIONS .............................................................. 58

MEASURING FINANCIAL PERFORMANCE IN INFRASTRUCTURE
EXECUTIVE SUMMARY
Reliable and affordable infrastructure is essential for a well-functioning economy. Today the performance of many public utilities in Europe and Central Asia (ECA) has become an impediment to more rapid economic growth. This discussion paper raises a constellation of issues—high losses, non-payment of bills, and tariffs set below cost-recovery rates—that block progress in the power, natural gas, and water sectors. The paper reviews available data on these sectors and begins to develop a model to quantify the burden on national budgets of infrastructure policy and implementation decisions. The intention is to widen opportunities for overall improvements in allocating scarce budgetary resources by offering policymakers data that will be useful to (a) understand the order of magnitude of current hidden fiscal costs, (b) estimate the costs of current and future policy choices (c) and reduce the burden on consumers. Implicit subsidies to public utilities can be considered an illegitimate claim on public resources. Direct subsidies to utilities are formally allocated and formally recorded ‘on the books.’ In contrast, ‘hidden’ costs, although accumulated by utilities, go unrecorded, thereby creating a fiscal burden on the local or national government that amounts to a hidden subsidy. Typically utilities compensate for these hidden costs by reducing investment in maintaining the utility; they may delay or forego essential maintenance and repairs or reduce the workforce, actions that cause significant deterioration in the value of assets, declining service quality, and increasing cost for each unit of service provided. When this happens, losses are increased substantially and abnormally high investment is required to carry out repairs, which is rarely cost effective. The Cost of Policy Choices. The vicious cycle—that begins with hidden costs and proceeds to hidden subsidies—means that when governments finally absorb accumulated debts, they do so at the cost of adding to the national debt or reducing funding for other programs. This cycle has persisted in part because of difficulties in quantifying the order of magnitude of ‘hidden costs.’ The model presented in this discussion paper was designed to provide a single measure for all implicit subsidies so that policymakers can weigh the price of policy actions (or inactions) that could, but do not, have a fiscal offset. One important criterion for developing the model was to calibrate carefully the tradeoffs between complexity and comprehensiveness on the one hand and ease of use on the other. The model presented here ensures that this single measure can be easily calculated, tracked, and reported. Another benefit of this model is that it can be used to monitor and benchmark trends across sectors and countries without the need for intensive data collection. Structure of this Report. Chapter one of this paper provides insight into the derivation of the Hidden Costs Calculator model used to estimate the extent of implicit subsidies. Chapters Two, Three, and Four use the model to analyze the hidden costs and their component factors for the energy, water, and transport sectors. In the case of transport, applying the model was challenging because it is fundamentally different from the power, water, and natural gas sectors. In addition, the transport lacks consistent data sources over time, and data sets among countries in the Region lack sufficient commonalty for meaningful comparison. References for this report are found at the end of Chapter Four. Full details of the Hidden Costs Calculator model are outlined in Annex 1, and all data sources and definitions follow in Annex 2. The Hidden Costs Calculator Model. The model, the Hidden Costs Calculator, is designed to provide insight into three key components of hidden costs affecting ECA infrastructure: poor bill collection rates; excessive losses due to inefficient operations or theft from the network in power, gas or water systems; tariffs set below cost-recovery rates (i.e., amounts needed for long-run operations and maintenance, investment, and normative losses). This model compares the difference between actual revenues and

ii
revenues that could be anticipated in a well-functioning system operating with cost-covering tariffs, bills paid, and losses normative for networks of a certain age and design. In its final form the applied model to estimate Hidden Costs, H is expressed as: H = R* - R Where, R* is the expected revenue and R is the actual revenue. H can be expressed alternatively as a function of tariffs below cost recovery, unaccounted losses and poor collections, by substituting for these variables: H = Qe (Tc – Te) + Qe Tc (lm – ln) / (1 – lm) + Qe Te (1 – Rct) Where, Qe = end user consumption Tc = average cost-recovery price Te = weighted average end user tariff lm = total loss rate ln = normative loss rate Rct = collection rate Please note: Tariffs set below cost-recovery levels as a recognized policy should be considered an explicit subsidy and therefore should be deducted from the overall calculation. In this case the correct measure of hidden costs would be as follows: H = R* - R – T Where, T is the amount of capital or other transfer. No attempt has been made to estimate T in this review and Hidden Costs may in some cases be overestimated. Data Used in the Hidden Costs Calculator. Hidden costs estimates in the energy sector span twenty-two ECA countries. However due to decentralization of water service provision, coverage in this paper is limited to the sixteen countries with available data. Data collection has focused on 2000 to 2003 using internationally known sources or existing data collection instruments where possible. Since there are no external datasets of desired financial performance (e.g., average cost-recovery price), supplemental data has been applied (from existing World Bank publications and reports; from World Bank and IMF sector specialists). The review presents information reported in external datasets or by utilities that have been checked for inconsistencies and outliers but no special audit has been conducted. All data presented in this report are in 2001 constant US dollars to eliminate trends or fluctuations that result from currency conversions. Key Findings: Hidden Costs in ECA are Significant. Throughout the Region during this period, the power sector share of hidden costs had had by far the largest impact. The water and gas sector contributions are of similar magnitude to each other but their combined impact is still less that that of the power sector. Tariffs set below the cost-recovery rate are the most significant factor in the power and gas sectors, while unaccounted losses is the main factor in water. Hidden costs in the power sector averaged 4.4 percent of GDP in 2003, down from double that figure in 2000. About half of this decline is due to an increase in GDP, but the remainder is attributed to improved sector performance. While an increase in overall GDP throughout the Region has had some effect on these percentages, the downward trend also indicates improved management within this sector. Since 2000, hidden costs in the gas and water sectors have changed little—2002 estimates were 1.0 percent of GDP for gas and 1.2 percent for water. Such minor movement in Region-wide hidden cost estimates for

iii
the gas and water sectors makes trend analysis difficult. However, applying the model to national datasets frequently makes it possible to discern country-wide trends. Power Sector. Throughout the Region, tariffs set below cost-recovery rates accounted for 67 percent of aggregate hidden costs in 2003, followed by unaccounted losses at 22 percent and poor collections at 11 percent. Overall, the aggregate value of total hidden costs declined by about 48 percent from a value of US$ 30.1 billion in 2000 to US$ 15.9 billion in 2003.1 The largest declines were in Russia (70 percent, from US$ 14.2 billion in 2000 to US$ 4.2 billion in 2003) and Bosnia (62 percent, from US$ 251.5 million to US$ 96 million). Notably, two countries with high hidden costs that differ from other countries by a wide margin are Tajikistan at 16 percent of GDP and Uzbekistan at 12 percent.
• Tariffs and cost-recovery rates. In absolute terms the contribution to overall hidden costs due to tariffs set below cost recovery totaled US$ 10.6 billion in 2003. In relative terms, these costs have declined from 5.4 percent of GDP in 2000 to 2.6 percent GDP in 2003, despite increasing consumption across the Region. Two factors contributed to this decline—GDP increased and the gap narrowed between the average cost-recovery price and the weighted average end user tariff. In Turkey tariffs exceeded cost-recovery levels in 2003, and in Moldova, 2002, eliminating this form of hidden cost. Over the same period in Croatia cost-recovery levels and weighted-average tariffs converged significantly. In 2003 high hidden costs persisted, due to tariffs set below cost-recovery levels, in Tajikistan—14 percent of GDP, and Moldova—8 percent.
• Unaccounted Losses. Region-wide, hidden costs due to unaccounted losses initially increased
from 2.0 percent of GDP in 2000 to 2.2 percent in 2001, but then steadily declined to 1.1 percent in 2003.2 During 2003, hidden costs due to unaccounted losses were highest in FSU-LI countries—Kyrgyz Republic (4.5 percent of GDP), Georgia (3.3 percent), Moldova (3.2 percent) and Armenia (2.2 percent). Total losses in these countries were in excess of 26 percent of domestic supply. In all other countries unaccounted losses comprised less than 2 percent of GDP where total losses ranged between 10 and 20 percent of domestic supply. The largest decline in unaccounted losses (as a proportion of GDP) occurred in Belarus and Bosnia—each more than 100 percent. There was a corresponding decline in total losses in Bosnia.
Natural gas sector. Across the Region tariffs set below cost-recovery levels accounted for 70 percent of total hidden costs, collection failures at 29 percent, and unaccounted losses at 1.0 percent. Hidden costs for natural gas remained below 2.0 percent of GDP for all years and in all countries except Ukraine (in earlier years) and Uzbekistan, where they were between 3.0 and 6.0 percent. Overall in the Region hidden costs declined from US$ 6.6 billion in 2000 to US$ 4.7 billion in 2002. In absolute values, Ukraine had the largest decrease in the three years prior to 2002 (a drop of US$ 749 million); in relative terms Poland had the largest decline—64 percent in the same three years.
• Natural gas tariffs and cost recovery. Region-wide, in relative terms, hidden costs due to tariffs set below cost recovery declined from 0.8 percent to 0.6 percent of GDP, despite a 13 percent increase in end-user consumption for the period ending in 2002. This shows a convergence between average cost-recovery prices and weighted average end-user tariffs. In constant 2001 US$, hidden costs from tariffs set below cost-recovery levels declined 35 percent—from US$ 5.1 billion in 2000 to US$ 3.3 billion in 2002. The largest decline in hidden costs occurred in CEE
1 Excluding Hungary and Turkmenistan for which no data were available. 2 Excluding Hungary and Turkmenistan—no data available.

iv
countries. Azerbaijan, Belarus, Kyrgyz Republic and Uzbekistan increased over this period.
• Natural gas—collection rates. During 2000-02, hidden costs due to collection failures remained largely unchanged at around 0.4 percent of GDP, roughly US$ 90 million. This is consistent with relatively small changes in collection efficiency. Other than Tajikistan,3 ECA countries improved their collection rates very gradually, reflecting diminishing scope for potential revenue leakages due to poor revenue collection institutions. Marked differences existed collection levels across the Region; Georgia’s rate remained low at 25 percent; Croatia, Moldova, Poland and Turkey remained between 78 and 90 percent. No country for which data were available exhibited a decline in collection rates.
Water sector. During 2002, hidden costs (in absolute terms) comprised—unaccounted losses, 50 percent; tariffs set below cost, 43 percent; poor collections, 7.0 percent. Hidden costs in all countries and for all years are below 2.5 percent of GDP, except Armenia and Moldova. In relative terms, hidden costs in the Region overall, as a proportion of GDP, increased from 0.9 percent in 2000 to 1.2 percent in 2002. However, the aggregate value of hidden costs in this sector declined between 2000-02 by about 30 percent from US$ 2.5 billion in 2000 to US$ 1.8 billion in 2002. The largest declines in hidden costs were for Russia and Tajikistan—a decline of around 70 percent in each country in the same period.
• Water—unaccounted losses. FSU countries contributed most to an increasing trend of hidden costs due to unaccounted losses, which rose from an average of 0.6 percent of GDP in 2000 to 0.9 percent in 2002; from US$ 626 million to US$ 939 million. This is consistent with deteriorating integrity of supply networks evidenced by a rise in total system losses (water abstracted minus water billed) from 32 percent in 2000 to 39 percent in 2002. Losses increased the most in FSU-LI countries, perhaps indicating deteriorating supply networks.4
• Water—tariffs and cost recovery. Overall hidden costs due to tariffs set below cost-recovery levels decreased 31 percent from US$ 1140 million to US$ 785 million, led by FSU-MI countries (55 percent over the period). However, data for 2003, while not covering all countries, showed an overall increasing trend. As a percentage of GDP this has remained on average between 0.4 – 0.5 percent.
Transport Sector. As mentioned, applying the model to the transport sector was problematical not only because it is fundamentally different from the power, water, and natural gas sectors, but also because the sector lacks comprehensive and consistent data sources over time and among countries. Nevertheless this report includes some transport discussion including state budget support, working ratio, and staffing data for rail and yearly average expenditures in roads. The discussion demonstrates the difficulty in applying the model to the sector but seeks appropriate financial performance indicators.
• Rail subsector. One available indicator of railway performance is the level of state budget support, however, measured over the short term—one to four years—this measure can misrepresent financial performance because railways often compensate for reduced budget support by reducing long-term maintenance or rehabilitation. State budget support is also difficult to compare among countries because state public budgets and policies vary. The available dataset spans three countries in CEE, six in SEE and two FSU-LI countries for 2000-02. During the period, in relative terms, State budget support as a percentage of GDP remained unchanged across
3 Tajikistan’s collection rates for the first three years were in the 50-55 percent range, and spiked to 100 percent in 2003. 4 Although in absolute terms losses in Azerbaijan were the lowest across all countries.

v
all countries—averaging 0.4 percent or less. However this average masks a 24 percent increase in CEE countries and a 24 percent decrease in SEE countries. Over the period, state budget support was lowest in Poland and Estonia and peaked in Croatia in 2002 at just over 1.0 percent of GDP. In absolute terms, data spanning the three-year period reveal that the overall state budget support increased by 7.6 percent from US$ 775 million to US$ 834 million for the six countries. Poland’s state support decreased 34 percent from US$ 244 million to US$ 162 million; Estonia’s increased 1.0 percent; and Romania’s, 1.9 percent. State budget support was highest in Hungary in 2002 at over US$290 million.
• Road subsector. Across the Region priorities for expenditure were as follows: routine maintenance and repair; new construction; rehabilitation. Average expenditure in the sector remained largely unchanged at around 0.9 percent of GDP (2000-03). In 2003 FSU-MI countries average expenditures in the sector—1.4 percent of GDP—exceeded the Regional average. Stable average expenditures across the Region as a percentage of GDP mask differences between sub-regions. SEE expenditure increased 26 percent and CEE, 16 percent; FSU-LI decreased -15 percent and FSU-MI, 41 percent. Serbia’s expenditures increased 72 percent; Russia’s expenditures dropped -41 percent and the Kyrgyz Republic, -56 percent. Across the Region, for the 13 countries in the sample, expenditures totaled US$ 8.9 billion. Actual expenditure in dollar terms rose 9.0 percent from an average of US$ 625 million to US$ 681 million. These figures are distorted by expenditures in Russia, which represent 64 percent of the total in 2003. Average expenditure in FSU-LI countries was significantly lower than other sub-regional groups at US$ 26.8 million in 2003. Expenditure in absolute terms increased most significantly in Serbia (+291 percent), while the only decreases were in the Kyrgyz Republic (-41 percent) and Russia (-7 percent).
Going Forward. This exercise demonstrated that estimating the order of magnitude of hidden costs is worth pursuing. In the energy and water sector, the intention is to continue to update this dataset as information becomes available through external sources for additional countries for 2004 and onward. Future updates will be available through the website http://ecadata-worldbank.org. The review team has concluded that it is not useful to continue this exercise in the transport sector without significant in-depth work, and there are no plans to pursue this for now.

vi

1. MEASURING HIDDEN COSTS IN INFRASTRUCTURE
Discussions about the scale and effectiveness of explicit subsidies in the infrastructure sectors have been a part of the Bank’s ongoing policy dialogue with client countries in the Europe and Central Asia Region (ECA) but addressing implicit subsidies or hidden costs has been hampered by lack of empirical data or concrete numbers. Therefore the primary objective of this report is to estimate the extent of ‘hidden costs’—sometimes referred to as implicit subsidies—in the infrastructure sectors in ECA. This report reviews available data on the power, natural gas, water, and transport sectors and begins to develop a model to quantify the burden on national budgets of infrastructure policy and implementation decisions. The intention is to widen opportunities for overall improvements in allocating scarce budgetary resources by offering decision makers data that will be useful to understand the order of magnitude of current hidden fiscal costs; estimate the costs of current and future policy choices; and reduce the burden on consumers.
Sector Overview
In the Europe and Central Asia (ECA) Region during transition, access to basic infrastructure services was widespread and services were highly subsidized.5 Operating performance was poor, efficiency was low, and losses were high. Even though tariffs were set below the cost of service provision, poor service quality provided few incentives for payment.6 As a result consumption levels were high compared to developed countries. Today the power, natural gas and water sectors in many ECA countries suffer from high losses, nonpayment of bills, and tariffs that are set below cost-recovery rates. This contributes to implicit subsidies to public utilities that can be considered an illegitimate claim on public resources. Direct subsidies to utilities are formally allocated and formally recorded ‘on the books.’ In contrast, ‘hidden’ costs, although accumulated by utilities, go unrecorded, thereby creating a fiscal burden on the local or national government that amounts to a hidden subsidy. Typically governments compensate for these hidden costs by reducing investment in maintaining the utility; they may delay or forego essential maintenance and repairs or reduce the workforce, actions that cause significant deterioration in the value of assets, declining service quality, and increasing cost for each unit of service provided. When this happens, losses are increased substantially and abnormally high investment is required to carry out repairs, which is rarely cost effective. In some countries private sector involvement in infrastructure has yielded some improvements—particularly in payment collections.7 More recently the private sector has shown less interest in infrastructure investments.
The Hidden Costs Calculator Model
In an effort to improve dialogue with client countries on hidden costs in infrastructure, the World Bank and the International Monetary Fund (IMF) have collaborated to design a simple model that can provide a single measure for all implicit subsidies so that policymakers can weigh the price of policy actions (or inactions) that could, but do not, have a fiscal offset. One important criterion for developing the model 5 Even today access is fairly widespread: electricity connections tend to be universal; connections to other services vary widely. Water is close to 100 percent in capital cities, but nearer to 80 percent in other urban areas and only 40 percent in rural areas. Gas connections are more limited in secondary cities and rural areas (Hamilton, 2004). 6 Non payment is widespread. More than 20 percent of households do not pay for electricity where payment enforcement is relatively simple. 7 In the power sector—Georgia, Hungary, Kazakhstan, Moldova and Slovakia. In the water sector—Bulgaria, Czech Republic, Estonia, and Kyrgyz Republic.

2
was to calibrate carefully the tradeoffs between complexity and comprehensiveness on the one hand and ease of use on the other. The model presented here ensures that this single measure can be easily calculated, tracked, and reported. Another benefit of this model is that it can be used to monitor and benchmark trends across sectors and countries without the need for intensive data collection. The model, the Hidden Costs Calculator, is designed to provide insight into three key components of ECA infrastructure: poor bill collection rates; excessive losses due to inefficient operations or theft from the network in power, gas or water systems; tariffs set below cost-recovery rates (i.e., amounts needed for long-run operations and maintenance, investment, and normative losses). This model compares the difference between actual revenues and revenues that could be anticipated in a well-functioning system operating with cost-covering tariffs, bills paid, and losses normative for networks of a certain age and design. These three components of hidden costs can be summarized as follows:
• Collection failure. Less-than-perfect collection of tariffs billed to consumers for their actual consumption; it is a function of end-user consumption, the weighted average end-user tariff and the difference between billed and collected amounts. It provides an indication of infrastructure and institutional deficiencies that prevent utilities from collecting revenues to which they are entitled.
• Tariffs set below cost-recovery levels. This occurs in pricing structures where tariffs are set below the cost of providing energy services to consumers; computed as the product of end-user consumption and the difference between cost-recovery and weighted average end-user tariffs.
• Unaccounted losses. These result from the cost-recovery tariff, end-user consumption and the difference between total and normative losses. Total losses include both transmission and distribution losses and are calculated as a percentage of the domestic supply. Normative losses constitute that component of total losses that accrues due to system design and technology constraints; they are inevitable and predictable.
Hidden costs, H can therefore be expressed as: H = R* - R Where, R* is the expected revenue and R is the actual revenue. H can alternatively be expressed as a function of tariffs below cost recovery, unaccounted losses and poor collections, by substituting for these variables: H = Qe (Tc – Te) + Qe Tc (lm – ln) / (1 – lm) + Qe Te (1 – Rct)8 Where, Qe = end-user consumption Tc = average cost-recovery price Te = weighted average end-user tariff lm = total loss rate ln = normative loss rate Rct = collection rate 8 Annex 1 provides a full derivation of this formula.

3
NOTE: Tariffs set below cost-recovery levels by policy should be considered an explicit subsidy and should be deducted from the overall calculation. In such a case the correct measure of hidden costs would be as follows: H = R* - R – T Where, T is the amount of capital or other transfer. No attempt has been made to estimate T in this review and Hidden Costs may in some cases be overestimated.
Data Availability and Quality
This review covers performance measurement in the power and natural gas sectors across twenty two countries in ECA. Due to the decentralized nature of water service provision country coverage is limited to the sixteen ECA countries for which data were available. This review has focused primarily on data collection for 2000-03; data used are from internationally known sources or existing data collection instruments, existing World Bank publications and reports, and World Bank and IMF sector specialists. All data are presented in constant 2001 US dollars to eliminate trends or fluctuations from currency conversions. The review presents information reported in external data sets or by utilities, and while the data have been checked for inconsistancies and outlying data, no special audit has been conducted. While data on railway performance and the road sector are available for most countries in the Region, information on the financial state of the sector has been difficult to obtain in all cases. Therefore applying the model to the transport sector was challenging because it is fundamentally different from the power, water, and natural gas sectors, it lacks sufficient consistent data sources over time, and data among countries in the Region lacks sufficient commonalty for meaningful comparison. Country coverage may vary by sector but countries are classified as follows to compare trends:
• Central and Eastern Europe (CEE) • South East Europe (SEE) • Former Soviet Union – Low Income Countries (FSU-LI) • Former Soviet Union – Middle Income Countries (FSU-MI)
Structure of the Review
Section 1 of this review provides insight into the derivation of a Hidden Costs Calculator model used to estimate the extent of implicit subsidies in the energy and water sectors. Sections 2, 3, and 4 cover financial performance in the energy, water, and transport sectors. The transport sector section focuses on expenditure on roads and budget support to the rail sub sectors. Derivation of the Hidden Cost model and assumptions made in hidden cost calculations are provided in Annex 1 – Hidden Costs in the Energy and Water Sectors. A full description of data sources is presented in Annex 2 – Data Sources, Availability and Definitions and the supporting data set can be accessed at http://ecadata-worldbank.org.
2. FINANCIAL PERFORMANCE IN THE ENERGY SECTOR
Infrastructure reforms in ECA in the post-communist period have transformed the ownership, management, and the pricing of services provided by the erstwhile state-owned and operated utilities. From a command-based service pricing approach, the current system has evolved towards a market based competitive pricing mechanism. The change in ownership and functioning was motivated by the desire to provide incentives to mobilize investment finance within affordability constraints, to lower production

4
costs, and to place a lower burden on the state through more realistic pricing systems and a more efficient tariff collection. This review focuses on the performance of energy utilities—electricity and natural gas providers, to estimate the magnitude and proportions of hidden costs of providing the services. The indicators provide a measure of efficiency of the system from its generation through service delivery to revenue collection. The results discuss the true cost of receiving the services and thereby the degree of success in achieving some of the main goals of infrastructure reforms. It disaggregates hidden costs to separate components—some of which can be addressed by policy initiatives. The review also compares the residential sector to the non-residential sector in distribution of the cost of service, and thereby illustrates any cross-subsidization that might occur. An overview of energy consumption patterns is provided as a backdrop to this analysis.
Overview of Energy Consumption Patterns
The Power Sector
In the power sector aggregate end-user consumption increased by 6.3 percent with the most notable increases in SEE countries in this four-year period; Serbia and Montenegro (45.4 percent increase), Macedonia (38.7 percent) and in Romania (22.1 percent). The only countries to demonstrate an actual decline in end-user consumption were the low-income FSU countries (Georgia by 41.8 percent and Kyrgyz Republic by 14.5 percent). Russia and Ukraine had the highest levels of end-user consumption, but these levels increased marginally between 2000-03. Transmission efficiency, or the ratio of end-user consumption to domestic supply, declined across the Region by 4.7 percent. Low-income FSU countries where excess generation capacity is coupled with high levels of system losses and theft contributed the most to this trend; reflected in transmission efficiencies much lower than 100 percent with a trend towards a further decline. Residential electricity consumption declined for two-thirds of countries in this review while non residential electricity consumption increased 5.9 percent.9 However, Uzbekistan, Ukraine, Romania, Tajikistan, Armenia, and Bulgaria faced large declines in both residential and non-residential consumption over the period. This could indicate that declining consumption resulted primarily from an overall resource availability constraint that affected the entire country and did not insulate any specific sector.
The Natural Gas Sector
Overall end-user consumption in the entire Region10 increased at average of 22.7 percent and outpaced the growth in domestic supply. This indicates a decline in losses and inefficiencies related to transportation and distribution in the system. The fastest growth in end-user gas consumption was experienced in the SEE countries; fuelled by a 93 percent increase in Romania. Among the major players in the sector, Uzbekistan and Belarus had modest growth in the 6-8 percent range; Russia reported a slight decline (0.8 percent); and Ukraine had a 47 percent increase. Bosnia, Georgia, and the Kyrgyz Republic were the only three countries that had a decline in end-user consumption.
9 Excludes Macedonia and Serbia and Montenegro for lack of data for 2003. 10 Albania was excluded since data needed to be verified.

5
Transmission efficiency gradually increased across all countries from 52 percent to 70 percent and was most notable in SEE and FSU-LI countries. However, these countries had below average transmission efficiencies to begin with and much greater scope for improvement.
Hidden Costs - Overall Trends: The Power Sector
In relative terms, hidden costs as a proportion of GDP have declined overall from an average of 8.6 percent in 2000 to 4.4 percent in 2003. About half of this is due to an increase in GDP and the remainder to an improvement in sector performance. Tajikistan and Uzbekistan have high hidden costs in the power sector at 16 percent and 12 percent (in 2003) of the GDP respectively, and differ from other countries by a wide margin.
Electricity: Hidden Costs - Total
0.0
2.0
4.0
6.0
8.0
10.0
12.0
14.0
16.0
18.0
20.0
22.0
24.0
26.0
28.0
30.0
Albania
Armen
ia
Azerba
ijan
Belarus
Bosnia
Bulgari
a
Croatia
Georgi
a
Kazak
hstan
Kyrgyz
Rep
ublic
Maced
onia
Moldov
a
Poland
Roman
ia
Russia
Serbia
and M
onten
egro
Tajikis
tan
Turkey
Ukraine
Uzbek
istan
Percent of GDP
2000 2001 2002 2003Average 2000 Average 2001 Average 2002 Average 2003
In the Region overall11, the aggregate value of total hidden costs (in constant 2001 US$) declined by about 48 percent from a value of US$ 30.1 billion in 2000 to US$ 15.9 billion in 2003. The largest declines were in Russia (from US$ 14.2 billion in 2000 to US$ 4.2 billion in 2003 – a decline of 70 percent) and Bosnia (from US$ 251.5 million to US$ 96 million – a decline of 62 percent). Tariffs set below cost-recovery rates was the largest component of hidden costs, representing 67 percent of hidden costs in 2003 on aggregate (absolute terms) across the Region. In the same year unaccounted losses contributed 22 percent to hidden costs, and poor collections, 11 percent.
11 Barring Hungary and Turkmenistan for which no data was available.

6
Electricity: Hidden Cost Components, 2003
0
250
500
750
1000
1250
1500
1750
2000
2250
2500
Albania
Armen
ia
Azerba
ijan
Belarus
Bosnia
Bulgari
a
Croatia
Georgi
a
Kazak
hstan
Kyrgyz
Rep
ublic
Maced
onia
Moldov
a
Poland
Roman
ia
Russia
Serbia
and M
onten
egro
Tajikis
tan
Turkey
Ukraine
Uzbek
istan
US$ million(Constant 2001 US$)
Unaccounted Losses Collection Failures Tariff Below Cost Recovery
4,232
Hidden Costs—Tariffs below Cost Recovery
Hidden costs due to tariffs set below cost recovery have declined relatively from 5.4 percent of GDP in 2000 to 2.6 percent in 2003, despite an increase in consumption across the Region. This is due to an increase in GDP and a narrowing gap between the average cost-recovery price and the weighted average end-user tariff. In 2003 Tajikistan’s hidden costs due to tariffs set below cost-recovery levels were high at 14 percent of GDP and Uzbekistan’s were 8.0 percent. In absolute terms hidden costs due to tariffs set below cost recovery totaled US$ 10.6 billion in 2003. In Turkey and Moldova, tariffs exceeded cost-recovery levels by 2003 and 2002 respectively; thereby eliminating this form of hidden cost. There was also significant convergence over the period between cost-recovery levels and weighted average tariffs in Croatia.

7
Electricity: Hidden Costs - Tariff Below Cost Recovery Price
0.0
2.0
4.0
6.0
8.0
10.0
12.0
14.0
16.0
18.0
20.0
22.0
24.0
26.0
Albania
Armen
ia
Azerba
ijan
Belarus
Bosnia
Bulgari
a
Croatia
Georgi
a
Kazak
hstan
Kyrgyz
Rep
ublic
Maced
onia
Moldov
a
Poland
Roman
ia
Russia
Serbia
and M
onten
egro
Tajikis
tan
Turkey
Ukraine
Uzbek
istan
Percent GDP
2000 2001 2002 2003
Average 2000 Average 2001 Average 2002 Average 2003 Average Cost Recovery Price. The Average Cost Recovery Price (ACRP), or the average actual cost of providing the electricity to the end user, showed a consistent decline across the Region from 5.37 USc per kWh in 2000 to 5.10 USc per kWh in 2003—5.0 percent overall. All groups of countries matched this trend with FSU-MI countries declining by 13 percent over this period. Russia, the largest net exporter of electricity saw a decrease in average cost-recovery price, and remained one of the lowest in the entire Region together with Kazakhstan, the Kyrgyz Republic and Tajikistan; below 3.0 USc per kWh in all cases. This could explain the motivation for other countries in the Region at that time to import electricity from Russia rather than augment their domestic production. It could also explain why other countries that were facing such price competition from Russia limited in their potential electricity exporting opportunities. The CEE countries however faced an increase in cost-recovery price of about 57 percent. This may represent a combination of more efficient technology, better management of resources, and the gradual phasing out of old inefficient infrastructure. The ACRP was highest in SEE countries, and more than double the average rates of republics in the FSI countries. Weighted Average End-User Tariff. The Weighted Average End-User Tariff (WAET) is the average tariff rate actually charged to consumers taking into account differences in residential and non-residential tariff rates. The overall average WAET across ECA rose from 3.30 USc per kWh in 2000 to 4.15 USc per kWh by 2003—an increase of 25.6 percent; more than half of this increase was in the last year. Only three countries (Armenia, Georgia, and Macedonia) had declines in WAET.

8
Country Weighted Average End-user Tariff Change in WAET USc/kWh % 2000 2001 2002 2003 2000 - 2003 Albania 2.87 3.70 4.23 5.41 88.9 Armenia 4.06 3.79 3.66 3.44 -15.3 Azerbaijan 1.95 1.46 1.88 2.42 24.3 Belarus 3.69 3.60 3.26 3.70 0.5 Bosnia 5.08 5.09 5.24 5.12 0.9 Bulgaria 3.65 3.87 4.05 5.15 41.3 Croatia 5.93 5.79 5.70 7.19 21.4 Georgia 3.34 3.17 2.99 2.51 -24.7 Hungary 5.02 5.00 6.26 7.78 55.1 Kazakhstan 2.40 2.35 2.36 2.56 6.4 Kyrgyz Republic 0.84 0.92 1.12 1.37 62.9 Macedonia 4.81 4.70 4.63 4.35 -9.6 Moldova 4.57 4.89 4.92 4.93 8.0 Poland 4.75 5.48 5.91 6.33 33.4 Romania 3.77 3.78 4.69 5.51 46.2 Russia 0.92 1.52 1.48 2.29 148.7 Serbia and Montenegro 1.84 1.63 3.01 3.87 109.9 Tajikistan 0.20 0.32 0.20 0.44 112.5 Turkey 6.64 6.96 7.58 8.39 26.3 Ukraine 2.35 2.50 2.60 2.78 17.9 Uzbekistan 0.72 0.80 0.83 1.24 72.7 Average 3.30 3.40 3.65 4.13 25.08 Average CEE 4.88 5.24 6.09 7.06 44.6 Average SEE 4.32 4.44 4.89 5.63 30.1 Average FSU-LI 2.24 2.19 2.23 2.34 4.3 Average FSU-MI 2.34 2.49 2.42 2.83 21.0 On aggregate, residential tariffs in the Region remained higher than non-residential tariffs indicating a level of cross-subsidy or cross-pricing by service providers. However this gap marginally declined over the period (by 13 percent). Residential tariff rates grew by 35 percent in SEE countries. In FSU-MI countries non-residential tariff rates grew by 56 percent substantially reducing the tariff differential with residential consumers. Overall 12 of 20 countries levied a premium on residential electricity tariffs in 2003, reflecting the lower price elasticity of demand for household consumption of electricity as compared to the commercial and non-residential usage. A few countries (Armenia, Bulgaria, Kyrgyz, Moldova, Romania, and Ukraine) offer a cash subsidy to poor households to offset the tariff structure, and to provide subsidies for heating during the winter. Most countries offer tariff differentials based on user-classification, voltage of supply, and time of consumption (peak versus non-peak12). Lampietti (2004) notes that the comparison of welfare losses from price increases and welfare gains from service delivery improvements remain inconclusive. In some countries consumption switching has occurred; the ratio of residential to non-residential consumption declined in 16 countries over the period. This could indicate preferential tariff structures,
12 Residential consumption occurs mainly in peak hours, tending to increase the cost.

9
improved availability, or improved reliability of services (the latter aspects are not captured in the review). Increases in tariffs are often a trade-off with the otherwise lower service quality. In the 1990s, limited privatization in these markets did increase service quality (reduced voltage fluctuation, increased supply frequency, and uninterrupted hours of service per day)13 in Armenia, Azerbaijan, Georgia, but not elsewhere. Limited investments restricted scope for service improvements and in some cases the increased tariff just rationalized a historically subsidized tariff structure that private operators could no longer bear. Belarus spent part of the larger revenue collected from increased tariffs to repay accumulated debts to energy exporters in Russia. Overall no pattern emerges among countries—the size of the economy or geographic location—to determine higher probability of charging a premium.
13 Table 3.4 in Lampietti (2004).

10
Power Sector – Tariff Structure in Select Countries14
End-user Tariffs Country Organization Differentiation
Cross Subsidy Direct Subsidy to Consumers
Development Costs
Included Albania Voltage levels;
customer type Seasonal periods NO. A hidden subsidy might exist—State defines
the tariff; average residential consumer price is lower than the nonresidential price or average end-user price.
No Yes
Armenia Voltage levels Day-night differentiation; the definition of time zones is based on the system's Load Curve
YES. Between distribution companies and between high and low voltage consumers: (a) Yerevan and Southern distribution co.s subsidize the Northern and Central Distribution co.s; (b) high voltage consumers subsidize low voltage consumers.
Yes, subsidies for residential heating during the winter
No. There is a method for establishing tariffs
Bulgaria Voltage levels Day-night differentiation for residential customers; hourly zones during the day for industry based on the system's load curve pattern
YES. Between residential and nonresidential consumers. Regulated prices provide cross subsidy from industrial to residential consumers. Low-income have same rates as other residential consumers.
Yes. Poorest users receive assistance in cold season (capped US$15 per month)
Yes
Kyrgyz Republic
Customer type Day-night differentiation; the definition of time zones is based on the system's Load Curve pattern
YES. Inside residential consumer classes—monthly consumers over 400 kWh and industrial consumers subsidize residential consumers with less than 150 kWh; about 65 percent of total number of consumers
Yes. 15 percent subsidies from State for low-income electricity /heat consumers.
No data
Moldova No data Tariffs are differentiated on hourly zones during the day. The definition of time zones is based on the pricing policy.
No data Yes. State subsidies for energy efficiency (up to 60 kWh/m and low-income heat consumers
No
Poland Voltage& demand levels; load factors; consumer type;
Hourly zones during day; day-night; weekend; weekdays; seasonal; definition of time zones is based on pricing policies and the system's load
No data No data Yes, after agreeing with the Regulator
14 Sources: (i) Energy Regulators Regional Association, Tariff/ Pricing Committee, 2002 Issue Papers; (ii) Energy Regulators Regional Association, Licensing/ Competition Committee, 2003 Issue Papers

11
End-user Tariffs Country Organization Differentiation
Cross Subsidy Direct Subsidy to Consumers
Development Costs
Included other curve.
Romania Voltage levels, demand levels and load factors.
Hourly zones during the day; day-night; weekend; seasonal period; the definition of time zones is based on the system's load curve pattern.
YES, inside residential consumer classes. For residential customers, there is a standard tariff and a social tariff. The average price for residential consumption is 53.32 USD per MWh; the social tariff is 33.18 USD per MWh and the standard tariff is 58
Yes. State subsidies for heat suppliers, for low-income heat consumers in cold season. Facilities for energy sector workers & retired.
Yes
Russia n.a. Differentiation of time zones; six zones in Russian Federation, each has a wholesale market tariff. Retail market uses single-rate, dual-rate, and zonal tariffs. Time zones based on system load curve and pricing policy.
No data No data Yes
Ukraine Voltage levels Hourly zones during the day and day-night. Time zones are based on system load curve pattern.
YES. Residential and agricultural consumers are subsidized by industrial consumers—about 20 percent of total sales; discount 35 percent for cash payments.
Yes, 35 percent discount for cash payments for privileged consumers
Yes

12
Hidden Costs—Unaccounted Losses
As a fraction of their respective GDP, hidden costs due to unaccounted losses initially increased from 2.0 percent in 2000 to 2.2 percent in 2001, but then steadily declined to 1.1 percent in 2003.15 Hidden costs due to unaccounted losses were highest in FSU-LI countries; Kyrgyz Republic (4.5 percent of GDP), Georgia (3.3 percent), Moldova (3.2 percent) and Armenia (2.2 percent) in 2003. Total losses in all countries exceeded 26 percent of domestic supply. In all other countries this component was less than 2.0 percent of GDP where total losses largely ranged between 10 and 20 percent of domestic supply. The largest declines in this component, as a proportion of GDP, were in Belarus and Bosnia—both exceeded 100 percent. A corresponding decline in total losses occurred in Bosnia.
Electricity: Hidden Costs - Unaccounted Losses
0.0
2.0
4.0
6.0
8.0
10.0
12.0
14.0
16.0
18.0
20.0
Albania
Armen
ia
Azerba
ijan
Belarus
Bosnia
Bulgari
a
Croatia
Georgi
a
Kazak
hstan
Kyrgyz
Rep
ublic
Maced
onia
Moldov
a
Poland
Roman
ia
Russia
Serbia
and M
onten
egro
Tajikis
tan
Turkey
Ukraine
Uzbek
istan
Percent GDP
2000 2001 2002 2003
Average 2000 Average 2001 Average 2002 Average 2003
In constant 2001 US$, total hidden costs due to unaccounted losses for the entire Region declined by 29 percent during 2000-03 from US$ 4.6 billion to US$ 3.3 billion.16 The SEE and FSU-MI countries contributed most to this trend with total average losses declining 11 percent.
Hidden Costs—Collection Failure
As a proportion of GDP, hidden costs due to collection failures declined for the Region and in all countries accounted for less than 1.5 percent of GDP. Exceptions were Azerbaijan (3.2 percent of GDP in 2003) where collection rates remained comparatively low at 46 percent and Kyrgyz Republic (1.6 percent of GDP in 2003) where collection rates were around 69 percent. That being said Azerbaijan had the
15 Except Hungary and Turkmenistan for which data were not available for the entire four-year period. 16 Unaccounted losses are a function of the differential between total system losses and the normative losses; the residual can be affected and improved upon by minimising gaps in the transmission and distribution mechanism beyond the limitations of technology, and by reducing commercial losses.

13
largest proportional increase in collection rate over the period reflecting its low collection rate (16 percent) in 2000.
Electricity: Hidden Costs - Collection Failure
0.0
0.5
1.0
1.5
2.0
2.5
3.0
3.5
4.0
4.5
5.0
Albania
Armen
ia
Azerba
ijan
Belarus
Bosnia
Bulgari
a
Croatia
Georgi
a
Kazak
hstan
Kyrgyz
Rep
ublic
Maced
onia
Moldov
a
Poland
Roman
ia
Russia
Serbia
and M
onten
egro
Tajikis
tan
Turkey
Ukraine
Uzbek
istan
Percent GDP
2000 2001 2002 2003
Average 2000 Average 2001 Average 2002 Average 2003
Region-wide total hidden costs due to collection failure declined steadily from the US$ 3,226 million in 2000 to US$ 1,792 million in 2003 (in constant US$ terms) 17 Hidden costs due to commercial losses have declined as collection rates have improved. Across all ECA countries the average collection rate was 78 percent in 2000, rising gradually to 88 percent by 2003.18 Except for Azerbaijan and Georgia all countries had collection rates above 60 percent. Most countries had increases; the largest contribution to this trend was made by FSU countries. The FSU-LI countries had average collection rates of 63 percent in 2000 that rose to 73 percent in four years. FSU-MI countries in the aggregate, and notably Russia and Belarus as individual countries in that group increased their collection rate to beyond 100 percent in 2003– possibly due to collecting arrears and overdue payments.
Hidden Costs - Overall Trends:The Natural Gas Sector
As a proportion of GDP, overall hidden costs decreased between 2000 and 200219 from an average of 1.2 percent to 1.0 percent. They remained below 2.0 percent of GDP for all years and in all countries except Ukraine (in earlier years) and Uzbekistan where they were between 3.0 percent and 6.0 percent.
17 This excludes Hungary and Turkmenistan. 18 This excludes Turkmenistan for which no data were available for 2003. 19 Data are not presented for 2003 since the coverage was patchy.

14
Natural Gas: Hidden Costs - Total
0.0
0.5
1.0
1.5
2.0
2.5
3.0
3.5
4.0
4.5
5.0
5.5
6.0
Armen
ia
Azerba
ijan
Belarus
Bulgari
a
Croatia
Georgi
a
Kazak
hstan
Kyrgyz
Rep
ublic
Moldov
a
Poland
Roman
ia
Russia
Tajikis
tan
Turkey
Ukraine
Uzbek
istan
Percent GDP
2000 2001 2002 Average 2000 Average 2001 Average 2002
Region-wide hidden costs declined from US$ 6.6 billion in 2000 to US$ 4.7 billion in 2002. In absolute values, Ukraine had the largest decline in the three years to 2002 (a drop of US$ 749 million); in relative terms Poland had the largest decline of 64 percent in the same three years.
Natural Gas: Hidden Cost Components, 2002(selected for the year with more data points)
0.0
0.2
0.4
0.6
0.8
1.0
1.2
1.4
1.6
1.8
2.0
2.2
2.4
2.6
Armen
ia
Azerba
ijan
Belarus
Bulgari
a
Croatia
Georgi
a
Kazak
hstan
Kyrgyz
Rep
ublic
Moldov
a
Poland
Roman
ia
Russia
Tajikis
tan
Turkey
Ukraine
Uzbek
istan
US$ billion(Constant 2001 US$)
Unaccounted Losses Collection Failures Tariff Below Cost Recovery Average 2000
Average 2001 Average 2002 Average 2003
15
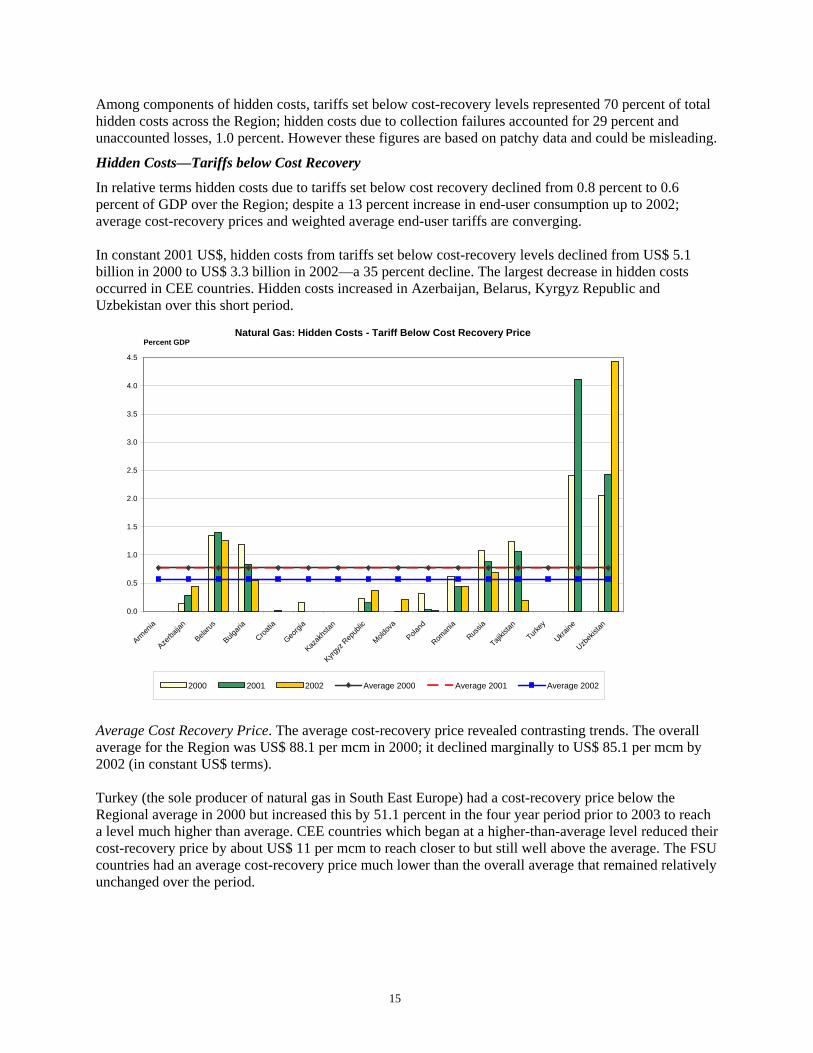
Among components of hidden costs, tariffs set below cost-recovery levels represented 70 percent of total hidden costs across the Region; hidden costs due to collection failures accounted for 29 percent and unaccounted losses, 1.0 percent. However these figures are based on patchy data and could be misleading.
Hidden Costs—Tariffs below Cost Recovery
In relative terms hidden costs due to tariffs set below cost recovery declined from 0.8 percent to 0.6 percent of GDP over the Region; despite a 13 percent increase in end-user consumption up to 2002; average cost-recovery prices and weighted average end-user tariffs are converging. In constant 2001 US$, hidden costs from tariffs set below cost-recovery levels declined from US$ 5.1 billion in 2000 to US$ 3.3 billion in 2002—a 35 percent decline. The largest decrease in hidden costs occurred in CEE countries. Hidden costs increased in Azerbaijan, Belarus, Kyrgyz Republic and Uzbekistan over this short period.
Natural Gas: Hidden Costs - Tariff Below Cost Recovery Price
0.0
0.5
1.0
1.5
2.0
2.5
3.0
3.5
4.0
4.5
Armen
ia
Azerba
ijan
Belarus
Bulgari
a
Croatia
Georgi
a
Kazak
hstan
Kyrgyz
Rep
ublic
Moldov
a
Poland
Roman
ia
Russia
Tajikis
tan
Turkey
Ukraine
Uzbek
istan
Percent GDP
2000 2001 2002 Average 2000 Average 2001 Average 2002
Average Cost Recovery Price. The average cost-recovery price revealed contrasting trends. The overall average for the Region was US$ 88.1 per mcm in 2000; it declined marginally to US$ 85.1 per mcm by 2002 (in constant US$ terms). Turkey (the sole producer of natural gas in South East Europe) had a cost-recovery price below the Regional average in 2000 but increased this by 51.1 percent in the four year period prior to 2003 to reach a level much higher than average. CEE countries which began at a higher-than-average level reduced their cost-recovery price by about US$ 11 per mcm to reach closer to but still well above the average. The FSU countries had an average cost-recovery price much lower than the overall average that remained relatively unchanged over the period.

16
Weighted Average End-User Tariff. The WAET varied widely across ECA countries—from a low US$ 6.1 per mcm for Uzbekistan to a high of US$ 154.5 per mcm in Poland (2000).20 Over the four years 2000-03, all ECA countries except Azerbaijan and Moldova increased the WAET (by 37 percent) but the spread of tariff rates actually increased. Uzbekistan and Russia more than doubled their WAET in just four years. Both had low levels of WAET in 2000 and thus greater scope for increase than other countries. Available data on residential and non-residential natural gas tariffs are very sketchy. Of the 22 countries in ECA, only 13 had data and only four among them had information across all four years of the review. In some countries for which data were available residential consumers received a discount; in Azerbaijan it was as high as 85 percent and growing. Belarus, which offered the highest discount on residential consumption in 2000 (87 percent), reduced the discount drastically to just 1.2 percent by 2003. In contrast, Georgia and Poland have consistently maintained a premium on domestic consumption (around 1.5 times). However overall, there were no consistent patterns of consumer groups receiving cross-subsidies, of whether the notion of cross-pricing was increasing or decreasing, or if countries in geographic proximity to one other followed similar pricing schemes. Additional data might clarify overall trends and patterns. The ratio of WAET to average cost-recovery tariff indicates a gap in pricing that contributes to hidden costs; a ratio greater than 100 percent might imply profit generation in the aggregate. As an average this ratio rose across ECA from 73 percent in 2000 to 104 percent in 2003. Country Weighted Average End-user Tariff %Change US$ per mcm 2000 2001 2002 2003 2000 - 2003 Armenia 68.59 66.33 65.32 72.15 5.19 Azerbaijan 27.23 23.00 18.71 21.27 -21.91 Belarus 31.45 31.12 29.80 41.19 30.97 Bulgaria 123.98 133.00 136.49 134.10 8.16 Croatia 196.94 223.73 269.01 Georgia 57.62 71.69 85.45 89.16 54.74 Kazakhstan 41.46 Kyrgyz Republic 59.80 58.74 57.85 75.23 25.80 Moldova 77.17 72.70 65.98 68.43 -11.32 Poland 154.48 195.13 194.89 190.01 23.00 Romania 76.22 81.07 76.87 89.95 18.02 Russia 10.26 11.02 12.83 21.95 113.96 Tajikistan 36.86 38.60 57.02 58.00 57.36 Turkey 131.58 140.04 149.61 166.97 26.90 Ukraine 43.92 40.28 63.18 58.88 34.07 Uzbekistan 6.14 6.36 10.93 20.47 233.24 Average 64.66 77.73 83.24 88.64 37.08 Average CEE 154.48 195.13 194.89 190.01 23.00 Average SEE 110.59 137.76 146.67 165.01 49.21 Average FSU-LI 47.63 48.20 51.61 57.81 21.38 Average FSU-MI 28.54 27.48 35.27 40.87 43.19
20 Data were not available for Albania, Bosnia, Hungary, Macedonia, Serbia and Montenegro, and Turkmenistan.

17
Hidden Costs—Collection Failure
Hidden costs due to collection failures remained largely unchanged over the period 2000–02 at around 0.4% GDP or around US$ 90 million. This is consistent with the relatively small changes in collection efficiency. Countries other than Tajikistan21 had very gradual improvements in their collection rates reflecting diminishing scope for potential revenue leakages on account of poor revenue collection institutions. There were marked differences in collection levels across the Region. Georgia maintained a low rate of 25 percent for the period, whereas Croatia, Moldova, Poland, and Turkey remained between 78 percent and 90 percent. No country, for which data were available, had a decline in the collection rate.
Natural Gas: Hidden Costs - Collection Failure
0.0
0.2
0.4
0.6
0.8
1.0
1.2
1.4
1.6
Armen
ia
Azerba
ijan
Belarus
Bulgari
a
Croatia
Georgi
a
Kazak
hstan
Kyrgyz
Rep
ublic
Moldov
a
Poland
Roman
ia
Russia
Tajikis
tan
Turkey
Ukraine
Uzbek
istan
Percent GDP
2000 2001 2002 Average 2000 Average 2001 Average 2002
Hidden Costs—Unaccounted Losses
Hidden costs due to unaccounted losses declined from 0.2 percent GDP to 0.1 percent GDP across the Region up to 2002. However this trend is based on limited and patchy data. In constant 2001 US$ terms, overall hidden costs due to unaccounted losses also decreased over the three years from US$ 109 million in 2000 to US$ 54 million in 2002. Total losses (arising from transportation and distribution losses) for most countries were below four percent of the domestic supply but there were instances of sporadic spikes in the rates—for example in 2001 Georgia was reportedly over 25 percent.
21 Tajikistan’s collection rates ranged 50-55 percent for three years then spiked to 100 percent in 2003.

18
Natural Gas: Hidden Costs - Unaccounted Losses
0.0
0.1
0.1
0.2
0.2
0.3
0.3
0.4
0.4
0.5
0.5
0.6
0.6
0.7
Armen
ia
Azerba
ijan
Belarus
Bulgari
a
Croatia
Georgi
a
Kazak
hstan
Kyrgyz
Rep
ublic
Moldov
a
Poland
Roman
ia
Russia
Tajikis
tan
Turkey
Ukraine
Uzbek
istan
Percent GDP
2000 2001 2002 Average 2000 Average 2001 Average 2002
3. FINANCIAL PERFORMANCE IN THE WATER SECTOR
Historically, water supply and sanitation services have been considered a social good and their provision has been heavily subsidized by the State. During transition, the water sector was well developed in most ECA countries; about 90 percent of the population had access to an improved water source.22 Direct water connection rates for urban populations ranged from over 52 percent in Armenia to 100 percent in the Czech Republic.23 Sector operations were heavily subsidized. On the demand side, the end consumer paid a very low share of the real cost of production and was billed based on norms set by the Government rather than actual consumption. On the supply side, water production and electricity prices were capped well below cost. As a result ECA countries inherited a massive infrastructure that had been designed and operated with no regard to energy efficiency, or supply and demand side water management mechanisms. Explicit or direct (operational) subsidies provided by the State to water utilities were discontinued in the early years of transition and today cash-strapped municipalities are rarely able to provide funds for capital renovation or new construction. Of 450 utilities surveyed by the OECD, EAP Task Force,24 only 15
22 World Bank, WDI and GDF database 23OECD EAP Task Force and www.ib-net.org 24 OECD (2003a), EAP Task Force, Data sets and performance indicators for Armenia, Azerbaijan, Georgia, Moldova, Kazakhstan, Kyrgyz Republic, Russian Federation, Tajikistan and Ukraine OECD (2003b), Urban Water Reform in Eastern Europe, Caucasus and Central Asia, Progress Since the Almaty Ministerial Conference

19
reported receiving additional funding from municipalities,25 mainly investment loans or grant programs sponsored by international donors. Notable exceptions are Belarus and Turkmenistan where subsidies are included in municipal budgets, and Hungary where a special fund provides direct subsidies to utilities with operational costs (and respectively tariffs) above the national average. Following tariff liberation and the economic downturn in the early years of transition, many water systems became uneconomic. Today most large and medium cities in ECA are served by water and waste water treatment networks that were constructed, or dramatically expanded, between 1950 and 1980. Lack of maintenance and a virtual absence of investment over the transition period have led to the rapid degradation of the sector, increased water losses and higher costs of operation. Increased metering, higher tariffs, and a corresponding reduction in per capita consumption have also been the main reasons for a decline in abstraction rates in most countries. Despite high levels of service coverage and an expanding connection rate in municipal areas, the reliability of water supplies is a common issue in many countries. Deteriorating infrastructure means that many utilities struggle to provide continuous (24 hr) service or deliberately initiate a program of intermittent water supplies to reduce short-term costs, especially electricity. Reducing operational hours creates savings that reduce short-run costs, but long-run costs can increase dramatically due to hydraulic shocks that destroy the water infrastructure and other effects that reduce water quality (when the network is down infiltration into supply mains takes place). To improve service provision and sector financial performance countries have remodeled the institutional framework for the sector. Initially they decentralized services and more recently they have initiated aggregate municipal services provision, in some cases to cover more than a single municipality. In the transition to a market economy in the early 1990s, water services were decentralized and assets were transferred to the municipal level in all countries except Slovakia, and to some extent Bulgaria. However today many countries are taking steps to reverse this trend. Except for the Czech Republic most countries have announced plans to aggregate municipal water services to simplify tariff regulation processes; establish national-level financial mechanisms for sector investment; and introduce economies of scale and the reallocation of revenues from larger to smaller utilities. This analysis focuses on the performance of water utilities to estimate the magnitude and proportions of hidden costs of providing the services. The indicators provide a measure of efficiency of the system from its abstraction through service delivery to revenue collection. The results discuss the true cost of receiving the services and thereby the degree of success in achieving some of the main goals of infrastructure reforms. An overview of consumption patterns is provided as a backdrop to this analysis. Please note that because the water sector is decentralized, national averages included in this review are based on statistics reported by utilities and have been derived from national averages based on a representative sample of urban utilities. There may therefore be differences between data reported by utilities and data presented through national surveys which will include statistics on the rural sector as well. The following sections present analysis for 2000-02 since for 2003 data are not consistently available for all countries.
25 State capitals (Chisinau, Yerevan, Tbilisi, Astana and Almaty) and the rest were mainly large cities.

20
Water Affordability
Water is affordable in most of the countries in the sample and is comparable with the USA and UK. To assess the affordability of tariffs for residential consumer groups, the ratio of the average annual residential water bill to the GNI per capita (used as a proxy for actual income data) has been considered.26 Using this measure, water bills remain critically high particularly in Moldova and Tajikistan where the average residential water bill is over 2.0 percent of the GNI per capita but in most countries rates are comparable with the average for the USA and UK. Tariffs are clearly very low in Poland, Belarus and the Kyrgyz Republic where the average residential water bill is less than 0.5 percent of the GNI per capita. This can indicate that average tariffs can be increased but does not address the needs of poorer sections of the community, for which other instruments are required.
The Affordability of Water Supplied to Residential Consumer Groups (Average annual residential water bill as a percentage of the GNI per capita, 2002)
0.00%
0.50%
1.00%
1.50%
2.00%
2.50%
3.00%
Turk
men
ista
n
Bela
rus
Kyrg
yz R
ep.
Pola
nd
Arm
enia
Kaza
khst
an
Geo
rgia
Azer
baija
n
Alba
nia
Cze
ch R
ep.
Rom
ania
Rus
sian
Fede
ratio
nBu
lgar
ia
Ukr
aine
Esto
nia
Latv
ia
Mol
dova
Tajik
ista
n
UK
USA
Water Access, Abstraction, and Consumption
Access to municipal water services is high in the Region; at over 50 percent for all countries and closer to 100 percent in the Czech Republic and Belarus. Access, measured as the percentage of residents with piped connections, has grown or remained stable in all countries over the period 2000-03. Growth has been mainly reported in large cities where utilities can afford new connections. Armenia, Azerbaijan, Bulgaria, and Kyrgyz Republic reported the lowest connection rates (less than 60 percent in 2002), which can be explained by their long tradition of individual water intakes and a well developed system of self dug wells. Water abstraction rates declined in most countries during 2000-02.27 Increased metering, higher tariffs, and a corresponding reduction in consumption are the main reasons for such trends. The decline has been most marked in Ukraine where abstraction rates dropped by 11 percent and Moldova, 25 percent. The large increase in Croatia’s water abstraction rates are attributed to the country’s economic recovery and an associated increase in industrial consumption.
26 This measure does not reflect regional variations in income. 27 Abstraction rates are calculated based on pump capacities and the period of operation of the pumps in most countries. Water abstraction is metered in the Czech Republic.

21
Differences between Public Survey and Utility Reported Data–
An Example for the Water Sector This report focuses on data reported by water utilities. Other common sources for statistics are public surveys which provide a view of the water sector from the perspective of the consumer. It is interesting to note that these two sources can present quite different pictures. Consider the issue of service coverage. Public surveys show overall water service coverage rates rather than piped connections in urban areas which is the indicator tracked by utilities. The data obtained from public surveys typically shows degradation in service provision and is collected at a national rather than municipal level. The example provides a comparison of national survey and utility reported data:
National Survey Data,
Water Access (%) (2002)
Utility Reports, Piped Connection Rates (%)
(2002)
Difference (%)
Armenia 88 52 36 Belarus 76 100 -24 Bulgaria 100 55 45 Georgia 82 85 -3 Hungary 100 100 0 Kazakhstan 95 85 10 Kyrgyz Republic 83 59 24 Moldova 98 78 20 Poland 97 94 3 Romania 99 92 7 Russia 80 89 -9 Tajikistan 67 74 -7 Uzbekistan 72 70 2
Public surveys report better access in Moldova, Kyrgyz Republic, Armenia and Bulgaria when compared with utility statistics and this reflects the availability of other water sources to supplement utility provided services. In Belarus, where municipal water systems are well developed, the lower access level reported through national surveys reflects the poor level of service available to the rural population who typically use shallow wells for potable water.
Water Abstraction Rates Have Declined (2002 as a % of 2000 abstraction volumes)
70 75 80 85 90 95 100 105 110
CroatiaGeorgia
Kyrgyz RepublicSerbia and Montenegro
BelarusAlbania
ArmeniaRussian Federation
KazakhstanBulgaria
Czech RepublicTajikistan
AzerbaijanPoland
UkraineMoldova

22
There has been a corresponding decline in water consumption over 2000-04. The volume of water billed to consumers (by utilities) has been used as a proxy for water consumption since metering levels vary significantly across countries. Per capita consumption is artificially high in Azerbaijan, Belarus, Central Asia (except the Kyrgyz Republic), Ukraine, and Georgia reflecting low metering rates and utilities’ practice of recovering costs through (high) consumption norms.
Average Daily Water Consumption per Capita (lpcd, billed by utilities to households)
Country 2000 2001 2002 2003 Albania 130 126 Armenia 134 121 165 Azerbaijan 232 216 216 Belarus 201 199 Bulgaria 86 79 79 77 Croatia 220 Czech Rep. 114 113 Estonia 103 Georgia 645 669 646 655 Kazakhstan 166 146 144 Kyrgyz Rep. 76 79 72 Latvia 213 178 Lithuania 147 135 Moldova 221 186 147 137 Poland 116 112 109 108 Romania 248 137 Russian Federation 179 170 163 158 Tajikistan 321 298 309 Turkey 94 Turkmenistan 421 Ukraine 251 230 214 197 Uzbekistan 220 Despite high levels of service coverage and expanding connection rates in municipal areas, water supplies are unreliable in many countries. Statistics collected through national surveys show that less than 65 percent of households report 24-hour access to water services in capital cities, and less than 50 percent in secondary cities and rural areas. Utilities report poor supply rates particularly in Albania, Armenia, Azerbaijan and Moldova.28 Also, in some areas, average daily water supply rates mask significant Regional differences. For example, in Ukraine water supply averages 19 hours per day however supply in the fifth largest oblast, Lviv, averages 12 hours per day,29 and supply rates average between 5 and 10 hours per day in many places in the oblasts of Zakarpatskya, Nikolayevskaya, and Donetskaya.
Hidden Costs – Overall Trends
In relative terms, hidden costs as a proportion of GDP increased from 0.9 percent in 2000 to 1.2 percent in 2002. Hidden costs in all countries and for all years are below 2.5 percent of GDP, except in Armenia and Moldova. Among the components of hidden costs, the component due to unaccounted losses represented 28 Hours of service have continued to decline in Moldova from an average of 18 hours per day in 2000 to around 10 to 12 hours per day in 2002-2003. 29 Although this has increased from 8 hours a day in 2000

23
50 percent of hidden costs (in absolute terms) in 2002; followed by tariffs set below cost at 43 percent of the total, and poor collections at 7.0 percent.
Water: Hidden Cost Components, 2002
0
100
200
300
400
500
600
700
800
Armen
ia
Azerba
ijan
Belarus
Bulgari
a
Czech
Rep
ublic
Estonia
Georgi
a
Kazakh
stan
Kyrgyz
Repu
blicLa
tvia
Moldov
a
Poland
Romania
Russia
Tajikis
tan
Ukraine
US$ million(Constant 2001 US$)
Unaccounted Losses Collection Failures Tariff Below Cost Recovery
In the Region overall, the aggregate value of hidden costs in the water sector (in constant 2001 US$) declined between 2000 and 2002 by about 30 percent from US$ 2.5 billion in 2000 to US$ 1.8 billion in 2002. The largest declines in hidden costs were for Russia and Tajikistan—around 70 percent in each country in the same period. The larger countries (Russia, Poland, and Ukraine) have the highest level of hidden costs in monetary terms.
Hidden Costs – Unaccounted Losses
Hidden costs due to unaccounted losses rose from an average of 0.6 percent of GDP to 0.9 percent of GDP in the three years to 2002—or in absolute terms from US$ 626 million to US$ 939 million. FSU countries contributed most to this increasing trend. This is consistent with deterioration in the integrity of the supply networks demonstrated by a rise in total system losses (the difference between water abstracted and water billed) from 32 percent in 2000 to 39 percent in 2002. The greatest increase in losses occurred in the FSU-LI countries maybe indicating deterioration in supply networks; although in absolute terms losses in Azerbaijan were the lowest across all countries.

24
Water: Hidden Costs - Total
0.0
0.5
1.0
1.5
2.0
2.5
3.0
3.5
4.0
4.5
5.0
Armen
ia
Azerba
ijan
Belarus
Bulgari
a
Czech
Rep
ublic
Estonia
Georgi
a
Kazakh
stan
Kyrgyz
Repu
blicLa
tvia
Moldov
a
Poland
Romania
Russia
Tajikis
tan
Ukraine
Percent GDP
2000 2001 2002 2003Average 2000 Average 2001 Average 2002 Average 2003
In countries where reported losses are low, factors influencing this trend may include the transfer of losses to consumers through artificially high consumption norms (with limited metering); and the low development of the water network (in the case of Azerbaijan and Tajikistan). Specifically, reported losses in Russia, Ukraine, Kazakhstan and Azerbaijan should be treated with caution since metering in these countries is limited, and consumption norms are also high in Russia, Ukraine, and Kazakhstan. In Armenia, Bulgaria, and Estonia, utilities have increased attention on their operations and introduced more metering so that reported losses are higher than in other countries in the Region.
Hidden Costs – Tariff below Recovery Cost
This component of hidden costs is on account of pricing structures where tariffs are set below the cost of providing water services to the consumers. Overall hidden costs due to tariff set below cost-recovery levels decreased 31 percent from US$ 1140 million to US$ 785 million, led by a large decline in FSU-MI countries (55 percent over the period). However, data for 2003 while not covering all countries showed an overall increasing trend. As a percentage of GDP this has remained between 0.4-0.5 percent on average. The applied tariff policy remains a key element of sector sustainability as it provides revenue for operations and ensures financial stability for the water service provider. In most countries in this sample, municipalities set tariffs for utilities.30
30 In Slovakia, water tariffs are proposed by the operating company and then approved by the municipality.

25
Decrease in Per Capita Water Consumption due to Increased Metering in Two Cities in Moldova,
Chisinau, and Balti, between 1996 and 2003 Declining abstraction and consumption rates translate into substantial lost revenue and higher unit costs of operation as utilities continue to operate below design capacity; facilities in Moldova were built in line with the SNIP construction code that are considered excessive for current operations and require the provision of water in the range 265-400 lpcd. Similar standards were applied in many countries in the Region. In Moldova, between 1996 and 2003, abstraction and consumption have declined, a trend that is that is clearly linked to changes in the level of metering.
0%
10%
20%
30%
40%
50%
60%
70%
1996 1997 1998 1999 2000 2001 2002 2003Year
Water metering rate, %
- 100
200
300
400
500
600
700
Consumption, lpcd
Balti- metering Chisinau- metering Balti- consumption, lpcd Chisinau- consumption, lpcd
Source: Moldova performance indicators report, 2004. Moldova Apa Canal/OECD

26
Water: Hidden Costs - Tariffs Below Cost Recovery
0.00
0.20
0.40
0.60
0.80
1.00
1.20
1.40
1.60
1.80
2.00
Armen
ia
Azerba
ijan
Belarus
Bulgari
a
Czech
Rep
ublic
Estonia
Georgi
a
Kazak
hstan
Kyrgyz
Rep
ublic
Latvi
a
Moldov
a
Poland
Roman
ia
Russia
Tajikis
tan
Ukraine
Percent GDP
2000 2001 2002 2003
Average 2000 Average 2001 Average 2002 Average 2003
Water: Hidden Costs - Unaccounted Losses
0.0
0.5
1.0
1.5
2.0
2.5
3.0
3.5
4.0
Armen
ia
Azerba
ijan
Belarus
Bulgari
a
Czech
Rep
ublic
Estonia
Georgia
Kazakh
stan
Kyrgyz
Rep
ublic
Latvia
Moldova
Poland
Romania
Russia
Tajikista
n
Ukraine
Percent GDP
2000 2001 2002 2003Average 2000 Average 2001 Average 2002 Average 2003

27
Most countries in the Region apply a cost-plus approach when setting tariffs for water services.31 The definition of cost varies significantly. In former Soviet Union countries, except Estonia, tariffs include only operating and maintenance costs and depreciation. However, in the Czech Republic, Croatia, and Poland an investment component is also included in the tariff formula and is calculated on the basis of long-term development plans for respective utilities. Countries with a national regulator in place have moved to more advanced tariff regulation. For example, Bulgaria, Kosovo, and Romania are introducing advanced tariff-setting procedures (e.g., price-caps)32 to protect foreign investors from local currency depreciation. In Romania and the Czech Republic the tariff formula is pegged to the exchange rate, transferring exchange rate risks to the consumer. Average Cost Recovery Price. The Average Cost Recovery Price (ACRP) is the average actual cost of providing water to the end user and is defined as the cost per cubic meter of supplying water 24 hours per day. The ACRP rose across the Region from an average of US$ 0.35 per m3 in 2000 to US$ 0.55 per m3 in 2003. The ACRP was highest in the SEE countries at US$0.75 per m3 on average, and was three times the average rates of FSU-MI countries of US$0.23 per m3 in 2003. All countries showed an increase in the ACRP over the period with the highest increase in Russia (91 percent); although Russia’s average cost-recovery price in 2003 was still one of the lowest in the sample. Weighted Average End-user Tariffs. The weighted average end-user tariff (WAET) increased across the Region from US$ 0.21 per m3 in 2000 to US$ 0.32 per m3—or 11 percent—most of this in the last year. Only in Belarus did the WAET decrease during 2000-03. Most countries in the Region set tariffs rates for non-residential consumers higher than tariff rates for residential consumers except for Bulgaria, the Czech Republic, Kazakhstan, and Romania. In Azerbaijan, Belarus, Georgia, Kyrgyz Republic, Moldova and Russia non-residential tariffs exceed cost-recovery levels thereby providing a subsidy to residential consumer groups. Subsidized services for privileged population groups (war veterans, former state employees, etc.) are widely reported across the sample, however, in practice, many of these declared subsidies are rarely paid to the utility. In the Czech Republic (since 1998), Kazakhstan, and Estonia (both since 2000) privileges for selected consumer groups (in the form of a lower tariff) have now been replaced with monetary compensation. Tariffs set below cost recovery and subsidized services contribute to low operating revenues. In the Region operating revenues fall below the cost of water consumed, in some countries by as much as 50 percent—Armenia, Azerbaijan, Georgia, and Romania.
31 The tariff consists of costs and a profit margin calculated as a percentage of total costs, which is usually set on an arbitrary basis and depends on numerous subjective factors. 32 The type of regulation establishes an upper limit on consumer prices. As the regulated operator knows the maximum price it can charge, the saving on costs during the term of the price-cap becomes part of the rate of return to the operator. In Ukraine a price-cap formula is allowed but is not practiced. However ‘price caps’ have proved to be vulnerable to exchange rate shocks in Latin America and the Caribbean and are a source of renegotiation, and movement towards a hybrid system.

28
Country Weighted Average End-user Tariff US$ per m3 2000 2001 2002 2003 Armenia 0.08 0.10 0.09 Azerbaijan 0.06 0.07 0.08 Belarus 0.07 0.07 0.03 0.05 Bulgaria 0.36 0.42 0.51 0.55 Czech Republic 1.09 1.17 Estonia 1.22 Georgia 0.04 0.04 0.04 0.05 Kazakhstan 0.12 0.13 0.14 Kyrgyz Republic 0.06 0.07 0.08 Latvia 1.0 Moldova 0.16 0.22 0.25 0.26 Poland 0.35 0.41 0.5 0.56 Romania 0.30 Russia 0.06 0.08 0.18 0.18 Tajikistan 0.03 0.04 0.04 Ukraine 0.11 0.10 Average 0.21 0.22 0.32 0.26 Average CEE 0.72 0.79 0.91 0.56 Average SEE 0.36 0.42 0.51 0.43 Average FSU-LI 0.07 0.09 0.10 0.13 Average FSU-MI 0.09 0.10 0.12 0.12
Water: (1) Tariffs as a Percentage of the Average Cost Recovery Price (2002)(2) Operating Revenues as a Percentage of the Cost of Water Consumed (2002)
0
20
40
60
80
100
120
140
160
180
200
220
240
260
280
Armenia
Azerba
ijan
Belarus
Bulgaria
Czech
Repu
blic
Estonia
Georgia
Kazakh
stan
Kyrgyz
Rep
ublic
Latvia
Moldova
Poland
Romania
Russia
Tajikista
n
Ukraine
Percent
Residential Tariff [%ACRP] Non Residential Tariff [%ACRP] Operating Revenues as% Cost of Water Consumed

29
Water Utilities and Tariffs Country Utility Status No. of
Utilities Utility Ownership Tariff Setting
Agency Tariff Formula
Albania Municipal 54 Municipal Municipality Cost-plus Armenia National
(Yerevan and Armavir- municipal)
3 Management contract (1); State (1) National level Cost-plus
Azerbaijan National company
1 Municipalities with water services (42) National level Cost-plus
Bulgaria Regional (28), Municipal (23)
51 State (13), Municipal (21), Mixed (state- municipal) (16), Private- municipal (1)
National regulator Cost-plus, price-cap by end 2005
Belarus Municipal 205 State company/ municipal Municipal Cost-plus Croatia Municipal 135 State company/ municipal Municipal Cost-plus (inc.
investment component) Czech Republic
Municipal, Regional
>200 Private utilities (85 percent), Municipal (15 percent)
Municipal Cost-plus
Estonia Municipal 183 Private 1 LLC 30 Municipal 152
Municipal Cost-plus
Georgia Municipal 130 Municipal Municipal Cost-plus Hungary Municipal 370 Municipal Municipal Cost-plus (inc.
Government reallocation of funds)
Kazakhstan Municipal 125 LLC33 (>20), Municipal (>100) Municipal/ Regional anti-monopoly committee
Cost-plus
Kyrgyz Republic
Municipal 50< LLC (10), Private (1), Municipal (35) Municipal Cost-plus
Latvia District level 33 Municipal (7), District (26) Municipal/ district Cost-plus Lithuania Municipal 46 Municipal JSC (46), Rural (700) Municipal Cost plus Macedonia, FYR
Regional (opstina) Skopje- municipal
84 (consolidated
from 123)
Regional (83), Municipal (1) Regional Cost-plus
33 Limited liability Company with substantial portion of shares in hands of municipality.

30
Country Utility Status No. of Utilities
Utility Ownership Tariff Setting Agency
Tariff Formula
Moldova Municipal 51 Municipal Municipal with
regulatory power on central level
Cost-plus
Poland Municipal 200 Municipally owned and operated (87.6 percent), state owned and operated (6.9 percent), privately operated (5.2 percent), mixed with the dominance of municipal (0.3 percent)
Municipal Cost-plus
Romania Municipal 74 Private (2), Municipal (72), Municipal combined with other services (482)
National regulator Price-cap (under implementation)
Russian Federation
Municipal >1,500 Municipal (20), privately operated (>14,870)
Municipal, approved by the Regional authority
Cost-plus
Slovak Republic
Regional/ Municipal
11 Regional (5), Large municipal (6) (incl. 1 with 49 percent of the private capital)
Regional Cost-plus
Serbia and Montenegro
Serbia Regional and municipal; Montenegro municipal; Kosovo Regional
About 200 Serbia (167), Montenegro (25), Kosovo (7) Municipal for Serbia and Montenegro; National for Kosovo
Cost-plus; In Kosovo with national redistribution
Tajikistan Municipal 56 4 large municipal companies (Dushanbe, Khujant, Chkalovsk and Nurek) and 52 sub-divisions of the state water company
Municipal Cost-plus
Turkey Municipal >500 Private, Municipal, Regional, National Municipal Cost-plus Turkmenistan Regional 5 Regional Cabinet of
Ministers Water is free
Ukraine Municipal 261 Private (36), LLC (9), Municipal (220) Municipal Cost-plus (price-cal is allowed, but not practiced)
Uzbekistan Municipal/ State 80 Municipal Municipal Cost-plus

31
Hidden Costs—Collection Failure
This component of hidden costs arises on account of less-than-perfect collection of tariffs billed to consumers for their consumption (based on metered consumption plus norms). Overall hidden costs due to collection failures declined from US$ 714 million in 2000 to US$ 137 million in 2002 showing improved collection performance. FSU-MI countries had the highest decline. As a percent of GDP, this remained largely unchanged at around 0.1 percent.
Water: Hidden Costs - Collection Failures
0.00
0.05
0.10
0.15
0.20
0.25
0.30
0.35
0.40
Armen
ia
Azerbaijan
Belarus
Bulgaria
Czech
RepublicEsto
nia
Georgia
Kazakh
stan
Kyrgyz
RepublicLatvia
Moldov
aPoland
RomaniaRussi
a
Tajikista
n
Ukraine
Percent GDP
2000 2001 2002 2003
Average 2000 Average 2001 Average 2002 Average 2003
Collection rates are high in most countries of the sample and are generally reported to be at or above 75 percent in both the residential and non-residential sectors. Some countries report collection rates of over 100 percent due to repayment of outstanding debts accumulated over preceding years;34 in Yerevan (Armenia) in 2003, outstanding debts were forgiven for consumers that agreed to install meters and pay amounts on metered readings. Residential sector collection rates are rising everywhere, especially where meters are being installed. In Eastern Europe high collection rates may be attributed to an increased payment discipline. In the former Soviet Union and Romania this could be explained by artificially low tariff levels and the fact that water services are not considered a burden by many consumers.
34 In most former USSR countries the outstanding accounts receivable cannot be converted into debt regardless of the non-payment period. In Kazakhstan, the “bad debt” legally becomes a cost item to a utility and can be put into its cost after 23 months of non-payment.

32
In other countries collection rates declined dramatically when tariffs increased rapidly. Residential collections reportedly dropped by 50 percent in Odessa and Nikolayiv (Ukraine) in 2002, when tariffs were increased from US$ 0.10 per m³ to US$ 0.15 per m³.
Other Factors Providing Insight to Financial Performance
Working Ratio
The working ratio indicates how adequate revenues are when compared with operational costs. It is calculated as the annual operating cost divided by the annual operating revenue. Adjusted for the consumer price index (CPI) and the opportunity cost of capital35 only the Czech and Kyrgyz Republics reported a working ratio below 1.0 in 2002. In the same year, Albania, Armenia, Belarus, Bulgaria, Georgia, Romania reported a working ratio above 1.25.
Water: Working Ratio, 2002
0.00
0.20
0.40
0.60
0.80
1.00
1.20
1.40
1.60
1.80
2.00
2.20
Armen
ia
Azerba
ijan
Belarus
Bulgari
a
Czech
Rep
ublic
Estonia
Georgi
a
Kazak
hstan
Kyrgyz
Rep
ublic
Latvi
a
Moldov
a
Poland
Roman
iaRus
sia
Tajikis
tan
Ukraine
Working Ratio CPI Bond interest
Staffing
In Russia and the CIS countries36 for which this indicator was available, labor costs exceeded 15 percent of total revenues; labor costs were 35 percent or more in Belarus and Tajikistan in 2002. Over the four-year period 2000-03 the trend remained stable, but in regional groups there was a decline of 26 percent of the labor cost as a percentage of total revenues in SEE countries, a 9.8 percent decline in the FSU-MI group but a rise of 14.5 percent in FSU-LI countries.
35 Measured by the municipal bond interest; the interest on the lowest revenue instrument which reflects opportunity cost of investments in the water sector. 36 Armenia, Azerbijan, Georgia, Kazakhstan, Kyrgyz Republic, Moldova, Tajikistan and Ukraine.

33
High labor costs could be due in part to staffing levels; many utilities in Russia and CIS countries of this sample continue to retain large costly labor forces. In 2002 staffing levels for water supply services were reported to be three to five employees per 1000 consumers; the average UK ratio for the period was 0.3-1.0 employee per 1000 consumers.37
Water: Labor Cost as a Percentage of Total Revenue
0
5
10
15
20
25
30
35
40
45
50
Armen
ia
Azerba
ijan
Belarus
Bulgari
a
Czech
Rep
ublic
Estonia
Georgi
a
Kazak
hstan
Kyrgyz
Rep
ublic
Latvi
a
Moldov
a
Poland
Roman
ia
Russia
Tajikis
tan
Ukraine
Percentage
2000 2001 2002 2003Average 2000 Average 2001 Average 2002 Average 2003
Low labor productivity in sampled countries is another component of hidden costs. Labor productivity, measured as the volume of water supplied to the system per employee per year, provides a correlation between utility efficiency and end-user consumption. Labor productivity rose from an average of US$ 4,411 per employee per year in 2000 to US$ 6,058 per employee per year in 2003—a rise of 37 percent. However this sample covers only 10 countries of the FSU and productivity varies widely from a low of around US$ 1,000 per employee (Tajikistan) to a high of around US$ 8,000 (Moldova) in 2003.
4. FINANCIAL PERFORMANCE IN THE TRANSPORT SECTOR
This section examines financial performance in the transport sector, but focuses on expenditure on roads and budget support to the rail subsectors. The Hidden Costs Calculator model is difficult to apply to the transport sector because transport is fundamentally different from the power, water, and natural gas sectors. In addition, the transport sector lacks consistent data sources over time, and country data lack sufficient commonalty for meaningful comparison.
Rail Sector
The rail systems in ECA vary greatly in their size and the extent to which the rail network serves the country. The Region includes Russia, the largest country by area in the world, and Moldova and Armenia some of the smallest. Rail networks in Russia, Ukraine, and Poland are the largest in the Region, while
37 http://www.ib-net.org/wb/bench/uk.html

34
line density, or the size of the network as a proportion of total land area, is higher in countries of Eastern Europe. The railway systems in these countries vary for many reasons including their geo-political history, country location, and main economic activities (high production levels of bulk natural resources such as coal, ores, or oil would influence the network size and density); international trading patterns; and population density and distribution.38 At the time of transition railways, which had carried a large share of transport activity during the Soviet era, lost about half of their traffic volume. Despite declining traffic volumes the government, for political reasons, was reluctant to downsize large rail networks and the financial health of the railway sector deteriorated rapidly beginning in the early 1990s. The substantial drop in traffic was attributed mainly to economic restructuring (reducing heavy industry production and manufacturing; increasing competition from the road sector; rapid growth in vehicle ownership. Recently financial performance in the rail sector has varied across the Region. In central and eastern Europe, imminent accession to the European Union has driven the relatively quick implementation of reforms to address the overwhelming and growing debt burden. Such reforms included the full separation of railway freight and passenger services as well as infrastructure and operating functions. Public Service Obligation (PSO) contracts have been established in some countries whereby the government pays for service provision when costs are not fully covered by fare structures. Although, EU accession countries have been prompt reformers in the rail sector, efforts to increase private sector involvement are still in progress. Relative to central and Eastern Europe, railway reforms have been delayed in the CIS countries although major structural reforms are under implementation in Russia and Kazakhstan. Some of the issues faced today in the operation and financing of railways, are linked to past practices, such as 100 percent state ownership; using revenues from freight services to cross subsidize less profitable passenger travel; applying non-transparent government subsidies to cover the cost of losses and/ or arrears railway infrastructure provision; or neglecting railway maintenance and delaying replacement of rolling stock.
Rail Sector Network and Usage
The size of the rail networks of Russia and to a lesser extent Ukraine and Poland dwarf those of the rest of the Region (measured in route-km). However the countries of Eastern Europe, particularly the Czech Republic, Slovakia, Hungary, Slovenia, and Poland, have high line densities—the extent to which a country is served by rail network—ranging from 0.06 to 0.12 route-km/ km2 of land. Over the period 2000-03, changes in the network and line density in ECA have been small. Rail traffic39 has been most significant in Russia, Ukraine, and Poland, commensurate with their sizable networks, and was high in the Czech Republic, Hungary, and Romania, countries noted for high density rail networks.
38 The World Bank (January 2005). Reform, Commercialization, and Private Sector Participation in Railways in Eastern Europe and Central Asia, Paul Amos, Transport Papers (TP-4). 39 Measured in million train-km, train activity provides a measure of combined traffic on both freight and passenger networks.

35
Traffic density, measured in thousands of traffic units40 per route-km was high in Russia, Ukraine, and Belarus, the Baltic states of Estonia, Latvia, and Lithuania. Freight represented over 60 percent of traffic
in most countries, and 90 percent or more in the Baltic States, the South Caucasus, and Russia. Albania and Kosovo were the only countries with a higher proportion of passenger traffic. Hungary had an equal share of passenger and freight traffic. Traffic density has generally increased over the period 2000-03 with Moldova reporting a more than 80 percent increase.
Across the Region freight services have had an overall increase and passenger traffic has decreased from 2000-03. Moldova reported considerable increases in freight services (+95 percent), Bosnia (+46 percent), Croatia (+42 percent). Passenger traffic declined most notably in Serbia (-35 percent), Estonia (-30 percent), Lithuania (-29 percent), Bulgaria (-27 percent), Belarus (-25 percent) and also in Macedonia (-48 percent); in the latter case there was also a corresponding decline in freight activities.
Factors Influencing Financial Performance
State Budget Support
While the level of State Budget support is presented below as one indicator of railway performance it should be viewed with caution when measured over a short period (1 - 4 years). In years when budget support is lower railways often simply cut back on long-term maintenance or rehabilitation and this measure may be misleading in financial performance. This measure is also difficult when comparing across countries due to variations in state public budgeting and policy choices. State budget support is presented for nine countries where data have been available for the years 2000-02. The data set spans three countries in CEE, six in SEE and two FSU-LI countries. In relative terms state 40 Traffic Unit (TU) = Passenger km + Freight km
Traffic Density, (000 TU per km)
02,0004,0006,0008,00010,000
19,442
11,037
0% 50% 100%
KosovoAlbaniaBosnia
ArmeniaMacedonia
Serbia CroatiaTurkey
BulgariaHungaryRomania
Czech Rp.MoldovaSlovenia
PolandSlovakiaGeorgia
AzerbaijanLithuania
LatviaBelarusEstoniaUkraineRussia
Freight traffic Passenger traffic

36
budget support as a percentage of GDP remained unchanged across the entire group for the three years at an average of around 0.4 percent or below. However this masks a 24 percent increase in CEE countries and a drop of 24 percent in countries of SEE. Sate support was lowest in Poland and Estonia and peaked in Croatia in 2002 at just over 1.0 percent of GDP.
Rail: State Budget Support - Total as a Percentage of GDP
0.00
0.10
0.20
0.30
0.40
0.50
0.60
0.70
0.80
0.90
1.00
1.10
1.20
Azerbaijan Bulgaria Croatia Estonia Georgia Hungary Kosovo Poland Romania Serbia Slovakia
Percent
2000 2001 2002 Average 2000 Average 2001 Average 2002
In absolute terms, overall State budget support increased by 7.6 percent from US$ 775 million to US$ 834 million for the six countries with data spanning the three-year period. The greatest decrease (34 percent) was in Poland from US$ 244 million to US$ 162 million. There was a marginal increase in State budget support in Estonia (<1.0 percent) and Romania (1.9 percent) in the same time frame. State budget support was highest in Hungary in 2002 (over US$290 million). Viewed as a ratio of the total number of traffic units, state budget support and operating costs and PSO support increased on average over the period driven by large increases in operating costs and PSO support in the Czech Republic (165 percent). The average state budget support per traffic unit was US$ 0.010 in 2000 and rose to US$ 0.022 in 2003; operating costs and PSO support per traffic unit rose from an average of US$ 0.009 in 2000 to US$ 0.012 in 2003. Croatia had the highest levels over the period in both cases.

37
Rail: Overall State Budget Support per Traffic Unit
0.000
0.010
0.020
0.030
0.040
0.050
0.060
0.070
Armen
ia
Azerba
ijan
Bulgari
a
Croatia
Czech
Rep
ublic
Estonia
Georgi
a
Hunga
ry
Kosov
o
Poland
Roman
iaSerb
ia
Slovak
ia
Sloven
ia
US$ per Traffic Unit(Constant 2001 US$)
2000 2001 2002 2003
Average 2000 Average 2001 Average 2002 Average 2003
Working Ratio
The working ratio provides an indication of the adequacy of revenues compared to the costs of operation. The picture was mixed in 2002, the year for which data are available for most countries. Eight of 17 countries had a working ratio below 1.0. Working ratios were above 2.5—significantly high—in Bosnia, Serbia, and Turkey. The average working ratio across the entire group was 1.29. On average it was below 1.0 for CEE countries (0.74 average), FSU-LI (0.78 average) and FSU-MI (0.5 average) and averaged 1.78 in of SEE countries that year. In 2002, unit operating costs across the Region averaged US$ 0.06 and exceeded both unit passenger revenues of US$ 0.018 and freight revenues of US$ 0.025. Operating costs on average were significantly greater in the SEE country group at US$ 0.09. In FSU country groups, unit operating costs and revenues were significantly below the Regional average. On average in all country groups freight revenues exceeded passenger revenues on a unit basis. Croatia, Estonia, Latvia, Lithuania and Romania were the only countries in the sample where passenger revenues exceeded freight revenues on a unit basis. At the same time, freight fares in this same group also exceeded passenger fares in contrast to other countries in the Region. In absolute terms freight revenues exceeded costs on a unit basis in four countries (Azerbaijan, Georgia, Latvia, Lithuania). Unit operating costs were highest in Bosnia at US$ 0.29 and lowest in Georgia at US$ 0.003. Costs ranged widely for passenger and freight revenues on a unit basis; freight revenues were highest in Macedonia (US$ 0.059) and lowest in Russia (US$ 0.008); passenger revenues were lowest in Turkey at US$ 0.001 and highest in Bosnia at US$ 0.035.

38
Rail: Unit Operating Costs and Revenues, 2002[Bosnia - Operating Cost per TU, US$ 0.293]
0.000
0.010
0.020
0.030
0.040
0.050
0.060
0.070
0.080
0.090
0.100
0.110
0.120
0.130
0.140
0.150
Armen
ia
Azerba
ijan
Belarus
Bosnia
Bulgari
a
Croatia
Czech
Rep
ublic
Estonia
Georgi
a
Hunga
ry
Kosov
oLa
tvia
Lithu
ania
Maced
onia
Poland
Roman
ia
Russia
Serbia
Slovak
ia
Sloven
ia
Turkey
Ukraine
US$ Constant 2001
Freight Revenue per tonne-km Passenger Revenue per pass-kmOperating Cost per TU Average Freight Revenue per tonne-kmAverage Passenger Revenue per pass-km Average operating Cost per TU
Staffing
Labor costs exceeded 60 percent of total revenues in many countries in the SEE and CEE groups over 2000-03 and exceeded 100 percent of total revenues in Bosnia, Croatia, Serbia, Slovenia, and Turkey. Over the three-year period to 2002 labor costs as a percentage of total revenues rose across the group from an average of just under 60 to about 80 percent despite a slight decline in staffing (averaging 11 percent). Staff productivity rose from an average of 453 thousand traffic units (TU) per employee in 2000 to 528 thousand TU per employee in 2003. The largest increases were in the CEE group at 43 percent and FSU-LI group at 55 percent. Macedonia alone experienced significant decline (34 percent) in productivity concomitant with a large reduction in staff.

39
Rail: Labor Costs as a Percentage of Total Revenues[Turkey: 359% (2002)]
0
20
40
60
80
100
120
140
160
180
Armen
ia
Azerba
ijanBosn
ia
Bulgaria
Croatia
Czech
Rep
ublic
Hunga
ry
Kosovo
Lithua
niaPolan
d
Romania
Serbia
Slovak
ia
Sloven
iaTurk
ey
Percent
2000 2001 2002 2003
Average 2000 Average 2001 Average 2002 Average 2003
Rail: Staff Productivity[Estonia: 1642 thousand TU per employee (2001); 2639 thousand TU per employee (2002)]
0
100
200
300
400
500
600
700
800
900
1000
1100
1200
1300
1400
1500
Armenia
Azerba
ijan
Belarus
Bosnia
Bulgaria
Croatia
Czech R
epublic
Estonia
Georgia
Hungary
Kosovo
Latvia
Lithuania
Macedonia
Poland
Romania
Russia
Serbia
Slovakia
Slovenia
Turkey
Ukraine
Thousand TUPer Employee
2000 2001 2002 2003Average 2000 Average 2001 Average 2002 Average 2003

40
Road Sector
Most countries in the Region have a legacy of extensive road networks constructed to serve a centrally planned economy, the former Soviet Union, and few roads were designed with adequate capacity and durability. During the early years of transition road networks worsened significantly in most ECA countries. Infrastructure problems have been largely due to insufficient fund allocation for maintenance and rehabilitation. Inadequate maintenance has effectively reduced the size of national road networks in many countries through downgrading badly deteriorated roads. Responsibility for some roads has been transferred to poorer local authorities such as municipalities and other regional governments and they have even fewer resources for maintenance and rehabilitation. The early transition years in many countries were accompanied by an economic downturn and restructuring of the transport sector, which led to a significant decline in all modes of transportation. Specifically, most of the Region experienced a decline in railway traffic that precipitated a significant mode shift away from railways to roads.
Road Use and Quality
The trend toward motorization has been rising for the last decade in ECA except for Latvia and Russia, where the number of trucks and buses declined. From 2000-03 the number of vehicles has been increasing in Croatia, Hungary, Latvia, Lithuania, Moldova, Russia, Serbia, and Turkey (between 5.0 percent and 23 percent) and a comparable increase occurred in passenger cars (5.0-18 percent), trucks (1.0 percent-113 percent) and buses (2.0–14 percent). Vehicle ownership has also increased at unprecedented rates, despite the slow growth in the economy and recessionary periods.41 In 2003, vehicle ownership, measured as the number of vehicles per 1000 people, varied from a low of 73 in Turkey and a high of 452 in Lithuania with most countries being in the 150 to 350 range. While overall vehicle ownership rates lag those of the EU-15 average, they are above the world average of 45.8 vehicles per 1000 inhabitants.42
Traffic Density (2003)[Vehicles per km of Motorw ay, Main and Secondary Road Netw ork]
0
50
100
150
200
250
Bosnia Croatia Hungary Latvia Lithuania Moldova Russia Serbia Tajikistan Turkey
Transport networks remain in poor condition in most countries. Even the new EU member states that have had faster rates of economic recovery have road networks that are rated in fair-to-poor condition. In the rest of the Region, particularly in FSU countries, most road networks are in poor condition.
41 Vehicle ownership by household is higher in capital and other urban areas than in rural areas (for most countries) and ranges from a low of 10 percent (of households owning vehicles) in Albania, Moldova, and Tajikistan to over 40 percent in Lithuania, Poland and Serbia (Hamilton 2004). 42 Worldwide the number of four- plus wheeled vehicles per 1000 inhabitants varies from low of around 0.2 to a high of 933.1 with a mid value of 45.8.

41
Road Condition[% of total road length, 2003 or most recent available year]
0% 10% 20% 30% 40% 50% 60% 70% 80% 90% 100%
MotorwaysMain Roads
Secondary RoadsMotorways
Main RoadsSecondary Roads
MotorwaysMain Roads
Secondary RoadsMotorways
Main RoadsSecondary Roads
MotorwaysMain Roads
Secondary RoadsMotorways
Main RoadsSecondary Roads
MotorwaysMain Roads
Secondary RoadsMotorways
Main RoadsSecondary Roads
MotorwaysMain Roads
Secondary RoadsMotorways
Main RoadsSecondary Roads
MotorwaysMain Roads
Secondary Roads
Aze
rbai
jan
Bul
garia
Cro
atia
Hun
gary
La
tvia
Lith
uani
aM
oldo
vaR
oman
iaS
erbi
aTa
jikis
tan
Turk
ey
Poor Fair Good
Traffic density and car ownership have grown but maintenance and network upgrades have not kept pace. Most roads need major rehabilitation, require remedies for access control and upgrade, and some have inadequate capacity for future transport needs.
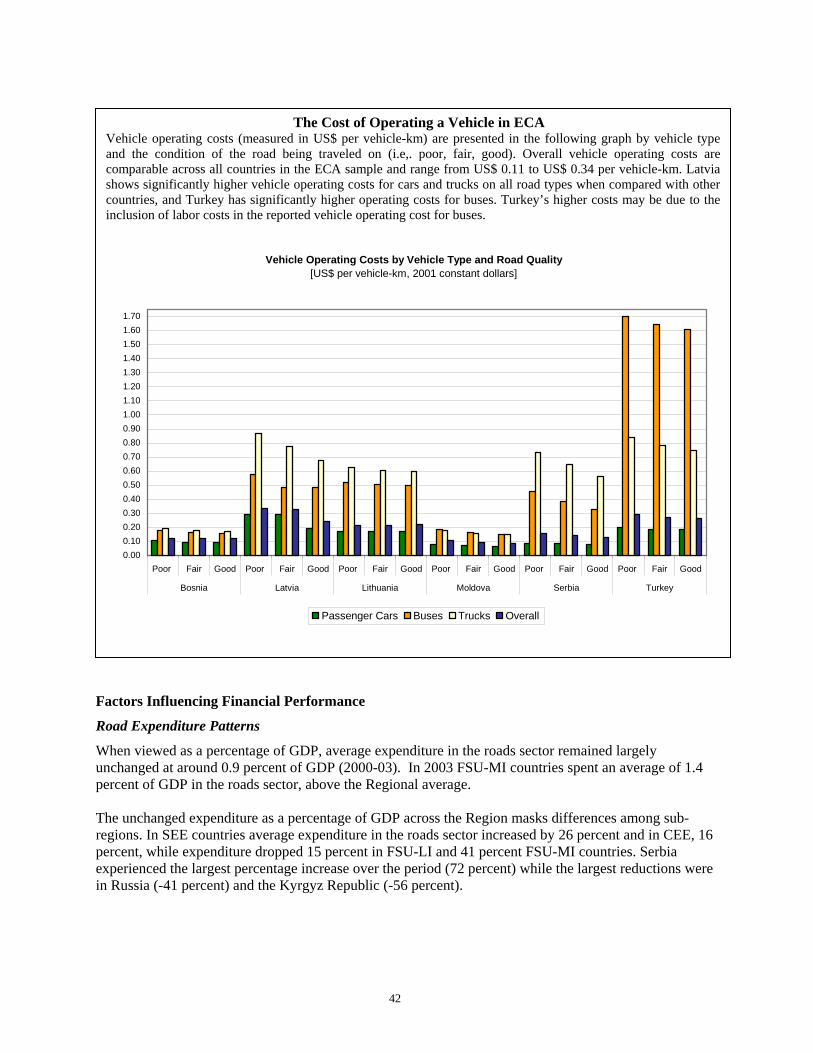
42
Factors Influencing Financial Performance
Road Expenditure Patterns
When viewed as a percentage of GDP, average expenditure in the roads sector remained largely unchanged at around 0.9 percent of GDP (2000-03). In 2003 FSU-MI countries spent an average of 1.4 percent of GDP in the roads sector, above the Regional average. The unchanged expenditure as a percentage of GDP across the Region masks differences among sub-regions. In SEE countries average expenditure in the roads sector increased by 26 percent and in CEE, 16 percent, while expenditure dropped 15 percent in FSU-LI and 41 percent FSU-MI countries. Serbia experienced the largest percentage increase over the period (72 percent) while the largest reductions were in Russia (-41 percent) and the Kyrgyz Republic (-56 percent).
The Cost of Operating a Vehicle in ECA Vehicle operating costs (measured in US$ per vehicle-km) are presented in the following graph by vehicle type and the condition of the road being traveled on (i.e,. poor, fair, good). Overall vehicle operating costs are comparable across all countries in the ECA sample and range from US$ 0.11 to US$ 0.34 per vehicle-km. Latvia shows significantly higher vehicle operating costs for cars and trucks on all road types when compared with other countries, and Turkey has significantly higher operating costs for buses. Turkey’s higher costs may be due to the inclusion of labor costs in the reported vehicle operating cost for buses.
Vehicle Operating Costs by Vehicle Type and Road Quality[US$ per vehicle-km, 2001 constant dollars]
0.000.100.200.300.400.500.600.700.800.901.001.101.201.301.401.501.601.70
Poor Fair Good Poor Fair Good Poor Fair Good Poor Fair Good Poor Fair Good Poor Fair Good
Bosnia Latvia Lithuania Moldova Serbia Turkey
Passenger Cars Buses Trucks Overall

43
Road: Actual Expenditure as a Percentage of GDP
0.00
0.20
0.40
0.60
0.80
1.00
1.20
1.40
1.60
1.80
2.00
2.20
2.40
Azerba
ijan
Bosnia
Bulgari
a
Croatia
Hunga
ry
Kyrgyz
Rep
ublic
Latvi
a
Lithu
ania
Moldov
a
Roman
ia
Russia
Serbia
Turkey
Percent
2000 2001 2002 2003Average 2000 Average 2001 Average 2002 Average 2003
Across the Region, US$ 8.9 billion was spent in the roads sector for the 13 countries in the sample. Actual expenditure in dollar terms rose 9.0 percent from an average of US$ 625 million to US$ 681 million. This average is distorted by expenditure in Russia (representing 64 percent of expenditure overall in 2003). Average expenditure in FSU-LI countries was significantly lower than other sub-regional groups at US$ 26.8 million in 2003. Expenditure in absolute terms increased most significantly in Serbia (+291 percent), while the only decreases were in the Kyrgyz Republic (-41 percent) and Russia (-7 percent). In priorities for expenditure, across the Region most attention was paid to routine maintenance and repair followed by new construction and finally, rehabilitation. These are discussed in turn below. Expenditure on routine maintenance and repair . Expenditure on routine maintenance and repair increased over the period 2001-03 by 16 percent from US$ 2.8 billion to US$ 3.3 billion.43 There was an increase across all sub-regional groups, the most significant being the FSU-LI countries at +130 percent. Average expenditure on routine maintenance and repair varied widely in dollar terms across sub-regional groups: FSU-LI (US$ 4.9 million), CEE/ SEE (US$ 79-81 million), and Russia (US$ 2.6 billion), all in 2003. Bulgaria increased expenditure on routine maintenance and repair by 172 percent and Serbia by 289 percent over the four years from 2000-03; Turkey’s expenditure decreased by 17 percent.
43 Data for 2000 are not presented because no 2000 data were available for Russia.

44
Road: Actual Expenditure Routine Maintenance and Repair[Russia: US$ 2.4 billion (2001), US$ 2.5 billion (2002), US$ 2.6 billion (2003)]
0
50
100
150
200
250
300
Azerba
ijan
Bosnia
Bulgari
a
Croatia
Hunga
ry
Kyrgyz
Rep
ublic
Latvi
a
Lithu
ania
Moldov
a
Roman
ia
Russia
Serbia
Turkey
US$ million(Constant 2001 US$)
2000 2001 2002 2003Average 2000 Average 2001 Average 2002 Average 2003
New construction. New construction data were limited or nonexistent for FSU countries. In CEE and SEE countries, average expenditure on new construction increased 41 percent from US$ 871 million to US$ 1,225 million overall, average expenditure from US$ 87 million to US$ 122 million. Expenditure in SEE countries was significantly above this average at US$ 174 million in 2003, and a similar difference was experienced in preceding years. There were significant increases in this area in Croatia (75 percent), Lithuania (108 percent) and Serbia (81 percent) while there was a drop over the period in Hungary of 11 percent. Rehabilitation. Expenditure on rehabilitation rose from US$ 154 million to US$ 228 million overall or on average terms from US$ 17 million to US$ 23 million (33 percent) over the period 2000-03. This Regional picture reflects expenditure in only SEE and CEE countries since data were unavailable for the FSU countries. In their difference, SEE increased expenditure in this area by 25 percent and CEE countries by 43 percent. This however hides a mixed picture at a country level. For example: Bulgaria (-40 percent), Hungary (-38 percent), Croatia (+102 percent) and Lithuania (+478 percent).

45
Road: Actual Expenditure New Construction[Russia: US$ 0.62 billion (2000), US$ 0.94 billion (2001), US$ 1.07 billion (2002), US$ 0.80 billion (2003)]
0
10
20
30
40
50
60
70
80
90
100
110
120
130
140
Azerba
ijan
Bosnia
Bulgari
a
Croatia
Hunga
ry
Kyrgyz
Rep
ublic
Latvi
a
Lithu
ania
Moldov
a
Roman
ia
Russia
Serbia
Turkey
U$ million2001 Constant
2000 2001 2002 2003
Average 2000 Average 2001 Average 2002 Average 2003
Road: Actual Expenditure Rehabilitation
0
10
20
30
40
50
60
70
Azerba
ijan
Bosnia
Bulgari
a
Croatia
Hunga
ry
Kyrgyz
Rep
ublic
Latvi
a
Lithu
ania
Moldov
a
Roman
ia
Russia
Serbia
Turkey
US$ million(Constant 2001 US$)
2000 2001 2002 2003
Average 2000 Average 2001 Average 2002 Average 2003
Actual road expenditure over the four-year period met or exceeded planned expenditure overall across the sample on aggregate and rose from an average of 100 percent of planned expenditure to 165 percent of planned expenditure. However data were available for only 10 of 14 countries. No data are available for

46
Russia and the FSU-LI group is also sparsely represented in this picture. On average CEE countries spent 250 percent above planned expenditure, and SEE countries spent 130 percent or more for the period. Data are more limited for examining the purpose of the planned expenditure captured in the ratio of actual to planned expenditure, e.g., maintenance or construction. No discernable pattern emerged over the eight countries where data were available. For example in 2003, routine maintenance and repair averaged 113 percent of planned expenditure ranging between 19 percent in Moldova and 500 percent in Hungary; new construction averaged 183 percent of planned expenditures, ranging from 40 percent in Ukraine to 480 percent in Hungary; rehabilitation averaged 70 percent of planned expenditures, ranging from 40 percent in Lithuania to 100 percent in Ukraine. Attempts to collate and review data pertaining to the financing the roads sector were thwarted because only four countries had readily available information and even those data did not include all years in the review.
Linking Annual Growth in Freight Transport with Expenditure on Maintenance and Rehabilitation in the Road Sector
Increases in road freight transport are closely linked to economic growth. However increased freight can also increase damage to the road network, which increases expenditures for maintenance and rehabilitation. During the period under review, Bosnia and Moldova have experienced growth in freight transport at annual rates of 4.4 percent and 13.2 percent respectively. This growth has been accompanied by an annual growth in maintenance and rehabilitation expenditure of 15.7 percent in Bosnia and 8.6 percent in Moldova. In contrast in both Hungary and Turkey freight activity has decreased annually around 2.0 percent but each country has a different pattern of expenditure. In Hungary annual expenditure on maintenance and rehabilitation increased by 8.6 percent and in Turkey it decreased by 28.3 percent.

47
REFERENCES
Albania (2003), National Water Association Report Belarus Ministry of Environment (2004), Environment Status Report (in Russian) BERCEN (2002), Report on Current Legal Structure and Resources Available to the Environmental
Protection Agencies and Inspectorates in Romania Bosnia and Herzegovina (2002), Assessment of Sustainable Development of Bosnia and Herzegovina for
Johannesburg Bulgaria (2002), Bulgaria Wastewater Equipment Market Research Bulgaria (2004), Bulgaria, New Strategy and Water Regulatory Commission, Water Investment
Conference, Paris Christopher Willoughby, Phil Anderson, “ECA Railways: Trends, Prospects and Challenges”, Working
Paper No.10, World Bank, 1999 Croatia (2003), National Statistics Report on Collection, Purification and Distribution of Water Czech Republic (2001), Report on State and Water Management in the Czech Republic Czech Republic (2004), Report of the Ministry of Agriculture EBRD (2003), Bosnia and Herzegovina Strategy EBRD (2005), Strategy for Croatia EIU (2005), Lithuania, Country Profile ENERDATA, http://www.enerdat.fr ERRANET,http://www.erranet.org/Products/Tariff/Database/TariffIndex Estache, Antonio and Katharina Gassner. 2004. “Recent Economic Developments in Electricity and
Water Sectors in ECA Countries: Basic facts and emerging issues”. Mimeo Estonia (2003), Current Status of Water Sector Restructuring in Estonia Estonia, Investment Profile 2001-2004 Fraser Julia and Louis S. Thompson (1993), “World Bank's Railway Database”, World Bank
Infrastructure Note No. RW-6 Hamilton (2004), Dimensions of Urban Poverty in ECA, World Bank HELCOM (2002), On Water Pricing and Cost-Recovery in Baltic Countries Hungarian Environmental Centre (2004), Assessment and Development of Municipal Water and
Wastewater Tariffs and Effluent Charges in the Danube River Basin

48
IB-NET, www.IB-NET.org; International Union of Railways (2002), “International Railway Statistics
2001” International Union of Railways (UIC), http://www.uic.asso.fr/home/home_en.html ISPA (1995 – 2005), Press releases on water and sanitation grants ISPA (2000 – 2004), Increasing Involvement of the Local Authorities of the Baltic States in the EU
Enlargement Process ISPA (2001), National ISPA Strategy for Slovenia Environmental Sector Jane’s World Railways, http://jwr.janes.com Jane’s, “World Railways Yearbook 2003-2004” Kennedy, David, Samuel Fankhauser, and Martin Raiser (2003), “Low Pressure, High Tension: The
Energy-Water Nexus and Regional Co-operation in the CIS-7 Countries”, Mimeo Krishnaswamy, Venkataraman, and Stuggins (2003), Private Participation in the Power Sector in Europe
and Central Asia: Lessons from the Last Decade. World Bank Working Paper No. 8, World Bank Lampietti, Julian (Ed.) (2004), Power’s Promise: Electricity Reforms in Eastern Europe and Central Asia.
World Bank Working Paper No. 40, World Bank Lesley Hemphill et al, Urban Studies Journal No. 41 on Sustainable Urban Regeneration Performance Louis S. Thompson (1996), “Rail Restructuring in the CEE Countries and Turkey,” Vienna Railway
Roundtable MAKCID (2003), Overview of National Policies and Development Plans in Macedonia MEIF (2004), Assisting Small and Medium Towns in Financing their Water Needs Millennium Development Goals OECD www.oecd.org/document/49/0,2340,en_2649_34343_1839281_1_1_1_1,00.html OECD (2003a), EAP Task Force, Data sets and performance indicators for Armenia, Azerbaijan, Georgia,
Moldova, Kazakhstan, Kyrgyz Republic, Russian Federation, Tajikistan and Ukraine OECD (2003b), Urban Water Reform in Eastern Europe, Caucasus and Central Asia, Progress since the
Almaty Ministerial Conference PriceWaterhouseCoopers (2004), Method of Evaluation of Investment Needs, Financing Strategies and
Consequences of Water Pricing Republica Srpska (2003), Platform for Reconstruction of Water Supply and Communal Infrastructure in
Republica Srpska

49
Romania (2001), Bucharest Romania, Strategy for Development of the Public, Transport and Communal Services
Romania (2003), Romania Investment Guide Saavalainen Tapio and Joy Ten Berge (2004), Energy Conditionality in Poor CIS Countries, IMF
Working Paper Serbia and Montenegro (2002), Serbia and Montenegro, Recent Progress on Structural Reforms Svetislav Orlic, Anthony Pellegrini and Louis S. Thompson (1994), “The Development of the Railways in
Central and Eastern Europe”, World Bank TACIS (2001), Belarus Water Tariff Systems Thomson, Peter (2004), “Structural Issues in the Georgian Gas Sector”, World Bank, Mimeo UNDP/GEF (2004), Assessment and Development of Municipal Water and Wastewater Tariffs and
Effluent Charges in the Danube Basin, Danube Regional Project, Hungarian Environmental Centre
UNMIK (2004), Regulation 2004/39 on Activities of Water, Wastewater and Waste Services Providers World Bank (2000), Azerbaijan Republic, Energy Sector Quasi Fiscal Deficit Assessment World Bank (2002a), Belarus, Building Blocks for Sustainable Future World Bank (2002b), Federal Republic of Yugoslavia, Environmental Sector Review World Bank (2003a) Latvia, ICR for Municipal Services Development Project World Bank (2003b) National Survey of Household Welfare and Program Participation NOBUS World Bank (2003c), Achieving the Human Development MDGs in ECA World Bank (2003d), ICR Klaipeda Environment Project World Bank (2003e) Ukraine: Challenges Facing the Gas Sector World Bank (2004a), Montenegro, Water Supply and Sanitation Report World Bank (2004b), Infrastructure Action Plan (FY05), Urban Anchor Proposal World Bank (2004c), Azerbaijan: Issues and Options Associated with Energy Sector Reform World Bank (2004d), ECA Infrastructure Regional Flagship Publication: Concept paper World Bank (2005), Turkey Urban Water and Wastewater Management Review (in print) World Bank Railway Database (RDB): http://www.worldbank.org/transport/rail/rdb.htm World Bank (2006), ECSIE Flagship Report: Characteristics of Road Networks in ECA

50
ANNEX 1. CALCULATING HIDDEN COSTS IN THE ENERGY AND WATER SECTORS
The model to calculate “Hidden Costs” in the infrastructure sector is described below. While there are more detailed and complex ways in which a model could be developed to reflect a loss in specific countries and sectors, this model has been formulated specifically to provide an insight into three key components of hidden costs: poor collections, tariffs set below cost-recovery levels and losses above normative levels. The intention in developing this model is to enable trends to be monitored and to benchmark across sectors and countries without the need for intensive data collection efforts. Let H be the “Hidden Costs” in the (electricity, gas or water) sector, defined as: H = R* - R ……………………………. (1) Where, R* is the expected revenue in a system operating with tariffs that cover costs, where bills are paid and where losses are within normal levels expected for a system of that age and design. R is the actual revenue. If, Qs, is the volume (electricity, gas or water) supplied to the transmission network. Qe, is the end-user consumption (of electricity, gas or water) Lm, are the losses in transmission and distribution (of electricity, gas or water). Lm includes normative losses, Ln where Ln are those losses that are expected in a system of that design and age as well as losses due to system inefficiencies outside norms and theft. Then, Qs = Qe + Lm …………………………… (2) And, R* = (Qs – Ln) Tc ……………………….. (3) Where Tc defined as the cost-recovery tariff, is the long run cost of operation and maintenance and includes a reasonable allowance for investment and normative losses. And, R = (Qs – Lm) Te Rct ................................ (4) Where Te is defined as the weighted average end-user tariff, and Rct is the rate of collection of billed amounts. Substituting for R* and R in (1), using (3) and (4), then H = (Qs – Ln) Tc – (Qs – Lm) Te Rct
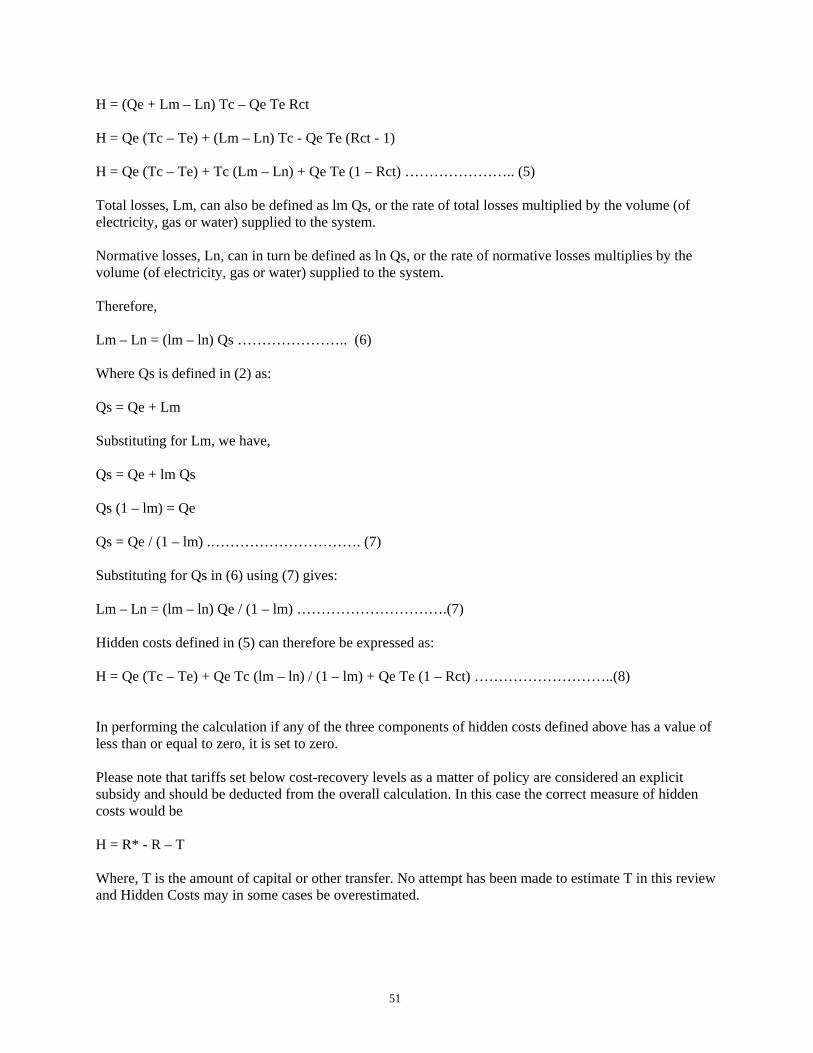
51
H = (Qe + Lm – Ln) Tc – Qe Te Rct H = Qe (Tc – Te) + (Lm – Ln) Tc - Qe Te (Rct - 1) H = Qe (Tc – Te) + Tc (Lm – Ln) + Qe Te (1 – Rct) ………………….. (5) Total losses, Lm, can also be defined as lm Qs, or the rate of total losses multiplied by the volume (of electricity, gas or water) supplied to the system. Normative losses, Ln, can in turn be defined as ln Qs, or the rate of normative losses multiplies by the volume (of electricity, gas or water) supplied to the system. Therefore, Lm – Ln = (lm – ln) Qs ………………….. (6) Where Qs is defined in (2) as: Qs = Qe + Lm Substituting for Lm, we have, Qs = Qe + lm Qs Qs (1 – lm) = Qe Qs = Qe / (1 – lm) .…………………………. (7) Substituting for Qs in (6) using (7) gives: Lm – Ln = (lm – ln) Qe / (1 – lm) ………………………….(7) Hidden costs defined in (5) can therefore be expressed as: H = Qe (Tc – Te) + Qe Tc (lm – ln) / (1 – lm) + Qe Te (1 – Rct) ………………………..(8) In performing the calculation if any of the three components of hidden costs defined above has a value of less than or equal to zero, it is set to zero. Please note that tariffs set below cost-recovery levels as a matter of policy are considered an explicit subsidy and should be deducted from the overall calculation. In this case the correct measure of hidden costs would be H = R* - R – T Where, T is the amount of capital or other transfer. No attempt has been made to estimate T in this review and Hidden Costs may in some cases be overestimated.

52
Key Assumptions Adjustment of Financial Data to Constant US$ (2001) In all cases currency tabulations for each year have been reported in constant US$ 2001. Most original data were obtained in year-specific local currency units. They were converted to US$ using the average annual exchange rate (local currency to US$) as reported in the World Bank World Development Indicators and subsequently calibrated to constant 2001 US$ using the US$ deflator series also in the World Development Indicators. While using country-specific purchasing power parity indices would have generated similar constant 2001 US$ currency values, this option was not chosen as data were not available for purchasing power parity for all the countries and for all the periods included in the review. Normative Loss Rates While most variables range significantly by country, it is possible to make assumptions regarding the normative loss rate ln. In the event that country specific data are unavailable we would suggest the use of: 0.1 (electricity), 0.02 (gas) and 0.2 (water). Specific Assumptions Made in Manipulating Data in the Water Sector In the water sector five specific assumptions have been made:
(i) The calculation of overall hidden costs is based on municipalities and urban settlements with centralized water services where the population is above 5,000. Rural settlements have been excluded from the calculation of subsidies as there is no systematic data collection and information gathering.
(ii) The normative level of water losses has been assumed to be 20 percent of produced
water. This level is representative of developed water systems in England and Wales.44
(iii) To enable cross-country comparisons, indicators used in the calculation of overall hidden costs have been extrapolated from per capita average values that have been available for a representative sample of utilities. In extrapolating to a national average, per capita values have been multiplied by the urban population in the country. The result is considered to be representative for the following reasons: (a) for Russia, the data set covers more than 90 municipal water and sewerage utilities in four regions of the country45 serving over 7.6 million residents or 5.2 percent of total population; (b) in Ukraine the data set covers more than 60 municipal water and sewerage utilities in four oblasts46 serving over 5.8 million residents or 10 percent of total population; and (c) for smaller countries the data set covers between 20 percent (for Kazakhstan) and 100 percent of the total urban population (Moldova and Armenia).
44 http://www.wrcplc.co.uk/worldbank 45 Samara oblast, Krasnodar krai, Leningrad oblast, Perm oblast, and several others from northwest Russia 46 Kharkiv, Mykolayiv, Lviv, and Transcarpatia

53
(iv) Average water tariffs have been calculated as the cost per cubic meter actually billed to a consumer (vs. declared tariffs) using data reported by the utilities to calculate the average tariff for an entire year. This approach avoids inconsistencies due to privileges for different consumer groups in different countries and cities.
(v) It is assumed that all assets have a life span of 25 years to ensure service standards are
maintained. While this period is short it reflects the Soviet standard that is practiced in all countries of the review.
Calculation of Average Cost Recovery Price in the Water Sector Cost-recovery tariffs are defined as the cost of supplying water 24 hours a day, including the cost of operation, maintenance and necessary investments. Where an average cost-recovery price has not been available the following assumptions have been made in its calculation: ACRP = [Current cost of operation] + [24 hours-a-day supply factor] + [Investment component] Where: Current cost of operation, C - The actual reported operation and maintenance cost collected from the OECD data set or by using the IB-NET toolkit. 24 hours-a-day supply factor, T - To reduce short-term costs, especially electricity costs, water utilities initiate intermittent water supply. Reducing operational hours results in some savings that reduce costs in the short run, but long-run costs increase dramatically due to hydraulic shocks that destroy the water infrastructure and other effects that reduce water quality. It has been assumed that savings incurred through interrupted water supplies are equal to one-quarter of the cost of maintaining supplies round the clock due to energy savings and reduced short-term maintenance. As a rule, intermittent water supply does reduce consumption. Here, T = 0.25 C (1 – (t/24)) Where, t = number of hours of water supply Investment Component, I - Assumed to be equivalent of 4 percent of the value of the assets per year on the basis that assets have a life span of 25 years to ensure service standards are maintained. The fixed asset value is reported in IB-NET. I = 0.04 A / P Where, A = fixed asset value in US$ P = annual water production in m3 Therefore the Average Cost Recovery Price, ACRP equals ACRP = C + T + I ACRP = C + 0.25 C (1 – (t/24)) + 0.04 A/ P

54
For example: The water system of the country N provides water services 12 hours a day supplying 100,000 cubic meters of water a day to its consumers. The fixed asset value is $100 million (approximately $100 per capita). The reported cost of water services is $0.10 per cubic meter. ACRP is calculated as follows: C = US$ 0.10 per m3 T = 0.25 US$ 0.10 per m3 (12/24) = US$ 0.013 per m3 I = 0.04 US$ 100,000,000 / (365 x 100,000 m3 per day) = US$ 0.109 per m3 And ACRP = US$ 0.10 per m3 + US$ 0.013 per m3 + US$ 0.109 per m3 = US$ 0.22 per m3

55
Hidden Cost Calculations Calculated Hidden Costs – The Power Sector Country
Hidden Costs: Unaccounted Losses [US$
million, 2001 constant]
Hidden Costs: Collection Failures [US$ million,
2001 constant]
Hidden Costs: Tariff Below Cost Recovery [US$ million,
2001 constant]
Hidden Costs: Total [US$ million, 2001 constant]
Hidden Costs: Total [% GDP]
2000 2001 2002 2003 2000 2001 2002 2003 2000 2001 2002 2003 2000 2001 2002 2003 2000 2001 2002 2003 Albania 168 131 143 135 36 19 16 14 193 165 133 98 397 315 292 247 10.49 7.41 6.14 4.16 Armenia 9 9 11 18 16 25 12 5 3 12 0 5 28 46 23 27 1.42 2.19 0.98 1.00 Azerbaijan 53 36 27 14 243 161 189 219 320 379 283 210 616 577 498 443 11.40 10.10 8.11 6.42 Belarus 12 14 0 0 191 140 24 0 125 121 84 0 327 275 108 0 2.51 2.22 0.75 0.00 Bosnia 53 45 41 0 0 20 0 4 199 190 172 92 251 255 212 96 5.40 5.08 3.85 1.42 Bulgaria 157 120 131 133 88 95 102 74 975 889 845 521 1220 1104 1079 729 9.45 8.12 7.04 3.80 Croatia 42 65 34 59 140 139 145 187 207 205 214 8 390 409 392 253 2.07 2.06 1.75 0.91 Georgia 208 121 118 127 124 65 59 50 49 34 38 53 381 220 216 230 12.21 6.85 6.45 5.97 Kazakhstan 218 213 163 140 141 148 159 175 262 274 267 69 621 635 589 384 3.31 2.87 2.43 1.33 Kyrgyz Republic 122 283 211 83 20 9 12 29 119 93 77 57 261 385 301 169 18.64 25.23 19.02 9.16 Macedonia 10 11 19 14 25 0 0 28 149 112 114 209 184 123 132 252 5.01 3.59 3.54 5.57 Moldova 98 110 52 51 28 0 0 0 17 4 0 0 143 114 52 51 10.84 7.68 3.20 2.71 Poland 168 259 169 173 92 105 0 0 163 2228 1850 1376 423 2592 2019 1549 0.25 1.40 1.07 0.76 Romania 176 186 183 155 102 110 119 43 1162 1179 812 533 1440 1474 1114 731 3.80 3.67 2.47 1.33 Russia 976 1062 916 525 680 947 790 0 12593 8909 8874 3708 14249 10918 10579 4233 5.36 3.56 3.11 1.01 Serbia and Montenegro 254 248 113 193 128 118 221 1529 1536 1137 1290 1977 1912 1368 1744 22.45 16.52 8.86 8.70 Tajikistan 20 20 15 30 8 13 8 9 257 238 255 209 286 272 279 248 28.18 24.95 22.95 16.53 Turkey 1467 1408 954 1035 637 663 758 449 1482 991 295 0 3586 3062 2008 1484 1.76 2.11 1.11 0.64 Ukraine 377 466 449 368 391 285 218 147 2139 1838 1656 1413 2907 2588 2323 1928 9.08 6.81 5.56 4.03 Uzbekistan 15 0 2 219 71 80 171 139 1119 1079 1077 802 1205 1159 1251 1159 8.55 10.16 13.11 12.05 Total 4604 4805 3753 3280 3227 3153 2900 1793 23062 20477 18184 10652 30892 28436 24836 15958 Total CEE 168 259 169 173 92 105 0 0 163 2228 1850 1376 423 2592 2019 1549 Total SEE 2327 2213 1618 1531 1222 1174 1258 1021 5897 5268 3722 2751 9446 8655 6597 5535 Total FSU-LI 525 579 437 543 511 354 452 450 1884 1839 1731 1336 2919 2771 2620 2329 Total FSU-MI 1583 1755 1528 1033 1403 1520 1190 322 15119 11142 10881 5189 18104 14417 13600 6545

56
Calculated Hidden Costs – The Natural Gas Sector Country
Hidden Costs: Unaccounted Losses [US$ million, 2001
constant]
Hidden Costs: Collection Failures [US$ million, 2001
constant]
Hidden Costs: Tariff Below Cost Recovery [US$ million,
2001 constant]
Hidden Costs: Total [US$ million, 2001 constant]
Hidden Costs: Total [% GDP]
2000 2001 2002 2003 2000 2001 2002 2003 2000 2001 2002 2003 2000 2001 2002 2003 2000 2001 2002 2003 Armenia 0 13 7 4 3 0 0 0 0 0 7 4 4 13 0.38 0.19 0.15 0.48 Azerbaijan 4 1 2 3 64 51 38 43 8 16 27 16 76 68 67 62 1.40 1.19 1.09 0.89 Belarus 2 1 2 1 72 72 0 0 175 174 180 77 250 247 182 78 1.92 1.99 1.29 0.46 Bulgaria 1 8 3 7 23 22 19 16 153 113 85 173 177 144 107 195 1.37 1.06 0.70 1.01 Croatia 3 6 2 2 0 22 24 3 0 0 3 31 26 2 0.02 0.16 0.11 0.01 Georgia 19 1 25 43 41 5 0 0 0 30 62 42 0 0.95 1.95 1.24 0.00 Kazakhstan 191 191 0.66 Kyrgyz Republic 2 1 0 0 3 2 6 0 6 3 6 0 0.41 0.20 0.40 0.00
Moldova 1 1 0 9 9 9 15 0 0 3 2 10 9 12 17 0.77 0.63 0.76 0.91 Poland 55 42 43 164 214 207 535 53 22 39 755 309 272 39 0.44 0.17 0.14 0.02 Romania 2 8 143 135 7 34 236 176 200 104 381 319 208 138 1.00 0.79 0.46 0.24 Russia 200 89 127 2865 2683 2348 1644 3065 2772 2475 1644 1.15 0.90 0.72 0.39 Tajikistan 0 3 8 8 11 0 13 12 2 2 21 20 13 5 2.04 1.92 1.14 0.39 Turkey 623 192 224 260 0 0 0 0 192 224 260 623 0.09 0.15 0.14 0.27 Ukraine 31 55 388 312 441 383 771 1566 0 113 1190 1934 441 496 3.72 5.09 1.05 1.03 Uzbekistan 9 9 116 96 145 291 277 423 125 416 383 568 125 2.95 3.36 5.93 1.29 Total 109 150 54 651 1415 1303 1332 491 5055 5077 3298 2485 6578 6529 4684 3628 Total CEE 55 42 43 0 164 214 207 0 535 53 22 39 755 309 272 39 Total SEE 7 22 5 632 358 404 310 50 388 292 285 277 753 718 601 958 Total FSU-LI 14 30 4 19 232 212 247 58 319 308 462 145 565 549 712 222
Total FSU-MI 33 56 2 1 660 473 568 383 3812 4423 2529 2024 4505 4953 3098 2409

57
Calculated Hidden Costs – The Water Sector Country
Hidden Costs: Unaccounted Losses [US$ million, 2001
constant]
Hidden Costs: Collection Failures [US$ million, 2001
constant]
Hidden Costs: Tariff Below Cost Recovery [US$ million,
2001 constant]
Hidden Costs: Total [US$ million, 2001 constant]
Hidden Costs: Total [% GDP]
2000 2001 2002 2003 2000 2001 2002 2003 2000 2001 2002 2003 2000 2001 2002 2003 2000 2001 2002 2003 Armenia 45 83 90 2 3 2 10 25 34 57 111 126 2.7 4.7 4.6 Azerbaijan 8 1 14 12 19 21 13 19 0.4 0.2 0.3 Belarus 9 9 14 14 36 37 59 60 0.5 0.5 Bulgaria 169 125 131 128 12 15 23 23 96 74 54 44 277 214 208 195 2.2 1.6 1.4 1.0 Czech Republic 49 40 30 31 8 87 71 0.2 0.1 Estonia 76 5 22 103 1.5 Georgia 22 26 26 26 5 36 40 37 34 58 72 62 60 1.9 2.2 1.9 1.5 Kazakhstan 32 34 45 23 23 32 55 56 77 0.3 0.3 0.3 Kyrgyz Republic 5 4 5 5 4 5 0.4 0.3 0.3 Latvia 30 59 89 1.0 Moldova 18 28 28 28 5 1 3 2 25 24 23 17 48 53 53 47 3.6 3.6 3.3 2.5 Poland 247 247 288 307 11 12 13 14 122 144 167 165 394 416 468 474 0.2 0.2 0.3 0.2 Romania 208 24 365 597 1.1 Russia 63 88 208 130 613 310 770 812 296 660 1446 1209 477 791 0.5 0.4 0.1 0.2 Tajikistan 2 2 1 1 3 1 1 0.3 0.1 0.1 Ukraine 12 28 49 64 19 58 60 52 8 30 51 64 99 45 159 179 0.1 0.3 0.4 0.4 Total 626 574 939 981 714 450 137 118 1140 1206 785 1383 2552 2271 1832 2469 Total CEE 296 287 364 307 41 43 48 14 130 144 249 165 481 487 660 474 Total SEE 169 125 131 336 12 15 23 47 96 74 54 409 277 214 208 792 Total FSU-LI 45 103 142 144 15 10 6 4 77 87 104 85 135 200 251 233 Total FSU-MI 116 159 302 194 646 382 60 52 837 901 378 724 1659 1370 713 970

58
ANNEX 2. DATA SOURCES, AVAILABILITY, AND DEFINITIONS
The following sections outline data availability, sources, and definitions of variable by sector. The full data set supporting this review can be accessed at http://ecadata-worldbank.org. The Energy Sector In the energy (power and natural gas) sector data have proved to be generally available for twenty-two countries in the ECA Region through external data sets particularly where these data relate to energy production, consumption, import, export, and loss statistics and to a slightly lesser degree tariffs. In loss statistics while generally available in the power sector these have been patchy at best for the natural gas sector. Key data sets accessed include ENERDATA and ERRANET; however there have been no externally available data sets for cross country data on normative losses, collection rates and cost-recovery prices. For the purpose of this exercise these data have been sourced through sector specialists from the World Bank that are working in these countries. While efforts have been made to verify and quality assure the data provided and to check for consistency and outliers in data sets, there has been no field based data collection effort or audit in the Region. A summary of data sources follows:
• Values for domestic energy production, imports, exports, and change in stocks – which together account for the total domestic supply – have been obtained from ENERDATA (http://www.enerdata.fr/) through subscription.
• Energy tariff rates have been obtained from ERRANET through subscription. (http://www.erranet.org/Products/TariffDatabase/TariffIndex)
• The Bank’s World Development Indicators Database (2004) is the source for GDP, Exchange Rate, and Price Deflators.
• Sector specialists – either based at the World Bank in Washington DC or in the Bank’s country offices have provided supplementary data on the energy sector, or have suggested corrections in the values reported in ENERDATA or ERRANET. Such expert data, where available, have been used to substitute primary data.
Data Availability For the analysis, countries included in the data set have been classified into groups based on a combination of geographic and economic criteria. The data set covers the four year period from 2000 to 2003. Name Acronym47 Countries Included
Central and Eastern Europe CEE (2) Hungary, Poland
South East Europe SEE (8) Albania, Bosnia, Bulgaria, Croatia, Macedonia, Romania, Serbia and Montenegro, Turkey
47 Number of counties in brackets

59
Name Acronym47 Countries Included Former Soviet Union – Low Income Countries FSU-LI (8) Armenia, Azerbaijan, Georgia, Moldova, Kyrgyz Republic,
Tajikistan, Turkmenistan, Uzbekistan Former Soviet Union – Middle Income Countries FSU-MI (4) Belarus, Kazakhstan, Russia, Ukraine
Description of Variables Indicator Unit Definition Average Cost Recovery Price (ACRP)
US$/ kWh (power) US$ per 1000 m3 or US$ per mcm (gas)
Average cost-recovery price at the end-user level defined as long run O&M costs plus allowance for reasonable investment and normative losses.
Collection Rate
rate (as a proportion of billed consumption)
This is the proportion of the billed charges to consumers of the respective energy that is actually collected in some form by the utility/service provider.
End-User Consumption
kWh metered or otherwise observed (power) thousand m3 (mcm) metered or otherwise observed (gas)
End-User Consumption measures the needs of the final consumers of the country. They are broken down into several categories: industry, transport, residential, tertiary, agriculture and non-energetic uses. This measure is the actual final consumption that is marketed by the utilities which is the difference between domestic consumption and the consumption which results from the transformation process, and the losses involved, for each country. In ENERDATA tables, the values correspond to Total Final Consumption.
Normative Loss
Rate, as a proportion of power injected into transmission Rate, as a proportion of gas produced for transport
Normative losses constitute that component of total losses that accrue due to system design and technology constraints; they are inevitable and predictable.
Total Loss
Rate, as a proportion of power injected into transmission Rate, as a proportion of gas produced for transport
Rate of actual losses in transmission and distribution due to technical issues and due to theft. ENERData are the primary source for transmission and distribution losses, supplemented with data from sector specialists where available.
WAET USc/ kWh (power) US$/ 1000 m3 or U$ per mcm (gas)
Weighted average end-user tariff.
The Water Sector The water sector review draws primarily upon data from utility surveys carried out by the OECD EAP Task Force in 2001-2003 and now available through IB-NET. The OECD original country data sets are based on samples from utilities across the country, and the approach that has been taken by the OECD has been to multiply per capita averages for the sample by the urban population to arrive at a national average. IB-NET otherwise known as the International Benchmarking Network for Water and Sanitation Utilities collects standard utilities performance indicators. The objective of IB-NET is to support access to comparative information that will help promote best practice among water supply and sanitation providers worldwide and eventually will provide consumers with access to high quality, and affordable water supply and sanitation services.

60
IB-NET sets forth a common set of data definitions and a minimum set of core indicators which, with some modifications and supplements from data sources from secondary sources have been used for estimating hidden costs and presenting a picture of technical and financial performance of the water sector. The IBNET website is http://www.ib-net.org/. A summary of data sources follows:
• Armenia, Azerbaijan, Georgia, Kazakhstan, Kyrgyz Republic, Moldova, Russian Federation,
Tajikistan (all 2001-2003) and Ukraine (2000-2001) use data collected by the OECD EAP Task Force (now available through: www.ib-net.org).
• Albanian data have been sourced from the National Water Association report, 2003.
• Data for Danube basin countries (Czech Republic, Hungary, Serbia and Montenegro, Romania,
Slovak Republic, Croatia, Bulgaria and Bosnia Herzegovina) have been sourced from UNDP/GEF (2004).
• Data for EU accession countries have been sourced though ISPA reports (2000-2004).
• Data for Belarus have been sourced through the State of Environment report, Ministry of
Environment, 2003.
• Data for Poland (2000-2003) and Ukraine (2002-2003) have been sourced through national experts on the basis of reports from national municipal water authorities.
• The Bank’s World Development Indicators Database (2004) is the source for GDP, Exchange Rate,
and Price Deflators.
• Data from various environmental and water sector reports have been used to supplement primary data.
Data Availability Data have been collated for sixteen countries48 that have been classified into groups based on a combination of geographic and economic criteria. The data set covers the four year period from 2000 to 2003, but in some cases the analysis is presented for the year 2002, the year where data are available for the majority of countries since there have not been significant changes in the trend across this four year period. Name Acronym49 Countries Included
Central and Eastern Europe CEE (4) Czech Republic, Estonia, Latvia, Poland
South East Europe SEE (2) Bulgaria, Romania
Former Soviet Union – Low Income Countries FSU-LI (6) Armenia, Azerbaijan, Georgia, Moldova, Kyrgyz Republic,
Tajikistan Former Soviet Union – Middle Income Countries FSU-MI (4) Belarus, Kazakhstan, Russia, Ukraine
48 For the analysis of hidden costs 11 of the 16 countries have data available for 3 – 4 years. 49 Number of counties in brackets
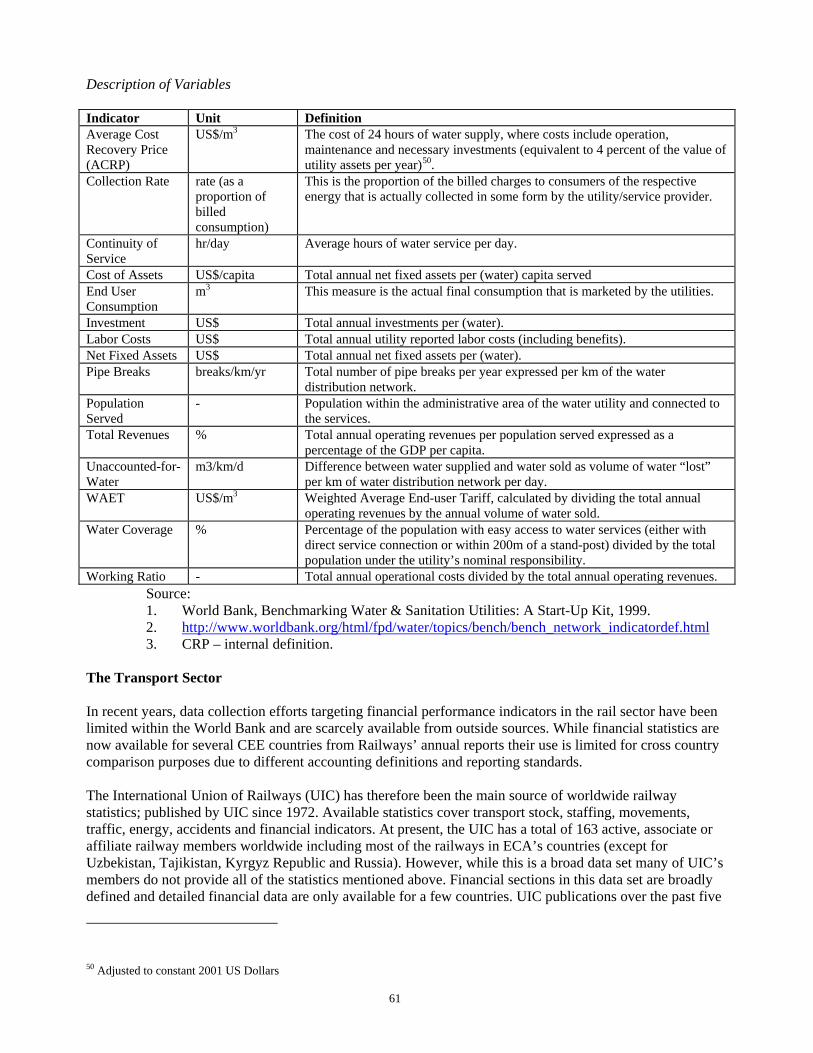
61
Description of Variables Indicator Unit Definition Average Cost Recovery Price (ACRP)
US$/m3 The cost of 24 hours of water supply, where costs include operation, maintenance and necessary investments (equivalent to 4 percent of the value of utility assets per year)50.
Collection Rate rate (as a proportion of billed consumption)
This is the proportion of the billed charges to consumers of the respective energy that is actually collected in some form by the utility/service provider.
Continuity of Service
hr/day Average hours of water service per day.
Cost of Assets US$/capita Total annual net fixed assets per (water) capita served End User Consumption
m3 This measure is the actual final consumption that is marketed by the utilities.
Investment US$ Total annual investments per (water). Labor Costs US$ Total annual utility reported labor costs (including benefits). Net Fixed Assets US$ Total annual net fixed assets per (water). Pipe Breaks breaks/km/yr Total number of pipe breaks per year expressed per km of the water
distribution network. Population Served
- Population within the administrative area of the water utility and connected to the services.
Total Revenues % Total annual operating revenues per population served expressed as a percentage of the GDP per capita.
Unaccounted-for-Water
m3/km/d Difference between water supplied and water sold as volume of water “lost” per km of water distribution network per day.
WAET US$/m3 Weighted Average End-user Tariff, calculated by dividing the total annual operating revenues by the annual volume of water sold.
Water Coverage % Percentage of the population with easy access to water services (either with direct service connection or within 200m of a stand-post) divided by the total population under the utility’s nominal responsibility.
Working Ratio - Total annual operational costs divided by the total annual operating revenues. Source: 1. World Bank, Benchmarking Water & Sanitation Utilities: A Start-Up Kit, 1999. 2. http://www.worldbank.org/html/fpd/water/topics/bench/bench_network_indicatordef.html 3. CRP – internal definition.
The Transport Sector In recent years, data collection efforts targeting financial performance indicators in the rail sector have been limited within the World Bank and are scarcely available from outside sources. While financial statistics are now available for several CEE countries from Railways’ annual reports their use is limited for cross country comparison purposes due to different accounting definitions and reporting standards. The International Union of Railways (UIC) has therefore been the main source of worldwide railway statistics; published by UIC since 1972. Available statistics cover transport stock, staffing, movements, traffic, energy, accidents and financial indicators. At present, the UIC has a total of 163 active, associate or affiliate railway members worldwide including most of the railways in ECA’s countries (except for Uzbekistan, Tajikistan, Kyrgyz Republic and Russia). However, while this is a broad data set many of UIC’s members do not provide all of the statistics mentioned above. Financial sections in this data set are broadly defined and detailed financial data are only available for a few countries. UIC publications over the past five
50 Adjusted to constant 2001 US Dollars

62
years include: International Railway Statistics from 1997 to 2001; Supplementary Statistics to the International Railway Statistics from1996 to 2000; and Railway Time Series Data from 1970 to 2001. In the roads sector the International Road Federation’s (IRF) World Road Statistics have been the major source of global statistics on road networks. However, country coverage and the quality of road transport data have declined in recent years, especially in low income countries with poor statistical services. Indicators collected by the IRF include: road network, road condition, and road traffic and expenditure. This data set has been supplemented by the International Road Traffic and Accident Database (IRTAD). IRTAD’s principal mandate is to collect standardized traffic collision and exposure data among OECD member countries. It became operational in 1990. The data collected is used by program and policy makers to identify existing and emerging road safety problems and if necessary, to help develop program to address these issues. Further statistics in the road and rail sectors have been collated through Eurostat; a comprehensive collection of transport statistics collected by the EU, and presented on the EuroStat Website51. Data cover the countries of the EU and EU candidate countries52 and comparisons are provided with statistics from the USA and Japan. Statistics are provided up to the year 2002 and cover: means of transport, safety, infrastructure, goods and passenger transport. There are no financial indicators in the data set. A summary of data sources follows:
• Rail sector performance data have been obtained from the International Union of Railways, Eurostat and data reported by relevant ministries or agencies of the respective country.
• Road sector performance data have been obtained from the International Roads Federation, the
International Road Traffic and Accident database, Eurostat and data reported by relevant ministries or agencies of the respective country.
• The Bank’s World Development Indicators Database (2004) is the source for GDP, Exchange Rate,
and Price Deflators.
• Data provided by sector specialists, World Bank staff and other existing external publications have been used to supplement the rail and roads data sets.
Data Availability The rail sub-sector review is based on statistics for 2000 – 2003 for 22 countries in the Region. Due to the difficulty in accessing financial information, data are presented for the most recent year where the majority of countries are represented.
51 http://europa.eu.int/comm/eurostat/ 52 Countries covered include: Austria, Belgium, Germany, Denmark, Spain, Greece, France, Finland, Italy, Ireland, The Netherlands, Portugal, Sweden, UK, Iceland, Cyprus, Czech Republic, Estonia, Hungary, Latvia, Lithuania, Malta, Poland, Slovak Republic, Slovenia, Bulgaria, Romania and Turkey.

63
The Rail Sector
Name Acronym53 Countries Included Central and Eastern Europe CEE (6) Czech Republic, Estonia, Hungary, Latvia, Lithuania, Poland
South East Europe SEE (10) Bosnia, Bulgaria, Croatia, Kosovo, Macedonia, Romania, Serbia, Slovakia, Slovenia, Turkey
Former Soviet Union – Low Income Countries FSU-LI (3) Armenia, Azerbaijan, Georgia,
Former Soviet Union – Middle Income Countries FSU-MI (3) Belarus, Russia, Ukraine
The road sub-sector review takes a look at a number of measures of the financial performance of the roads sector for 14 countries in the ECA Region. Trends are examined over four years starting in 2000. EU-15 average statistics for the year 2000 are from the Eurostat database and are provided for comparative purposes where available.
The Road Sector
Name Acronym54 Countries Included Central and Eastern Europe CEE (3) Hungary, Latvia, Lithuania South East Europe SEE (6) Bosnia, Bulgaria, Croatia, Romania, Serbia, Turkey Former Soviet Union – Low Income Countries FSU-LI (3) Azerbaijan, Kyrgyz Republic, Moldova
Former Soviet Union – Middle Income Countries FSU-MI (2) Russia, Ukraine
Description of Variables - Railways Indicator Unit Definition Average Freight Revenue
US$ per tonne-km Total freight revenue/total freight tonne-kilometers
Average Passenger Revenue
US$ per pass-km Total passenger revenue/total passenger kilometers
Capital Expenditures
US$ million Total annual impact of railway capital expenditure on national/ regional/ local government budgets
Freight train activity
train-km Movement of a freight train over one kilometer distance
Freight travel tonne-km One tonne of goods over one kilometer distance Infrastructure investment
US$ million Total annual capital expenditure on new railway infrastructure
Line density route-km/land area Size of the Network Network route-km Total length of railway route open for public passenger and freight services
(excluding dedicated private resource railways). Passenger PSO Support & Operating Subsidy
US$ per traffic unit Value of operating subsidy plus passenger public service obligation contracts
Passenger train activity
train-km Movement of a passenger train over one kilometer distance
Passenger travel pass-km One passenger over one kilometer distance Rail Traffic (tonne-km plus Traffic units
53 Number of counties in brackets 54 Number of counties in brackets

64
Indicator Unit Definition density pass-km)/route-km Staff - number of staff (year end) Total State Budget Support
US$ and % of GDP Including operating subsidies and investment
Total train activity
train-km Movement of passenger plus freight trains over one kilometer distance
Traffic units TU Passenger-km + freight tonne-km Description of Variables - Roads Indicator Unit Definition Actual to Required Road Maintenance Expenditure
Rate Ratio of road maintenance expenditure to road maintenance requirement
Expenditure US$ million Total amount of expenditure on new construction and extension of existing roads, including reconstruction, maintenance, renewal and major repairs of roads per year
Main Roads (also termed highways or national roads)
Km A-level roads that are outside urban areas and other roads outside urban areas. A-level roads are roads outside urban areas that are not motorways but belong to the top-level road network. A-level roads are characterized by a comparatively high quality standard, either non-divided roads with oncoming traffic or similar to motorways. In most countries these roads are financed by the federal or national government
Maintenance expenditure
US$ million Includes the total expenditure that would be required to keep roads in working order. This includes maintenance, patching and running repairs (work related to roughness of carriageways wearing course, roadsides, etc)
Motor vehicle operating cost
US$ per vehicle km on good condition roads
Operating costs - categorized by paved and unpaved
Motorways km Roads specifically designed and built for motor traffic, which does not serve properties bordering on it, and which (a) is provided, except at special points or temporarily, with separate carriageways for the two directions of traffic, separated from each other, either by a dividing strip not intended for traffic, or exceptionally by other means, (b) does not cross at level with any road, railway or tramway track, or footpath, (c) is specially sign-posted as a motorway and is reserved for specific categories of road motor vehicles. Entry and exit lanes of motorways are included irrespectively of the location of the signposts
Paved Roads - The length of all roads that are surfaced with crushed stone (macadam) and hydrocarbon binder or bitumized agents with concrete or with cobblestones
Required Maintenance Expenditure
US$ million Road maintenance requirement includes the amount of financing required per year to keep roads in working order. This includes maintenance, patching and running repairs (work related to roughness of carriageways wearing course, roadsides, etc)
Road Density km/1000 people and km/1000 sq km
Kilometer length of total road network per 1000 people or per 1000 sq. km of the territory respectively
Rural Roads km length of all roads in the rural categorized by paved and unpaved Secondary Roads (also termed regional roads)
km Roads that are feeder routes into, and provide main links between highways, main or national roads
Total Road Network
km The road network includes “all roads in a given area”
Traffic Density - Number of vehicles per km of the road network Urban Roads km Length of roads within the boundaries of a built-up area, which is an area
with entries and exits especially sign-posted as such

65