Probiotic in Indonesia : Local issue Indigenous Probiotic ... - London fin.pdf · Probiotic in...
49
Probiotic in Indonesia : Local issue Indigenous Probiotic Research Ingrid S. Surono SEAMEO TROPMED RCCN University of Indonesia
Transcript of Probiotic in Indonesia : Local issue Indigenous Probiotic ... - London fin.pdf · Probiotic in...
Probiotic in Indonesia :Local issue
Indigenous Probiotic Research
Ingrid S. Surono
SEAMEO TROPMED RCCNUniversity of Indonesia
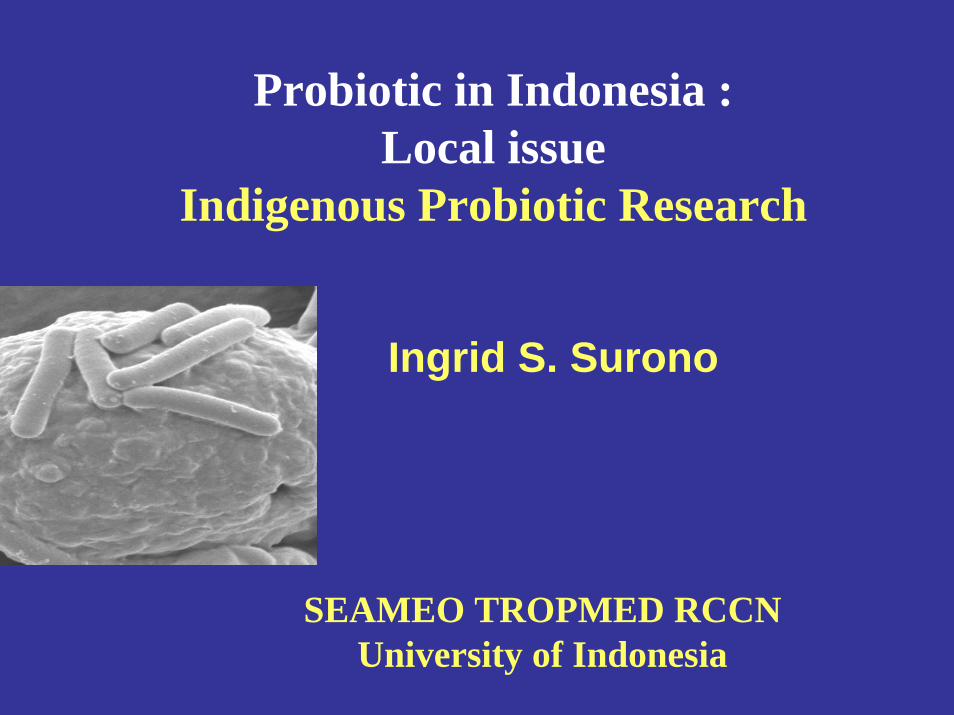
DADIH, TRADITIONAL FERMENTED MILKDADIH, TRADITIONAL FERMENTED MILKOF WEST SUMATRAOF WEST SUMATRA
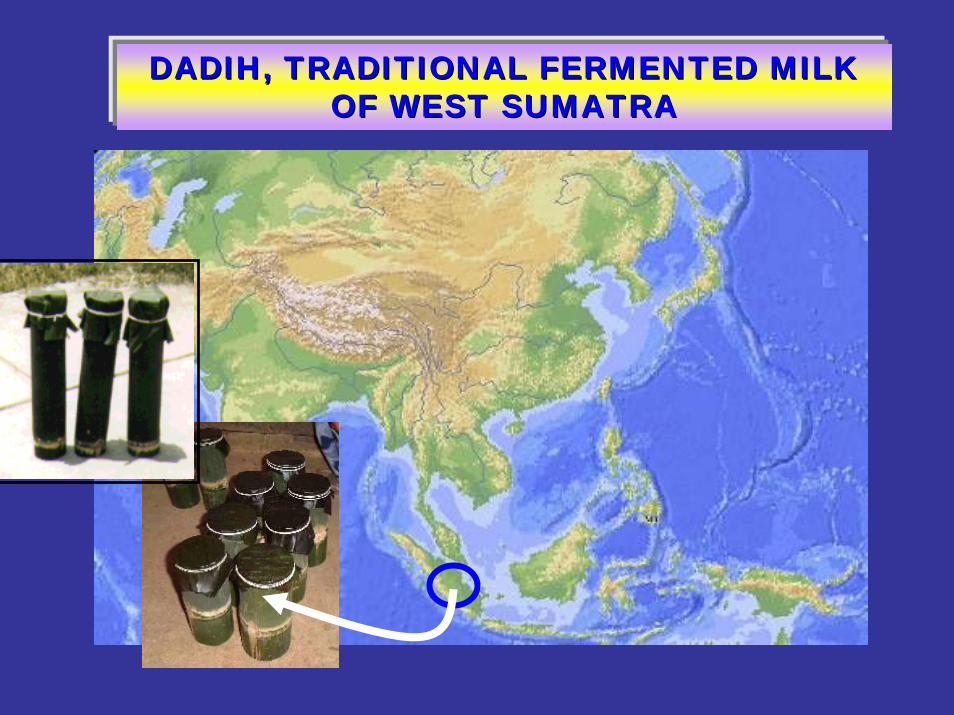
Dadih, Indonesian traditional fermented raw buffalo milk of West Sumatra
No heat application on the buffalo milkNo heat application on the buffalo milk
5 potential dadih strains
• Lactobacillus plantarum strains IS-10506 • Lactobacillus plantarum IS-20506• Enterococcus faecium strains IS-27526• Enterococcus faecium strains IS-23427 • Enterococcus faecium strains IS-16183
Screening studies
• Viability• Adhesion• Pathogen inhibition and displacement• Immune modulation• Detoxification
• In vivo Sprague Dawley rats and Balb/cmouse
• L. plantarum IS-10506 and IS-20506
Viability
0.784 0.837 0.891 0.944 0.998 1.051 1.104 1.158 1.211 1.264 above
3D Contour Plot (LACTIC-indeks-1.STA 5v*1810c)Distance Weighted Least Squares
VAR1
VA
R3
C0
C1
C2
C3
A0 A1 A2 A3
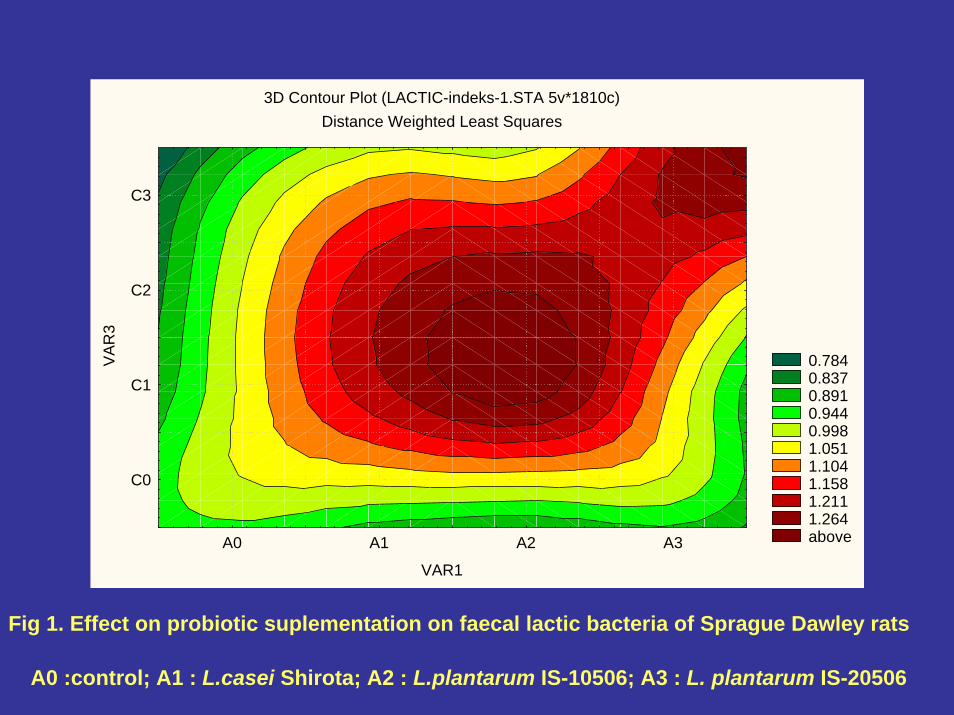
Fig 1. Effect on probiotic suplementation on faecal lactic bacteria of Sprague Dawley rats
A0 :control; A1 : L.casei Shirota; A2 : L.plantarum IS-10506; A3 : L. plantarum IS-20506
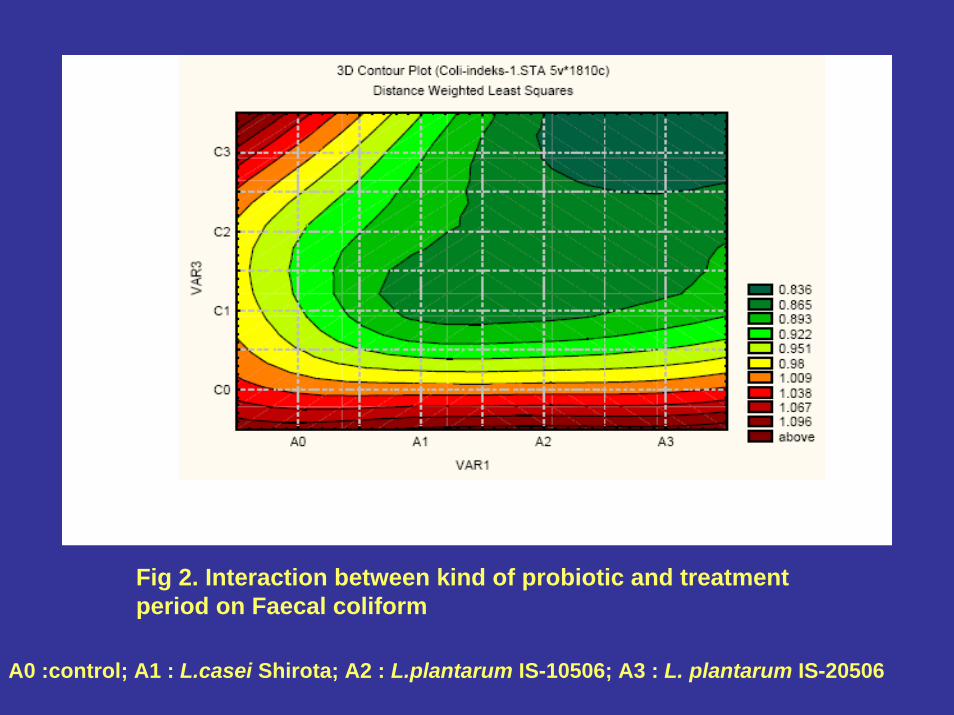
Fig 2. Interaction between kind of probiotic and treatment period on Faecal coliform
A0 :control; A1 : L.casei Shirota; A2 : L.plantarum IS-10506; A3 : L. plantarum IS-20506
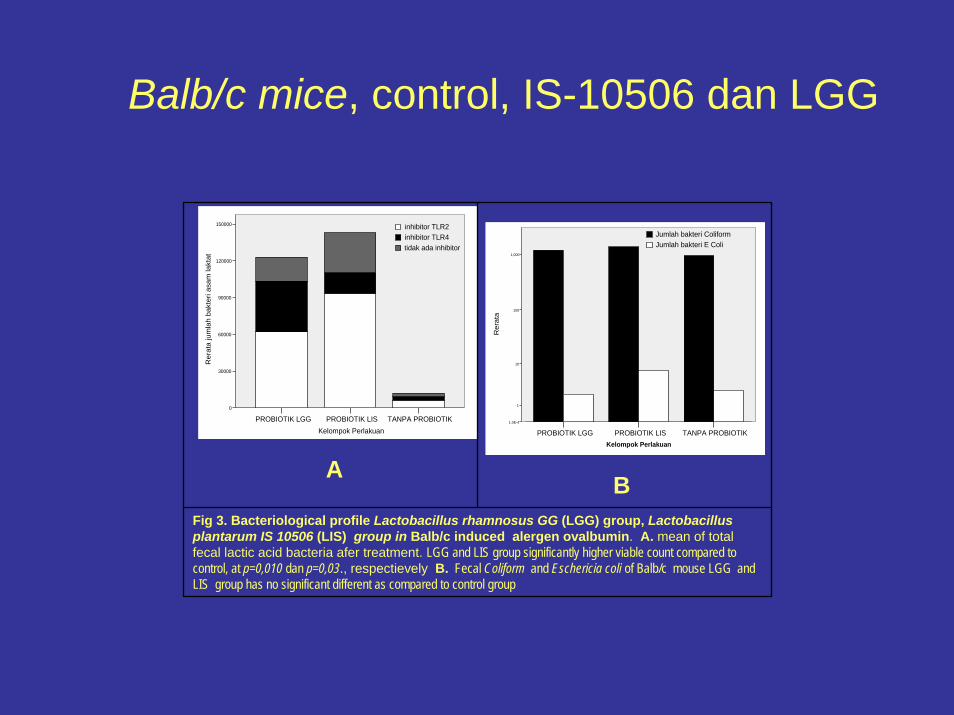
Balb/c mice, control, IS-10506 dan LGG
TANPA PROBIOTIKPROBIOTIK LISPROBIOTIK LGGKelompok Perlakuan
150000
120000
90000
60000
30000
0
Rer
ata
jum
lah
bakt
eri a
sam
lakt
at
tidak ada inhibitorinhibitor TLR4inhibitor TLR2
TANPA PROBIOTIKPROBIOTIK LISPROBIOTIK LGGKelompok Perlakuan
1,000
100
10
1
1.0E-4
Rer
ata
Jumlah bakteri E ColiJumlah bakteri Coliform
Fig 3. Bacteriological profile Lactobacillus rhamnosus GG (LGG) group, Lactobacillus plantarum IS 10506 (LIS) group in Balb/c induced alergen ovalbumin. A. mean of total fecal lactic acid bacteria afer treatment. LGG and LIS group significantly higher viable count compared to control, at p=0,010 dan p=0,03., respectievely B. Fecal Coliform and Eschericia coli of Balb/c mouse LGG and LIS group has no significant different as compared to control group
A B
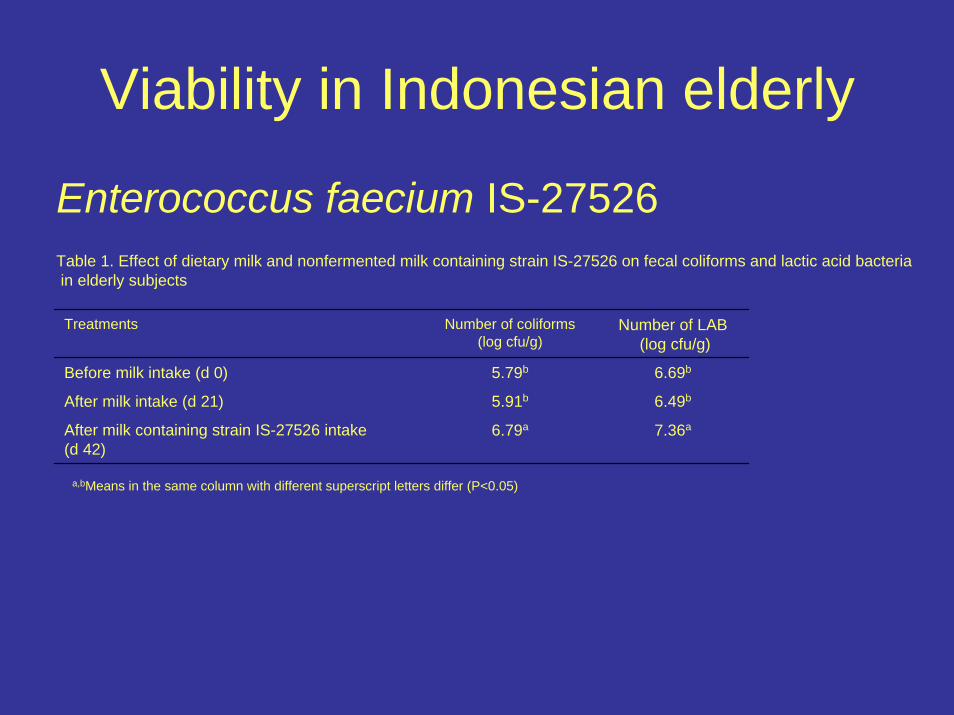
Viability in Indonesian elderly
Enterococcus faecium IS-27526Table 1. Effect of dietary milk and nonfermented milk containing strain IS-27526 on fecal coliforms and lactic acid bacteriain elderly subjects
Treatments Number of coliforms(log cfu/g)
Number of LAB(log cfu/g)
Before milk intake (d 0) 5.79b 6.69b
After milk intake (d 21) 5.91b 6.49b
After milk containing strain IS-27526 intake (d 42)
6.79a 7.36a
a,bMeans in the same column with different superscript letters differ (P<0.05)
Adhesion properties of 5 dadih’s strains
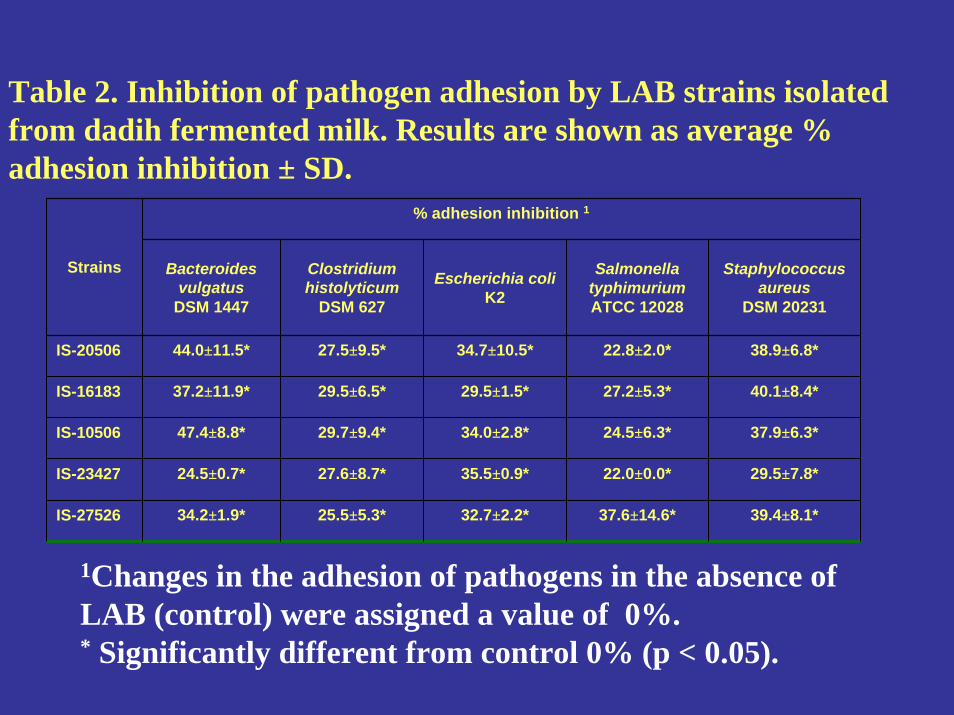
Table 2. Inhibition of pathogen adhesion by LAB strains isolatedfrom dadih fermented milk. Results are shown as average % adhesion inhibition ± SD.
% adhesion inhibition 1
Strains Bacteroidesvulgatus
DSM 1447
Clostridium histolyticum
DSM 627
Escherichia coliK2
Salmonella typhimuriumATCC 12028
Staphylococcus aureus
DSM 20231
IS-20506 44.0±11.5* 27.5±9.5* 34.7±10.5* 22.8±2.0* 38.9±6.8*
IS-16183 37.2±11.9* 29.5±6.5* 29.5±1.5* 27.2±5.3* 40.1±8.4*
IS-10506 47.4±8.8* 29.7±9.4* 34.0±2.8* 24.5±6.3* 37.9±6.3*
IS-23427 24.5±0.7* 27.6±8.7* 35.5±0.9* 22.0±0.0* 29.5±7.8*
IS-27526 34.2±1.9* 25.5±5.3* 32.7±2.2* 37.6±14.6* 39.4±8.1*
1Changes in the adhesion of pathogens in the absence of LAB (control) were assigned a value of 0%. * Significantly different from control 0% (p < 0.05).
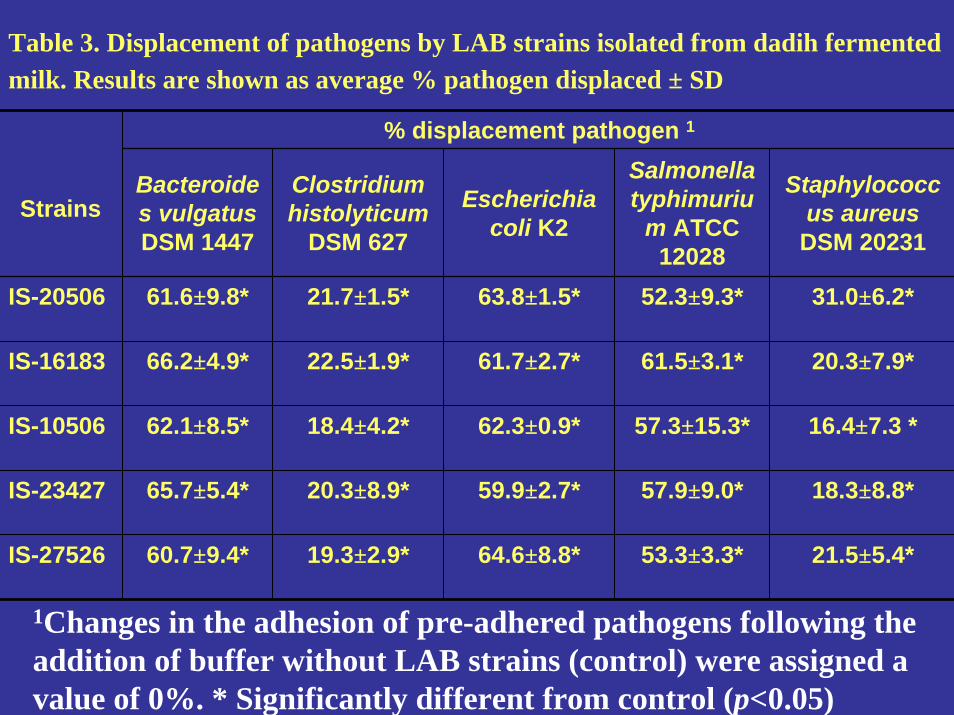
Table 3. Displacement of pathogens by LAB strains isolated from dadih fermented milk. Results are shown as average % pathogen displaced ± SD
% displacement pathogen 1
StrainsBacteroides vulgatusDSM 1447
Clostridium histolyticum
DSM 627
Escherichia coli K2
Salmonella typhimuriu
m ATCC 12028
Staphylococcus aureus
DSM 20231
IS-20506 61.6±9.8* 21.7±1.5* 63.8±1.5* 52.3±9.3* 31.0±6.2*
IS-16183 66.2±4.9* 22.5±1.9* 61.7±2.7* 61.5±3.1* 20.3±7.9*
IS-10506 62.1±8.5* 18.4±4.2* 62.3±0.9* 57.3±15.3* 16.4±7.3 *
IS-23427 65.7±5.4* 20.3±8.9* 59.9±2.7* 57.9±9.0* 18.3±8.8*
IS-27526 60.7±9.4* 19.3±2.9* 64.6±8.8* 53.3±3.3* 21.5±5.4*
1Changes in the adhesion of pre-adhered pathogens following the addition of buffer without LAB strains (control) were assigned avalue of 0%. * Significantly different from control (p<0.05)
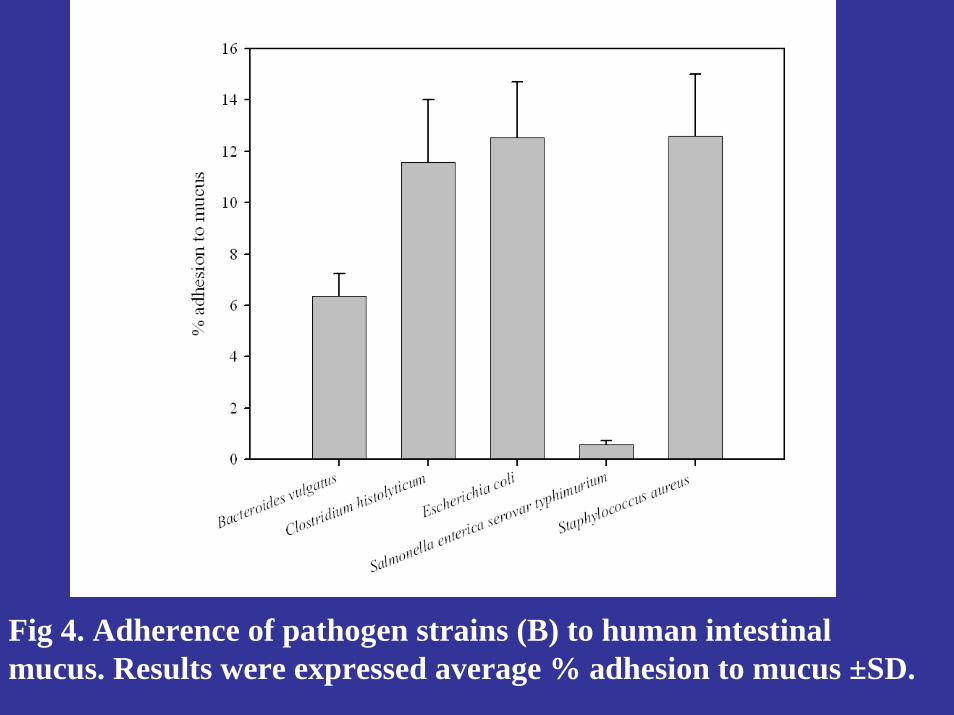
Fig 4. Adherence of pathogen strains (B) to human intestinal mucus. Results were expressed average % adhesion to mucus ±SD.
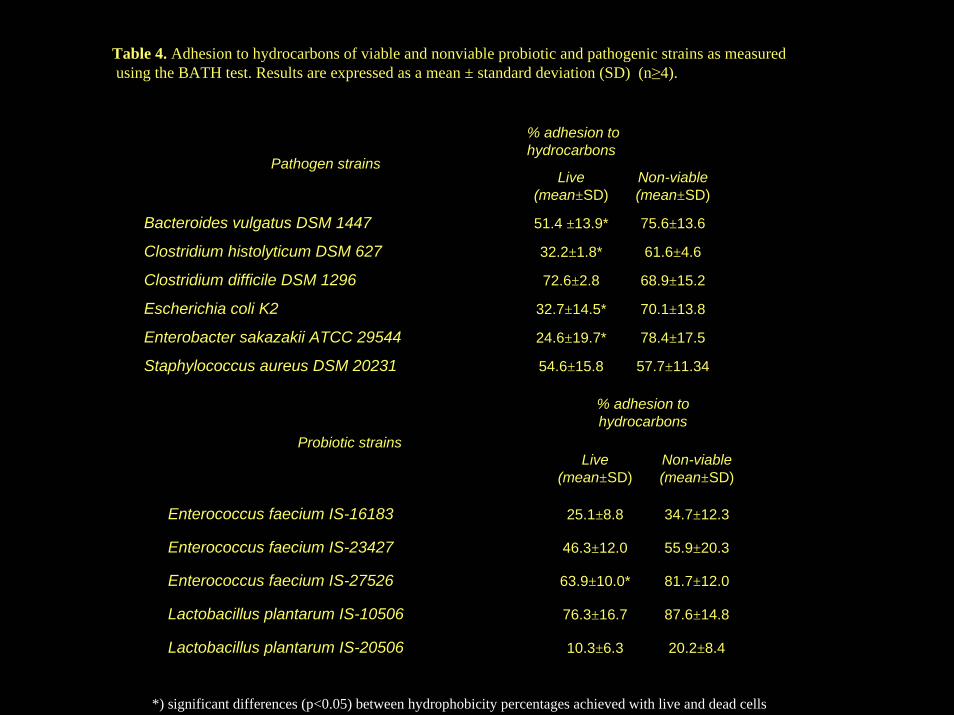
Table 4. Adhesion to hydrocarbons of viable and nonviable probiotic and pathogenic strains as measuredusing the BATH test. Results are expressed as a mean ± standard deviation (SD) (n≥4).
% adhesion to hydrocarbons
Pathogen strainsLive
(mean±SD)Non-viable (mean±SD)
Bacteroides vulgatus DSM 1447 51.4 ±13.9* 75.6±13.6
Clostridium histolyticum DSM 627 32.2±1.8* 61.6±4.6
Clostridium difficile DSM 1296 72.6±2.8 68.9±15.2
Escherichia coli K2 32.7±14.5* 70.1±13.8
Enterobacter sakazakii ATCC 29544 24.6±19.7* 78.4±17.5
Staphylococcus aureus DSM 20231 54.6±15.8 57.7±11.34
20.2±8.410.3±6.3Lactobacillus plantarum IS-20506
87.6±14.876.3±16.7Lactobacillus plantarum IS-10506
81.7±12.063.9±10.0*Enterococcus faecium IS-27526
55.9±20.346.3±12.0Enterococcus faecium IS-23427
34.7±12.325.1±8.8Enterococcus faecium IS-16183
Non-viable (mean±SD)
Live(mean±SD)
% adhesion to hydrocarbons
Probiotic strains
*) significant differences (p<0.05) between hydrophobicity percentages achieved with live and dead cells.
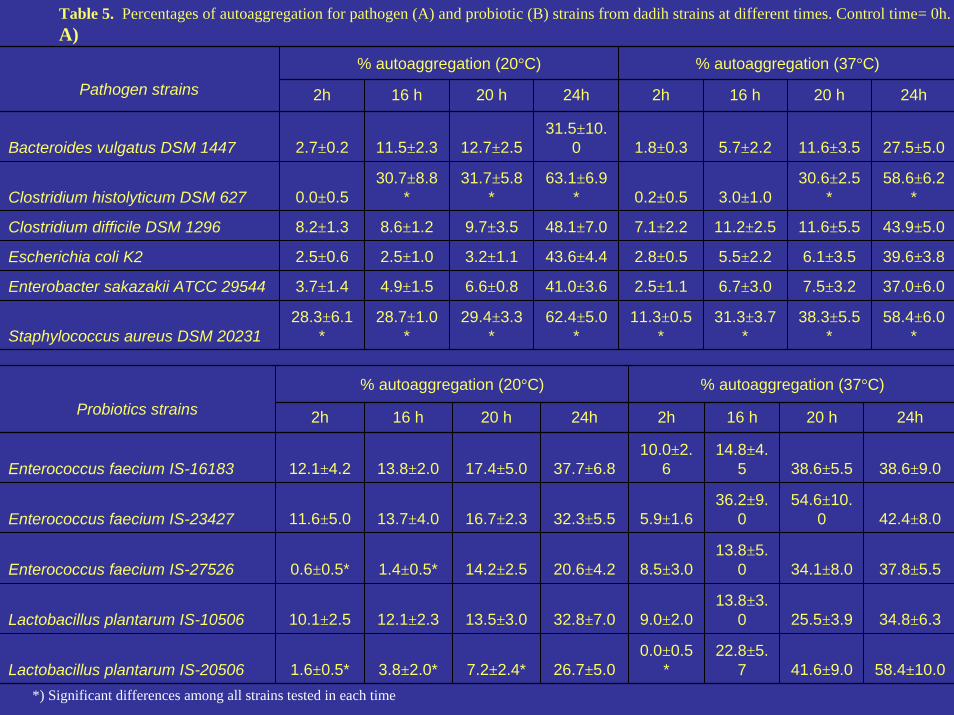
Table 5. Percentages of autoaggregation for pathogen (A) and probiotic (B) strains from dadih strains at different times. Control time= 0h.A)
% autoaggregation (20°C) % autoaggregation (37°C)
2h 16 h 20 h 24h 2h 16 h 20 h 24h
Bacteroides vulgatus DSM 1447 2.7±0.2 11.5±2.3 12.7±2.531.5±10.
0 1.8±0.3 5.7±2.2 11.6±3.5 27.5±5.0
Clostridium histolyticum DSM 627 0.0±0.530.7±8.8
*31.7±5.8
*63.1±6.9
* 0.2±0.5 3.0±1.030.6±2.5
*58.6±6.2
*
Clostridium difficile DSM 1296 8.2±1.3 8.6±1.2 9.7±3.5 48.1±7.0 7.1±2.2 11.2±2.5 11.6±5.5 43.9±5.0
Escherichia coli K2 2.5±0.6 2.5±1.0 3.2±1.1 43.6±4.4 2.8±0.5 5.5±2.2 6.1±3.5 39.6±3.8
Enterobacter sakazakii ATCC 29544 3.7±1.4 4.9±1.5 6.6±0.8 41.0±3.6 2.5±1.1 6.7±3.0 7.5±3.2 37.0±6.0
Staphylococcus aureus DSM 2023128.3±6.1
*28.7±1.0
*29.4±3.3
*62.4±5.0
*11.3±0.5
*31.3±3.7
*38.3±5.5
*58.4±6.0
*
Pathogen strains
58.4±10.041.6±9.022.8±5.
70.0±0.5
*26.7±5.07.2±2.4*3.8±2.0*1.6±0.5*Lactobacillus plantarum IS-20506
34.8±6.325.5±3.913.8±3.
09.0±2.032.8±7.013.5±3.012.1±2.310.1±2.5Lactobacillus plantarum IS-10506
37.8±5.534.1±8.013.8±5.
08.5±3.020.6±4.214.2±2.51.4±0.5*0.6±0.5*Enterococcus faecium IS-27526
42.4±8.054.6±10.
036.2±9.
05.9±1.632.3±5.516.7±2.313.7±4.011.6±5.0Enterococcus faecium IS-23427
38.6±9.038.6±5.514.8±4.
510.0±2.
637.7±6.817.4±5.013.8±2.012.1±4.2Enterococcus faecium IS-16183
24h20 h16 h2h24h20 h16 h2h
% autoaggregation (37°C)% autoaggregation (20°C)Probiotics strains
*) Significant differences among all strains tested in each time
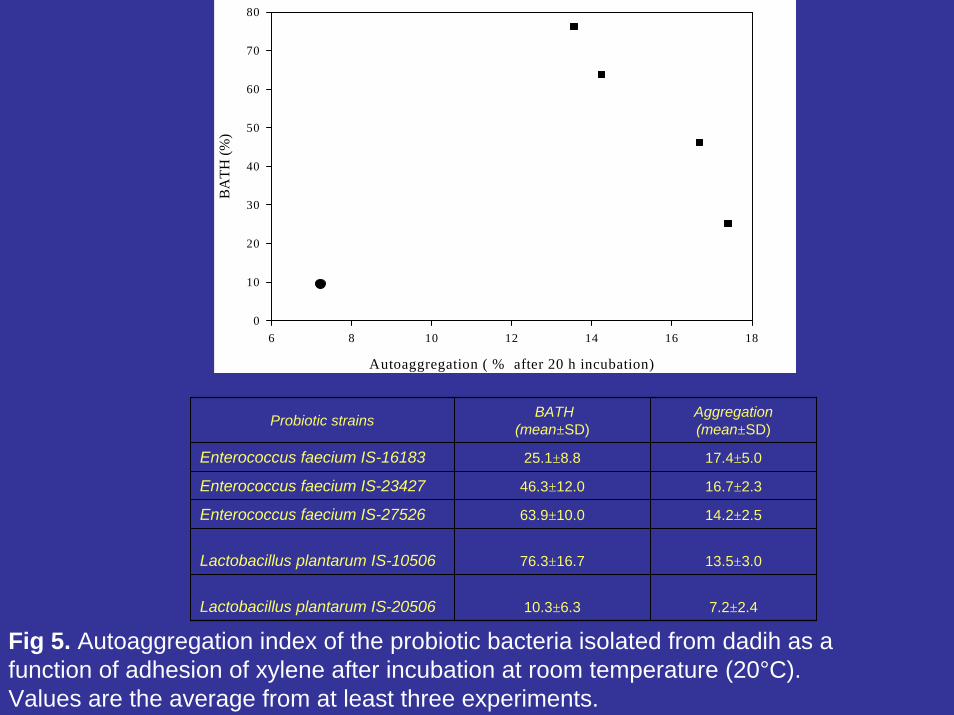
Autoaggregation ( % after 20 h incubation)
6 8 10 12 14 16 18
BA
TH (%
)
0
10
20
30
40
50
60
70
80
Probiotic strains BATH(mean±SD)
Aggregation(mean±SD)
Enterococcus faecium IS-16183 25.1±8.8 17.4±5.0
Enterococcus faecium IS-23427 46.3±12.0 16.7±2.3
Enterococcus faecium IS-27526 63.9±10.0 14.2±2.5
Lactobacillus plantarum IS-10506 76.3±16.7 13.5±3.0
Lactobacillus plantarum IS-20506 10.3±6.3 7.2±2.4
Fig 5. Autoaggregation index of the probiotic bacteria isolated from dadih as a function of adhesion of xylene after incubation at room temperature (20°C). Values are the average from at least three experiments.
IS-20506 IS-16183 IS-10506 IS-23427 IS-27526
% C
oagg
rega
tion
0
10
20
30
40
50
60
70
Bacteroides vulgatus Clostridium histolyticum
IS-20506 IS-16183 IS-10506 IS-23427 IS-27526
% c
oagg
rega
tion
0
10
20
30
40
50
60
70
Staphylococcus aureus
IS-20506 IS-16183 IS-10506 IS-23427 IS-27526
% C
oagg
rega
tion
0
10
20
30
40
50
60
70
Enterobacter sakazakii
IS-20506 IS-16183 IS-10506 IS-23427 IS-27526
% C
oagg
rega
tion
0
10
20
30
40
50
60
70
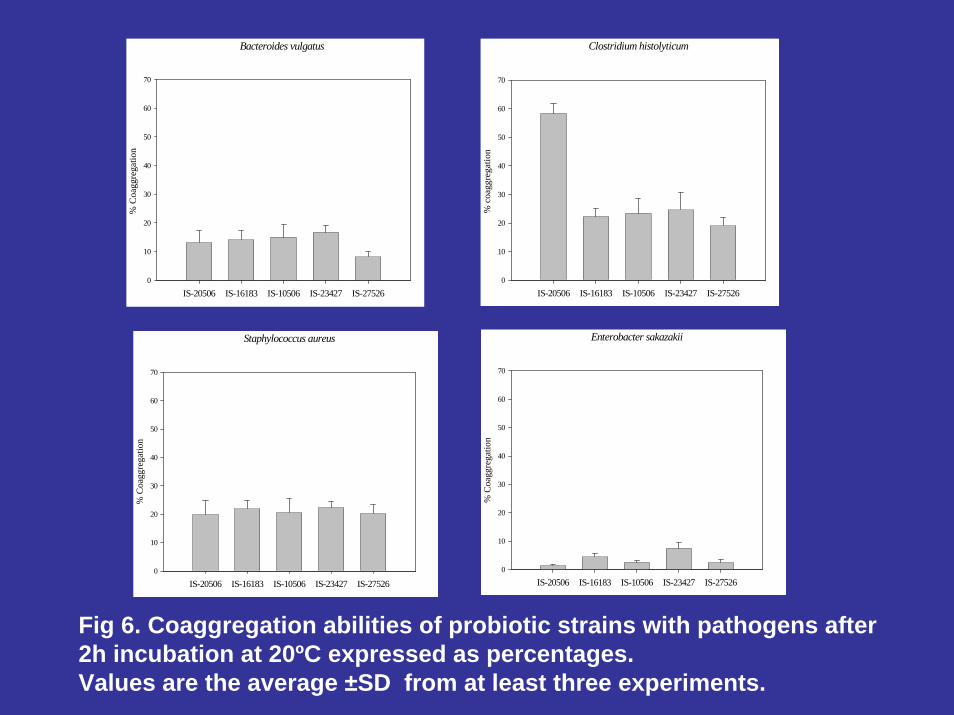
Fig 6. Coaggregation abilities of probiotic strains with pathogens after 2h incubation at 20ºC expressed as percentages. Values are the average ±SD from at least three experiments.
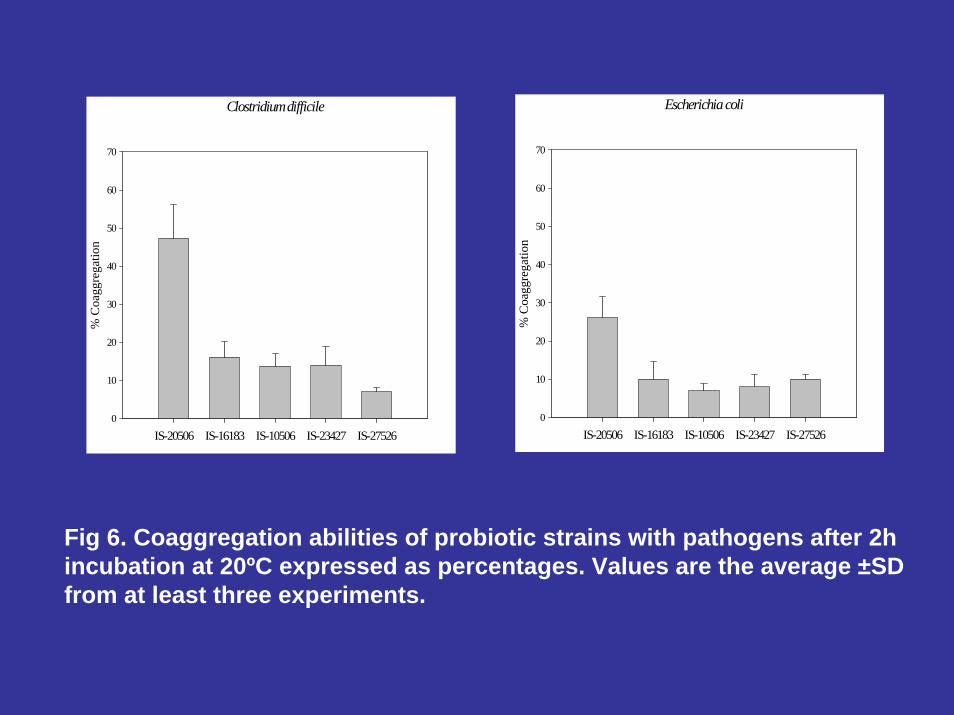
Clostridium difficile
IS-20506 IS-16183 IS-10506 IS-23427 IS-27526
% C
oagg
rega
tion
0
10
20
30
40
50
60
70
Escherichia coli
IS-20506 IS-16183 IS-10506 IS-23427 IS-27526
% C
oagg
rega
tion
0
10
20
30
40
50
60
70
Fig 6. Coaggregation abilities of probiotic strains with pathogens after 2h incubation at 20ºC expressed as percentages. Values are the average ±SD from at least three experiments.
Immune modulation
In vivo studies (Sprague Dawley rats and Balb/c mouse)
FAECAL ANAEROBIC BACTERIA
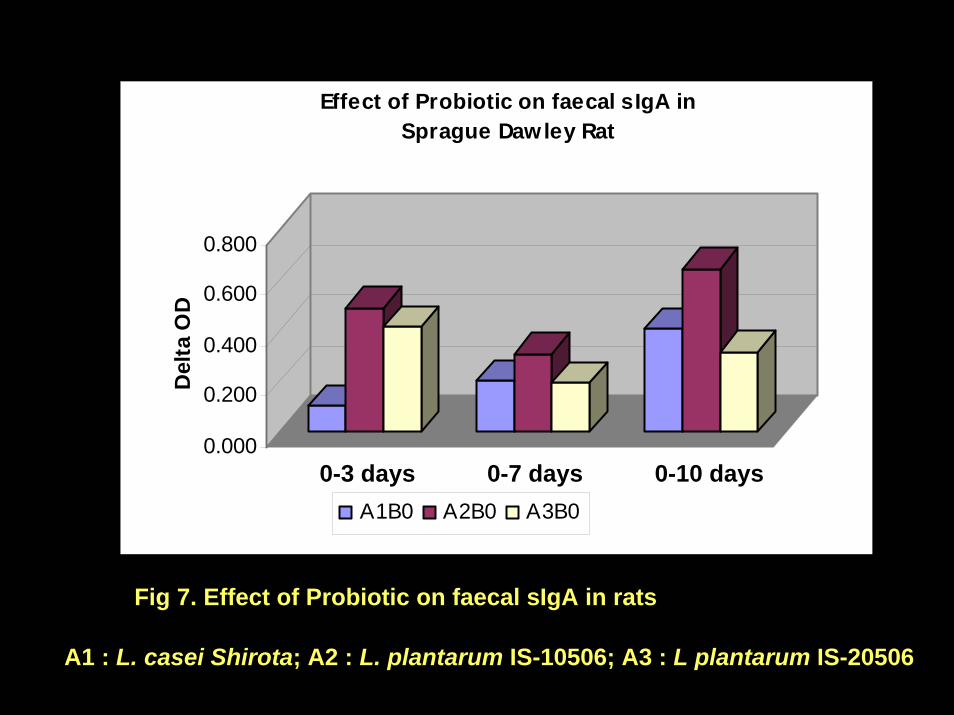
A1 : L. casei Shirota; A2 : L. plantarum IS-10506; A3 : L plantarum IS-20506
0.000
0.200
0.400
0.600
0.800
Del
ta O
D
Effect of Probiotic on faecal sIgA in Sprague Dawley Rat
A1B0 A2B0 A3B0
Fig 7. Effect of Probiotic on faecal sIgA in rats
0-3 days 0-7 days 0-10 days
E. faecium IS-27526 in Young children (under 5 years)
• Serum IgA• sIgA saliva• Serum IgG• Nutritional status
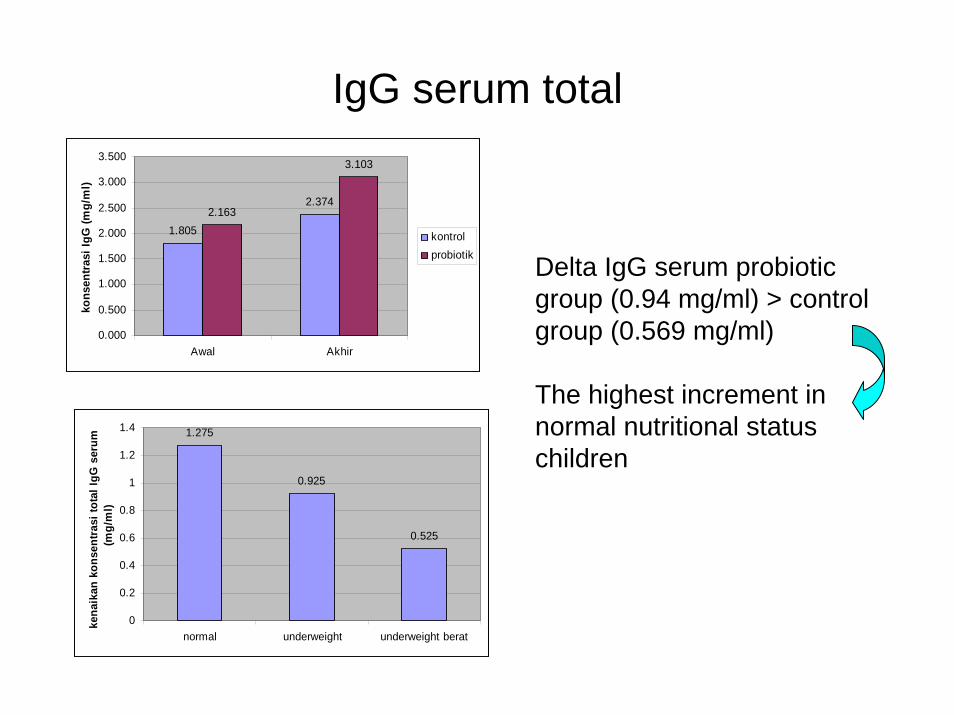
IgG serum total
1.805
2.3742.163
3.103
0.000
0.500
1.000
1.500
2.000
2.500
3.000
3.500
Awal Akhir
kons
entra
si Ig
G (m
g/m
l)
kontrolprobiotik
1.275
0.925
0.525
0
0.2
0.4
0.6
0.8
1
1.2
1.4
normal underweight underweight berat
kena
ikan
kon
sent
rasi
tota
l IgG
ser
um
(mg/
ml)
Delta IgG serum probiotic group (0.94 mg/ml) > control group (0.569 mg/ml)
The highest increment in normal nutritional status children
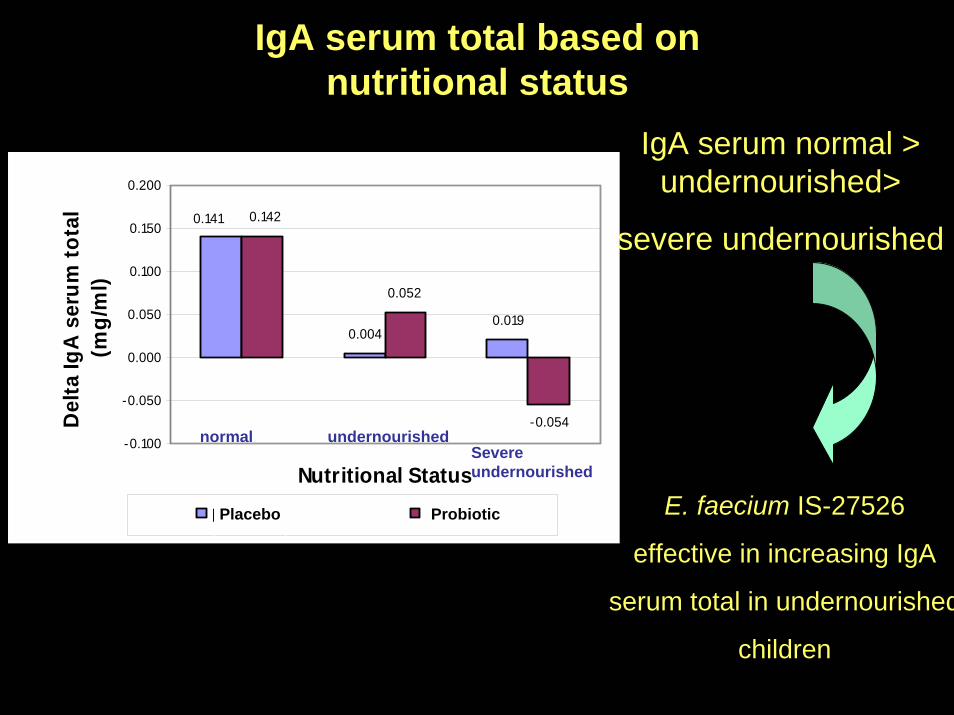
IgA serum total based on nutritional status
0.0040.019
0.052
-0.054
0.141 0.142
-0.100
-0.050
0.000
0.050
0.100
0.150
0.200
Nutritional Status
Del
ta Ig
A s
erum
tota
l (m
g/m
l)
plasebo probiotik
IgA serum normal > undernourished>
severe undernourished
E. faecium IS-27526
effective in increasing IgA
serum total in undernourished
children
undernourishednormalSevere undernourished
Placebo Probiotic
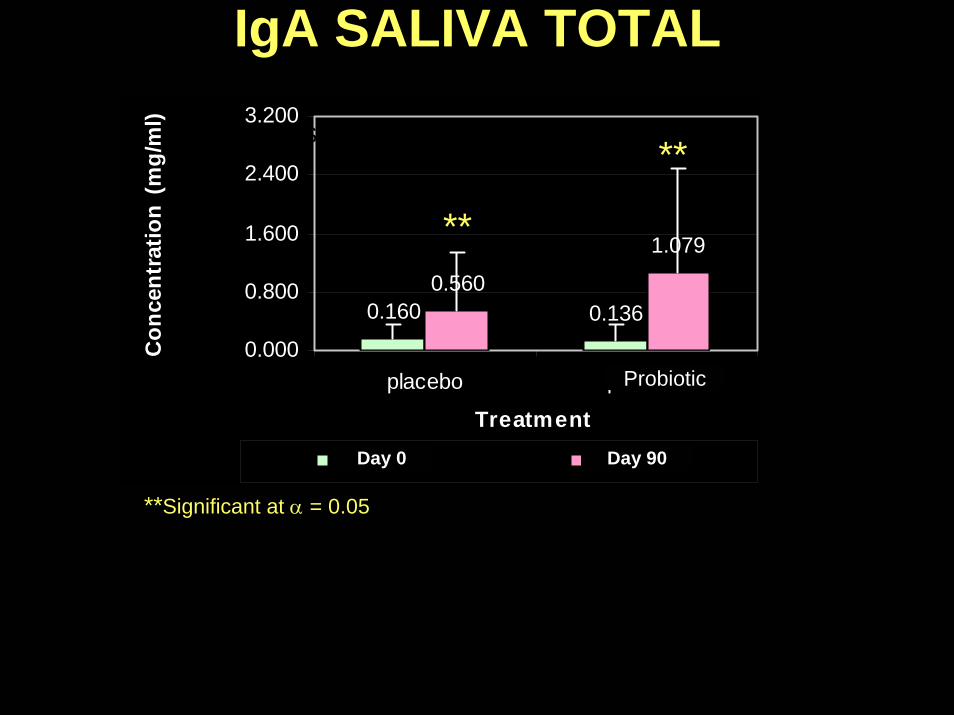
IgA SALIVA TOTAL
0.160 0.1360.560
1.079
0.000
0.800
1.600
2.400
3.200
placebo probiotik
Treatment
Con
cent
ratio
n (m
g/m
l)
hari ke-0 hari ke-90
**IgA Saliva Total
** **
**
**Significant at α = 0.05
Probiotic
Day 0 Day 90
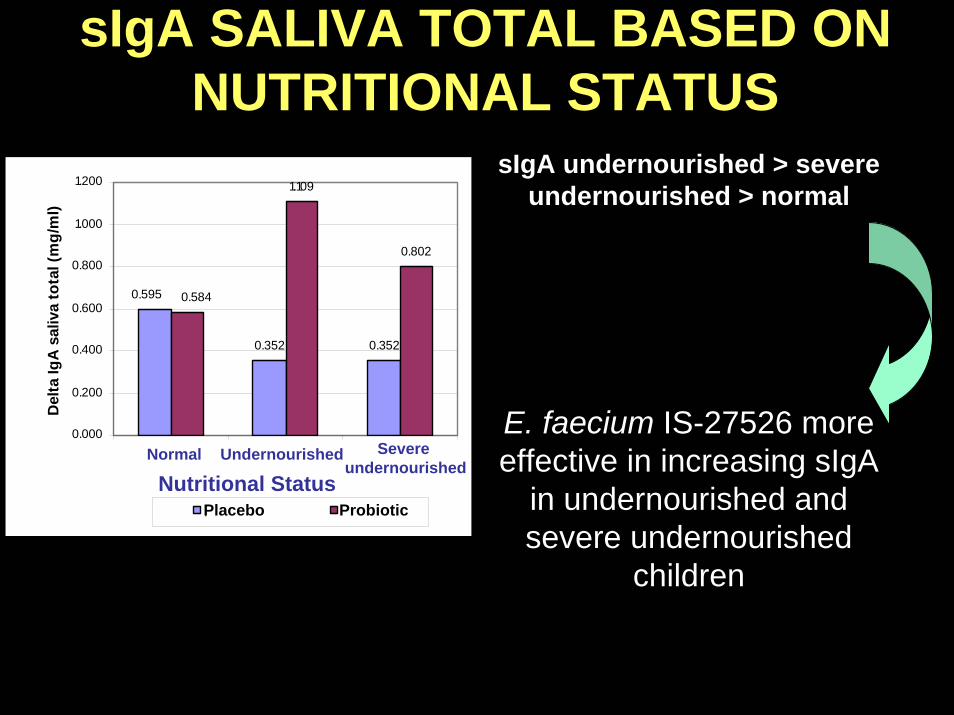
sIgA SALIVA TOTAL BASED ONNUTRITIONAL STATUS
sIgA undernourished > severe undernourished > normal
E. faecium IS-27526 more effective in increasing sIgA
in undernourished and severe undernourished
children
0.352 0.352
1.109
0.802
0.595 0.584
0.000
0.200
0.400
0.600
0.800
1.000
1.200
normal kurang sangat kurang
Status Gizi
Del
ta Ig
A s
aliv
a to
tal (
mg/
ml)
plasebo probiotik
Normal Undernourished Severe undernourished
Nutritional StatusPlacebo Probiotic
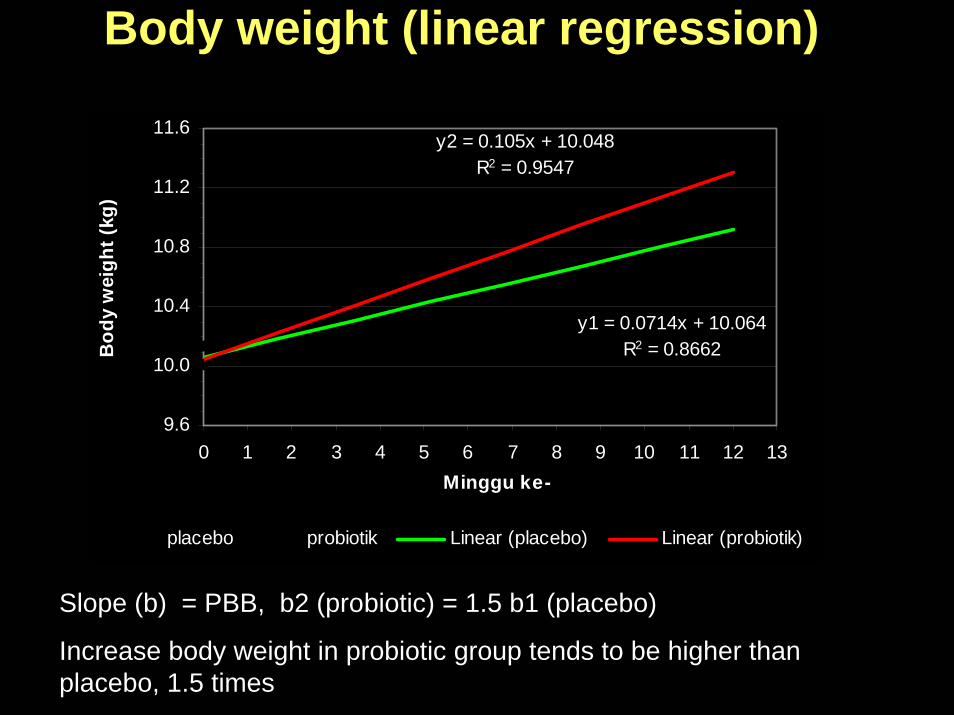
Body weight (linear regression)
y1 = 0.0714x + 10.064R2 = 0.8662
y2 = 0.105x + 10.048R2 = 0.9547
9.6
10.0
10.4
10.8
11.2
11.6
0 1 2 3 4 5 6 7 8 9 10 11 12 13Minggu ke-
Bod
y w
eigh
t (kg
)
placebo probiotik Linear (placebo) Linear (probiotik)
Slope (b) = PBB, b2 (probiotic) = 1.5 b1 (placebo)
Increase body weight in probiotic group tends to be higher than placebo, 1.5 times
42.11
31.71
0
5
10
15
20
25
30
35
40
45
Probiotik Kontrol
pers
en (%
)
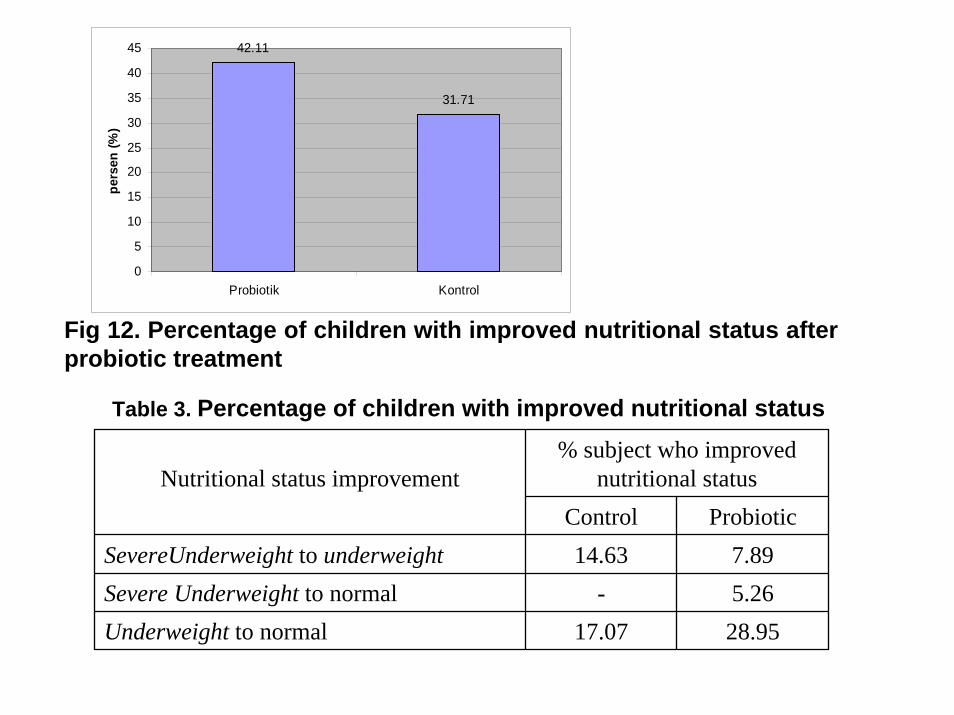
Table 3. Percentage of children with improved nutritional status% subject who improved
nutritional statusNutritional status improvementControl Probiotic
SevereUnderweight to underweight 14.63 7.89Severe Underweight to normal - 5.26Underweight to normal 17.07 28.95
Fig 12. Percentage of children with improved nutritional status after probiotic treatment
Detoxification
Bio elimination of cyanobacterial toxin Microcystin-LR (MC-LR)
Metabolically active removal of MC-LR
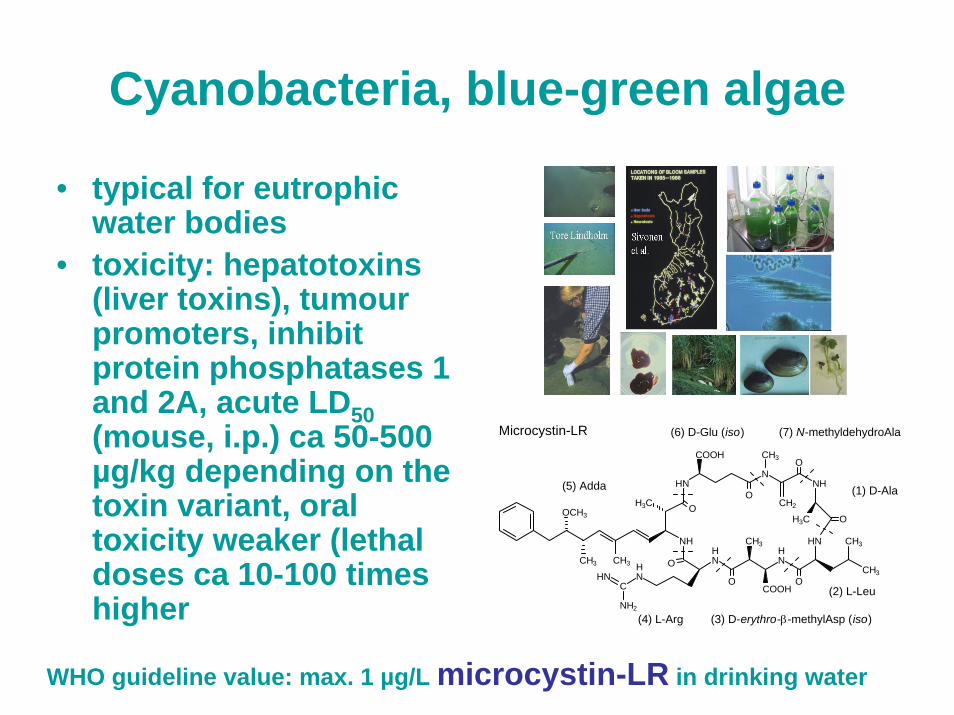
Cyanobacteria, blue-green algae
• typical for eutrophicwater bodies
• toxicity: hepatotoxins (liver toxins), tumour promoters, inhibit protein phosphatases 1 and 2A, acute LD50(mouse, i.p.) ca 50-500 µg/kg depending on the toxin variant, oral toxicity weaker (lethal doses ca 10-100 times higher
NH
N
HNN
OCH3
CH3CH3
H3C
N
NC
NH2
HN
NH
HN CH3
CH3
CH3COOH
H3C
COOH
CH3
O
O
O
O
O
O
O
CH2
H H
H
(5) Adda
(6) D-Glu (iso) (7) N-methyldehydroAla
(1) D-Ala
(2) L-Leu
(3) D-erythro-β-methylAsp (iso)(4) L-Arg
Microcystin-LR
WHO guideline value: max. 1 µg/L microcystin-LR in drinking water
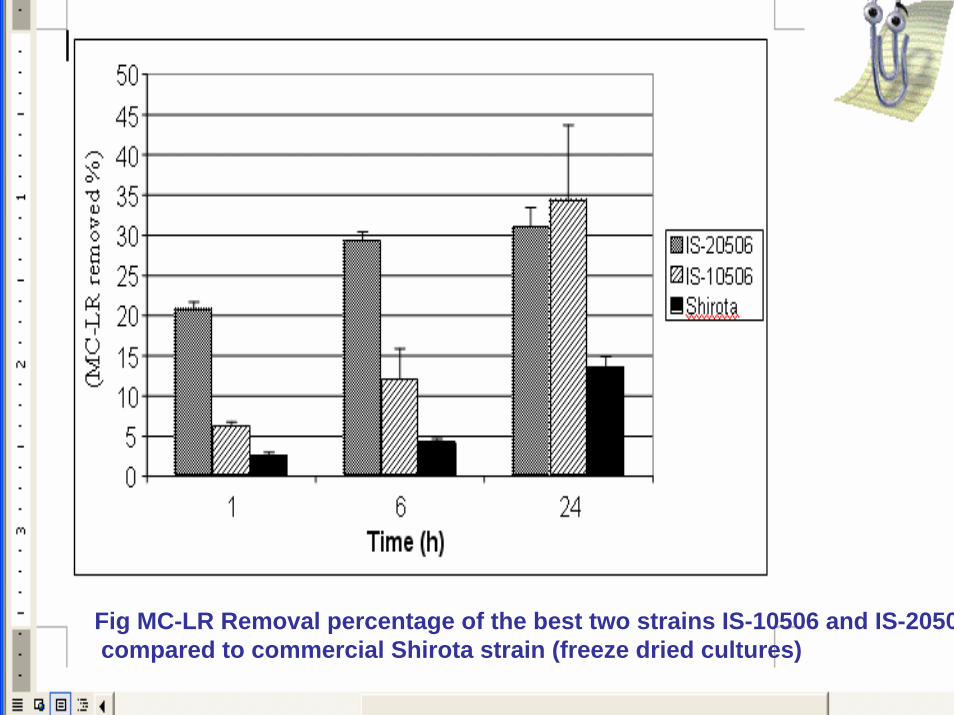
Fig MC-LR Removal percentage of the best two strains IS-10506 and IS-2050compared to commercial Shirota strain (freeze dried cultures)
0
10
20
30
40
50
60
70
80
90
24 30Incubation time (h)
MC
-LR
rem
oved
(%) b
a
cd
cd
cd
0
10
20
30
40
50
60
70
80
90
24 30Incubation time (h)
MC
-LR
rem
oved
(%)
b
a
dc
de
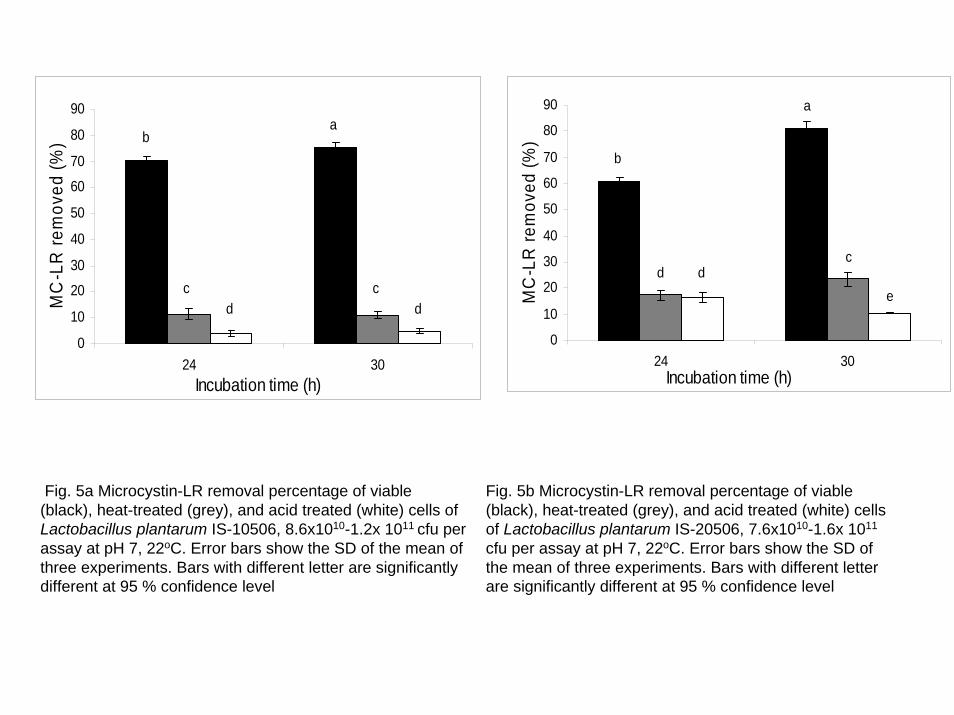
Fig. 5a Microcystin-LR removal percentage of viable (black), heat-treated (grey), and acid treated (white) cells of Lactobacillus plantarum IS-10506, 8.6x10¹⁰-1.2x 10¹¹ cfu per assay at pH 7, 22oC. Error bars show the SD of the mean of three experiments. Bars with different letter are significantly different at 95 % confidence level
Fig. 5b Microcystin-LR removal percentage of viable (black), heat-treated (grey), and acid treated (white) cells of Lactobacillus plantarum IS-20506, 7.6x10¹⁰-1.6x 10¹¹
cfu per assay at pH 7, 22oC. Error bars show the SD of the mean of three experiments. Bars with different letter are significantly different at 95 % confidence level
0
20
40
60
80
100
120
15 20 25 30incubation time (h)
MC
-LR
rem
oved
(%)
0
20
40
60
80
100
120
15 20 25 30incubation tim e (h)
MC
-LR
rem
oved
(%)
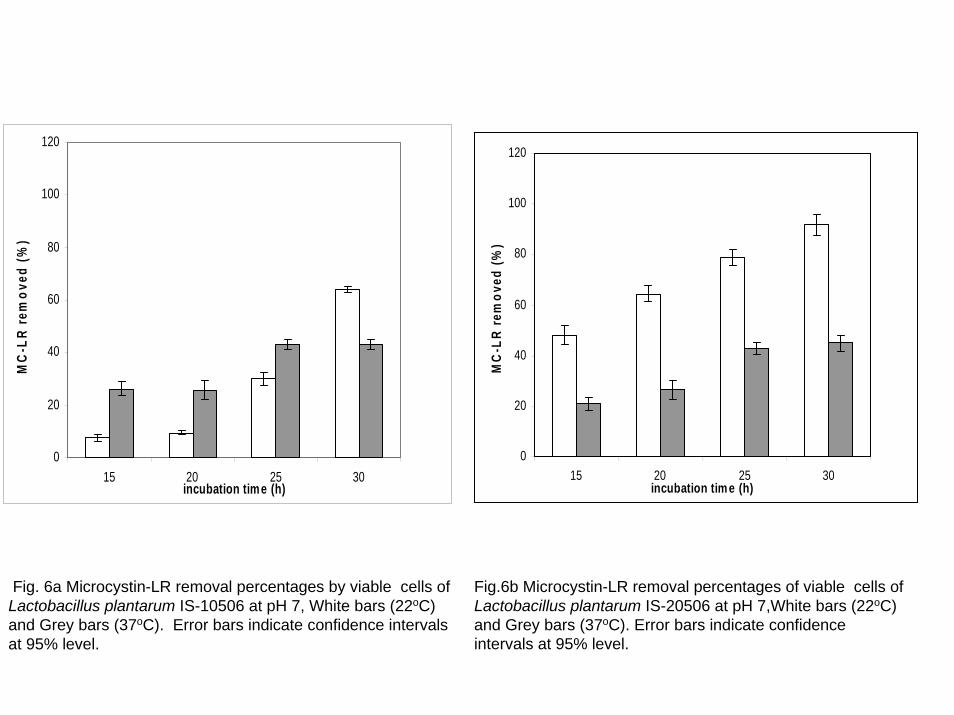
Fig. 6a Microcystin-LR removal percentages by viable cells of Lactobacillus plantarum IS-10506 at pH 7, White bars (22oC) and Grey bars (37oC). Error bars indicate confidence intervals at 95% level.
Fig.6b Microcystin-LR removal percentages of viable cells of Lactobacillus plantarum IS-20506 at pH 7,White bars (22oC) and Grey bars (37oC). Error bars indicate confidence intervals at 95% level.
IS-10506
Incubation time (h)
0 5 10 15 20 25 30
MC
-LR
rem
oved
(%)
0
20
40
60
80
100
log
viab
le c
ells
/ml
8
9
10
11
IS-20506
Incubation time (h)
0 5 10 15 20 25 30
MC
-LR
rem
oved
(%)
0
20
40
60
80
100
log
viab
le c
ells
/ml
7
8
9
10
11
12
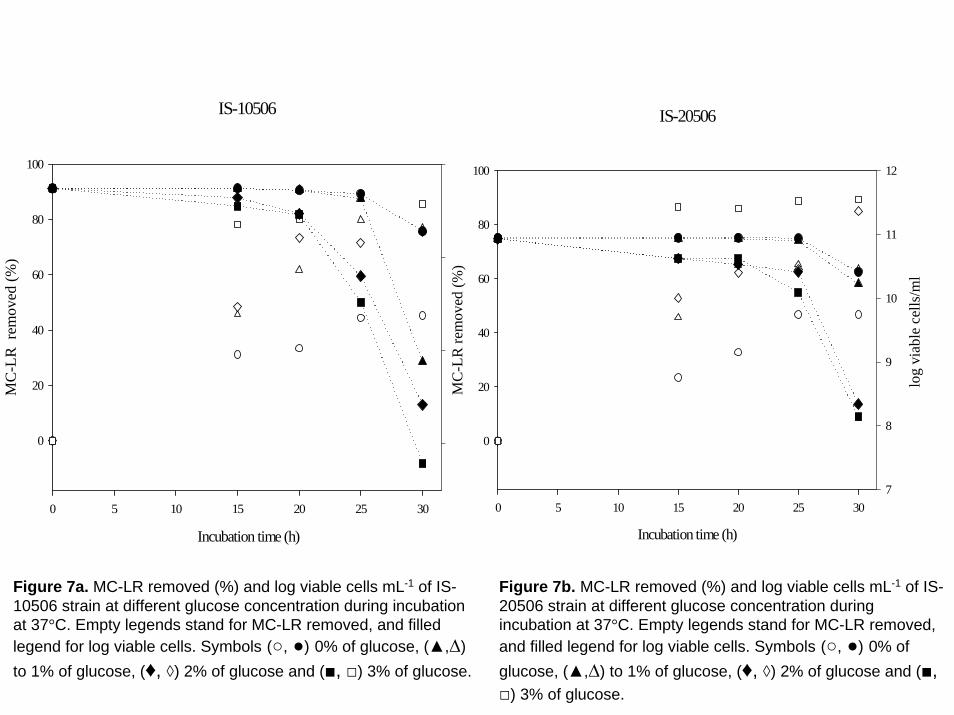
Figure 7a. MC-LR removed (%) and log viable cells mL-1 of IS-10506 strain at different glucose concentration during incubation at 37°C. Empty legends stand for MC-LR removed, and filled legend for log viable cells. Symbols (○, ●) 0% of glucose, (▲,∆) to 1% of glucose, (♦, ◊) 2% of glucose and (■, □) 3% of glucose.
Figure 7b. MC-LR removed (%) and log viable cells mL-1 of IS-20506 strain at different glucose concentration during incubation at 37°C. Empty legends stand for MC-LR removed, and filled legend for log viable cells. Symbols (○, ●) 0% of glucose, (▲,∆) to 1% of glucose, (♦, ◊) 2% of glucose and (■, □) 3% of glucose.
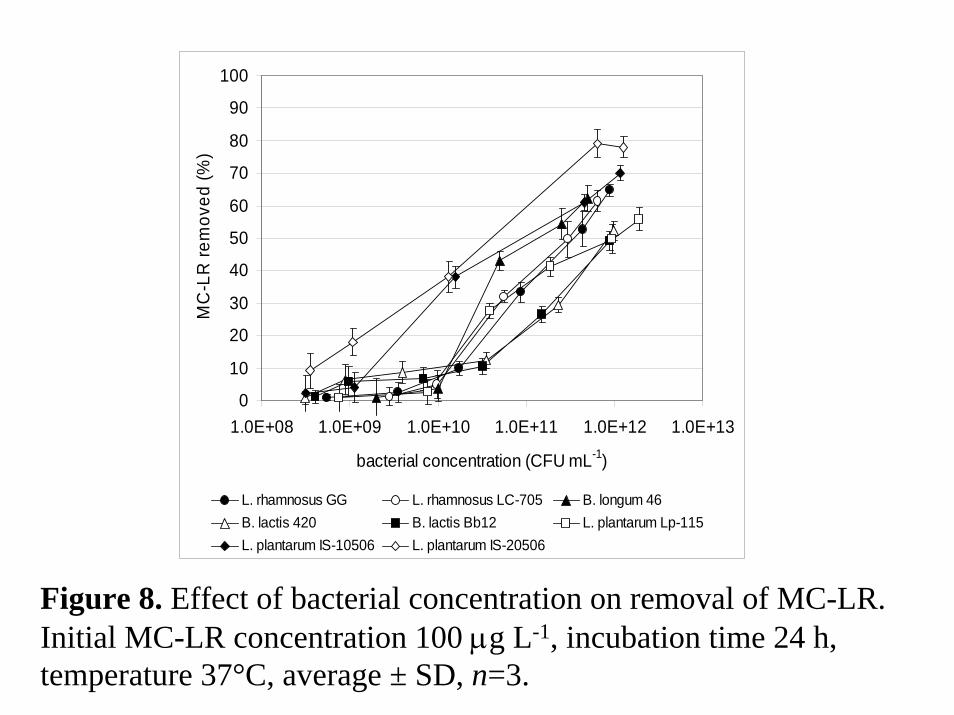
Figure 8. Effect of bacterial concentration on removal of MC-LR. Initial MC-LR concentration 100 μg L-1, incubation time 24 h, temperature 37°C, average ± SD, n=3.
0
10
20
30
40
50
60
70
80
90
100
1.0E+08 1.0E+09 1.0E+10 1.0E+11 1.0E+12 1.0E+13
bacterial concentration (CFU mL-1)
MC
-LR
rem
oved
(%)
L. rhamnosus GG L. rhamnosus LC-705 B. longum 46B. lactis 420 B. lactis Bb12 L. plantarum Lp-115L. plantarum IS-10506 L. plantarum IS-20506
On going research
L. plantarum IS-10506 : HIV/AIDS patient• Profile fecal microbiota• Humoral immune system• Cellular immune system
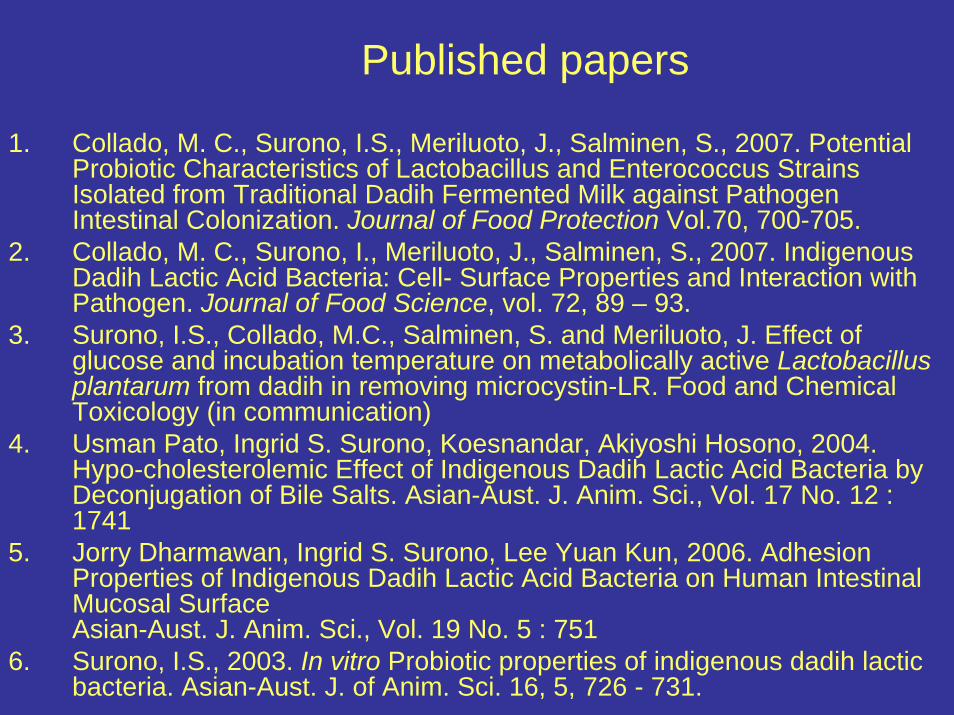
Published papers
1. Collado, M. C., Surono, I.S., Meriluoto, J., Salminen, S., 2007. Potential Probiotic Characteristics of Lactobacillus and Enterococcus Strains Isolated from Traditional Dadih Fermented Milk against Pathogen Intestinal Colonization. Journal of Food Protection Vol.70, 700-705.
2. Collado, M. C., Surono, I., Meriluoto, J., Salminen, S., 2007. Indigenous Dadih Lactic Acid Bacteria: Cell- Surface Properties and Interaction with Pathogen. Journal of Food Science, vol. 72, 89 – 93.
3. Surono, I.S., Collado, M.C., Salminen, S. and Meriluoto, J. Effect of glucose and incubation temperature on metabolically active Lactobacillus plantarum from dadih in removing microcystin-LR. Food and Chemical Toxicology (in communication)
4. Usman Pato, Ingrid S. Surono, Koesnandar, Akiyoshi Hosono, 2004. Hypo-cholesterolemic Effect of Indigenous Dadih Lactic Acid Bacteria by Deconjugation of Bile Salts. Asian-Aust. J. Anim. Sci., Vol. 17 No. 12 : 1741
5. Jorry Dharmawan, Ingrid S. Surono, Lee Yuan Kun, 2006. Adhesion Properties of Indigenous Dadih Lactic Acid Bacteria on Human Intestinal Mucosal Surface Asian-Aust. J. Anim. Sci., Vol. 19 No. 5 : 751
6. Surono, I.S., 2003. In vitro Probiotic properties of indigenous dadih lactic bacteria. Asian-Aust. J. of Anim. Sci. 16, 5, 726 - 731.
Financial Support
• Viability, and immuno modulatoryproperties : Ministry of Research and Technology (2002 – 2004)
• Adhesion and detoxification properties :Academy of Finland decisions RC 210309 and RC 210310
Prebiotic Research
• Roots and tubers as source of prebiotic : Sweet potato, bread fruit, taro, araroot
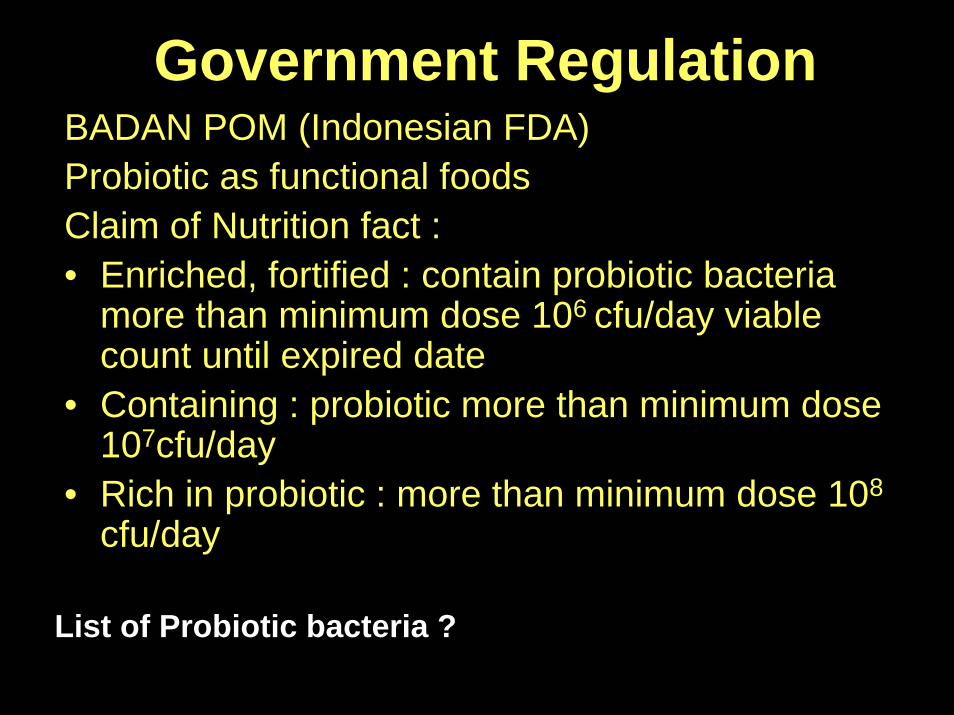
Government RegulationBADAN POM (Indonesian FDA) Probiotic as functional foodsClaim of Nutrition fact :• Enriched, fortified : contain probiotic bacteria
more than minimum dose 106 cfu/day viable count until expired date
• Containing : probiotic more than minimum dose 107cfu/day
• Rich in probiotic : more than minimum dose 108
cfu/day
List of Probiotic bacteria ?
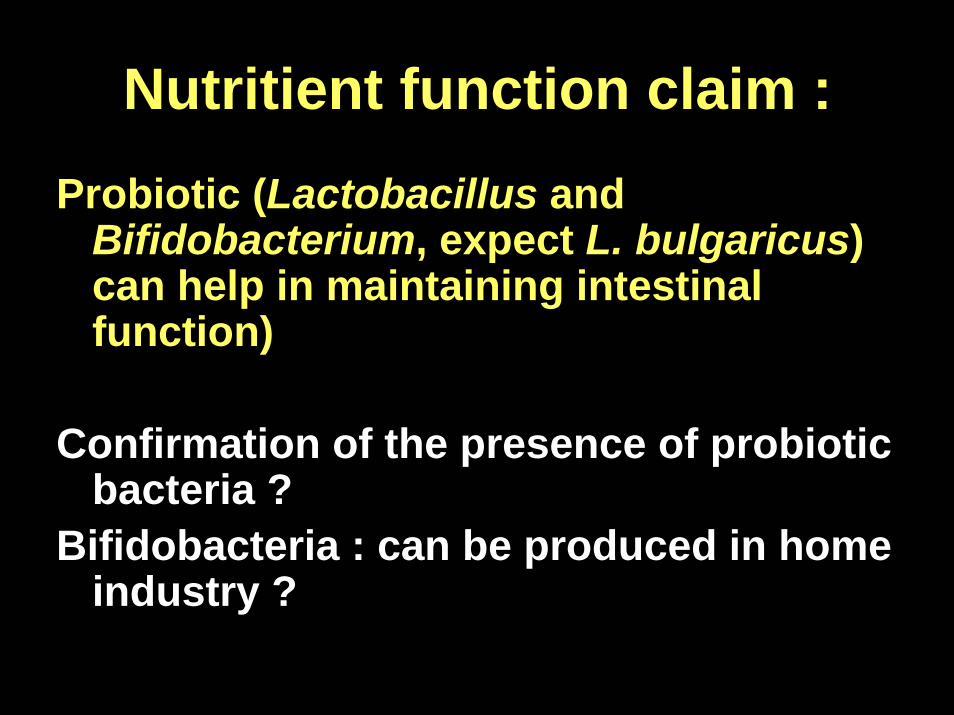
Nutritient function claim :Probiotic (Lactobacillus and
Bifidobacterium, expect L. bulgaricus) can help in maintaining intestinal function)
Confirmation of the presence of probioticbacteria ?
Bifidobacteria : can be produced in home industry ?

Health benefit claimNo health claim in Label and advertisement Label and advertisement for probiotic product
should mention Genus, species, and strain, minimun viable counts at the end of expired date, information about amount of probiotic and its fisiological effect. Storage condition, contact number of producer
Human studies on Indonesian people, minimum 20 subjects : Adequate amount ?
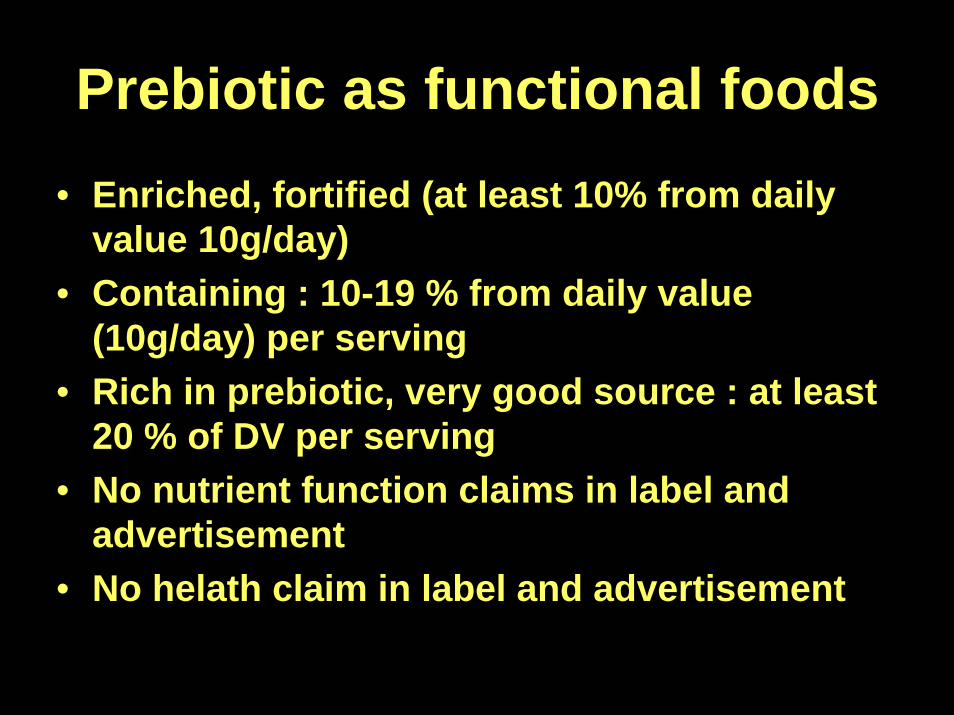
Prebiotic as functional foods• Enriched, fortified (at least 10% from daily
value 10g/day)• Containing : 10-19 % from daily value
(10g/day) per serving• Rich in prebiotic, very good source : at least
20 % of DV per serving• No nutrient function claims in label and
advertisement• No helath claim in label and advertisement
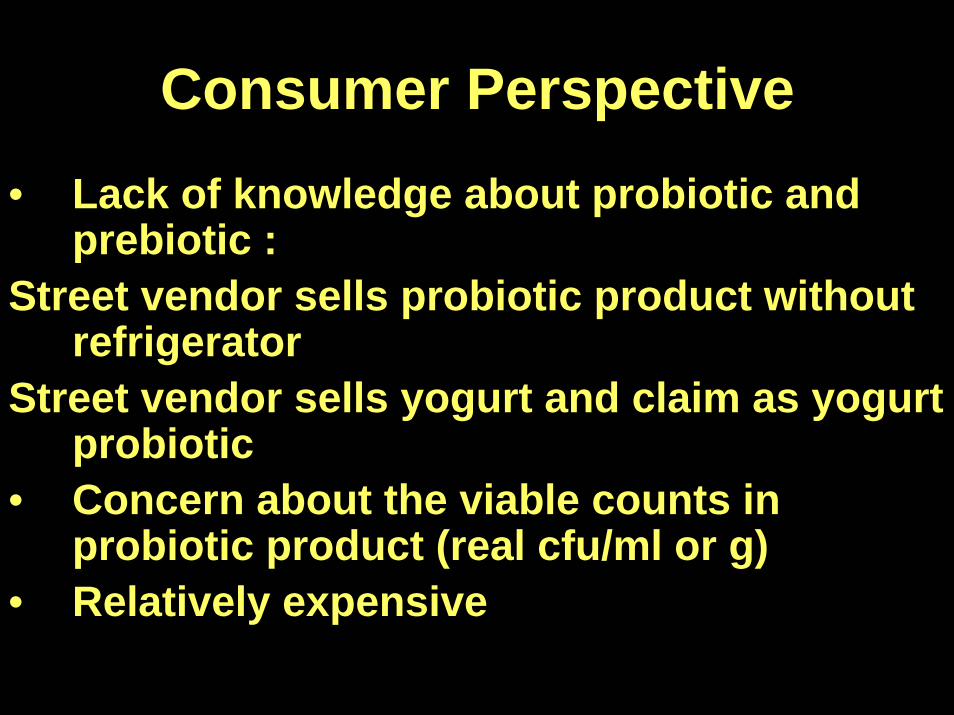
Consumer Perspective• Lack of knowledge about probiotic and
prebiotic : Street vendor sells probiotic product without
refrigeratorStreet vendor sells yogurt and claim as yogurt
probiotic• Concern about the viable counts in
probiotic product (real cfu/ml or g)• Relatively expensive
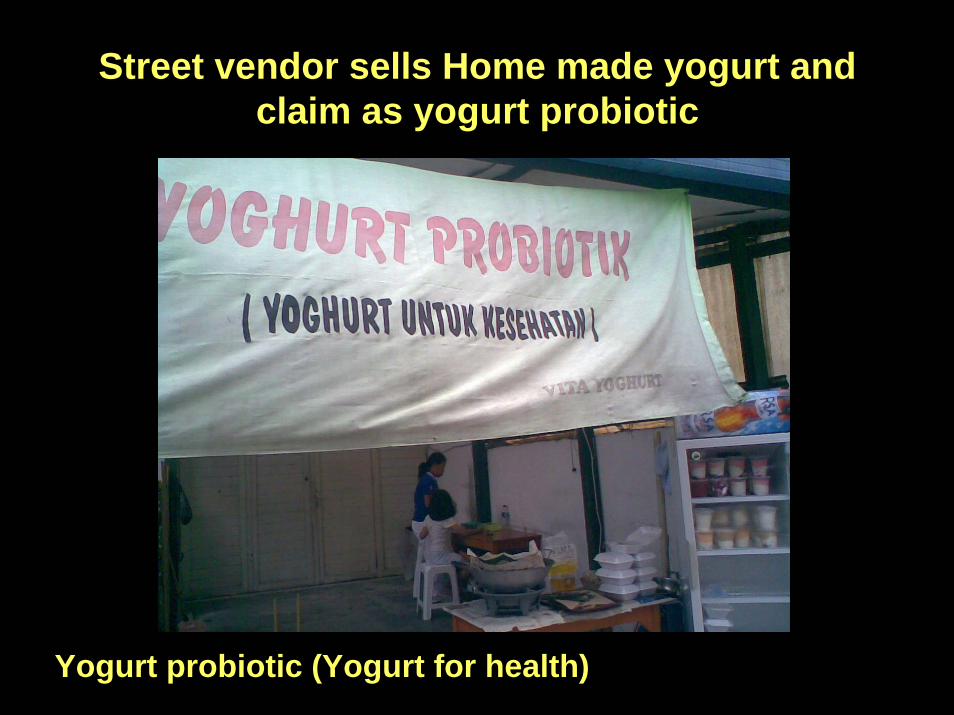
Street vendor sells Home made yogurt and claim as yogurt probiotic
Yogurt probiotic (Yogurt for health)
Producers Perspective
• Rigid government regulations for health claim : using defined commercial strain with scientific based evident, can not do health claim
• Need to educate customer to gain awareness on health benefit of probiotic

High Appreciation to Wonderful Team work

Thank You Very Much for your kind attention