measuring environmental values Sustainability...
38
Sustainability Analysis of Electricity Generation from Renewable Biomass Mike Kennedy, CEO and President Green Analytics measuring environmental values
Transcript of measuring environmental values Sustainability...
Sustainability Analysis of Electricity Generation
from Renewable Biomass
Mike Kennedy, CEO and President
Green Analytics
measuring environmental values
Green Analytics
• Who We Are
– Green Analytics is an independent consulting firm
focused on research, socio-economic analysis, and
complex and systems modelling to support public
and private decision-making that protects the
environment and provides economic returns.
• Our clients include:
– Government, industrial, non-profit and charitable institutions
who choose to seek progressive solutions towards advancing
the green economy.
• I want to recognize key contributors:
– Dave Lovekin: Project Manager
– Rich Wong: Lifecycle Analysis Lead
– Andrew Vandenbroek: Forest Carbon Analysis Lead
– Marlo Reynolds: Project Advisor
– Rob Lyng: Client
– Tammy Wong: Client
– Technical Advisory Members
– Staff of Ontario Ministry of Natural Resources
Recognition
Green Analytics
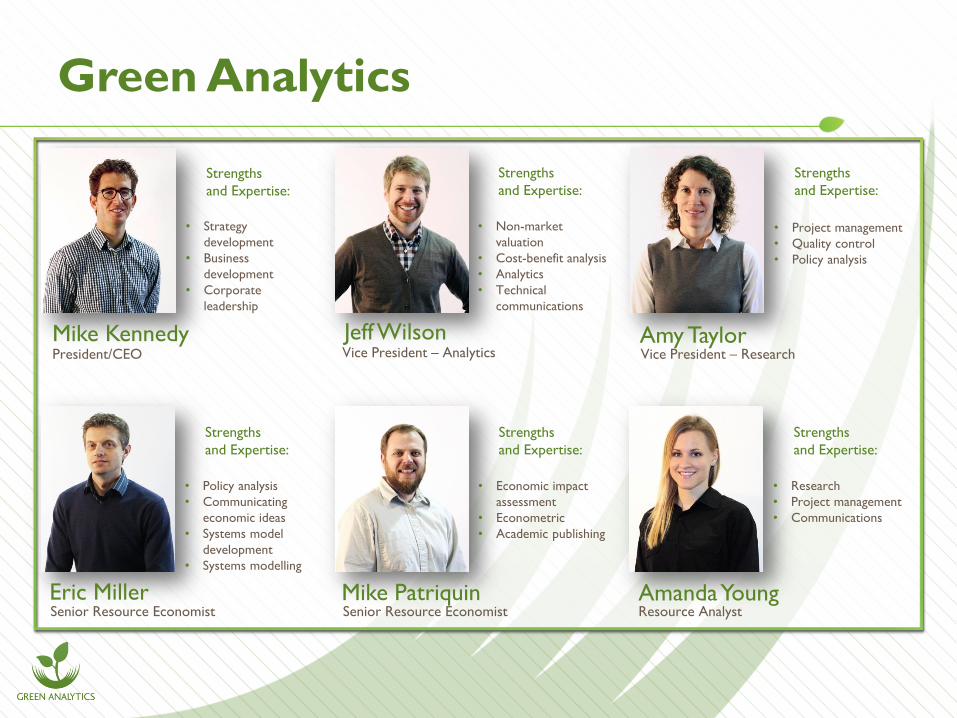
Mike Kennedy Jeff Wilson Amy Taylor
Eric Miller Mike Patriquin Amanda Young
President/CEO Vice President – Analytics Vice President – Research
Senior Resource Economist Senior Resource Economist Resource Analyst
• Strategy
development
• Business
development
• Corporate
leadership
• Policy analysis
• Communicating
economic ideas
• Systems model
development
• Systems modelling
• Economic impact
assessment
• Econometric
• Academic publishing
• Research
• Project management
• Communications
• Project management
• Quality control
• Policy analysis
• Non-market
valuation
• Cost-benefit analysis
• Analytics
• Technical
communications
Strengths
and Expertise:
Strengths
and Expertise:
Strengths
and Expertise:
Strengths
and Expertise:
Strengths
and Expertise:
Strengths
and Expertise:

To conduct a sustainability analysis of using renewable sources of biomass for electricity generation in four existing coal-fired generating
stations in Ontario.*
*The outcome of the project will provide further direction to OPG on whether utilizing biomass in their generating stations using crown-land biomass can be done so in a sustainable way.
Project Objective and Outcome

Project Scope:
Ontario’s Forest Management Units
• Forest carbon stocks, flux over time (100 years)
• Lifecycle GHG emissions from the biomass pathway
• Inventory of forest biomass resource
• Comparison with natural gas pathway
• Social well-being impact assessment (not presented today)
Sources: Peer-reviewed, post 1999 data and publications
Parameters of the Sustainability
Analysis
Scenario Definitions: • NH (No harvest): no harvesting takes place in the forest
• BAU (Business-as-usual): Harvesting takes place at a rate that is equal to a chosen historical rate.
– 15 M m3 for 2015 to 2020
– 20 M m3 for 2020 to 2115
• CO-FIRE (BAU + 2M ODT):
– 15 M m3/period for 2015 to 2020
– 20 M m3/period for 2020 to 2115
– Harvest forest residues as priority
• MAX CO-FIRE (MSH):
– Maximize the sustainable harvest level
– 21 Mm3/period for the entire planning horizon
OPG’s Four Scenarios
Caveat
• Ecosystem service impacts were out of scope for this analysis.
• We don’t know what the implications of the scenarios presented might mean for fauna, flora and fin.
• This work is advancing quickly…
http://www.youtube.com/watch?v=-Jw9dPYVT_Y
• Develop a modelling framework
• Gather input from Technical Advisory
Committee
• Define modelling scenarios
• Define modelling assumptions
• Present and discuss results
General Project Approach

Modelling Framework
• Parameterized a
collection of models to
form a biomass
sustainability analysis
modeling framework
• Gathered input from
provincial experts
(Technical Advisory
Committee)
FMA based Spatial Planning Tool
Forest Sector Model
Carbon Budget Model
Lifecycle Assessment of Wood Pellet Supply chain
Socio-economic Assessment
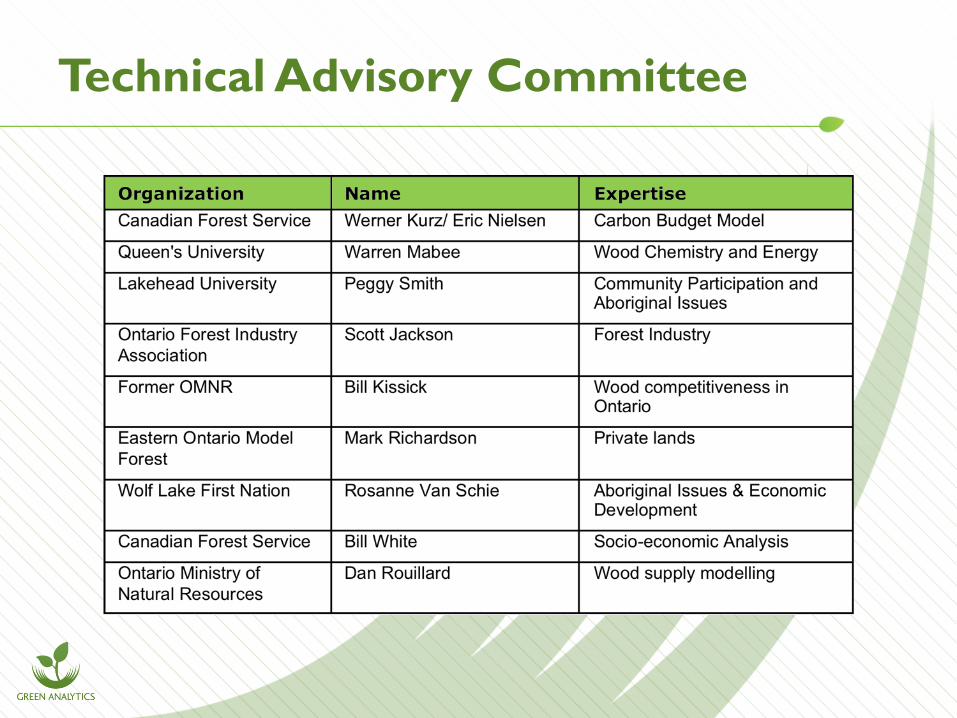
Technical Advisory Committee
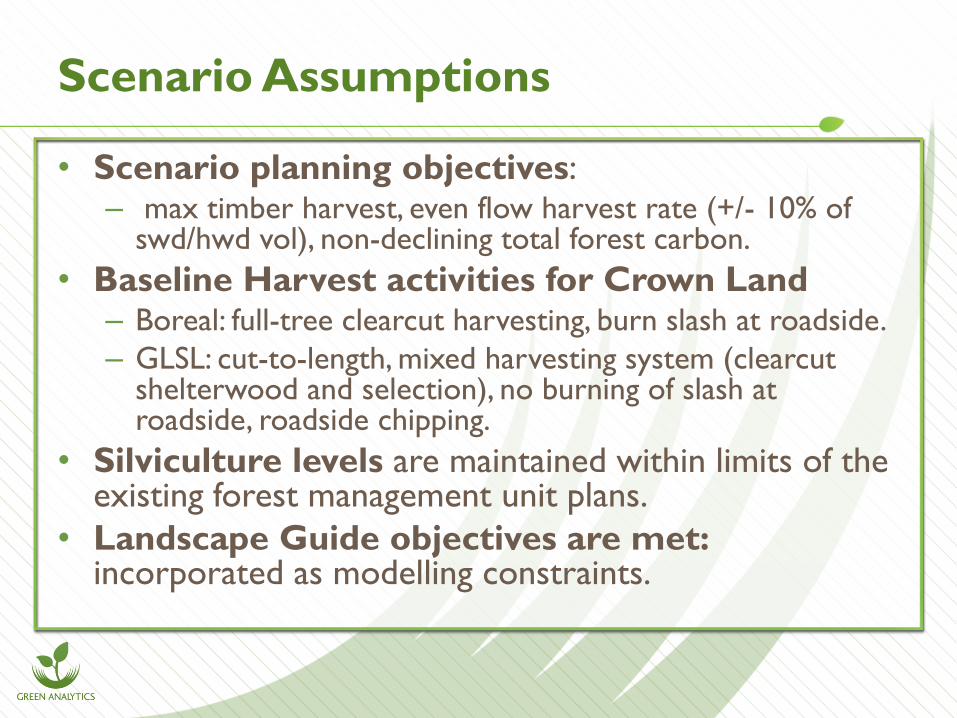
• Scenario planning objectives: – max timber harvest, even flow harvest rate (+/- 10% of
swd/hwd vol), non-declining total forest carbon.
• Baseline Harvest activities for Crown Land – Boreal: full-tree clearcut harvesting, burn slash at roadside.
– GLSL: cut-to-length, mixed harvesting system (clearcut shelterwood and selection), no burning of slash at roadside, roadside chipping.
• Silviculture levels are maintained within limits of the existing forest management unit plans.
• Landscape Guide objectives are met: incorporated as modelling constraints.
Scenario Assumptions
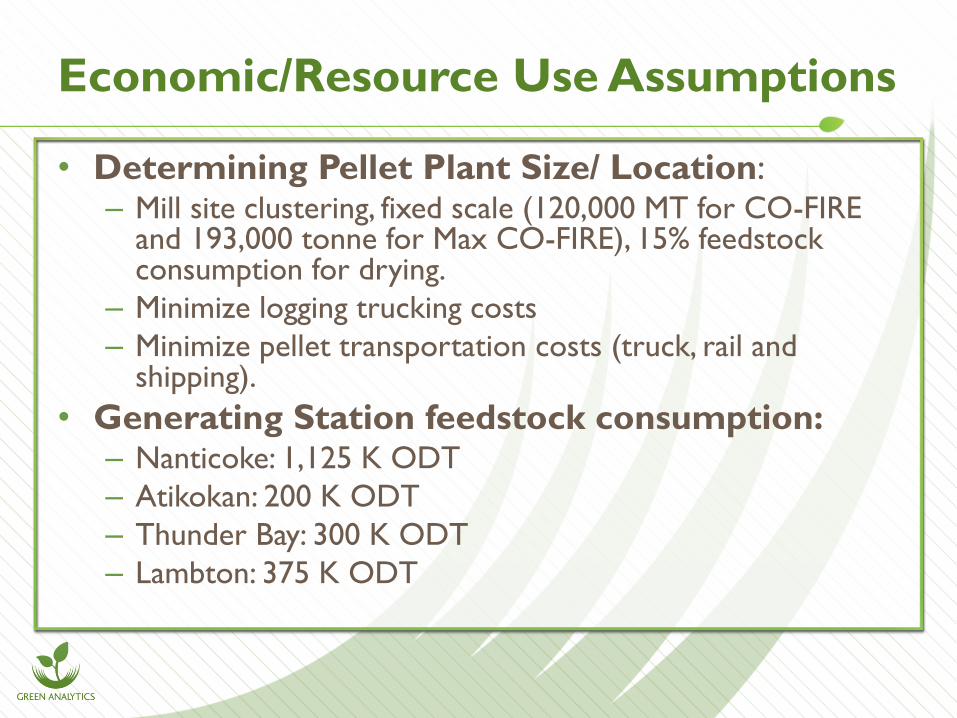
• Determining Pellet Plant Size/ Location: – Mill site clustering, fixed scale (120,000 MT for CO-FIRE
and 193,000 tonne for Max CO-FIRE), 15% feedstock consumption for drying.
– Minimize logging trucking costs
– Minimize pellet transportation costs (truck, rail and shipping).
• Generating Station feedstock consumption: – Nanticoke: 1,125 K ODT
– Atikokan: 200 K ODT
– Thunder Bay: 300 K ODT
– Lambton: 375 K ODT
Economic/Resource Use Assumptions
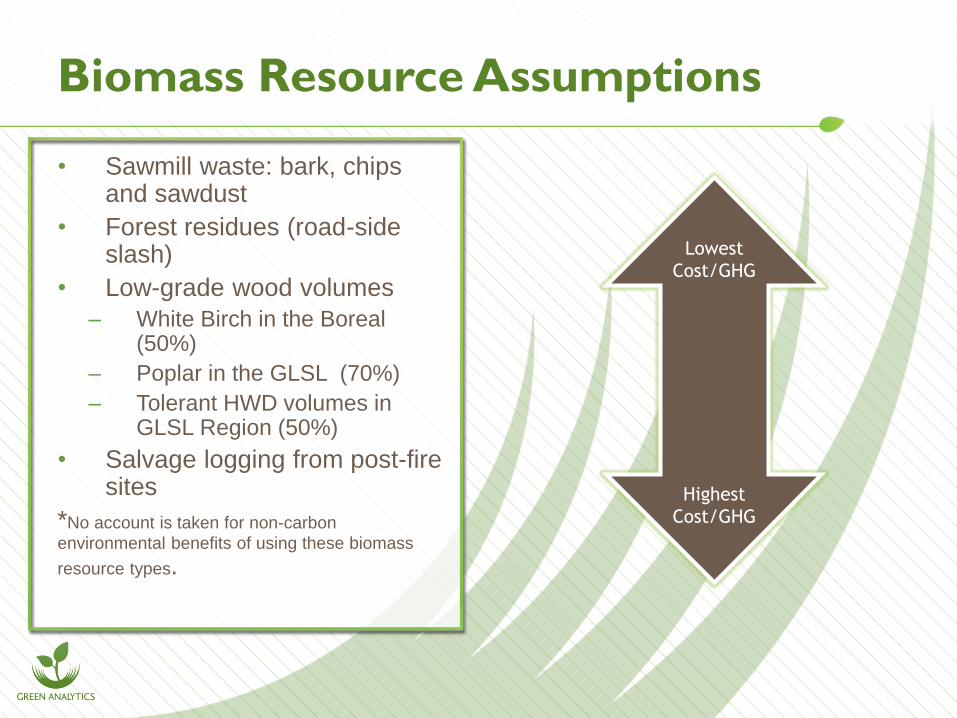
Biomass Resource Assumptions
• Sawmill waste: bark, chips and sawdust
• Forest residues (road-side slash)
• Low-grade wood volumes
– White Birch in the Boreal (50%)
– Poplar in the GLSL (70%)
– Tolerant HWD volumes in GLSL Region (50%)
• Salvage logging from post-fire sites
*No account is taken for non-carbon
environmental benefits of using these biomass
resource types.
Lowest
Cost/GHG
Highest
Cost/GHG
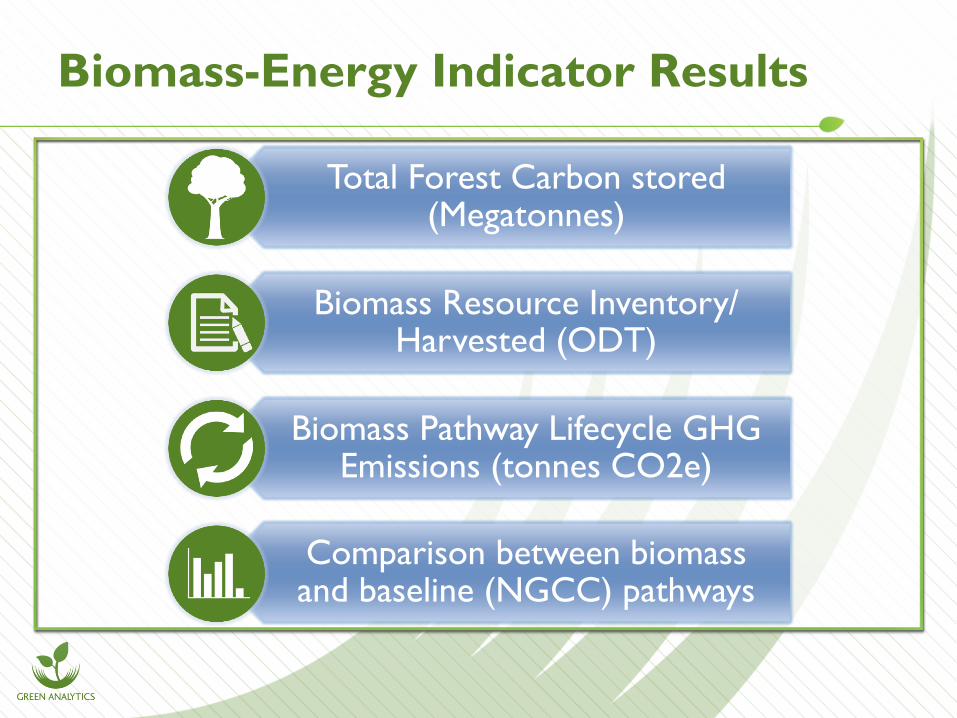
Total Forest Carbon stored (Megatonnes)
Biomass Resource Inventory/ Harvested (ODT)
Biomass Pathway Lifecycle GHG Emissions (tonnes CO2e)
Comparison between biomass and baseline (NGCC) pathways
Biomass-Energy Indicator Results
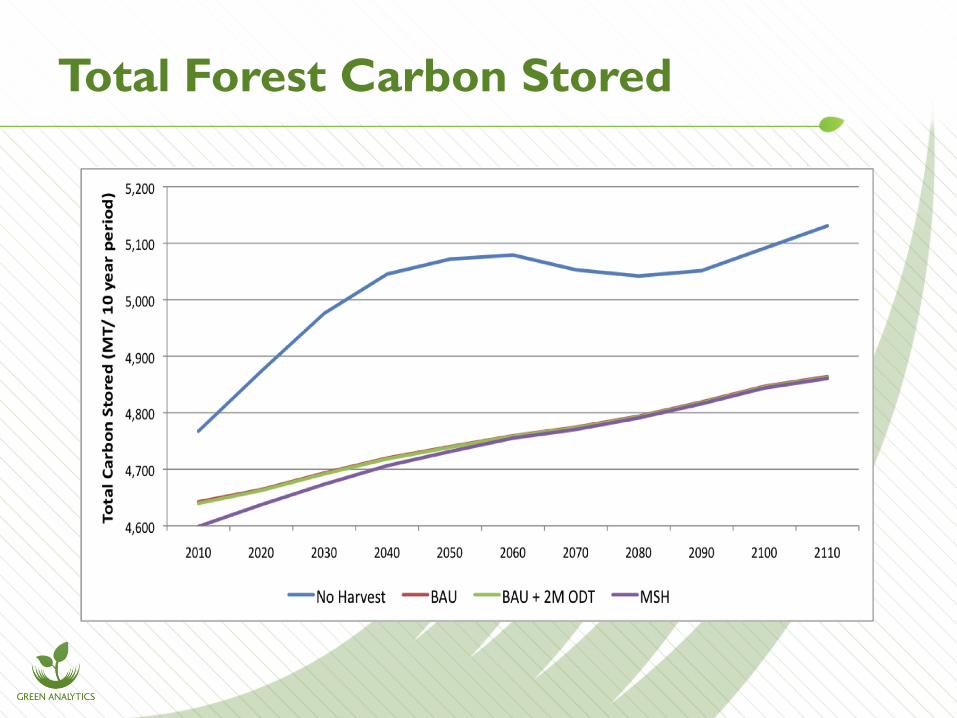
Total Forest Carbon Stored
Harvesting of forest biomass for electricity
production can be done in such a way as to not
systematically decrease forest carbon stores
over time.
Forest Carbon Stored: Findings
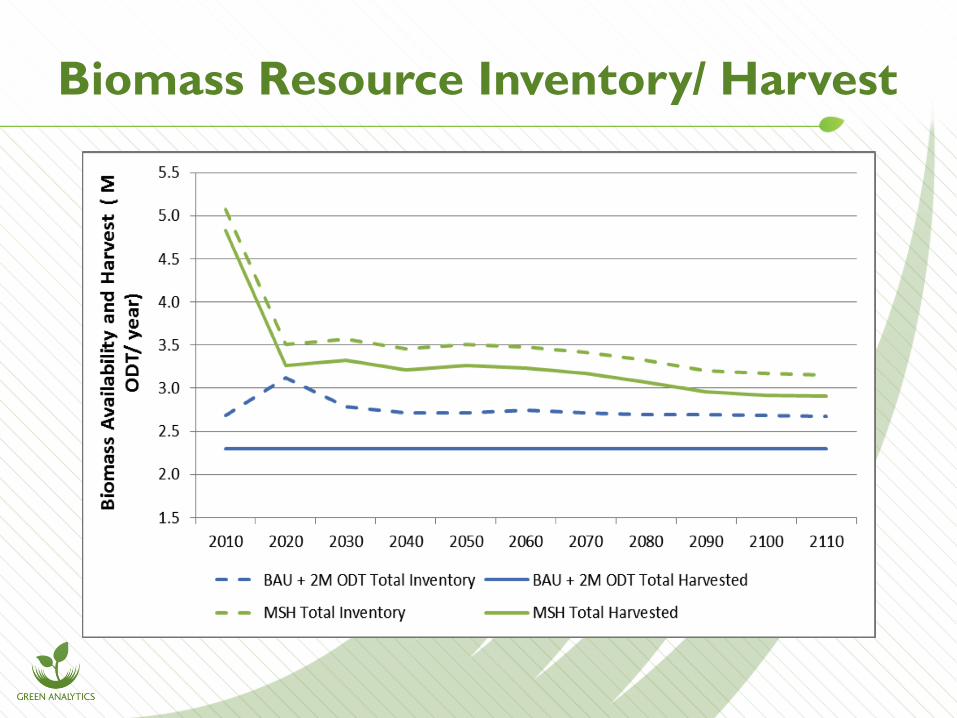
Biomass Resource Inventory/ Harvest
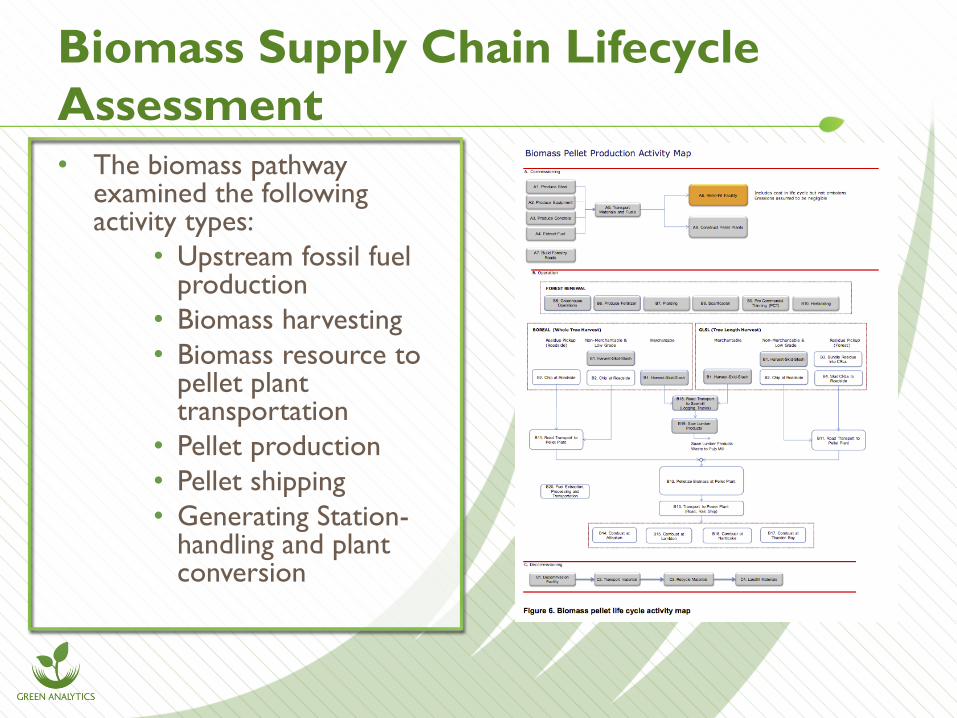
Biomass Supply Chain Lifecycle
Assessment • The biomass pathway
examined the following activity types:
• Upstream fossil fuel production
• Biomass harvesting
• Biomass resource to pellet plant transportation
• Pellet production
• Pellet shipping
• Generating Station- handling and plant conversion
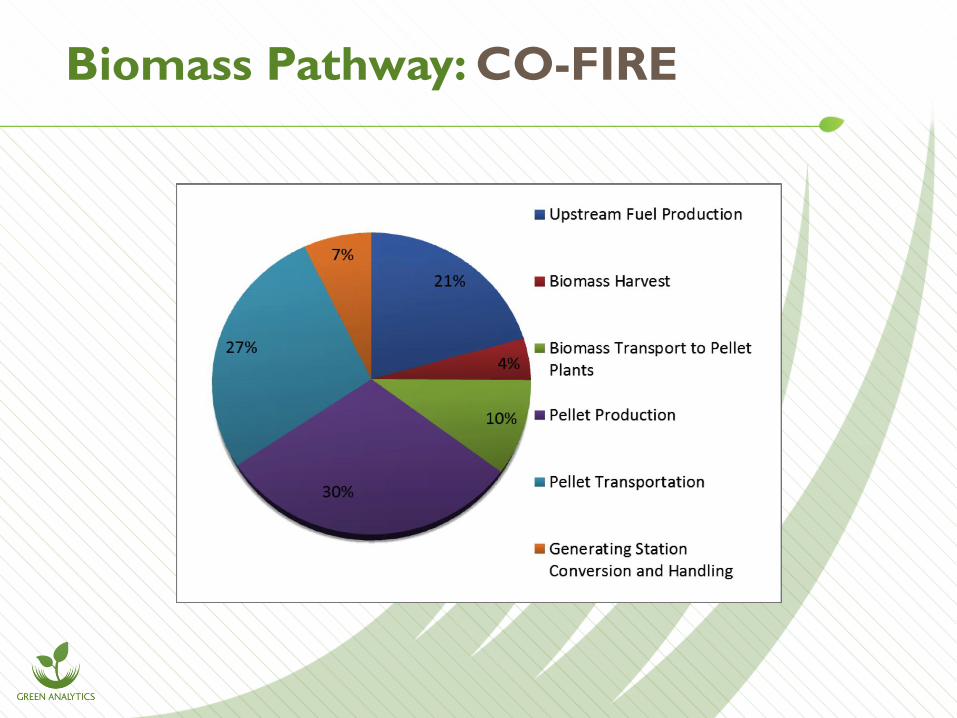
Biomass Pathway: CO-FIRE
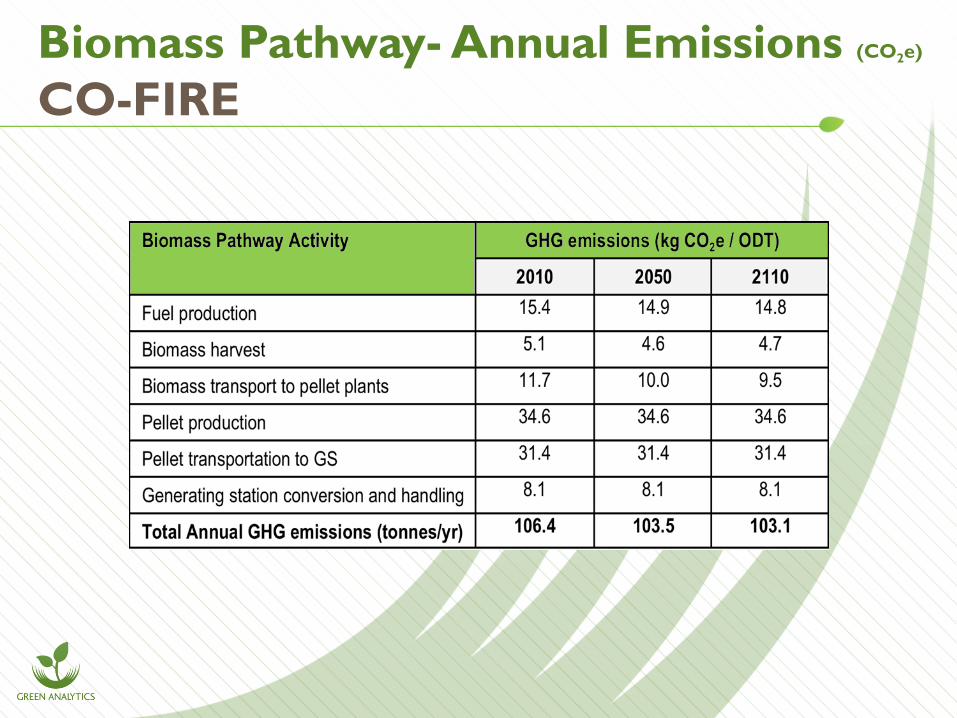
Biomass Pathway- Annual Emissions (CO2e)
CO-FIRE
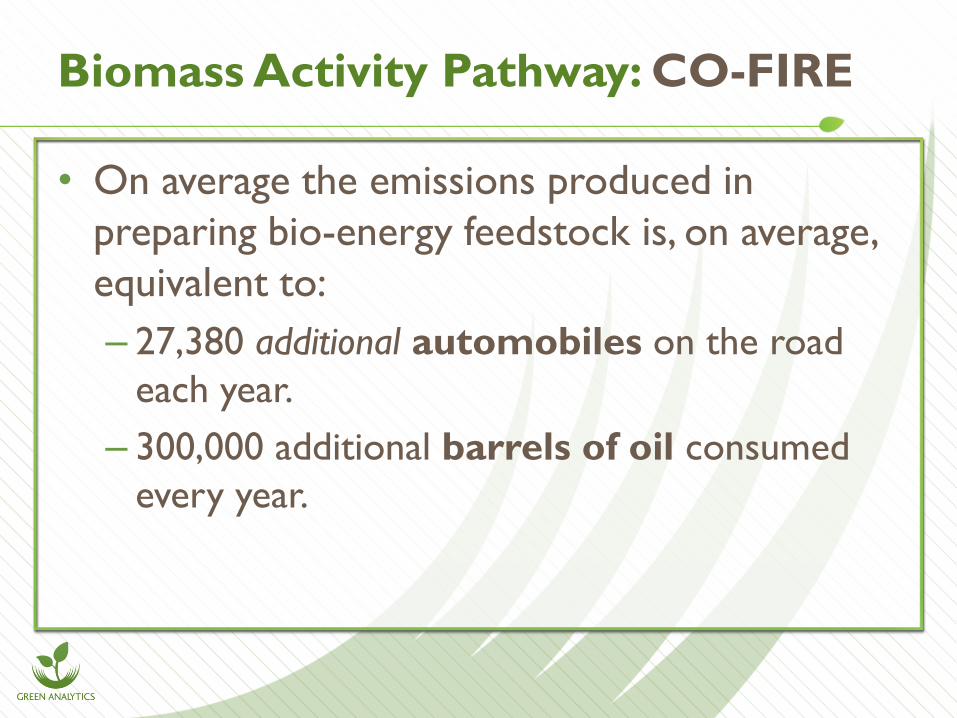
• On average the emissions produced in
preparing bio-energy feedstock is, on average,
equivalent to:
– 27,380 additional automobiles on the road
each year.
– 300,000 additional barrels of oil consumed
every year.
Biomass Activity Pathway: CO-FIRE
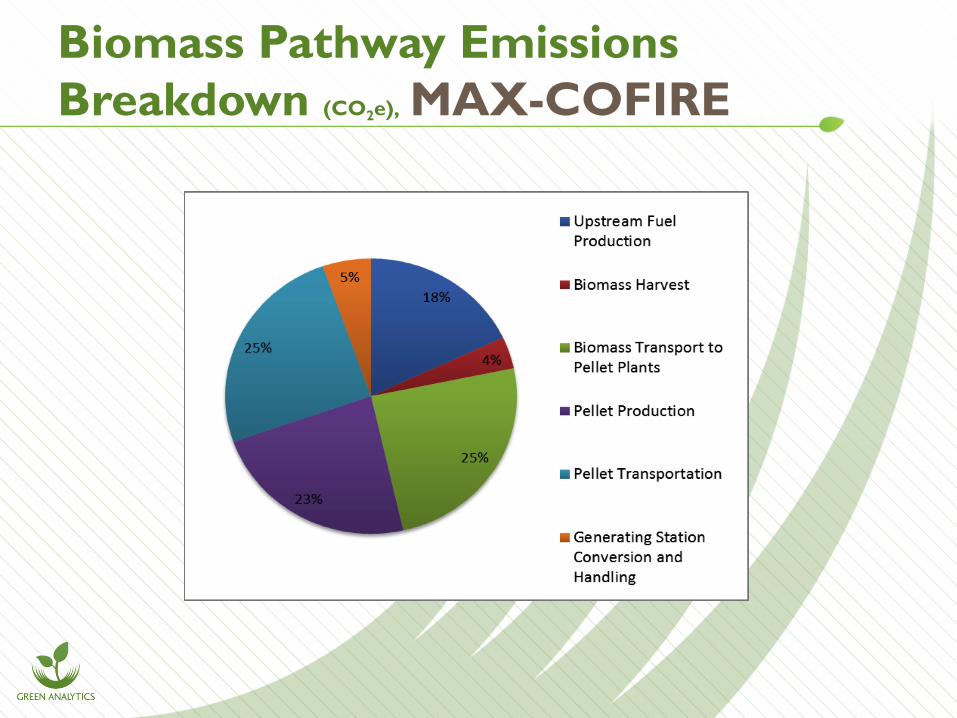
Biomass Pathway Emissions
Breakdown (CO2e), MAX-COFIRE

Biomass Pathway- Annual Emissions
(CO2e): MAX CO-FIRE
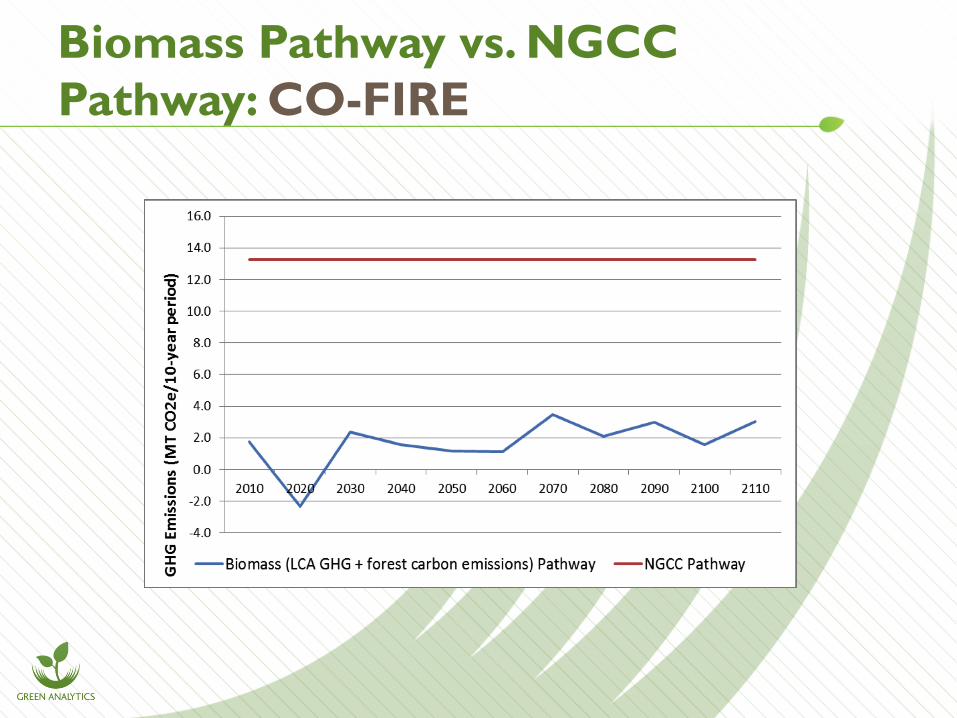
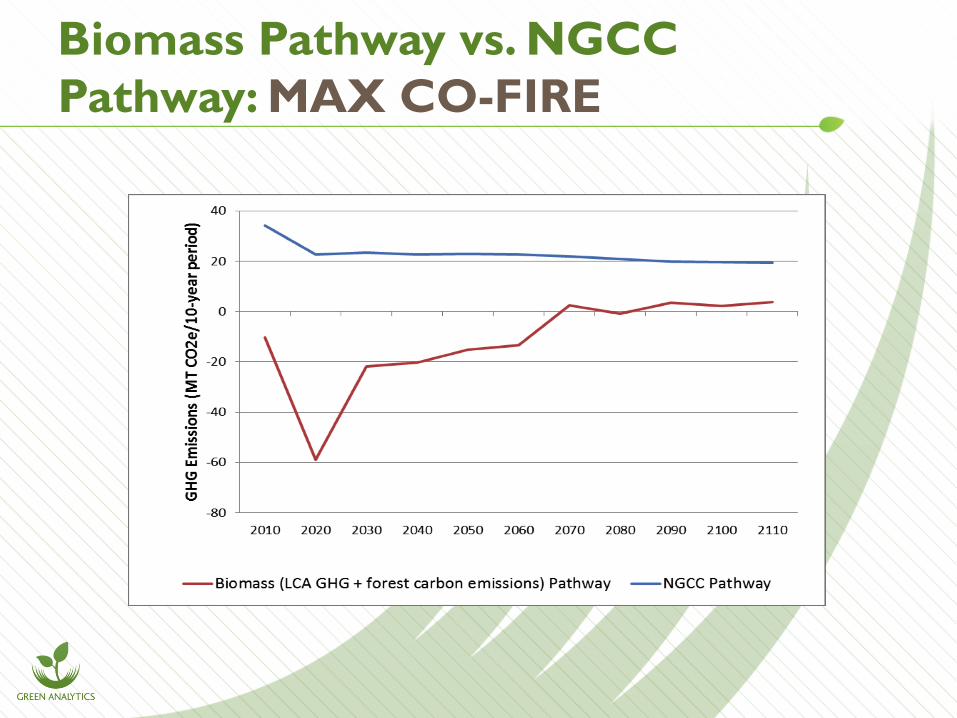
Biomass Pathway vs. NGCC
Pathway: CO-FIRE
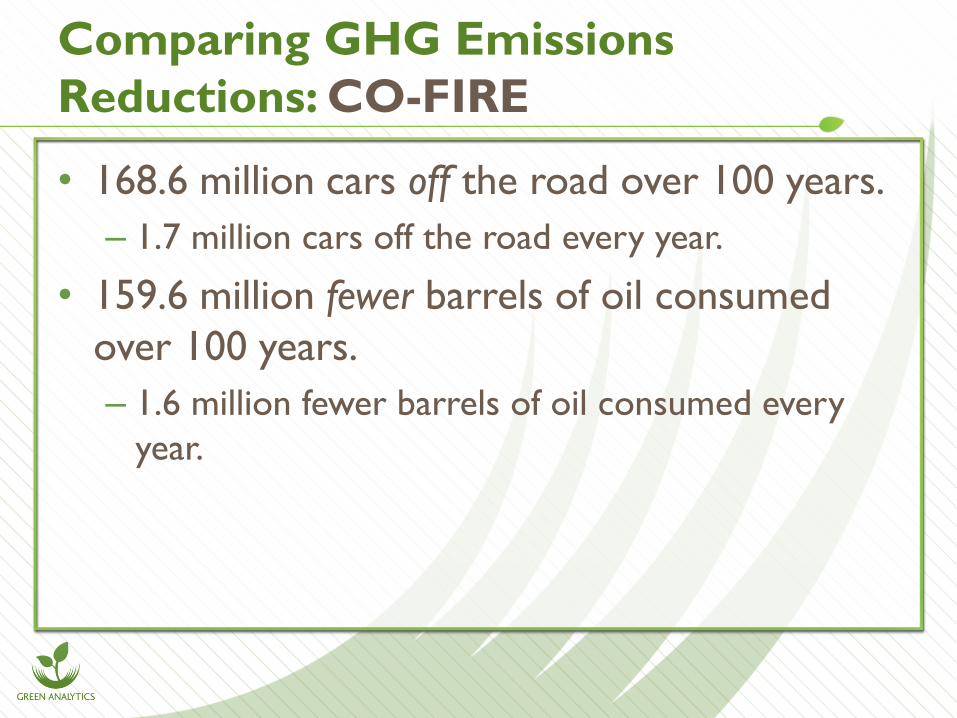
• 168.6 million cars off the road over 100 years.
– 1.7 million cars off the road every year.
• 159.6 million fewer barrels of oil consumed
over 100 years.
– 1.6 million fewer barrels of oil consumed every
year.
Comparing GHG Emissions
Reductions: CO-FIRE
Biomass Pathway vs. NGCC
Pathway: MAX CO-FIRE
• 491.5 million cars off the road over 100 years.
– 4.9 million cars off the road every year.
• 465.4 million fewer barrels of oil consumed
over 100 years.
– 4.6 million fewer barrels of oil consumed every
year.
Comparing GHG Emissions
Reductions: MAX CO-FIRE
• Harvesting of forest biomass for electricity production
can be done in such a way as to not systematically
decrease forest carbon stores over time (Figure 8 ).
• This analysis validated that the availability of renewable
biomass for pellet production is directly tied to
harvesting activities on Crown land.
• The future supply of renewable biomass for pellet
production is constrained by a total forest industry
sustainable harvest level of 21 Mm3/year.
Summary of Findings
• In Ontario, there is a sustainable long-term flow of 2.9M
ODT at existing harvest rates in the Boreal and GLSL
forest regions (Figure 45).
• An additional but declining tonnage of biomass is
available in the short term (2015 to 2060), at harvest
rates of 21 Mm3/year (Figure 60).
• There are a variety of biomass resource types available
for pellet production in the province and these resource
types have unique impacts on forest carbon, GHG
emissions and costs.
Summary of Findings
• Based on sensitivity analysis performed in this study, the following sources of biomass are prioritized for costs and GHG impacts:
– Sawmill waste from existing mill facilities- was only sufficient to meet existing demands from pulp and paper plants.
– The Boreal forest provides the largest tonnage of available forest residues from existing clearcut operations (1.85M ODT annually).
– The GLSL region provides a declining tonnage of forest residues over time due to the focus in this region on shelterwood and selection harvesting regimes.
Findings: Biomass Resource

• Low-grade wood volumes from standing timber
volumes are a large source of biomass tonnage in the
GLSL (312,000 ODT/year). Care must be taken to
adequately balance habitat, biodiversity, timber
productivity and economic benefits.
• Salvage wood volumes from fires and other natural
disturbances are expected to be available over time;
however in reality these volumes will be
unpredictable and costly to obtain.
Findings: Biomass Resource
• Biomass for electricity generation at a level of 2M
ODT/170,000 TCO2e/year
• For the CO-FIRE scenario, biomass for electricity
generation is renewable, but on a life-cycle basis does
contribute additional GHG emissions to the
atmosphere.
• Relative to the NGCC pathway, using biomass for
electricity generation at a level of 2M ODT/year
(CO-FIRE) reduces emissions by 127 MT CO2e over
the 100-year planning horizon.
Findings: GHG Emissions
• Biomass for electricity generation at 3.3 M ODT/year (Max CO-FIRE) / -11.7 MT CO2e/year
• Under the assumptions laid out in the Max CO-FIRE scenario, biomass for electricity generation is renewable and results in additional carbon sequestered, in the short and medium term (70 years).
• Relative to the NGCC pathway, using biomass for electricity generation at an average annual consumption rate of 3.3 M ODT/year (Max CO-FIRE) reduces emissions by 311 MT CO2e over the 100-year planning horizon.
Findings: GHG Emissions
For More Information
• You can download a copy of the full report at:
– Ontario Power Generation’s website:
www.opg.com/power/thermal/repowering
– IEA Bioenergy Task 32 website: www.ieabcc.nl/
– Canadian Bioenergy Association
www.canbio.ca/canbio.php
• You can download a copy of the factsheet at:
www.opg.com/power/thermal/pembina%20biomass%20sustainabilit
y%20analysis%20summary%20report.pdf

• Using biomass for wood pellet production is a good strategy
to reduce GHG emissions in Ontario.
• If OPG chooses to proceed consideration should be given to
sourcing some volumes of biomass from sustainably-managed
private lands and agriculture resources to ensure the long-
term viability of biomass supplies
• OPG should encourage pellet providers to locate their pellet
plants in communities that would benefit the most from new
employment opportunities.
• Consideration should be given to placing new generating
plants next to pellet plants.
Recommendations to OPG
• Consideration should be given to exploring harvesting
techniques and/or silviculture practices that might ensure
that the use of biomass for electricity production does not
lead to any additional GHG emissions in the atmosphere.
• Efforts should be made to integrate pellet product with
wood products manufacturing into forest industry clusters.
• In the short term there are gains to forest carbon from
harvesting forest stands in the GLSL that mature, with high
volumes of low-grade
Recommendations to the
Ontario Governments