The macro-context of communality in nineteenth century Ireland
MEASURING CULTURE OF INNOVATION:
A VALIDATION STUDY OF THE INNOVATION QUOTIENT INSTRUMENT
Shelby Danks, B.S., M.S.Ed.
Dissertation Prepared for the Degree of
DOCTOR OF PHILOSOPHY
UNIVERSITY OF NORTH TEXAS
October, 2015
Committee Members: Dr. Jeff Allen, Major Professor
Dr. Prathiba Natesan, Minor Professor Dr. Rose Baker, Professor

ii
Copyright 2015
By
Shelby Danks

iii
ACKNOWLEDGMENTS
“It's a dangerous business, Frodo, going out your door. You step onto the road, and if you
don't keep your feet, there's no knowing where you might be swept off to” (J.R.R. Tolkien). As I
embarked on the dangerous business of the doctoral process, I have been swept off to many great
places, which have been made possible by the fellowship of many…
I am thankful to Dr. Jeff Allen for his contributions in implementing a student-centered
approach for the ATPI program. Your commitment to the use of student-driven instructional
methods, as well as your personal support throughout the dissertation stage, have enabled me to
conduct research in the areas of my personal interests and navigate entry into academic work. I
would also like to express appreciation to my committee members and other colleagues whose
counsel has been invaluable to my growth – Dr. Prathiba Natesan, Dr. Rose Baker, Dr. Ji Hoon
Song, Dr. Kim Nimon, and Eric Schuler. Your relentless focus on methodological rigor and
willingness to pose challenging questions have fueled my desire to hone my research craft,
which I will continue to do regardless of what the future holds. I am also extremely indebted to
Dr. Jay Rao, Teaching Professor at Babson College, for his partnership during the dissertation
process. Your work inspires me to continue to support organizations in their efforts to become
catalysts of innovation.
I would finally like to thank my dearest friend and companion, Jacob Danks, my
Samwise. Your willingness to “share the load” has been the most important treasure I have
gleaned from this entire quest. Your brilliance, wit, kindness, and integrity have been the source
of my sanity, and I am looking forward to spending the rest of my life building extraordinary
things with you. Thank you for each and every day.
iv
TABLE OF CONTENTS
ACKNOWLEDGMENTS ............................................................................................. iii LIST OF TABLES AND FIGURES ............................................................................. vi CHAPTER 1: INTRODUCTION .................................................................................. 1 Need for the Study ................................................................................................ 3 Conceptual Framework ......................................................................................... 4 Measuring Culture of Innovation .......................................................................... 6 Purpose of the Study and Research Questions ...................................................... 7 Limitations ............................................................................................................ 8 Delimitations ......................................................................................................... 9 Definitions of Terms ............................................................................................. 10 Summary ............................................................................................................... 12 CHAPTER 2: REVIEW OF THE LITERATURE ....................................................... 13 Innovation ............................................................................................................. 14 Determinants of Innovation in Organizations ....................................................... 16
Culture .................................................................................................................. 21 Culture of Innovation ............................................................................................ 23
Measures of Culture of Innovation ....................................................................... 26 Instrumentation Evaluation ................................................................................... 28 The Innovation Quotient Survey to Measure Culture of Innovation .................... 35 Culture of Innovation Across Groups ................................................................... 39 Summary ............................................................................................................... 40 CHAPTER 3: METHODOLOGY ................................................................................ 42 Research Design ................................................................................................... 42 Sample .................................................................................................................. 45
Instrumentation ..................................................................................................... 48 Data Analysis and Procedures .............................................................................. 50
Summary ............................................................................................................... 56 CHAPTER 4: RESULTS .............................................................................................. 57 Stage 1 .................................................................................................................. 57 Data Screening ...................................................................................................... 57
Model Fit Assessment and Reliability .................................................................. 64 An Integrated Model of Culture of Innovation ..................................................... 87 Stage 2 .................................................................................................................. 95
Exploratory Data Analysis .................................................................................... 95

v
Cross-validation .................................................................................................... 100 CHAPTER 5: DISCUSSION AND RECOMMENDATIONS .................................... 112 Summary of Findings ........................................................................................... 112 Recommendations for Theory and Practice .......................................................... 113
Limitations, Delimitations, and Recommendations for Future Research ............. 120 Conclusion ............................................................................................................ 125
APPENDIX A PERMISSIONS ..................................................................................... 127 APPENDIX B IRB DOCUMENTS .............................................................................. 132 APPENDIX C INSTRUMENTATION ......................................................................... 134 REFERENCES .............................................................................................................. 143

vi
LIST OF TABLES AND FIGURES
Table Page 1. Six Building Blocks and Their Respective Factors and Indicators ..................... 4 2. Rao and Weintraub’s (2013) Building Blocks and Previous Models .................. 20 3. Sampling of Literature: Factors that Contribute to an Innovation Culture .......... 25 4. Summary of Instruments: Culture of Innovation or a Related Construct ............ 29 5. Similarities and Differences Among Instruments ................................................ 33 6. Participating Countries ........................................................................................ 47 7. Participating Industries ........................................................................................ 47 8. Participating Functional Roles ............................................................................. 48 9. Participating Organizational Levels ..................................................................... 48 10. Participating Languages of Administration ......................................................... 48 11. Item Descriptives ................................................................................................. 58 12. Tests for Multivariate Normality ......................................................................... 60 13. Inter-item Correlations ......................................................................................... 61 14. Variance Inflation Factors ................................................................................... 63 15. Common Method Variance .................................................................................. 64 16. CFA Results for Values ....................................................................................... 67 17. Factor Loadings for Values .................................................................................. 67 18. Intra-construct Correlations, SIC, AVE, and CR ................................................. 68 19. CFA Results for Resources .................................................................................. 69 20. Factor Loadings for Resources ............................................................................ 70 21. Intra-construct Correlations, SIC, AVE, and CR ................................................. 70

vii
22. CFA Results for Behaviors .................................................................................. 72 23. Factor Loadings for Behaviors ............................................................................ 72 24. Intra-construct Correlations, SIC, AVE, and CR ................................................. 73 25. CFA Results for Processes ................................................................................. 74 26. Factor Loadings for Processes ........................................................................... 75 27. Intra-construct Correlations, SIC, AVE, and CR ................................................. 75 28. CFA Results for Climate ................................................................................... 77 29. Factor Loadings for Climate .............................................................................. 77 30. Intra-construct Correlations, SIC, AVE, and CR ................................................. 78 31. CFA Results for Success ................................................................................... 79 32. Factor Loadings for Success .............................................................................. 80 33. Intra-construct Correlations, SIC, AVE, and CR ................................................. 80 34. CFA Results Summary ........................................................................................ 81 35. Initial Block Reliability Estimates and Factor Estimates by Country ................. 84 36. Initial Factor Reliability Estimates by Industry ................................................... 85 37. Estimates by Organizational Level, Functional Role, and Language .................. 86 38. CFA Results for Culture of Innovation (Integrated Model) ................................ 89 39. Content Issues Identified for Variant Items ......................................................... 90 40. Factor Loadings for Culture of Innovation (Integrated Model) ........................... 94 41. Intra-construct Correlations, SIC, AVE, and CR ................................................. 95 42. Steps to Complete Factor Analysis ...................................................................... 97 43. Pattern Matrix and Communality ........................................................................ 98 44. Item Descriptives ................................................................................................. 101
viii
45. Inter-item Correlations ......................................................................................... 103 46. CFA Results for Culture of Innovation (Alternate) ............................................. 106 47. Intra-construct Correlations, SIC, AVE, and CR ................................................. 107 48. Factor Loadings and Structure Coefficients for Culture of Innovation (Alternate)109 49. Factor Reliability Estimates and Estimates by Country ...................................... 110 50. Factor Reliability Estimates by Industry ............................................................. 110 51. Estimates by Organizational Level, Functional Role, and Language .................. 111
Figure Page 1. Hurly and Hult’s (1998) model of organization and market driven innovation .. 17 2. Sun et al.’s (2012) conceptual model of innovation performance ....................... 18 3. Crossan and Apaydin’s (2010) framework of organizational innovation ............ 19 4. Rao and Weintraub’s (2013) building blocks to a culture of innovation ............. 21 5. Hypothesized factor structure for each of the six building blocks ...................... 52 6. Standardized solution for values .......................................................................... 67 7. Standardized solution for resources ..................................................................... 70 8. Standardized solution for behaviors .................................................................... 72 9. Standardized solution for processes ..................................................................... 75 10. Standardized solution for climate ....................................................................... 77 11. Standardized solution for success ........................................................................ 80 12. Proposed factor structure of culture of innovation (integrated model) ................ 88 13. Standardized solution for culture of innovation (integrated model) .................... 93 14. Proposed factor structure for culture of innovation (alternate model) ................. 100 15. Standardized solution for culture of innovation (alternate model) ...................... 108

1
CHAPTER 1
INTRODUCTION
Background
In the Information Age where uncertainty and complexity are the new certainty, it is only
through distinction that companies can survive and ensure sustainability in the current
marketplace of products, services, and ideas, and it is believed that through innovation this
distinction occurs (George, Works, & Watson-Hemphill, 2005). Referred to as the “innovation
imperative,” the ability for an organization to innovate has become one of the most important
capabilities needed in the new knowledge economy (Lawson & Samson, 2001). Evidence of the
sensitivity to the topic of innovation extends beyond the fact that innovation boasts over 133
million results from a Google search, and over 900,000 results from ProQuest’s Summon
repository of articles spanning over 700 databases (ProQuest, 2014). Innovation has also become
one of the most important domains of study in business, technology, science, and engineering
over the past few decades (O’Sullivan & Dooley, 2009), and has specifically become a hot topic
in certain industries that operate in highly regulated, underfunded, or large and complex
environments (Christensen, Grossman, & Hwang, 2009; Dougherty & Hardy, 1996; Leavy,
2005; Price, 2014; Thakur, Hsu, & Fontenot, 2012; Vincent, 2005). For example, Lazarus and
Fell’s (2011) trend analysis in healthcare reported that a survey conducted in 2011 among CEOs
around the world demonstrated that innovation is one of the most important business priorities,
as executives across multiple industries believed it would “generate ‘significant’ new revenue
and cost reduction over the next three years” (p. 363).
What exactly do organizations must be able to do to innovate their products and services
or to transform to operate in new markets or lines of business? What capabilities or practices are

2
necessary to facilitate an organization’s ability to manage the competitive market terrain?
Theorists argue that organizations require certain tangibles, such as specific innovation
processes, as well as intangibles, such as innovative intelligence or innovation culture, to
produce other critical business outcomes, specifically market and financial outcomes (e.g., Dyer,
Gregersen & Christensen, 2011; O’Sullivan & Dooley, 2009; Skarzynski & Crosswhite, 2014;
Weiss & Legrand, 2011). And within the last thirty years, the academic literature has also
produced a substantial body of evidence that the ability to innovate, or lack thereof, has indeed
contributed to the success or failure for organizations from all sectors or industries (e.g., Brettel
& Cleven, 2011; Den Hartog, Van de Aa, & de Jong, 2010; Hurley & Hult, 1998; Zairi & Al-
Mashari, 2005). Perel (2005) has argued that that most successful way to manage difficulties
associated with an uncertain future and economic turbulence is to “make innovation an integral
part of a firm’s organization and management DNA” (p. 15).
To make such a focus a priority, Rao and Weintraub (2013) recommend organizational
leaders intentionally create a culture of innovation within their organizations, as well as measure
or assess the presence of that culture – a recommendation corroborated by Kuczmarski (2003) in
his assertion that a “measurement system for assessing innovation” (p. 538) is a key ingredient
for an organization’s successful approach. Rao and Weintraub (2013) also describe how
organizations can use the results from such assessments to identify perceived differences across
the multiple factors, particularly between senior leaders and employees and among geographical
locations and/or sectors. Aiman-Smith et al. (2005) and Balsano et al. (2008) also advocate the
use of a similar quantitative assessment and propose the use of the demographic variables of
gender and functional area to facilitate comparison, benchmarking, the development of
3
predictive models, and the reporting of trended results over time as a means to evaluate the
efficacy of change initiatives.
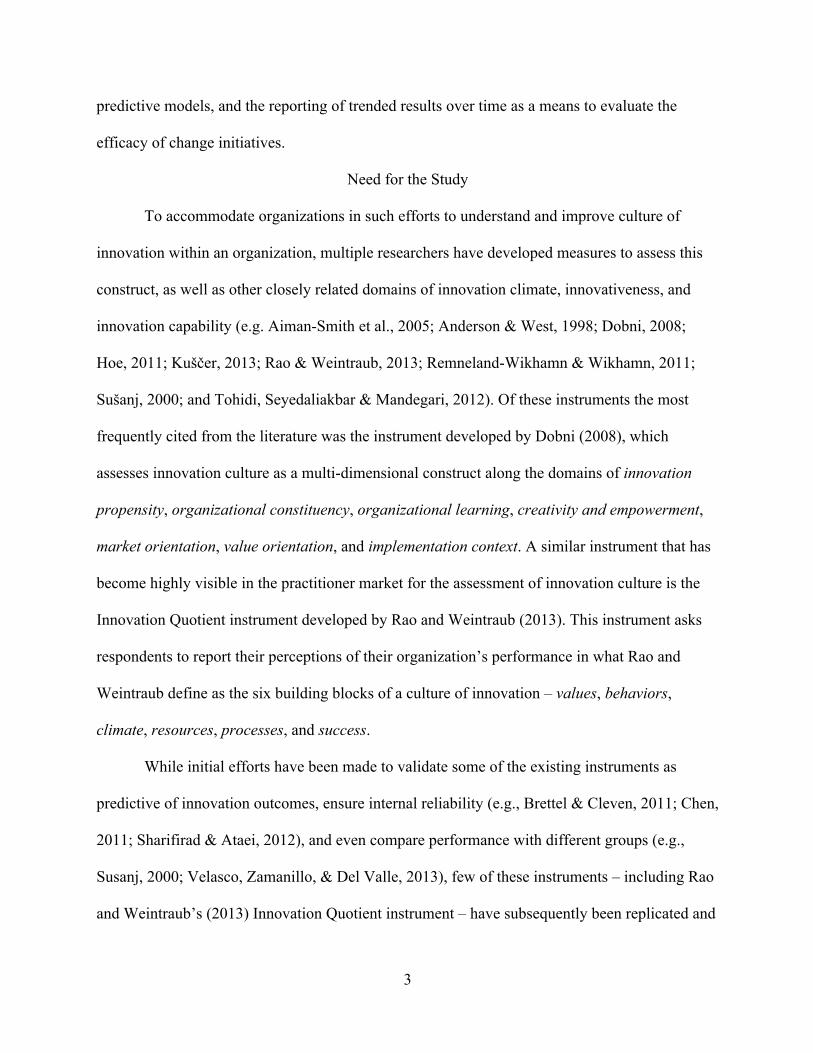
Need for the Study
To accommodate organizations in such efforts to understand and improve culture of
innovation within an organization, multiple researchers have developed measures to assess this
construct, as well as other closely related domains of innovation climate, innovativeness, and
innovation capability (e.g. Aiman-Smith et al., 2005; Anderson & West, 1998; Dobni, 2008;
Hoe, 2011; Kuščer, 2013; Rao & Weintraub, 2013; Remneland-Wikhamn & Wikhamn, 2011;
Sušanj, 2000; and Tohidi, Seyedaliakbar & Mandegari, 2012). Of these instruments the most
frequently cited from the literature was the instrument developed by Dobni (2008), which
assesses innovation culture as a multi-dimensional construct along the domains of innovation
propensity, organizational constituency, organizational learning, creativity and empowerment,
market orientation, value orientation, and implementation context. A similar instrument that has
become highly visible in the practitioner market for the assessment of innovation culture is the
Innovation Quotient instrument developed by Rao and Weintraub (2013). This instrument asks
respondents to report their perceptions of their organization’s performance in what Rao and
Weintraub define as the six building blocks of a culture of innovation – values, behaviors,
climate, resources, processes, and success.
While initial efforts have been made to validate some of the existing instruments as
predictive of innovation outcomes, ensure internal reliability (e.g., Brettel & Cleven, 2011; Chen,
2011; Sharifirad & Ataei, 2012), and even compare performance with different groups (e.g.,
Susanj, 2000; Velasco, Zamanillo, & Del Valle, 2013), few of these instruments – including Rao
and Weintraub’s (2013) Innovation Quotient instrument – have subsequently been replicated and
4
reported in the empirical literature. Estimates of model fit, inter-item relationships, and reliability
for the Innovation Quotient instrument in particular have yet to be cited in academic literature.
Therefore, there is a need to replicate investigations of innovation culture to assess and improve
the validity and reliability of current instrumentation. Through the analysis and validation of
such an instrument, organizational leaders and researchers may better assess its current state for
its determinants of innovation (Aiman-Smith et al., 2004; Susanj, 2000), therefore leading to
better organizational outcomes.
Conceptual Framework
While previous investigators have attempted to relate culture of innovation to other
critical organizational outcomes, the work of Rao and Weintraub (2013) focused on the construct
of culture of innovation itself, culminating in a comprehensive and multi-factorial theory of
innovation culture that can be observed and measured in organizations. Rao and Weintraub’s
(2013) six building blocks of an innovative culture was built upon the existing literature on
organizational culture (Denison, 1996; Hofstede, 1998; Schein, 1984), the practitioner literature
on innovation theory (Christensen, Anthony, & Roth, 2004), case studies of hundreds of
companies across multiple industries, and other empirical works on innovation (Tellis, Prabhu, &
Chandy, 2009). The authors proposed the six building blocks of resources, processes, success,
values, behaviors, and climate, each of which consists of three first order factors comprised of
three elements, or indicators. Table 1 summarizes each of the six building blocks, their factors
(first order factors), and their elements (indicators) (Rao & Weintraub, 2013).
Table 1
Six Building Blocks and Their Respective Factors and Indicators (Rao & Weintraub, 2013)
Building Block Factors Elements/Indicators Resources

5
People Champions, experts, talent Systems Selection, communication, ecosystem Projects Time, money, space
Processes Ideate Generate, filter, prioritize
Shape Prototype, fail smart, iterate Capture Flexibility, launch, scale
Success External Customers, competitors, financial
Enterprise Purpose, discipline, capabilities Individual Satisfaction, growth, reward
Values Entrepreneurial Ambiguity tolerance, action oriented, hunger
Creativity Imagination, autonomy, playful Learning Curiosity, experiment, failure okay
Behaviors Energize Inspire, challenge, model
Engage Initiative, support, coach Enable Influence, adapt, grit
Climate Safety Trust, integrity, openness
Simplicity No bureaucracy, accountability, decision making Collaboration Community, diversity, teamwork
Rao and Weintraub (2013) proposed that the three building blocks in a culture of
innovation that are easiest to understand and observe are an organization’s resources, processes,
and successes. The extent to which an organization resources its innovation efforts, particularly
through the identification of innovation champions and experts within its walls, affects an
organization’s ability to innovate. Organizations that deploy specific innovation processes, such
as steps to generate new ideas, filter good ideas from poor ones, prioritize suggestions, develop
and test prototypes, and flexibly determine which ideas or products go to scale, are better able to
innovate in new markets than organizations that do not employ such methods. Rao and
Weintraub (2013) also proposed that organizations that recognize its successes at the
6
external/market, enterprise, and individual levels can better engage its customers and maintain
market advantage.
The three building blocks to a culture of innovation that are more often neglected and
much less frequently measured in organizations are the critical areas of values, behaviors, and
climate. Rao and Weintraub (2013) identified that the values of an entrepreneurial focus,
creativity, and a willingness to learn play a part in priorities and decisions an organization will
face, and will therefore shape the use of its resources and other innovative efforts and processes.
Other specific actions or behaviors were also found to be conducive to the ability to innovate
new products. These include a willingness to adapt to new markets, abandon ineffective
approaches, energize employees toward a market focus, and exhibit grit when external forces
apply undesired pressure. Rao and Weintraub (2013) finally also demonstrated that a climate of
safety, trust, willingness to take risks, and limited bureaucracy “fosters learning and encourages
independent thinking” (p. 30).
Measuring Culture of Innovation
Rao and Weintraub (2013) demonstrate how organizations can assess their current levels
of performance along each of the six building blocks (higher order factors) and 18 first-order
factors using an instrument called the Innovation Quotient survey. These authors, as well as other
investigators in the field of innovation culture (e.g. Susanj, 2000; Velasco, Zamanillo, & Del
Valle, 2013) and organizational culture assessment in general (e.g. Cooke & Rousseau,1988),
advocate the use of measurement of culture to compare performance across different groups as a
means to inform opportunities for improvement. Some of these inter-group comparisons may
include the country of residence of the participants, the industry or sector, the type of
organizational work unit (e.g. between departments and entities), the level of employees (e.g.
7
executive leadership, middle leader or manager, or front line staff), or the functional role of the
employee (e.g. commercial/customer facing, R&D/innovation, operations, support, or other).
These investigators and others support the theory that culture of innovation can be observed and
quantified, that the results can be reported by each of the relevant factors, and that organizational
leaders can use those results to identify blind spots, make inter-group comparisons, and therefore
improve each of the building blocks of a culture of innovation. However, investigators have
presented little evidence to replicate the hypothesized factor structure, i.e. measurement model,
such as that proposed by Rao and Weintraub’s (2013), or to ensure meaningful interpretation of
results.
Purpose of the Study and Research Questions
The purpose of this present investigation is to assess the construct validity and reliability
of the Innovation Quotient instrument (Rao & Weintraub, 2013). This present investigation will
employ multiple factor analytic strategies to examine the hypothesized factor structure of each of
the six measurement models within the instrument by estimating model fit, inter-item
relationships, and reliability for each of the models. The specific research questions that will be
addressed include the following:
1. To what extent do each of the six measurement models within the Innovation Quotient
instrument demonstrate evidence for convergent and discriminant validity? To what
extent is the hypothesized factor structure of each of the six measurement models of the
Innovation Quotient instrument consistent with the administration of this present study
(i.e. demonstrate appropriate model fit through confirmatory factor analyses)?
2. To what extent are each of the six measurement models and their hypothesized factors
within the Innovation Quotient instrument reliable for multiple organizational groups,
8
including countries, industries, employee levels, functional roles, and the languages of
instrument administration?
3. In the absence of evidence for convergent or discriminant validity or reliability, what is a
plausible alternative factor structure of culture of innovation, as determined by an
exploratory factor analysis (EFA)? To what extent does the new factor structure
demonstrate evidence for convergent and discriminant validity, as well as reliability for
multiple organizational groups?
Limitations
This present study contains multiple limitations that will be outside the control of this
researcher. The first limitation is that of initial validation of the Innovation Quotient (2013)
instrument. This instrument was initially published through a practitioner-based publication – the
Spring 2013 issue of the MIT Sloan Management Review – and is therefore only in its infancy.
The instrument was supported by limited empirical evidence of its validity beyond the assertion
that it was “field tested over two years for statistical validity” (2013, p. 31), and has only begun
to be assessed in academic literature beyond the initial investigations conducted by the authors.
While the instrument authors have deployed the survey extensively since 2013, at this time it is
not clear whether the instrument is predictive of other critical organizational outcomes, and it is
expected that this present study will support initial validation efforts.
The second key limitation pertains to the use of the cross-sectional survey approach. This
present investigation used self-report, common method approach to obtain information about the
perceived culture of innovation within the organization, as well as the organizational groups into
which the participants self-characterized. While few instruments to assess these constructs exist
beyond the use of self-report methods, the use of the this approach may have contributed to

9
multiple threats to the validity of the findings, such as inconsistency in reference points, observer
effects, true state of affairs, sensitivity of the construct, dispositional characteristics, or
situational characteristics (Donaldson & Grant-Vallone, 2002).
Delimitations
In addition to the study’s limitations, additional constraints, or delimitations, will be
placed upon the study by this investigator. First, while multiple measures of culture of innovation
exist, this present study employed the Innovation Quotient (2013) instrument due its alignment
with the literature in organizational culture, its comprehensiveness in integrating the scope of
literature in the field of innovation, and its accessibility and user-friendliness to a wide audience
of varying educational backgrounds and abilities.
The second delimitation placed upon this investigation was the use of secondary data to
evaluate the key research questions. As the instrument’s lead author had already executed a
detailed, multi-faceted plan to administer the instrument in 138 companies across 24 industries in
13 countries, it was determined that an adequate sample size for the populations under
investigation had already been reached, yielding a more robust opportunity to generalize to those
groups where the instrument may be considered for future use. As this present study was not
considered as a part of the original design and data collection, multiple best practices in survey
administration were not guaranteed, such as the use of a sampling power analysis, participant
sampling and recruitment, the use of theory to guide the selection and categorization of
demographic variables for grouping, equality of sample to population representation,
standardized survey instructions, methods to manage common variance, the proper handling of
missing data, and other considerations.

10
As a secondary data source was used for this present study, one additional delimitation
was identified that may affect the final findings. The dataset contained participant responses to
54 items measuring constructs that contribute to a culture of innovation, but the data collection
process allowed for the instrument to be administered in both the Spanish and English languages.
While it is not typically the practice of psychometricians who evaluate the quality and validity of
instrumentation to pool respondents who participate in different languages, it was identified by
the instrument’s author that it is the common practice of the practitioners who use the data to
aggregate performance across both languages. As the final results would often be interpreted
regardless of the language of administration, it was important to maintain the dataset as a whole.
Definitions of Terms
Behaviors: One of the six building blocks of a culture of innovation from Rao and
Weintraub’s (2013) Innovation Quotient survey. The building block (higher order factor) of
behaviors consists of the three first order factors, energize, engage, and enable, and is
represented by a total of nine items.
Climate: One of the six building blocks of a culture of innovation from Rao and
Weintraub’s (2013) Innovation Quotient survey. The building block (higher order factor) of
climate consists of the three first order factors, collaboration, safety, and simplicity, and is
represented by a total of nine items.
Culture of innovation: Drawing on literature regarding innovation and organizational
culture, Rao and Weintraub (2013) asserted that a culture of innovation is the sum of the values,
behavior, climate, resources, processes, and successes of an organization that contribute to an
organizations’ ability to innovate its products and services.

11
Innovation Quotient survey: Instrument designed by Rao and Weintraub (2013) to
measure a culture of innovation in organizations. The Innovation Quotient survey provides self-
report results from participants along the six “building blocks” of a culture of innovation: values,
behaviors, climate, resources, processes, and results. Each of the six building blocks consists of
three first order factors, indicated by three elements, or items.
Processes: One of the six building blocks of a culture of innovation from Rao and
Weintraub’s (2013) Innovation Quotient survey. The building block (higher order factor) of
processes consists of the three first order factors, ideate, shape, and capture, and is represented
by a total of nine items.
Resources: One of the six building blocks of a culture of innovation from Rao and
Weintraub’s (2013) Innovation Quotient survey. The building block (higher order factor) of
resources consists of the three first order factors, people, systems, and projects, and is
represented by a total of nine items.
Success: One of the six building blocks of a culture of innovation from Rao and
Weintraub’s (2013) Innovation Quotient survey. The building block (higher order factor) of
success consists of the three first order factors, external, enterprise, and individual, and is
represented by a total of nine items.
Values: One of the six building blocks of a culture of innovation from Rao and
Weintraub’s (2013) Innovation Quotient survey. The building block (higher order factor) of
values consists of the three first order factors, entrepreneurial, creativity, and learning, and is
represented by a total of nine items.
12
Summary
Chapter One presented a background of the nature of innovation in organizations, the
importance of a culture of innovation and its measurement and assessment, and the need for this
present study to affirm the factor structure of measures of culture of innovation. The chapter also
described the theoretical framework that formed the basis for the instrument of choice to
accomplish the key research objectives and then provided a summary of the research questions,
hypotheses, limitation, and delimitations. Chapter Two will provide a review of the literature
related to this present study, specifically topics of organizational culture, innovation, culture of
innovation and its measurement. Chapter Three will describe the use of factor analytic methods
to address the key research questions, followed by a presentation of the findings of the analyses
in Chapter Four. The Fifth Chapter will articulate the conclusions and recommendations for
future research and for practitioners interested in the culture of innovation in organizations.

13
CHAPTER 2
REVIEW OF THE RELATED LITERATURE
The alarming notion of ‘innovate or die’ has become the new ultimatum for any
organization seeking sustainability (van Hamersveld & de Bont, 2007). Innovation is the
“lifeblood of our global economy and a strategic priority for virtually every CEO around the
world” (Dyer, Gregersen, Christensen, 2011). To address such a demand, a flurry of activity
among academicians, professional organizations, and other coalitions among all industries have
dedicated resources specifically to supporting organizations in their efforts to increase their
capacity to innovate. For example, in 2012 Harvard Business School and Harvard Medical
School joined forces to create an annual Forum on Healthcare Innovation. The goal of this forum
was to “unite leading executives, policymakers, and academics in a cross-disciplinary
exploration of innovative actions to improve quality, reduce costs, and, ultimately, increase value
in the health care industry” (Harvard Business School, 2014a, p.1). The result of that original
forum was a publication called, “Five Imperatives: Addressing Healthcare’s Innovation
Challenge” (Harvard Business School, 2014b, p. 1), which summarized the results from a survey
of healthcare leaders about quality and costs of care, as well as the documentation of the key
ideas that emerged from these great minds that focused on the future of the industry amidst these
challenges. The short but informative pamphlet left its readers with five imperatives:
1. Make value the central objective – the importance of care coordination and shared
information;
2. Promote novel approaches to process improvement – create an environment that
encourages improvement but also acknowledges that failure is an important component
in experimentation and learning;

14
3. Make consumerism work – make products that meet patient needs and engage patients to
manage their own health;
4. Decentralize approaches to problem solving – engage providers, innovators, and patients
to collaborate to improve; and
5. Integrate new approaches – built on past successes, but integrate new knowledge into the
community (2014b, p. 8).
Innovation
If such an alarmist phrase of ‘innovate or die’ has become a reality for organizations
facing increased competition over the turn of the century (van Hamersveld & de Bont, 2007),
then it may be helpful for organizational leaders, regardless of industry, to thoroughly investigate
exactly what innovation actually means – both its definition and its implications for
organizational outcomes. Where did the urgency of innovation come from, and what does it look
like today? Authors spanning multiple fields of study have discussed whether innovation should
be defined as a process or a product (e.g., Baregheh, Rowley, and Sambrook, 2009; Brophey, &
Brown, 2009; Quintane, Casselman, Reiche, & Nylund, 2011; Weiss & Legrand, 2011), a
continuous or a breakthrough process (e.g., Cole, 2002; Steiber & Alänge, 2013; Terziovski,
2002), synonymous with creativity, organizational learning, other terms (e.g., O'Cass & Ngo,
2007; Sharifirad & Ataei, 2012), macro or micro in nature (e.g., Kaufman, Tsangar, & Vrontis,
2012), and whether innovation should be extended to encompass open and/or closed innovation
characteristics (e.g., Brettel & Cleven, 2011; Enzing, Batterink, Janszen, & Omta, 2011;
Huizingh, 2011; Lee, Chen, Tsui, & Yu, 2014).
Recognizing the disparities in the definitions of innovation that flood the management
literature, Baregheh, Rowley, and Sambrook (2009) conducted a content analysis of the
15
definitions of innovation in the disciplines of economics, entrepreneurship, business,
management, technology, science, and engineering from the year 1934 through the present.
Through this study the authors uncovered that the definitions of innovation were diverse but
could be categorized into the major buckets of innovation types (e.g. product, service, process),
stages (e.g. adoption, creation, creation, implementation), social context (e.g. organization,
customer, employee, external environment), means (e.g. idea, invention, technology, market),
and aims (e.g. competition, success, differentiation). While the definitions continue to stockpile
in the literature, O’Sullivan and Dooley (2009), who are known experts in the study of
innovation management, propose that innovation should be view as the application of a process,
and described it as follows:
Applying innovation is the application of practical tools and techniques that make
changes, large and small, to products, processes, and services that results in the
introduction of something new for the organization that adds value to customers and
contributes to the knowledge store of the organization (2009; p. 5).
As a process our understanding of innovation has taken many turns throughout recent
history. Rothwell (1992) describes the shifts in our perceptions of the innovation process over
time since the early 1950s and summarizes five key generations: 1) the technology push model
from the early 1950s to the mid-1960s; 2) the market pull model from the mid-1960s to the early
1970s; 3) the coupling model from the early 1970s to the early 1980s; 4) the integrated, parallel
model from the early 1980s to the mid-1990s; and 5) the integrated, networked model since the
late 1990s. The Criteria for Performance Excellence (The Baldrige Performance Excellence
Program, 2013), one of the most frequently used sources of insight for leaders across multiple
industries, corroborates this notion of an integrated, networked model with its admonitions to
16
organizational leaders who seek to understand the contribution of innovation to overall
performance and results:
[Innovation is] making meaningful change to improve products, processes, or
organizational effectiveness and create new value for stakeholders. Innovation involves
adopting an idea, process, technology, product, or business model that is either new or
new to its proposed application. The outcome of innovation is a discontinuous or
breakthrough change in results, products, or processes. Innovation benefits from a
supportive environment, a process for identifying strategic opportunities, and a
willingness to pursue intelligent risks. Successful organizational innovation is a multistep
process of development and knowledge sharing, a decision to implement,
implementation, evaluation, and learning. Although innovation is often associated with
technological innovation, it is applicable to all key organizational processes that can
benefit from change through innovation, whether breakthrough improvement or a change
in approach or outputs. Innovation could include fundamental changes in an
organization’s structure or business model to accomplish work more efficiently (p. 46).
Determinants of Innovation in Organizations
This integrated perspective of innovation is consistent with ideas proposed by complexity
theorists such as Goldstein (2008) and demonstrate that multiple components and/or structures
must work together simultaneously as a part of a whole system to be able to produce innovation
within or for an organization. Multiple researchers have developed integrated models in an
attempt to summarize the key determinants of innovation within the organizational setting across
multiple sectors, some of which include Hurley and Hult’s (1998) organization and market
driven innovation model, Sun, Wong, Zhao, and Yam’s (2012) multi-level conceptual model of
17
innovation performance, and Crossan and Apaydin’s (2010) multi-dimensional framework of
organizational innovation.
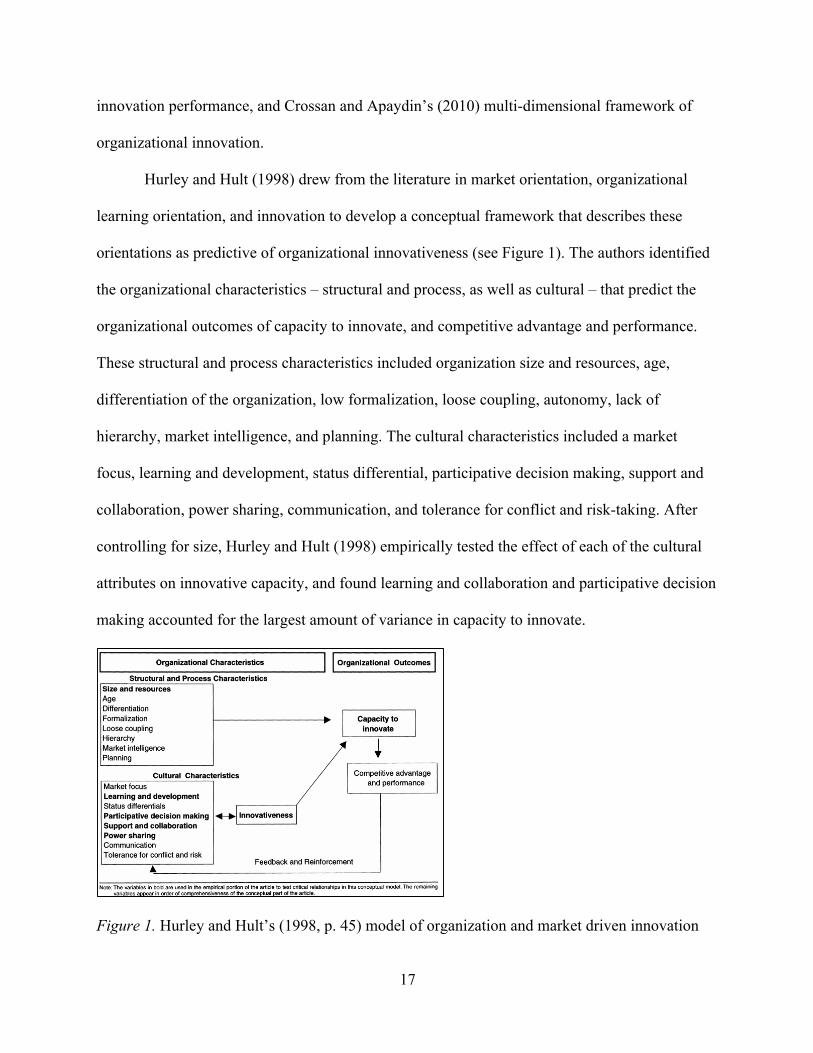
Hurley and Hult (1998) drew from the literature in market orientation, organizational
learning orientation, and innovation to develop a conceptual framework that describes these
orientations as predictive of organizational innovativeness (see Figure 1). The authors identified
the organizational characteristics – structural and process, as well as cultural – that predict the
organizational outcomes of capacity to innovate, and competitive advantage and performance.
These structural and process characteristics included organization size and resources, age,
differentiation of the organization, low formalization, loose coupling, autonomy, lack of
hierarchy, market intelligence, and planning. The cultural characteristics included a market
focus, learning and development, status differential, participative decision making, support and
collaboration, power sharing, communication, and tolerance for conflict and risk-taking. After
controlling for size, Hurley and Hult (1998) empirically tested the effect of each of the cultural
attributes on innovative capacity, and found learning and collaboration and participative decision
making accounted for the largest amount of variance in capacity to innovate.
Figure 1. Hurley and Hult’s (1998, p. 45) model of organization and market driven innovation
18
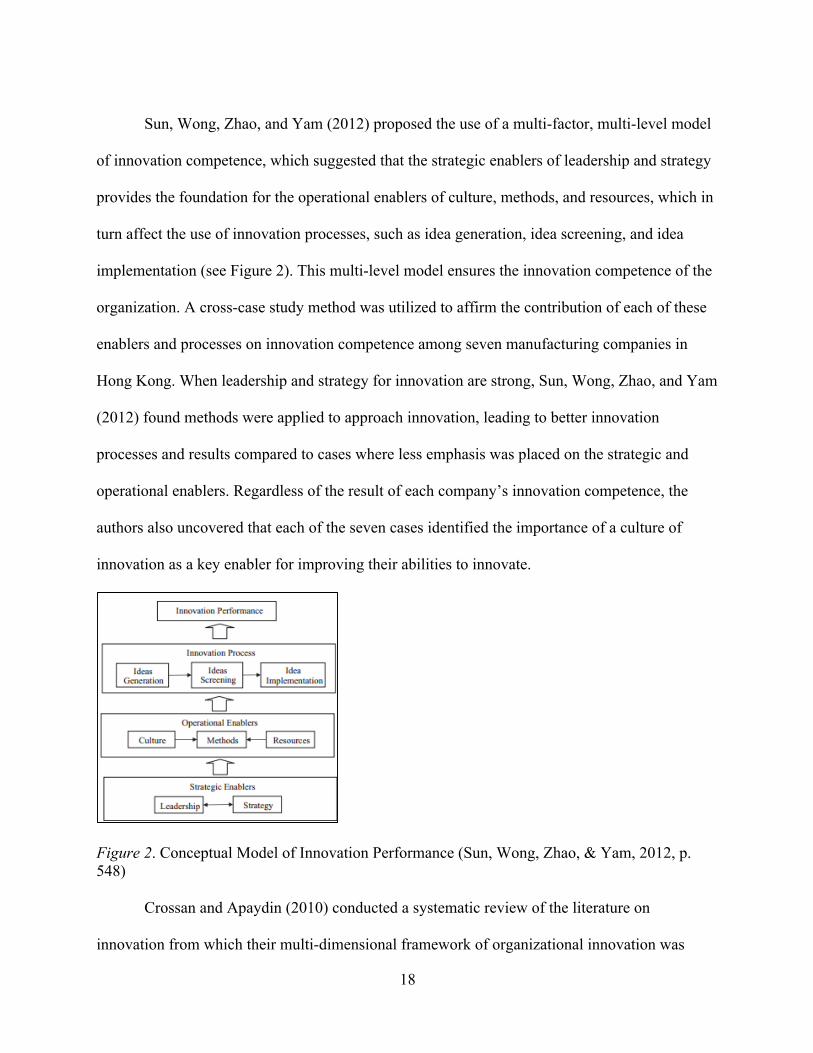
Sun, Wong, Zhao, and Yam (2012) proposed the use of a multi-factor, multi-level model
of innovation competence, which suggested that the strategic enablers of leadership and strategy
provides the foundation for the operational enablers of culture, methods, and resources, which in
turn affect the use of innovation processes, such as idea generation, idea screening, and idea
implementation (see Figure 2). This multi-level model ensures the innovation competence of the
organization. A cross-case study method was utilized to affirm the contribution of each of these
enablers and processes on innovation competence among seven manufacturing companies in
Hong Kong. When leadership and strategy for innovation are strong, Sun, Wong, Zhao, and Yam
(2012) found methods were applied to approach innovation, leading to better innovation
processes and results compared to cases where less emphasis was placed on the strategic and
operational enablers. Regardless of the result of each company’s innovation competence, the
authors also uncovered that each of the seven cases identified the importance of a culture of
innovation as a key enabler for improving their abilities to innovate.
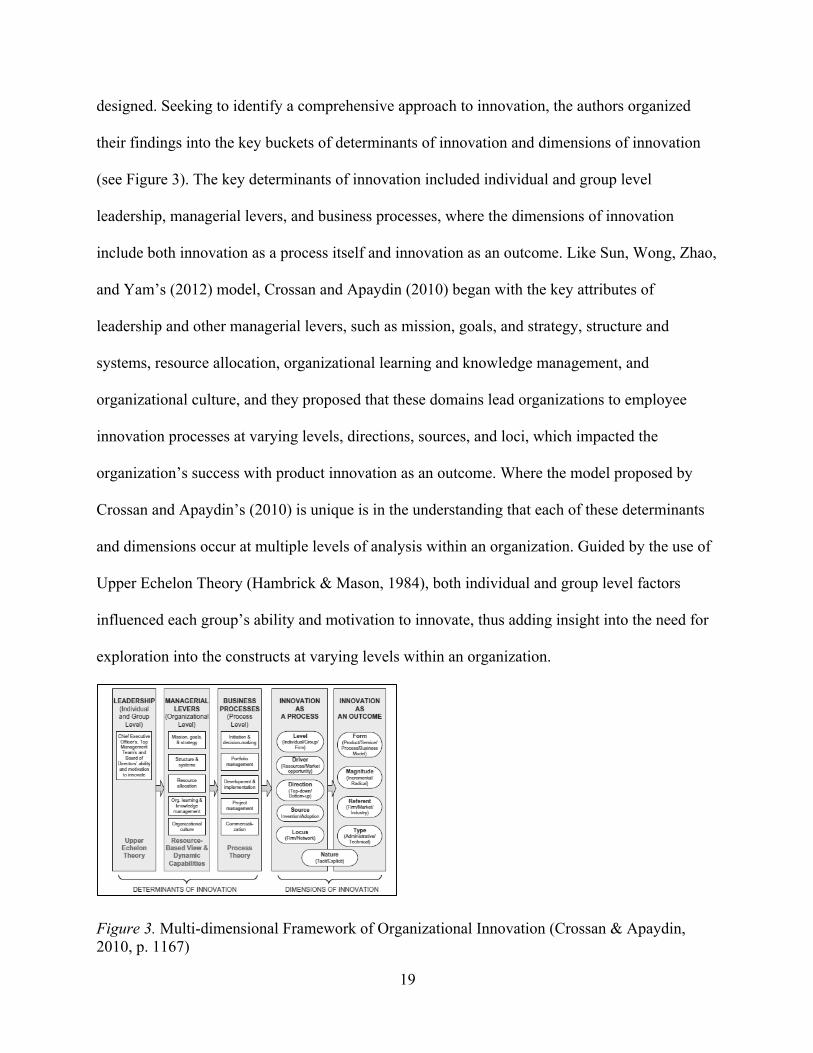
Figure 2. Conceptual Model of Innovation Performance (Sun, Wong, Zhao, & Yam, 2012, p. 548) Crossan and Apaydin (2010) conducted a systematic review of the literature on
innovation from which their multi-dimensional framework of organizational innovation was
19
designed. Seeking to identify a comprehensive approach to innovation, the authors organized
their findings into the key buckets of determinants of innovation and dimensions of innovation
(see Figure 3). The key determinants of innovation included individual and group level
leadership, managerial levers, and business processes, where the dimensions of innovation
include both innovation as a process itself and innovation as an outcome. Like Sun, Wong, Zhao,
and Yam’s (2012) model, Crossan and Apaydin (2010) began with the key attributes of
leadership and other managerial levers, such as mission, goals, and strategy, structure and
systems, resource allocation, organizational learning and knowledge management, and
organizational culture, and they proposed that these domains lead organizations to employee
innovation processes at varying levels, directions, sources, and loci, which impacted the
organization’s success with product innovation as an outcome. Where the model proposed by
Crossan and Apaydin’s (2010) is unique is in the understanding that each of these determinants
and dimensions occur at multiple levels of analysis within an organization. Guided by the use of
Upper Echelon Theory (Hambrick & Mason, 1984), both individual and group level factors
influenced each group’s ability and motivation to innovate, thus adding insight into the need for
exploration into the constructs at varying levels within an organization.
Figure 3. Multi-dimensional Framework of Organizational Innovation (Crossan & Apaydin, 2010, p. 1167)
20
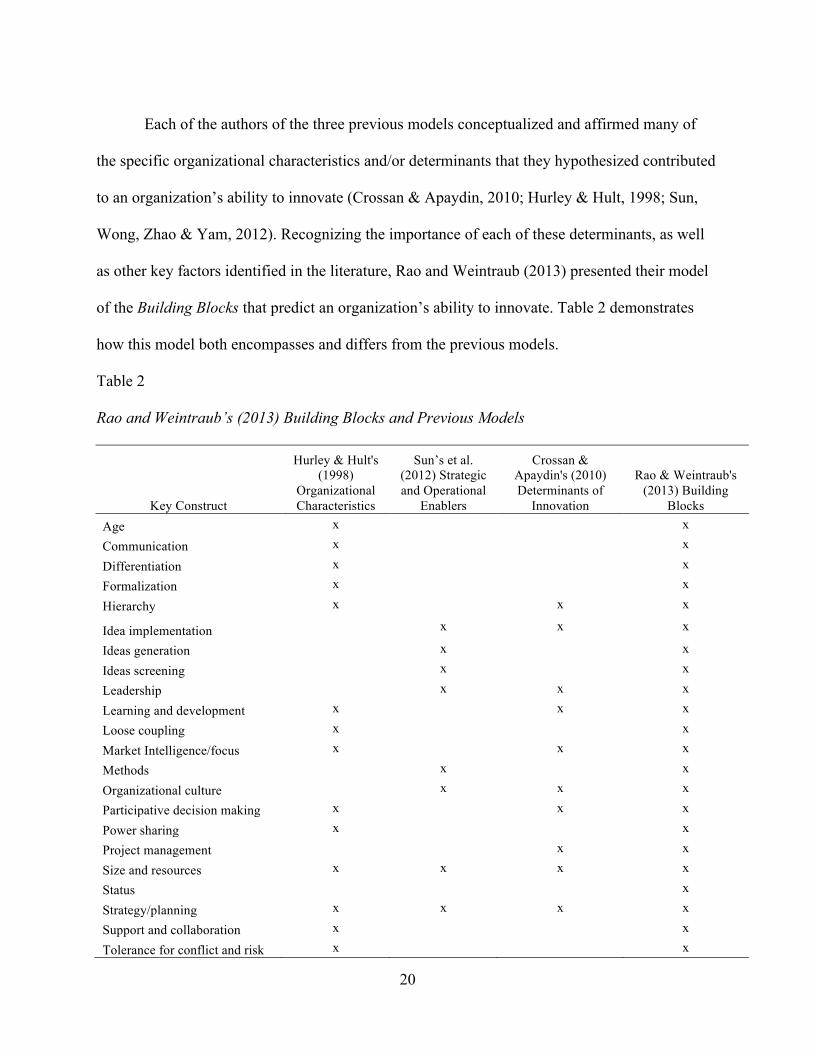
Each of the authors of the three previous models conceptualized and affirmed many of
the specific organizational characteristics and/or determinants that they hypothesized contributed
to an organization’s ability to innovate (Crossan & Apaydin, 2010; Hurley & Hult, 1998; Sun,
Wong, Zhao & Yam, 2012). Recognizing the importance of each of these determinants, as well
as other key factors identified in the literature, Rao and Weintraub (2013) presented their model
of the Building Blocks that predict an organization’s ability to innovate. Table 2 demonstrates
how this model both encompasses and differs from the previous models.
Table 2
Rao and Weintraub’s (2013) Building Blocks and Previous Models
Key Construct
Hurley & Hult's (1998)
Organizational Characteristics
Sun’s et al. (2012) Strategic and Operational
Enablers
Crossan & Apaydin's (2010) Determinants of
Innovation
Rao & Weintraub's (2013) Building
Blocks Age x x
Communication x x
Differentiation x x
Formalization x x
Hierarchy x x x
Idea implementation x x x
Ideas generation x x
Ideas screening x x
Leadership x x x
Learning and development x x x
Loose coupling x x
Market Intelligence/focus x x x
Methods x x
Organizational culture x x x
Participative decision making x x x
Power sharing x x
Project management x x
Size and resources x x x x
Status x
Strategy/planning x x x x
Support and collaboration x x
Tolerance for conflict and risk x x

21
While the authors have created unique labels to describe each of these domains, factors, and
indicators, Rao and Weintraub (2013) integrate in a nonlinear fashion each of the constructs
identified by the previous researchers, as well as others, to propose a comprehensive construct
they term an organization’s culture of innovation, depicted by Rao (2014) in Figure 4 and
presented in Rao and Weintraub’s (2013) Innovation Quotient instrument (see Appendix C).
Figure 4. Building Blocks to a Culture of Innovation (Rao, 2014)
Culture
The idea of the culture of an organization, or specifically its organizational culture, has
also undergone thorough scrutiny and investigation in academic literature (e.g. Allaire &
Firsirotu, 1984; Denison, 1996; Hatch, 1993; Hoffman & Hegarty, 1993; Hofstede, 1998). The
most frequently referenced view is that of Schein (1984), who defined organizational culture as a
“pattern of basic assumptions that a given group has invented, discovered, or developed in
22
learning to cope with its problems of external adaptation and internal integration, and that have
worked well enough to be considered valid, and therefore, to be taught to new members as the
correct way to perceive, think, and feel in relation to those problems” (p. 3). To be able to
respond to these ‘external problems’, Schein (1984) contended that three levels of culture – basic
assumptions, values, and artifacts and creations – as well as the interaction among these three
levels, are generated and manifest themselves in different ways by the organization’s members.
As described by Bellot (2011), artifacts, or the visible structures and processes of the
organization, are the most visible to an outside observer, whereas the values, which are the
strategies, goals, and philosophies of the organization, are less visible to an outside observer. The
most difficult to observe, and therefore understand, are the underlying assumptions of the
organization’s members, which include the unconscious beliefs, perceptions, thoughts, and
feelings of its individual members. Taken together each of these critical facets of an organization
– its structures and processes (artifacts), strategies, goals, and philosophies (values), and beliefs,
perceptions, thoughts, and feelings of individual members (assumptions) – reflect the
organizational culture of the social construct we know as the organization.
To describe how these assumptions, values, and artifacts are generated, multiple theorists
have presented cultural typologies that help explain differences among cultures both within and
between organizations. Handy (1996) identified four culture types, which include power, role,
task, and person culture. Hofstede et al. (1990) theorized that culture presented itself through
practices in its values, rituals, heroes, and symbols, and through factor analytic methods
provided empirical support for six independent factors of cultural orientation – process versus
results; employee versus job; parochial versus professional; open versus closed systems; loose
versus tight control; and normative versus pragmatic focus. Additional theories advocate for the

23
separation or the integration of organizational climate as a topic of related study (e.g., Schneider,
Ehrhart, & Macey, 2013; Scott, Mannion, Davies, & Marshall, 2003). Denison (1996) also
argued that while culture and climate have been presented to both overlap and diverge
throughout the history of their study, future research should aim to “incorporate the traditions of
climate research within the culture literature” (p. 646). In an effort to synthesize these multiple
perspectives in literature around organizational culture, Denison (1996) succinctly summarized
the similarities between the findings of multiple researchers, compared them to those that typify
organizational climate, and classified the culture and climate types along the domains of an
organization’s structure, support, risk, cohesiveness, and outcome orientation.
Culture of Innovation
Schneider, Ehrhart, and Macey (2013) posited that it is helpful for the research and
practice of organizational culture to study its variety of values and behaviors within the context
of “a culture for-something, such as for a culture of well-being or a culture of innovation” (p.
377). The study of a culture of innovation, therefore, supports this aim and may involve
integrating the definitions of innovation and organizational culture. While it has not been the
practice of most researchers to define culture of innovation in a systematic fashion through the
integration of a formal definition of innovation with cultural domains, such as structure, support,
risk, cohesiveness, and outcome orientation (Denison, 1996), authors have certainly canvassed
these key domains indirectly, as well as those related to the strikingly similar topics of innovative
culture, innovation capability, innovative capacity, innovation competence, innovation climate,
and global innovation culture (e.g., Crossan & Apaydin, 2010; Hurley & Hult, 1998;
Kleinschmidt, De Brentani, & Salomo, 2007; Lemon & Sahota, 2004; Panayides, 2006; Sarros,
Cooper, & Santora, 2008; Shahin & Zeinali, 2010; Sun et al., 2012).

24
Most theorists and investigators have not defined innovation culture as an integrated
construct, but have instead focused on describing the key dimensions or factors that contribute to
an innovation culture. An example of this is Dobni (2008), who defined innovation culture as “a
multi-dimensional context which includes the intention to be innovative, the infrastructure to
support innovation, operational level behaviors necessary to influence a market and value
orientation, and the environment to implement innovation” (p. 540), a definition which has
influenced and shaped the work of many other investigations (e.g. Humphreys, McAdam, &
Leckey, 2005; Sharifirad & Ataei, 2012), as well as the four conceptual models of innovation
described in the previous section (Crossan & Apaydin, 2010; Hurley & Hult, 1998; Rao &
Weintraub, 2013; Sun et al., 2012).
As interest in the culture of innovation in organizations has climbed, dozens of other
voices have emerged to support or slightly modify existing notions of this multi-dimensional
construct. Anderson and West (1998) proposed a four-factor model of work group innovation
climate – vision, participative safety, task orientation, and support for innovation. Humphreys,
McAdam, and Leckey (2005) applied Frances’ (2000) dimensions of innovativeness, which
include direction, capability, culture, learning, structure and process, and decision making, to
evaluate the progression of innovativeness of a small-to-medium enterprise over time. Also
operating with the theory that the climate research better aids in the understanding of the surface
structures of culture and that climate can more easily be assessed and measured, Remneland-
Wikhamn, and Wikhamn (2011) integrated Patterson’s et al. (2005) research on climate to
innovation, proposing four dimensions of flexibility, innovation support and approaches,
outward focus, and reflexivity. And as was described above, Rao and Weintraub (2013)
incorporated each of the dimensions that predict innovation, including abstracted factors within

25
the domains of values, behaviors, climate, resources, processes, and success, to the
comprehensive construct termed a culture of innovation. A brief summary of additional
examples of researchers who have attempted to define and study the factors that contribute to a
culture of innovation, innovativeness, innovation climate, and other closely related constructs is
illustrated in Table 3.
Table 3
Sampling of Literature: Factors that Contribute to an Innovation Culture
Study Factors of Innovation Culture, Innovativeness, and/or
Innovation Climate
Bakovic, Lazibat, & Sutic, 2013 Autonomy, cannibalization, pro-activeness, and risk-taking
Brettel & Cleven, 2011 Orientation toward new technologies, learning orientation, willingness to take risks, and future market orientation
Chen, 2011 Vision, participation safety, support for innovation, task orientation, interaction frequency
Enzing et al., 2011 Upfront activities, organizational routines, company culture (flexibility, openness, cooperation, management style, human focus, etc.)
Herrmann, Gassmann, & Eisert, 2007
Orientation toward new technologies, learning orientation, willingness to take risks, long-term orientation, customer orientation, and independent units
Kumar & Uzkurt, 2010 Individualism-collectivism, masculinity-femininity, power distance, and uncertainty avoidance
Lee et al., 2014 Innovation and flexibility, outward focus, reflexivity
McAdam et al., 2007 Direction, capability, culture, learning, structures/processes, and decision making
O'Cass & Ngo, 2007 Encouraging creativity, being receptive to new ideas, decentralizing decision making, and encouraging open communication
O'Connor, Roos, & Vickers-Willis, 2007
Innovation capability: various innovation resource assets (or inputs), and immediate transformative assets (culture, systems, processes, procedures)
Panuwatwanich, Stewart, & Mohamed, 2009
Propensity for creativity, freedom and autonomy, and innovation support and facilitation
Sarros, Cooper & Santora, 2008 Articulates vision, provides individual support, and performance-oriented culture
Saunila & Ukko, 2013 Leadership practices, employee skills/innovativeness, processes/tools for idea management, supporting culture, external sources for information, development of individual knowledge, employee welfare, and linkage to strategic goals
Shahin & Zeinali, 2010 Decision making, direction, capability, culture, and structure/process
Sharifirad & Ataei, 2012 Innovation propensity, organizational constituency, organizational learning, creativity and empowerment, market orientation, value orientation, and implementation context
Steiber & Alänge, 2013 Leaders, structures, incentives, continuous learning, and change oriented board

26
Velasco, Zamanillo, & Del Valle, 2013
Leadership, culture, and human resources
Measures of Culture of Innovation
Previous empirical works investigating the relationships between a culture of innovation
and other critical outcomes required that the construct of culture of innovation be operationally
defined, quantified, and measured. In order to identify existing instruments to define and
measure culture of innovation, an extensive literature search was conducted to identify a menu of
possible instruments (refer to Table 4) from which a final instrument could be selected. This
literature review took place in three stages. First, a search for the key words of “innovation
culture” AND “measurement” was conducted among all databases listed in the Serials Solutions
databases and packages (which included 39 open archives such as ABI/Inform, ProQuest,
EBSCO, etc.) for all empirical, peer-reviewed publications. No date restrictions were imposed
upon the search. Each of the abstracts of these articles was read to determine if one of the above
construct (or a related construct of innovation climate, innovativeness, culture of innovation,
etc.) was measured using a quantitative instrument. Each of these remaining articles was read in
its entirety and was eliminated from final inclusion if the article referenced the measurement of
innovation itself, as defined by a process or product instead of the culture of innovation, or if the
article was not related to the topic of this present study. However, the article was included if it
reported the use of a measure of organizational culture in relation to innovation, or investigated
relationships between innovation and organizational learning, for example. Finally, a second-
level search was conducted through Google Scholar to determine whether additional studies
could be identified that utilized those instruments to measure culture of innovation. Using the
same scanning technique described above, and after eliminating duplicate results, additional
27
articles were identified, leading to a total of nearly 60 empirical articles, theoretical articles, and
literature review or meta-analytic articles that were retained due to their discussion on the topic
of the measurement of innovation culture.
In order to critically appraise each article for key abstractions that relate to this present
study, Garrard’s (2011) Matrix Method was used. To review the articles employing this
investigative approach, a matrix was developed that contained each of the following column
headers: search term, author, year, type of article, reason for inclusion, key constructs of study,
measures used, list of subscales or factors reported, instrument scale, factor analytic methods
conducted, audience, sample size, sample characteristics, industry, study purpose, key
relationships observed between culture of innovation and other outcomes, whether the actual
instrument items were included in the article, and other final notes and observations. The content
of each of the articles was systematically analyzed in order to obtain information to complete
each of the columns of the matrix. While nearly 400 results were produced from the initial
search, only about 60 results were selected and analyzed using the matrix method above, which
finally produced ten articles that presented a unique, non-adapted instrument of innovation
culture, innovation capability, innovation climate, innovativeness, or other related construct.
The majority of these 60 works could be classified into one of four types of studies: 1)
the testing of relationship between culture of innovation and other outcomes, which included the
development of a new measures of innovation culture (or a related construct) using a univariate
model/factor with a range of two to four survey items in total (e.g., Panayides, 2006; Sun et al.,
2012); 2) the testing of relationship between a culture of innovation and other outcomes, which
included the adaptation of previously used measures of innovation culture (e.g., Hurley & Hult,
1998; Sharifirad, & Ataei, 2012); 3) the development and validation of a new measure of a multi-

28
factorial construct of innovation culture (e.g., Dobni, 2008; Kuscer, 2013); and 4) a literature
review or conceptual article summarizing the importance of the measurement of multi-
dimensional model of innovation culture or prescribing the improvement of innovation culture
within organizations (e.g., Rao & Weintraub, 2013; Slater, Mohr, & Sengupta, 2014). Table 4
summarizes examples of key instruments that have been developed in order to measure a culture
of innovation or a related construct, as well as the evidence for the validity and reliability
presented by the original authors for each instrument.
Instrument Evaluation
While many instruments have been developed as a means to measure culture of
innovation or a related construct for multiple purposes, much variation exists among the
instruments in their design, particularly related to the inclusion of domains or factors, level of
rigor in the analysis, and recommendations for applied use. Switzer et al. (1999) and Kimberlin
and Winterstein (2008) summarized some key criteria that should be utilized in the selection of
an instrument for such a research purpose, including participant characteristics, research goals,
administration issues (such as user-friendliness, parsimony, and feasibility), critical psychometric
issues of reliability and validity, and the presence of existing instruments. Subjecting the list of
instruments shown in Table 4 to evaluation against the criteria of validity, reliability, parsimony,
and interpretation/user-friendliness, it is clear that some instruments may be better suited for
subsequent evaluation and validation compared to others.

29
Table 4
Summary of Instruments: Culture of Innovation or a Related Construct
Reference Purpose Instrument
Subscales Validity/Reliability
Aiman-Smith et al., 2005*
Summarize the development of a tool to measure Value Innovation Potential
Value Innovation Potential Assessment Tool (VIPAT)
Meaningful work, risk-taking culture, customer orientation, agile decision-making, business intelligence, open communication, empowerment, business planning, learning
Reliabilities, as measured by Cronbach alpha, were greater than 0.70; Content/convergent validity were checked
Anderson & West, 1998
Measure and relate facets of climate for innovation and innovativeness
Team Climate Inventory
Vision, participative safety, task orientation, support for innovation
Reliabilities, as measured by Cronbach alpha, ranged from 0.67 to 0.98; Discrim/consensual validity
Dobni, 2008* Develop a comprehensive instrument for measuring innovation culture
Dobni (2008) Innovation propensity, organizational constituency, organizational learning, creativity and empowerment, market orientation, value orientation, and implementation context
Reliabilities, as measured by Cronbach alpha, ranged from 0.74 to 0.82; Content/construct validity were checked
Hoe, 2011* Develop an instrument Hoe (2011) Shared vision, management support, community and individual creativity, implementation, and motivators
No summary results were reported; Not reported
Humphreys et al., 2005*
Apply instrument to evaluate a SME organization over time
Francis’ (2000) Centrim G2 Innovation Audit
Direction, capability, culture, learning, structure and process, and decision making
Only average ratings over time are presented; Not reported
Kuščer, 2013 Test elements of mountain destination innovativeness; develop measure
Kuscer (2013) Sociocultural sustainability and stakeholder participation, environmental sustainability (natural environment), and proactiveness
Reliabilities, as measured by Cronbach alpha, ranged from 0.899 to 0.92; Content validity checked
Rao & Weintraub,2013*
Propose and advocate for use of instrument
Innovation Quotient Survey
Values, behaviors, climate, resources, processes, and success
“Field tested over two years for statistical validity” (2013, p. 31)
Remneland-Wikhamn & Wikhamn, 2011
Propose and validate instrument
Open Innovation Climate Measure
Innovation and flexibility, outward focus, and reflexivity
Reliabilities, as measured by Cronbach alpha, ranged from 0.66 to 0.83; Discrim/converg validity
Sušanj, 2000 Examine differences in innovation culture and climate in different countries
FOCUS Questionnaire
Risk-taking, open to criticism, forefront of technology, flexibility, challenging old ideas, searching for new markets, pioneering
Discrim/converg validity

30
Tohidi, Seyedaliakbar & Mandegari, 2012
Propose and validate a measurement scale to capture learning capabilities
Organizational Learning Capabilities
Managerial commitment/empowerment, experimentation, risk taking, interaction with the external environment and openness and knowledge transfer and integration
Reliabilities, as measured by Cronbach alpha, ranged from 0.73 to 0.89; Discrim/converg validity
Note. *Denotes a more comprehensive alignment to previous research models of determinants of innovation
31
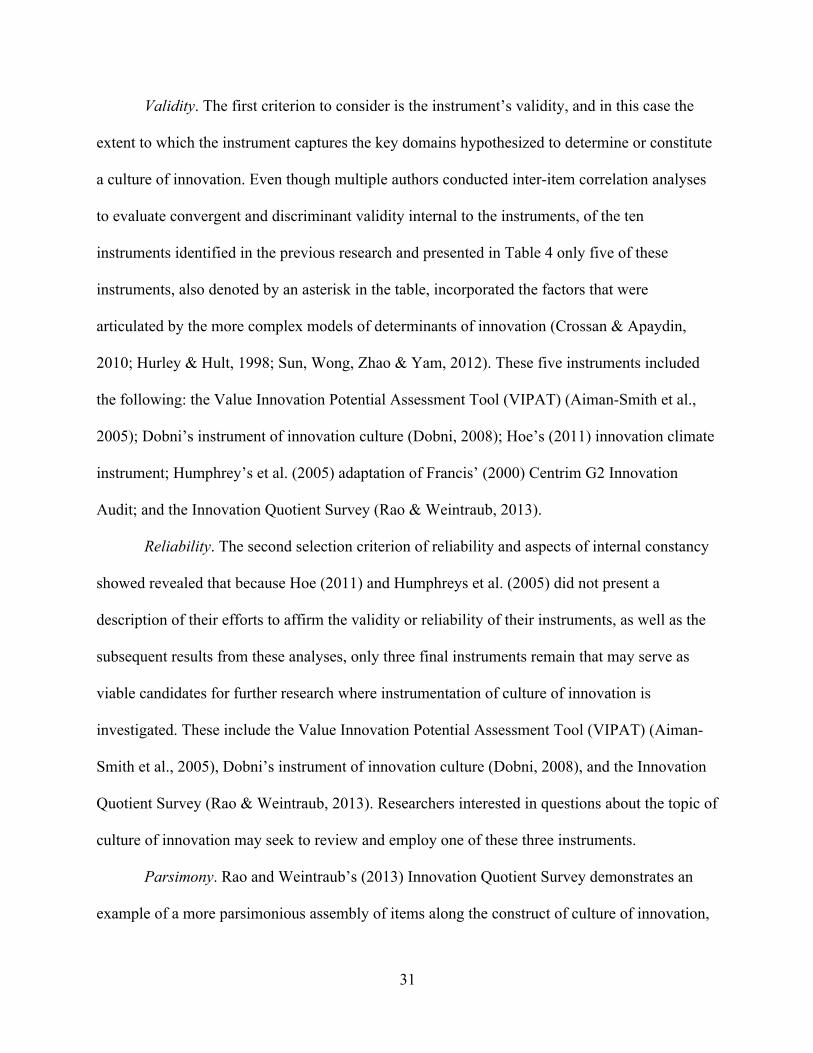
Validity. The first criterion to consider is the instrument’s validity, and in this case the
extent to which the instrument captures the key domains hypothesized to determine or constitute
a culture of innovation. Even though multiple authors conducted inter-item correlation analyses
to evaluate convergent and discriminant validity internal to the instruments, of the ten
instruments identified in the previous research and presented in Table 4 only five of these
instruments, also denoted by an asterisk in the table, incorporated the factors that were
articulated by the more complex models of determinants of innovation (Crossan & Apaydin,
2010; Hurley & Hult, 1998; Sun, Wong, Zhao & Yam, 2012). These five instruments included
the following: the Value Innovation Potential Assessment Tool (VIPAT) (Aiman-Smith et al.,
2005); Dobni’s instrument of innovation culture (Dobni, 2008); Hoe’s (2011) innovation climate
instrument; Humphrey’s et al. (2005) adaptation of Francis’ (2000) Centrim G2 Innovation
Audit; and the Innovation Quotient Survey (Rao & Weintraub, 2013).
Reliability. The second selection criterion of reliability and aspects of internal constancy
showed revealed that because Hoe (2011) and Humphreys et al. (2005) did not present a
description of their efforts to affirm the validity or reliability of their instruments, as well as the
subsequent results from these analyses, only three final instruments remain that may serve as
viable candidates for further research where instrumentation of culture of innovation is
investigated. These include the Value Innovation Potential Assessment Tool (VIPAT) (Aiman-
Smith et al., 2005), Dobni’s instrument of innovation culture (Dobni, 2008), and the Innovation
Quotient Survey (Rao & Weintraub, 2013). Researchers interested in questions about the topic of
culture of innovation may seek to review and employ one of these three instruments.
Parsimony. Rao and Weintraub’s (2013) Innovation Quotient Survey demonstrates an
example of a more parsimonious assembly of items along the construct of culture of innovation,

32
satisfying the third criterion of instrumentation evaluation. The previous research has, in various
forms, affirmed that each of the key factors described among these three instruments indeed
predict or contribute to a culture of innovation, leading to greater innovation performance or
other critical organizational outcomes (e.g., Bakovic, Lazibat, & Sutic, 2013; Brettel & Cleven,
2011; Chen, 2011; Herrmann, Gassmann, & Eisert, 2007; McAdam, Keogh, Reid, & Mitchell,
2007; O’Cass & Ngo, 2007; O’Connor, Roos, & Vickers-Willis, 2007; Saunila & Ukko, 2013).
Table 5 presents a matrix that identifies similarities and differences among the factors within the
three instruments. As Rao and Weintraub’s (2013) Innovation Quotient survey contains the
greatest number (count) of factors (18 total factors of three indicators each), each of the factors
are listed, alongside the similar factors that appear in the Value Innovation Potential Assessment
Tool (VIPAT) (Aiman-Smith et al., 2005) and Dobni’s instrument of innovation culture (Dobni,
2008). As is illustrated in Table 5, Rao and Weintraub’s (2013) instrument identifies the sum of
ideas presented by both of the other two instruments, but with 54 items more parsimoniously
captures what each of the key factors identified in Dobni’s (2008) instrument assesses with 70
items. While the instrument developed by Aiman-Smith et al. (2005) contains only 33 items,
which may be more user-friendly and less likely to contribute to survey fatigue, the instrument
does not address the key construct of resources while more rigorously addressing the external
domains of customer orientation (five items), business intelligence (three items), and business
planning (four items), which Rao and Weintraub (2013) capture with a total of nine items.

33
Table 5
Similarities and Differences Among Instruments
Rao and Weintraub, 2013 Similar Factor in Aiman-Smith et al., 2005
Similar factor in Dobni, 2008 Domains Factors (indicators/1 item for each indicator)
Resources People (champions, experts, talent) Value orientation (7) Systems (selection, communication, ecosystem) Projects (time, money, space)
Processes Ideate (generate, filter, prioritize) Learning (3) Creativity and empowerment (6); Implementation context (17)
Shape (prototype, fail smart, iterate) Capture (flexibility, launch, scale)
Success External (customers, competitors, financial) Customer orientation (5); Business intelligence (3); Business planning (4); Meaningful work (3)
Innovation propensity (9); Market orientation (8) Enterprise (purpose, discipline, capabilities)
Individual (satisfaction, growth, reward)
Values Entrepreneurial (ambiguity tolerance, action oriented, hunger)
Risk-taking culture (5) Organizational constituency (13)
Creativity (imagination, autonomy, playful) Learning (curiosity, experiment, failure okay)
Behaviors Energize (inspire, challenge, model) Empowerment (3) Organizational learning (10); More implementation context
Engage (initiative, support, coach) Enable (influence, adapt, grit)
Climate Safety (trust, integrity, openness) Open communication (3); Agile decision-making (4)
More organizational constituency Simplicity (no bureaucracy, accountability,
decision making) Collaboration (community, diversity, teamwork)
Item total 54 items 33 items 70 items
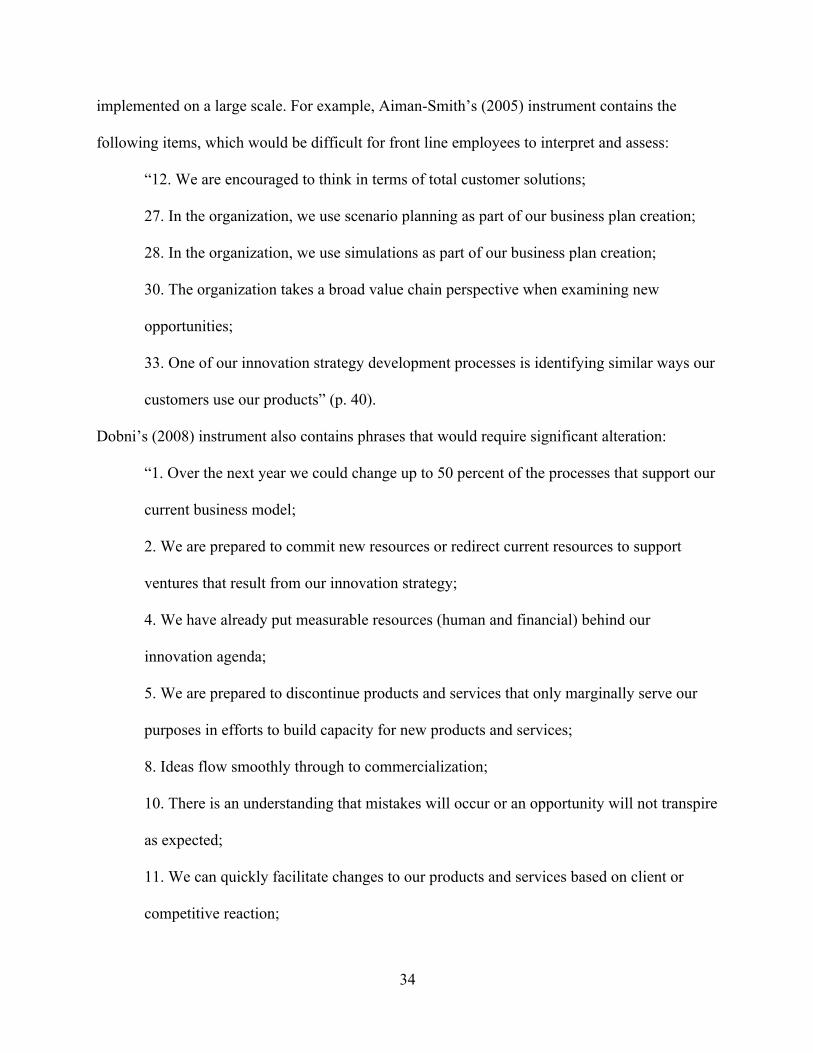
Interpretation and user-friendliness. The extent to which the participants are able to
interpret the instrument items can affect the validity of the results (Switzer et al., 1999). In
investigations that involve comparisons among groups at different levels in an organization, it is
important the interpretation of the instrument carry the same meaning for all groups and is in
essence what this present study seeks to understand. Therefore, while each of the instruments
contains the occasional word choice that would be difficult to interpret by both leaders/managers
and front line employees, there are two instruments in particular (Aiman-Smith et al., 2005 and
Dobni, 2008) that contained multiple items that would be difficult to interpret by front line
employees, which would have to be adapted and changed significantly in order to be
34
implemented on a large scale. For example, Aiman-Smith’s (2005) instrument contains the
following items, which would be difficult for front line employees to interpret and assess:
“12. We are encouraged to think in terms of total customer solutions;
27. In the organization, we use scenario planning as part of our business plan creation;
28. In the organization, we use simulations as part of our business plan creation;
30. The organization takes a broad value chain perspective when examining new
opportunities;
33. One of our innovation strategy development processes is identifying similar ways our
customers use our products” (p. 40).
Dobni’s (2008) instrument also contains phrases that would require significant alteration:
“1. Over the next year we could change up to 50 percent of the processes that support our
current business model;
2. We are prepared to commit new resources or redirect current resources to support
ventures that result from our innovation strategy;
4. We have already put measurable resources (human and financial) behind our
innovation agenda;
5. We are prepared to discontinue products and services that only marginally serve our
purposes in efforts to build capacity for new products and services;
8. Ideas flow smoothly through to commercialization;
10. There is an understanding that mistakes will occur or an opportunity will not transpire
as expected;
11. We can quickly facilitate changes to our products and services based on client or
competitive reaction;
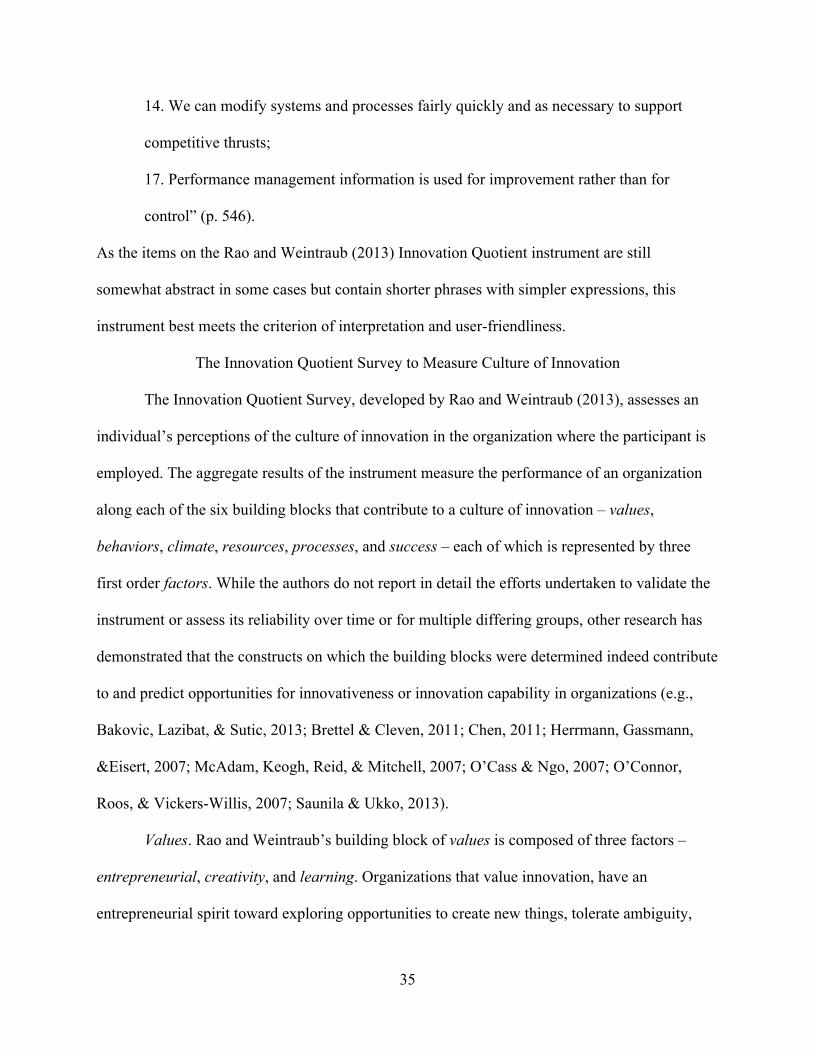
35
14. We can modify systems and processes fairly quickly and as necessary to support
competitive thrusts;
17. Performance management information is used for improvement rather than for
control” (p. 546).
As the items on the Rao and Weintraub (2013) Innovation Quotient instrument are still
somewhat abstract in some cases but contain shorter phrases with simpler expressions, this
instrument best meets the criterion of interpretation and user-friendliness.
The Innovation Quotient Survey to Measure Culture of Innovation
The Innovation Quotient Survey, developed by Rao and Weintraub (2013), assesses an
individual’s perceptions of the culture of innovation in the organization where the participant is
employed. The aggregate results of the instrument measure the performance of an organization
along each of the six building blocks that contribute to a culture of innovation – values,
behaviors, climate, resources, processes, and success – each of which is represented by three
first order factors. While the authors do not report in detail the efforts undertaken to validate the
instrument or assess its reliability over time or for multiple differing groups, other research has
demonstrated that the constructs on which the building blocks were determined indeed contribute
to and predict opportunities for innovativeness or innovation capability in organizations (e.g.,
Bakovic, Lazibat, & Sutic, 2013; Brettel & Cleven, 2011; Chen, 2011; Herrmann, Gassmann,
&Eisert, 2007; McAdam, Keogh, Reid, & Mitchell, 2007; O’Cass & Ngo, 2007; O’Connor,
Roos, & Vickers-Willis, 2007; Saunila & Ukko, 2013).
Values. Rao and Weintraub’s building block of values is composed of three factors –
entrepreneurial, creativity, and learning. Organizations that value innovation, have an
entrepreneurial spirit toward exploring opportunities to create new things, tolerate ambiguity,
36
encourage diverse perspectives, provide the freedom to pursue new opportunities, constantly
experiment, and are not afraid to take risks predict key behaviors that increase the likelihood of
innovation (Rao & Weintraub, 2013). Sarros, Cooper, and Santora (2008) also illustrated that the
ability for an organization to articulate its vision, a key factor of innovation culture, significantly
predicted its climate for organizational innovation. Clarity of vision toward attaining specific
innovative objectives (Anderson & West, 1998; Slater, Mohr, and Sengupta, 2014) and shared
vision as a means to avoiding specific innovation fads (Hoe, 2011) have been shown to serve as
key factors that contribute to innovation performance. Chen (2011) demonstrated the role of
vision as a key factor of service innovation culture to predict innovation in organizations,
mediated by charged behavior – which also included factors of challenging ideas and taking
risks. Studies have also corroborated the supposition that an organization’s willingness to take
risks predict the presence of radical product innovations (Bakovic, Lazibat, & Sutic, 2013;
Brettel & Cleven, 2011; Herrmann, Gassmann, & Eisert, 2007). O’Cass and Ngo (2007) also
found that innovation culture, constituted by high factor loadings in receptiveness to new ways
of doing things, encouraging creativity, and communicating how work contributes to the big
picture, predicted brand performance and market orientation.
Behaviors. A leader’s ability to energize, engage, and enable are the three key leadership
behaviors (and factors) that Rao and Weintraub (2013) demonstrated to be necessary for leading
innovation in organizations. Leaders who provide additional support for innovation through
personally modeling and taking initiative, coaching, feedback, influence strategies, challenge,
and other methods impact innovation (Chen, 2011; Saunila & Ukko, 2013; O'Connor, Roos, &
Vickers-Willis, 2007; Scott & Bruce, 1994; Slater, Mohr, and Sengupta, 2014; Sharifirad &
Ataei, 2012; Xerri & Brunetto, 2011). Steiber and Alange’s (2013) case study of Google

37
identified the importance of leaders as facilitators of the innovation process. Velasco, Zamanillo,
and Del Valle (2013)’s cross-company case study illustrated the importance of leadership in
mobilizing an organization toward innovation. Other investigations that sought to measure
culture of innovation identified leadership, management support, or empowerment as a key
factor that contributes to the success of innovation efforts (Aiman-Smith et al., 2005; Anderson
& West, 1998; Enzing et al., 2011; Hoe, 2011; Tohidi, Seyedaliakbar, & Mandegari, 2012).
Climate. The three factors of climate – collaboration, safety, and simplicity – assess the
extent to which an organization can ensure community, diversity, teamwork, trust, integrity,
openness, a lack of bureaucracy, accountability, and decision-making as key drivers of
innovation (Rao & Weintraub, 2013). Enzing et al., (2011) identified that company culture, as
characterized by flexibility, openness, cooperation, human focus, etc., predict short- and longer-
term market success of products in the food and beverage industry. Other studies reinforced this
effect in other industries (Anderson & West, 1998; Hoe, 2011; McAdam, Keogh, Reid, &
Mitchell, 2007; Panuwatwanich, Stewart, & Mohamed, 2009; Saunila & Ukko, 2013; Shahin &
Zeinali, 2010; Velasco, Zamanillo, & Del Valle, 2013; Xerri & Brunetto, 2011). Of these
constructs, the prevalence of agility and flexibility in decision-making, along with localized
autonomy in particular, has shown to be highly predictive of opportunities for innovation across
industries (Aiman-Smith et al., 2005; Humphreys et al., 2005; McAdam, Keogh, Reid, &
Mitchell, 2007; O’Cass & Ngo, 2007; Panuwatwanich, Stewart, & Mohamed, 2009; Shahin &
Zeinali, 2010).
Resources. The building block that Rao and Weintraub (2013) propose that appears to be
the least frequently studied in the literature is that of resources. Rao and Weintraub (2013)
propose that without resources, which include people, systems, and projects, innovation is less

38
likely to occur, as often human resources in particular are those most likely to produce
innovation within an organization. Previous studies affirm the importance of human resources as
key to delivering innovative results (Saunila & Ukko, 2013; Scott & Bruce, 1994). O’Connor,
Roos, & Vickers-Willis’s (2007) case study particularly investigated the role of resource assets
(human, relational, physical, and monetary) and found that that sum of these assets produce the
capacity for an organization to innovate within its industry. Saunila and Ukko’s (2013)
investigation of the factors that contribute to innovation capability found that “the expertise of
the employees play an important role for the development of the innovation capability of the
organization” (p. 1001), a finding corroborated by others who have evaluated the role of
knowledge and expertise of individuals throughout an entire organization (Scott & Bruce, 1994;
Enzing et al., 2011; Hoe, 2011; Velasco, Zamanillo, & Del Valle, 2013). Some studies have
focused on use the monetary and technological resources, although exclusively focused on
research and development expenditures and technologies, and their influence on innovation
outcomes (e.g. Kaufman, Tsangar, & Vrontis, 2012; O’Connor, 2008; Saunila & Ukko, 2013;
Susanj, 2000).
Processes. Rao and Weintraub’s (2013) building block of processes supports what a
majority of the research in the field of innovation management prescribes – that systematic
processes to ideate (generate ideas, filter and prioritize ideas), shape (prototype, iterate with
quick feedback loops, etc.) and capture (processes tailored to context and easy to move quickly
to scale or to market) produce innovation in organizations. As much of the practitioner literature
has focused on how to deploy such processes within organizations (e.g. Christensen, Grossman,
& Hwang, 2009; Dyer, Gregersen, & Christensen, 2011; O’Sullivan & Dooley, 2009; Rao, 2014;
Zairi & Al-Mashari, 2005), much research has been conducted regarding the effectiveness of
39
such models. Slater, Mohr, and Sengupta’s (2014) extensive review of the literature identified
that one of the key contributors to radical product innovation capability in an organization is the
innovation process involving discovery, incubation, and acceleration. While the theory that
resulted from this literature review has not yet been tested, other empirical works identified that
such processes indeed contribute to opportunities for innovation (e.g. Enzing et al., 2011;
McAdam, Keogh, Reid, & Mitchell, 2007, O’Connor, Roos, & Vickers-Willis, 2007; Saunila &
Ukko, 2013; Shahin & Zeinali, 2010; Sharifirad & Ataei, 2012; Steiber & Alange, 2013).
Researchers who have developed instruments to measure culture of innovation, as previously
described, have also identified innovation management processes as critical enough a factor to
incorporate into their respective measurement models (e.g. Hoe, 2011; Humphreys et al., 2005;
Susanj, 2000; Tohidi, Seyedaliakbar, & Mandegari, 2012).
Success. Operating from the assumption that innovation activities must be perceived as
successful to encourage employees to engage in continued use, organizations should assess the
extent to which they experience success with their innovation efforts, which can be reflected in
the three factors of external, enterprise, and individual success (Rao & Weintraub, 2013).
Organizations that track the external market orientation and/or customer focus of their products
may be more likely to develop products that are innovative, and can therefore be financially
successful as well (Brettel & Cleven, 2011; Dobni, 2008; Herrmann, Gassmann, & Eisert, 2007;
Kuščer, 2013; Lee et al., 2014; Remneland-Wikhamn & Wikhamn, 2011; Sarros, Cooper, &
Santora, 2008).
Culture of Innovation Across Groups
The measurement and reporting of results of the construct of culture of innovation can be
useful for organizational leaders to ascertain the extent to which its employees perceive the
40
presence of each of these key determinants of innovation within the organization (Aiman-Smith
et al., 2005; Dobni, 2008; Rao & Weintraub, 2013; Remneland-Wikhamn & Wikhamn, 2011;
Susanj, 2000). The Spanish Society for Quality (Asociacion Espaniola para la Calidad, or AEC;
2015), utilizing Rao and Weintraub’s (2013) Innovation Quotient instrument, engages
organizations from Spain and beyond to participate in a key initiative aimed at the organizational
assessment and/or measurement of their culture innovation culture. The AEC presents an
organization’s results benchmarked from within the organization across hierarchical levels and
functional areas, and outside the organization across sectors and countries. While most of the
remaining instruments have not been validated or applied across multiple industries in a similar
manner, a great number of investigations and theories developed in healthcare, for example, have
centered around the topics of the actual nature of organizational culture and its subcultures (e.g.
Bellot, 2011), creativity (e.g., Lazarus & Fell, 2011), innovation implementation (e.g. Birken,
Lee, & Weiner, 2012; Birken et al., 2013), and innovation and change (e.g., Dopson, Fitzgerald,
& Ferile, 2008). Previous findings have corroborated that differences in the factors of a culture
of innovation, as well as the items used to measure those factors, may exist among countries
(national cultures), industries, employee levels, functional roles, and even the languages of
instrument administration (e.g. Aiman-Smith et al., 2005; Çakar & Ertürk, 2010; Kaufman,
Tsangar, & Vrontis, 2012; Kuščer , 2013; Hoffman, 1999; Martens, 2013; McAdam, Keogh,
Reid, & Mitchell, 2007; National Audit Office, 2009; O'Connor, Roos, & Vickers-Willis, 2007;
Sun, Wong, Zhao, & Yam, 2012; Susanj, 2000; Unger, Rank, & Gemünden, 2014; Wilhelm &
Wilhelm, 2012).
Summary
This chapter discussed key topics relevant to the study of the measurement of culture of
innovation. First, innovation itself was defined, and three models identified from the literature
41
were presented which summarized the key determinants of innovation in organizations. An
analysis of organizational culture was stated as it relates to the culture ‘for innovation’ as is
recommended by Schneider, Ehrhart, and Macey (2013). A summary of the key instruments that
measure culture of innovation and related constructs was shared, along with a brief analysis of
those instruments deemed most feasible for use in applied organizational settings. Next, the brief
amount of literature of the measurement of culture of innovation among groups was described.
Chapter Three presents the key methods utilized in the design of this present study, as well as
further detail regarding the selected instrumentation.
42
CHAPTER 3
METHODOLOGY
The following section presents the research methods utilized in this present study,
including the research design, sampling methods, instrumentation, data collection, and data
analysis procedures. The key objective of this current study was to assess the validity and
reliability of the Innovation Quotient instrument, as proposed by Rao and Weintraub (2013). The
three research questions for this study were as follows:
1. To what extent do each of the six measurement models within the Innovation Quotient
instrument demonstrate evidence for convergent and discriminant validity? To what
extent is the hypothesized factor structure of each of the six measurement models of the
Innovation Quotient instrument consistent with the administration of this present study
(i.e. demonstrate appropriate model fit through confirmatory factor analyses)?
2. To what extent are each of the six measurement models and their hypothesized factors
within the Innovation Quotient instrument reliable for multiple organizational groups,
including countries, industries, employee levels, functional roles, and the languages of
instrument administration?
3. In the absence of evidence for convergent or discriminant validity or reliability, what is a
plausible alternative factor structure of culture of innovation, as determined by an
exploratory factor analysis (EFA)? To what extent does the new factor structure
demonstrate evidence for convergent and discriminant validity, as well as reliability for
multiple organizational groups?
Research Design
To address the research questions stated above this study employed a quantitative
research design, stemming from a post-positivist perspective of inquiry (Creswell, 2013).

43
Because the aim of the investigation was to evaluate the validity and reliability of an existing
instrument/survey, the use of independent and dependent variables were not considered.
However, methods specific to the assessment of content and construct validity, convergent
validity, and discriminant validity were used to investigate the accuracy of the Innovation
Quotient survey (Rao & Weintraub, 2013) as a measure of culture of innovation, as well as its
reliability (internal consistency) and appropriateness for use to compare performance across
administration language, country, industry, functional role, and employee level.
Threats to internal validity. This present study itself comprised specific procedures to
identify evidence for the validity of the Innovation Quotient (2013) instrument. To assess content
validity – or “how thoroughly the instrument samples the relevant target domain” (Grimm &
Yarnold, 2000, p. 104) – two methods were utilized, including a rigorous review of the literature
to select instrumentation, and the use of the appropriate statistical methods to investigate its
psychometric properties.
First, the process used to conduct a rigorous review of the literature to select appropriate
instrumentation was presented in Chapter Two. This review of the literature produced a list of
ten instruments that measured culture of innovation or a related construct (Table 4). Each of
these ten instruments was subjected to a systematic review against four criteria: (1) the extent to
which the original authors provided evidence for the validity of the instrument; (2) the
information the original authors provided regarding the reliability of the instrument; (3) the
extent to which the instrument parsimoniously taps each relevant domain with an elegant number
of items; and (4) the level of appropriateness for use with administration language, country,
industry, functional role, and employee level. Please refer to Chapter Two for the presentation of
the review of these instruments against these four criteria.

44
The second approach to ensure the content and construct validity of the instrument, as
well as to verify convergent and discriminant validity, was the completion of the appropriate
statistical methods to illustrate the factor structure of the instrument (Cronbach & Meehl, 1955;
Goldberg & Velicer, 2006; Messick, 1989). Inter-item correlation matrices were examined, and
items within factors were expected to produce higher correlations (illustrating evidence for
convergent validity), while items from different factors were expected to produce lower
correlations (illustrating evidence for discriminant validity) (Lissitz & Samuelsen, 2007). Results
from multiple confirmatory factor analyses (CFA) were also assessed to ensure appropriate
model fit for the six building blocks and their full measurement models (Hair, Black, Babin, &
Anderson, 2010).
Threats to external validity. As this present study itself comprised specific procedures to
identify evidence for the external validity of the Innovation Quotient (2013) instrument, steps
were taken to ensure the generalizability of the results. First, in order to ensure that the
instrument could be applied in settings beyond its current proposed use (i.e. evaluate population
validity), this investigation estimated internal consistency (reliability) for each of the
demographic variables that are typically used in practice for comparative purposes by
organizations and in research. Evaluation of reliability for each of the groups in which
comparisons are expected helps demonstrate the instrument may be applied beyond the initial
deployment and to other groups, such as administration languages, countries, industries,
functional roles, and employee levels (Aiman-Smith et al., 2005; Çakar & Ertürk, 2010;
Kaufman, Tsangar, & Vrontis, 2012; Kuščer , 2013; Hoffman, 1999; Martens, 2013; McAdam,
Keogh, Reid, & Mitchell, 2007; National Audit Office, 2009; O'Connor, Roos, & Vickers-Willis,
2007; Sun, Wong, Zhao, & Yam, 2012; Susanj, 2000; Unger, Rank, & Gemünden, 2014;

45
Wilhelm & Wilhelm, 2012). Next, in order to ensure that the instrument could be applied in
settings beyond its current proposed use (i.e. evaluate population validity), this investigation
used a cross-validation, resampling methodology (Byrne, Shavelson, & Múthen, 1989; Obsorne,
2008; Osborne. & Fitzpatrick, 2012). By conducting an initial analysis of the hypothesized
models, then cross-validating in an independent sample to confirm those results, the findings
may lead to a better understanding of how the instrument could be applied in other settings.
Sample
While simulation researchers have not been able to confirm the appropriate sample-to-
variable ratio needed to conduct factor analytic techniques (e.g. MacCallum, Widaman, Zhang,
& Hong, 1999), a sufficiently large sample size was needed for the number of variables (p = 54)
for this present study. Assuming the use of the traditional recommendation of N > 10p, the
desired sample size would be approximately N = 540 for each analysis. Kline (2011) also
indicated a sample size of 540, or at least N > 10p, would be necessary to have produce
confidence in the variable scores and factors.
In order to obtain a dataset that would yield the desired number of participants across
each of the groups previously described, a large dataset was required. The lead author of the
Innovation Quotient instrument was contacted to seek permission to use, as well as obtain
additional evidence for its validity and reliability, in current administrations. This investigator
identified at this time that the instrument’s lead author had already executed a detailed, multi-
faceted administration of the instrument to just under 20,000 participants from 138 companies
across 24 industries in 13 countries. Therefore, this existing, secondary dataset was obtained for
use in this present study.

46
Since the publication of their original publication in 2013, Rao and Weintraub have
continued to administer the instrument to dozens of other organizations across the globe. In
2014, the Spanish Society for Quality (2015) selected the instrument (renamed the Index of
Culture of Innovation in Spain) over other noteworthy instruments to be made available to their
list of over 1,000 member organizations worldwide, which engaged another 66 firms to
participate. The remaining firms to whom the instrument has been administered were obtained
through convenience based on consulting relationships with the instrument author. Of all the
firms that participated, invitations were sent to each and every employee in the respective
organizations, but participation rates were not provided or reported by each of the firms.
The final dataset used for this present study consisted of a total sample size of N = 19,781
participants, where the total dataset was randomly split in two (n1 = 9,860, n2 = 9,921). Across
the entire sample, 27% of the participants were male, 18% were female, and 55% did not report
their gender. The age ranges of the participants were as follows: younger than 26 years old (4%),
from 26 to 35 years old (28%), from 36 to 45 years old (34%), older than 45 years old (26%),
and those that did not report their age (8%). The education level of the participants included
professional studies/vocational training (17%), bachelor or grade school (39%), postgraduate/
master’s degree (21%), doctorate (2%), and those that did not report their educational attainment
(10%). Company seniority was also evenly dispersed as follows: less than one year (7%), from
one to three years (15%), from four to eight years (23%), from nine to 15 years (20%), more than
15 years (27%), and those that did not report their company seniority (8%). Total representation
of participants for the entire dataset is presented in Tables 6 through 10.

47
Table 6 Participating Countries
Country n1 n2 Country n1 n2 Spain 5,237 5,192 Mexico 70 69 Chile 2,346 2,410 Germany 69 55 Colombia 797 837 Scotland 21 31 United States 447 430 United Kingdom 25 26 Panamá 385 407 Saudi Arabia 12 18 El Salvador 356 349 Belgium 9 4 Portugal 86 93
Table 7 Participating Industries
Industry n1 n2 Industry n1 n2 Financial and Insurance 2,404 2,442 IT – Software and Electronics 238 244 Telecommunications 1,053 1,128 Retail 239 236 Professional Services 841 911 Education 221 213 Industrial Machinery and Equipment 802 836 Public and State
Administration 203 210
Health Care and Social Services 665 619 Transport and logistics 206 179
Aerospace and Defense 647 567 Pharmaceuticals 161 171 Food & Beverages 435 420 Biotechnology and Research 42 30 Construction and Building Materials 396 389 Media and Publication 40 28
Industrial Metals and Mining 384 393 Agriculture and Fisheries 20 14
Automobile and Parts 315 308 NGO’s 14 8 Oil & Chemicals 283 304 Distributors 7 5 Energy - Electricity and Gas 241 263 Hotels, Restaurants, Lodging 3 3

48
Table 8 Participating Functional Roles Role n1 n2 Role n1 n2 Operations 4,164 4,127 Others 956 928 Commercial 1,942 1,986 R&D / Innovation 920 932 Support 1,878 1,948 Table 9 Participating Organizational Levels Area n1 n2 Staff, without direct reports 5,991 5,953
Manager, with direct reports 2,793 2,833
Director or executive 1,076 1,135 Table 10 Participating Languages Language n1 n2 Spanish 9,027 9,105 English 833 816
Instrumentation
Rao and Weintraub (2013) developed their Innovation Quotient instrument based on
studies conducted by Tellis, Prabhu and Chandy (2009), who investigated innovation among 759
companies across 17 markets, the work of Christensen, Anthony, and Roth (2004), Schein
(1999), O’Reilly (1989), and Denison (1996). While specific results of tests for reliability and
validity were not reported, the authors stated that the elements and factors were “field-tested for
over two years for statistical validity and executive acceptance as both a diagnostic and
actionable tool. Data [were] gathered from 1,026 executives and managers in 15 companies

49
headquartered in the United States, Europe, Latin America, and Asia” (Rao & Weintraub, 2013,
p. 31). As no additional evidence for the validity and/or reliability of the instrument was
originally presented, the need to apply approaches to examine the validity and reliability of the
instrument, as previously described, was evident. While other authors have cited this new
instrument and the theoretical framework from which it was derived (e.g. Anthony, 2014; Silva,
2014), no additional use of the instrument in subsequent investigations within the last two years
is evident in the published literature.
Rao and Weintraub’s Innovation Quotient (2013) instrument consisted of six building
blocks (values, behaviors, climate, resources, processes, and success), each of which were
represented by three first order factors (see Appendix C). Each first order factor was indicated by
three elements, or indicators, represented by one survey question/item. There were a total of p =
54 indictors on the instrument, which were assessed using an ordinal, Likert-style scale where 1
= Not at all, 2 = To a small extent, 3 = To a moderate extent, 4 = To a great extent, and 5 = To a
very great extent. In addition to the instrument, an additional 15 to 18 categorical, demographic
questions were solicited, but only the grouping variables of countries, industries, employee
levels, functional roles, and languages of instrument administration were utilized in this present
study. While it is typically not common practice among the academic community to pool data
administered in more than one language (see Appendix C.1 for English and C.2 for Spanish), this
present study maintained the pooled dataset administered in two languages. Practitioners who
seek to compare their performance across multiple countries, industries, organizational levels,
functional roles, etc. often analyze results regardless of the language of administration, and it has
been the practice of the instrument’s author to facilitate such analyses. Therefore it was

50
necessary to consider the dataset in aggregate. Future research may wish to assess the extent to
which the measurement models are invariant across such groups or administrations.
Data Analysis and Procedures
As this investigation employed the use of a secondary dataset, no additional procedures
were required to manage missing data (Kline, 2011). The dataset (N = 19,781) obtained from the
instrument author was used to address the research questions which took place in two stages.
Stage 1. Consistent with best practice in conducting research to evaluate model fit and
estimate other psychometric properties of instruments (Osborne, 2008), a cross-validation
method was used to split the dataset in half, randomly using the Statistical Package for the Social
Sciences (SPSS version 22; IBM Corp., 2013). The first half of the dataset (n1 = 9,860) was
utilized to address each of the research questions for each of the six hypothesized measurement
models within the Innovation Quotient (2013) instrument – values, behaviors, climate,
resources, processes, and success. Each of the six hypothesized measurement models is
presented in Figure 5. These measurement models each include three first order factors, each of
which is measured by three indicators, where each of the first order factors are allowed to
correlate with each other.
For each of the six models, data screening procedures were utilized to ensure the
integrity, normality, and reliability of the first dataset. Univariate statistics of mean, standard
deviation, skewness, and kurtosis, as well as Pearson inter-item correlations, were computed and
examined for each of the 54 items using the Statistical Package for the Social Sciences (SPSS
version 22; IBM Corp., 2013). Individual items that exceeded the recommended standardized
values for skewness or kurtosis (+/- 3.0) were considered non-normal (Kline, 2011), but were
considered in the analysis regardless of skewness or kurtosis, as Field (2009) indicated that
extremely large sample sizes are likely to reduce standard errors, yielding standard z scores for

51
skewness and kurtosis that are more likely to yield extreme values. Each of the item distributions
was also visually assessed to ensure that each of the categories within the ordinal scales was
populated, and that the q-q plots of the distribution did not deviate from the expected
distribution.
Pearson item correlations for all items within each of the measurement models were
obtained using the Statistical Package for the Social Sciences (SPSS version 22; IBM Corp.,
2013) to assess item relatedness within each model (Table 13), where correlations greater than
0.30 demonstrated appropriate relationship (Hair, Black, Babin, & Anderson, 2010) . Also,
because the assumption of multivariate normality is required within the general linear model,
tests for multivariate normality within each of the six measurement models were conducted in
LISREL 9.2 (SSI, 2015) based upon Mardia’s (1985; SSI, 2015) recommendations. Models that
failed to pass the test were managed by extracting and applying the asymptotic covariance matrix
for issues with multivariate non-normality (Curran, West, & Finch, 1996; Kline, 2011) during
model fit analyses.

52
Values Resources Behaviors
Processes Climate Success
Figure 5. Hypothesized factor structure for each of the six blocks of innovation culture

53
Confirmatory factor analyses (CFAs) were performed in LISREL 9.2 (Kline, 2011; SSI,
2015) for each of the six models to determine model fit of the factor structures proposed by Rao
and Weintraub (2013). Hair, Black, Babin, and Anderson (2010) asserted that the use of a CFA
approach is appropriate if the investigator seeks to affirm a factor pattern that has previously
been theorized. As Rao and Weintraub (2013) have provided the initial evidence for the validity
of the factor structures of the Innovation Quotient instrument, and as additional information has
been sought from these researchers via electronic mail to identify the results underlying their
findings, a CFA was used to assess model fit for this present study.
As each of the items in every model was ordinal in scale, a polychoric matrix was used
(Tello, Moscoso, García, & Chaves, 2006; Tello, Moscoso, García, & Abad, 2010). The
unweighted least squares (ULS) estimation method (Kline, 2011) was employed for each CFA in
which the presence of multivariate non-normality for each of the six measurement models was
identified and where a fewer number of indicators per factor was present (Forero, Maydeu-
Olivares, & Gallardo-Pujol, 2009). Multiple indices were utilized to interpret adequacy of model
fit in addition to the chi-square tests (χ2) – performance on values approximately greater than
0.90 on the comparative fit index (CFI), greater than 0.95 the adjusted goodness of fit index
(AGFI), and lower than 0.10 on the standardized root mean square residual (SRMR) (Hair,
Black, Babin, & Anderson, 2010; Brown, 2006). While it has been stated that current research
advises against drawing conclusions based on strict RMSEA cutoffs, results that sit within the
confidence interval at 1.0 or less were interpreted as having a desirable fit (Hair, Black, Babin, &
Anderson, 2010).
To specify each of the models, the first indicator for each first order factor was set to one
for the first test of model fit. In cases where the model with only first order factors failed to

54
produce appropriate model fit or too much error, additional considerations were made, including
the decision to specify a higher order factor for that model – based on the theory that the factors
of each measurement model relate to the higher order construct (Rao & Weintraub, 2013) – or
the option to collapse factors to produce a two-factor solution if multicollinearity was present
(Kline, 2011). Also, in cases where common method variance (CMV) exceeded 50% of the total
variance explained by all of the indicators within a model, the inclusion of a common, social
desirability latent factor was considered to establish a better fit (Podsakoff, MacKenzie, Lee, &
Podsakoff, 2003). If model fit still could not be produced, evaluation of factor loading estimates
and modification indices were used to correlate errors, combine related first order factors, or
make other appropriate revisions. Finally, while multiple processes were used to identify the
model with best fit, it was noted that “specification searches based on purely empirical grounds
are discouraged because they are inconsistent with the theoretical basis of CFA” (Hair, Black,
Babin, & Anderson, 2010), so the simplest model demonstrating acceptable goodness of fit was
selected.
Results from each of the six CFAs were used to either corroborate the hypothesized
models or to propose the models demonstrating the best solutions and model fits. Using the
proposed models, assessments of the average variance extracted (AVE) and composite reliability
(CR) were conducted to provide additional evidence for convergent validity for each construct,
and the AVE and the squared interconstruct correlations (SIC) were used to compare to AVE to
assess divergent validity. The AVE is the sum of the squared standardized factor loadings, or
item reliability, divided by the number of items, and it was expected that each exceeded 0.50
(Fornell & Larcker, 1981), where SIC values were expected to fall below the AVE values of the
correlated constructs. The CR is the sum of the factor loadings squared, divided by that squared

55
sum plus the squared sum of the error variance terms, and was expected to exceed 0.70 (Hair,
Black, Babin, & Anderson, 2010) for each construct.
Initial estimates of item relatedness, as measured by the proxy of Cronbach’s alpha
coefficients, were computed for the overall measurement models, for each factor, and for each of
the group samples for which analysis is typically reported in organizations – by countries,
industries, employee levels, functional roles, and languages of instrument administration. Alpha
coefficients were loosely and contextually interpreted, as it is known that alpha values increase
as the number of items increases (Field, 2009). However, these results were used to interpret
opportunities for improvement by improving the reliability of the instrument for future use.
Stage 2. Assuming undesirable results were identified for any of the six measurement
models for the research questions, such as lack of acceptable evidence for the convergent or
discriminant validity, a new measurement model would need to be proposed. To address the third
research question, an exploratory factor analysis (EFA) would be conducted in SPSS (SPSS
version 22; IBM Corp., 2013) using the total item inventory supplied by the Innovation Quotient
instrument to identify a plausible factor structure, which would then be corroborated through a
content analysis of the items to ensure alignment with prior theory. The Minimum Average
Partial and parallel analysis methods would be used to determine the number of factors to retain
(Henson & Roberts, 2006; O’Connor, 2000; Velicer, 1976). As previous researchers have
theorized that the factors between and across each of the models correlate with one another, the
principal axis factoring method of extraction with a direct oblimin rotation strategy would be
used to produce the factors and capture the relationships among the items and their respective
factors (Costello & Osborne, 2011). At each iteration of the analysis, multiple criteria would be
used to determine whether to remove or delete items based on the pattern matrix, such as items

56
that did not load by at least 0.32 on any factor or items that cross-loaded on more than one factor
with a value greater than 0.32 (Costello & Osborne, 2011). Items with communality coefficients
(h2) less than 0.40 (Costello & Osborne, 2011) would be considered in tandem with an
examination of factor loadings and related item content, but evaluation of communalities will not
be used in isolation to remove items.
Once a new measurement model is proposed, the second half of the dataset (n2 = 9,921)
would be used to cross-validate the findings with a new sample. This cross-validation through an
independent sample ensures that recommended changes to the measurement model or factor
structure are valid across new samples (Brown, 2006; Byrne, Shavelson, & Muthén, 1989;
Osborne & Fitzpatrick, 2012). To replicate the results, the newly proposed measurement
model(s) would be subject to each of previous CFA analyses described in Stage 1 using the
second half of the dataset (n2 = 9,921).
Summary
This chapter articulated the methods used to select participants for this study, select the
instrument to use to measure the construct of culture of innovation, and to collect and analyze the
data to address the key research questions. Chapter Four will report the results and findings for
the research questions.

57
CHAPTER 4
RESULTS
The key objective of this present study was to assess the validity and reliability of the
Innovation Quotient instrument, as proposed by Rao and Weintraub (2013). The investigation
employed data screening, inter-item correlations, factor analytic methods, and estimates of
internal consistency to evaluate the validity and reliability for each of the six measurement
models – values, behaviors, climate, resources, processes, and success. This chapter presents the
findings from both Stage 1 and Stage 2.
Stage 1
Data Screening
Data screening procedures were conducted to ensure accuracy and reliability of the
results. As the dataset was obtained through a secondary source, no missing data were identified.
Item descriptives, including item means, standard deviations, skewness and kurtosis, were
analyzed for each of the models’ items using SPSS version 22 (IBM Corp., 2013) and are shown
in Table 11. The standardized values for skewness and kurtosis were also evaluated, and a
majority of the values demonstrated a negative skew, indicating a preference for general
agreement higher than the mean for many of the scales. While the large sample size (n1 = 9,860)
drove standard errors low, leading to highly inflated z-scores for skewness, this was not
determined as problematic (Field, 2009), even though it was noted that many of the individual
items exceeded the recommended thresholds of the absolute value of ±3.0 (Kline, 2011). No
items exceeded Kline’s (2011) recommended threshold of ±20.0 for z-kurt. These findings
provided preliminary evidence that each of the item distributions demonstrated levels of
normality that could be handled in continued analysis using modern statistical estimates.
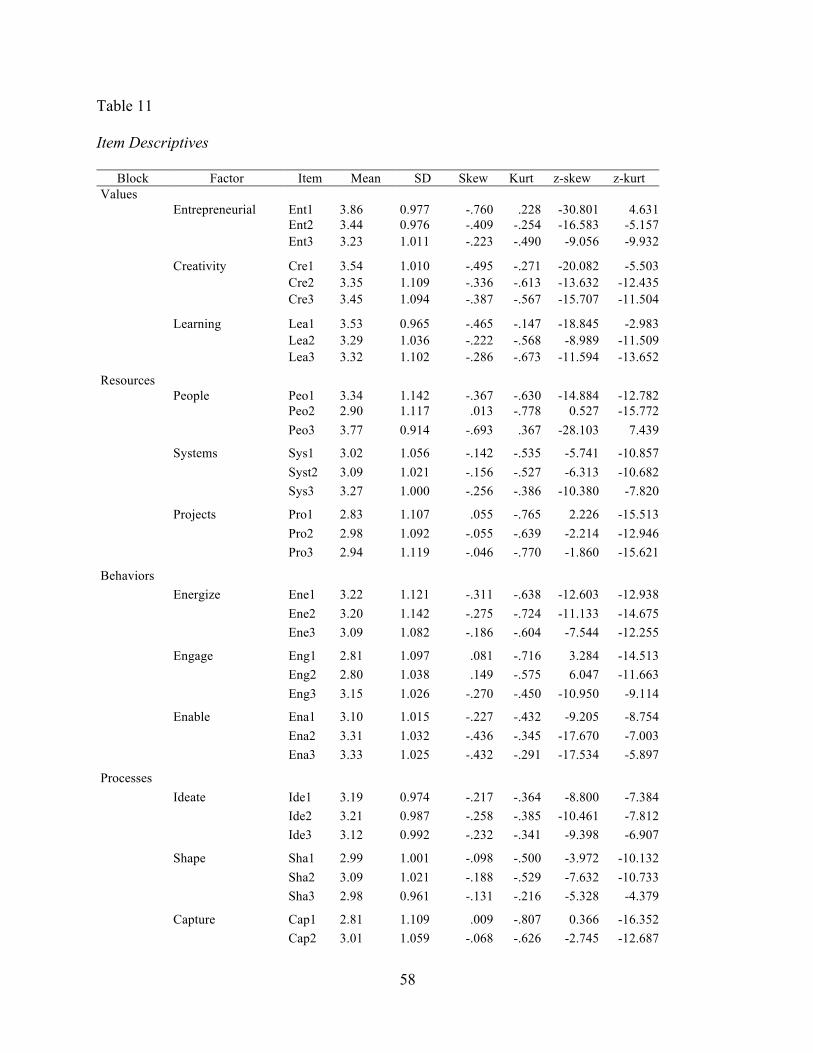
58
Table 11 Item Descriptives
Block Factor Item Mean SD Skew Kurt z-skew z-kurt Values Entrepreneurial Ent1 3.86 0.977 -.760 .228 -30.801 4.631
Ent2 3.44 0.976 -.409 -.254 -16.583 -5.157 Ent3 3.23 1.011 -.223 -.490 -9.056 -9.932
Creativity Cre1 3.54 1.010 -.495 -.271 -20.082 -5.503 Cre2 3.35 1.109 -.336 -.613 -13.632 -12.435 Cre3 3.45 1.094 -.387 -.567 -15.707 -11.504
Learning Lea1 3.53 0.965 -.465 -.147 -18.845 -2.983 Lea2 3.29 1.036 -.222 -.568 -8.989 -11.509 Lea3 3.32 1.102 -.286 -.673 -11.594 -13.652
Resources People Peo1 3.34 1.142 -.367 -.630 -14.884 -12.782 Peo2 2.90 1.117 .013 -.778 0.527 -15.772 Peo3 3.77 0.914 -.693 .367 -28.103 7.439
Systems Sys1 3.02 1.056 -.142 -.535 -5.741 -10.857 Syst2 3.09 1.021 -.156 -.527 -6.313 -10.682 Sys3 3.27 1.000 -.256 -.386 -10.380 -7.820
Projects Pro1 2.83 1.107 .055 -.765 2.226 -15.513 Pro2 2.98 1.092 -.055 -.639 -2.214 -12.946 Pro3 2.94 1.119 -.046 -.770 -1.860 -15.621
Behaviors Energize Ene1 3.22 1.121 -.311 -.638 -12.603 -12.938 Ene2 3.20 1.142 -.275 -.724 -11.133 -14.675 Ene3 3.09 1.082 -.186 -.604 -7.544 -12.255
Engage Eng1 2.81 1.097 .081 -.716 3.284 -14.513 Eng2 2.80 1.038 .149 -.575 6.047 -11.663 Eng3 3.15 1.026 -.270 -.450 -10.950 -9.114
Enable Ena1 3.10 1.015 -.227 -.432 -9.205 -8.754 Ena2 3.31 1.032 -.436 -.345 -17.670 -7.003 Ena3 3.33 1.025 -.432 -.291 -17.534 -5.897
Processes Ideate Ide1 3.19 0.974 -.217 -.364 -8.800 -7.384 Ide2 3.21 0.987 -.258 -.385 -10.461 -7.812 Ide3 3.12 0.992 -.232 -.341 -9.398 -6.907
Shape Sha1 2.99 1.001 -.098 -.500 -3.972 -10.132 Sha2 3.09 1.021 -.188 -.529 -7.632 -10.733 Sha3 2.98 0.961 -.131 -.216 -5.328 -4.379
Capture Cap1 2.81 1.109 .009 -.807 0.366 -16.352 Cap2 3.01 1.059 -.068 -.626 -2.745 -12.687

59
Cap3 2.99 1.032 -.100 -.576 -4.074 -11.676
Climate Collaboration Col1 2.94 1.054 -.024 -.627 -0.987 -12.715 Col2 3.36 1.012 -.401 -.285 -16.273 -5.784 Col3 3.45 1.011 -.471 -.244 -19.110 -4.955
Safety Saf1 3.45 0.985 -.521 -.093 -21.136 -1.888 Saf2 3.53 0.959 -.521 .008 -21.134 0.162 Saf3 3.46 1.034 -.523 -.267 -21.201 -5.407
Simplicity Sim1 2.70 1.101 .137 -.773 5.540 -15.679 Sim2 3.07 1.061 -.202 -.643 -8.181 -13.043 Sim3 3.02 1.006 -.095 -.554 -3.853 -11.223
Success External Ext1 3.34 1.024 -.275 -.374 -11.144 -7.589 Ext2 3.28 1.039 -.220 -.386 -8.910 -7.829 Ext3 3.26 1.001 -.210 -.245 -8.503 -4.967
Enterprise Ent1 3.44 1.055 -.426 -.349 -17.280 -7.079 Ent2 3.24 1.039 -.258 -.423 -10.460 -8.579 Ent3 3.49 0.989 -.440 -.098 -17.827 -1.982
Individual Ind1 3.09 1.098 -.155 -.662 -6.267 -13.416 Ind2 3.12 1.025 -.215 -.518 -8.715 -10.500 Ind3 2.81 1.106 .043 -.720 1.737 -14.604
As this present study employed multivariate methods to specify the factor structure of
each measurement model and needed to identify the most appropriate estimation method for
analysis, the assumption of multivariate normality was assessed for each of the six models using
LISREL 9.2 (SSI, 2015) based upon Mardia’s recommendations (Mardia, 1985; SSI, 2015).
Extreme, statistically significant values for z-skew and z-kurt showed that none of the six
measurement models met the criteria for multivariate normality (Table 12; Mardia, 1985), which
Kline (2011) suggested may occur due to large sample size. Therefore, it was determined that an
unweighted least squares method (ULS) of estimation would be applied, which has been shown
to outperform the weighted least squares estimation in accuracy when there are few indicators
per factor or high levels of skewness in the univariate distributions (Forero, Maydeu-Olivares, &
Gallardo-Pujol, 2009).

60
Table 12 Tests for Multivariate Normality
Model Relative Multivariate Kurt z-skew z-kurt Values 1.250 51.858* 52.938* Resources 1.235 52.659* 50.881* Behaviors 1.359 49.682* 65.600* Processes 1.320 38.090* 61.382* Climate 1.277 53.671* 56.409* Success 1.322 46.583* 61.637* * p < .001
Pearson item correlations for all items within each of the measurement models were
obtained to assess evidence for convergent and divergent validity within each model (Table 13).
Every item-correlation produced a statistically significant result at the p < .01 level which were
liberally interpreted as a function of the large sample size (n = 9,860). Across all of the models
inter-item correlations within each building block/model ranged from r = .315, p < .01 to r =
.797, p < .01, indicating moderate and sometimes high correlations both within and across related
factors (Hair, Black, Babin, & Anderson, 2010). This provided initial evidence for convergent
validity, but limited evidence for discriminant validity was determined, therefore suggesting the
possible presence of higher order factors for all six models – values, resources, behaviors,
processes, climate, and success, or evidence for common method variance/bias (CMV/B)
(Podsakoff, MacKenzie, Lee, & Podsakoff, 2003). This finding also informed the consideration
of a higher order factor in the subsequent specification of the measurement model for each of the
six confirmatory factor analyses when initial model fit without the higher order factor could not
be obtained. Using computations according to Fornell and Larcker (1981), final assessments of
convergent and discriminant validity would also be investigated through an analysis of the AVE,
SIC, and CR measures for each model.

61
Table 13 Inter-item correlations Values
EP1 EP2 EP3 Cre1 Cre2 Cre3 Lea1 Lea2 Lea3 EP1 1.00 EP2 .647 1.00 EP3 .465 .522 1.00 Cre1 .604 .565 .507 1.00 Cre2 .455 .424 .360 .534 1.00 Cre3 .463 .480 .429 .535 .458 1.00 Lea1 .480 .471 .401 .558 .425 .602 1.00 Lea2 .566 .549 .474 .614 .509 .530 .619 1.00 Lea3 .417 .507 .439 .556 .424 .613 .572 .626 1.00
Resources Peo1 Peo2 Peo3 Sys1 Sys2 Sys3 Pro1 Pro2 Pro3
Peo1 1.00 Peo2 .560 1.00 Peo3 .375 .415 1.00 Sys1 .535 .539 .429 1.00 Sys2 .556 .595 .413 .656 1.00 Sys3 .517 .500 .390 .519 .591 1.00 Pro1 .560 .524 .332 .533 .578 .565 1.00 Pro2 .480 .515 .315 .509 .548 .476 .556 1.00 Pro3 .504 .546 .344 .513 .574 .488 .603 .644 1.00
Behaviors
Ene1 Ene2 Ene3 Eng1 Eng2 Eng3 Ena1 Ena2 Ena3 Ene1 1.00 Ene2 .797 1.00 Ene3 .801 .784 1.00 Eng1 .712 .693 .770 1.00 Eng2 .553 .550 .586 .634 1.00 Eng3 .668 .648 .690 .667 .590 1.00 Ena1 .695 .665 .712 .688 .588 .744 1.00 Ena2 .684 .655 .694 .630 .521 .683 .729 1.00 Ena3 .679 .664 .691 .627 .521 .666 .698 .750 1.00
Processes
Ide1 Ide2 Ide3 Sha1 Sha2 Sha3 Cap1 Cap2 Cap3 Ide1 1.00 Ide2 .717 1.00 Ide3 .598 .697 1.00 Sha1 .610 .625 .592 1.00 Sha2 .527 .535 .531 .587 1.00 Sha3 .482 .524 .543 .524 .536 1.00 Cap1 .511 .513 .481 .559 .520 .505 1.00 Cap2 .549 .541 .523 .632 .560 .503 .637 1.00 Cap3 .548 .549 .529 .617 .561 .513 .617 .753 1.00
Climate
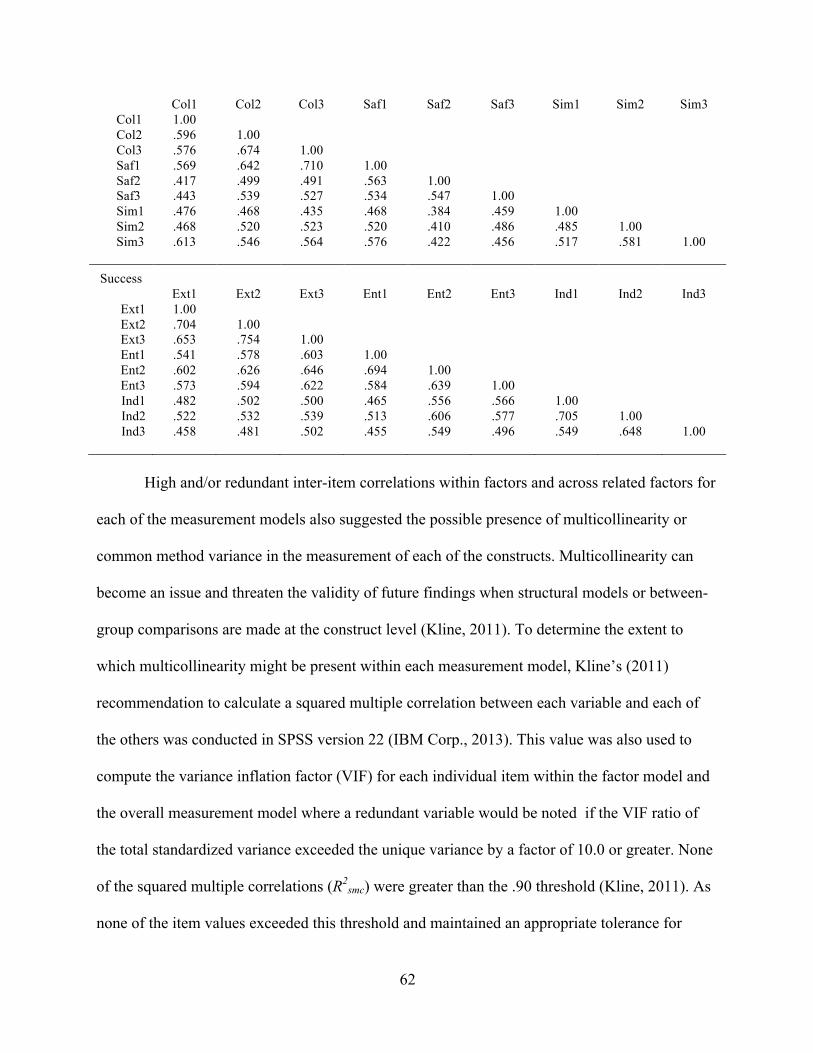
62
Col1 Col2 Col3 Saf1 Saf2 Saf3 Sim1 Sim2 Sim3 Col1 1.00 Col2 .596 1.00 Col3 .576 .674 1.00 Saf1 .569 .642 .710 1.00 Saf2 .417 .499 .491 .563 1.00 Saf3 .443 .539 .527 .534 .547 1.00 Sim1 .476 .468 .435 .468 .384 .459 1.00 Sim2 .468 .520 .523 .520 .410 .486 .485 1.00 Sim3 .613 .546 .564 .576 .422 .456 .517 .581 1.00 Success
Ext1 Ext2 Ext3 Ent1 Ent2 Ent3 Ind1 Ind2 Ind3 Ext1 1.00 Ext2 .704 1.00 Ext3 .653 .754 1.00 Ent1 .541 .578 .603 1.00 Ent2 .602 .626 .646 .694 1.00 Ent3 .573 .594 .622 .584 .639 1.00 Ind1 .482 .502 .500 .465 .556 .566 1.00 Ind2 .522 .532 .539 .513 .606 .577 .705 1.00 Ind3 .458 .481 .502 .455 .549 .496 .549 .648 1.00
High and/or redundant inter-item correlations within factors and across related factors for
each of the measurement models also suggested the possible presence of multicollinearity or
common method variance in the measurement of each of the constructs. Multicollinearity can
become an issue and threaten the validity of future findings when structural models or between-
group comparisons are made at the construct level (Kline, 2011). To determine the extent to
which multicollinearity might be present within each measurement model, Kline’s (2011)
recommendation to calculate a squared multiple correlation between each variable and each of
the others was conducted in SPSS version 22 (IBM Corp., 2013). This value was also used to
compute the variance inflation factor (VIF) for each individual item within the factor model and
the overall measurement model where a redundant variable would be noted if the VIF ratio of
the total standardized variance exceeded the unique variance by a factor of 10.0 or greater. None
of the squared multiple correlations (R2smc) were greater than the .90 threshold (Kline, 2011). As
none of the item values exceeded this threshold and maintained an appropriate tolerance for

63
analysis (less than 10.0) (Table 14), it was determined that there were no redundant items and
little evidence of extreme multicollinearity within a measurement model or within a factor.
Table 14 Variance Inflation Factors (VIF)
VIF by Item per Block VIF by Item for Factor Block Items 1 through 9 Factor 1 2 3
Values 3.663, 3.636, 2.532, 4.016, 2.532, 3.484, 3.534, 4.237, 3.690 Entrepreneurial 2.976 3.257 2.212 Creativity 2.674 2.331 2.342 Learning 2.959 3.356 3.021
Resources 3.185, 3.367, 2.028, 3.597, 4.348, 3.145, 3.650, 3.413, 3.802 People 2.392 2.513 1.815 Systems 3.086 3.546 2.604 Projects 2.786 3.106 3.425
Behaviors 7.143, 6.329, 8.000, 5.618, 3.165, 5.128, 5.988, 5.556, 5.181 Energize 6.494 5.988 6.098 Engage 3.717 3.058 3.344 Enable 4.237 5.076 4.587
Processes 4.219, 5.128, 4.000, 4.184, 3.268, 2.933, 3.425, 5.102, 4.902 Ideate 3.704 4.785 3.460 Shape 2.755 2.817 2.469 Capture 3.040 4.651 4.425
Climate 3.460, 4.167, 4.608, 4.673, 2.809, 3.067, 2.604, 3.040, 3.745 Collaboration 2.786 3.584 3.425 Safety 2.667 2.732 2.577 Simplicity 2.299 2.625 2.778
Success 4.049, 5.376, 5.208, 3.802, 5.000, 3.861, 3.861, 4.854, 3.226 External 3.690 5.102 4.405 Enterprise 3.546 4.016 3.012 Individual 3.509 4.367 2.950
As little evidence for multicollinearity was identified, the diagnostic test for common
method variance/bias (CMV/B) was conducted in SPSS version 22 (IBM Corp., 2013) using
Harman’s single-factor method (Podsakoff, MacKenzie, Lee, & Podsakoff, 2003) to determine if
a common method factor explained 50% or greater of the cumulative variance. Each of the
models failed Harman’s single-factor test (Table 15) with a percent of variance greater than 50%,
indicating the possible threat of a common method bias across the entire survey instrument, as
well as for each of the six measurement models. This finding revealed the possible consideration
of a common, social desirability factor in the subsequent specification of the measurement
models when initial model fit without the higher order factor could not be obtained.

64
Table 15 Common Method Variance
Model % variance explained All 54 items 50.123% Values 56.906% Resources 56.687% Behaviors 70.872% Processes 61.443% Climate 57.528% Success 62.138%
Model Fit Assessment and Reliability
To evaluate the extent to which the hypothesized factor structure of each of the six
measurement models of the Innovation Quotient instrument is consistent with the administration
of this present study, a confirmatory factor analysis (CFA) for each of the hypothesized
measurement models (Figure 5) was conducted using LISREL 9.2 (SSI, 2015). As each of the
instrument’s items was measured on an ordinal scale, a polychoric correlation matrix was applied
in the CFA instead of the Pearson correlation matrix (Tello, Moscoso, García, & Abad, 2010).
Additional procedures for model specification, estimation, and analysis are summarized in
Chapter Three. Greater detail of model fit analysis and interpretation is described below for the
Values measurement model, but similar processes were used for each of the model fit
assessments.
Values. Multiple CFA models were conducted to identify a model of best fit for Values
(Table 16). First, initial CFA results for the three-factor, hypothesized measurement model
(Figure 6) for values demonstrated adequate model fit, χ2 = 1117.818, df = 24, CFI = 0.960,
AGFI = 0.996, SRMR = 0.029, but presented error that approached the undesirable suggested
threshold of 0.100 for the RMSEA upper bound, RMSEA = 0.097 (0.094; 0.100). To improve

65
model fit and reduce error, additional model specifications were considered. First, because the
Harman’s test for common method bias had returned an adverse result (CMV = 56.91%), the
model was specified by loading each of the nine items onto their respective factors, as well as
onto a common factor, which improved the fit and reduced the error but returned a non-positive
definite result which Kline (2011) suggested may be attributed to multicollinearity. This result,
coupled with the finding that high inter-item correlations between and across indicators of
Entrepreneurial, Creativity, and Learning were identified by prior theory and in this present
study, and under the assumption that multicollinearity was not present based on desirable VIF
values, a three-factor model with a higher order factor was conducted. This specification did not
improve model fit or reduce error, and still returned a non-positive definite result, specifying
negative error variances in the model, causing the analysis to not converge. Next, modification
indices were reviewed to identify the impact of correlation of item errors within a factor on
overall variance and fit, and it was identified that by allowing the errors of items EP1 and EP3 to
correlate, better fit was obtained. Another iteration of this approach identified that the three-
factor model, where the errors of EP1 and EP3, as well as the errors of Cre1 and Cre2, were
allowed to correlate, produced the most significant result, χ2 = 892.644, df = 22, CFI = 0.968,
AGFI = 0.996, SRMR = 0.026, RMSEA = 0.090 (0.087; 0.094). A final, two-factor model where
the Creativity and Learning factors were collapsed into a single factor was attempted due to high
inter-factor correlations (Figure 6, Table 16) but did not improve the final result. It was decided
that the three-factor, EP1-EP3, Cre1-Cre2 errors model best fit the data with the least error, given
the current sample. However, as a significant amount of error was not reduced, the hypothesized
and most parsimonious model – the three factor model – was retained as the model that would
66
best suit researchers and practitioners interested in assessing the model of Values in research or
organizations, respectively (Table 16, Figure 6).
Standardized coefficients, structure coefficients, and R2 values of the confirmed model
were reviewed to avoid misinterpretation of the relationships among the items and their
corresponding factors (Table 17) (Graham, Guthrie, & Thompson, 2003). Standardized path
coefficients ranged from 0.660 to 0.856, indicating strong loadings on each of the indicators’
respective factors, but also suggested possible similarity, as the coefficients were very close in
range across factors. Structure coefficients for each of the three latent factors were also high,
ranging from 0.628 to 0.827, suggesting a possible lack of discriminant validity across each of
the factors within the model. Such high values for EP1 illustrate, for example, that for every one-
unit increase of both Creativity and Learning, performance on Entrepreneurial’s EP1 increased
0.767 and 0.717, respectively. The relationships between the latent variables indirectly increased
the relationship between a discriminant factor and an individual item. For each of the measured
variables in the model, the amount of variance explained ranged from R2 = 0.478 to 0.732 (Table
17), and in most cases was less than some of the structure coefficients of other factors.
For the Values model, it was identified that three factors within the model –
Entrepreneurship, Creativity, and Learning – were highly correlated (Table 18), explaining the
higher structure coefficients between the three factors. To evaluate convergent and discriminant
validity, AVE and CR, as well as SIC values, were computed. While each of the three factors’
AVE and CR values exceeded desirable thresholds of 0.5 and 0.7 for each, the SIC values
exceeded the corresponding AVE values (SICEP,Cre = 0.824; SICEP,Lea = 0.719; SICCre,Lea =
0.933), illustrating that the factors do not discriminate well among each other.
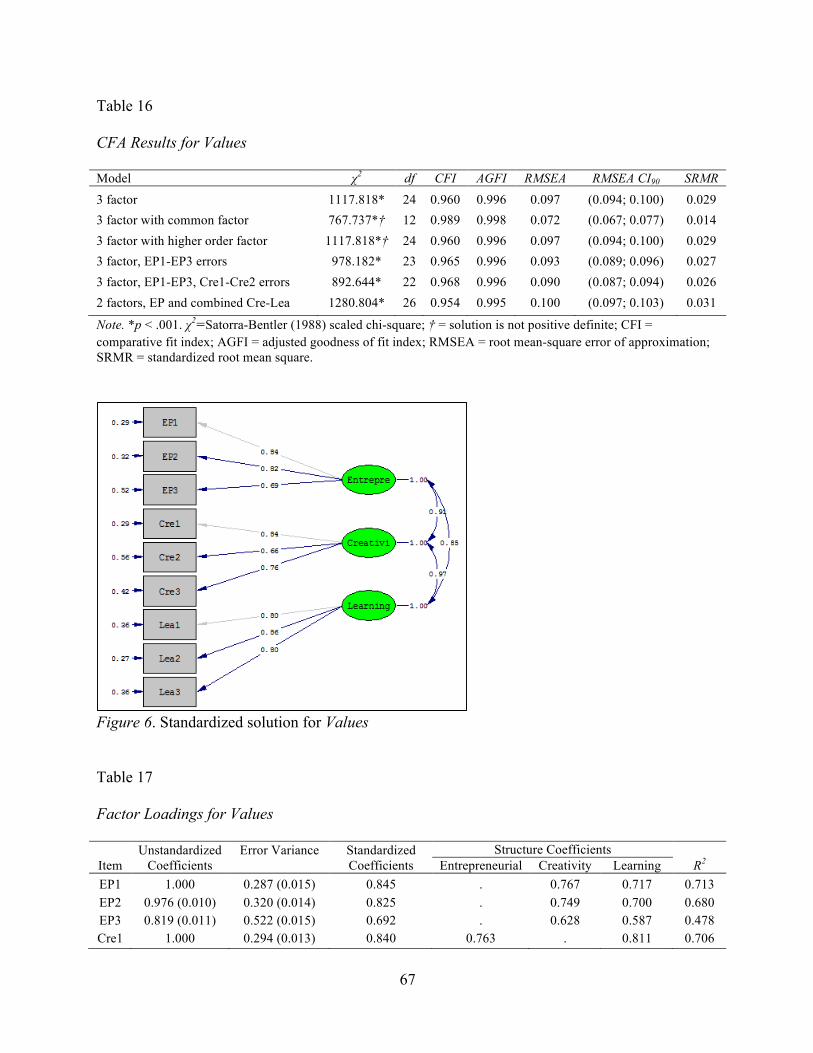
67
Table 16 CFA Results for Values Model χ2 df CFI AGFI RMSEA RMSEA CI90 SRMR
3 factor 1117.818* 24 0.960 0.996 0.097 (0.094; 0.100) 0.029 3 factor with common factor 767.737*† 12 0.989 0.998 0.072 (0.067; 0.077) 0.014 3 factor with higher order factor 1117.818*† 24 0.960 0.996 0.097 (0.094; 0.100) 0.029 3 factor, EP1-EP3 errors 978.182* 23 0.965 0.996 0.093 (0.089; 0.096) 0.027 3 factor, EP1-EP3, Cre1-Cre2 errors 892.644* 22 0.968 0.996 0.090 (0.087; 0.094) 0.026 2 factors, EP and combined Cre-Lea 1280.804* 26 0.954 0.995 0.100 (0.097; 0.103) 0.031
Note. *p < .001. χ2=Satorra-Bentler (1988) scaled chi-square; † = solution is not positive definite; CFI = comparative fit index; AGFI = adjusted goodness of fit index; RMSEA = root mean-square error of approximation; SRMR = standardized root mean square.
Figure 6. Standardized solution for Values Table 17 Factor Loadings for Values
Item Unstandardized
Coefficients Error Variance
Standardized Coefficients
Structure Coefficients R2 Entrepreneurial Creativity Learning
EP1 1.000 0.287 (0.015) 0.845 . 0.767 0.717 0.713 EP2 0.976 (0.010) 0.320 (0.014) 0.825 . 0.749 0.700 0.680 EP3 0.819 (0.011) 0.522 (0.015) 0.692 . 0.628 0.587 0.478 Cre1 1.000 0.294 (0.013) 0.840 0.763 . 0.811 0.706

68
Cre2 0.786 (0.010) 0.564 (0.014) 0.660 0.599 . 0.638 0.436 Cre3 0.906 (0.008) 0.421 (0.014) 0.761 0.691 . 0.735 0.579 Lea1 1.000 0.363 (0.014) 0.798 0.677 0.771 . 0.637 Lea2 1.072 (0.009) 0.268 (0.013) 0.856 0.726 0.827 . 0.732 Lea3 0.999 (0.010) 0.364 (0.014) 0.797 0.676 0.770 . 0.636 *p < .05 Table 18 Intra-construct Correlations, SIC, AVE, and CR Entrepreneurship Creativity Learning AVE CR Entrepreneurship 1.000 0.824 0.719 0.625 0.832 Creativity 0.908 1.000 0.933 0.573 0.800 Learning 0.848 0.966 1.000 0.668 0.858 Note: Values below the diagonal are estimates of intra-construct correlations, and values above the diagonal are squared intra-construct correlations (SIC).
Resources. Four CFA models were run to identify the best fit for Resources (Table 19).
CFA results for the three-factor, hypothesized measurement model (Figure 7) for Resources
demonstrated a desirable model fit, χ2 = 883.691, df = 24, CFI = 0.980, AGFI = 0.997, SRMR =
0.021, RMSEA = 0.060 (0.057; 0.064). While the data fit the hypothesized model, additional
model specifications were considered, due to considerations described above in the Values
section. A summary of the additional models considered, which also included a three-factor
model with a common latent factor, a higher order factor, and a model with correlated errors
based on analysis of modification indices, are presented in Table 16. However, as a significant
amount of error was not reduced through these efforts, the hypothesized and most parsimonious
three-factor model was also retained for subsequent analysis (Table 19, Figure 7).
Standardized path coefficients ranged from 0.525 to 0.823, indicating strong loadings on
each of the indicators’ respective factors, but also suggested possible inter-factorial similarity.
Structure coefficients for each of the three latent factors were also high, ranging from 0.463 to
0.784, suggesting a possible lack of discriminant validity across each of the factors within the

69
model (Graham, Guthrie, & Thompson, 2003). For the measured variables, the amount of
variance explained ranged from R2 = 0.276 to 0.677 (Table 20), with most above 0.521.
The three factors within the model – People, Systems, and Projects – were highly
correlated (Table 21), explaining the higher structure coefficients between the three factors. To
evaluate convergent and discriminant validity, AVE and CR, as well as SIC values, were
computed (Table 21). While AVE and CR values exceeded desirable thresholds of 0.5 and 0.7
for the Systems (AVE = 0.593, CR = 0.813) and Project factors (AVE = 0.601, CR = 0.819), the
AVE for Processes did not for AVE (AVE = 0.466, CR = 0.719), demonstrating lower
convergent validity for this factor. As the SIC values exceeded the corresponding AVE values
for all three factors (SICPeo,Sys = 0.908; SICPeo,Pro = 0.776; SICSys,Pro = 0.796), it was determined
that the factors did not discriminate well between each other.
Table 19 CFA Results for Resources Model χ2 df CFI AGFI RMSEA RMSEA CI90 SRMR 3 factor 883.691* 24 0.980 0.997 0.060 (0.057; 0.064) 0.021 3 factor with common 1503.830*┼ 12 0.993 0.998 0.051 (0.046; 0.055) 0.014 3 factor with higher order 883.691* 24 0.980 0.997 0.060 (0.057; 0.064) 0.021 3 factor, Pro2-Pro3 errors 612.883* 23 0.986 0.998 0.051 (0.048; 0.055) 0.018 Note. *p < .001. χ2=Satorra-Bentler (1988) scaled chi-square; ┼ = errors could not be identified; CFI = comparative fit index; AGFI = adjusted goodness of fit index; RMSEA = root mean-square error of approximation; SRMR = standardized root mean square.

70
Figure 7. Standardized solution for Resources Table 20 Factor Loadings for Resources Item Unstandardized
Coefficients Error
Variance Standardized Coefficients
Structure Coefficients People Systems Processes
R2
Peo1 1.000 0.454 (0.013) 0.739 . 0.704 0.651 0.546 Peo2 1.029 (0.010) 0.422 (0.013) 0.760 . 0.724 0.670 0.578 Peo3 0.710 (0.012) 0.724 (0.013) 0.525 . 0.500 0.463 0.276 Sys1 1.000 0.420 (0.013) 0.761 0.725 . 0.679 0.580 Sys2 1.080 (0.008) 0.323 (0.012) 0.823 0.784 . 0.734 0.677 Sys3 0.948 (0.009) 0.479 (0.013) 0.722 0.689 . 0.644 0.521 Pro1 1.000 0.374 (0.013) 0.791 0.697 0.706 . 0.626 Pro2 0.947 (0.009) 0.439 (0.013) 0.749 0.660 0.668 . 0.561 Pro3 0.993 (0.008) 0.383 (0.013) 0.785 0.692 0.700 . 0.617 *p < .05 Table 21 Intra-construct Correlations, SIC, AVE, and CR People Systems Projects AVE CR People 1.000 0.908 0.776 0.466 0.719 Systems 0.953 1.000 0.796 0.593 0.813 Projects 0.881 0.892 1.000 0.601 0.819 Note: Values below the diagonal are estimates of intra-construct correlations, and values above the diagonal are squared intra-construct correlations (SIC).
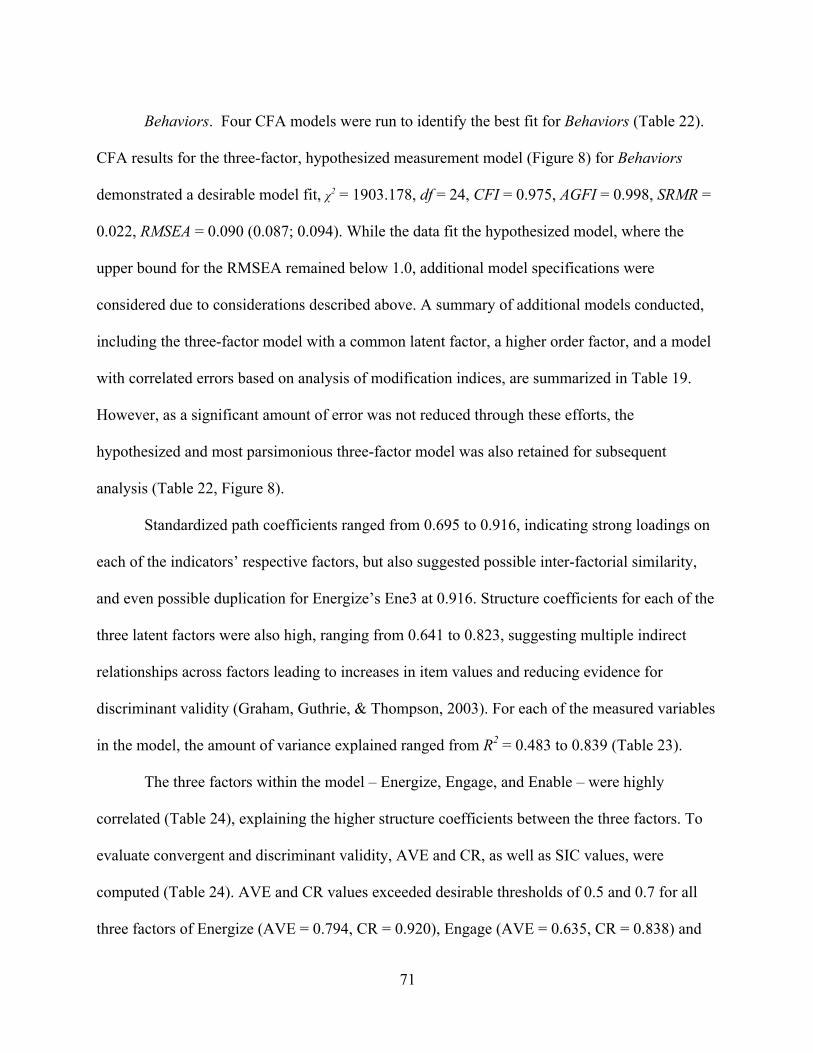
71
Behaviors. Four CFA models were run to identify the best fit for Behaviors (Table 22).
CFA results for the three-factor, hypothesized measurement model (Figure 8) for Behaviors
demonstrated a desirable model fit, χ2 = 1903.178, df = 24, CFI = 0.975, AGFI = 0.998, SRMR =
0.022, RMSEA = 0.090 (0.087; 0.094). While the data fit the hypothesized model, where the
upper bound for the RMSEA remained below 1.0, additional model specifications were
considered due to considerations described above. A summary of additional models conducted,
including the three-factor model with a common latent factor, a higher order factor, and a model
with correlated errors based on analysis of modification indices, are summarized in Table 19.
However, as a significant amount of error was not reduced through these efforts, the
hypothesized and most parsimonious three-factor model was also retained for subsequent
analysis (Table 22, Figure 8).
Standardized path coefficients ranged from 0.695 to 0.916, indicating strong loadings on
each of the indicators’ respective factors, but also suggested possible inter-factorial similarity,
and even possible duplication for Energize’s Ene3 at 0.916. Structure coefficients for each of the
three latent factors were also high, ranging from 0.641 to 0.823, suggesting multiple indirect
relationships across factors leading to increases in item values and reducing evidence for
discriminant validity (Graham, Guthrie, & Thompson, 2003). For each of the measured variables
in the model, the amount of variance explained ranged from R2 = 0.483 to 0.839 (Table 23).
The three factors within the model – Energize, Engage, and Enable – were highly
correlated (Table 24), explaining the higher structure coefficients between the three factors. To
evaluate convergent and discriminant validity, AVE and CR, as well as SIC values, were
computed (Table 24). AVE and CR values exceeded desirable thresholds of 0.5 and 0.7 for all
three factors of Energize (AVE = 0.794, CR = 0.920), Engage (AVE = 0.635, CR = 0.838) and

72
Enable (AVE = 0.726, CR = 0.888), but because the AVE values for each factor were still lower
than each of the SIC results (SICEne,Eng = 0.852; SICEneEna = 0.808; SICEng,Ena = 0.870), it was
determined that the factors did not discriminate well among each other.
Table 22 CFA Results for Behaviors Model χ2 df CFI AGFI RMSEA RMSEA CI90 SRMR 3 factor 1903.178* 24 0.975 0.998 0.090 (0.087; 0.094) 0.022 3 factor with common 656.065*┼ 12 0.996 1.00 0.048 (0.043; 0.053) 0.007 3 factor with higher order 1903.179* 24 0.975 0.998 0.090 (0.087; 0.094) 0.022 3 factor, Eng1-Eng2 1670.012* 23 0.978 0.998 0.086 (0.083; 0.090) 0.021 Note. *p < .001. χ2=Satorra-Bentler (1988) scaled chi-square; ┼ = errors could not be identified; CFI = comparative fit index; AGFI = adjusted goodness of fit index; RMSEA = root mean-square error of approximation; SRMR = standardized root mean square.
Figure 8. Standardized solution for Behaviors Table 23 Factor Loadings for Behaviors Item Unstandardized
Coefficients Error
Variance Standardized Coefficients
Structure Coefficients Energize Engage Enable
R2
Ene1 1.000 0.207 (0.011) 0.891 . 0.822 0.801 0.793
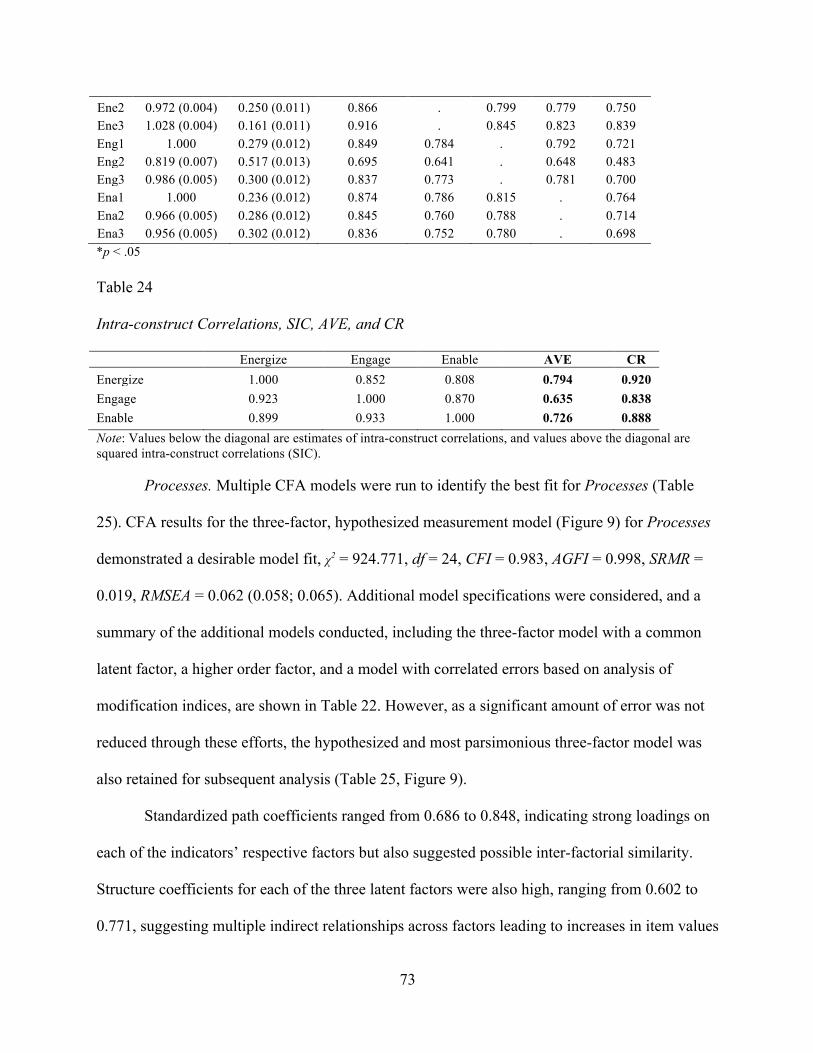
73
Ene2 0.972 (0.004) 0.250 (0.011) 0.866 . 0.799 0.779 0.750 Ene3 1.028 (0.004) 0.161 (0.011) 0.916 . 0.845 0.823 0.839 Eng1 1.000 0.279 (0.012) 0.849 0.784 . 0.792 0.721 Eng2 0.819 (0.007) 0.517 (0.013) 0.695 0.641 . 0.648 0.483 Eng3 0.986 (0.005) 0.300 (0.012) 0.837 0.773 . 0.781 0.700 Ena1 1.000 0.236 (0.012) 0.874 0.786 0.815 . 0.764 Ena2 0.966 (0.005) 0.286 (0.012) 0.845 0.760 0.788 . 0.714 Ena3 0.956 (0.005) 0.302 (0.012) 0.836 0.752 0.780 . 0.698 *p < .05 Table 24 Intra-construct Correlations, SIC, AVE, and CR Energize Engage Enable AVE CR Energize 1.000 0.852 0.808 0.794 0.920 Engage 0.923 1.000 0.870 0.635 0.838 Enable 0.899 0.933 1.000 0.726 0.888 Note: Values below the diagonal are estimates of intra-construct correlations, and values above the diagonal are squared intra-construct correlations (SIC).
Processes. Multiple CFA models were run to identify the best fit for Processes (Table
25). CFA results for the three-factor, hypothesized measurement model (Figure 9) for Processes
demonstrated a desirable model fit, χ2 = 924.771, df = 24, CFI = 0.983, AGFI = 0.998, SRMR =
0.019, RMSEA = 0.062 (0.058; 0.065). Additional model specifications were considered, and a
summary of the additional models conducted, including the three-factor model with a common
latent factor, a higher order factor, and a model with correlated errors based on analysis of
modification indices, are shown in Table 22. However, as a significant amount of error was not
reduced through these efforts, the hypothesized and most parsimonious three-factor model was
also retained for subsequent analysis (Table 25, Figure 9).
Standardized path coefficients ranged from 0.686 to 0.848, indicating strong loadings on
each of the indicators’ respective factors but also suggested possible inter-factorial similarity.
Structure coefficients for each of the three latent factors were also high, ranging from 0.602 to
0.771, suggesting multiple indirect relationships across factors leading to increases in item values

74
and reducing evidence for discriminant validity (Graham, Guthrie, & Thompson, 2003). For each
of the measured variables in the model, the amount of variance explained ranged from R2 = 0.532
to 0.718 (Table 26).
The three factors within the model – Ideate, Shape, and Capture – correlated highly
(Table 27), explaining the higher structure coefficients among the three factors. To evaluate
convergent and discriminant validity, AVE and CR, as well as SIC values, were computed
(Table 27). AVE and CR values exceeded desirable thresholds of 0.5 and 0.7 for all three factors
of Ideate (AVE = 0.672, CR = 0.860), Shape (AVE = 0.552, CR = 0.786) and Capture (AVE =
0.673, CR = 0.860), but because the AVE values for each factor were still lower than each of the
SIC results (SICIde,Sha = 0.826; SICIde,Cap = 0.615; SICSha,Cap = 0.828), it was determined that the
factors did not discriminate well among each other, with the exception of Ideate and Capture,
where the SIC between these two factors was less than the AVE for Ideate.
Table 25 CFA Results for Processes Model χ2 df CFI AGFI RMSEA RMSEA CI90 SRMR 3 factor 924.771* 24 0.983 0.998 0.062 (0.058; 0.065) 0.019 3 factor with common 1806.877*† 12 0.996 1.000 0.045 (0.040; 0.050) 0.010 3 factor with higher order 924.771*† 24 0.983 0.998 0.062 (0.058; 0.065) 0.019 3 factor, Ide1-Ide3 580.986* 23 0.990 0.999 0.050 (0.046; 0.053) 0.016 Note. *p < .001. χ2=Satorra-Bentler (1988) scaled chi-square; † = solution is not positive definite; CFI = comparative fit index; AGFI = adjusted goodness of fit index; RMSEA = root mean-square error of approximation; SRMR = standardized root mean square.
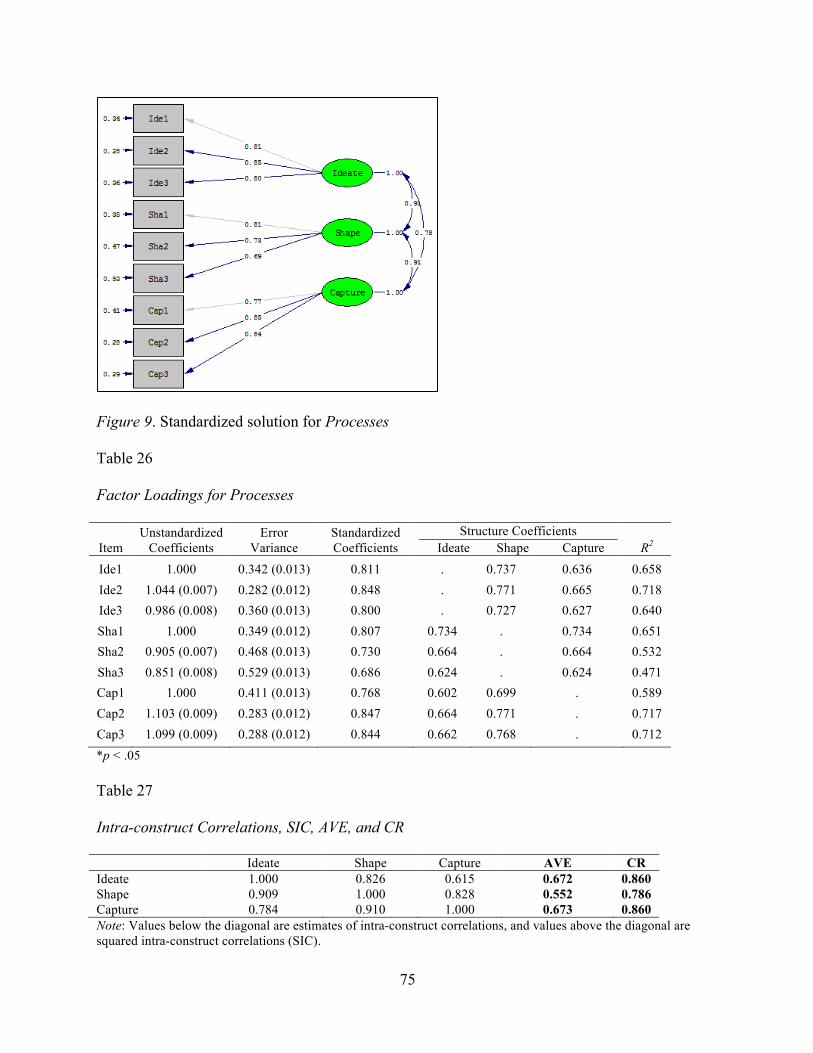
75
Figure 9. Standardized solution for Processes Table 26 Factor Loadings for Processes
Item Unstandardized
Coefficients Error
Variance Standardized Coefficients
Structure Coefficients Ideate Shape Capture R2
Ide1 1.000 0.342 (0.013) 0.811 . 0.737 0.636 0.658 Ide2 1.044 (0.007) 0.282 (0.012) 0.848 . 0.771 0.665 0.718 Ide3 0.986 (0.008) 0.360 (0.013) 0.800 . 0.727 0.627 0.640 Sha1 1.000 0.349 (0.012) 0.807 0.734 . 0.734 0.651 Sha2 0.905 (0.007) 0.468 (0.013) 0.730 0.664 . 0.664 0.532 Sha3 0.851 (0.008) 0.529 (0.013) 0.686 0.624 . 0.624 0.471 Cap1 1.000 0.411 (0.013) 0.768 0.602 0.699 . 0.589 Cap2 1.103 (0.009) 0.283 (0.012) 0.847 0.664 0.771 . 0.717 Cap3 1.099 (0.009) 0.288 (0.012) 0.844 0.662 0.768 . 0.712 *p < .05 Table 27 Intra-construct Correlations, SIC, AVE, and CR Ideate Shape Capture AVE CR Ideate 1.000 0.826 0.615 0.672 0.860 Shape 0.909 1.000 0.828 0.552 0.786 Capture 0.784 0.910 1.000 0.673 0.860 Note: Values below the diagonal are estimates of intra-construct correlations, and values above the diagonal are squared intra-construct correlations (SIC).

76
Climate. Multiple CFA models were run to identify the best fit for Climate (Table 28).
CFA results for the three-factor, hypothesized measurement model (Figure 10) for Climate
demonstrated an acceptable model fit, χ2 = 1755.376, df = 24, CFI = 0.962, AGFI = 0.995, SRMR
= 0.030, RMSEA = 0.086 (0.082; 0.089). Additional model specifications were considered, and
the additional models conducted, including the three-factor model with a common latent factor, a
higher order factor, and a model with correlated errors based on analysis of modification indices,
are summarized in Table 25. However, as a significant amount of error was not reduced through
these efforts, the hypothesized and most parsimonious three-factor model was also retained for
subsequent analysis (Table 28, Figure 10).
Standardized path coefficients ranged from 0.664 to 0.843, indicating strong loadings on
each of the indicators’ respective factors, but also suggested possible inter-factorial similarity.
Structure coefficients for each of the three latent factors were also high, ranging from 0.573 to
0.785, suggesting multiple indirect relationships across factors leading to increases in item values
and reducing evidence for discriminant validity (Graham, Guthrie, & Thompson, 2003). For each
of the measured variables in the model, the amount of variance explained ranged from R2 = 0.440
to 0.710 (Table 29).
The three factors within the model – Collaboration, Safety, and Simplicity – were highly
correlated (Table 30), explaining the higher structure coefficients among the three factors. To
evaluate convergent and discriminant validity, AVE and CR, as well as SIC values, were
computed (Table 30). AVE and CR values exceeded desirable thresholds of 0.5 and 0.7 for all
three factors of Collaboration (AVE = 0.617, CR = 0.829), Safety (AVE = 0.552, CR = 0.785)
and Simplicity (AVE = 0.532, CR = 0.772), but because the AVE values for each factor were
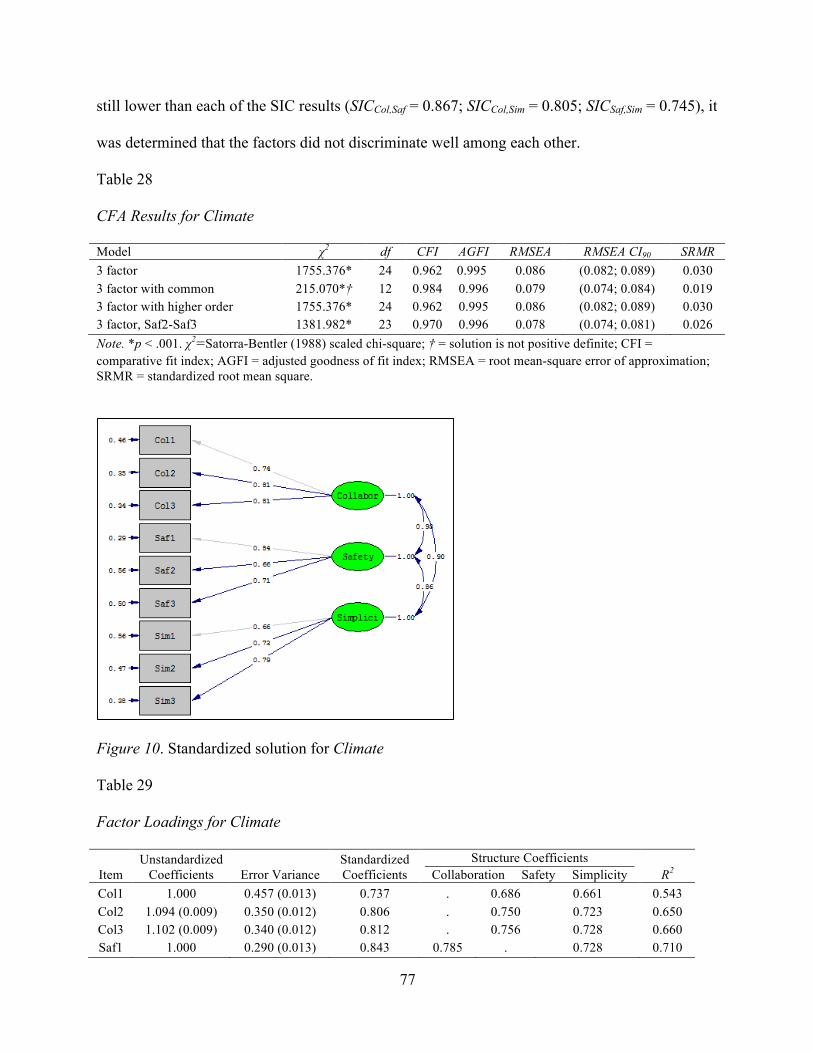
77
still lower than each of the SIC results (SICCol,Saf = 0.867; SICCol,Sim = 0.805; SICSaf,Sim = 0.745), it
was determined that the factors did not discriminate well among each other.
Table 28 CFA Results for Climate Model χ2 df CFI AGFI RMSEA RMSEA CI90 SRMR 3 factor 1755.376* 24 0.962 0.995 0.086 (0.082; 0.089) 0.030 3 factor with common 215.070*† 12 0.984 0.996 0.079 (0.074; 0.084) 0.019 3 factor with higher order 1755.376* 24 0.962 0.995 0.086 (0.082; 0.089) 0.030 3 factor, Saf2-Saf3 1381.982* 23 0.970 0.996 0.078 (0.074; 0.081) 0.026 Note. *p < .001. χ2=Satorra-Bentler (1988) scaled chi-square; † = solution is not positive definite; CFI = comparative fit index; AGFI = adjusted goodness of fit index; RMSEA = root mean-square error of approximation; SRMR = standardized root mean square.
Figure 10. Standardized solution for Climate Table 29 Factor Loadings for Climate
Item Unstandardized
Coefficients Error Variance Standardized Coefficients
Structure Coefficients Collaboration Safety Simplicity R2
Col1 1.000 0.457 (0.013) 0.737 . 0.686 0.661 0.543 Col2 1.094 (0.009) 0.350 (0.012) 0.806 . 0.750 0.723 0.650 Col3 1.102 (0.009) 0.340 (0.012) 0.812 . 0.756 0.728 0.660 Saf1 1.000 0.290 (0.013) 0.843 0.785 . 0.728 0.710
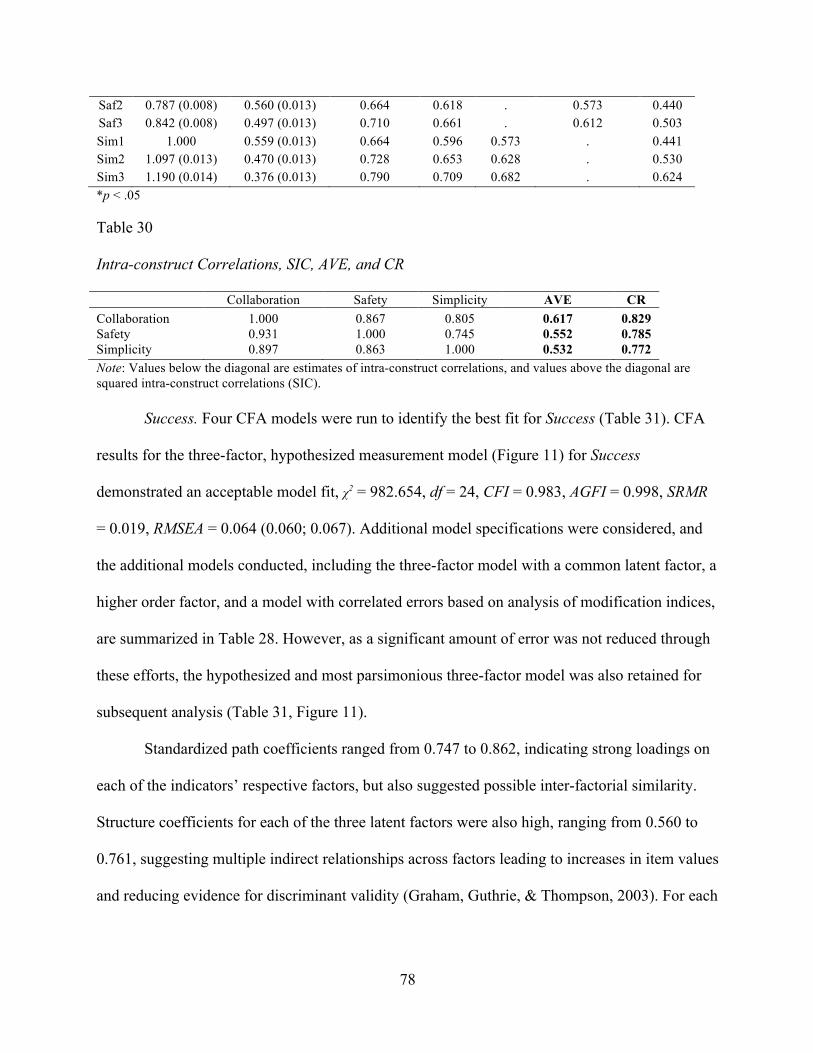
78
Saf2 0.787 (0.008) 0.560 (0.013) 0.664 0.618 . 0.573 0.440 Saf3 0.842 (0.008) 0.497 (0.013) 0.710 0.661 . 0.612 0.503 Sim1 1.000 0.559 (0.013) 0.664 0.596 0.573 . 0.441 Sim2 1.097 (0.013) 0.470 (0.013) 0.728 0.653 0.628 . 0.530 Sim3 1.190 (0.014) 0.376 (0.013) 0.790 0.709 0.682 . 0.624 *p < .05 Table 30 Intra-construct Correlations, SIC, AVE, and CR Collaboration Safety Simplicity AVE CR Collaboration 1.000 0.867 0.805 0.617 0.829 Safety 0.931 1.000 0.745 0.552 0.785 Simplicity 0.897 0.863 1.000 0.532 0.772 Note: Values below the diagonal are estimates of intra-construct correlations, and values above the diagonal are squared intra-construct correlations (SIC).
Success. Four CFA models were run to identify the best fit for Success (Table 31). CFA
results for the three-factor, hypothesized measurement model (Figure 11) for Success
demonstrated an acceptable model fit, χ2 = 982.654, df = 24, CFI = 0.983, AGFI = 0.998, SRMR
= 0.019, RMSEA = 0.064 (0.060; 0.067). Additional model specifications were considered, and
the additional models conducted, including the three-factor model with a common latent factor, a
higher order factor, and a model with correlated errors based on analysis of modification indices,
are summarized in Table 28. However, as a significant amount of error was not reduced through
these efforts, the hypothesized and most parsimonious three-factor model was also retained for
subsequent analysis (Table 31, Figure 11).
Standardized path coefficients ranged from 0.747 to 0.862, indicating strong loadings on
each of the indicators’ respective factors, but also suggested possible inter-factorial similarity.
Structure coefficients for each of the three latent factors were also high, ranging from 0.560 to
0.761, suggesting multiple indirect relationships across factors leading to increases in item values
and reducing evidence for discriminant validity (Graham, Guthrie, & Thompson, 2003). For each
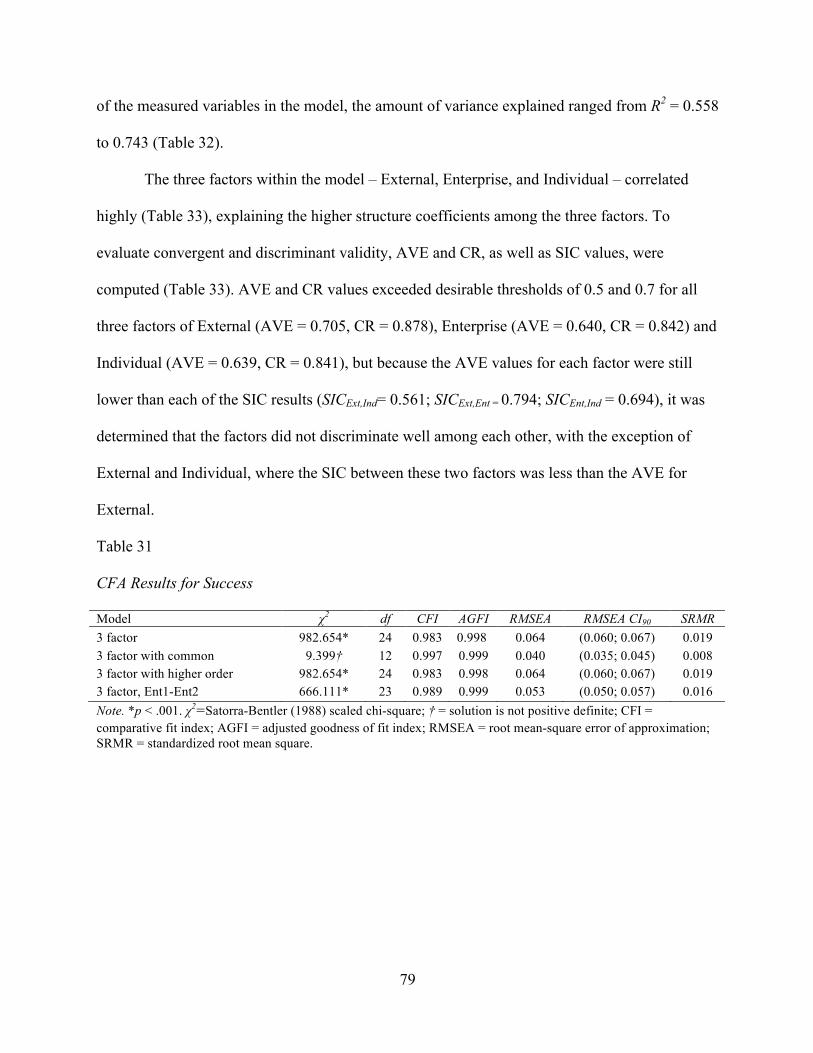
79
of the measured variables in the model, the amount of variance explained ranged from R2 = 0.558
to 0.743 (Table 32).
The three factors within the model – External, Enterprise, and Individual – correlated
highly (Table 33), explaining the higher structure coefficients among the three factors. To
evaluate convergent and discriminant validity, AVE and CR, as well as SIC values, were
computed (Table 33). AVE and CR values exceeded desirable thresholds of 0.5 and 0.7 for all
three factors of External (AVE = 0.705, CR = 0.878), Enterprise (AVE = 0.640, CR = 0.842) and
Individual (AVE = 0.639, CR = 0.841), but because the AVE values for each factor were still
lower than each of the SIC results (SICExt,Ind= 0.561; SICExt,Ent = 0.794; SICEnt,Ind = 0.694), it was
determined that the factors did not discriminate well among each other, with the exception of
External and Individual, where the SIC between these two factors was less than the AVE for
External.
Table 31 CFA Results for Success Model χ2 df CFI AGFI RMSEA RMSEA CI90 SRMR 3 factor 982.654* 24 0.983 0.998 0.064 (0.060; 0.067) 0.019 3 factor with common 9.399† 12 0.997 0.999 0.040 (0.035; 0.045) 0.008 3 factor with higher order 982.654* 24 0.983 0.998 0.064 (0.060; 0.067) 0.019 3 factor, Ent1-Ent2 666.111* 23 0.989 0.999 0.053 (0.050; 0.057) 0.016 Note. *p < .001. χ2=Satorra-Bentler (1988) scaled chi-square; † = solution is not positive definite; CFI = comparative fit index; AGFI = adjusted goodness of fit index; RMSEA = root mean-square error of approximation; SRMR = standardized root mean square.
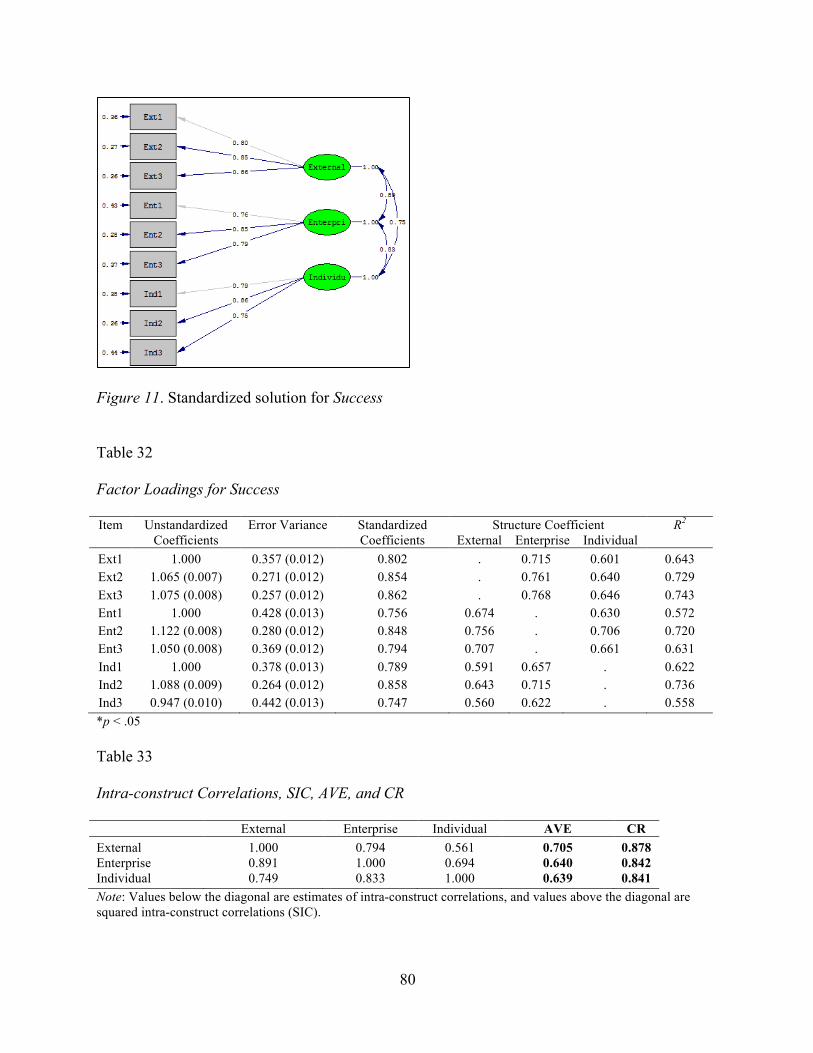
80
Figure 11. Standardized solution for Success Table 32 Factor Loadings for Success Item Unstandardized
Coefficients Error Variance Standardized
Coefficients Structure Coefficient
External Enterprise Individual R2
Ext1 1.000 0.357 (0.012) 0.802 . 0.715 0.601 0.643 Ext2 1.065 (0.007) 0.271 (0.012) 0.854 . 0.761 0.640 0.729 Ext3 1.075 (0.008) 0.257 (0.012) 0.862 . 0.768 0.646 0.743 Ent1 1.000 0.428 (0.013) 0.756 0.674 . 0.630 0.572 Ent2 1.122 (0.008) 0.280 (0.012) 0.848 0.756 . 0.706 0.720 Ent3 1.050 (0.008) 0.369 (0.012) 0.794 0.707 . 0.661 0.631 Ind1 1.000 0.378 (0.013) 0.789 0.591 0.657 . 0.622 Ind2 1.088 (0.009) 0.264 (0.012) 0.858 0.643 0.715 . 0.736 Ind3 0.947 (0.010) 0.442 (0.013) 0.747 0.560 0.622 . 0.558 *p < .05 Table 33 Intra-construct Correlations, SIC, AVE, and CR External Enterprise Individual AVE CR External 1.000 0.794 0.561 0.705 0.878 Enterprise 0.891 1.000 0.694 0.640 0.842 Individual 0.749 0.833 1.000 0.639 0.841 Note: Values below the diagonal are estimates of intra-construct correlations, and values above the diagonal are squared intra-construct correlations (SIC).

81
Summary. Each of the six original, hypothesized measurement models was the least
complicated model that demonstrated acceptable model fit (Table 34), demonstrating evidence
for convergent validity. However, none of the individual measurement models demonstrated
evidence for discriminant validity, indicating a high degree of items that load across theoretically
different factors. Therefore, it was determined that each of the models was not discriminant,
leading to the need for additional analyses to better explain the nature of the relationships
between the individual items.
Table 34 CFA Results Summary Model Spec χ2 df CFI AGFI RMSEA RMSEA CI90 SRMR Values 3 factor 1117.818* 24 0.960 0.996 0.097 (0.094; 0.100) 0.029 Resources 3 factor 883.691* 24 0.980 0.997 0.060 (0.057; 0.064) 0.021 Behaviors 3 factor 1903.178* 24 0.975 0.998 0.090 (0.087; 0.094) 0.022 Processes 3 factor 924.771* 24 0.983 0.998 0.062 (0.058; 0.065) 0.019 Climate 3 factor 924.771* 24 0.983 0.998 0.062 (0.058; 0.065) 0.019 Success 3 factor 982.654* 24 0.983 0.998 0.064 (0.060; 0.067) 0.019 Note. *p < .001. χ2=Satorra-Bentler (1988) scaled chi-square; CFI = comparative fit index; AGFI = adjusted goodness of fit index; RMSEA = root mean-square error of approximation; SRMR = standardized root mean square.
Reliability. While a lack of discriminant validity was identified, estimates of reliability,
as measured by coefficient alpha, were computed in order to support understanding regarding
improvements for each of the six original measurement models and for each of the groups for
which additional analyses are conducted in organizations – by countries (national cultures),
industries, employee levels, functional roles, and the languages of instrument administration.
Estimates were only computed for groups that had a minimum sample size of 30. Tables 35
through 37 illustrate that most of these first-order factor estimates exceeded Nunally’s (1978)
recommended threshold of 0.70, with many of them higher than 0.90, for the entire first half of
the dataset. Many of these estimates also met or exceeded reliability findings identified in

82
previous literature (e.g. Aiman-Smith et al., 2005; Anderson & West, 1998; Dobni, 2008;
Kuščer, 2013; Remneland-Wikhamn & Wikhamn, 2011; and Tohidi, Seyedaliakbar &
Mandegari, 2012). However, in some instances reliability estimates did not meet the desired
threshold and are illustrated by bold type in Tables 35 through 37.
While many of these estimates still approximated the threshold, which is a desirable
result considering each coefficient was estimated from a pool of only three items, multiple
patterns where thresholds were not met were identified. First, while the reliability estimate for
the factor of People within the resources model was sufficient for the entire sample (α = 0.712),
the thresholds were not consistent for all countries (for Spain, the United States, and Germany),
industries (industrial machinery and equipment, health care and social services, aerospace and
defense, food and beverages, construction and building materials, industrial metals and mining,
IT – software and electronics, education, public and state administration, pharmaceuticals, and
biotechnology and research), for the organizational level of managers, for the functional role of
R&D, or for the English language. Another pattern emerged for the Creativity factor within the
values model. While the overall estimate for the whole sample was α = 0.755, a lack of evidence
for reliability was identified for multiple industries (construction and building materials,
industrial metals and mining, automobile and parts, education, public and state administration,
transport and logistics, and pharmaceuticals). The pattern for the Simplicity factor in the climate
model showed questionable reliability for one country (Germany), but among multiple industries
(construction and building materials, industrial metals and mining, automobile and parts, IT –
software and electronics, public and state administration; and biotechnology and research). A
final pattern identified is that very few consistently poor findings emerged within a particular
country, organizational level, functional role, or language. However, for some particular

83
industries (construction and building materials, automobile and parts, public and state
administration, and biotechnology and research), reliability results, overall, were insufficient for
four or more factors.
In conclusion, while AVE values for most of the factors exceeded 0.50, all factors
exceeded the CR threshold of 0.70, and most areas were reliable across groups, a lack of
divergent validity was identified for each of the six measurement models. As multicollinearity
was excluded as a possible contributor to this issue via investigation of squared multiple
correlation and VIF values (Table 14), it was next hypothesized by the investigator that due to
the high amount of cross loading and common variance across factors, it could be theorized that
each of the six measurement models may actually be first order factors in the more global
construct of culture of innovation, when these six factors are measured by nine common items. A
follow-up investigation of a more global measurement model of a culture of innovation was
considered before investigating an alternative plausible model.

84
Table 35 Initial Block Reliability Estimates and Factor Estimates by Country
Model α Factor α 1 2 3 4 5 6 7 8 9
Values .904 Entrepreneurial .781 .792 .753 .713 .736 .733 .704 .700 .664 .745 Creativity .755 .728 .731 .717 .789 .732 .709 .820 .709 .810 Learning .820 .804 .798 .837 .750 .826 .824 .841 .820 .796
Resources .904 People .712 .689 .720 .727 .693 .730 .721 .753 .744 .688 Systems .811 .788 .811 .809 .749 .835 .837 .807 .863 .733 Projects .819 .796 .774 .836 .863 .851 .891 .859 .742 .850
Behaviors .948 Energize .920 .917 .914 .903 .889 .923 .922 .913 .925 .854 Engage .837 .817 .845 .829 .801 .846 .832 .854 .854 .723 Enable .888 .880 .885 .883 .814 .913 .897 .859 .887 .772
Processes .921 Ideate .859 .846 .862 .842 .792 .898 .875 .871 .833 .823 Shape .785 .746 .830 .782 .670 .822 .780 .818 .840 .707 Capture .857 .844 .838 .880 .781 .877 .878 .848 .854 .810
Climate .906 Collaboration .827 .820 .802 .796 .803 .813 .831 .836 .809 .822 Safety .784 .765 .779 .719 .803 .824 .758 .798 .637 .782 Simplicity .768 .747 .751 .724 .744 .789 .740 .806 .734 .589
Success .923 External .877 .858 .854 905 .850 .920 .917 .830 .899 .869 Enterprise .842 .841 .789 .839 .848 .844 .847 .825 .763 .742 Individual .837 .833 .821 .816 .792 .861 .820 .844 .853 .758
Note: α = alpha coefficient, 1 = Spain, 2 = Chile, 3 = Colombia, 4 = United States, 5 = Panama, 6 = El Salvador, 7 = Portugal, 8 = Mexico, 9 = Germany.

85
Table 36 Initial Factor Reliability Estimates by Industry
Factor α 1 2 3 4 5 6 7 8 9 10 11 12 13 14 15 16 17 18 19 20
Entrepreneurial .781 .762 .806 .821 .757 .821 .790 .749 .694 .656 .749 .803 .681 .749 .826 .665 .808 .772 .710 .669 .786 Creativity .755 .764 .760 .799 .766 .712 .737 .727 .693 .638 .681 .731 .708 .748 .795 .650 .673 .660 .683 .727 .776 Learning .820 .848 .836 .820 .800 .793 .807 .781 .731 .778 .739 .801 .756 .776 .835 .752 .798 .794 .751 .741 .798
People .712 .754 .747 .705 .693 .670 .699 .673 .643 .639 .702 .700 .716 .682 .731 .555 .562 .701 .638 .630 .811 Systems .811 .846 .829 .827 .807 .775 .766 .784 .748 .733 .716 .740 .744 .800 .805 .745 .722 .764 .687 .703 .816 Projects .819 .853 .842 .812 .830 .781 .762 .790 .752 .729 .703 .790 .827 .811 .852 .743 .680 .773 .816 .747 .791
Energize .920 .925 .928 .933 .918 .910 .915 .879 .884 .883 .890 .910 .906 .908 .873 .878 .915 .907 .893 .910 .905 Engage .837 .855 .860 .835 .840 .810 .807 .805 .765 .783 .779 .829 .824 .778 .846 .767 .798 .750 .798 .707 .719 Enable .888 .908 .900 .893 .870 .870 .886 .819 .825 .849 .859 .897 .884 .805 .831 .851 .902 .844 .838 .782 .827
Ideate .859 .879 .882 .854 .853 .871 .836 .851 .792 .807 .793 .833 .838 .836 .833 .870 .816 .821 .794 .773 .866 Shape .785 .823 .857 .760 .805 .763 .697 .746 .704 .704 .663 .725 .672 .747 .754 .708 .722 .727 .719 .589 .595 Capture .857 .895 .880 .851 .843 .812 .840 .804 .773 .745 .820 .828 .799 .778 .829 .760 .824 .849 .778 .723 .837
Collaboration .827 .841 .834 .844 .829 .787 .834 .774 .732 .763 .800 .827 .817 .759 .823 .808 .772 .839 .792 .557 .773 Safety .784 .800 .806 .785 .780 .757 .793 .771 .648 .759 .662 .787 .789 .701 .711 .752 .740 .770 .788 .652 .850 Simplicity .768 .794 .806 .757 .793 .733 .734 .722 .650 .689 .639 .763 .706 .695 .763 .724 .683 .706 .651 .487 .745
External .877 .925 .871 .870 .877 .846 .857 .776 .851 .843 .749 .861 .828 .820 .838 .829 .826 .868 .828 .804 .811 Enterprise .842 .861 .841 .856 .850 .825 .835 .772 .794 .794 .777 .829 .834 .769 .754 .827 .811 .824 .772 .801 .851 Individual .837 .854 .869 .852 .826 .815 .827 .772 .728 .760 .782 .834 .852 .805 .842 .819 .833 .804 .790 .733 .699
Note: α = alpha coefficient, 1 = Financial and insurance, 2 = Telecommunications, 3 = Professional services, 4 = Industrial machinery and equipment, 5 = Health care and social services, 6 = Aerospace and defense, 7 = Food and beverages, 8 = Construction and building materials, 9 = Industrial metals and mining; 10 = Automobile and parts, 11 = Oil and chemicals, 12 = Energy – electricity and gas, 13 = IT – software and electronics, 14 = Retail, 15 = Education, 16 = Public and state administration; 17 = Transport and logistics, 18 = Pharmaceuticals, 19 = Biotechnology and research, 20 = Media and publication.

86
Table 37 Estimates by Organizational Level, Functional Role, and Language
Factor α Staff Man Exec/Dir Ops Com Sup Oth R&D Span Eng
Entrepreneurial .781 .785 .776 .771 .781 .772 .789 .761 .775 .782 .740 Creativity .755 .755 .745 .798 .754 .750 .740 .792 .733 .753 .773 Learning .820 .818 .812 .848 .817 .838 .828 .772 .819 .825 .768
People .712 .724 .681 .712 .722 .718 .705 .712 .679 .716 .682 Systems .811 .817 .791 .825 .813 .829 .799 .785 .764 .814 .761 Projects .819 .830 .790 .820 .809 .828 .807 .858 .758 .814 .854
Energize .920 .920 .920 .916 .918 .924 .924 .884 .919 .923 .882 Engage .837 .848 .819 .816 .842 .855 .820 .812 .791 .840 .790 Enable .888 .894 .882 .862 .893 .891 .888 .833 .874 .893 .821
Ideate .859 .866 .846 .854 .867 .861 .868 .831 .805 .864 .799 Shape .785 .796 .771 .757 .796 .814 .770 .739 .708 .792 .687 Capture .857 .861 .851 .845 .861 .871 .857 .816 .820 .862 .791
Collaboration .827 .833 .813 .829 .836 .810 .822 .821 .807 .829 .801 Safety .784 .791 .775 .762 .778 .786 .786 .787 .772 .784 .777 Simplicity .768 .768 .754 .803 .764 .785 .755 .766 .743 .771 .730
External .877 .881 .864 .882 .876 .882 .880 .870 .860 .878 .864 Enterprise .842 .844 .835 .843 .842 .843 .847 .828 .820 .844 .826 Individual .837 .843 .820 .842 .843 .841 .833 .792 .831 .841 .781
Note: α = alpha coefficient, Man = Manager, Exec/Dir = Executive or director, Ops = Operations, Com = Commercial, Sup = Support, Oth = Other, R&D = Research and development, Span = Spanish, Eng = English.

87
An Integrated Model of Culture of Innovation
A global measure of the culture of innovation is consistent with previously discussed
instruments, such as those proposed by Aiman-Smith et al. (2005) and Dobni (2008). However,
Aiman-Smith’s et al. (2005) instrument reflected a less comprehensive view of the contributors
to a culture of innovation, overlapped with other organizational culture constructs, and consisted
of only nine factors – learning, customer orientation, business intelligence, business planning,
meaningful work, risk-taking culture, empowerment, open communication, agile decision-
making. Dobni’s (2008) instrument tapped into each of the critical areas of innovation culture
with seven factors – value orientation, creativity and empowerment, implementation context,
innovation propensity, market orientation, organizational constituency, and organizational
learning – but required 70 items to measure these constructs. It could be theorized that the
Innovation Quotient instrument in this present study also consists of fewer than the original 18
factors, and captured the more comprehensive view of innovation culture with 54 or fewer items.
With a possible consideration of nine observed variables per factor, improvement in the
measurement model would be possible through item elimination, as necessary.
To evaluate the extent to which the factor structure of the integrated culture of innovation
model, as measured by the Innovation Quotient instrument using a six-factor measurement
model, better fits the data for this present study, a confirmatory factor analysis (CFA) was
conducted using LISREL 9.2 (SSI, 2015). This proposed, integrated model is illustrated in
Figure 12, where each of the blocks of a culture of innovation is represented as a factor instead
of its own measurement model. As each of the instrument’s items was measured on an ordinal
scale, the polychoric correlation matrix was applied in the CFA instead of the Pearson

88
correlation matrix (Tello, Moscoso, García, & Abad, 2010). Additional procedures for model
specification, estimation, and analysis are summarized in Chapter Three.
Figure 12. Proposed factor structure of culture of innovation (integrated model)
Iteration 1. Results for the initial integrated, six-factor model only approached acceptable
levels for model fit, χ2 = 45,281.565, df = 1,362, CFI = 0.891, AGFI = 0.995, SRMR = 0.033,
RMSEA = 0.057 (0.057; 0.058) (Table 38). While performance on the AGFI and error indices of
SRMR and RMSEA were desirable, the CFI still did not reach the recommended threshold of
0.10 (Hair, Black, Babin, & Anderson, 2010). Each of the standardized factor loadings were
greater than 0.60 (Hair, Black, Babin, & Anderson, 2010). However, AVE and SIC values were
also computed for each of the variables (AVEValues = 0.515, AVEBehaviors = 0.514, AVEResources =
0.566, AVEProcesses = 0.523, AVEClimate = 0.672, AVESuccess = 0.574), and it was identified that
while each of the six factors had AVE values greater than 0.50, none of the factors demonstrated
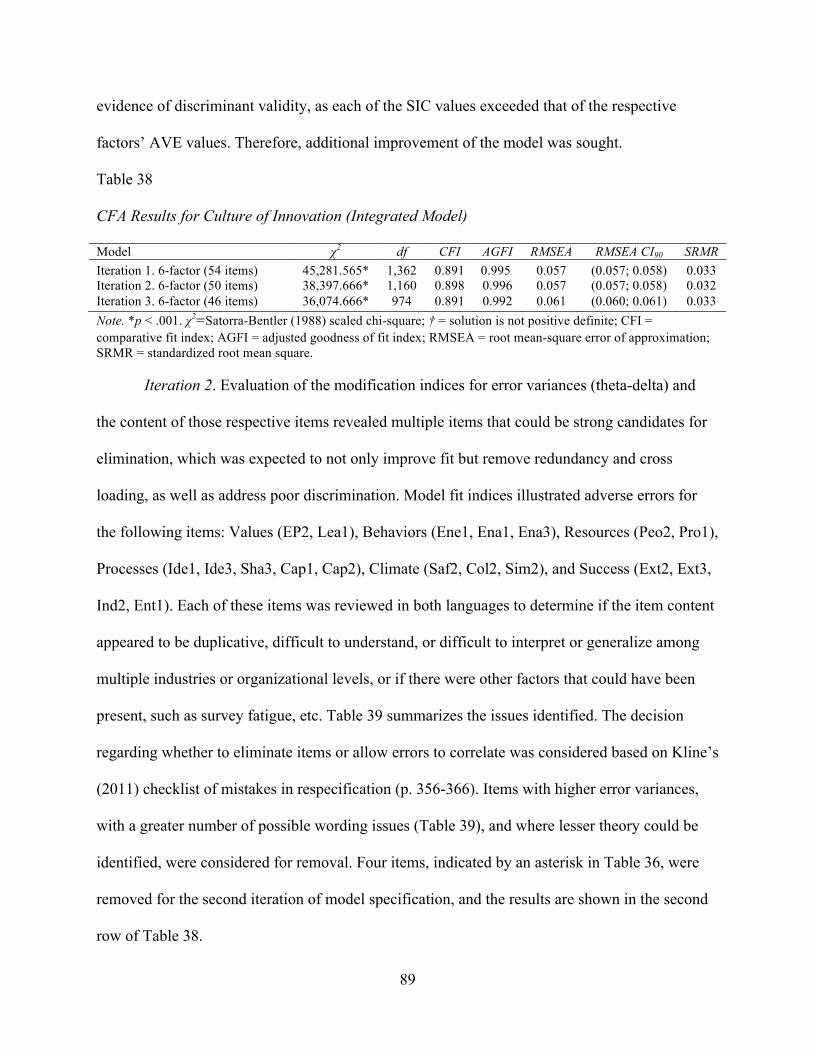
89
evidence of discriminant validity, as each of the SIC values exceeded that of the respective
factors’ AVE values. Therefore, additional improvement of the model was sought.
Table 38 CFA Results for Culture of Innovation (Integrated Model) Model χ2 df CFI AGFI RMSEA RMSEA CI90 SRMR Iteration 1. 6-factor (54 items) 45,281.565* 1,362 0.891 0.995 0.057 (0.057; 0.058) 0.033 Iteration 2. 6-factor (50 items) 38,397.666* 1,160 0.898 0.996 0.057 (0.057; 0.058) 0.032 Iteration 3. 6-factor (46 items) 36,074.666* 974 0.891 0.992 0.061 (0.060; 0.061) 0.033 Note. *p < .001. χ2=Satorra-Bentler (1988) scaled chi-square; † = solution is not positive definite; CFI = comparative fit index; AGFI = adjusted goodness of fit index; RMSEA = root mean-square error of approximation; SRMR = standardized root mean square.
Iteration 2. Evaluation of the modification indices for error variances (theta-delta) and
the content of those respective items revealed multiple items that could be strong candidates for
elimination, which was expected to not only improve fit but remove redundancy and cross
loading, as well as address poor discrimination. Model fit indices illustrated adverse errors for
the following items: Values (EP2, Lea1), Behaviors (Ene1, Ena1, Ena3), Resources (Peo2, Pro1),
Processes (Ide1, Ide3, Sha3, Cap1, Cap2), Climate (Saf2, Col2, Sim2), and Success (Ext2, Ext3,
Ind2, Ent1). Each of these items was reviewed in both languages to determine if the item content
appeared to be duplicative, difficult to understand, or difficult to interpret or generalize among
multiple industries or organizational levels, or if there were other factors that could have been
present, such as survey fatigue, etc. Table 39 summarizes the issues identified. The decision
regarding whether to eliminate items or allow errors to correlate was considered based on Kline’s
(2011) checklist of mistakes in respecification (p. 356-366). Items with higher error variances,
with a greater number of possible wording issues (Table 39), and where lesser theory could be
identified, were considered for removal. Four items, indicated by an asterisk in Table 36, were
removed for the second iteration of model specification, and the results are shown in the second
row of Table 38.
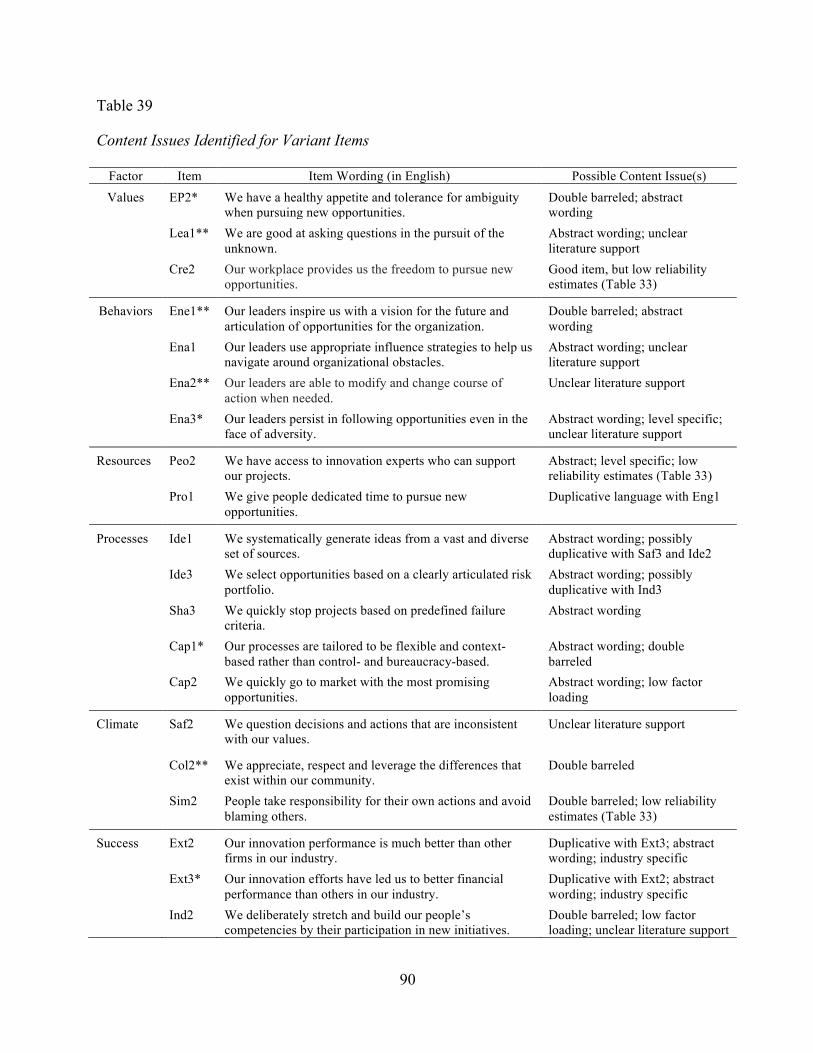
90
Table 39
Content Issues Identified for Variant Items
Factor Item Item Wording (in English) Possible Content Issue(s) Values EP2* We have a healthy appetite and tolerance for ambiguity
when pursuing new opportunities. Double barreled; abstract wording
Lea1** We are good at asking questions in the pursuit of the unknown.
Abstract wording; unclear literature support
Cre2 Our workplace provides us the freedom to pursue new opportunities.
Good item, but low reliability estimates (Table 33)
Behaviors Ene1** Our leaders inspire us with a vision for the future and articulation of opportunities for the organization.
Double barreled; abstract wording
Ena1 Our leaders use appropriate influence strategies to help us navigate around organizational obstacles.
Abstract wording; unclear literature support
Ena2** Our leaders are able to modify and change course of action when needed.
Unclear literature support
Ena3* Our leaders persist in following opportunities even in the face of adversity.
Abstract wording; level specific; unclear literature support
Resources Peo2 We have access to innovation experts who can support our projects.
Abstract; level specific; low reliability estimates (Table 33)
Pro1 We give people dedicated time to pursue new opportunities.
Duplicative language with Eng1
Processes Ide1 We systematically generate ideas from a vast and diverse set of sources.
Abstract wording; possibly duplicative with Saf3 and Ide2
Ide3 We select opportunities based on a clearly articulated risk portfolio.
Abstract wording; possibly duplicative with Ind3
Sha3 We quickly stop projects based on predefined failure criteria.
Abstract wording
Cap1* Our processes are tailored to be flexible and context-based rather than control- and bureaucracy-based.
Abstract wording; double barreled
Cap2 We quickly go to market with the most promising opportunities.
Abstract wording; low factor loading
Climate
Saf2 We question decisions and actions that are inconsistent with our values.
Unclear literature support
Col2** We appreciate, respect and leverage the differences that exist within our community.
Double barreled
Sim2 People take responsibility for their own actions and avoid blaming others.
Double barreled; low reliability estimates (Table 33)
Success Ext2 Our innovation performance is much better than other firms in our industry.
Duplicative with Ext3; abstract wording; industry specific
Ext3* Our innovation efforts have led us to better financial performance than others in our industry.
Duplicative with Ext2; abstract wording; industry specific
Ind2 We deliberately stretch and build our people’s competencies by their participation in new initiatives.
Double barreled; low factor loading; unclear literature support

91
Ent1 We treat innovation as a long-term strategy rather than a short-term fix.
Organization level or functional role specific
Note: *items removed in second iteration; **items removed in the third iterations
Results for the second six-factor model demonstrated acceptable levels for model fit, χ2 =
38,397.666, df = 1,160, CFI = 0.898, AGFI = 0.996, SRMR = 0.032, RMSEA = 0.057 (0.057;
0.058) (Table 38), a result strikingly similar to the first iteration. Each of the standardized factor
loadings were greater than 0.60 (Hair, Black, Babin, & Anderson, 2010), but AVE and SIC
values (AVEValues = 0.514, AVEBehaviors = 0.508, AVEResources = 0.573, AVEProcesses = 0.523,
AVEClimate = 0.645, AVESuccess = 0.565) still did not exceed the corresponding SIC values, again
lacking evidence of discrimination among factors. To continue to investigate opportunities to
improvement inter-factor discrimination, one final specification was considered.
Iteration 3. The third specification included the removal of additional items that
demonstrated inter-factor cross loading, as identified through modification indices or
standardized residuals. The content of each of these cross-loading items was examined, and
items that were well-written and are critical to the theory of a culture of innovation were not
removed. Only four items included questionable item content (Table 39) – Lea1, Ene1, Ena2,
and Col2 – and were therefore removed for the final iteration.
Results for the third six-factor model demonstrated acceptable levels for model fit, χ2 =
36,074.666, df = 974, CFI = 0. 891, AGFI = 0. 995, SRMR = 0. 033, RMSEA = 0. 061 (0.060;
0.061) (Table 38). Each of the standardized factor loadings exceeded 0.60 (Hair, Black, Babin, &
Anderson, 2010), with the exception of Engage 1 at 0.521, and standardized path coefficients
ranged from 0.521 to 0.833 (Figure 13, Table 40) and the amount of variance explained ranged
from R2 = 0.271 to 0.693 (Table 40). High structure coefficients for each of the three latent
factors, which ranged from 0.440 to 0.791 (Table 40), corroborated multiple indirect

92
relationships across the factors (Graham, Guthrie, & Thompson, 2003), and again failed to
provide evidence for discrimination among factors, as the AVE values for each of the six factors
(AVEValues = 0.511, AVEResources = 0.565, AVEBehaviors = 0.514, AVEProcesses = 0..511, AVEClimate
= 0.591, AVESuccess = 0.565) also did not exceed the corresponding SIC values (Table 41).

93
Figure 13. Standardized solution for Culture of Innovation (Integrated Model)
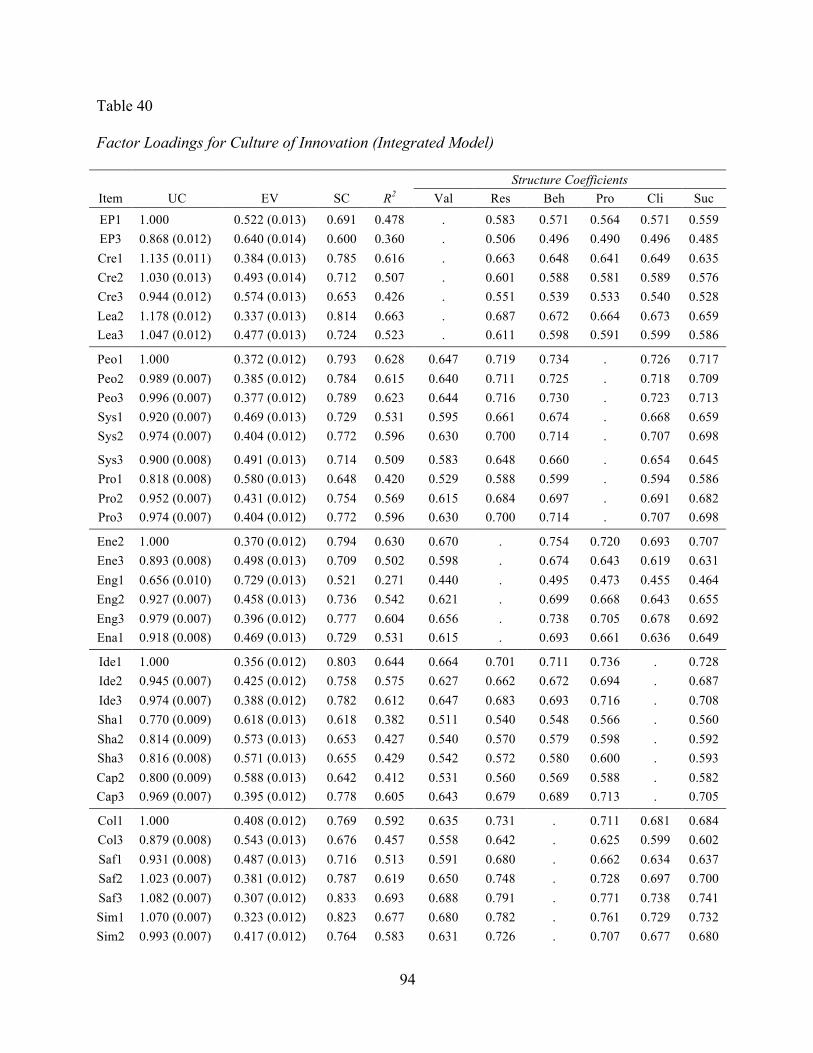
94
Table 40 Factor Loadings for Culture of Innovation (Integrated Model)
Structure Coefficients Item UC EV SC R2 Val Res Beh Pro Cli Suc EP1 1.000 0.522 (0.013) 0.691 0.478 . 0.583 0.571 0.564 0.571 0.559 EP3 0.868 (0.012) 0.640 (0.014) 0.600 0.360 . 0.506 0.496 0.490 0.496 0.485 Cre1 1.135 (0.011) 0.384 (0.013) 0.785 0.616 . 0.663 0.648 0.641 0.649 0.635 Cre2 1.030 (0.013) 0.493 (0.014) 0.712 0.507 . 0.601 0.588 0.581 0.589 0.576 Cre3 0.944 (0.012) 0.574 (0.013) 0.653 0.426 . 0.551 0.539 0.533 0.540 0.528 Lea2 1.178 (0.012) 0.337 (0.013) 0.814 0.663 . 0.687 0.672 0.664 0.673 0.659 Lea3 1.047 (0.012) 0.477 (0.013) 0.724 0.523 . 0.611 0.598 0.591 0.599 0.586
Peo1 1.000 0.372 (0.012) 0.793 0.628 0.647 0.719 0.734 . 0.726 0.717 Peo2 0.989 (0.007) 0.385 (0.012) 0.784 0.615 0.640 0.711 0.725 . 0.718 0.709 Peo3 0.996 (0.007) 0.377 (0.012) 0.789 0.623 0.644 0.716 0.730 . 0.723 0.713 Sys1 0.920 (0.007) 0.469 (0.013) 0.729 0.531 0.595 0.661 0.674 . 0.668 0.659 Sys2 0.974 (0.007) 0.404 (0.012) 0.772 0.596 0.630 0.700 0.714 . 0.707 0.698
Sys3 0.900 (0.008) 0.491 (0.013) 0.714 0.509 0.583 0.648 0.660 . 0.654 0.645 Pro1 0.818 (0.008) 0.580 (0.013) 0.648 0.420 0.529 0.588 0.599 . 0.594 0.586 Pro2 0.952 (0.007) 0.431 (0.012) 0.754 0.569 0.615 0.684 0.697 . 0.691 0.682 Pro3 0.974 (0.007) 0.404 (0.012) 0.772 0.596 0.630 0.700 0.714 . 0.707 0.698
Ene2 1.000 0.370 (0.012) 0.794 0.630 0.670 . 0.754 0.720 0.693 0.707 Ene3 0.893 (0.008) 0.498 (0.013) 0.709 0.502 0.598 . 0.674 0.643 0.619 0.631 Eng1 0.656 (0.010) 0.729 (0.013) 0.521 0.271 0.440 . 0.495 0.473 0.455 0.464 Eng2 0.927 (0.007) 0.458 (0.013) 0.736 0.542 0.621 . 0.699 0.668 0.643 0.655 Eng3 0.979 (0.007) 0.396 (0.012) 0.777 0.604 0.656 . 0.738 0.705 0.678 0.692 Ena1 0.918 (0.008) 0.469 (0.013) 0.729 0.531 0.615 . 0.693 0.661 0.636 0.649
Ide1 1.000 0.356 (0.012) 0.803 0.644 0.664 0.701 0.711 0.736 . 0.728 Ide2 0.945 (0.007) 0.425 (0.012) 0.758 0.575 0.627 0.662 0.672 0.694 . 0.687 Ide3 0.974 (0.007) 0.388 (0.012) 0.782 0.612 0.647 0.683 0.693 0.716 . 0.708 Sha1 0.770 (0.009) 0.618 (0.013) 0.618 0.382 0.511 0.540 0.548 0.566 . 0.560 Sha2 0.814 (0.009) 0.573 (0.013) 0.653 0.427 0.540 0.570 0.579 0.598 . 0.592 Sha3 0.816 (0.008) 0.571 (0.013) 0.655 0.429 0.542 0.572 0.580 0.600 . 0.593 Cap2 0.800 (0.009) 0.588 (0.013) 0.642 0.412 0.531 0.560 0.569 0.588 . 0.582 Cap3 0.969 (0.007) 0.395 (0.012) 0.778 0.605 0.643 0.679 0.689 0.713 . 0.705
Col1 1.000 0.408 (0.012) 0.769 0.592 0.635 0.731 . 0.711 0.681 0.684 Col3 0.879 (0.008) 0.543 (0.013) 0.676 0.457 0.558 0.642 . 0.625 0.599 0.602 Saf1 0.931 (0.008) 0.487 (0.013) 0.716 0.513 0.591 0.680 . 0.662 0.634 0.637 Saf2 1.023 (0.007) 0.381 (0.012) 0.787 0.619 0.650 0.748 . 0.728 0.697 0.700 Saf3 1.082 (0.007) 0.307 (0.012) 0.833 0.693 0.688 0.791 . 0.771 0.738 0.741 Sim1 1.070 (0.007) 0.323 (0.012) 0.823 0.677 0.680 0.782 . 0.761 0.729 0.732 Sim2 0.993 (0.007) 0.417 (0.012) 0.764 0.583 0.631 0.726 . 0.707 0.677 0.680

95
Sim3 1.004 (0.008) 0.403 (0.012) 0.772 0.597 0.638 0.733 . 0.714 0.684 0.687
Ext1 1.000 0.492 (0.013) 0.713 0.508 0.577 0.635 0.635 0.645 0.646 . Ext2 1.022 (0.008) 0.470 (0.013) 0.728 0.530 0.589 0.648 0.648 0.658 0.660 . Ent1 0.992 (0.010) 0.500 (0.013) 0.707 0.500 0.572 0.629 0.629 0.639 0.641 . Ent2 1.155 (0.009) 0.322 (0.012) 0.823 0.678 0.666 0.732 0.732 0.744 0.746 . Ent3 1.046 (0.009) 0.444 (0.013) 0.745 0.556 0.603 0.663 0.663 0.673 0.675 . Ind1 1.044 (0.010) 0.447 (0.013) 0.744 0.553 0.602 0.662 0.662 0.673 0.674 . Ind2 1.135 (0.010) 0.346 (0.012) 0.809 0.654 0.654 0.720 0.720 0.731 0.733 . Ind3 1.034 (0.010) 0.457 (0.013) 0.737 0.543 0.596 0.656 0.656 0.666 0.668 . *p < .05, UC = unstandardized coefficients; EV = error variance; SC = standardized coefficients.
Table 41 Intra-construct Correlations, SIC, AVE, and CR
Values Resources Behaviors Processes Climate Success AVE CR Values 1.000 0.666 0.712 0.684 0.682 0.654 0.511 0.879 Resources 0.816 1.000 0.823 0.839 0.856 0.817 0.565 0.921 Behaviors 0.844 0.907 1.000 0.762 0.903 0.792 0.514 0.862 Processes 0.827 0.916 0.873 1.000 0.785 0.821 0.511 0.892 Climate 0.826 0.925 0.950 0.886 1.000 0.792 0.591 0.920 Success 0.809 0.904 0.890 0.906 0.890 1.000 0.565 0.912 Note: Values below the diagonal are estimates of intra-construct correlations, and values above the diagonal are squared intra-construct correlations (SIC).
Stage 2
Exploratory Data Analysis
As results from each of the previous analyses illustrated an opportunity to identify a
model that demonstrates evidence for both convergent and discriminant validity, as well as
reliability for multiple groups, the third research question was investigated. A plausible
alternative factor structure of culture of innovation was sought, as well as information regarding
the extent to which an alternative factor structure would demonstrate reliability for multiple
organizational groups. To accomplish this, exploratory factor analysis (EFA) procedures were
conducted to identify a new plausible factor structure that would explain the greatest amount of
variance in the model, produce a clean item pattern that would yield the best model fit, and

96
reduce cross loading among factors (Henson & Roberts, 2006; Costello & Osborne, 2011; Farrell
& Rudd, 2009). The steps that were used to iterate, identify, and propose a clean factor structure
were conducted based on recommendations by Kieffer (1998), and were as follows: 1) identify
the number of factors to retain; 2) conduct the factor analysis, fixing the solution to the
appropriate number of factors; 3) interpret the results; 4) identify and select a single item to
delete, if necessary; and 5) repeat the process, starting first with the next analysis to determine
the number of factors to retain.
As it is known that the eigenvalue-greater-than-one rule has been shown to under- or
over-estimate the number of factors that should be extracted (Zwick & Velicer, 1986), the
Minimum Average Partial test and parallel analysis test (Henson & Roberts, 2006; O’Connor,
2000; Velicer, 1976), were conducted and interpreted in tandem. Also, theory and prior research
have indicated that the factors relate to one another, so a principal axis factoring method was
selected over the principal components analytic method, with the direct oblimin strategy of
rotation and a delta value set to zero (Costello & Osborne, 2011). At each iteration of the
analysis, multiple criteria were used to determine whether to remove or delete items based on the
pattern matrix, such as items that did not load by at least 0.32 on any factor, or items that cross-
loaded on more than one factor with a value greater than 0.32 (Costello & Osborne, 2011). Items
with communality coefficients (h2) less than 0.40 (Costello & Osborne, 2011) were considered in
tandem with an examination of factor loadings and related item content, but evaluation of
communalities was not used in isolation to remove items, as the goal was to retain the highest
number of items possible.
To identify a clean, simple solution, a total of 14 iterations of exploration were
completed. A parallel analysis and the minimum average partial (MAP) test were first conducted

97
at each iteration to determine the number of factors to retain. Results from the parallel test
produced the recommended extraction of a substantially high number of factors at each iteration
(approximately 12 or more factors each time) and therefore the MAP results were interpreted to
determine how many factors to retain, which was five factors for all 14 iterations. Table 42
presents a summary of each step completed in order to arrive at a simple structure.
Table 42 Steps to Complete Factor Analysis Iteration Factors
retained Item
removed Rationale
1 5 2 5 Ind1 Highest loading = 0.264; abstract; fatigue 3 5 Peo3 Highest loading = 0.247; abstract; level specific 4 5 Ind2 Highest loading = 0.273; abstract; fatigue 5 5 Ide1 Highest loading = 0.292; double-barrelled 6 5 Sys3 Highest loading = 0.294; level specific 7 5 Ide2 Highest loading = 0.287; abstract; level specific 8 5 Ind3 Highest loading = 0.295; abstract; fatigue 9 5 Cre2 Good item, but cross-loads on two factors = 0.356, 0.441; duplicative with
EP1; could be worded as “Our leaders provide us the freedom to pursue new opportunities.”
10 5 Cap2 Cross-loads on two factors = 0.471, 0.323; abstract; level specific 11 5 Sim1 Highest loading = 0.315; abstract; double-barrelled 12 5 Eng1 Cross-loads on two factors = 0.585, 0.322; double-barrelled about leadership
and time 13 5 Saf3 Cross-loads on two factors = 0.345, 0.336; abstract; double-barrelled 14 5 Saf2 Highest loading = 0.276; abstract; relevance
The final solution that best fit the data according to the factor pattern is shown in Table
43. The principal axis factor analysis with the final 41 items in five factors explained a total of
59.82% of the variance, where five factors produced eigenvalues greater than one, but the first
factor alone explained a total of 50.09% of that variance. With the exception of Entrepreneurial
3, Shape 3, and Simplicity 2, each of the communality coefficients (h2) were greater than 0.5,
illustrating a desired amount of variance of each items with its corresponding factor (Costello,

98
2009). While a five-factor solution was identified, analysis of the structure coefficients indicates
that most of the items still highly related not only to the factor on which it was intended to load,
but also moderately on the other factors (Table 43), illustrating the concern with common
method variance across all items. This was also illustrated through moderate to high inter-factor
correlations (in absolute values) among factors, r1,2 = 0.635, r1,3 = 0.717, r1,4 = 0.745, r1,5 = 0.313,
r2,3 = 0.636, r2,4 = 0.660, r2,5 = 0.291, r3,4 = 0.664, r3,5 = 0.307, r4,5 = 0.331, which were
particularly high between the first and second factors.
Table 43 Pattern Matrix and Communality
Factor Matrix Structure Matrix
1 2 3 4 5 1 2 3 4 5 h2
Entrepreneurial 1 .651 .465 .724 .552 .519 .105 .561 Entrepreneurial 2 .709 .477 .729 .498 .480 .156 .538 Entrepreneurial 3 .570 .444 .617 .428 .418 .190 .387 Creativity 1 .656 .551 .775 .555 .601 .231 .617 Creativity 3 .735 .434 .718 .428 .476 .291 .527 Learning 1 .702 .477 .727 .462 .500 .288 .536 Learning 2 .646 .623 .785 .590 .582 .197 .648 Learning 3 .691 .527 .745 .480 .526 .290 .566 People 1 .677 .644 .646 .598 .812 .196 .691 People 2 .555 .703 .505 .542 .603 .129 .524 Systems 1 .512 .713 .515 .570 .626 .274 .532 Systems 2 .605 .766 .551 .607 .636 .254 .601 Projects 1 .556 .739 .619 .553 .636 .257 .590 Projects 2 .665 .721 .459 .558 .558 .124 .539 Projects 3 .678 .749 .508 .562 .592 .131 .579 Energize 1 .827 .689 .593 .618 .877 .190 .786 Energize 2 .792 .653 .593 .585 .843 .203 .722 Energize 3 .781 .708 .611 .616 .877 .249 .780 Engage 2 .453 .708 .590 .570 .634 .344 .553 Engage 3 .688 .655 .544 .550 .800 .384 .662 Enable 1 .715 .680 .560 .571 .828 .375 .705 Enable 2 .803 .607 .539 .566 .822 .378 .690

99
Enable 3 .747 .613 .560 .587 .810 .339 .665 Ideate 3 .424 .672 .534 .565 .593 .373 .503 Shape 1 .469 .717 .615 .617 .595 .365 .577 Shape 2 .459 .680 .490 .585 .577 .401 .517 Shape 3 .467 .623 .457 .516 .501 .404 .442 Capture 1 .424 .680 .547 .577 .595 .414 .530 Capture 3 .508 .742 .554 .656 .608 .365 .598 Collaboration 1 .463 .742 .575 .675 .621 .407 .622 Collaboration 2 .340 .586 .591 .606 .652 .549 .601 Collaboration 3 .381 .577 .602 .600 .647 .584 .625 Safety 1 .357 .606 .618 .631 .653 .570 .637 Simplicity 2 .345 .512 .480 .497 .551 .513 .453 Simplicity 3 .392 .697 .550 .628 .612 .488 .594 External 1 .717 .596 .524 .778 .527 .259 .609 External 2 .859 .598 .530 .841 .538 .245 .708 External 3 .832 .610 .534 .841 .563 .263 .708 Enterprise 1 .600 .575 .520 .729 .577 .253 .547 Enterprise 2 .537 .713 .596 .793 .644 .318 .678 Enterprise 3 .578 .601 .555 .744 .604 .248 .578
Trace 20.926 1.794 1.515 1.144 1.113 Total Variance 50.09% 3.32% 2.90% 1.79% 1.72%
Note: absolute values of factor loadings are shown; loadings less than 0.32 left blank; h2 = communality
Regardless of moderate to high factor correlations, it was expected that the simple
structure identified through the exploratory factor analysis would yield a better fit over the
original structure as well as reduce cross loading among factors, (Henson & Roberts, 2006;
Costello & Osborne, 2011; Rao & Weintraub, 2013). The principal axis factoring produced a
solution that grouped items together in a surprising yet meaningful way. For example, People 1
loaded onto the factor that resembled the original Behaviors factors, which is a logical pairing for
an item that states “We have committed leaders who are willing to be champions of innovation.”
In a similar manner, Engage 2, an item formerly tapping the Behaviors factor, loaded higher on
the factor that resembles the original Resources factor, stating “In our organization, people at all
levels proactively take initiative to innovate,” which may hint in content that those resources or

100
systems are diffused throughout the organization, and may therefore be more similar to the
former Resources and Processes items. Simplicity 3 loaded higher on this factor as well,
suggesting that “Our people know exactly how to get started and move initiatives through the
organization,” which may involve those structures or processes that have been established to
facilitate innovative activity. As the exploratory analysis yielded these findings and others, the
following model (Figure 14) was proposed as a plausible alternative factor structure of a culture
of innovation using the second half of the dataset, which would therefore be tested for additional
evidence for convergent and discriminant validity as well as reliability for multiple
organizational groups.
Figure 14. Proposed factor structure for culture of innovation (alternate model)
Cross-validation
To evaluate the extent to which the alternate factor structure of culture of innovation
demonstrated evidence for convergent and discriminant validity and reliability, confirmatory
factor analytic procedures and reliability estimates were conducted using the second half of the

101
dataset (n2 = 9,921) to ensure that the changes are valid across new samples (Byrne, Shavelson,
& Muthén,1989).
Data screening. The data screening procedures completed for the first half of the data set
were also conducted using the second half to ensure accuracy and reliability of the results. Item
descriptives were analyzed for each of the models’ items using SPSS version 22 (IBM Corp.,
2013) and are shown in Table 44. Most of the values also demonstrated a negative skew,
indicating a preference for general agreement higher than the mean for the scales. While the
large sample size (n2 = 9,921) drove standard errors low, leading to highly inflated z-scores for
skewness, this was not determined as problematic (Field, 2009), even though many of the
individual items exceeded the recommended thresholds of the absolute value of ±3.0 (Kline,
2011). No items exceeded Kline’s (2011) recommended threshold of ±20.0 for z-kurt. These
findings showed, similar to the first half of the data set, the item distributions were appropriate
for continued analysis.
Table 44 Item Descriptives Mean SD skew z-skew kurt z-kurt
Values Entrepreneurial 1 3.851 0.960 -0.742 -30.174 0.268 5.456 Entrepreneurial 2 3.447 0.962 -0.365 -14.860 -0.263 -5.355 Entrepreneurial 3 3.259 0.988 -0.233 -9.472 -0.418 -8.505 Creativity 1 3.540 0.998 -0.505 -20.557 -0.206 -4.193 Creativity 3 3.484 1.077 -0.402 -16.342 -0.531 -10.809 Learning 1 3.535 0.962 -0.430 -17.487 -0.204 -4.144 Learning 2 3.292 1.024 -0.226 -9.204 -0.515 -10.480 Learning 3 3.321 1.091 -0.296 -12.030 -0.653 -13.276
Behaviors People 1 3.352 1.143 -0.377 -15.344 -0.632 -12.843 Engage 3 3.178 1.030 -0.290 -11.776 -0.431 -8.764 Energize 1 3.217 1.119 -0.311 -12.635 -0.656 -13.341 Energize 2 3.198 1.133 -0.267 -10.852 -0.710 -14.431 Energize 3 3.102 1.078 -0.197 -7.997 -0.609 -12.395 Enable 1 3.115 1.010 -0.226 -9.184 -0.424 -8.613
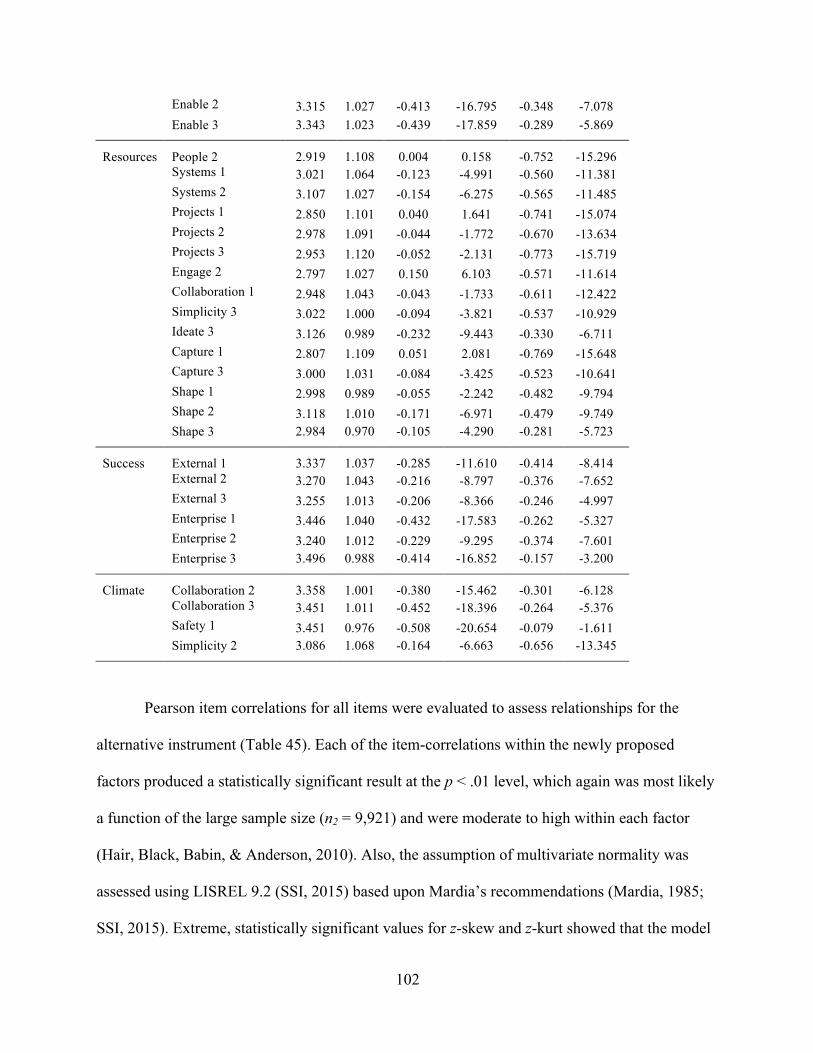
102
Enable 2 3.315 1.027 -0.413 -16.795 -0.348 -7.078 Enable 3 3.343 1.023 -0.439 -17.859 -0.289 -5.869
Resources People 2 2.919 1.108 0.004 0.158 -0.752 -15.296 Systems 1 3.021 1.064 -0.123 -4.991 -0.560 -11.381 Systems 2 3.107 1.027 -0.154 -6.275 -0.565 -11.485 Projects 1 2.850 1.101 0.040 1.641 -0.741 -15.074 Projects 2 2.978 1.091 -0.044 -1.772 -0.670 -13.634 Projects 3 2.953 1.120 -0.052 -2.131 -0.773 -15.719 Engage 2 2.797 1.027 0.150 6.103 -0.571 -11.614 Collaboration 1 2.948 1.043 -0.043 -1.733 -0.611 -12.422 Simplicity 3 3.022 1.000 -0.094 -3.821 -0.537 -10.929 Ideate 3 3.126 0.989 -0.232 -9.443 -0.330 -6.711 Capture 1 2.807 1.109 0.051 2.081 -0.769 -15.648 Capture 3 3.000 1.031 -0.084 -3.425 -0.523 -10.641 Shape 1 2.998 0.989 -0.055 -2.242 -0.482 -9.794 Shape 2 3.118 1.010 -0.171 -6.971 -0.479 -9.749 Shape 3 2.984 0.970 -0.105 -4.290 -0.281 -5.723
Success External 1 3.337 1.037 -0.285 -11.610 -0.414 -8.414 External 2 3.270 1.043 -0.216 -8.797 -0.376 -7.652 External 3 3.255 1.013 -0.206 -8.366 -0.246 -4.997 Enterprise 1 3.446 1.040 -0.432 -17.583 -0.262 -5.327 Enterprise 2 3.240 1.012 -0.229 -9.295 -0.374 -7.601 Enterprise 3 3.496 0.988 -0.414 -16.852 -0.157 -3.200
Climate Collaboration 2 3.358 1.001 -0.380 -15.462 -0.301 -6.128 Collaboration 3 3.451 1.011 -0.452 -18.396 -0.264 -5.376 Safety 1 3.451 0.976 -0.508 -20.654 -0.079 -1.611 Simplicity 2 3.086 1.068 -0.164 -6.663 -0.656 -13.345
Pearson item correlations for all items were evaluated to assess relationships for the
alternative instrument (Table 45). Each of the item-correlations within the newly proposed
factors produced a statistically significant result at the p < .01 level, which again was most likely
a function of the large sample size (n2 = 9,921) and were moderate to high within each factor
(Hair, Black, Babin, & Anderson, 2010). Also, the assumption of multivariate normality was
assessed using LISREL 9.2 (SSI, 2015) based upon Mardia’s recommendations (Mardia, 1985;
SSI, 2015). Extreme, statistically significant values for z-skew and z-kurt showed that the model

103
did not meet the criteria for multivariate normality (zskew = 140.809, p<.001, zkurt = 143.388,
p<.001, χ2 = 40,387.421, p<.001; Mardia, 1985), which Kline (2011) affirmed may occur in large
samples. Therefore, it was again determined that an unweighted least squares method (ULS) of
estimation was necessary for this analysis (Forero, Maydeu-Olivares, & Gallardo-Pujol, 2009).
Table 45 Inter-item Correlations Values EP1 EP2 EP3 Cre1 Cre3 Lea1 Lea2 Lea3
EP1 1.000 EP2 .637 1.000 EP3 .425 .483 1.000 Cre1 .594 .553 .486 1.000 Cre3 .438 .461 .407 .509 1.000 Lea1 .473 .454 .389 .546 .585 1.000 Lea2 .555 .531 .463 .610 .508 .608 1.000 Lea3 .458 .495 .438 .545 .591 .541 .608 1.000
Behaviors Peo1 Eng3 Ene1 Ene2 Ene3 Ena1 Ena2 Ena3
Peo1 1.000 Eng3 .635 1.000 Ene1 .742 .667 1.000 Ene2 .696 .644 .801 1.000 Ene3 .733 .693 .795 .786 1.000 Ena1 .648 .754 .695 .673 .712 1.000 Ena2 .651 .689 .687 .657 .700 .743 1.000 Ena3 .648 .685 .684 .664 .698 .705 .758 1.000
Resources
Peo2
Sys1
Sys2
Pro1
Pro2
Pro3
Eng2
Col1 Sim3 Ide3
Cap1
Cap3 Sha1
Sha2
Sha3
Peo2 1.00 Sys1 .549 1.00 Sys2 .592 .649 1.00 Pro1 .545 .548 .577 1.00 Pro2 .504 .504 .542 .577 1.00 Pro3 .559 .517 .584 .606 .636 1.00 Eng2 .527 .537 .563 .589 .500 .537 1.00 Col1 .547 .536 .571 .563 .499 .550 .609 1.00 Sim3 .495 .525 .543 .554 .466 .491 .584 .599 1.00

104
Ide3 .462 .497 .524 .528 .481 .489 .522 .543 .533 1.00 Cap1 .476 .510 .520 .548 .461 .473 .557 .575 .564 .499 1.00 Cap3 .508 .523 .547 .556 .542 .525 .558 .623 .571 .537 .624 1.00 Sha1 .504 .495 .531 .567 .485 .514 .567 .598 .555 .598 .584 .631 1.00 Sha2 .471 .488 .524 .505 .469 .485 .521 .561 .534 .535 .539 .568 .589 1.00 Sha3 .417 .449 .460 .470 .405 .430 .467 .496 .487 .538 .520 .521 .544 .513 1.00
Success Ext1 Ext2 Ext3 Ent1 Ent2 Ent3 Ext1 1.000 Ext2 .712 1.000 Ext3 .673 .752 1.000 Ent1 .546 .565 .596 1.000 Ent2 .611 .622 .646 .682 1.000 Ent3 .582 .594 .623 .587 .642 1.000
Climate Col2 Col3 Saf1 Sim2 Col2 1.000 Col3 .663 1.000 Saf1 .649 .718 1.000 Sim2 .514 .522 .520 1.000
Note: all correlations are statistically significant at p < .01.
Model fit assessment. To evaluate the extent to which the alternative, five-factor model
better fit the data for this present study, a confirmatory factor analysis (CFA) was conducted
using LISREL 9.2 (SSI, 2015) using the second half of the total data set (n2 = 9,921). This
proposed model is illustrated in Figure 13, where each of the blocks of a culture of innovation is
represented as a factor instead of its own measurement model. As each of the instrument’s items
was measured on an ordinal scale, the polychoric correlation matrix was applied in the CFA
instead of the Pearson correlation matrix (Tello, Moscoso, García, & Abad, 2010). Additional
procedures for model specification, estimation, and analysis are summarized in Chapter Three.
Iteration 1. An initial CFA model was conducted to identify the best fit for the alternate
factor structure (Table 46). Results for the first run of the five-factor model (Figure 14) with 41
items approached a desirable model fit, χ2 = 36,871.422, df = 769, CFI = 0.880, AGFI = 0.994,
SRMR = 0.037, RMSEA = 0.069 (0.069; 0.070). However, to increase model fit, additional model

105
specifications were considered, as squared interfactor correlations exceeded the individual AVE
values for each factor, demonstrating lesser evidence for discriminant validity. To attempt to
increase AVE values and decrease cross-loading, it was identified through an examination of the
modification indices and standardized residual values that multiple items could be candidates for
deletion, such as People 1, Collaboration 2, Enable 3, and Shape 3. Examination of item content
for the indicators of Collaboration 2, Enable 3, and Shape 3 revealed existing issues, as
determined in previous analyses (see Table 39), and were deleted. While People 1 did not present
apparent content issues, it was also deleted, as it cross-loaded with multiple items across multiple
factors – a surprising yet meaningful result.
Iteration 2. A second CFA model was completed using the remaining 37 items (Table
46). A strikingly similar result was produced, where the model still approached an acceptable
model fit, χ2 = 29,024.467, df = 619, CFI = 0.893, AGFI = 0.995, SRMR = 0.035, RMSEA =
0.068 (0.068; 0.069), where each of these values met acceptable thresholds, except for the CFI,
which was just beneath the desired threshold of 0.900. Even with the elimination of four items
with significant interfactor cross-loading, SIC values exceeded at each iteration corresponding
AVE values, indicating that the factors still did not discriminate. Based on this repeated finding,
and the identification of high structure coefficients, it was determined that discrimination would
most likely not be achieved without significantly reducing the number of items in the model.
Therefore, a final iteration was considered to improve model fit where errors would be allowed
to correlate. An analysis of the modification indices, coupled with an evaluation of content
similarity, indicated a significant improvement in estimates if the errors of the following pairs of
items correlated – Entrepreneurial 1 and Entrepreneurial 2, Learning 1 and Creativity 3, Systems
1 and People 2, Projects 2 and Projects 3, and Enterprise 2 and Enterprise 3.

106
Iteration 3. A final CFA was conducted with the remaining 37 variables, allowing the
errors of the four following pairs to correlate – Entrepreneurial 1 and Entrepreneurial 2,
Learning 1 and Creativity 3, Systems 1 and People 2, Projects 2 and Projects 3, and Enterprise 2
and Enterprise 3 (Table 46). The model demonstrated an acceptable model fit, χ2 = 21,984.960,
df = 614, CFI = 0. 919, AGFI = 0. 996, SRMR = 0. 032, RMSEA = 0. 060 (0. 060; 0. 060), and
each of these values met acceptable thresholds. Each of the standardized factor loadings
exceeded 0.60 (Hair et al., 2010) (Figure 15), but the AVE values for each of the six factors
(AVEValues = 0.507, AVEBehaviors = 0.566, AVEResources = 0.573, AVESuccess = 0.533, and
AVEClimate = 0.640) did not exceed corresponding SIC values, although these relationships were
closer to thresholds than in previous analyses (Table 47). Standardized path coefficients ranged
from 0.608 to 0.869, where an increase of one unit in the latent factor of Values, for example,
would produce an increase of 0.703 on EP1. The amount of variance explained for each item
ranged from R2 = 0.370 to 0.756 (Table 48). High structure coefficients for each of the three
latent factors, which ranged from 0.458 to 0.796 (Table 48), corroborated multiple indirect
relationships across the factors (Graham, Guthrie, & Thompson, 2003) and again failed to
provide evidence for discrimination among factors.
Table 46 CFA Results for Culture of Innovation (Alternate) Model χ2 df CFI AGFI RMSEA RMSEA CI90 SRMR 5 factor, 41 variables 36,871.422* 769 0.880 0.994 0.069 (0.069; 0.070) 0.037 5 factor, 37 variables 29,024.467* 619 0.893 0.995 0.068 (0.068; 0.069) 0.035 5 factor, 37 variables, corr errors 21,984.960* 614 0.919 0.996 0.060 (0.060; 0.060) 0.032 Note. *p < .001. χ2=Satorra-Bentler (1988) scaled chi-square; CFI = comparative fit index; AGFI = adjusted goodness of fit index; RMSEA = root mean-square error of approximation; SRMR = standardized root mean square.

107
Table 47 Intra-construct Correlations, SIC, AVE, and CR Values Behaviors Resources Success Climate AVE CR Values 1.000 0.585 0.672 0.650 0.569 0.507 0.891 Behaviors 0.765 1.000 0.832 0.726 0.659 0.566 0.887 Resources 0.820 0.912 1.000 0.865 0.745 0.573 Success 0.806 0.852 0.930 1.000 0.889 0.533 0.872 Climate 0.754 0.812 0.863 0.943 1.000 0.640 0.842 Note: Values below the diagonal are estimates of intra-construct correlations, and values above the diagonal are squared intra-construct correlations (SIC).

108
Figure 15. Standardized solution for culture of innovation (alternate model)

109
Table 48 Factor Loadings and Structure Coefficients for Culture of Innovation (Alternate)
Item
UC
EV
SC
Structure Coefficients Values Behaviors Resources
Success
Climate
R2
EP1 1.086 (0.015) 0.505 (0.013) 0.703 . 0.538 0.576 0.567 0.530 0.495 EP2 1.058 (0.015) 0.530 (0.014) 0.685 . 0.524 0.562 0.552 0.516 0.470 EP3 0.939 (0.015) 0.630 (0.014) 0.608 . 0.465 0.499 0.490 0.458 0.370 Cre1 1.226 (0.015) 0.369 (0.013) 0.794 . 0.607 0.651 0.640 0.599 0.631 Cre3 1.000 0.580 (0.014) 0.648 . 0.496 0.531 0.522 0.489 0.420 Lea1 1.066 (0.013) 0.523 (0.013) 0.690 . 0.528 0.566 0.556 0.520 0.477 Lea2 1.270 (0.015) 0.323 (0.013) 0.823 . 0.630 0.675 0.663 0.621 0.677 Lea3 1.113 (0.013) 0.480 (0.013) 0.721 . 0.552 0.591 0.581 0.544 0.520
Eng3 0.977 (0.009) 0.469 (0.013) 0.729 0.558 . 0.693 0.661 0.636 0.531 Ene1 1.000 0.444 (0.013) 0.746 0.571 . 0.709 0.677 0.651 0.556 Ene2 1.061 (0.008) 0.374 (0.012) 0.791 0.605 . 0.751 0.717 0.691 0.626 Ene3 1.077 (0.009) 0.355 (0.012) 0.803 0.614 . 0.763 0.728 0.701 0.645 Ena1 0.944 (0.010) 0.504 (0.013) 0.704 0.539 . 0.669 0.639 0.615 0.496 Ena2 0.989 (0.009) 0.456 (0.013) 0.738 0.565 . 0.701 0.669 0.644 0.544
Peo2 1.017 (0.006) 0.375 (0.012) 0.791 0.649 0.751 . 0.732 0.701 0.625 Sys1 0.985 (0.006) 0.412 (0.012) 0.767 0.629 0.729 . 0.709 0.680 0.588 Sys2 1.053 (0.006) 0.329 (0.012) 0.819 0.672 0.778 . 0.758 0.726 0.671 Pro1 0.970 (0.007) 0.430 (0.012) 0.755 0.619 0.717 . 0.698 0.669 0.570 Pro2 0.966 (0.006) 0.435 (0.012) 0.752 0.617 0.714 . 0.696 0.666 0.565 Pro3 1.000 0.395 (0.012) 0.778 0.638 0.739 . 0.720 0.689 0.605 Eng2 0.962 (0.006) 0.440 (0.012) 0.748 0.613 0.711 . 0.692 0.663 0.560 Col1 0.921 (0.007) 0.487 (0.013) 0.716 0.587 0.680 . 0.662 0.634 0.513 Sim3 0.973 (0.007) 0.427 (0.012) 0.757 0.621 0.719 . 0.700 0.671 0.573 Ide3 0.905 (0.008) 0.504 (0.013) 0.704 0.577 0.669 . 0.651 0.624 0.496 Cap1 0.935 (0.007) 0.470 (0.012) 0.728 0.597 0.692 . 0.673 0.645 0.530 Cap3 0.986 (0.007) 0.412 (0.012) 0.767 0.629 0.729 . 0.709 0.680 0.588 Sha1 0.999 (0.007) 0.396 (0.012) 0.777 0.637 0.738 . 0.719 0.688 0.604 Sha2 0.941 (0.007) 0.464 (0.012) 0.732 0.600 0.695 . 0.677 0.649 0.536
Ext1 1.210 (0.013) 0.404 (0.012) 0.772 0.622 0.700 0.714 . 0.707 0.596 Ext2 1.000 0.593 (0.013) 0.638 0.514 0.579 0.590 . 0.584 0.407 Ext3 1.201 (0.012) 0.413 (0.012) 0.766 0.617 0.695 0.709 . 0.702 0.587 Ent1 1.145 (0.013) 0.467 (0.013) 0.730 0.588 0.662 0.675 . 0.669 0.533 Ent2 1.129 (0.013) 0.481 (0.013) 0.720 0.580 0.653 0.666 . 0.660 0.519 Ent3 1.168 (0.013) 0.445 (0.013) 0.745 0.600 0.676 0.689 . 0.682 0.555
Col3 1.000 0.448 (0.013) 0.743 0.560 0.649 0.658 0.681 . 0.552 Saf1 1.170 (0.009) 0.244 (0.012) 0.869 0.655 0.759 0.770 0.796 . 0.756 Sim2 1.055 (0.009) 0.386 (0.013) 0.783 0.590 0.684 0.694 0.717 . 0.614
*p < .05; UC = unstandardized coefficients; EV = error variance; SC = standardized coefficients.

110
Reliability. While a lack of discriminant validity was identified, estimates of reliability,
as measured by coefficient alpha, were computed for the second half of the dataset (n2 = 9,921)
for each of the factors in the alternate model, and by countries, industries, employee levels,
functional roles, and the languages of instrument administration. Estimates were only computed
for groups that had a minimum sample size of 30. Tables 49 through 51 illustrate that all these
estimates exceeded Nunally’s (1978) recommended threshold of 0.70, with many of them higher
than 0.90 for the alternate model, surpassing the estimates identified by the original model and in
previous literature (e.g. Aiman-Smith et al., 2005; Anderson & West, 1998; Dobni, 2008;
Kuščer, 2013; Remneland-Wikhamn & Wikhamn, 2011; and Tohidi, Seyedaliakbar &
Mandegari, 2012).
Table 49 Factor Reliability Estimates and Estimates by Country Factor α 1 2 3 4 5 6 7 8 9 10 Values .894 .887 .886 .888 .872 .872 .866 .870 .868 .820 .861 Resources .944 .934 .946 .943 .930 .944 .956 .924 .950 .886 .969 Behaviors .949 .947 .947 .943 .927 .950 .949 .904 .950 .902 .929 Success .910 .900 .890 .924 .909 .927 .912 .878 .921 .881 .924 Climate .854 .837 .849 .846 .831 .833 .878 .809 .890 .761 .921
Note: α = alpha coefficient for n2 = 9,921, 1 = Spain, 2 = Chile, 3 = Colombia, 4 = United States, 5 = Panama, 6 = El Salvador, 7 = Portugal, 8 = Mexico, 9 = Germany, 10 = Scotland. Table 50 Factor Reliability Estimates by Industry Factor 1 2 3 4 5 6 7 8 9 10 Values .896 .911 .906 .889 .891 .881 .867 .861 .846 .863 Resources .953 .957 .939 .949 .930 .924 .928 .932 .919 .932 Behaviors .952 .959 .952 .945 .952 .941 .918 .937 .925 .937 Success .929 .914 .915 .908 .903 .890 .835 .921 .866 .853 Climate .871 .875 .852 .863 .825 .819 .822 .843 .788 .843 11 12 13 14 15 16 17 18 19 Values .890 .849 .857 .893 .870 .879 .878 .834 .779 Resources .918 .934 .922 .932 .929 .905 .930 .923 .888

111
Behaviors .942 .931 .933 .937 .931 .942 .940 .942 .936 Success .910 .896 .898 .851 .875 .831 .913 .851 .892 Climate .797 .830 .833 .831 .842 .759 .844 .802 .801
Note: 1 = Financial and insurance, 2 = Telecommunications, 3 = Professional services, 4 = Industrial machinery and equipment, 5 = Health care and social services, 6 = Aerospace and defense, 7 = Food and beverages, 8 = Construction and building materials, 9 = Industrial metals and mining; 10 = Automobile and parts, 11 = Oil and chemicals, 12 = Energy – electricity and gas, 13 = IT – software and electronics, 14 = Retail, 15 = Education, 16 = Public and state administration; 17 = Transport and logistics, 18 = Pharmaceuticals, 19 = Biotechnology and research. Table 51 Estimates by Organizational Level, Functional Role, and Language Factor Staff Man Exec/Dir Ops Com Sup Oth R&D Span Eng Values .897 .892 .884 .894 .900 .894 .876 .884 .896 .874 Resources .949 .934 .939 .945 .946 .943 .939 .929 .945 .932 Behaviors .952 .946 .945 .951 .947 .951 .929 .947 .951 .925 Success .915 .901 .908 .910 .910 .918 .903 .891 .911 .904 Climate .864 .835 .842 .852 .860 .861 .834 .830 .856 .833
Note: Man = Manager, Exec/Dir = Executive or director, Ops = Operations, Com = Commercial, Sup = Support, Oth = Other, R&D = Research and development, Span = Spanish, Eng = English.

112
CHAPTER 5
DISCUSSION AND RECOMMENDATIONS
This chapter will summarize and discuss the findings yielded from the current
investigation, as well as offer recommendations and implications for future research and practice.
The first section will summarize and discuss the current findings and conclusions from this
present study. The next section will present recommendations for theory and practice, as well as
offer opportunities for improvement in the measurement and analysis of culture of innovation for
practitioners. The final section will analyze the impact of the study’s limitations and
delimitations on the findings, which may inform recommendations for future research.
Summary of Findings
The purpose of this study was to assess the construct validity and reliability of the
Innovation Quotient instrument (Rao & Weintraub, 2013). This study employed multiple data
analytic strategies to examine the hypothesized factor structure of each of the six measurement
models within the instrument by estimating model fit, inter-item relationships, evidence for
discriminant validity, and reliability across groups for each of the models. It was determined that
those six measurement models, though showing adequate fit using the first half of the dataset (n1
= 9,860) did not produce evidence for discriminant validity or consistently demonstrate
reliability for all organizational groups, and therefore additional measurement models were
explored. As it was expected that common method variance may have played a role within each
model, reducing factor discrimination, an integrated measurement model consisting of all 54
variables, was investigated, in which each of the previous six measurement models were
specified as six first-order factors within one global measure. Once it was determined that this
six-factor, integrated model also illustrated acceptable model fit but poor discrimination across
113
the factors, an alternate factor structure was investigated using exploratory factor analytic
procedures.
The exploratory factor analysis, conducted via cross-validation using the second half of
the dataset (n2 = 9,921), produced a five-factor model consisting of 41 variables, but was reduced
to 37 variables, with some item errors allowed to correlate. This short-form, so to speak, of the
Innovation Quotient instrument demonstrated acceptable model fit as well but still did not
discriminate across the five factors, as indicated by average variance extracted values falling
below the related factors’ squared interconstruct correlations. Therefore, it was concluded that
the alternate measurement model demonstrated evidence for convergent validity and reliability
for the organizational groups of countries, industries, employee levels, functional roles, and the
languages of instrument administration but did not produce evidence for discriminant validity.
Interconstruct correlations consistently produced values too high for appropriate factor
differences to be detected, which may threaten the validity of findings in future studies in which
relationships are investigated (Farrell, 2010; Lissitz & Samuelsen, 2007). An integration of the
findings of the original confirmatory factor analysis, coupled with the exploratory factor analysis
and validation on an independent dataset, provided preliminary evidence that the five-factor
model does fit the data. However, additional work is needed to validate and improve the
psychometric properties of the item inventory and final instrument.
Recommendations for Theory and Practice
Throughout each step of the current investigation, many surprising yet meaningful
findings were identified at the measurement, factor, and item levels that may have implications
for future theory and practice.
The measurement level. While few modern methodologists would advocate for the
analysis of goodness of fit indices alone as the sole evidence for assessment instrument validity,

114
the results of this present study illustrate quite emphatically that model fit should be
accompanied by other analytic strategies to validate instrumentation. A total of 32 confirmatory
factor analyses were conducted for this present study, with ten of them producing results that
were either non-positive definite or provided results for which errors could not be computed. Of
these 32 analyses, all but three demonstrated desirable goodness fit, as measured by a value of
greater than 0.9 for the CFI and greater than 0.95 for the AGFI, and the final three tests of the
integrated model of culture of innovation approached acceptable fit with a minimum value of
CFI of 0.891 (Table 35). Each of the analyses also demonstrated RMSEA values with an upper
bound confidence interval that did not exceed 1.0. However, none of the 32 models produced
evidence for discriminant validity. The only minor exception to this finding was the
discrimination between Ideate and Capture in the original model for Processes, in which the
AVE for Ideate (AVE = 0.672, CR = 0.860) exceeded the squared interfactor correlation between
Ideate and Capture (SICIdeate,Capture = 0.615) (Table 24). Of considerable note is the finding that an
alternative factor model of culture of innovation better fit the data than the original model, which
was due to the elimination of items with content issues, or the respecification of items due to
better alignment to reference point, such as People 1 loading better onto Behaviors than
Resources. Even when a higher order factor was included in each of the original six models as a
way to control for the lack of factor discrimination, model fit was not improved or reduced,
rendering the exact nature of the relationships for each model unclear.
Lehmann’s (1975) list of limitations of interpreting goodness of fit measures – including
imperfect model operationalization, measurement model mis-specification, spurious correlations,
stochastic influences, and measurement/scale problems – certainly were exemplified in this
present study. Lehmann’s (1975, p. 741) observation that “when such consistency bias is present,

115
the goodness of fit measures among the affected variables are artificially increased” is one
plausible explanation for why goodness of fit indices were identified regardless of the fact that
factorial discrimination was not, a finding echoed by Hayduk (2014), who also offered that “a
research commitment to understanding the world’s causal structure, combined with clear
examples of factor mismodeling should spur diagnostic assessment of significant factor model
failures” (p. 905). This result carries significant implications for a better understanding of the
latent factor and its subsequent effects, which can be used to find a model that better illustrates
the cause and effect relationships that facilitate innovation.
The factor level. In order to identify an alternate factor structure, an exploratory factor
analysis was conducted, which produced a five-factor solution. It was identified that while five
factors were extracted due to the results of the Minimum Average Partial (MAP) test, one of
those five explained a cumulative 50.09% of the total variance extracted (Table 40). While it is
certainly important to consider the extent to which this high amount of variance explained was
due to an unknown common factor, as Harman’s (Podsakoff, MacKenzie, Lee, & Podsakoff,
2003) test may have indicated, additional structures produced by the pattern matrix (Table 40)
may also shed light on this critical factor. There were a total of 15 items that were retained in the
model that loaded moderately onto that factor, which most closely resembled the original
Resources and Processes factors, which the EFA collapsed. In particular there were seven items
that loaded on the factor greater than 0.5, which included the following – People 2, “We have
access to innovation experts who can support our projects”; Systems 1, “We have the right
recruiting and hiring systems in place to support a culture of innovation”; Systems 2, “We have
good collaboration tools to support our innovation efforts”; Projects 1, “We give people
dedicated time to pursue new opportunities”; Projects 2, “We have dedicated finances to pursue

116
new opportunities”; Projects 3, “We have dedicated physical and/or virtual space to pursue new
opportunities”; and Capture 3, “We rapidly allocate resources to scale initiatives that show
market promise”. While common method issues may have confounded the weights of these items
to that first factor, an evaluation of the structure matrix indicated that these seven items had the
highest relationships to the first factor, regardless of whether it is a common method factor, at r =
.703, .713, .766, .739, .721, .749, and .742, respectively. This finding was corroborated in the
CFA using the second dataset, where high standardized factor loadings (>0.7) for each of these
items were identified for its latent factor. Therefore, the theme and/or pattern across the content
of each of these items – that they each relate to the resources an organization should have in
place to make innovation possible – explain high levels of variance that may be a useful finding
to practitioners interested in identifying key actions they may take to create a culture of
innovation.
The consideration of the resources that facilitate innovativeness – the innovation experts,
recruiting and hiring systems, collaboration tools, dedicated finances, dedicated time to pursue
opportunities, and the physical and virtual space – has surfaced in the innovation literature in
general (i.e. Google’s ‘20% time’; Gersch, 2013), but has yet to be included in many of the most
heavily cited instruments that measure a culture of innovation (Table 4). Constructs such as
support for innovation (Aiman-Smith et al., 2005), implementation context (Dobni, 2008),
structure and process (Humphreys et al., 2005), forefront of technology (Susanj, 2000), the
external environment (Tohidi, Seyedaliakbar, & Mandegari, 2012), and related ideas have been
measured, but an opportunity exists to better identify the specific resources that are critical to the
success of innovative efforts and measure the extent to which those resources are present within
organizations.

117
A secondary observation that emerged is the nature of the high relationships among each
of the factors (Table 44) but particularly between Resources and Behaviors (rResources,Behaviors =
0.912), Resources and Success (rResources,Success = 0.930), and Success and Climate (rSuccess,Climate =
0.943), which each exceeded 0.9. Structure coefficients (Table 44) were high across all factors,
but were the highest among the items of Resources with the Behaviors factor, followed closely
by the Success factor, which has elsewhere been hypothesized to be an outcome of innovative
activities and behaviors (Rao & Chuan, 2013). Considering the relationship among these factors,
additional learning may be warranted for both practitioners and researchers to investigate how
specific leadership Behaviors are employed to remove obstacles and enable the allocation of
Resources to pursue innovative solutions, or how leadership Behaviors affect respondents’
perceptions of Success.
Item content level. The Innovation Quotient (Rao & Weintraub, 2013) instrument was
selected for this present study due to its user-friendliness and comprehensiveness in addressing
some of the key factors that contribute to a culture of innovation, as identified in the previous
literature (see Chapter Two). However, while these building blocks, or factors, were amply
supported by the literature, the items themselves had not been tested to identify the extent to
which they accurately measure these critical factors. Throughout each step in the current study,
any subtle issues with item content, such as items that were abstractly worded, double-barreled,
or required specialized knowledge available only to specific organizational levels (i.e. specific to
senior leaders or strategists), produced item level errors or cross-loadings that reduced overall
model fit or factor discrimination. Other items may not have loaded highly on any of the five
factors, which may have also contributed to some of the overall error in the model. Some of the
items that generated such noise are summarized in Table 39 or in the EFA portion of Chapter

118
Four. However, a brief review of the content of each of the 54 items in the inventory reveals
multiple content issues that future researchers or users of the instrument may wish to remedy
(Appendix C.3). Some of these remedies may include the following:
1. Clarify the object of the measurement or frame of reference: For many of the items in
the Innovation Quotient instrument, it is unclear what object is being measured by the
descriptors. For example, in Entrepreneurial 1’s “We have a burning desire to explore
opportunities and to create new things”, it is unclear to what unit the respondent must
associate the “we”, or by what frame of reference the participant must respond to the
descriptor – whether it be one’s own local team, the division, or the entire
organization. Likewise, in Energize 3 the participant must respond to “Our leaders
model the right innovation behaviors for others to follow”, but it is unclear whether
the participant is being asked to evaluate his or her own direct supervisor, division or
unit leader, or the senior most leaders of the organization. By providing reference
materials, such as a glossary, that clarify the terms included in the items, greater
accuracy could be ensured (Kasunic, 2005; Leung, 2001).
2. Clarify which items are best suited for each level of the organization and validate
those items with those audiences: While the instrument’s items demonstrated
appropriate levels of reliability across different organizational areas, levels, and
industries for n2, the inventory of items in the Innovation Quotient contained some
items that may be better suited for specific areas. A content analysis of many the
items that were removed from either the six-factor or the alternate five-factor models
demonstrated that many included content knowledge or expertise that only a few
people in the organization would know – specifically division or senior leaders. For

119
example, in External 3 or Systems 3, it is reasonable to expect that only leaders may
know the extent to which, “Our innovation efforts have led us to better financial
performance than others in our industry,” and “We are good at leveraging our
relationships with suppliers and vendors to pursue innovation,” but many front line
employees may not. Likewise in People 3, “We have the internal talent to succeed in
our innovation projects” may be an item to which certain human resources or senior
leader teams may confidently be able to respond. On the other side of the spectrum,
there are many items that would be useful for leaders to know how front line staff or
middle managers would respond, such as to Creativity 2, “Our workplace provides us
the freedom to pursue new opportunities”, or any of the items that evaluate “our
leaders” as a source of leadership and action toward innovation. Therefore, future
researchers may choose to investigate the development of level-specific tools that can
assess those factors that contribute to innovation at the relevant level of the
organization, which may be useful to practitioners and leaders who seek to measure
and evaluate this construct within their organizations (Kasunic, 2005).
3. Clarify the key content for each factor and vary the question stems to tap those
factors: It was determined in the current investigation that common method variance
was present across the entire instrument, with a total of 50.12% variance explained
for all 54 items, and greater than 50% variance explained within each of the six
original, hypothesized factors (Table 12). A review of the item content in both the
Spanish and English languages demonstrates that a majority of the items begin with
similar language – “we” and “our leaders” in English and various forms of the
“nosotros” and “nuestros líderes” in Spanish. By identifying the key nugget of the

120
item, and varying the language to address it, respondents may be forced to mentally
reload each item anew, reducing cognitive load and improving accuracy (Kasunic,
2005).
Limitations, Delimitations, and Recommendations for Future Research
The current investigation’s limitations and delimitations may limit the generalizability of
the findings, many of which can be monitored and addressed in future research.
Limitations
There were two key limitations identified in Chapter 1 that may have affected the
generalizability of the results. The first limitation was the consideration and use of a newly-
developed instrument that was based on evidence that factors of a culture of innovation relate
with each other and predict innovation in organizations. However, the instrument had yet to be
validated beyond its initial use by the author. The second limitation was the use of cross-
sectional survey administration for each of the 54 items on the instrument. These limitations
certainly manifested themselves in the final results, where each of the six original measurement
models failed to produce evidence for divergent validity due to high squared inter-factor
correlations, some of which were possibly due to the common method variance identified in the
model (Tables 15, 18, 21, 24, 27, and 30).
Common method bias. Common method designs can threaten the accuracy of the findings
by presenting the inconsistency in reference points, model error in observer effects, hide the
sensitivity of the construct, dispositional characteristics, or situational characteristics (Donaldson
& Grant-Vallone, 2002). Sources of common method biases in survey instruments may include
common rater effects (consistently motifs, social desirability, leniency biases, acquiescence,
mood states), item characteristic effects (item social desirability, item demand and ambiguity,
common scales, and positive and negatively worded items), item context effects (item printing

121
effects, item embeddedness, context-induced mood, scale length, and grouping of items on the
questionnaire), and measurement context effects (predictor and criterion variables measured at
the same point, location, and medium) (Podsakoff, MacKenzie, Lee, & Podsakoff, 2003).
Researchers who have studied common method variance have articulated its effects on
inter-item relationships, and have made recommendations for how to reduce those effects on the
validity of findings, which include both instrument design methods and statistical controls
(Lindell & Whitney, 2001; Meade, Watson, & Kroustalis, 2007; Podsakoff, MacKenzie, Lee, &
Podsakoff, 2003). While some design methods proposed by Lindell and Whitney (2001) would
not apply to this present study (such as reverse coding to address acquiescence, or reducing items
to address boredom or fatigue), other recommendations could be applied, such as the reduction
of items with similar wording or stems, or the inclusion of a marker variable intended to detect
relationships to theoretically irrelevant behaviors. To this list Podsakoff, MacKenzie, Lee, and
Podsakoff (2003) add the procedural remedies of collecting data from different sources,
separating the predictors and criterion variables, protecting anonymity and reduce apprehension,
counterbalancing the question order, and improving the wording of the scale items, such as
removing double-barreled language, avoiding vague concepts, keeping questions simple, and
defining terms. Also, Little & Rhemtulla (2013) recommended the use of planned missing data
using multiform designs to reduce the cost of administration, participant fatigue, and therefore
increase instrument validity and statistical power. When such better practices cannot be
established, statistical controls can be put in place to alleviate the issues produced by common
methods. These statistical controls include the following: 1) the use of Harman’s (Podsakoff,
MacKenzie, Lee, & Podsakoff, 2003) single factor test to evaluate if common method variance is
present within the model; 2) conducting partial correlation procedures to control for biases; 3)

122
controlling for the effects of a directly measured latent methods factor by allowing items to load
on their theoretical constructs in addition to a common latent factor; 4) controlling for the effects
of an unmeasured latent methods factor by allowing items to load on their theoretical constructs
in addition to a common latent factor, and then interpreting the structural relationships with and
without the latent factor; and 5) using the multiple method factors, or a confirmatory factor
analysis of the MTMM model (Podsakoff, MacKenzie, Lee, & Podsakoff, 2003).
None of the instruments evaluated in the review of the literature and considered for this
study (Table 4) addressed common method variance. This present study attempted to correct for
such affects by testing for common method variance using Harman’s test, as well as including a
common latent factor within the model, which often produced nonpositive definite results. Future
researchers, however, may wish to employ both survey design remedies, as well as statistical
controls, to evaluate, reduce, and better interpret common method effects.
Delimitations
Multiple constraints, or delimitations, were placed upon the study. First, while multiple
measures of culture of innovation have surfaced in the literature, this study employed the
Innovation Quotient (2013) instrument due its alignment with the literature in organizational
culture, its comprehensiveness in integrating the scope of literature in the field of innovation, and
its accessibility and user-friendliness to a wide audience of varying educational backgrounds and
abilities. While the comprehensive nature of the instrument was one of the key criteria used to
identify the instrument, it also became apparent through the assessment of model fit that
comprehensiveness also increased the inclusion of measurement error into the model, which in
turn negatively affected discriminant validity.

123
Discriminant validity. Discriminant validity is evident when a set of variables that
theoretically measure different constructs indeed present intercorrelations that are not too high
(Kline, 2011). According to Farrell and Rudd (2009), “if discriminant validity is not established,
then conclusions made regarding relationships between constructs under investigation may be
incorrect. For example, the strength of a relationship could be overestimated, or a relationship
may be confirmed when in fact there is no real relationship” (p. 6). When issues with
discriminant validity persist – or when squared inter-construct correlations (SIC) among factors
exceed the average variance extracted (AVE) of the respective individual factors – remedies
should be applied to increase evidence for the discriminant validity (Fornell & Larcker, 1981).
Some of these remedies might include increasing the AVE through deletion of items with high
error variances, creating item subsets if theory warrants, and using the multitrait multimethod
matrix if mixed method designs are possible (Fornell & Larcker, 1981).
As future researchers will wish to examine the structural relationships among relevant
factors that contribute to a culture of innovation, or those factors themselves, discriminant
validity must be examined to ensure conclusions from those findings can reasonably be made.
Future researchers also may wish to reduce factor cross loading by reducing the total number of
items to measure the key constructs, balancing comprehensiveness with parsimony.
The second delimitation placed upon the investigation was the use of secondary data to
evaluate the key research question, where multiple best practices in survey administration
(discussed in Chapter 1) were not guaranteed. One of these issues that may have threatened the
results was the aggregation of data across multiple organizational groups, and particularly across
the administration languages of both Spanish and English. For this present study, the data used to
assess the measurement models were pooled because practitioners typically analyze performance
124
in aggregate, but reliability estimates across many groups indicated inconsistencies of item-
relatedness for n1. Inconsistency as a threat to validity has already been identified by previous
researchers, who noted differences in the factors of a culture of innovation, as well as the items
used to measure those factors, among groups such as industries, countries, employee levels, and
functional roles (e.g. Aiman-Smith et al., 2005; Birken et al., 2013; Çakar & Ertürk, 2010;
Kaufman, Tsangar, & Vrontis, 2012; Kuščer , 2013; Hoffman, 1999; Kesting & Parm Ulhøi,
2010; Lee, Chen, Tsui, & Yu, 2014; McAdam, Keogh, Reid, & Mitchell, 2007; Moosa &
Panurach, 2008; O'Connor, Roos, & Vickers-Willis, 2007; Sun, Wong, Zhao, & Yam, 2012;
Susanj, 2000). Therefore, a recommended next step for the current instrument and other related
instruments is to assess the property of measurement invariance.
Measurement invariance. As results from this investigation and previous findings
recommend that greater attention be paid to understanding performance within organizational
subcultures, an opportunity exists for researchers and organizational leaders to assess
measurement model fit across multiple groups. In order to ensure that the items can be
interpreted to mean the same thing to all groups of participants, the researcher or analyst who
collects and reports the results must ensure a few key prerequisites are met, such as use of same
scales, and controlling for item artifacts caused by item wording, ordering, and meaning – a
property known as measurement invariance (Eid & Rauber, 2000). To date, a literature search
using the terms culture of innovation AND measurement invariance produces few results and
demonstrated that previous researchers deploying instruments of culture of innovation have not
investigated measurement invariance.
The investigation of measurement invariance is to study the extent to which the factors
that constitute the construct(s) of interest in the investigation remain the same for each of the

125
groups for which it is intended to indicate performance. Vandenburg and Lance (2000) presented
some of the key considerations that guide the study of measurement invariance: 1) the extent to
which respondents from different cultures interpret a measure in a similar way; 2) the extent to
which rating sources define values similarly on identical dimensions; 3) the extent to which other
individual differences affect responses on an instrument; 4) or the extent to which the
intervention of measurement itself affects how a respondent rates over time. Such an assessment
of invariance has demonstrated its usefulness in organizational sciences, and can therefore aid in
the understanding of the meaning and interpretation of cultural measures, particularly measures
of perception, beliefs, or attitudes for culture of innovation (e.g., Alam, 2010; Nimon & Reio,
2011; Vandenberg & Lance, 2000; Wu, Li, & Zumbo, 2007). Once the design and deployment of
the current instrument is improved using best practices, and a fitting factor structure is identified,
future researchers may wish to test for measurement invariance for each of the demographic
variables or organizational groups for which additional comparisons might be made.
Conclusion
The purpose of this study was to assess the construct validity and reliability of the
Innovation Quotient instrument (Rao & Weintraub, 2013). Using a dataset obtained from the
instrument’s author, it was determined that the six original measurement models each
demonstrated adequate model fit, but did not produce desirable evidence for divergent validity
for each of the first-order factors within each of the six models, or consistent reliability for
multiple organizational groups. An integrated measurement model consisting of six factors
aligned to the theorized building blocks of a culture of innovation was also tested but also did not
discriminate well across these factors. Through a final exploratory factor analysis, an alternate
model was proposed, which identified a total of 37 items across five factors in alignment with
the previous blocks stated by Rao and Weintraub (2013) – Values, Behaviors, Resources,
126
Success, and Climate. This model was tested in an independent dataset using a final confirmatory
factor analysis, which demonstrated adequate model fit when correlating errors and reliability
across multiple organizational groups but did not discriminate among the five factors.
Some key implications for future theory were presented, which included an increased
attention to the factors of Resources and Behaviors as key constructs in measuring culture of
innovation, and the identification of the individual items that better operationalize each of the
key factors of innovation culture to improve factor discrimination. Key implications for
practitioners who deploy a measure of culture of innovation in their organizations included
greater clarification of the object of measurement, use of alternative short forms that vary by
organizational level or role in the organization, and other administration methods to reduce
common method variance, such as the use of item randomization, planned missing data, and
avoiding abstract or double-barreled items. Additional opportunities for additional research
included the identification of fewer items that measure the key constructs as a way to increase
factor discrimination, identification of an alternate model to increase model fit and reliability
while avoiding multicollinearity, and testing for measurement invariance across organizational
groups among which practitioners may wish to compare item and factor level performance. This
study contributes to the body of knowledge regarding the measurement of a culture of
innovation, and exemplifies the importance of adherences to best practice in instrument design,
deployment, and analysis.

127
APPENDIX A
PERMISSIONS

128
Appendix A.1: Permission to use Innovation Quotient Instrument

129
Appendix A.2: Permission to use Dataset

130

131

132
APPENDIX B
IRB DOCUMENTS
133
B.1 IRB Certificate of Completion
B.2 IRB Letter of Approval

134
APPENDIX C
INSTRUMENTATION
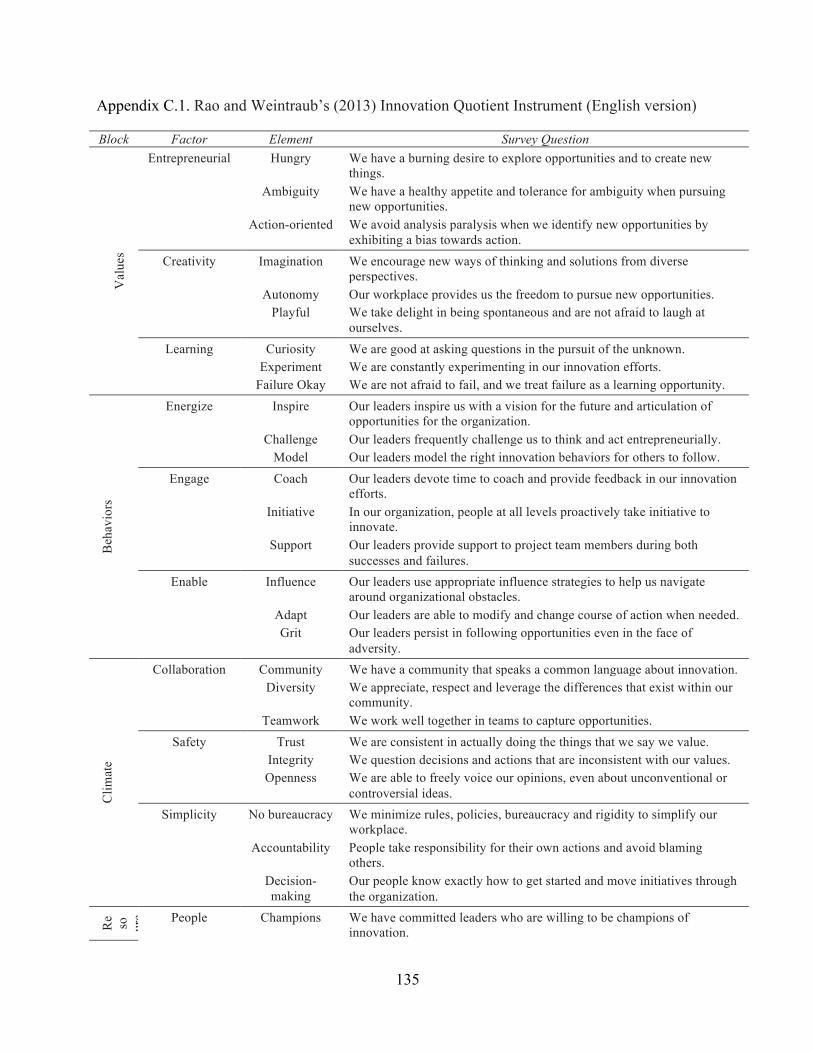
135
Appendix C.1. Rao and Weintraub’s (2013) Innovation Quotient Instrument (English version)
Block Factor Element Survey Question V
alue
s
Entrepreneurial Hungry We have a burning desire to explore opportunities and to create new things.
Ambiguity We have a healthy appetite and tolerance for ambiguity when pursuing new opportunities.
Action-oriented We avoid analysis paralysis when we identify new opportunities by exhibiting a bias towards action.
Creativity Imagination We encourage new ways of thinking and solutions from diverse perspectives.
Autonomy Our workplace provides us the freedom to pursue new opportunities. Playful We take delight in being spontaneous and are not afraid to laugh at
ourselves. Learning Curiosity We are good at asking questions in the pursuit of the unknown.
Experiment We are constantly experimenting in our innovation efforts. Failure Okay We are not afraid to fail, and we treat failure as a learning opportunity.
Beh
avio
rs
Energize Inspire Our leaders inspire us with a vision for the future and articulation of opportunities for the organization.
Challenge Our leaders frequently challenge us to think and act entrepreneurially. Model Our leaders model the right innovation behaviors for others to follow.
Engage Coach Our leaders devote time to coach and provide feedback in our innovation efforts.
Initiative In our organization, people at all levels proactively take initiative to innovate.
Support Our leaders provide support to project team members during both successes and failures.
Enable Influence Our leaders use appropriate influence strategies to help us navigate around organizational obstacles.
Adapt Our leaders are able to modify and change course of action when needed. Grit Our leaders persist in following opportunities even in the face of
adversity.
Clim
ate
Collaboration Community We have a community that speaks a common language about innovation. Diversity We appreciate, respect and leverage the differences that exist within our
community. Teamwork We work well together in teams to capture opportunities.
Safety Trust We are consistent in actually doing the things that we say we value. Integrity We question decisions and actions that are inconsistent with our values. Openness We are able to freely voice our opinions, even about unconventional or
controversial ideas. Simplicity No bureaucracy We minimize rules, policies, bureaucracy and rigidity to simplify our
workplace. Accountability People take responsibility for their own actions and avoid blaming
others. Decision-making
Our people know exactly how to get started and move initiatives through the organization.
Re so urc es People Champions We have committed leaders who are willing to be champions of
innovation.

136
Experts We have access to innovation experts who can support our projects. Talent We have the internal talent to succeed in our innovation projects.
Systems Selection We have the right recruiting and hiring systems in place to support a culture of innovation.
Communication We have good collaboration tools to support our innovation efforts. Ecosystem We are good at leveraging our relationships with suppliers and vendors
to pursue innovation. Projects Time We give people dedicated time to pursue new opportunities.
Money We have dedicated finances to pursue new opportunities. Space We have dedicated physical and/or virtual space to pursue new
opportunities.
Proc
esse
s
Ideate Generate We systematically generate ideas from a vast and diverse set of sources. Filter We methodically filter and refine ideas to identify the most promising
opportunities. Prioritize We select opportunities based on a clearly articulated risk portfolio.
Shape Prototype We move promising opportunities quickly into prototyping. Iterate We have effective feedback loops between our organization and the
voice of the customer. Fail Smart We quickly stop projects based on predefined failure criteria.
Capture Flexibility Our processes are tailored to be flexible and context-based rather than control- and bureaucracy-based.
Launch We quickly go to market with the most promising opportunities. Scale We rapidly allocate resources to scale initiatives that show market
promise.
Succ
ess
External Customers Our customers think of us as an innovative organization. Competitors Our innovation performance is much better than other firms in our
industry. Financial Our innovation efforts have led us to better financial performance than
others in our industry. Enterprise Purpose We treat innovation as a long-term strategy rather than a short-term fix.
Discipline We have a deliberate, comprehensive and disciplined approach to innovation.
Capabilities Our innovation projects have helped our organization develop new capabilities that we did not have three years ago.
Individual Satisfaction I am satisfied with my level of participation in our innovation initiatives. Growth We deliberately stretch and build our people’s competencies by their
participation in new initiatives. Reward We reward people for participating in potentially risky opportunities,
irrespective of the outcome.

137
Appendix C.2. Rao and Weintraub’s (2013) Innovation Quotient Instrument (Spanish version)
Block Factor Element Survey Question V
alor
es
Emprendimiento Apetito Tenemos un ferviente deseo por explorar oportunidades y crear cosas nuevas.
Abigüedad Tenemos un saludable apetito y somos tolerantes a la ambigüedad cuando buscamos nuevas oportunidades.
Acción Evitamos el análisis paralizante cuando identificamos nuevas oportunidades mostrando una orientación a la acción.
Creatividad Imaginación Estimulamos nuevas soluciones y formas de pensar desde diferentes perspectivas.
Autonomía Nuestro lugar de trabajo nos ofrece la libertad para buscar nuevas oportunidades.
Entretenido Nos encanta ser espontáneos y no tenemos miedo a reirnos de nosotros mismos.
Aprendizaje Curiosidad Somos buenos formulando preguntas en la búsqueda de lo desconocido.
Experimentación Estamos constantemente experimentando en nuestros esfuerzos de innovación.
Fracaso No tenemos miedo a fracasar y lo consideramos como oportunidad de aprendizaje.
Com
porta
mie
ntos
Energizar Inspirar Nuestros líderes nos inspiran con una visión de futuro y la articulación de oportunidades para la organización.
Desafiar Frecuentemente nuestros líderes nos desafían a pensar y actuar como emprendedores.
Modelar Nuestros líderes modelan el comportamiento innovador correcto para que otros lo imiten.
Participar Iniciativa En nustra organización, la gente de todos los nivelestoma la iniciativa para innovar.
Entrenador Nuestros líderes dedican tiempo a entrenar y proporcionar retroalimentacion oportuna en nuestros esfuerzos de innovación.
Soporte Los líderes proporcionan soporte a los miembros de los equipos de proyecto tanto en los éxitos como en los fracasos.
Habilitar Influenciar Nuestros líderes usan estratégias de influencia apropiadas para ayudarnos a navegar entre los obstaculos organizacionales.
Adaptar Nuestros líderes son capaces de modificar y cambiar el curso de acción cuando es necesario.
Aguantar Nuestros líderes persisten en seguir las oportunidades aún al enfrentar la adversidad.
Clim
a
Colaboración Comunidad Tenemos una comunidad que habla un lenguaje común acerca de innovación.
Diversidad Valoramos, respetamos y apreciamos las diferencias que existen al interior de nuestra comunidad.
Trabajo en equipo Trabajamos bien en equipo para capturar oportunidades. Seguridad Confianza Somos consistentes en hacer las cosas que decimos que tienen valor.
Integridad Cuestionamos las decisiones y acciones que no son consistentes con nuestros valores.
Apertura Somos capaces de expresar libremente nuestras opiniones aún cuando sean ideas no convencionales o controvertidas.
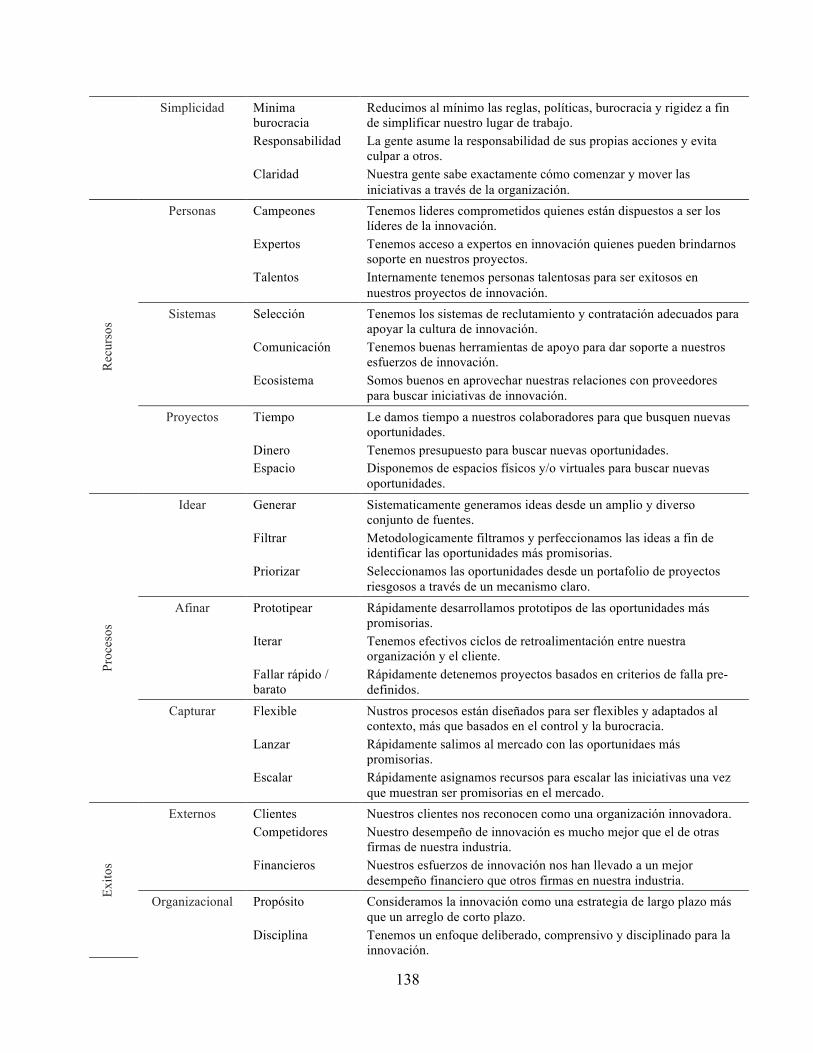
138
Simplicidad Minima burocracia
Reducimos al mínimo las reglas, políticas, burocracia y rigidez a fin de simplificar nuestro lugar de trabajo.
Responsabilidad La gente asume la responsabilidad de sus propias acciones y evita culpar a otros.
Claridad Nuestra gente sabe exactamente cómo comenzar y mover las iniciativas a través de la organización.
Rec
urso
s
Personas Campeones Tenemos lideres comprometidos quienes están dispuestos a ser los líderes de la innovación.
Expertos Tenemos acceso a expertos en innovación quienes pueden brindarnos soporte en nuestros proyectos.
Talentos Internamente tenemos personas talentosas para ser exitosos en nuestros proyectos de innovación.
Sistemas Selección Tenemos los sistemas de reclutamiento y contratación adecuados para apoyar la cultura de innovación.
Comunicación Tenemos buenas herramientas de apoyo para dar soporte a nuestros esfuerzos de innovación.
Ecosistema Somos buenos en aprovechar nuestras relaciones con proveedores para buscar iniciativas de innovación.
Proyectos Tiempo Le damos tiempo a nuestros colaboradores para que busquen nuevas oportunidades.
Dinero Tenemos presupuesto para buscar nuevas oportunidades. Espacio Disponemos de espacios físicos y/o virtuales para buscar nuevas
oportunidades.
Proc
esos
Idear Generar Sistematicamente generamos ideas desde un amplio y diverso conjunto de fuentes.
Filtrar Metodologicamente filtramos y perfeccionamos las ideas a fin de identificar las oportunidades más promisorias.
Priorizar Seleccionamos las oportunidades desde un portafolio de proyectos riesgosos a través de un mecanismo claro.
Afinar Prototipear Rápidamente desarrollamos prototipos de las oportunidades más promisorias.
Iterar Tenemos efectivos ciclos de retroalimentación entre nuestra organización y el cliente.
Fallar rápido / barato
Rápidamente detenemos proyectos basados en criterios de falla pre-definidos.
Capturar Flexible Nustros procesos están diseñados para ser flexibles y adaptados al contexto, más que basados en el control y la burocracia.
Lanzar Rápidamente salimos al mercado con las oportunidaes más promisorias.
Escalar Rápidamente asignamos recursos para escalar las iniciativas una vez que muestran ser promisorias en el mercado.
Exito
s
Externos Clientes Nuestros clientes nos reconocen como una organización innovadora. Competidores Nuestro desempeño de innovación es mucho mejor que el de otras
firmas de nuestra industria. Financieros Nuestros esfuerzos de innovación nos han llevado a un mejor
desempeño financiero que otros firmas en nuestra industria. Organizacional Propósito Consideramos la innovación como una estrategia de largo plazo más
que un arreglo de corto plazo. Disciplina Tenemos un enfoque deliberado, comprensivo y disciplinado para la
innovación.

139
Capacidades Nuestros proyectos de innovación han ayudado a nuestra organización a desarrollar nuevas capacidades que no teníamos hace tres años.
Individual Satisfacción Estoy satisfecho con mi nivel de participación en nuestras iniciativas de innovacion.
Crecimiento Deliberadamente forzamos y desarrollamos las competencias de nuestra gente a través de su participación en nuevas iniciativas.
Recompensa Recompensamos a la gente por su participación en oportunidades potencialmente riesgosas, independiente del resultado.

140
Appendix C.3. Content Analysis of Rao and Weintraub’s (2013) Innovation Quotient Instrument
Item Item Object Level Double Abstract Phrase
EP1 We have a burning desire to explore opportunities and to create new things. Unclear All x We
EP2 We have a healthy appetite and tolerance for ambiguity when pursuing new opportunities. Unclear Leaders x x We
EP3 We avoid analysis paralysis when we identify new opportunities by exhibiting a bias towards action. Unclear All x x We
Cre1 We encourage new ways of thinking and solutions from diverse perspectives. Unclear All x We
Cre2 Our workplace provides us the freedom to pursue new opportunities. Org All
Cre3 We take delight in being spontaneous and are not afraid to laugh at ourselves. Unclear All x We
Lea1 We are good at asking questions in the pursuit of the unknown. Unclear All We
Lea2 We are constantly experimenting in our innovation efforts. Unclear All We
Lea3 We are not afraid to fail, and we treat failure as a learning opportunity. Unclear All x We
Ene1 Our leaders inspire us with a vision for the future and articulation of opportunities for the organization. Leaders Staff x x Our
leaders
Ene2 Our leaders frequently challenge us to think and act entrepreneurially. Leaders Staff x Our
leaders
Ene3 Our leaders model the right innovation behaviors for others to follow. Leaders Staff Our
leaders
Eng1 Our leaders devote time to coach and provide feedback in our innovation efforts. Leaders Staff x x Our
leaders
Eng2 In our organization, people at all levels proactively take initiative to innovate. Org All Our
Eng3 Our leaders provide support to project team members during both successes and failures. Leaders Staff Our
Ena1 Our leaders use appropriate influence strategies to help us navigate around organizational obstacles. Leaders Staff x Our
leaders
Ena2 Our leaders are able to modify and change course of action when needed. Leaders Staff Our
leaders
Ena3 Our leaders persist in following opportunities even in the face of adversity. Leaders Staff Our
leaders
Col1 We have a community that speaks a common language about innovation. Comm All We
Col2 We appreciate, respect and leverage the differences that exist within our community. Comm All x We
Col3 We work well together in teams to capture opportunities. Unclear All x We
Saf1 We are consistent in actually doing the things that we say we value. Unclear All We
Saf2 We question decisions and actions that are inconsistent with our values. Unclear All We
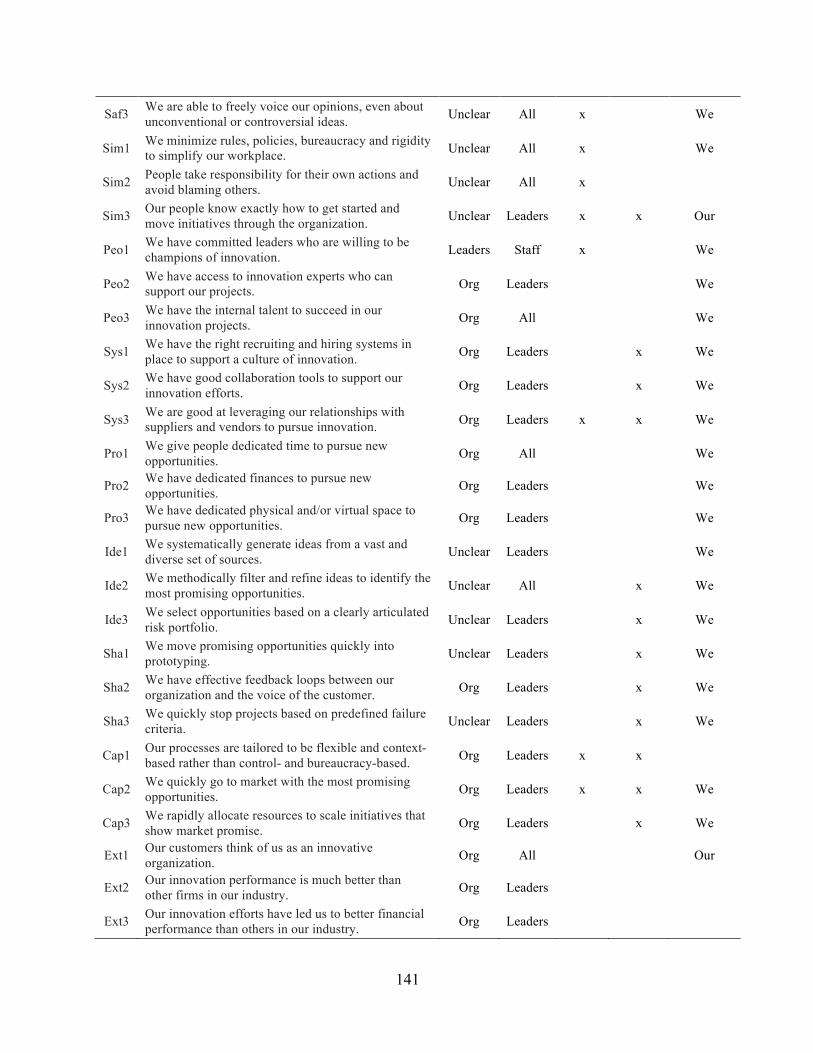
141
Saf3 We are able to freely voice our opinions, even about unconventional or controversial ideas. Unclear All x We
Sim1 We minimize rules, policies, bureaucracy and rigidity to simplify our workplace. Unclear All x We
Sim2 People take responsibility for their own actions and avoid blaming others. Unclear All x
Sim3 Our people know exactly how to get started and move initiatives through the organization. Unclear Leaders x x Our
Peo1 We have committed leaders who are willing to be champions of innovation. Leaders Staff x We
Peo2 We have access to innovation experts who can support our projects. Org Leaders We
Peo3 We have the internal talent to succeed in our innovation projects. Org All We
Sys1 We have the right recruiting and hiring systems in place to support a culture of innovation. Org Leaders x We
Sys2 We have good collaboration tools to support our innovation efforts. Org Leaders x We
Sys3 We are good at leveraging our relationships with suppliers and vendors to pursue innovation. Org Leaders x x We
Pro1 We give people dedicated time to pursue new opportunities. Org All We
Pro2 We have dedicated finances to pursue new opportunities. Org Leaders We
Pro3 We have dedicated physical and/or virtual space to pursue new opportunities. Org Leaders We
Ide1 We systematically generate ideas from a vast and diverse set of sources. Unclear Leaders We
Ide2 We methodically filter and refine ideas to identify the most promising opportunities. Unclear All x We
Ide3 We select opportunities based on a clearly articulated risk portfolio. Unclear Leaders x We
Sha1 We move promising opportunities quickly into prototyping. Unclear Leaders x We
Sha2 We have effective feedback loops between our organization and the voice of the customer. Org Leaders x We
Sha3 We quickly stop projects based on predefined failure criteria. Unclear Leaders x We
Cap1 Our processes are tailored to be flexible and context-based rather than control- and bureaucracy-based. Org Leaders x x
Cap2 We quickly go to market with the most promising opportunities. Org Leaders x x We
Cap3 We rapidly allocate resources to scale initiatives that show market promise. Org Leaders x We
Ext1 Our customers think of us as an innovative organization. Org All Our
Ext2 Our innovation performance is much better than other firms in our industry. Org Leaders
Ext3 Our innovation efforts have led us to better financial performance than others in our industry. Org Leaders
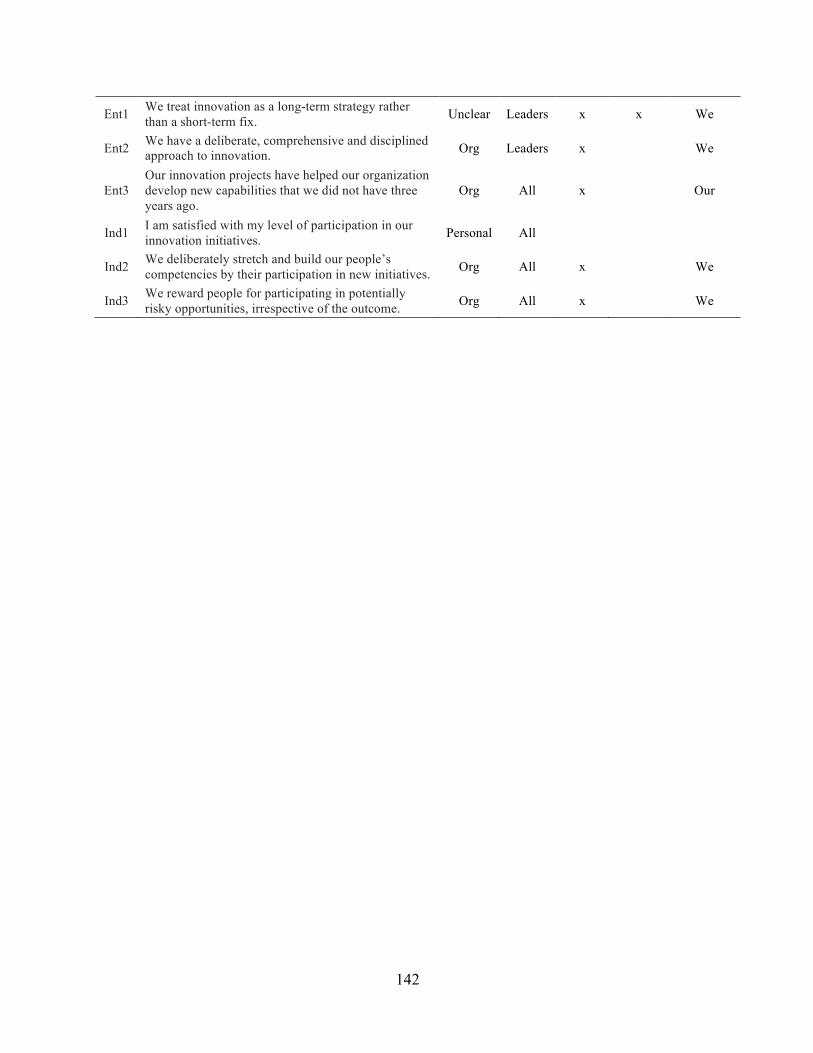
142
Ent1 We treat innovation as a long-term strategy rather than a short-term fix. Unclear Leaders x x We
Ent2 We have a deliberate, comprehensive and disciplined approach to innovation. Org Leaders x We
Ent3 Our innovation projects have helped our organization develop new capabilities that we did not have three years ago.
Org All x Our
Ind1 I am satisfied with my level of participation in our innovation initiatives. Personal All
Ind2 We deliberately stretch and build our people’s competencies by their participation in new initiatives. Org All x We
Ind3 We reward people for participating in potentially risky opportunities, irrespective of the outcome. Org All x We

143
References
Aiman-Smith, L., Goodrich, N., Roberts, D., & Scinta, J. (2005). Assessing your organization's
potential for value innovation. Research-Technology Management, 48(2), 37-42.
Alam, I. (2010). Does service innovation process differ across cultures? Asia Pacific Journal of
Marketing and Logistics, 22(4), 460-472. http://dx.doi.org/10.1108/13555851011090501
Allaire, Y., & Firsirotu, M. E. (1984). Theories of organizational culture. Organization
Studies, 5(3), 193-226. http://dx.doi.org/10.1177/017084068400500301
Anderson, N. R., & West, M. A. (1998). Measuring climate for work group innovation:
Development and validation of the team climate inventory. Journal of Organizational
Behavior, 19(3), 235-258. http://dx.doi.org/10.1002/(SICI)1099-
1379(199805)19:3%3C235::AID-JOB837%3E3.0.CO;2-C
Anthony, K. U. (2014). How leadership facilitates an innovative organizational culture and an
independent ethical climate: The role of being risk-taking and integrative. Paper
presented at International Conference on Global Trends in Academic Research. Bali,
Indonesia. Retrieved from
http://www.researchgate.net/profile/Anthony_Kuo/publication/272821848_How_Leaders
hip_Facilitates_an_Innovative_Organizational_Culture_and_an_Independent_Ethical_Cli
mate_The_Role_of_Being_Risk-
Taking_and_Integrative/links/54f01a860cf2432ba6582365.pdf
Bakovic, T., Lazibat, T., & Sutic, I. (2013). Radical innovation culture in Croatian
manufacturing industry. Journal of Enterprising Communities: People and Places in the
Global Economy, 7(1), 74-80.
Balsano, T. J., Goodrich, N. E., Lee, R. K., Miley, J. W., Morse, T. F., & Roberts, D. A. (2008).

144
Identify your innovation enablers and inhibitors. Research Technology Management,
51(6).
Baregheh, A., Rowley, J., & Sambrook, S. (2009). Towards a multidisciplinary definition of
innovation. Management Decision, 47(8), 1323-1339.
http://dx.doi.org/10.1108/00251740910984578
Bellot, J. (2011). Defining and assessing organizational culture. InNursing forum, 46(1), 29-37.
http://dx.doi.org/10.1111/j.1744-6198.2010.00207.x
Birken, S. A., Lee, S. Y. D., Weiner, B. J., Chin, M. H., & Schaefer, C. T. (2013). Improving the
effectiveness of health care innovation implementation: Middle managers as change
agents. Medical Care Research and Review, 70(1), 29-45.
http://dx.doi.org/10.1177/1077558712457427
Birken, S. A., Lee, S. Y., & Weiner, B. J. (2012). Uncovering middle managers’ role in
healthcare innovation implementation. Implement Science, 7(1), 28.
Brettel, M., & Cleven, N. J. (2011). Innovation culture, collaboration with external partners and
NPD performance. Creativity and Innovation Management, 20(4), 253-272.
http://dx.doi.org/10.1111/j.1467-8691.2011.00617.x
Brophey, G., & Brown, S. (2009). Innovation practices within small to medium-sized
mechanically-based manufacturers. Innovation: Management, Policy & Practice, 11(3),
327-340. http://dx.doi.org/10.5172/impp.11.3.327
Brown, T.A. (2006). Confirmatory factor analysis for applied research. New York: The Guilford
Press.
Byrne, B. M., Shavelson, R. J., & Muthén, B. (1989). Testing for the equivalence of factor

145
covariance and mean structures: The issue of partial measurement
invariance. Psychological bulletin, 105(3), 456. http://dx.doi.org/10.1037/0033-
2909.105.3.456
Çakar, N. D., & Ertürk, A. (2010). Comparing innovation capability of small and medium-
sized enterprises: Examining the effects of organizational culture and
empowerment. Journal of Small Business Management, 48(3), 325-359.
Chen, W. J. (2011). Innovation in hotel services: Culture and personality. International Journal
of Hospitality Management, 30(1), 64-72. http://dx.doi.org/10.1016/j.ijhm.2010.07.006
Christensen, C. M., Anthony, S. D., & Roth, E. A. (2004). Seeing what's next: Using the theories
of innovation to predict industry change. Boston, MA: Harvard Business Press.
Christensen, C.M, Grossman, J.H., & Hwang, J. (2009). The innovator’s prescription: A
disruptive solution for health care. New York, NY: McGraw-Hill.
Cole, R. E. (2002). From continuous improvement to continuous innovation. Total quality
management, 13(8), 1051-1056. http://dx.doi.org/10.1080/09544120200000001
Cooke, R. & Rousseau, D. (1988). Behavioral norms and expectations: A quantitative approach
to the assessment of organizational culture. Group and Organizational Studies, 13(3),
245-273. http://dx.doi.org/10.1177/105960118801300302
Costello, A. B. (2009). Getting the most from your analysis. Pan, 12(2), 131-146.
Costello, A. B., & Osborne, J. W. (2011). Best practices in exploratory factor analysis: four
recommendations for getting the most from your analysis. Practical Assessment in
Research and Evaluation 2005; 10. Retrieved from http://pareonline.net/pdf/v10n7.pdf
Creswell, J. W. (2013). Research design: Qualitative, quantitative, and mixed methods
approaches. Thousand Oaks, CA: Sage Publications, Inc.

146
Cronbach, L. J., & Meehl, P. E. (1955). Construct validity in psychological tests. Psychological
Bulletin, 52(4), 281. http://dx.doi.org/10.1037/h0040957
Crossan, M. M., & Apaydin, M. (2010). A multi-dimensional framework of organizational
innovation: A systematic review of the literature. Journal of management studies, 47(6),
1154-1191. http://dx.doi.org/10.1111/j.1467-6486.2009.00880.x
Curran, P. J., West, S. G., & Finch, J. F. (1996). The robustness of test statistics to nonnormality
and specification error in confirmatory factor analysis. Psychological Methods, 1(1), 16.
http://dx.doi.org/10.1037/1082-989X.1.1.16
Den Hertog, P., Van der Aa, W., & de Jong, M. W. (2010). Capabilities for managing service
innovation: Towards a conceptual framework. Journal of Service Management, 21(4),
490-514.
Denison, D. R. (1996). What is the difference between organizational culture and organizational
climate?: A native's point of view on a decade of paradigm wars. Academy of
management review, 21(3), 619-654. http://dx.doi.org/10.5465/AMR.1996.9702100310
Dobni, C. B. (2008). Measuring innovation culture in organizations: The development of a
generalized innovation culture construct using exploratory factor analysis. European
Journal of Innovation Management, 11(4), 539-559.
http://dx.doi.org/10.1108/14601060810911156
Donaldson, S. I., & Grant-Vallone, E. J. (2002). Understanding self-report bias in organizational
behavior research. Journal of Business and Psychology, 17(2), 245-260.
Dopson, S., Fitzgerald, L., & Ferlie, E. (2008). Understanding change and innovation in
healthcare settings: Reconceptualizing the active role of context. Journal of Change
Management, 8(3-4), 213-231. http://dx.doi.org/10.1080/14697010802133577

147
Dougherty, D., & Hardy, C. (1996). Sustained product innovation in large, mature organizations:
Overcoming innovation-to-organization problems. Academy of Management Journal,
39(5), 1120-1153. http://dx.doi.org/10.2307/256994
Dyer, J., Gregersen, H., & Christensen, C.M. (2011). The innovator’s DNA: Mastering the five
skills of disruptive innovators. Boston, MA: Harvard Business Review Press.
Eid, M., & Rauber, M. (2000). Detecting measurement invariance in organizational
surveys. European Journal of Psychological Assessment, 16(1), 20.
http://dx.doi.org/10.1027//1015-5759.16.1.20
Enzing, C. M., Batterink, M. H., Janszen, F. H., & Omta, S. O. (2011). Where innovation
processes make a difference in products' short-and long-term market success. British
Food Journal, 113(7), 812-837. http://dx.doi.org/10.1108/00070701111148379
Farrell, A. M. (2010). Insufficient discriminant validity: A comment on Bove, Pervan, Beatty,
and Shiu (2009). Journal of Business Research, 63(3), 324-327.
http://dx.doi.org/10.1016/j.jbusres.2009.05.003
Farrell, A. M., & Rudd, J. M. (2009). Factor analysis and discriminant validity: A brief review of
some practical issues. Anzmac. Retrieved from
http://andrewmfarrell.com/fr_anzmac_2009.pdf
Field, A. (2009). Discovering statistics using SPSS (3rd ed.). London, UK: Sage Publications.
Forero, C. G., Maydeu-Olivares, A., & Gallardo-Pujol, D. (2009). Factor analysis with ordinal
indicators: A Monte Carlo study comparing DWLS and ULS estimation. Structural
Equation Modeling, 16(4), 625-641. http://dx.doi.org/10.1080/10705510903203573
Fornell, C. & Larcker, D.F. (1981). Evaluating structural equation models with unobserved
variables and measurement error. Journal of Marketing Research, 18, 39-50.

148
Francis, D. L. (2000). Assessing and improving innovation capabilities in organizations.
(Doctoral thesis, Center for Research in Innovation Management. Brighton, University of
Brighton, UK).
Garrard, J. (2011). Health sciences literature review made easy: The matrix method. Sudbury,
MA: Jones & Bartlett.
George, M. L., Works, J., & Watson-Hemphill, K. (2005). Fast innovation: Achieving superior
differentiation, speed to market, and increased profitability. New York: McGraw-Hill.
Gersch, K. (2013, August 21). Google’s best new innovation: Rules around ‘20% time’. Forbes.
Retrieved from http://www.forbes.com/sites/johnkotter/2013/08/21/googles-best-new-
innovation-rules-around-20-time/
Goldberg, L. R., & Velicer, W. F. (2006). Principles of exploratory factor analysis. In S. Strack
(Ed.), Differentiating normal and abnormal personality: Second edition. New York, NY:
Springer. (pp. 209-237).
Goldstein, J. (2008). Complexity science applied to innovation: Theory meets praxis. The
Innovation Journal: The Public Sector Innovation Journal, 13(3), 1-16.
Graham, J. M., Guthrie, A. C., & Thompson, B. (2003). Consequences of not interpreting
structure coefficients in published CFA research: A reminder. Structural Equation
Modeling, 10(1), 142-153. http://dx.doi.org/10.1207/S15328007SEM1001_7
Grimm, L. G., & Yarnold, P. R., eds. (2000). Reading and understanding MORE multivariate
statistics. Washington, DC: American Psychological Association.
Hair, J. F. Black, W.C., Babin, B.J., & Anderson, R.E. (2010). Multivariate data analysis (7th
ed.). Upper Saddle River, NJ: Prentice Hall.
Hambrick, D. C. & Mason, P. A. (1984). Upper echelons: The organization as a reflection of its

149
top managers. Academy of Management Review, 9, 193–206.
http://dx.doi.org/10.5465/AMR.1984.4277628
Handy, C. B. (1996).Beyond certainty: The changing worlds of organizations. Boston, MA:
Harvard Business Press.
Harvard Business School (2014a). Forum on health care innovation. Retrieved from
http://forumonhealthcareinnovation.org/#about-the-forum-on-health-care-innovation
Harvard Business School (2014b). 5 imperatives: Addressing healthcare’s innovation challenge.
Retrieved from http://www.hbs.edu/healthcare/pdf/Forum-on-Healthcare-Innovation-5-
Imperatives.pdf
Hatch, M. J. (1993). The dynamics of organizational culture. The Academy of Management
Review,18(4), 657-693. http://dx.doi.org/10.5465/AMR.1993.9402210154
Hayduk, L. (2014). Seeing perfectly fitting factor models that are causally misspecified:
Understanding that close-fitting models can be worse. Educational and Psychological
Measurement, 74(6), 905-926. http://dx.doi.org/10.1177/0013164414527449
Henson, R. K., & Roberts, J. K. (2006). Use of exploratory factor analysis in published research
common errors and some comment on improved practice. Educational and Psychological
Measurement, 66(3), 393-416. http://dx.doi.org/10.1177/0013164405282485
Herrmann, A., Gassmann, O., & Eisert, U. (2007). An empirical study of the antecedents for
radical product innovations and capabilities for transformation. Journal of Engineering
and Technology Management, 24(1), 92-120.
http://dx.doi.org/10.1016/j.jengtecman.2007.01.006
Hoe, S.L. (2011). Measuring an organization’s innovation climate: A case study from Singapore.

150
Development and Learning in Organizations, 25(6), 13-15.
http://dx.doi.org/10.1108/14777281111173342
Hoffman, R. C. (1999). Organizational innovation: Management influence across
cultures. Multinational Business Review, 7, 37-49.
Hoffman, R. C., & Hegarty, W. H. (1993). Top management influence on innovations: Effects of
executive characteristics and social culture. Journal of management, 19(3), 549-574.
http://dx.doi.org/10.1177/014920639301900303
Hofstede, G. (1998). Attitudes, values and organizational culture: Disentangling the
concepts. Organization studies, 19(3), 477-493.
http://dx.doi.org/10.1177/017084069801900305
Hofstede, G., Neuijen, B., Ohayv, D. D., & Sanders, G. (1990). Measuring organizational
cultures: A qualitative and quantitative study across twenty cases. Administrative science
quarterly, 35(2), 286-316. http://dx.doi.org/10.2307/2393392
Huizingh, E. K. (2011). Open innovation: State of the art and future perspectives. Technovation,
31(1), 2-9. http://dx.doi.org/10.1016/j.technovation.2010.10.002
Humphreys, P., McAdam, R., & Leckey, J. (2005). Longitudinal evaluation of innovation
implementation in SMEs. European Journal of Innovation Management, 8(3), 283-304.
http://dx.doi.org/10.1108/14601060510610162
Hurley, R. F., & Hult, G. T. M. (1998). Innovation, market orientation, and organizational
learning: An integration and empirical examination. The Journal of Marketing, 42-54.
http://dx.doi.org/10.2307/1251742
IBM Corp. Released 2013. IBM SPSS Statistics for Windows, Version 22.0. Armonk, NY: IBM
Corp.

151
Kasunic, M. (2005). Designing an effective survey. Pittsburgh, PA: Carnegie-Mellon University
Software Engineering Inst.
Kaufman, H.R., Tsangar, H., & Vrontis, D. (2012). Innovativeness of European
SMEs: Mission not yet accomplished. Ekonomska istraživanja, 25(2), 333-360.
Kesting, P., & Parm Ulhøi, J. (2010). Employee-driven innovation: Extending the license to
foster innovation. Management Decision, 48(1), 65-84.
http://dx.doi.org/10.1108/00251741011014463
Kieffer, K. M. (April, 1998). Some comments on analytic traditions in EFA as against CFA: An
analysis of selected research reports. Paper presented at the Annual Meeting of the
American Educational Research Association, San Diego, CA.
Kimberlin, C. L., & Winterstein, A. G. (2008). Validity and reliability of measurement
instruments used in research. American Journal of Health Syst Pharm, 65(23), 2276-
2284. http://dx.doi.org/10.2146/ajhp070364
Kleinschmidt, E. J., De Brentani, U., & Salomo, S. (2007). Performance of global new product
development programs: A resource-based view. Journal of Product Innovation
Management, 24(5), 419-441. http://dx.doi.org/10.1111/j.1540-5885.2007.00261.x
Kline, R. B. (2011). Principles and practice of structural equation modeling. New York, NY:
Guilford Publications.
Kumar, R. & Uzkurt, C. (2010). Can innovativeness be impacted by interpersonal influences and
do cultural dimensions play a moderating role?: An investigation in the Turkish context.
Journal of Global Business Management, 6(2), 1.
Kuczmarski, T. D. (2003). What is innovation? And why aren’t companies doing more of it?
Journal of Consumer Marketing, 20(6), 536-541.

152
Kuščer, K. (2013). Determining factors of mountain destination innovativeness. Journal of
Vacation Marketing, 19(1), 41-54. http://dx.doi.org/10.1177/1356766712461404
Lawson, B., & Samson, D. (2001). Developing innovation capability in organizations: A
dynamic capabilities approach. International Journal of Innovation Management, 5(3),
377-400.
Lazarus, I. R., & Fell, D. (2011). Innovation or stagnation? Crossing the creativity gap in
healthcare. Journal of Healthcare Management/American College of Healthcare
Executives, 56(6), 363.
Leavy, B. (2005). A leader's guide to creating an innovation culture. Strategy & Leadership,
33(4), 38-45. http://dx.doi.org/10.1108/10878570510608031
Lee, C. S., Chen, Y. C., Tsui, P. L., & Yu, T. H. (2014). Examining the relations between open
innovation climate and job satisfaction with a PLS path model. Quality & Quantity, 1-18.
http://dx.doi.org/10.1007/s11135-014-0029-4
Lehmann, D.R. in M.J. Schlinger (ed.) (1975). Validity and goodness of fit in data analysis. In
Advances in Consumer Research. Association for Consumer Research, 2, 741-750.
Lemon, M. & Sahota, P. S. (2004). Organizational culture as a knowledge repository for
increased innovative capacity. Technovation, 24(6), 483-498.
http://dx.doi.org/10.1016/S0166-4972(02)00102-5
Leung, W. C. (2001). How to design a questionnaire. Student BMJ, 9(11), 187-189.
Lindell, M. K., & Whitney, D. J. (2001). Accounting for common method variance in cross-
sectional research designs. Journal of Applied Psychology, 86(1), 114.
http://dx.doi.org/10.1037/0021-9010.86.1.114
Lissitz, R. W., & Samuelsen, K. (2007). A suggested change in terminology and emphasis

153
regarding validity and education. Educational researcher, 36(8), 437-448.
http://dx.doi.org/10.3102/0013189X07311286
Little, T. D., & Rhemtulla, M. (2013). Planned missing data designs for developmental
researchers. Child Development Perspectives, 7(4), 199-204.
http://dx.doi.org/10.1111/cdep.12043
MacCallum, R. C., Widaman, K. F., Zhang, S., & Hong, S. (1999). Sample size in factor
analysis. Psychological Methods, 4(1), 84-99. http://dx.doi.org/10.1037/1082-
989X.4.1.84
Mardia, K.V. (1985). Mardia’s test of multinormality. In S. Kotz & N.L. Johnson (Eds.),
Encyclopedia of Statistical Sciences, 5, 217-221. New York: Wiley.
Martens, J. (2013). Stories of innovation: Roles, perspectives, and players. European Journal of
Training and Development, 38(1/2), 40-53.
McAdam, R., Keogh, W., Reid, R. S., & Mitchell, N. (2007). Implementing innovation
management in manufacturing SMEs: A longitudinal study. Journal of Small Business
and Enterprise Development, 14(3), 385-403.
http://dx.doi.org/10.1108/14626000710773501
Meade, A. W., Watson, A. M., & Kroustalis, C. M. (2007, April). Assessing common methods
bias in organizational research. Paper presented at the 22nd Annual Meeting of the
Society for Industrial and Organizational Psychology, New York.
Messick, S. (1989). Validity. In R.L. Linn (Ed.), Educational measurement (3rd ed., pp. 13-103).
New York: American Council on Education; Macmillan.
Moosa, N., & Panurach, P. (2008). Encouraging front-line employees to rise to the innovation

154
challenge. Strategy & Leadership, 36(4), 4-9.
http://dx.doi.org/10.1108/10878570810888704
National Audit Office. (2009). Innovation: The perspective of front line staff. Victoria, London:
UK. Retrieved from http://www.nao.org.uk/wp-
content/uploads/2009/03/080912_mori.pdf
Nimon, K., & Reio, T. G. (2011). Measurement invariance: A foundational principle for
quantitative theory building. Human Resource Development Review, 10(2), 198-214.
http://dx.doi.org/10.1177/1534484311399731
Nunally, J. C. (1978). Psychometric theory (2nd ed.). New York: McGraw-Hill.
O'Cass, A., & Ngo, L. V. (2007). Market orientation versus innovative culture: two routes to
superior brand performance. European Journal of Marketing, 41(7/8), 868-887.
http://dx.doi.org/10.1108/03090560710752438
O’Connor, B. P. (2000). SPSS and SAS programs for determining the number of components
using parallel analysis and Velicer’s MAP test. Behavior Research Methods, Instruments,
& Computers, 32(3), 396-402.
O'Connor, G. C. (2008). Major innovation as a dynamic capability: A systems approach. Journal
of Product Innovation Management, 25(4), 313-330. http://dx.doi.org/10.1111/j.1540-
5885.2008.00304.x
O'Connor, A., Roos, G., & Vickers-Willis, T. (2007). Evaluating an Australian public policy
organization's innovation capacity. European Journal of Innovation Management, 10(4),
532-558. http://dx.doi.org/10.1108/14601060710828817
O'Reilly, C. A. (1989). Corporations, culture and commitment: Motivation and social control

155
in organizations. California Management Review, 31, 9-25.
http://dx.doi.org/10.2307/41166580
Osborne, J. W. (2008). Best practices in quantitative methods. Thousand Oaks, CA: Sage
Publications.
Osborne, J. W. & Fitzpatrick, D C. (2012). Replication analysis in exploratory factor
analysis: What it is and why it makes your analysis better. Practical Assessment,
Research & Evaluation, 17(15). Retrieved from
http://pareonline.net/getvn.asp?v=17&n=15.
O'Sullivan, D. & Dooley, L. (2009). Applying innovation. Thousand Oaks, CA: Sage
Publications.
Panayides, P. (2006). Enhancing innovation capability through relationship management and
implications for performance. European Journal of Innovation Management, 9(4), 466-
483. http://dx.doi.org/10.1108/14601060610707876
Panuwatwanich, K., Stewart, R. A., & Mohamed, S. (2009). Validation of an empirical model for
innovation diffusion in Australian design firms. Construction Innovation: Information,
Process, Management, 9(4), 449-467. http://dx.doi.org/10.1108/14714170910995976
Patterson, M. G., West, M. A., Shackleton, V. J., Dawson, J. F., Lawthom, R., Maitlis, S., ... &
Wallace, A. M. (2005). Validating the organizational climate measure: Links to
managerial practices, productivity, and innovation. Journal of Organizational Behavior,
26(4), 379-408. http://dx.doi.org/10.1002/job.312
Perel, M. (2005). You can innovate in hard times. Research Technology Management,
48(4).
Podsakoff, P. M., MacKenzie, S. B., Lee, J. Y., & Podsakoff, N. P. (2003). Common method
156
biases in behavioral research: a critical review of the literature and recommended
remedies. Journal of applied psychology, 88(5), 879. http://dx.doi.org/10.1037/0021-
9010.88.5.879
Price Jr, J. (2014). U.S. military innovation: Fostering creativity in a culture of compliance. Air
& Space Power Journal, 28, 128-134.
ProQuest. (2014). Summon Service [computer website]. Ann Arbor, MI.
http://www.proquest.com/products-services/The-Summon-Service.html
Quintane, E., Casselman, R. M., Reiche, B. S., & Nylund, P. A. (2011). Innovation as a
knowledge-based outcome. Journal of Knowledge Management, 15(6), 928-947.
Rao, J. (2014, October). Jay Rao: My approach. [Web log comment.] Retrieved from
http://faculty.babson.edu/jayrao/my_approach.htm
Rao, J., & Weintraub, J. (2013). How Innovative is your company’s culture? MIT Sloan
Management Review, 54(3), 28-37.
Rao, J. & Chuan, F. (2013). The discipline and culture of innovation: A socratic journey.
Barcelona, Spain: Profit Editorial.
Remneland-Wikhamn, B., & Wikhamn, W. (2011). Open innovation climate measure: The
introduction of a validated scale. Creativity and Innovation Management, 20(4), 284-295.
http://dx.doi.org/10.1111/j.1467-8691.2011.00611.x
Rothwell, R. (1992), Successful industrial innovation: Critical factors for the 1990s. R&D
Management, 22: 221–240. http://dx.doi.org/10.1111/j.1467-9310.1992.tb00812.x
Sarros, J. C., Cooper, B. K., & Santora, J. C. (2008). Building a climate for innovation through
transformational leadership and organizational culture. Journal of Leadership &
Organizational Studies, 15(2), 145-158. http://dx.doi.org/10.1177/1548051808324100

157
Satorra, A., & Bentler, P. M. (1988). Scaling corrections for chi-square statistics in covariance
structure analysis. ASA 1988 Proceedings of the Business and Economic Statistics,
Section (308-313). Alexandria, VA: American Statistical Association.
Saunila, M., & Ukko, J. (2013). Facilitating innovation capability through performance
measurement: A study of Finnish SMEs. Management Research Review, 36(10), 991-
1010. http://dx.doi.org/10.1108/MRR-11-2011-0252
Schein, E.H. (1984). Coming to a new awareness of organizational culture. Sloan Management
Review, 25(2), 3-16.
Schein, E. H. (1999). The corporate culture survival guide: Sense and nonsense about culture
change. Warren Bennis signature series. San Francisco, CA: Jossey-Bass.
Schneider, B., Ehrhart, M. G., & Macey, W. H. (2013). Organizational climate and
culture. Annual Review of Psychology, 64, 361-388. http://dx.doi.org/10.1146/annurev-
psych-113011-143809
Scientific Software International. [Computer Software] (2015). LISREL 9.2 for Windows.
Obtained from http://www.ssicentral.com/lisrel/upgrade9.1.html
Scott, S. G., & Bruce, R. A. (1994). Determinants of innovative behavior: A path model of
individual innovation in the workplace. Academy of Management Journal, 37(3), 580-
607. http://dx.doi.org/10.2307/256701
Scott, T., Mannion, R., Davies, H., & Marshall, M. (2003). The quantitative measurement of
organizational culture in health care: A review of the available instruments. Health
Services Research, 38(3), 923-945. http://dx.doi.org/10.1111/1475-6773.00154
Shahin, A., & Zeinali, Z. (2010). Developing a relationship matrix for organizational learning

158
and innovativeness with a case study in a manufacturing company. International Journal
of Business & Management, 5(7). http://dx.doi.org/10.5539/ijbm.v5n7p187
Sharifirad, M. S., & Ataei, V. (2012). Organizational culture and innovation culture: exploring
the relationships between constructs. Leadership & Organization Development Journal,
33(5), 494-517. http://dx.doi.org/10.1108/01437731211241274
Silva, A. (2014). How to become an innovative company: A case study. International Journal
of Innovation Science, 6(3), 177-182. http://dx.doi.org/10.1260/1757-2223.6.3.177
Skarzynski, P. & Crosswhite, D. (2014). The innovator’s field guide: Market-tested methods and
frameworks to help you meet your innovation challenges. San Francisco, CA: Jossey-
Bass.
Slater, S. F., Mohr, J. J., & Sengupta, S. (2014). Radical product innovation capability:
Literature review, synthesis, and illustrative research propositions. Journal of Product
Innovation Management, 31(3), 552-566. http://dx.doi.org/10.1111/jpim.12113
Steiber, A., & Alänge, S. (2013). A corporate system for continuous innovation: The case of
Google Inc. European Journal of Innovation Management, 16(2), 243-264.
http://dx.doi.org/10.1108/14601061311324566
Sun, H., Wong, S. Y., Zhao, Y., & Yam, R. (2012). A systematic model for assessing innovation
competence of Hong Kong/China manufacturing companies: A case study. Journal of
Engineering and Technology Management, 29(4), 546-565.
http://dx.doi.org/10.1016/j.jengtecman.2012.03.005
Sušanj, Z. (2000). Innovative climate and culture in manufacturing organizations: differences
between some European countries. Social Science Information, 39(2), 349-361.
http://dx.doi.org/10.1177/053901800039002011

159
Switzer, G. E., Wisniewski, S. R., Belle, S. H., Dew, M. A., & Schultz, R. (1999). Selecting,
developing, and evaluating research instruments. Social Psychiatry and Psychiatric
Epidemiology, 34(8), 399-409. http://dx.doi.org/10.1007/s001270050161
Tellis, G. J., Prabhu, J. C., & Chandy, R. K. (2009). Radical innovation across nations: the
preeminence of corporate culture. Journal of Marketing, 73(1), 3-23.
http://dx.doi.org/10.1509/jmkg.73.1.3
Tello, F. P., Moscoso, S., García, I.B., & Chaves, S.S. (2006). Training satisfaction rating scale:
development of a measurement model using polychoric correlations. European Journal
of Psychological Assessment, 22(4), 268-279.
Tello, F. P., Moscoso, S., García, I.B, & Abad, E. (2010). Polychoric versus Pearson correlations
in exploratory and confirmatory factor analysis of ordinal variables. Quality &
Quantity, 44(1), 153-166. http://dx.doi/10.1007/s11135-008-9190-y
Terziovski, M. (2002). Achieving performance excellence through an integrated strategy of
radical innovation and continuous improvement. Measuring Business Excellence, 6(2), 5-
14. http://dx.doi.org/10.1108/13683040210431419
Thakur, R., Hsu, S. H., & Fontenot, G. (2012). Innovation in healthcare: Issues and future
trends. Journal of Business Research, 65(4), 562-569.
http://dx.doi.org/10.1016/j.jbusres.2011.02.022
The Baldrige Performance Excellence Program. (2013). Criteria for performance excellence:
2013-2014. Gaithersburg, MD: National Institute of Standards and Technology, U.S.
Department of Commerce. Retrieved from
http://www.nist.gov/baldrige/publications/criteria.cfm
The Spanish Society for Quality. (2015). Participa en indice cultural de la innovacion. Retrieved

160
from http://www.aec.es/web/guest/cultura-innovacion/indice-cultura-innovacion-2015
Tohidi, H., Seyedaliakbar, S. M., & Mandegari, M. (2012). Organizational learning measurement
and the effect on firm innovation. Journal of Enterprise Information Management, 25(3),
219-245. http://dx.doi.org/10.1108/17410391211224390
Unger, B. N., Rank, J., & Gemünden, H. G. (2014). Corporate innovation culture and
dimensions of project portfolio success: The moderating role of national culture. Project
Management Journal, 45(6), 38-57. http://dx.doi.org/10.1002/pmj.21458
Vandenberg, R. J., & Lance, C. E. (2000). A review and synthesis of the measurement invariance
literature: Suggestions, practices, and recommendations for organizational
research. Organizational research methods, 3(1), 4-70.
http://dx.doi.org/10.1177/109442810031002
van Hamersveld, M. & de Bont, C. (Eds.). (2007). Market research handbook. West Sussex,
England: John Wiley & Sons.
Velasco, E., Zamanillo, I., & Del Valle, T. G. (2013). Mobilizing company members' full
innovative potential. Human Factors and Ergonomics in Manufacturing & Service
Industries, 23(6), 541-559. http://dx.doi.org/10.1002/hfm.20341
Velicer, W. F. (1976). Determining the number of components from the matrix of partial
correlations. Psychometrika, 41(3), 321-327. http://dx.doi.org/10.1007/BF02293557
Vincent, L. (2005). Innovation midwives: Sustaining innovation streams in established
companies. Research-Technology Management, 48(1), 41-49.
Weiss, D. S., & Legrand, C. (2011). Innovative intelligence: The art and practice of leading
sustainable innovation in your organization. Toronto, Canada: John Wiley & Sons.
Wilhelm, P. G., & Wilhelm, J. P. (2012). Competitiveness, social networking and international

161
culture variables as predictors of capacity for innovation: An empirical test. American
Society for Competitiveness, In Competition Forum, 10(1), 63.
Wu, A. D., Li, Z., & Zumbo, B. D. (2007). Decoding the meaning of factorial invariance and
updating the practice of multi-group confirmatory factor analysis: A demonstration with
TIMSS data. Practical Assessment, Research and Evaluation, 12(3), 1-26.
Xerri, M. J., & Brunetto, Y. (2011). Fostering the innovative behaviour of SME employees: A
social capital perspective. Research & Practice in Human Resource Management, 19(2),
43.
Zairi, M., & Al-Mashari, M. (2005). Developing a sustainable culture of innovation
management: A prescriptive approach. Knowledge and Process Management, 12(3), 190-
202. http://dx.doi.org/10.1002/kpm.229
Zwick, W. R., & Velicer, W. F. (1986). Comparison of five rules for determining the number of
components to retain. Psychological bulletin, 99(3), 432. http://dx.doi.org/10.1037/0033-
2909.99.3.432