Lpg Bulk Modulus of Elasticity - Industrial Professionals - Cheresources
2-043 0061-2A BO 0061
Measurement of the Complex Modulus of Elasticity: A Brief Survey.
hvordan å skrive ditt eget eventyr
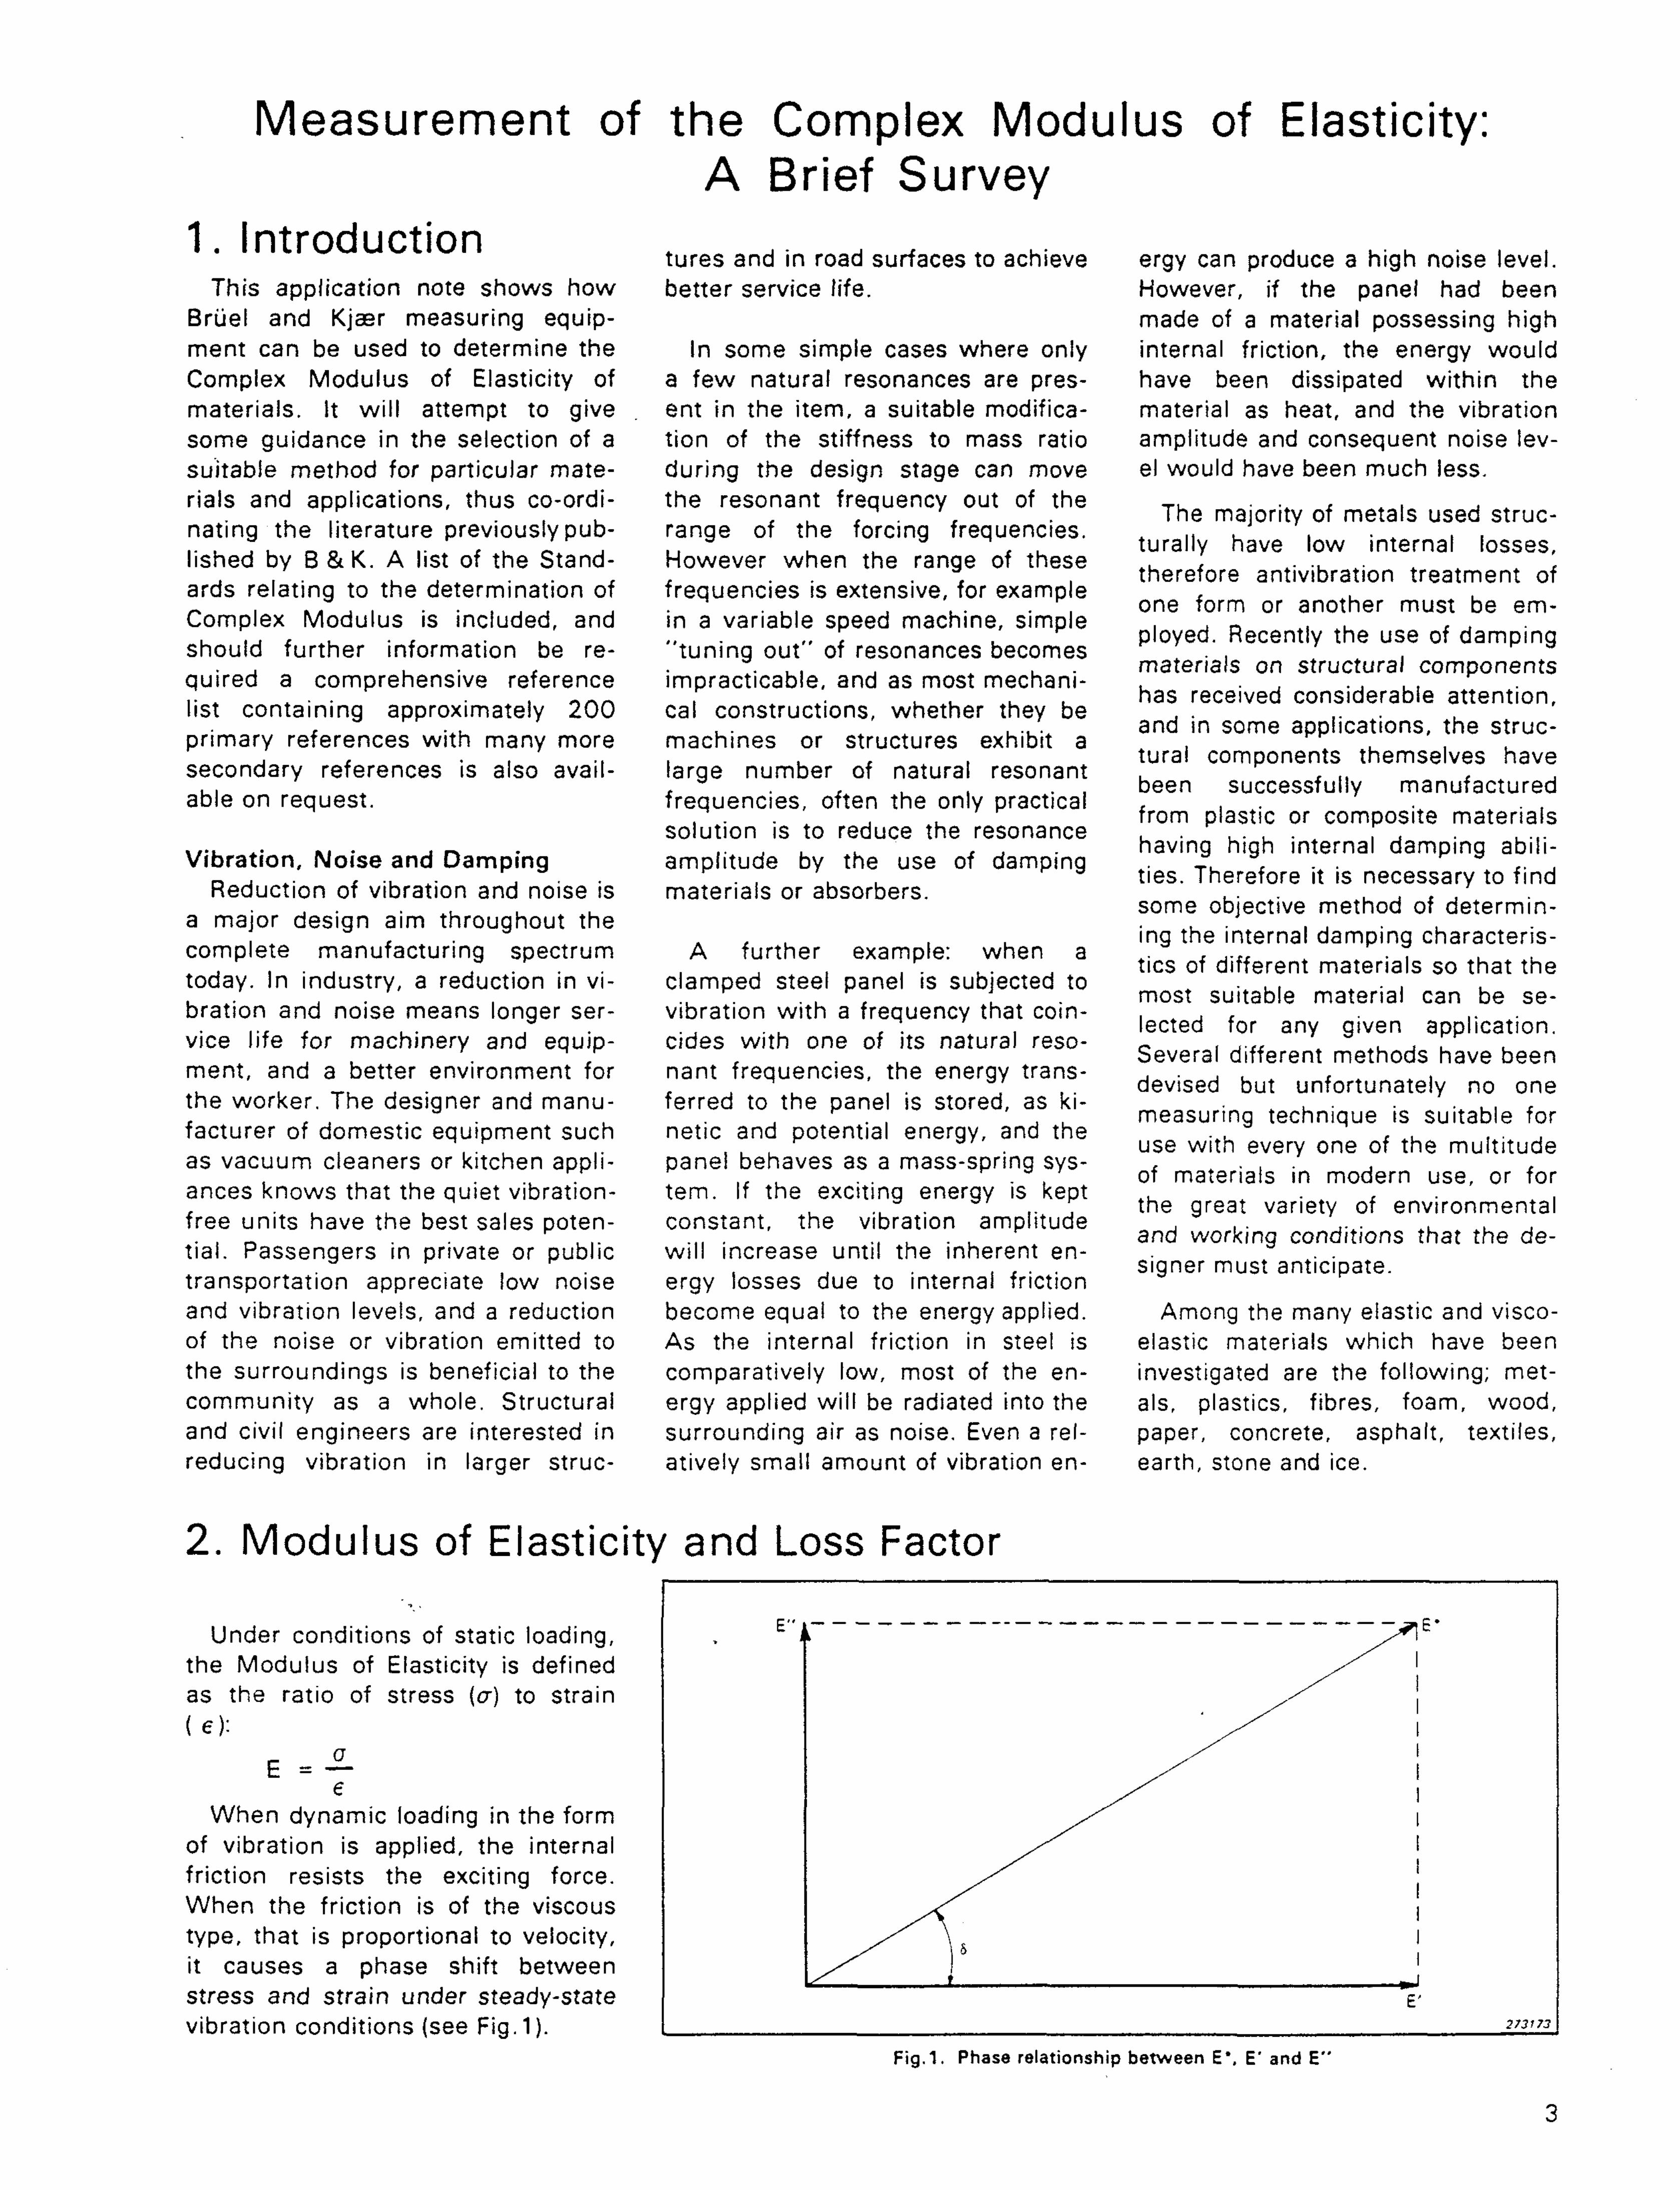
Fig. 1 . Phase relationship between E \ E' and E" ■t
3
w
" * h
Under conditions of static loading, the Modulus of Elasticity is defined as the ratio of stress [a) to strain (e ) :
E - i €
When dynamic loading in the form of vibration is applied, the internal friction resists the exciting force. When the friction is of the viscous type, that is proportional to velocity, it causes a phase shift between stress and strain under steady-state vibration conditions (see Fig. 1).
2. Modulus of Elasticity and Loss Factor
Measurement of the Complex Modulus of Elasticity: A Brief Survey
1. Introduction t * • * * . * ■ *■ * ■ . . tures and in road surfaces to achieve ergy can produce a high notse level.
This application note shows how better service life. However, if the panel had been Bruel and Kjaer measuring equip- made of a material possessing high ment can be used to determine the In some simple cases where only internal friction, the energy would Complex Modulus of Elasticity of a few natural resonances are pres- have been dissipated within the materials. It wi l l attempt to give . ent in the item, a suitable modifica- material as heat, and the vibration some guidance in the selection of a tion of the stiffness to mass ratio amplitude and consequent noise lev-suitable method for particular mate- during the design stage can move el would have been much less. rials and applications, thus co-ordi- the resonant frequency out of the _. . .. , . . , .
. , , , L_ , - - T n e majority of metals used struc-nating the literature previously pub- range of the forcing frequencies. M , ■ • * ■ ■ i- i_ J i_ « a yy A .- l x t- «-. _i i , i_ ,_ x u turally have low internal losses, lished by B & K . A list of the Stand- However when the range of these . . . .- i_ ■ . . . . . ., , . , , . . , therefore antivibration treatment of ards relating to the determination of frequencies is extensive, for example , , , _ . . . , . • • , _ , _ , . • • L l . . . . , one form or another must be em-Complex Modulus is included, and in a variable speed machine, simple . . - . , . . , . , ., . , ., „ 7 . ployed. Recently the use of damping should further information be re- tuning out of resonances becomes . . . a
, , , . . . , materials on structural components quired a comprehensive reference impracticable, and as most mechani- , , . .. . . . . , 0 / . - . . A. . . has received considerable attention, list containing approximately 200 cal constructions, whether they be , . ,.
x -*u i_- i_-i_'A a n d m some applications, the struc-primary references with many more machines or structures exhibit a . L . , • i -i i i. , tural components themselves have secondary references is also avail- large number of natural resonant , , ,, , . . 4 . a . , . . . . been successfully manufactured
able on request. frequencies, often the only practical , , . . 4 , i. f r o m plastic or composite materials solution is to reduce the resonance , . . . . . , , .... Kl . , _, .. j i_ u x j having high internal damping abili-Vibration, Noise and Damping amplitude by the use of damping T L , ,. .
n J *■ x -u *■ -J ■ , i. ties. Therefore it is necessary to find Reduction of vibration and noise is materials or absorbers. , . . , , . . . i U , . some objective method of determin-a major design aim throughout the , . , * x ■ A . mg the internal damping charactens-complete manufacturing spectrum A further example: when a .. , , . t , 4 . 7 . . . . . , , . . , , . , . . ^ tics of different materials so that the
today. In industry, a reduction in vi- clamped steel panel is subjected to , . , . . . . . . . , . . .. . . , . most suitable material can be se-bration and noise means longer ser- vibration with a frequency that coin- . . , , . . . .., , . . . . . , . lected for any given application. vice life for machinery and equip- cides with one of its natural reso- « . ,.,, it_ _, L M ,K , , Several different methods have been ment, and a better environment for nant frequencies, the energy trans- . . , . . , . . . T L , . ^ ^ L , . ! , ■ devised but unfortunately no one the worker. The designer and manu- ferred to the panel is stored, as ki- . , . . . . , , £ J . . . ■ _ ■ • ■ j . measuring technique is suitable for facturer of domestic equipment such netic and potential energy, and the . . . . , . . , . , ,. , L !_ ■ use with every one of the multitude as vacuum cleaners or kitchen appli- panel behaves as a mass-spring sys- , . . , . , ., ,, . . , of materials in modern use, or for ances knows that the quiet vibration- tern. If the exciting energy is kept ., , .
L , i_ . . . . . T t n e great variety of environmental free units have the best sales poten- constant, the vibration amplitude , . . . . . ., . . . . _ , ,. ... • .. t_ - 1. a n d working conditions that the de-tial. Passengers in private or public wil l increase until the inherent en- . . . K . , K . , _, , x ■ ■ signer must anticipate. transportation appreciate low noise ergy losses due to internal friction and vibration levels, and a reduction become equal to the energy applied. Among the many elastic and visco-of the noise or vibration emitted to As the internal friction in steel is elastic materials which have been the surroundings is beneficial to the comparatively low, most of the en- investigated are the following; met-community as a whole. Structural ergy applied will be radiated into the als, plastics, fibres, foam, wood, and civil engineers are interested in surrounding air as noise. Even a rel- paper, concrete, asphalt, textiles, reducing vibration in larger struc- atively small amount of vibration en- earth, stone and ice.
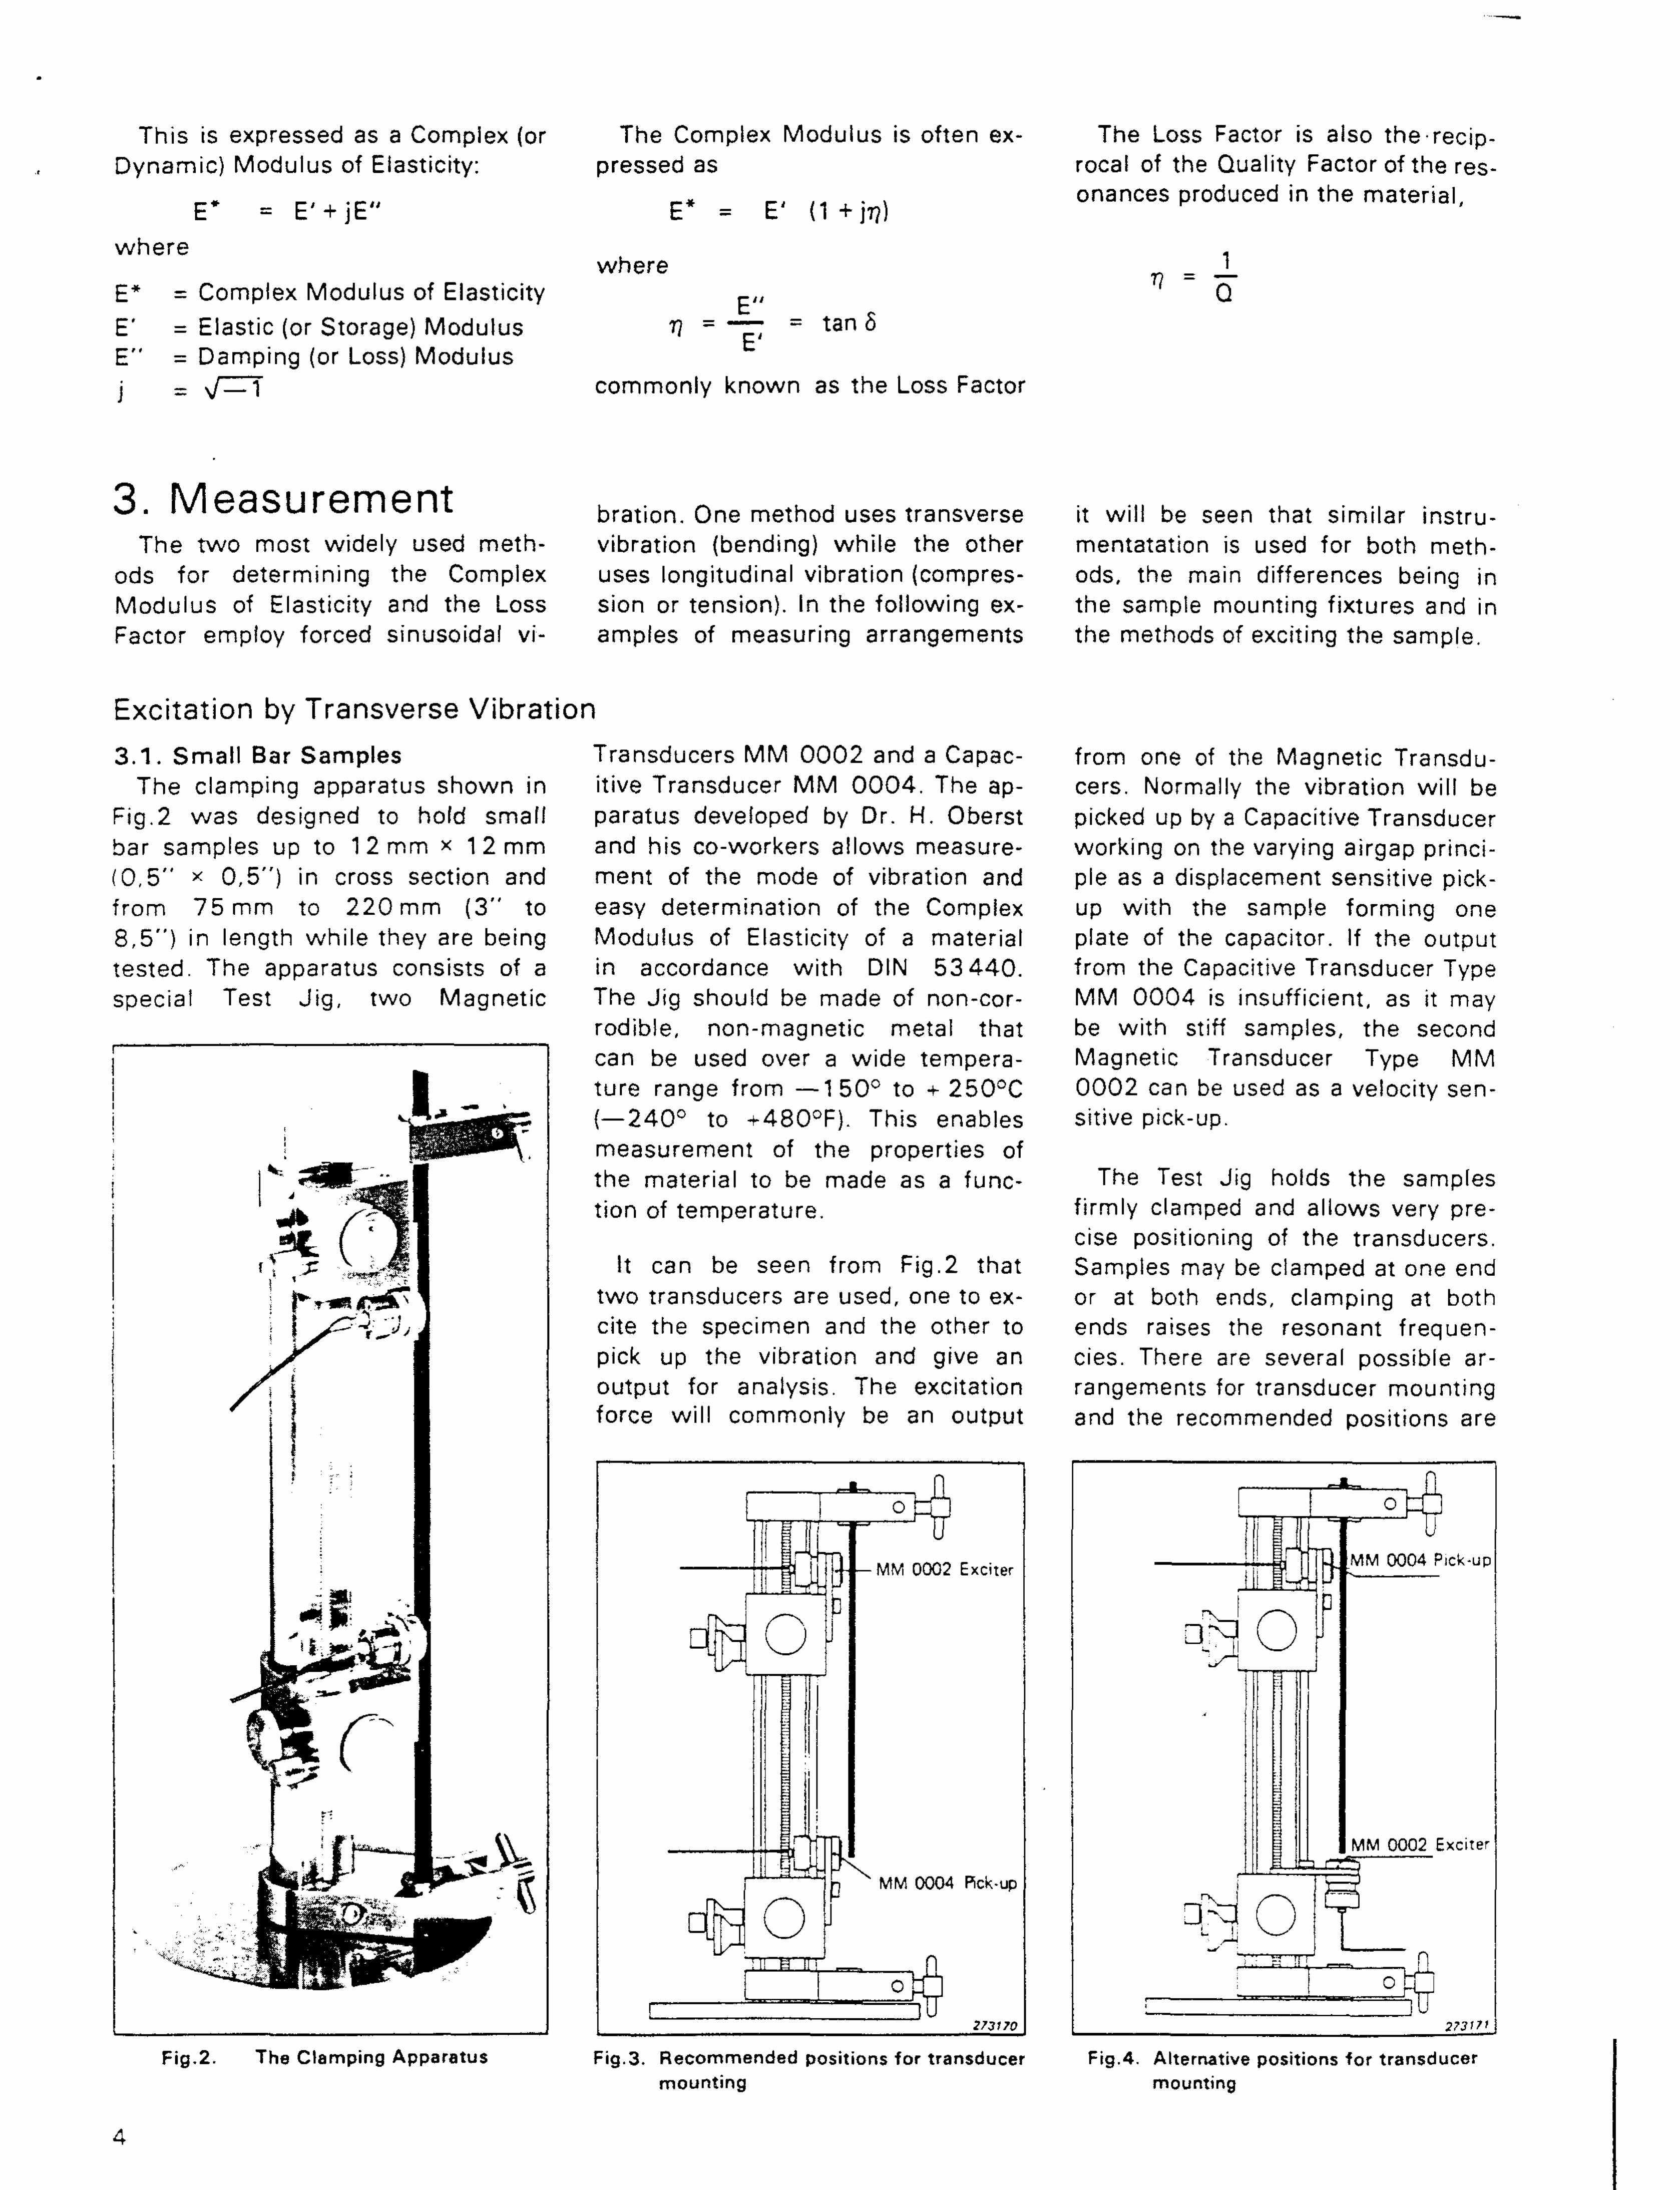
Fig.2. The Clamping Apparatus Fig.3. Recommended positions for transducer Fig.4. Alternative positions for transducer mounting mounting
4
This is expressed as a Complex (or Dynamic) Modulus of Elasticity:
E* = E' + jE" where
E* = Complex Modulus of Elasticity E' = Elastic (or Storage) Modulus E" = Damping (or Loss) Modulus j = V=T
W
3. Measurement The two most widely used meth
ods for determining the Complex Modulus of Elasticity and the Loss Factor employ forced sinusoidal vi-
Excitation by Transverse Vibratio 3 . 1 . Smal l Bar Samples
The clamping apparatus shown in Fig.2 was designed to hold small bar samples up to 12 mm * 12 mm ( 0 , 5 " * 0,5") in cross section and from 75 mm to 220 mm (3 " to 8,5") in length whi le they are being tested. The apparatus consists of a special Test J ig, two Magnetic
The Complex Modulus is often ex- The Loss Factor is also therec ip-pressed as roca! of the Quality Factor of the res-
_- _, ,„ . . onances produced in the material, E = E' (1 +j7?)
where ^ _ 1 E „ * " Q
7) = — = tan 6
commonly known as the Loss Factor
bration. One method uses transverse it wi l l be seen that similar instru-vibration (bending) whi le the other mentatation is used for both meth-uses longitudinal vibration (compres- ods, the main differences being in sion or tension). In the following ex- the sample mounting fixtures and in amples of measuring arrangements the methods of exciting the sample.
:ion Transducers MM 0002 and a Capac- from one of the Magnetic Transdu-itive Transducer M M 0 0 0 4 . The ap- cers. Normally the vibration wi l l be paratus developed by Dr. H. Oberst picked up by a Capacitive Transducer and his co-workers allows measure- working on the varying airgap princi-ment of the mode of vibration and pie as a displacement sensitive pick-easy determination of the Complex up with the sample forming one Modulus of Elasticity of a material plate of the capacitor. If the output in accordance wi th DIN 53 440 . from the Capacitive Transducer Type The Jig should be made of non-cor- MM 0004 is insufficient, as it may rodible, non-magnetic metal that be with stiff samples, the second can be used over a wide tempera- Magnetic Transducer Type MM ture range from — 1 5 0 ° to + 250°C 0002 can be used as a velocity sen-(—240° to +480°F). This enables sitive pick-up. measurement of the properties of the material to be made as a func- The Test Jig holds the samples tion of temperature. firmly clamped and allows very pre
cise positioning of the transducers. It can be seen from Fig.2 that Samples may be clamped at one end
two transducers are used, one to ex- or at both ends, clamping at both cite the specimen and the other to ends raises the resonant frequen-pick up the vibration and give an cies. There are several possible ar-output for analysis. The excitation rangements for transducer mounting force wil l commonly be an output and the recommended positions are
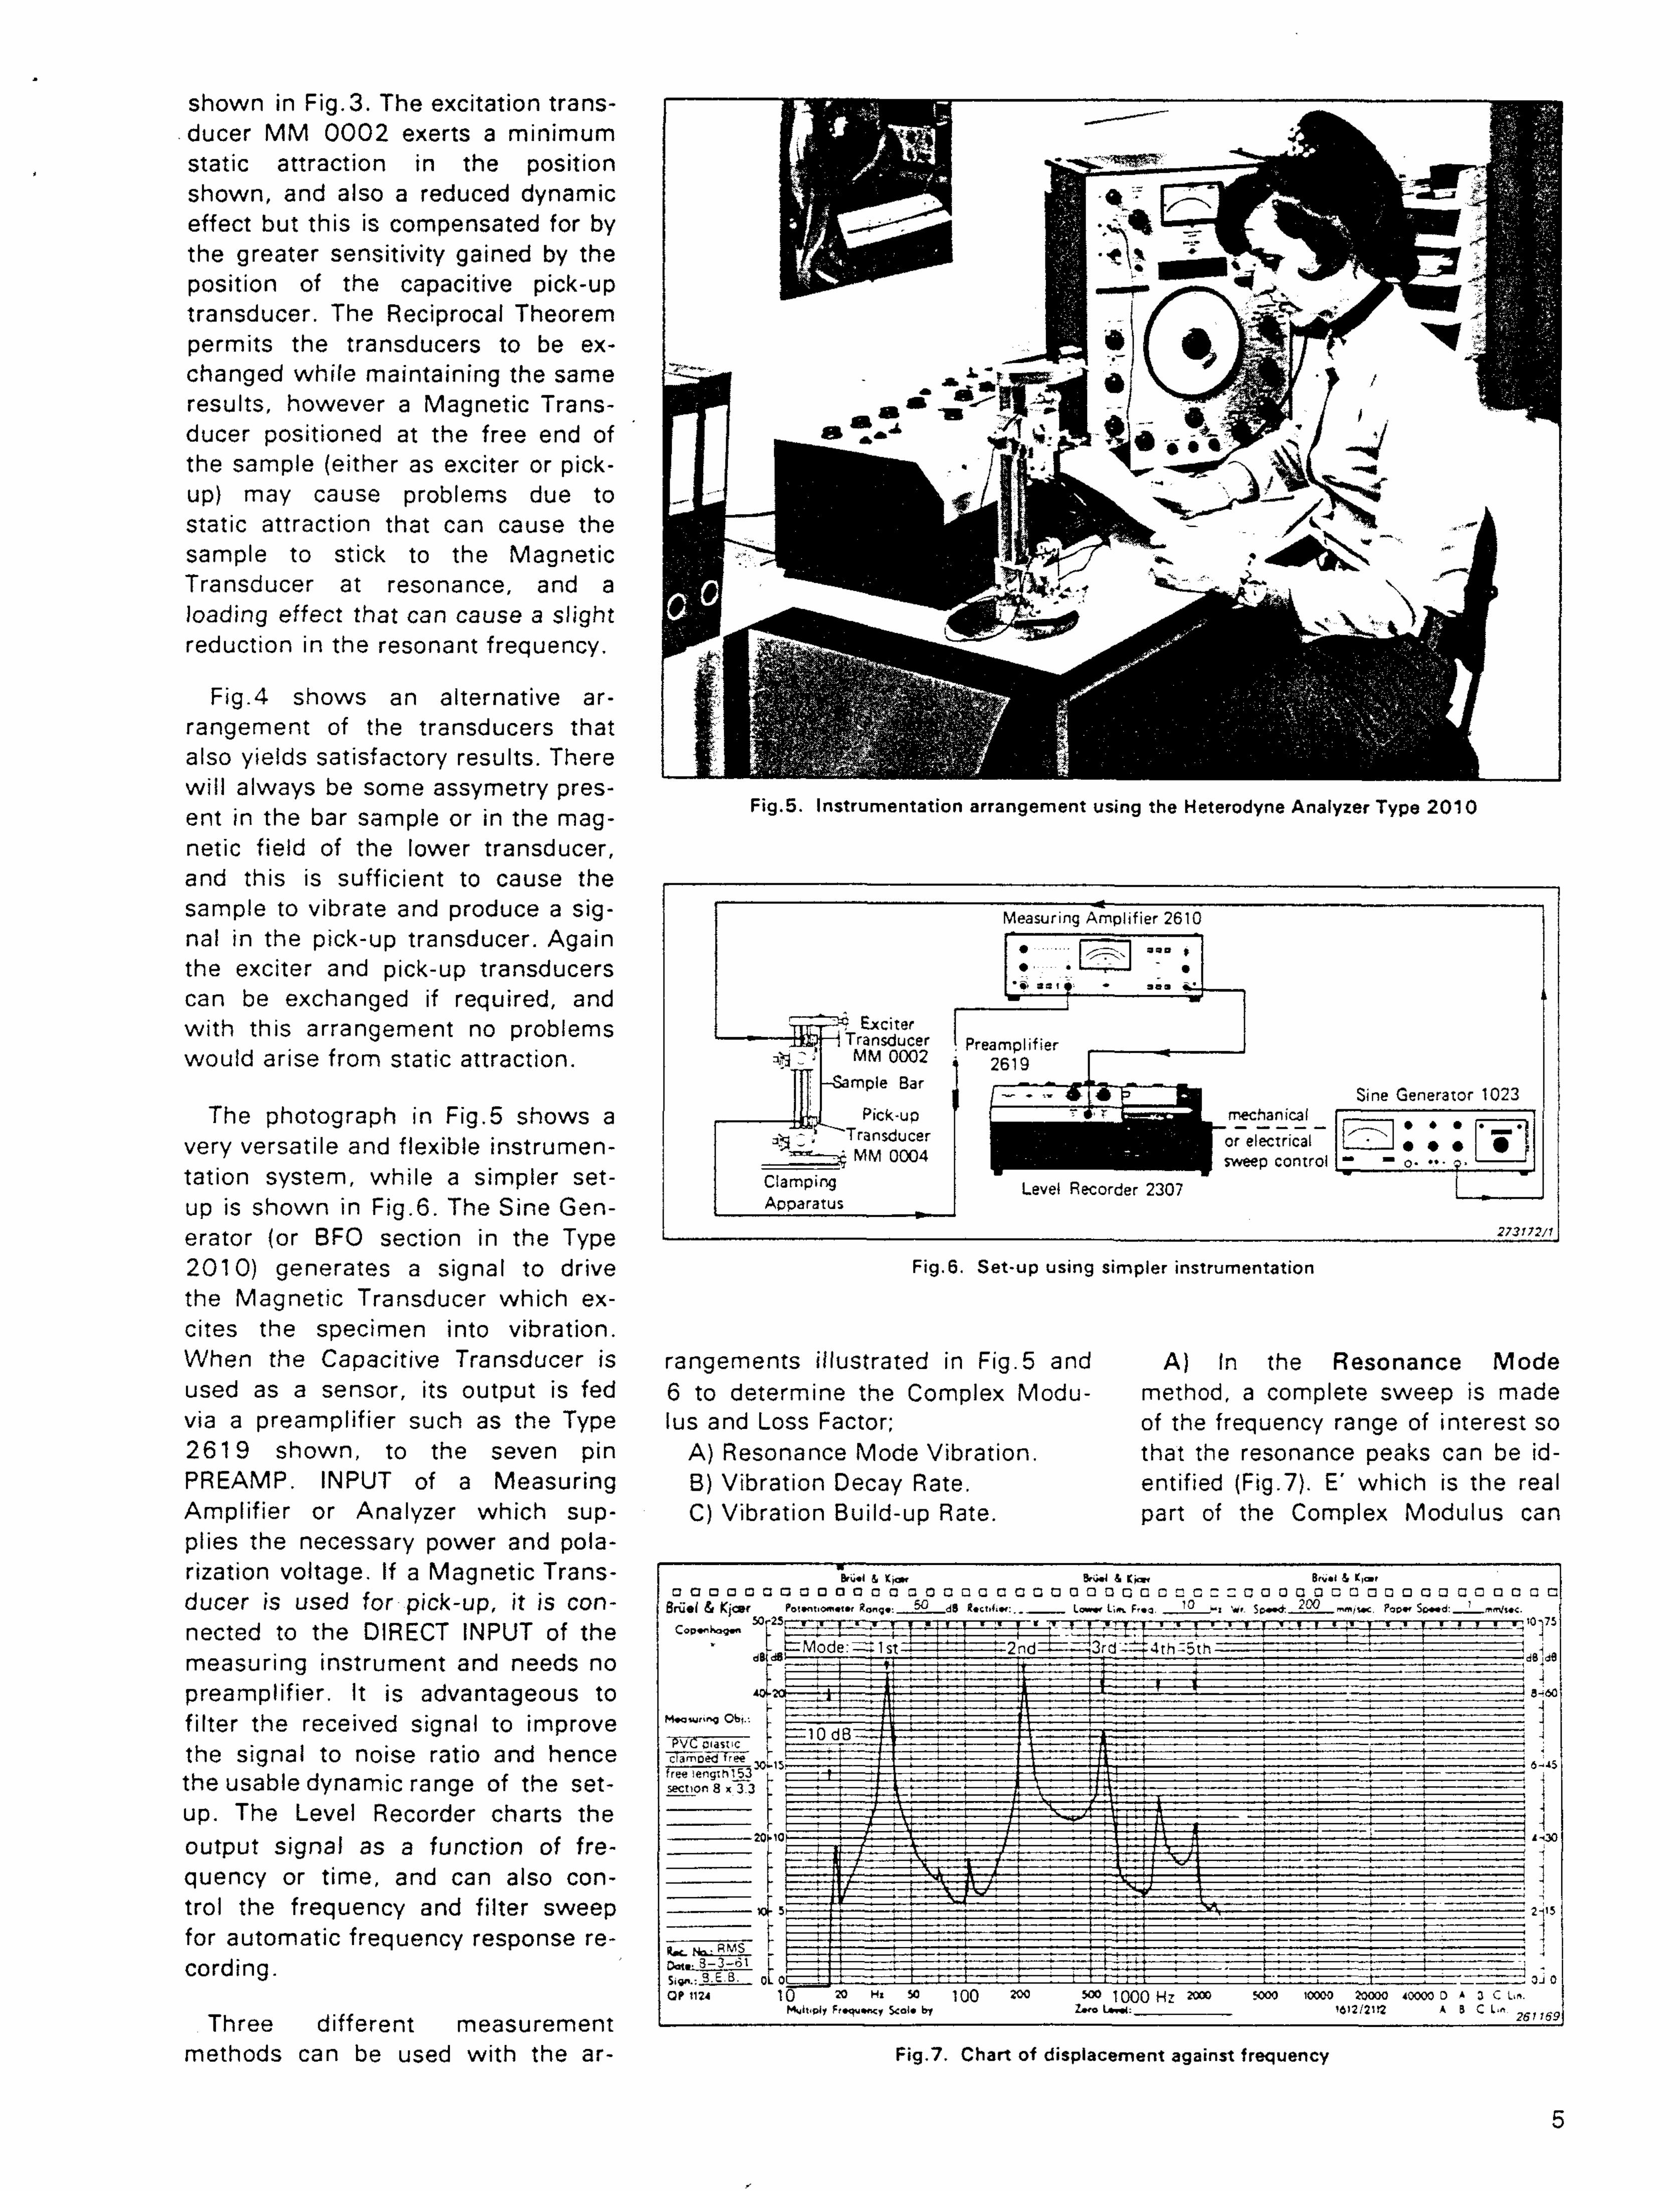
Fig.7. Chart of displacement against frequency
5
rangements illustrated in Fig.5 and A) In the Resonance Mode 6 to determine the Complex Modu- method, a complete sweep is made lus and Loss Factor; of the frequency range of interest so
A) Resonance Mode Vibration. that the resonance peaks can be id-B) Vibration Decay Rate. entified (Fig.7). E' which is the real C) Vibration Build-up Rate. part of the Complex Modulus can
shown in Fig.3. The excitation transducer MM 0002 exerts a minimum static attraction in the position shown, and also a reduced dynamic effect but this is compensated for by the greater sensitivity gained by the position of the capacitive pick-up transducer. The Reciprocal Theorem permits the transducers to be exchanged while maintaining the same results, however a Magnetic Trans-ducer positioned at the free end of the sample (either as exciter or pickup) may cause problems due to static attraction that can cause the sample to stick to the Magnetic Transducer at resonance, and a loading effect that can cause a slight reduction in the resonant frequency.
Fig. 4 shows an alternative arrangement of the transducers that also yields satisfactory results. There will always be some assymetry present in the bar sample or in the magnetic field of the lower transducer, and this is sufficient to cause the sample to vibrate and produce a signal in the pick-up transducer. Again the exciter and pick-up transducers can be exchanged if required, and with this arrangement no problems would arise from static attraction.
The photograph in Fig.5 shows a very versatile and flexible instrumentation system, while a simpler setup is shown in Fig.6. The Sine Generator (or BFO section in the Type 2010) generates a signal to drive the Magnetic Transducer which excites the specimen into vibration. When the Capacitive Transducer is used as a sensor, its output is fed via a preamplifier such as the Type 2619 shown, to the seven pin PREAMP. INPUT of a Measuring Amplifier or Analyzer which supplies the necessary power and polarization voltage. If a Magnetic Transducer is used for pick-up, it is connected to the DIRECT INPUT of the measuring instrument and needs no preamplifier. It is advantageous to filter the received signal to improve the signal to noise ratio and hence the usable dynamic range of the setup. The Level Recorder charts the
output signal as a function of frequency or time, and can also control the frequency and filter sweep for automatic frequency response recording.
Three different measurement methods can be used with the ar-
Fig.5. Instrumentation arrangement using the Heterodyne Analyzer Type 2 0 1 0
Fig.6. Set-up using simpler instrumentation

then be determined from the formula;
E' = 4,8 ff2Pl~*"^J Pa(N/m2) where
p = sample density (Kg/m3) / = free length (m) h = thickness (m) fn = the undamped resonant fre
quency of the mode " n " kn = a coefficient depending
upon the resonant mode number and the damping method
The Loss Factor 17 is determined from the sharpness of the resonance curve; A f
n = —n
where Afn = the bandwidth at the half power points (3dB down from the peak).
When the frequency sweep has been logarithmic, the 3 dB bandwidth can be read directly from the Level Recorder chart as a linear dimension which greatly helps in the calculation. Direct reading Q (= 1/77) is possible using the Q-Rule BM 1001 supplied with the Complex Modulus Apparatus as shown in Fig.8. The Rule is calibrated for the three most commonly employed scanning speeds of the Level Recorder. A very low scanning speed is required when investigating resonance peaks of sample bars having small Loss Factors, therefore, where V < 0 , 0 1 , Decay Rate, or Build-up Rate measurement is recommended.
B) In the Decay rate method, the sample is brought to a resonance by tuning the signal frequency. The decay is obtained by pushing the GENERATOR switch to "Off" or BFO STOP button on the generator. The Level Recorder provides a direct and accurate measurement of the decay rate in dB/s, when used with a logarithmic potentiometer. Fig.9 shows how the Decay Rate is measured over the straight-line portion of the curve. Making the assumption that the damping is viscous (usually a true assumption, but difficult to ascertain) the Decay Rate D in dB/s at a frequency f (Hz) is related to the Damping Factor as follows;
r\ = 0,0366 y
6
C) In the Vibration Build-up Rate method, the Level Recorder is used to record how the sample under test builds up to a steadystate resonance oscillation under the action of an oscillating force with constant amplitude. The Build-up Rate is determined by the inherant damping so that the Loss Factor can be calculated from the relationship;
1 r\ =
7T X f X T
where T the Build-up Time is the time taken for the amplitude of the bar to reach 1 — e ~ 1 of its steady state level (as shown in Fig. 10).
This method avoids the possibility of rearrangement of the atomic-scale structure of the sample which could occur under conditions of steady state loading.
The preceding methods using the clamping apparatus are intended for measurements on elastic materials. Non-elastic materials such as felt or mastic compounds, and materials
Fig.9. Measurement of Decay Rate -from Level Recorder chart
with very high internal damping can be glued to a thin metal strip to allow the excitation of bending waves in the specimen bar. These coated or composite samples are tested as described above, and when necessary, the characteristics of the coating alone can be deducted from the performance of the combined sample using a somewhat more involved mathematical analysis.
Fig.8. Use of the Q-Rule BM 1001
Fig.10. Calculation of Build-up Time
When using the Capacitive Trans- each Magnetic Transducer. High-^ used in roadway construction, be-- ducer with non-conducting materi- discs (YO 0010) are supplied with cause the aggregate size limits how
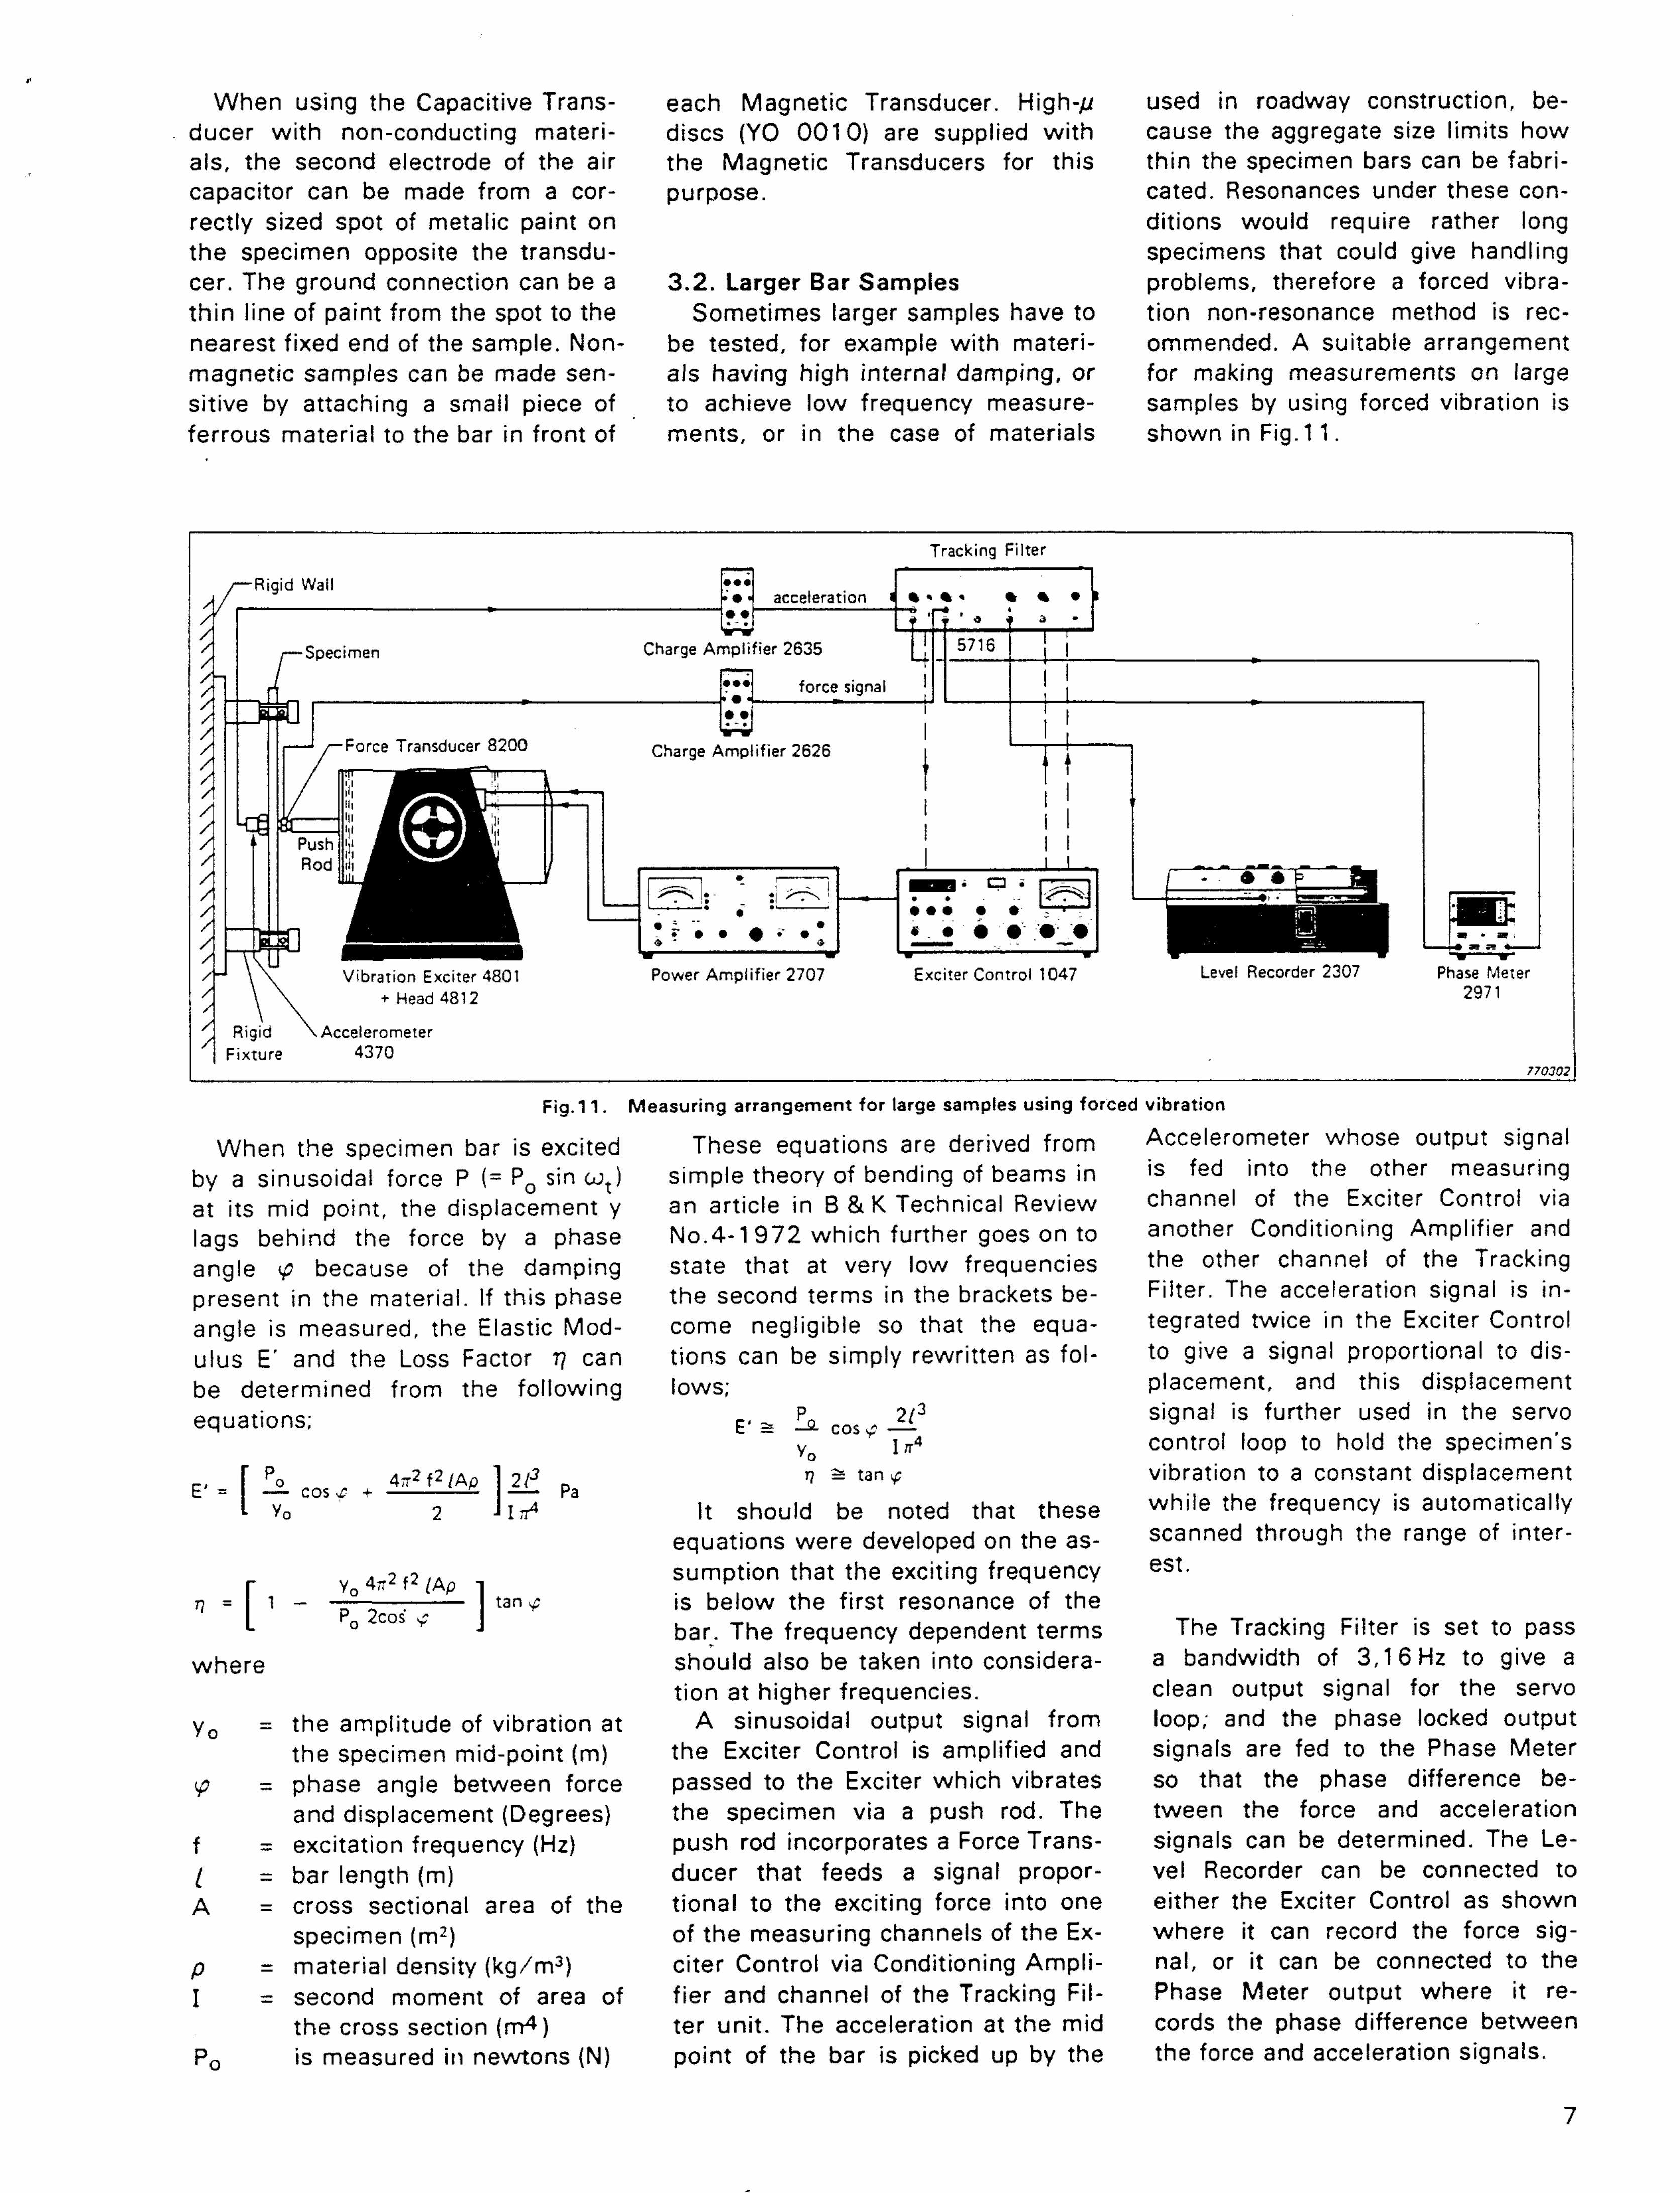
als, the second electrode of the air the Magnetic Transducers for this thin the specimen bars can be fabri-capacitor can be made from a cor- purpose. cated. Resonances under these con-rectly sized spot of metalic paint on ditions would require rather long the specimen opposite the transdu- specimens that could give handling cer. The ground connection can be a 3.2. Larger Bar Samples problems, therefore a forced vibra-thin line of paint from the spot to the Sometimes larger samples have to tion non-resonance method is rec-nearest fixed end of the sample. Non- be tested, for example with materi- ommended. A suitable arrangement magnetic samples can be made sen- als having high internal damping, or for making measurements on large sitive by attaching a small piece of to achieve low frequency measure- samples by using forced vibration is ferrous material to the bar in front of ments, or in the case of materials shown in Fig. 1 1 .
When the specimen bar is excited by a sinusoidal force P (= P0 sin cot) at its mid point, the displacement y lags behind the force by a phase angle <p because of the damping present in the material. If this phase angle is measured, the Elastic Modulus E' and the Loss Factor 7] can be determined from the following equations;
E. . [ !2. co$ , + iZiiilAfi 12£ pa
I Vo 2 J i n 4
r Y0 4TT2 f2 [Ap -I
" " l 1 " P0 2cos- , j " " '
where
y0 = the amplitude of vibration at the specimen mid-point (m)
V? = phase angle between force and displacement (Degrees)
f = excitation frequency (Hz) / = bar length (m) A = cross sectional area of the
specimen (m2) p = material density (kg/m3) I = second moment of area of
the cross section (m4) P0 is measured in newtons (N)
Fig. 1 1 . Measur ing arrangement for large samples using forced vibrat ion
; excited These equations are derived from Accelerometer whose output signal 3 sin cot) simple theory of bending of beams in 'S fed into the other measuring ement y an article in B & K Technical Review channel of the Exciter Control via 3 phase No.4-1 972 which further goes on to another Conditioning Amplifier and jamping state that at very low frequencies the other channel of the Tracking is phase the second terms in the brackets be- Filter. The acceleration signal is in-tic Mod- come negligible so that the equa- tegrated twice in the Exciter Control • 7] can tions can be simply rewritten as fol- to give a signal proportional to dis-ollowing lows; placement, and this displacement
p 2/3 signal is further used in the servo E := —2- COS ■£ , , , i . .
y \JTA control loop to hold the specimens 3 rj s tan ̂ vibration to a constant displacement 4 Pa it should be noted that these w h i l e t h e frequency is automatically
equations were developed on the as- scanned through the range of inter-sumption that the exciting frequency e s t -
$ is below the first resonance of the bar. The frequency dependent terms The Tracking Filter is set to pass should also be taken into considera- a bandwidth of 3,1 6 Hz to give a tion at higher frequencies. clean output signal for the servo
ration at A sinusoidal output signal from loop; and the phase locked output >int (m) the Exciter Control is amplified and signals are fed to the Phase Meter sn force passed to the Exciter which vibrates so that the phase difference be-egrees) the specimen via a push rod. The tween the force and acceleration (Hz) push rod incorporates a Force Trans- signals can be determined. The Le-
ducer that feeds a signal propor- vel Recorder can be connected to 3 of the tional to the exciting force into one either the Exciter Control as shown
of the measuring channels of the Ex- where it can record the force sig-'m3) citer Control via Conditioning Ampli- nal, or it can be connected to the area of fier and channel of the Tracking Fil- Phase Meter output where it re-
l ) ter unit. The acceleration at the mid cords the phase difference between ons (N) point of the bar is picked up by the the force and acceleration signals.
7
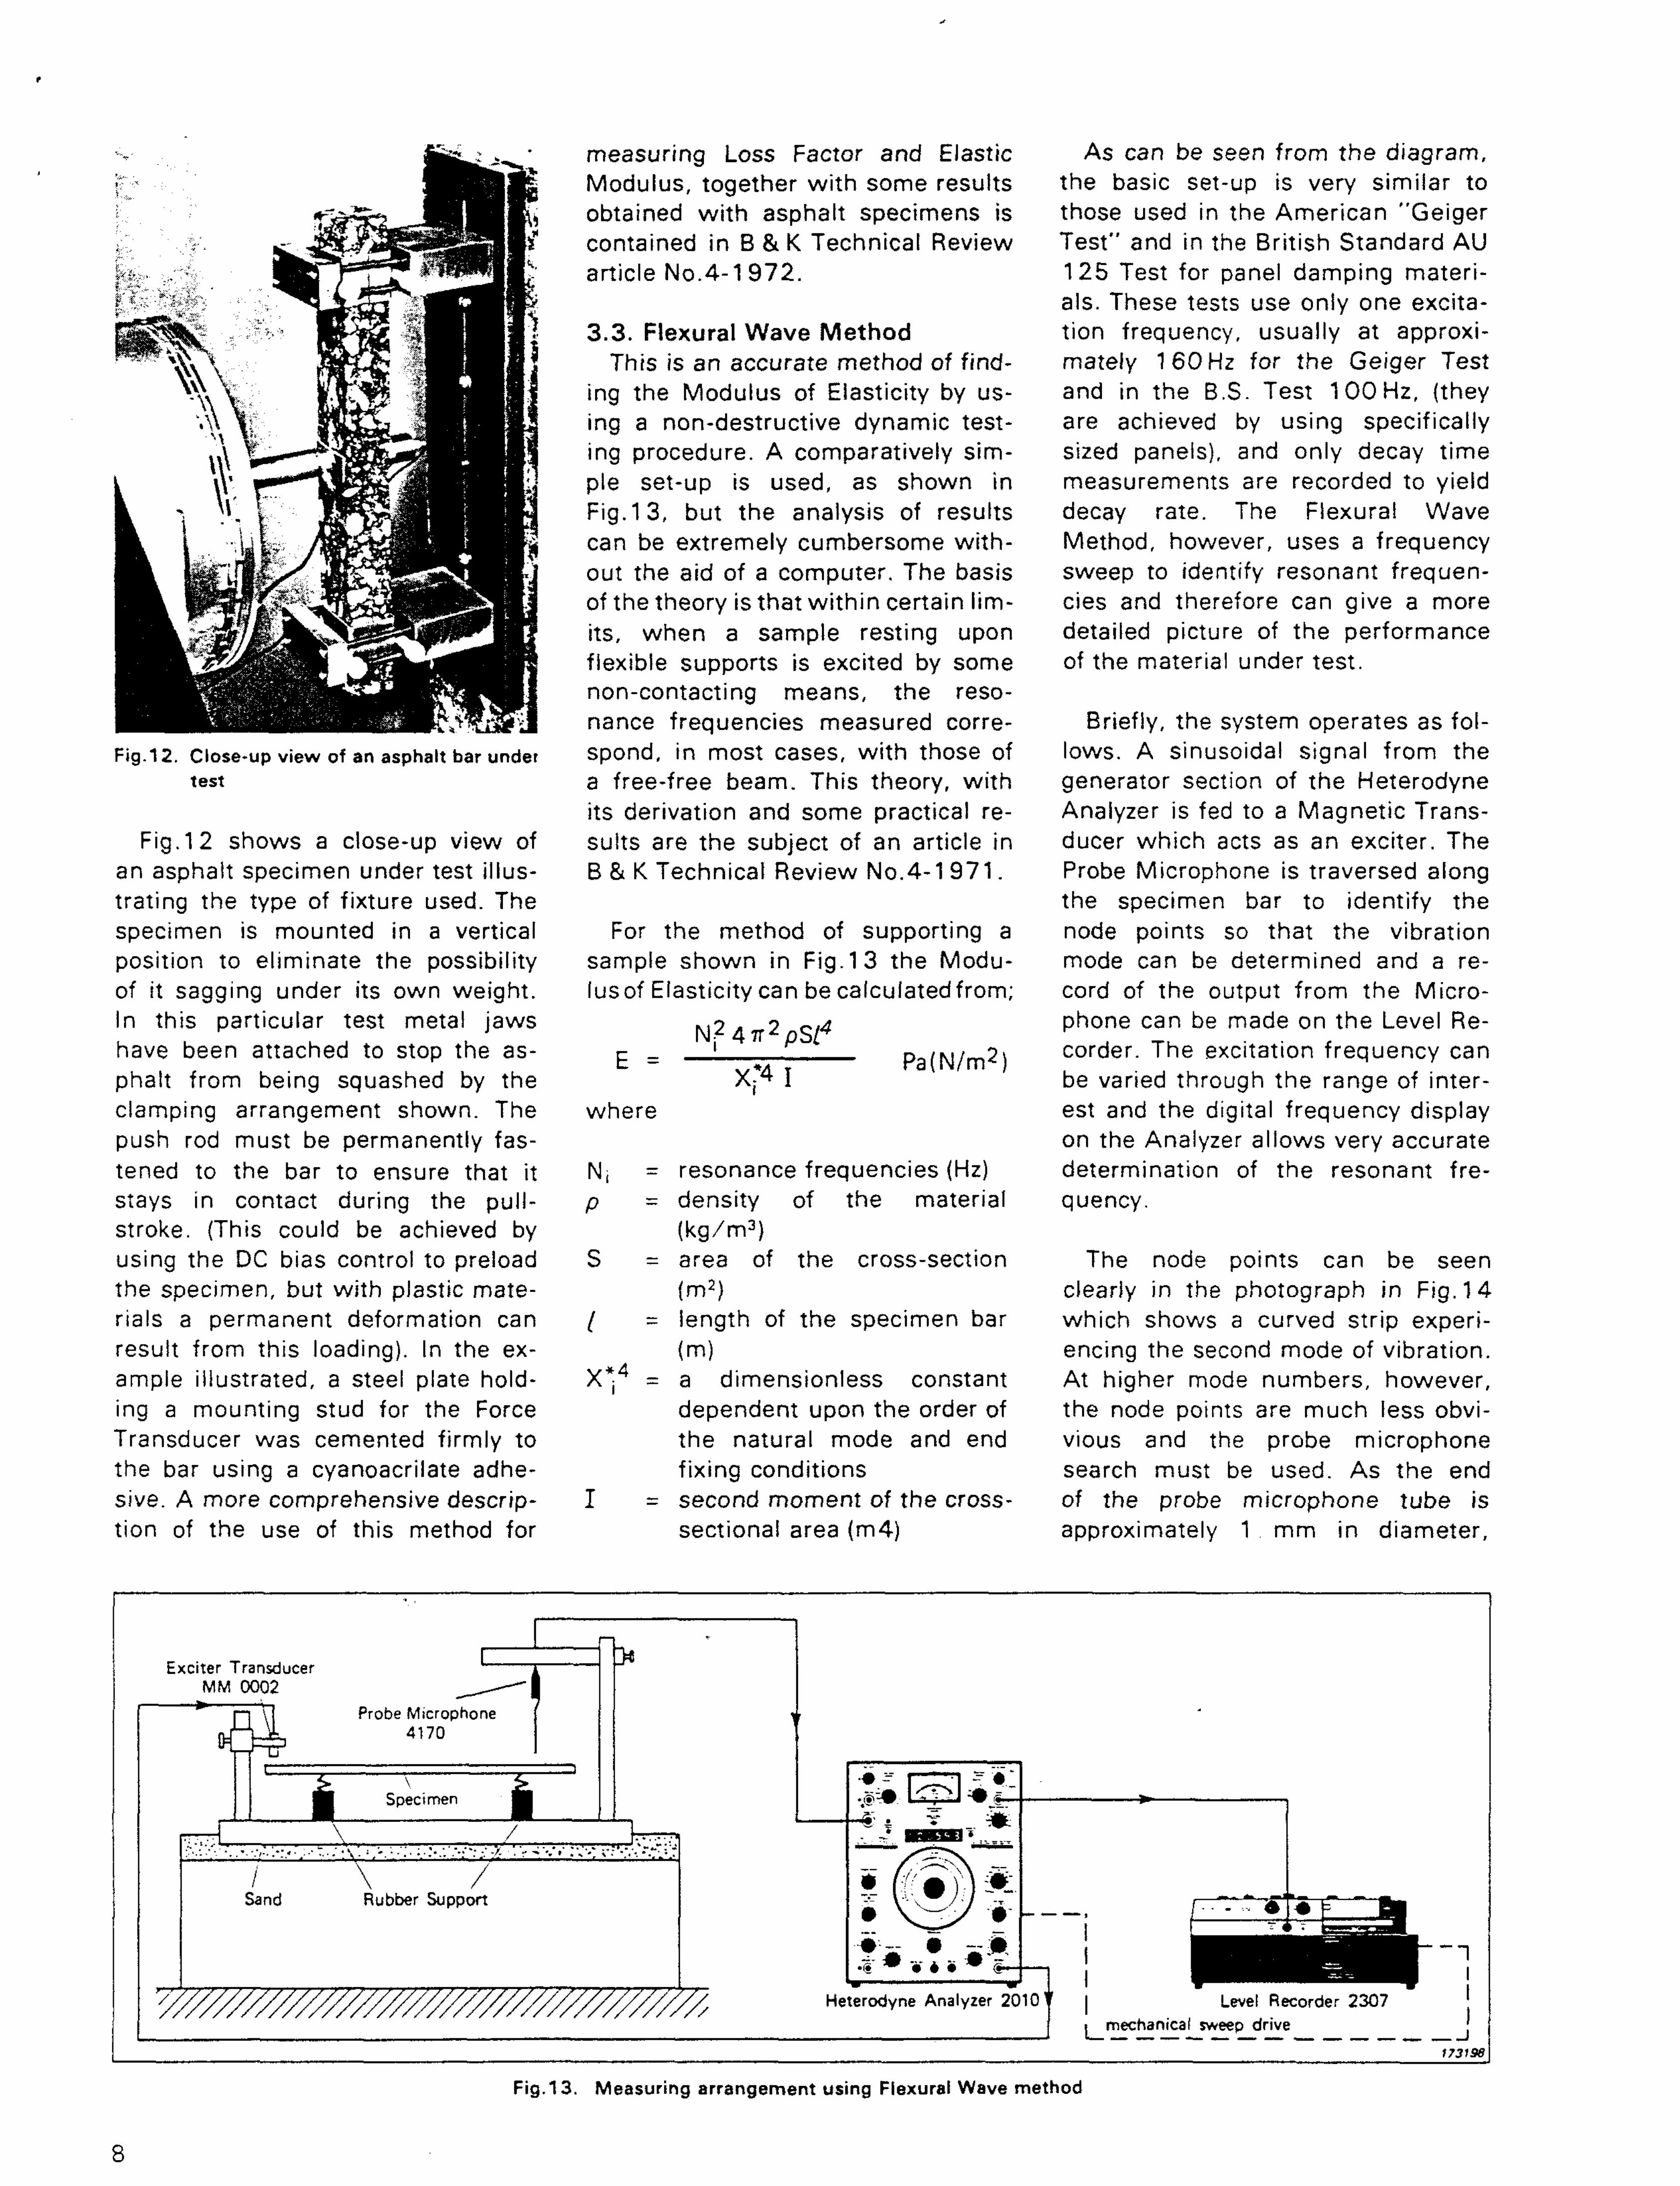
Fig.13. Measuring arrangement using Flexural Wave method
8
measuring Loss Factor and Elastic As can be seen from the diagram, Modulus, together with some results the basic set-up is very similar to obtained with asphalt specimens is those used in the American "Geiger contained in B & K Technical Review Test" and in the British Standard AU article No.4-1 972. 125 Test for panel damping materi
als. These tests use only one excita-3.3. Flexural Wave Method tion frequency, usually at approxi-
This is an accurate method of find- mately 1 60 Hz for the Geiger Test ing the Modulus of Elasticity by us- and in the B.S. Test 100 Hz, (they ing a non-destructive dynamic test- are achieved by using specifically ing procedure. A comparatively sim- sized panels), and only decay time pie set-up is used, as shown in measurements are recorded to yield Fig. 13, but the analysis of results decay rate. The Flexural Wave can be extremely cumbersome with- Method, however, uses a frequency out the aid of a computer. The basis sweep to identify resonant frequen-of the theory is that within certain lim- cies and therefore can give a more its, when a sample resting upon detailed picture of the performance flexible supports is excited by some of the material under test. non-contacting means, the resonance frequencies measured corre- Briefly, the system operates as fol-spond, in most cases, with those of lows. A sinusoidal signal from the a free-free beam. This theory, with generator section of the Heterodyne its derivation and some practical re- Analyzer is fed to a Magnetic Trans-suits are the subject of an article in ducer which acts as an exciter. The B & K Technical Review No.4-1 9 7 1 . Probe Microphone is traversed along
the specimen bar to identify the For the method of supporting a node points so that the vibration
sample shown in Fig.13 the Modu- mode can be determined and a re-lusof Elasticity can be calculatedfrom; cord of the output from the Micro-
r\t2 A 2 c/4 phone can be made on the Level Re-c _ _ l Pa(N/m2) corder. The excitation frequency can
X*4 I be varied through the range of inter-where est and the digital frequency display
on the Analyzer allows very accurate Nj = resonance frequencies (Hz) determination of the resonant fre-p - density of the material quency.
(kg/m3) S = area of the cross-section The node points can be seen
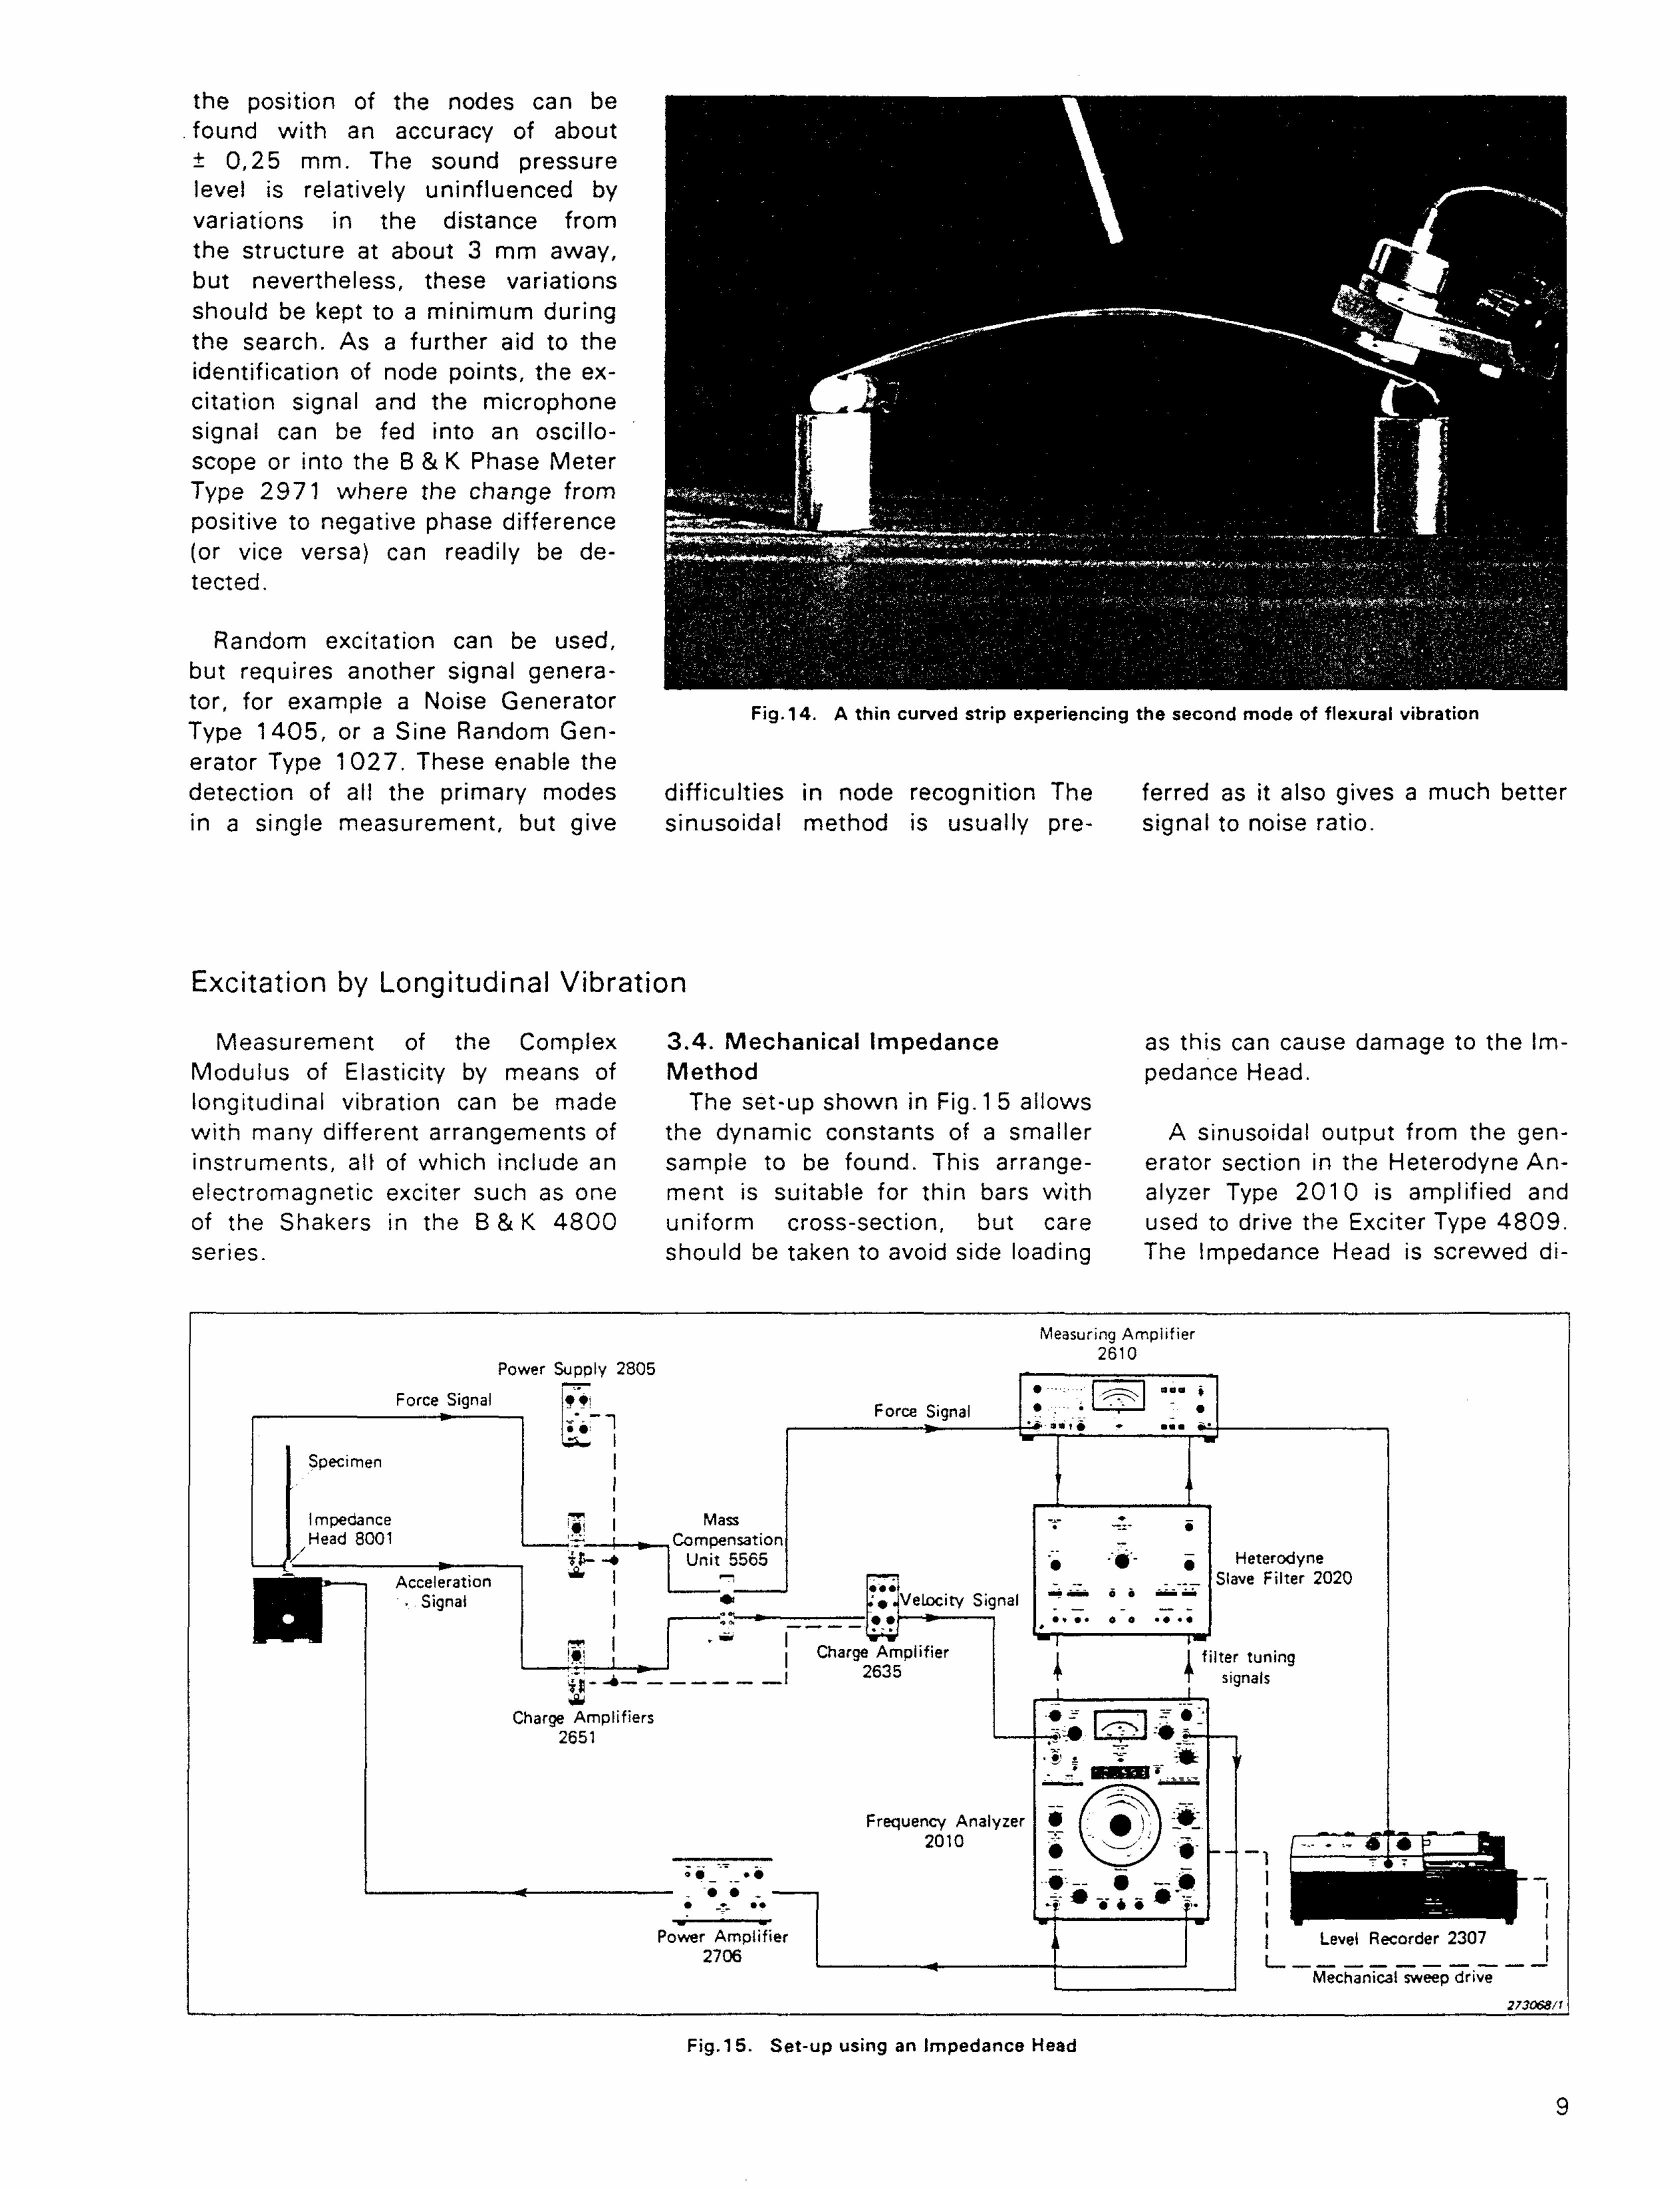
(m2) clearly in the photograph in Fig. 14 / ~ length of the specimen bar which shows a curved strip experi-
(m) encing the second mode of vibration. X* 4 = a dimensionless constant At higher mode numbers, however,
dependent upon the order of the node points are much less obvi-the natural mode and end vious and the probe microphone fixing conditions search must be used. As the end
I = second moment of the cross- of the probe microphone tube is sectional area (m4) approximately 1 mm in diameter,
i - tg. iz. uiose-up view or an asphalt bar under test
Fig.12 shows a close-up view of an asphalt specimen under test illustrating the type of fixture used. The specimen is mounted in a vertical position to eliminate the possibility of it sagging under its own weight. In this particular test metal jaws have been attached to stop the asphalt from being squashed by the clamping arrangement shown. The push rod must be permanently fastened to the bar to ensure that it stays in contact during the pull-stroke. (This could be achieved by using the DC bias control to preload the specimen, but with plastic materials a permanent deformation can result from this loading). In the example illustrated, a steel plate holding a mounting stud for the Force Transducer was cemented firmly to the bar using a cyanoacrilate adhesive. A more comprehensive description of the use of this method for
9
Fig.15. Set-up using an Impedance Head
Excitation by Longitudinal Vibration
Measurement of the Complex 3.4. Mechanical Impedance as this can cause damage to the Im-Moduius of Elasticity by means of Method pedance Head. longitudinal vibration can be made The set-up shown in Fig. 1 5 allows with many different arrangements of the dynamic constants of a smaller A sinusoidal output from the gen-instruments, all of which include an sample to be found. This arrange- erator section in the Heterodyne An-electromagnetic exciter such as one ment is suitable for thin bars with alyzer Type 2010 is amplified and of the Shakers in the B & K 4800 uniform cross-section, but care used to drive the Exciter Type 4809. series. should be taken to avoid side loading The Impedance Head is screwed di-
the position of the nodes can be . found with an accuracy of about ± 0,25 mm. The sound pressure level is relatively uninfluenced by variations in the distance from the structure at about 3 mm away, but nevertheless, these variations should be kept to a minimum during the search. As a further aid to the identification of node points, the excitation signal and the microphone signal can be fed into an oscilloscope or into the B & K Phase Meter Type 2971 where the change from positive to negative phase difference (or vice versa) can readily be detected.
Random excitation can be used, but requires another signal generator, for example a Noise Generator Type 1405, or a Sine Random Generator Type 1027. These enable the detection of all the primary modes in a single measurement, but give
Fig. 14. A thin curved strip experiencing the second mode of flexural vibration
difficulties in node recognition The ferred as it also gives a much better sinusoidal method is usually pre- signal to noise ratio.

10
Fig.17. Force against frequency plotted on an enlarged frequency scale
rectiy on to the Shaker and is used to transfer the output force to the sample bar. The acceleration signal from the Impedance Head passes through a Preamplifier stage and further to another Preamplifier where it is integrated to give a signal proportional to velocity. This velocity signal is fed back into the amplifier section of the Type 2010 which is used in a compressor cir-cuit to control the generator output such that the Shaker delivers vibration at a constant velocity level.
The force signal from the Impedance Head is fed through a Preamplifier and further to the Measuring Amplifier which is coupled to a Slave Filter Type 2020 tuned by the 2010. The narrow band filtered force signal is plotted on the Level Recorder so that a force/frequency curve is made for the frequency range of interest. This results in a chart like the one shown in Fig. 16 where the individual resonances and anti-resonances can be identified. Fig. 17 shows a similar impedance plot, but here it is drawn on a greatly enlarged scale to permit accurate measurement of the band widths.
The Mass Compensation Unit Type 5565 is included in the set-up to compensate electrically for the 1 gm mass below the force gauge in the Impedance Head and the Cementing Stud (YQ 2962) used for mounting.
Loss Factor 77 is determined from the sharpness of the resonance curve such that
Fig.16. Level Recorder chart of force against frequency
A fn A fm ACt [ 2 M n ] 2
77 = —r or —— and E' = P fn fm L n J when 77 « 1 Kn = 1
when 77 « 1 At anti-resonance:
[ 2 / f I 2 1 ™ 1
m -1/2 J Km
down) and fn and f m are respectively r 2 / f i 2 resonance frequency and anti-reso- and E' = P j I nance frequency. ^ m-1/2 *
-r,. o , „„ .. , L w n e n V « 1 K m s l
The Complex Modulus can be found from Where
E' = Real part of the Complex E* = E' (1 +j7?) Modulus
P = Sample density (kg/m3) At resonance: L - Sample length (m)
n = Order of the resonance r 2 Z f l 2 l m = Order of the anti-resonance
E' = p I — I — Kn and Km are correction factors.

These correction factors are dis- generating a sinusoidal signal that is Re = cosh( £' tan - ) (cos §' - R£' sin §') cussed fully in "Elevated Tempera- amplified to feed the Exciter that . ture Dynamic Modulii of Metallic drives the specimen, and sending + R£' tan - cos £' sinh ( £' tan - ) = 0 Materials", (p. 890—906), W. H. tuning signals to the Slave Filters or 2 2
Hill, K. D. Shimmin and B. A. Wil- frequency synchronisation. A feed- -cox, and in "A Method for Determin- back incorporating the amplifier sec- Im = sinh ( ^ t a n - ) (sin £' + R %' cos £') ing Mechanical Resonance Frequen- tion in the Type 2010 is employed to cies and for Calculating Elastic Mod- compress the output signal and hold + R£' tan-s in %' cosh ( %' t a n - ) = —, ulii from These Frequencies", (p. a constant acceleration on the Exci- 2 Q 1 221 — 1 238), S. Spinner and W. E. ter as the frequency is varied. and hence: Tefft, both in ATSM Proceedings Vol. 2
61(1961) . Norris and Young have developed E* = pc2cos2— = p I ^ - c o s — I equations for the calculation of the L ? ^ J
3.5. Phase Measurement Method Complex Modulus and Loss Factor A method similar to that used for based on real and imaginary parts of so that E' = E* cos 5
the larger bar samples tested in the ratio of the acceleration of the bending can be adapted for use with driven to the free end of the bar and E" = E*s in5 compression excitation. This method sample. These are related as fol-was developed by D. M. Norris Jr. lows: where and Wun-Chung Young and is fully t a n = I m / R e £' = frequency ratio when Re = described in "Longitudinal Forced Vi- 0 bration of Viscoelastic Bars with End where 5 = angle by which strain lags Mass", Special Report 135, Cold <p = the phase angle measured stress (rads) Regions Research and Engineering Im = the imaginary part of the ra- R = a mass ratio dependent Laboratory, U.S. Army, and in tio upon the mass loading the "Complex Modulus Measurements Re = the real part of the ratio free end by Longitudinal Vibration Testing", . a = specimen density (kg/m3) Experimental Mechanics, Vol. 10 They show that when Re = 0 there r j r? g
Feb. 1 970, p. 93—96. is a 90° phase shift at which condi- = phase velocity y/ — section Im = 1/Q where Q is the abso- ' ^
Fig. 18 shows the measuring ar- lute value of the acceleration ratio of CJ = exciting angular frequency rangement that utilises the phase the two ends of the bar. Therefore (rad/s) difference between the signals from during the test the excitation fre- I = specimen length (m) accelerometers at different ends of a quency is adjusted until the phase £ = frequency ratio = col/c test bar. The Phase Meter indicates difference is 90° (a resonance) so this difference by measuring the that the value of Q' can be mea- These equations may be solved phase angle between the 120 kHz sured at this frequency. Using the Q' with a graphical method or by using outputs from the Slave Filters which value obtained, the following equa- a computer. A computer program are connected one to each of the ac- tions can be solved numerically to written in FORTRAN IV to perform celerometers. The Heterodyne Ana- yield the Complex Modulus and the these operations is available from lyzer controls the whole system. Loss Factor. B & K.
11
British Standard 1881 Part 5 details a similar but much simplified method for finding the Dynamic Modulus of concrete.
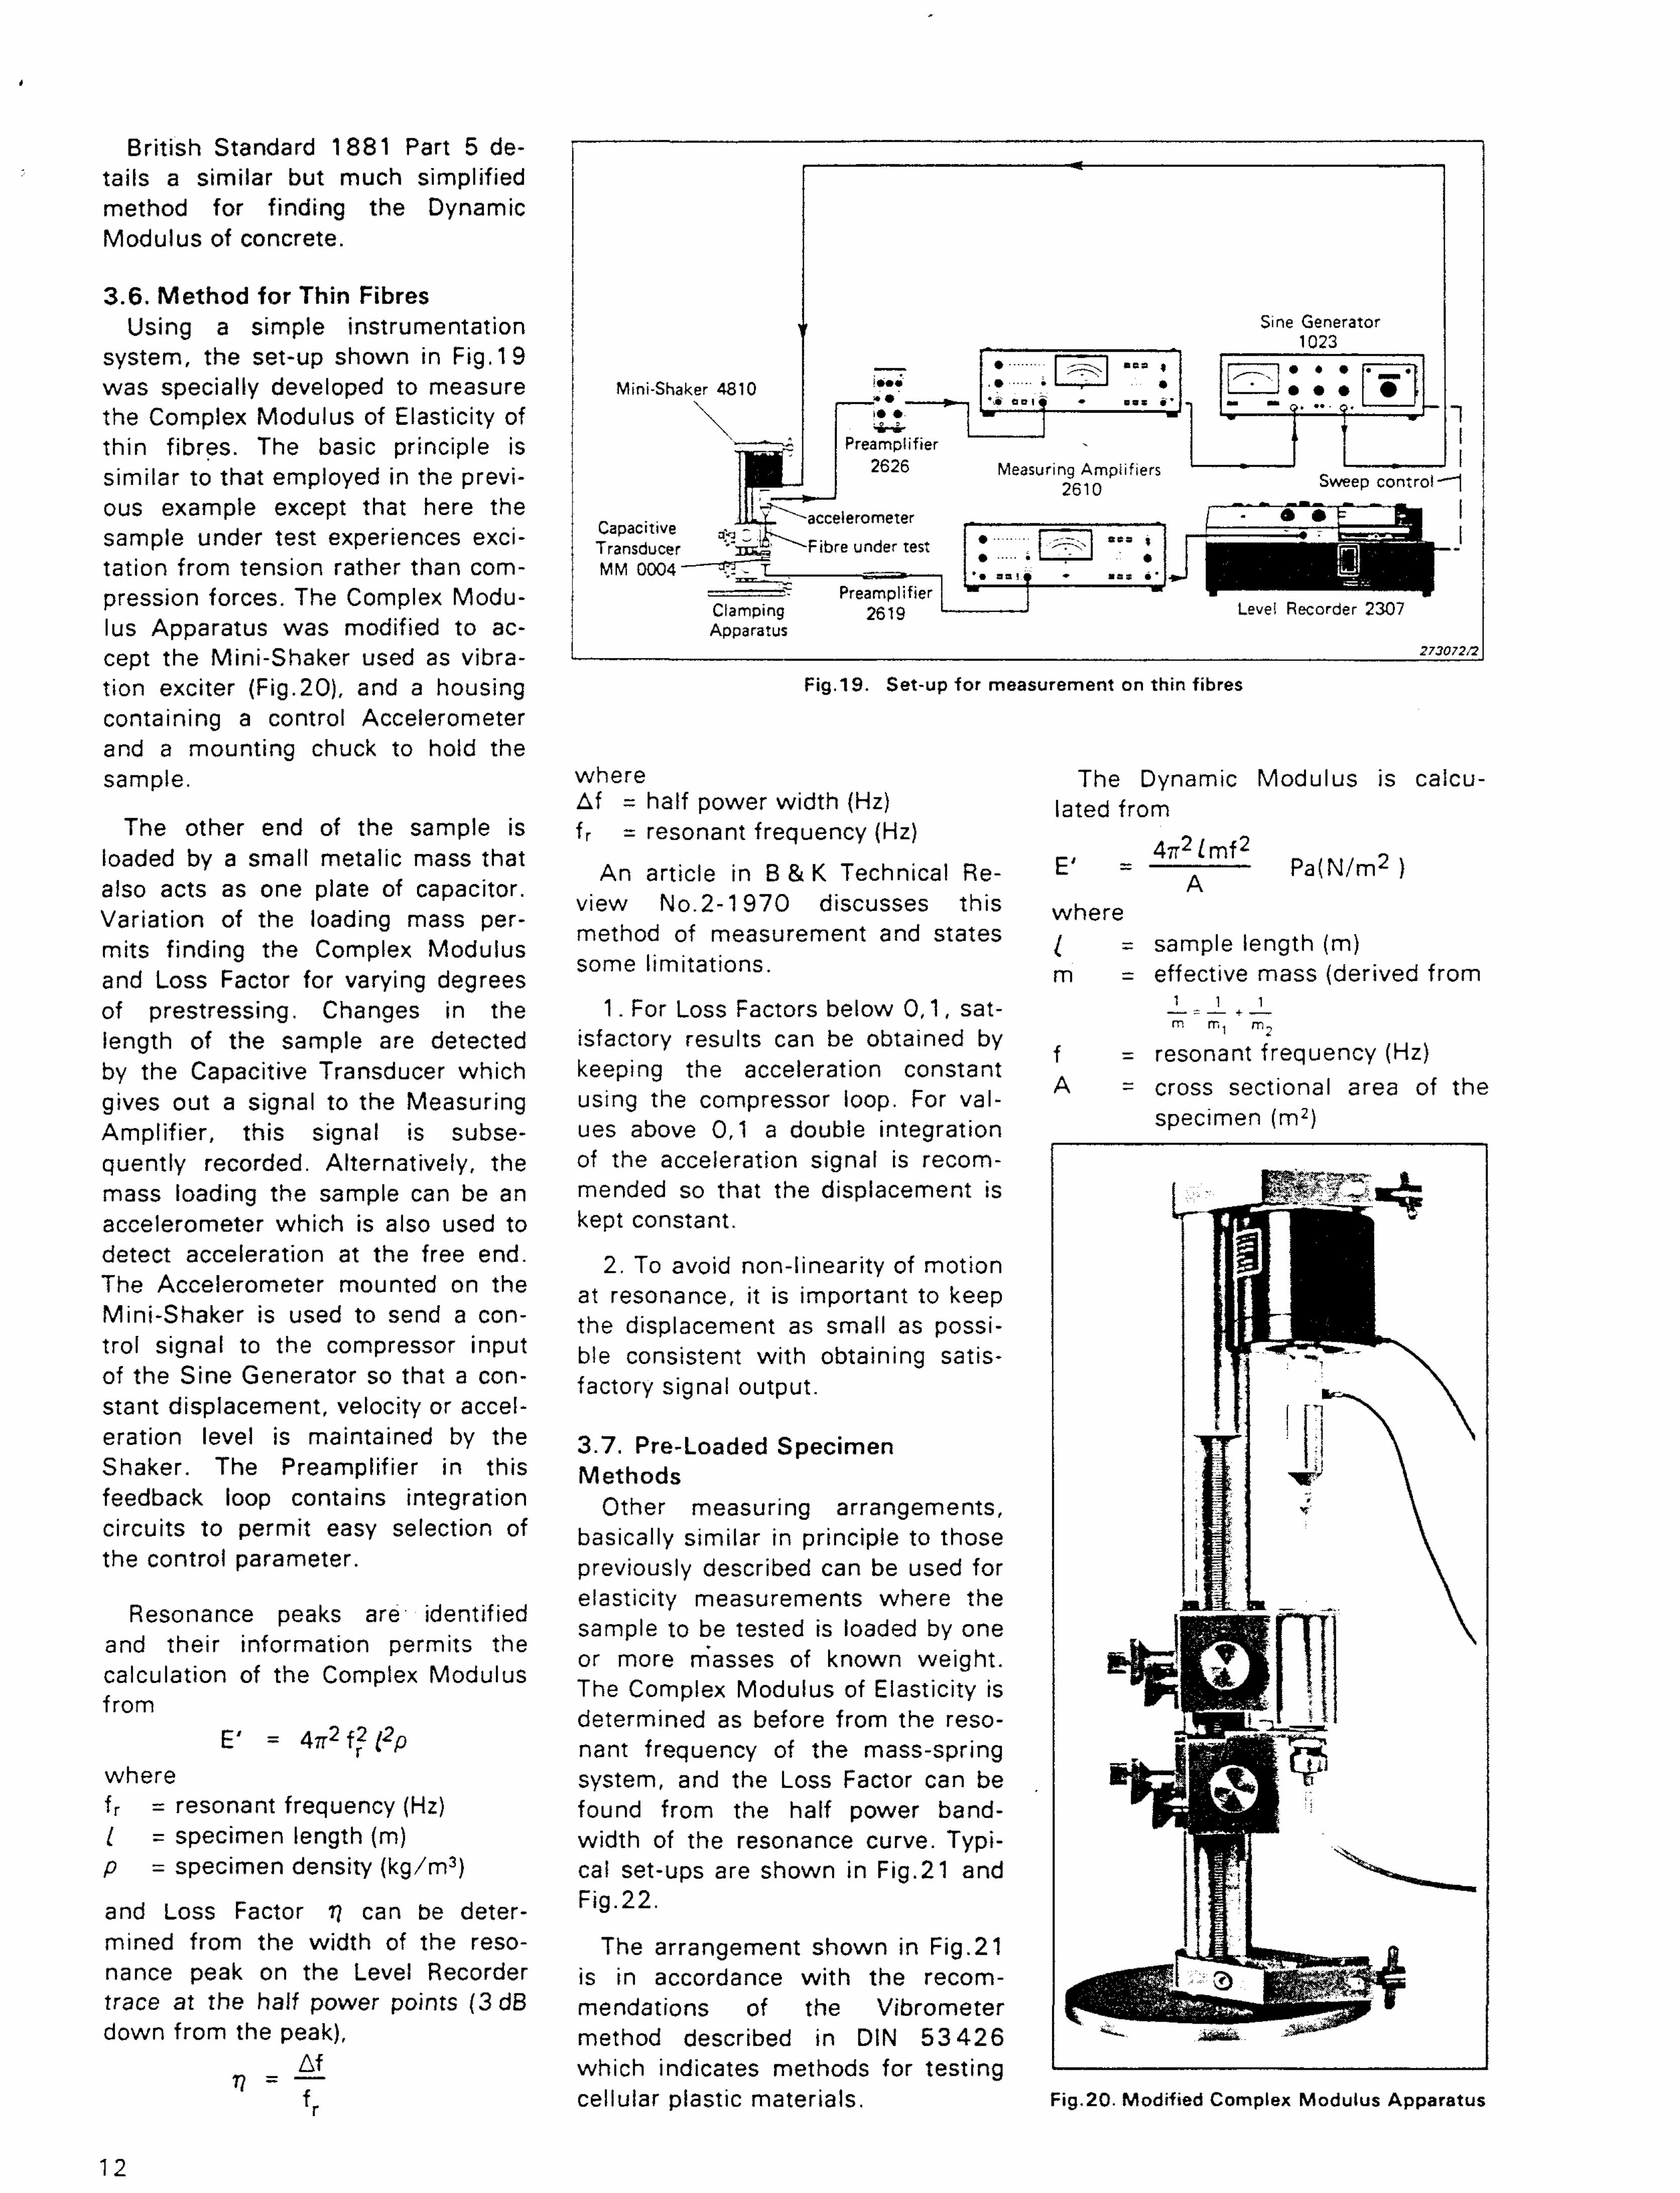
3.6. Method for Thin Fibres Using a simple instrumentation
system, the set-up shown in Fig. 19 was specially developed to measure the Complex Modulus of Elasticity of thin fibres. The basic principle is similar to that employed in the previous example except that here the sample under test experiences excitation from tension rather than compression forces. The Complex Modulus Apparatus was modified to accept the Mini-Shaker used as vibration exciter (Fig.20), and a housing containing a control Accelerometer and a mounting chuck to hold the sample.
The other end of the sample is loaded by a small metalic mass that also acts as one plate of capacitor. Variation of the loading mass permits finding the Complex Modulus and Loss Factor for varying degrees of prestressing. Changes in the length of the sample are detected by the Capacitive Transducer which gives out a signal to the Measuring Amplifier, this signal is subsequently recorded. Alternatively, the mass loading the sample can be an accelerometer which is also used to detect acceleration at the free end. The Accelerometer mounted on the Mini-Shaker is used to send a control signal to the compressor input of the Sine Generator so that a constant displacement, velocity or acceleration level is maintained by the Shaker. The Preamplifier in this feedback loop contains integration circuits to permit easy selection of the control parameter.
Resonance peaks are identified and their information permits the calculation of the Complex Modulus from
E' = 47T2fr2ft>
where fr = resonant frequency (Hz) [ = specimen length (m) p = specimen density (kg/m3)
and Loss Factor t] can be determined from the width of the resonance peak on the Level Recorder trace at the half power points (3dB down from the peak),
Af
12
Fig.19. Set-up for measurement on thin fibres
where The Dynamic Modulus is caicu-Af = half power width (Hz) l a t e d f r o m fr = resonant frequency (Hz) 0 -
Ait L mf An article in B & K Technical Re- E ' = — ^ Pa(N/m2 )
view No.2-1970 discusses this where method of measurement and states ( = s a m p , e i e n g t h ( m )
some limitations. m = effective mass (derived from 1. For Loss Factors below 0 , 1 , sat- — = — + _L
isfactory results can be obtained by r : /L1 . , , f resonant frequency Hz)
keeping the acceleration constant . «.u i r i A = cross sectional area of the
using the compressor loop. For values above 0,1 a double integration specimen (m2)
Cel lu lar p l a s t i c m a t e r i a l s . Fig.20. Modified Complex Modulus Apparatus
where Af = half power width (Hz) fr = resonant frequency (Hz)
An article in B & K Technical Review No.2-1970 discusses this method of measurement and states some limitations.
1. For Loss Factors below 0 , 1 , satisfactory results can be obtained by keeping the acceleration constant using the compressor loop. For values above 0,1 a double integration of the acceleration signal is recommended so that the displacement is kept constant.
2. To avoid non-linearity of motion at resonance, it is important to keep the displacement as small as possible consistent with obtaining satisfactory signal output.
3.7. Pre-Loaded Specimen Methods
Other measuring arrangements, basically similar in principle to those previously described can be used for elasticity measurements where the sample to be tested is loaded by one or more masses of known weight. The Complex Modulus of Elasticity is determined as before from the resonant frequency of the mass-spring system, and the Loss Factor can be found from the half power bandwidth of the resonance curve. Typical set-ups are shown in Fig.21 and Fig.22.
The arrangement shown in Fig.21 is in accordance with the recommendations of the Vibrometer method described in DIN 53 426 which indicates methods for testing cellular plastic materials.
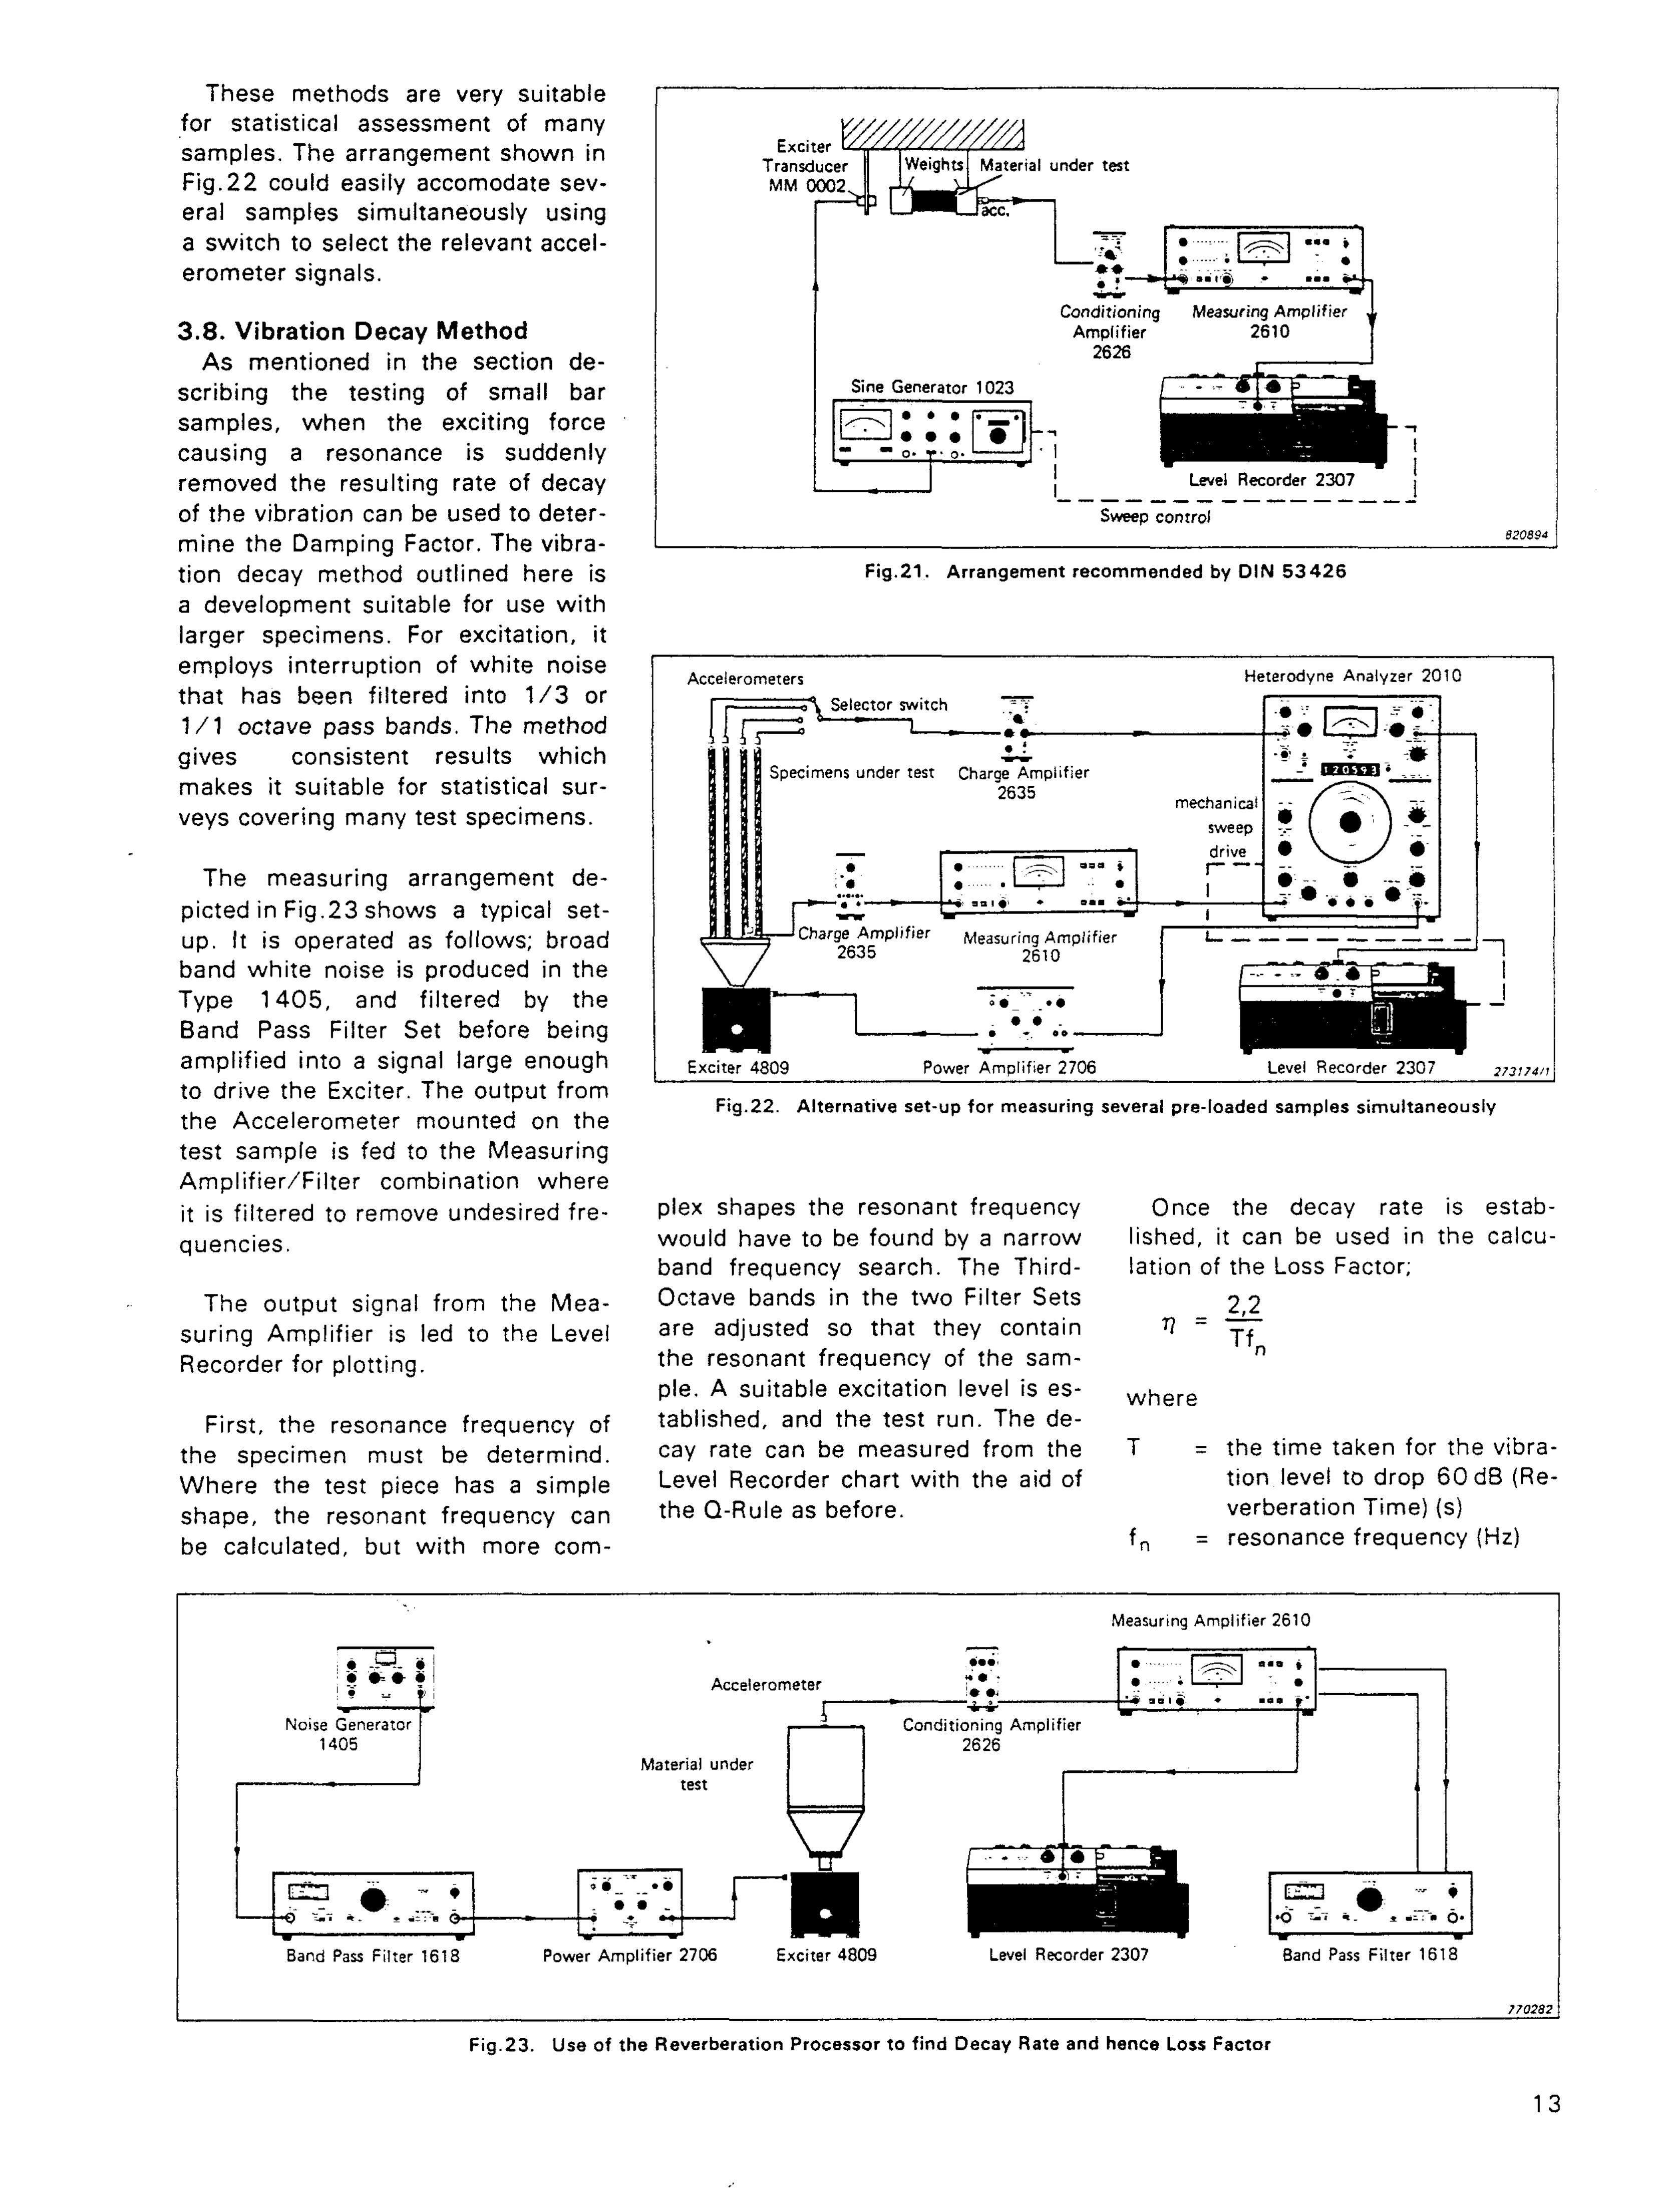
These methods are very suitable for statistical assessment of many samples. The arrangement shown in Fig.22 could easily accomodate several samples simultaneously using a switch to select the relevant accel-erometer signals.
3.8. Vibration Decay Method As mentioned in the section de
scribing the testing of small bar samples, when the exciting force causing a resonance is suddenly removed the resulting rate of decay of the vibration can be used to determine the Damping Factor. The vibration decay method outlined here is a development suitable for use with larger specimens. For excitation, it employs interruption of white noise that has been filtered into 1/3 or 1/1 octave pass bands. The method gives consistent results which makes it suitable for statistical surveys covering many test specimens.
The measuring arrangement depicted in Fig.23 shows a typical setup. It is operated as follows; broad band white noise is produced in the Type 1405, and filtered by the Band Pass Filter Set before being amplified into a signal large enough to drive the Exciter. The output from the Accelerometer mounted on the test sample is fed to the Measuring Amplif ier/Filter combination where it is filtered to remove undesired frequencies.
The output signal from the Measuring Amplifier is led to the Level Recorder for plotting.
First, the resonance frequency of the specimen must be determind. Where the test piece has a simple shape, the resonant frequency can be calculated, but with more corn-
Fig.22. Alternative set-up for measuring several pre-loaded samples simultaneously
plex shapes the resonant frequency Once the decay rate is estab-wouid have to be found by a narrow lished, it can be used in the calcu-band frequency search. The Third- lation of the Loss Factor; Octave bands in the two Filter Sets 2 2 are adjusted so that they contain V ~ "^f" the resonant frequency of the sam- n
pie. A suitable excitation level is es- where tablished, and the test run. The decay rate can be measured from the T = the time taken for the vibra-Level Recorder chart with the aid of tion level to drop 60 dB (Re-the Q-Rule as before. verberation Time) (s)
fn = resonance frequency (Hz)
Fig.21. Arrangement recommended by DIN 5 3 4 2 6
Fig.23. Use of the Reverberation Processor to f ind Decay Rate and hence Loss Factor
13

Complex Modulus Apparatus
Forced Vibration
Flexural Wave Method
Mechanical Impedance Method
Phase Measurement Method
Thin Fibres
i Pre- loaded Specimens
Vibrat ion Decay
Material to be Tested
Metal Hard Soft
Plastic Hard Foam
Homogeneous (ice) Fibre In homogeneous (cement} Rubber
C as sandwich
0 as sandwich
0
as sandwich
0 0
. 0 as sandwich
0
0 C 0
O C 0 0 0
0 o
0 o 0 0 0 0 o 0
0 0 0
O O o 0 0
o o
O 0
c o 0 c
Material to be Tested
Metal Hard Soft
Plastic Hard Foam
Homogeneous (ice) Fibre In homogeneous (cement} Rubber
C as sandwich
0 as sandwich
0
as sandwich
0 0
. 0 as sandwich
0
0 C 0
O C 0 0 0
0 o
0 o 0 0 0 0 o 0
o |
O O o 0 0
o o
O 0
c o 0 c
Material to be Tested
Metal Hard Soft
Plastic Hard Foam
Homogeneous (ice) Fibre In homogeneous (cement} Rubber
C as sandwich
0 as sandwich
0
as sandwich
0 0
. 0 as sandwich
0
0 C 0
O C 0 0 0
0 o
0 o 0 0 0 0 o 0
O O o 0 0
o o
O 0
c o 0 c
Material to be Tested
Metal Hard Soft
Plastic Hard Foam
Homogeneous (ice) Fibre In homogeneous (cement} Rubber
C as sandwich
0 as sandwich
0
as sandwich 0
0 C 0
O C 0 0 0
0 o
0 o 0 0 0 0 o 0
O O o 0 0
o o
O 0
c o 0 c
Test Sample
Bars /Rods Strip Panels 'Plates Sandwich Fibres Blocks Non std. x section
0 0 0 o 0 0
I i 0 0
0 0
0 0
0
o
0
0 o
o 0 o o
o 0
Test Sample
Bars /Rods Strip Panels 'Plates Sandwich Fibres Blocks Non std. x section
0 0 ~ 0 0 0
0 o 0 0
I
—
0
0 0
0 0
0
o
0
0 o
o 0 o o
o 0
Test Sample
Bars /Rods Strip Panels 'Plates Sandwich Fibres Blocks Non std. x section
0 0 ~ 0 0 0
0 o 0 0
0
0
0 0
0 0
0
o
0
0 o
o 0 o o
o 0
Sample Size
Large Small c
! c j o ; 0 j o
0 o o I 1 ' o
1 : c-0
Normal Loading
Bending Compression "Tension
c 0 o ; 0 0 0 0
0 o
Temperature Range
Wide Wide wi th some adaptation Room temp, oniy
I c 0 0
0 o 0 * 0 o Temperature
Range
Wide Wide wi th some adaptation Room temp, oniy
0 0 0
o 0 * 0 o Frequency Range
Wide Restricted to 1st. harmonic
0 0 0
o 0 _
0 0
0 o | o
Ease of operation
Simple to use {good for statistical use) More complicated 0
0
0
c i I '^ i
0
o 1 0 Ease of operation
Simple to use {good for statistical use) More complicated 0
0
0
i 0
o
Ease of Calculation
Simple calculation More Involved Needs computer
0 0 —
_
0 *
0 0 0
o 0 _
Ease of Calculation
Simple calculation More Involved Needs computer
0 0 —
jV Ace results 0
*
0 0 0
o 0 _
Particular References DIN 53 4 4 0
B & K Tech. Rev. No 4 -1972
B & K Tech. Rev No 4 -1971 See text See text
B & K Tech. Rev No.2-1970
DIN 53 4 2 6 —
Simitar less complicated systems than shown available
o i
0 — — 0 0 c
Previous Interest
r
Vibration Acoustic Special Instrument
c 0 0
0 O 0
c 0 0 0 0
c 0 o
Measurement of Shear Modulus G, land E) — « ~ - ^ 0 o : - 1 - 1
1 The system | particularly jquirement * **' b l e l . Capabilities and app lications of Xf >e different measuring syst ems meets this re particularly jquirement * **' b l e l . Capabilities and app lications of Xf >e different measuring syst ems
4. Conclusion Having come thus far, the reader bending test method could be used that is consistently repeatable, and
wil l now be faced with the problem when the material is a thin panel or have the possibility of measuring of deciding which of the many sys- plate loaded in bending, and a com- many samples in a short time either terns available is the correct one for pression/tension method used for simultaneously or successively. It his test requirements. Guidance can bars, rods or blocks loaded in com- could also be that the personnel en-be given in fairly general terms only pression or tension. gaged in the test work have little tech-as so many factors, some of them nicai experience so the procedures conflicting, influence the selection, The size of the sample to be tested and equipment should be as simple as but a few important areas of influ- wi l l play an important part in the possible. ence wi l l be considered in broad choice of a measuring method as . .
. . . In some cases cost is the most im-terms and some conclusions drawn. some systems have size restrictions. t „ . , , ,
. . . ,, . , portant consideration, and here it Sample size may be influenced by , . . . 4 t , i U A 4 , . . , L _i should be stated that most of the set-
The most important factor in the the frequency range to be examined ... t t . A ,. , . r , K
L L u ■ , L. ups illustrated represent a medium choice of the correct system is the or by the material type, as in the , A . . . . . . r , . . price range. In most arrangements type of material to be tested. Is it a case of concrete aggregate which . 4 i_ _. - <_ , , . , , , - simpler equipment can be used w i th homogeneous solid, for example met- necessitates a larger specimen. Fre- . . ,
La . , , _. ■ • - . , . • • ■ A some reduction in ease of operation
al, hard plastic or glass? These quency is in itself a limiting factor as , . , . . , _ . , , . . . , . . ' . . , . , . . . of degradation in the results. On
materials can be tested by any of the some methods are restricted by hav- . , , , , , . . . . . . . . . , .«_ x ■ Jb L. consideration it may be found that a
methods described here. Is it a ing to keep the forcingaiequency be- „. . , , , . , . . *u x- * -WSJ *U prospective tester already has some
material such as plastic foam or soft low the first resonancFw the sam- . . . , , , . . - , - , - . . , of the instruments at hand from pre-rubber? These can be cemented on pie. * ♦ ♦ ■ * *u * .
vious test assignments so that only a to metal strips or panels and tested , , , , , _ ^ • L • i T K 0 t«r«r.«r^ ™ ~+ k^k *k^ ~ ™ f e w 'terns need be purchased. Some as a sandwich material using a The temperature at which the sam- K
. . . , , ~i ■ ♦ k ■ -J • • * * of the test arrangements use mstru-bendmg vibration method, or they pie is to be examined is important; ,y
t , i. ^ m ; , „««. ii m *u ^ j - i ments employed more in the vibra-can be tested using the German DIN not all measuring methods are readily J, u . w-, L ^ *_ ^ * ki * u- u tion field while others use acoustic Standard Vibrometer method or the adaptable to measuring at higher
K* L- -J -i x/-u *■ r̂ +«^««r^. r«^ instrumenta11on, this could also bias Phase Method and Vibration Decay temperatures. . , . ., . ,_,. L , _, , . . . . ,.. , T L . the choice if the test establishment method. Is it a thin single fibre? This . t . . ,.
. . . I* *u * * i u * * J IS rnore interested in one line than can be tested using the arrangement IT the test sample must be tested , , A , , , , _,_. -.^ y ,. . , _, , the other. A few of the systems use for Thin Fibres. according to some standard code of ■ » . - . - j •
. . „ . specially designed instrumentat ion. practice, this could affect the measur-
What is to be the normal method ing method and to a lesser degree the The following table summarises of loading or stressing the material instrumentation used. If a statistically the forgoing observations so that the in service? The test procedure could accurate result must be obtained prospective tester can check off the employ a similar method of stressing many samples would need to be test- points that are important to his par-wherever necessary. For example a ed so the test method should be one ticular test problem.
14
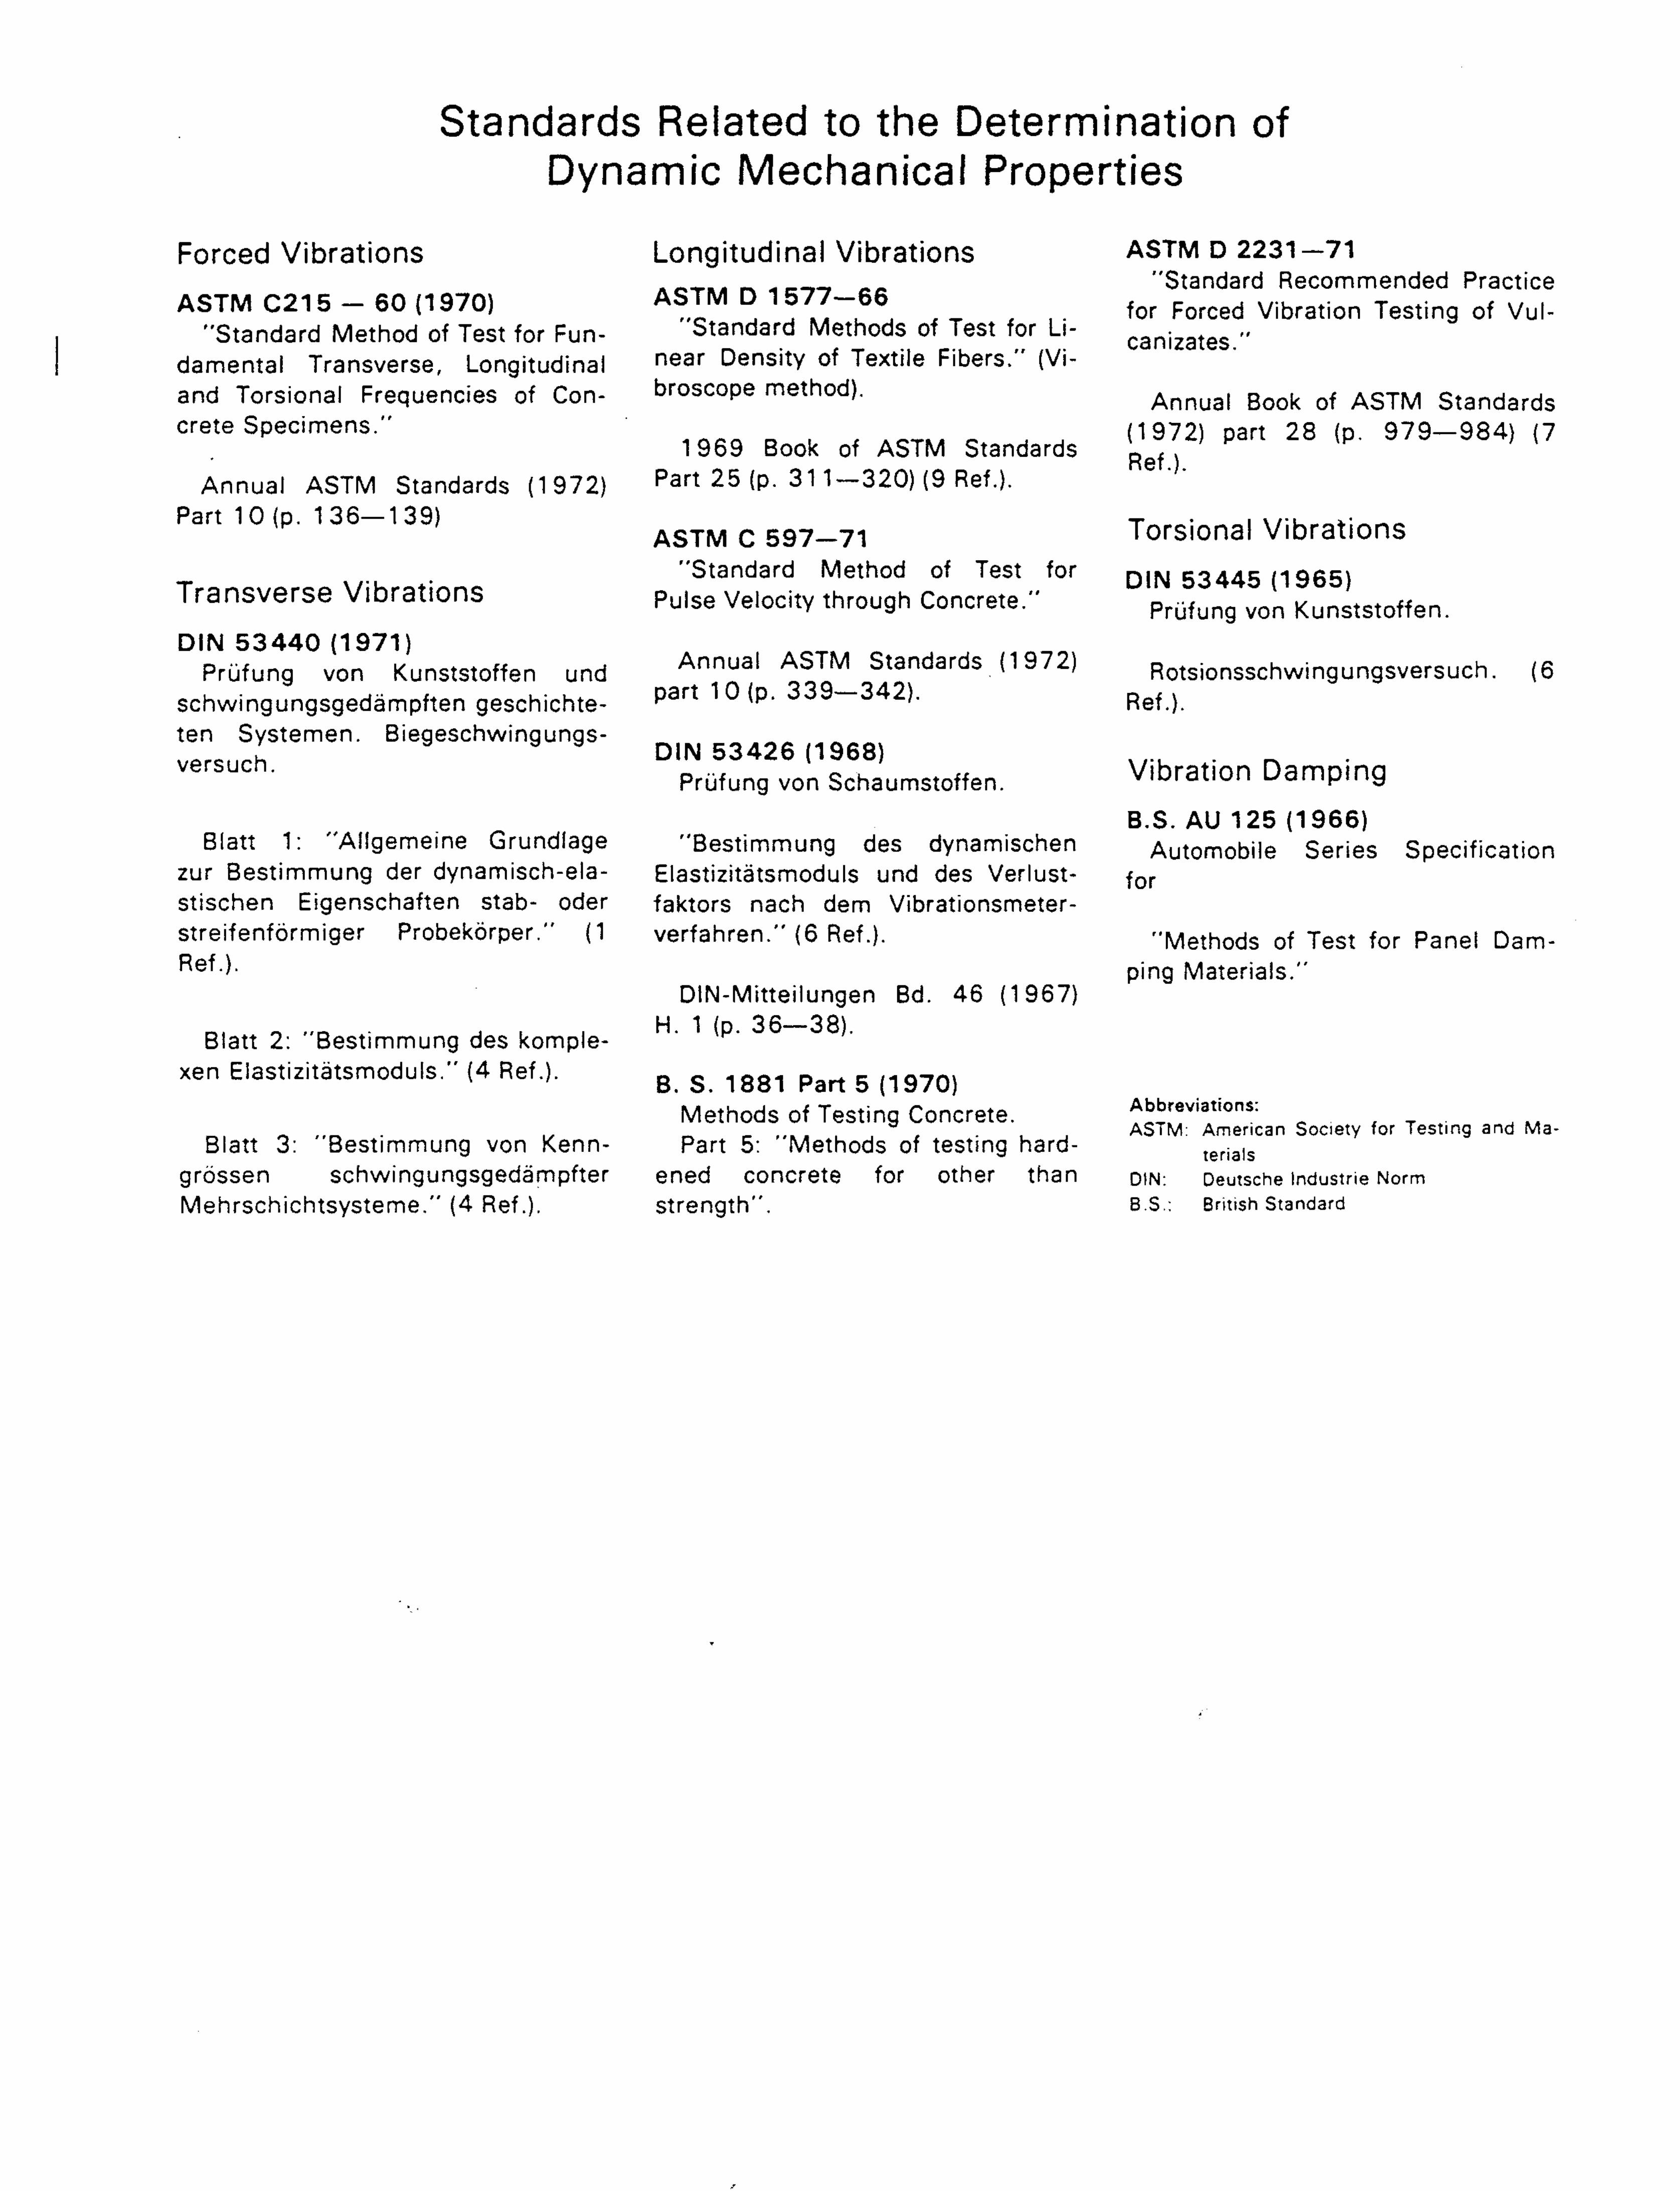
Standards Related to the Determination of Dynamic Mechanical Properties
Forced Vibrations Longitudinal Vibrations A S T M D 2231-71 »^-r»« r* 4^-,-t o/. "Standard Recommended Practice
ASTM C215 - 60 (1970) ASTM D 1 5 7 7 - 6 6 f o r F o r c e d Vibration Testing of Vul-"Standard Method of Test for Fun- Standard Methods of Test for Li- c a n i z a t e s -
damental Transverse, Longitudinal n e a r Density of Textile Fibers." (Viand Torsional Frequencies of Con- broscope method). Annual Book of ASTM Standards crete Specimens." (1972) part 28 (p. 979—984) (7
1969 Book of ASTM Standards R f ) Annual ASTM Standards (1972) Part 25 (p. 311—320) (9 Ref.).
Part 10 (D. 136—139) -r • ■ w i_ *• w } ASTM c 597-71 Torsional Vibrations
"Standard Method of Test for Q^ 53445 (1965) Transverse Vibrations Pu l se velocity through Concrete." P r 0 f u n g v o n K u n s t s t o f f e n . DIN 5 3 4 4 0 (1971)
Prufung von Kunststoffen und A n n " a l ^STM Standards (1972) Rotsionsschwingungsversuch. (6 schwingungsgedampften geschichte- p a r t 1 ° ( p * 3 3 9 3 4 2 ) " Ref.). ten Systemen. Biegeschwingungs-l f t r e i l i y y DIN 5 3 4 2 6 (1968) v e r s u c h ' Prufung von Schaumstoffen. Vibration Damping
B.S. AU 125 (1966) Blatt 1: "Allgememe Grundlage "Bestimmung des dynamischen Automobile Series Specification
zur Bestimmung der dynamisch-ela- Elastizitatsmoduls und des Verlust- for
stischen Eigenschaften stab- oder faktors nach dem Vibrationsmeter-streifenformiger Probekorper." (1 verfahren." (6 Ref.). "Methods of Test for Pane! Dam-R e f -)- ping Materials."
DIN-Mitteilungen Bd. 46 (1967) n i n „ n . , , , H. 1 (p. 36—38). Blatt 2: Bestimmung des komple-
xen Elastizitatsmoduls." (4 Ref.). g g 1 8 g l p a n g ( 1 9 7 Q )
Methods of Testing Concrete. Abbreviations: ~ ,,„ ., ^ , - , . * . L J * L _. ASTM: American Society for Testing and Ma-
Blatt 3: Bestimmung von Kenn- Part 5: Methods of testing hard- teriais grossen schwingungsgedampfter ened concrete for other than DIN: Deutscne Industrie Norm Mehrschichtsysteme." (4 Ref.). strength". B.S.: British Standard