MEASUREMENT - Abdul Latif Jameel Poverty Action Lab · Students like chocolate Participants eat...
48
MEASUREMENT Martin Abel J-PAL Africa Executive Education 18-22 January 2016
Transcript of MEASUREMENT - Abdul Latif Jameel Poverty Action Lab · Students like chocolate Participants eat...

MEASUREMENT Martin Abel J-PAL Africa Executive Education 18-22 January 2016

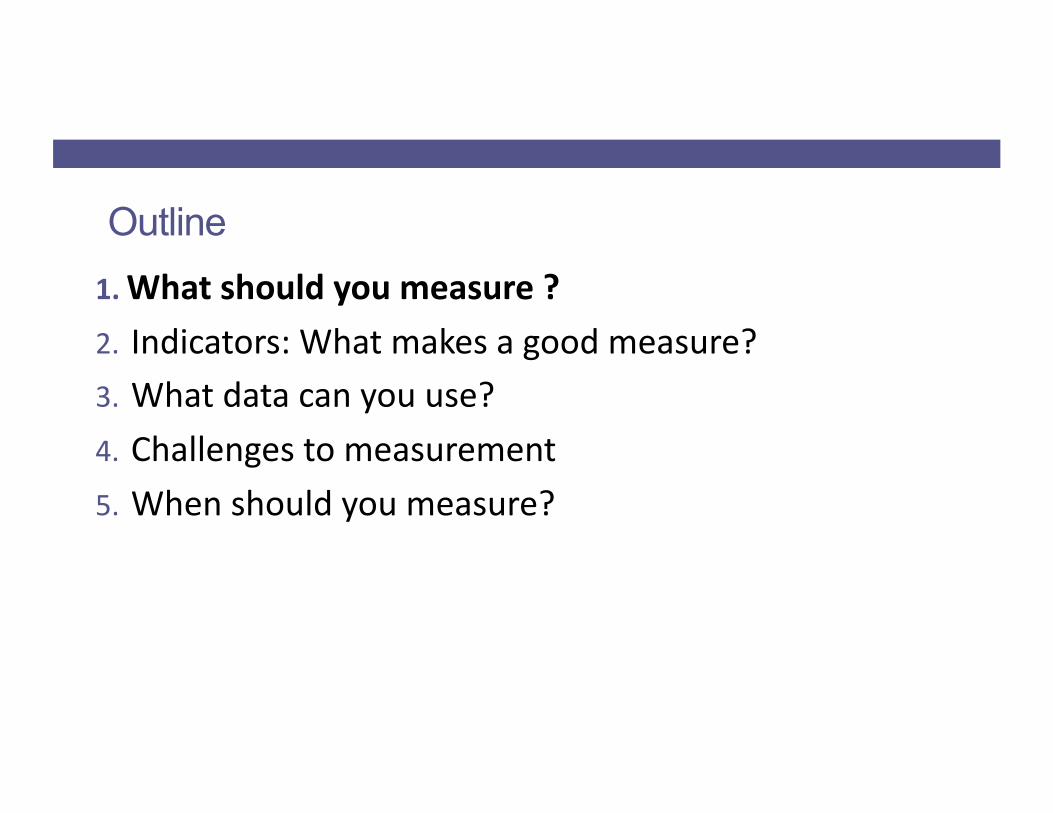
Outline 1. What should you measure ?
2. Indicators: What makes a good measure? 3. What data can you use?
4. Challenges to measurement
5. When should you measure?
Students like
chocolate
Participants eat chocolates
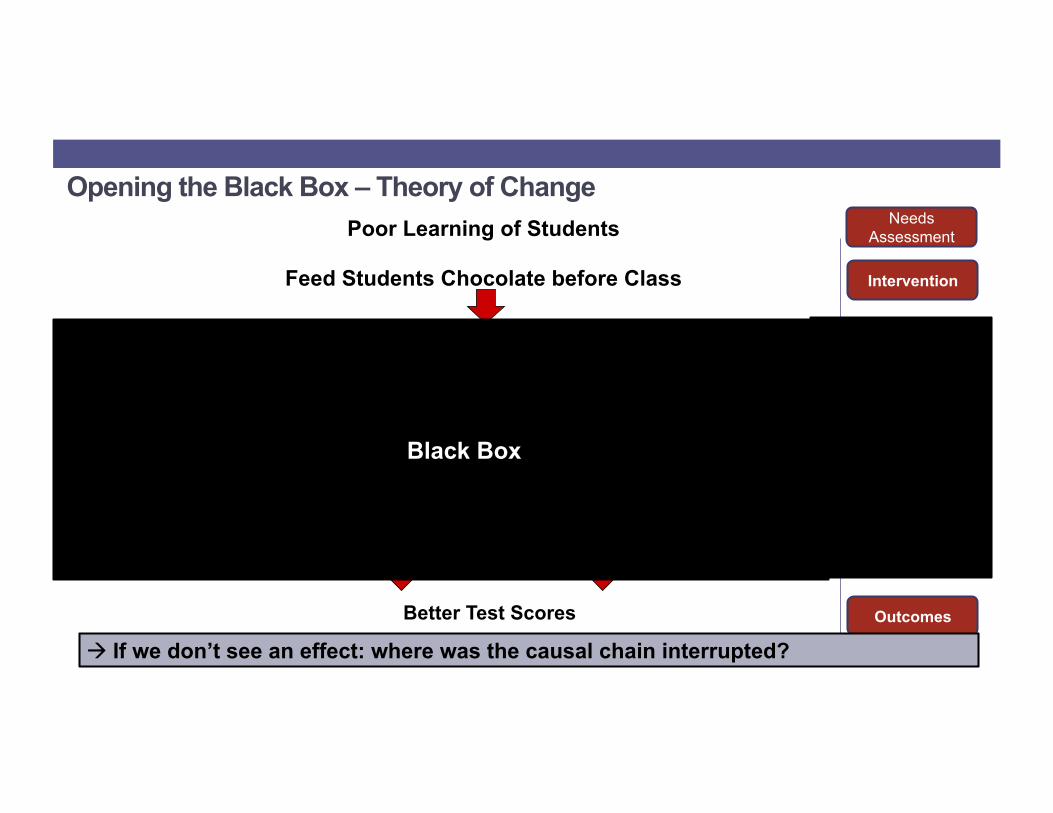
Opening the Black Box – Theory of Change
Feed Students Chocolate before Class
Participants are more motivated
Less focused in class
Intervention
Inputs
Intermediary outcomes
Outcomes
Assumptions
Better Test Scores
Outputs
Participants are distracted
More focused in class
Chocolates given to students
Needs Assessment Poor Learning of Students
Black Box
! If we don’t see an effect: where was the causal chain interrupted?
Outline 1. What should you measure ?
2. Indicators: What makes a good measure? 3. What data can you use?
4. Challenges to measurement
5. When should you measure?

Theory of Change (ToC)
• Definition: • A theory of change is a description of how an intervention is supposed to
deliver the desired results.
• ToC • sets out the causal logic of how and why a particular project, program, or
policy will reach its intended outcomes. • depicts the sequence of events leading to these outcomes; explores the
assumptions needed for these changes to take place.
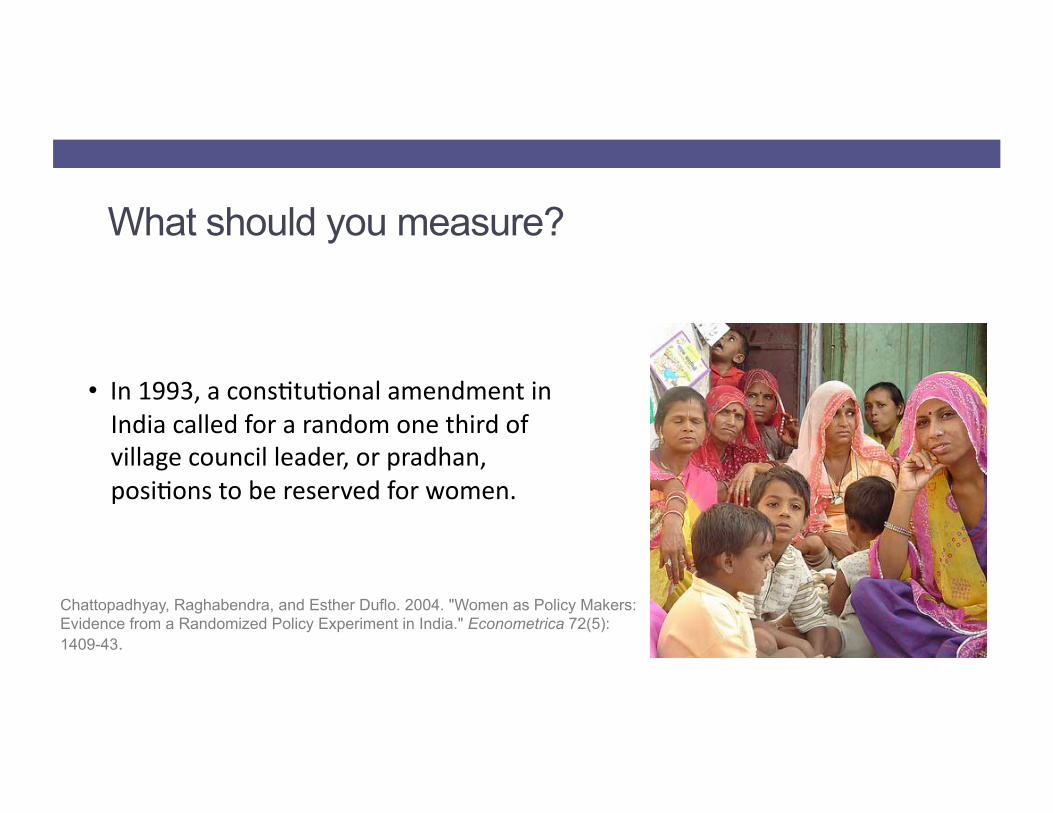
What should you measure?
• In 1993, a cons@tu@onal amendment in India called for a random one third of village council leader, or pradhan, posi@ons to be reserved for women.
Chattopadhyay, Raghabendra, and Esther Duflo. 2004. "Women as Policy Makers: Evidence from a Randomized Policy Experiment in India." Econometrica 72(5): 1409-43.
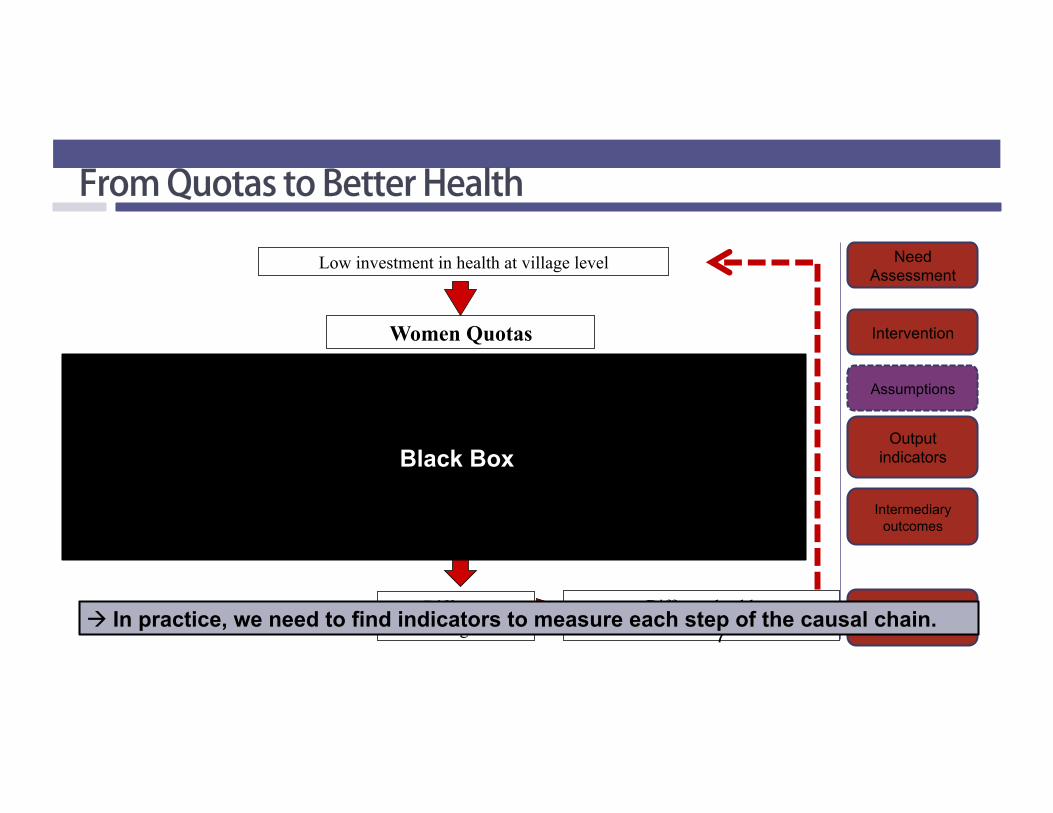
From Quotas to Better Health
Women Quotas
Village council has actual decision power
More women Village council
Women are empowered Women have different preferences
Different Public goods
Different health outcomes? 7
Need Assessment
Intervention
Output indicators
Intermediary outcomes
Outcomes
Assumptions
Low investment in health at village level
Women can express own preferences
Black Box
! In practice, we need to find indicators to measure each step of the causal chain.
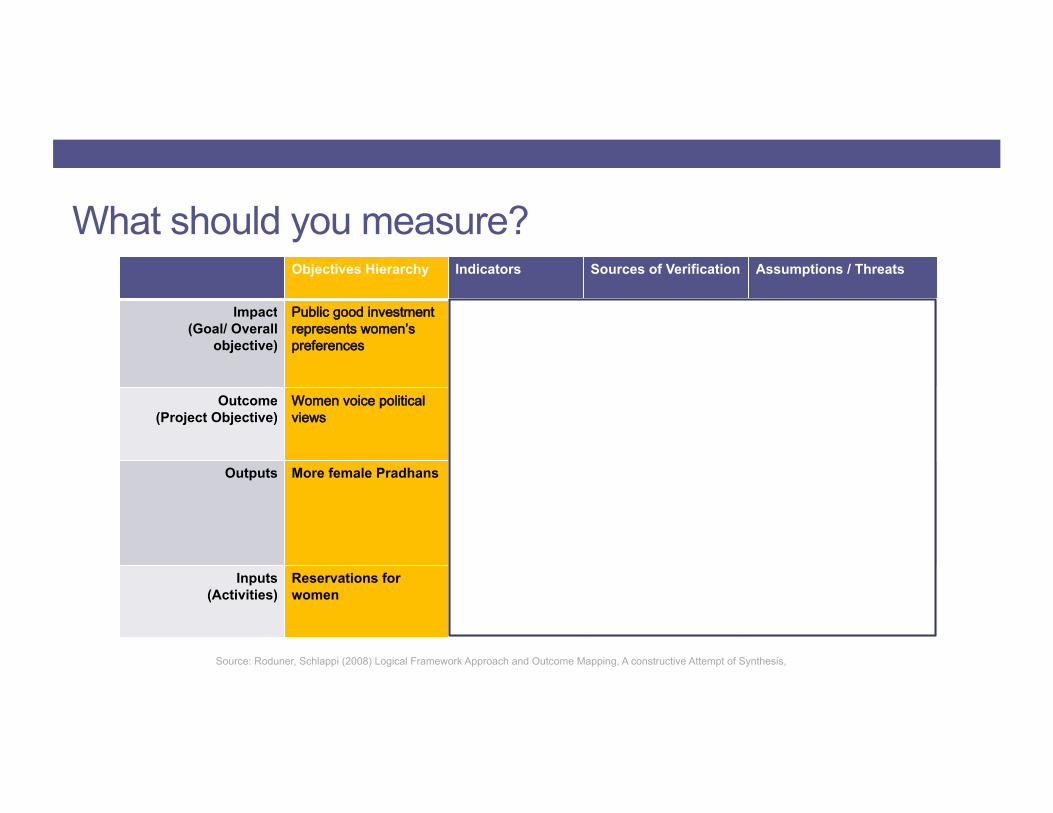
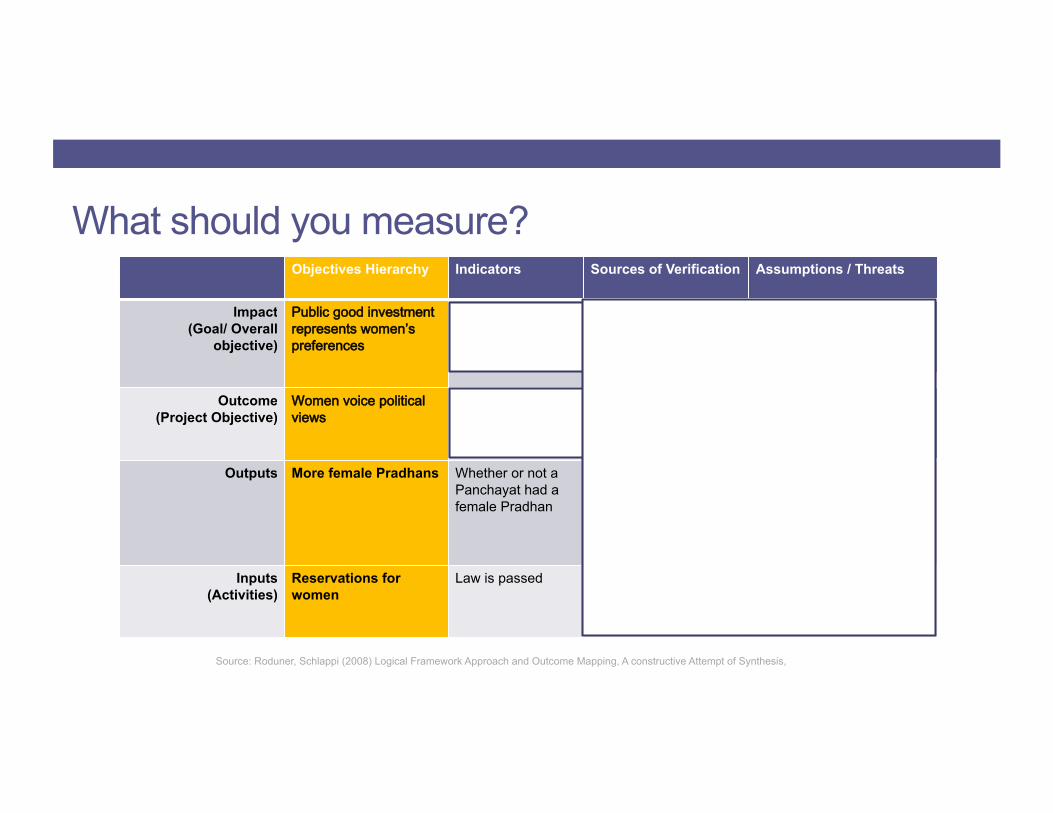
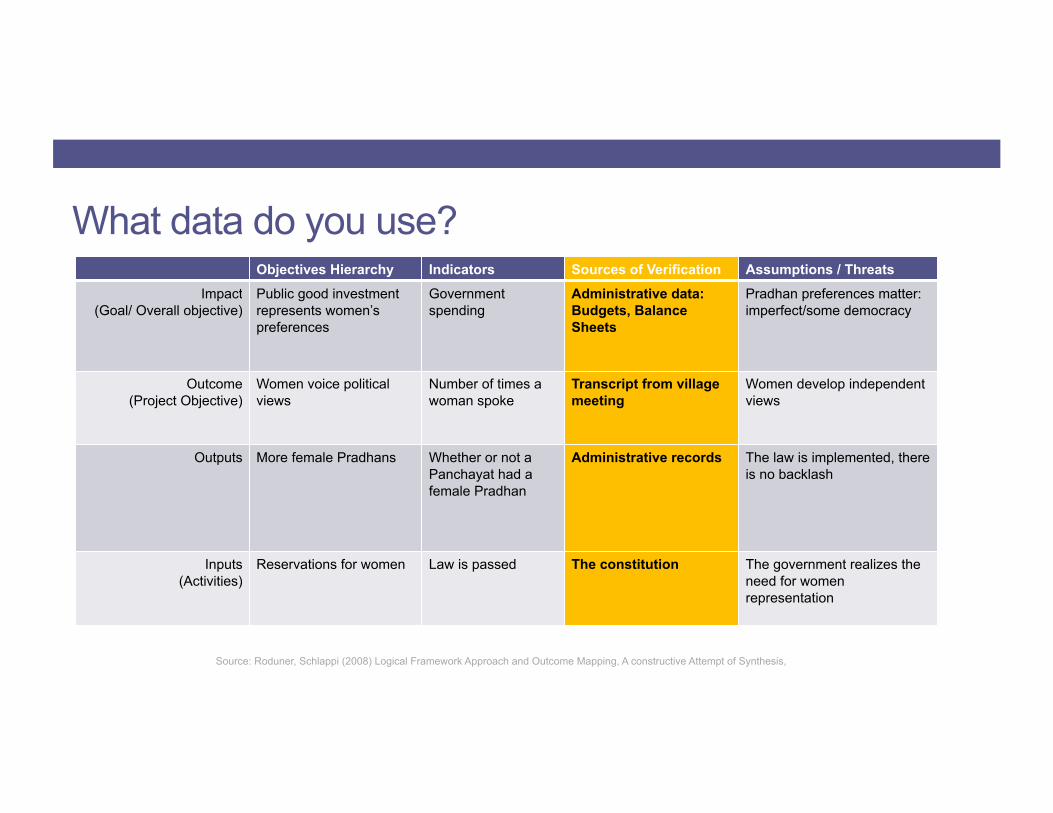
Source: Roduner, Schlappi (2008) Logical Framework Approach and Outcome Mapping, A constructive Attempt of Synthesis,
Objectives Hierarchy Indicators Sources of Verification Assumptions / Threats
Impact (Goal/ Overall
objective)
Public good investment represents women’s preferences
Government spending
Administrative data: Budgets, Balance Sheets
Pradhan preferences matter: imperfect/some democracy
Outcome (Project Objective)
Women voice political views
Number of times a woman spoke
Transcript from village meeting
Women develop independent views
Outputs More female Pradhans Whether or not a Panchayat had a female Pradhan
Administrative records The law is implemented, there is no backlash
Inputs (Activities)
Reservations for women
Law is passed The constitution The government realizes the need for women representation
What should you measure?
Outline 1. What should you measure ?
2. Indicators: What makes a good measure? 3. What data can you use?
4. Challenges to measurement
5. When should you measure?
Source: Roduner, Schlappi (2008) Logical Framework Approach and Outcome Mapping, A constructive Attempt of Synthesis,
Objectives Hierarchy Indicators Sources of Verification Assumptions / Threats
Impact (Goal/ Overall
objective)
Public good investment represents women’s preferences
Government spending
Administrative data: Budgets, Balance Sheets
Pradhan preferences matter: imperfect/some democracy
Outcome (Project Objective)
Women voice political views
Number of times a woman spoke
Transcript from village meeting
Women develop independent views
Outputs More female Pradhans Whether or not a Panchayat had a female Pradhan
Administrative records The law is implemented, there is no backlash
Inputs (Activities)
Reservations for women
Law is passed The constitution The government realizes the need for women representation
What should you measure?
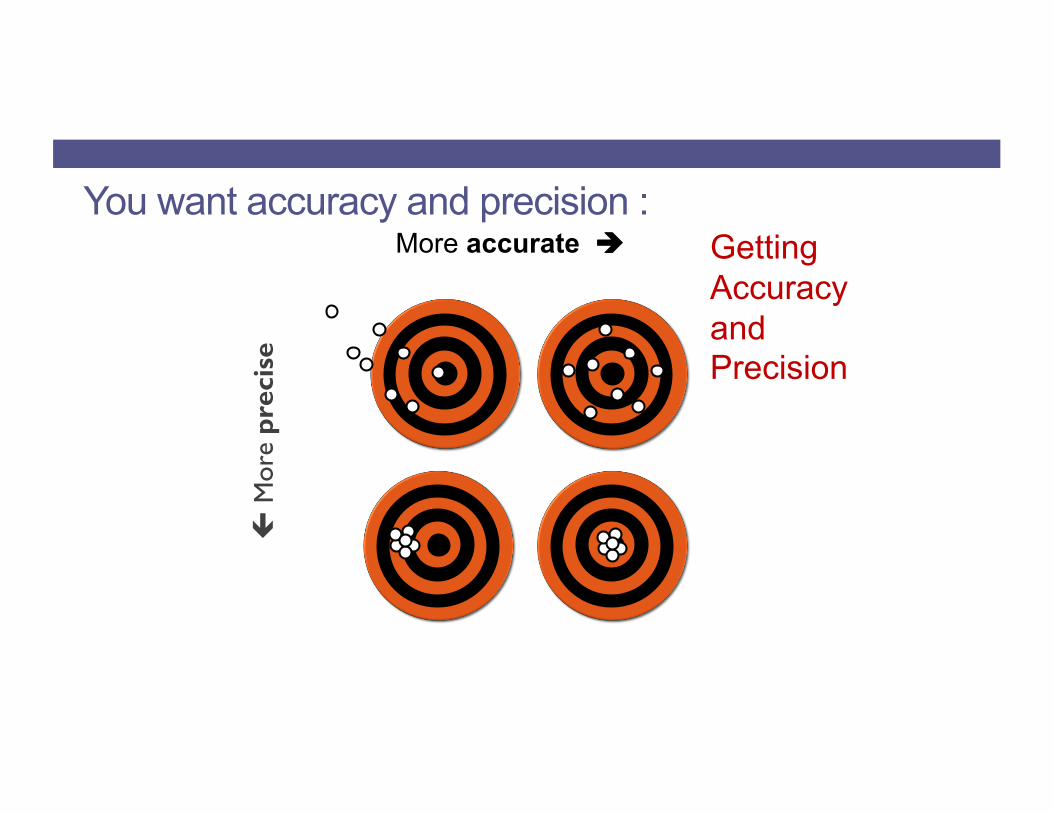
More accurate ! "
Mor
e pr
ecis
e
You want accuracy and precision : Getting Accuracy and Precision
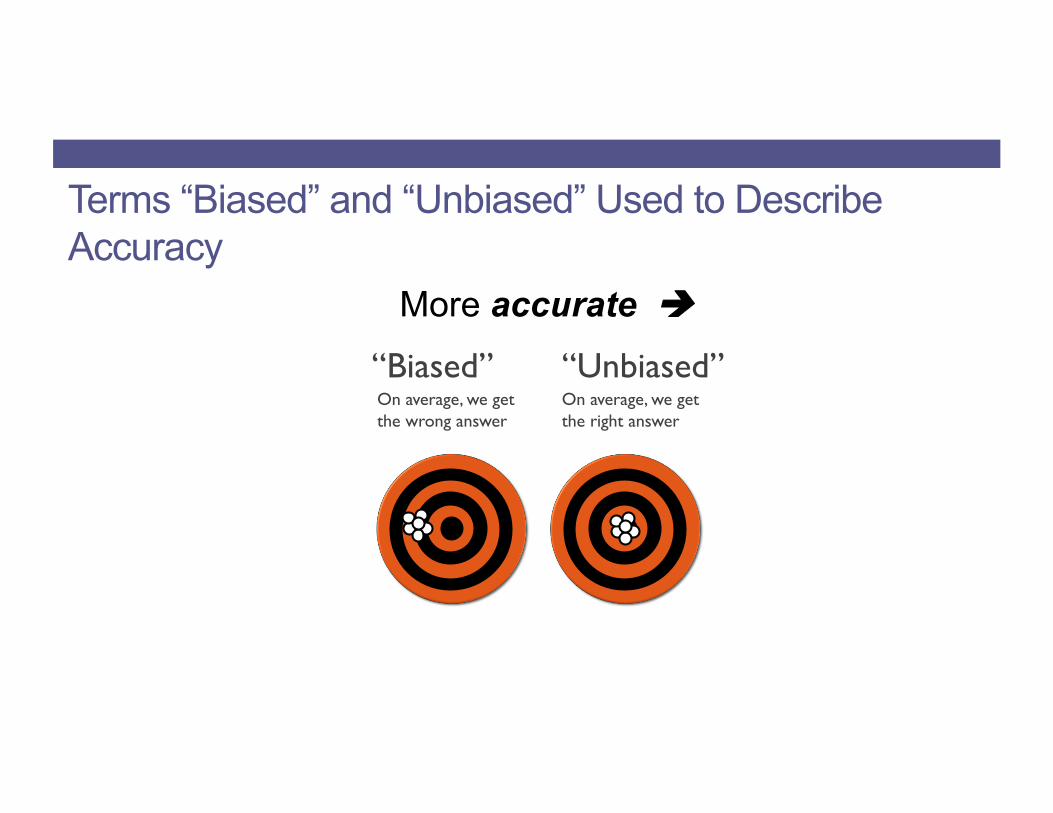
More accurate ! “Biased” “Unbiased”
On average, we get the wrong answer
On average, we get the right answer
Terms “Biased” and “Unbiased” Used to Describe Accuracy
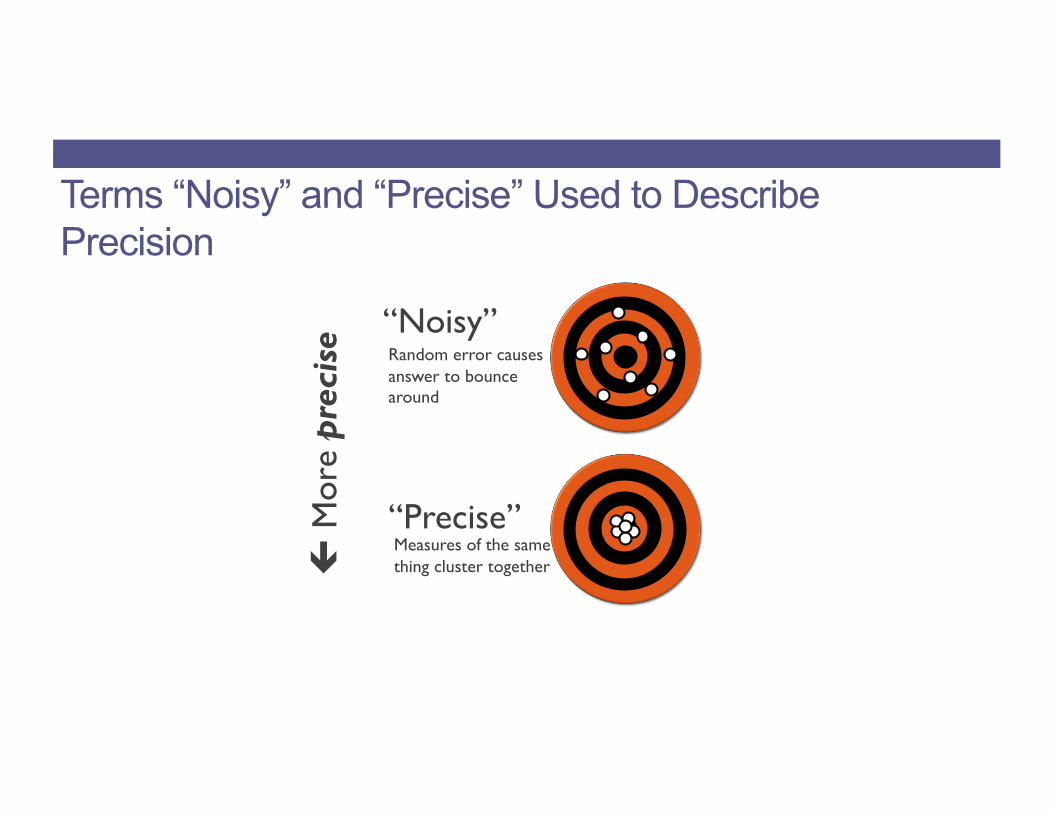
" M
ore
prec
ise “Noisy”
“Precise”
Random error causes answer to bounce around
Measures of the same thing cluster together
Terms “Noisy” and “Precise” Used to Describe Precision
• In theory: • How well does the indicator map to the outcome? (e.g. intelligence ! IQ tests)
• In prac;ce: Are you geKng unbiased answers?
• Social desirability bias (response bias)
• Anchoring bias (Strack and Mussweiler, 1997)
• Framing effect
• Given that violence against women is a problem, should we impose nighKme
curfews?
Accuracy
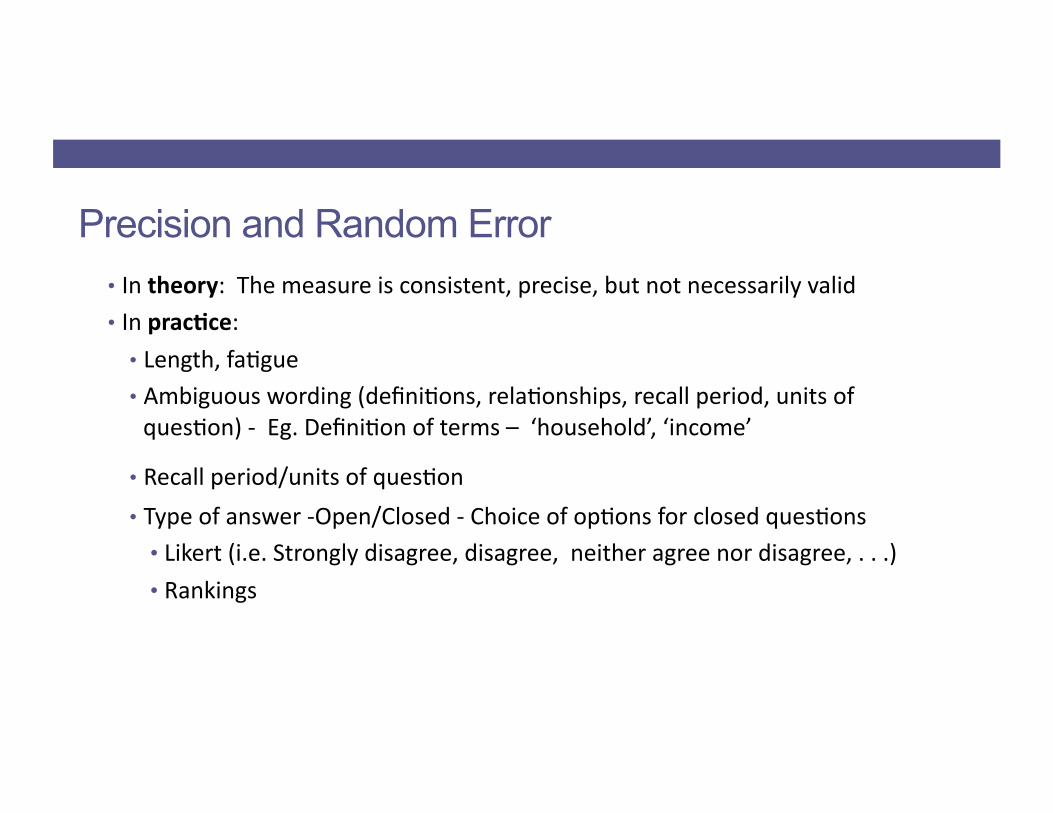
• In theory: The measure is consistent, precise, but not necessarily valid • In prac;ce:
• Length, fa@gue • Ambiguous wording (defini@ons, rela@onships, recall period, units of ques@on) -‐ Eg. Defini@on of terms – ‘household’, ‘income’
• Recall period/units of ques@on
• Type of answer -‐Open/Closed -‐ Choice of op@ons for closed ques@ons • Likert (i.e. Strongly disagree, disagree, neither agree nor disagree, . . .) • Rankings
Precision and Random Error
Outline 1. What should you measure ?
2. Indicators: What makes a good measure? 3. What data can you use?
4. Challenges to measurement
5. When should you measure?
Source: Roduner, Schlappi (2008) Logical Framework Approach and Outcome Mapping, A constructive Attempt of Synthesis,
Objectives Hierarchy Indicators Sources of Verification Assumptions / Threats
Impact (Goal/ Overall objective)
Public good investment represents women’s preferences
Government spending
Administrative data: Budgets, Balance Sheets
Pradhan preferences matter: imperfect/some democracy
Outcome (Project Objective)
Women voice political views
Number of times a woman spoke
Transcript from village meeting
Women develop independent views
Outputs More female Pradhans Whether or not a Panchayat had a female Pradhan
Administrative records The law is implemented, there is no backlash
Inputs (Activities)
Reservations for women Law is passed The constitution The government realizes the need for women representation
What data do you use?
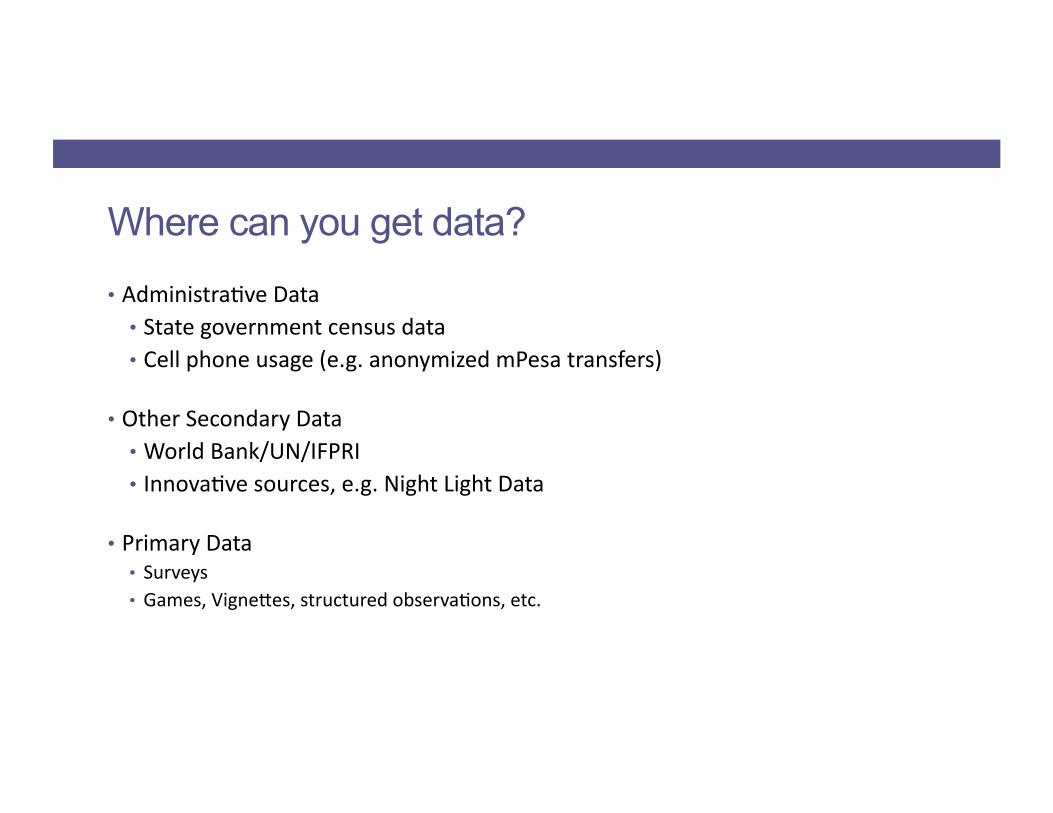
Where can you get data?
• Administra@ve Data • State government census data • Cell phone usage (e.g. anonymized mPesa transfers)
• Other Secondary Data • World Bank/UN/IFPRI • Innova@ve sources, e.g. Night Light Data
• Primary Data • Surveys • Games, Vigneees, structured observa@ons, etc.

Administrative Data
West Bengal Rajasthan
Issue Investment Issue Reserved Issue Reserved
W M Investment W M Investment
Drinking Water # facilities 31% 17% 9.09 54% 49% 2.62
Road Improvement
Road Condition (0-1) 31% 25% 0.18 13% 23% -0.08
Irrigation # facilities 4% 20% -0.38 2% 4% -0.02
Education Informal education center 6% 12% -0.06 5% 13%
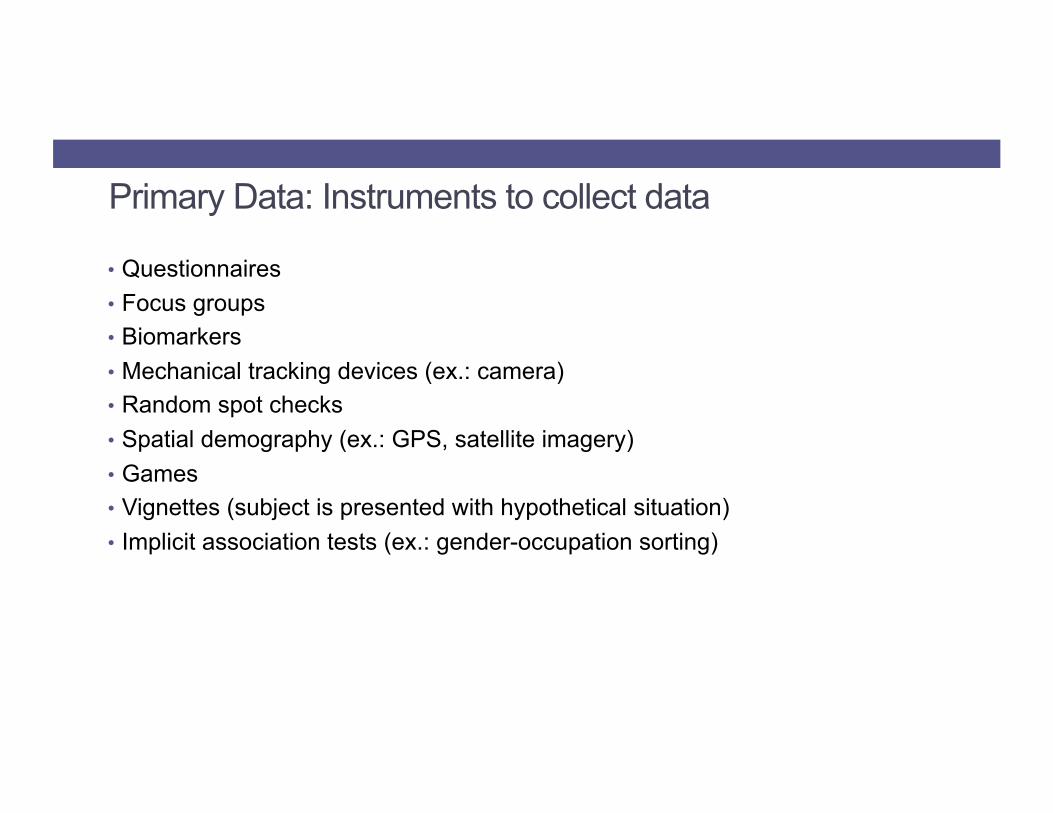
Primary Data: Instruments to collect data
• Questionnaires • Focus groups • Biomarkers • Mechanical tracking devices (ex.: camera) • Random spot checks • Spatial demography (ex.: GPS, satellite imagery) • Games • Vignettes (subject is presented with hypothetical situation) • Implicit association tests (ex.: gender-occupation sorting)
Primary Data: Survey Creation
• SMURF Criteria
• Specific – asks one ques@on at a @me
• Measurable – quan@fies accurate and unbiased informa@on
• Understandable – easy to comprehend and clearly defined
• Relevant – measure a key or intermediate outcome • Framed – has boundaries, e.g. @me frame
Instruments (I) • Questionnaires
• Captures information from an individual • Can be
• Cross-sectional: snap shot in time • Panel: change over time, common in RCTs
• Focus group discussions • Interview with more than one individual at a time • Advantages?
• Random spot checks • Some information can’t easily be collected through baseline or endline questionnaire
• Eg. Corruption, teacher attendance , discrimination, service delivery
• What types of spot checks might be used?
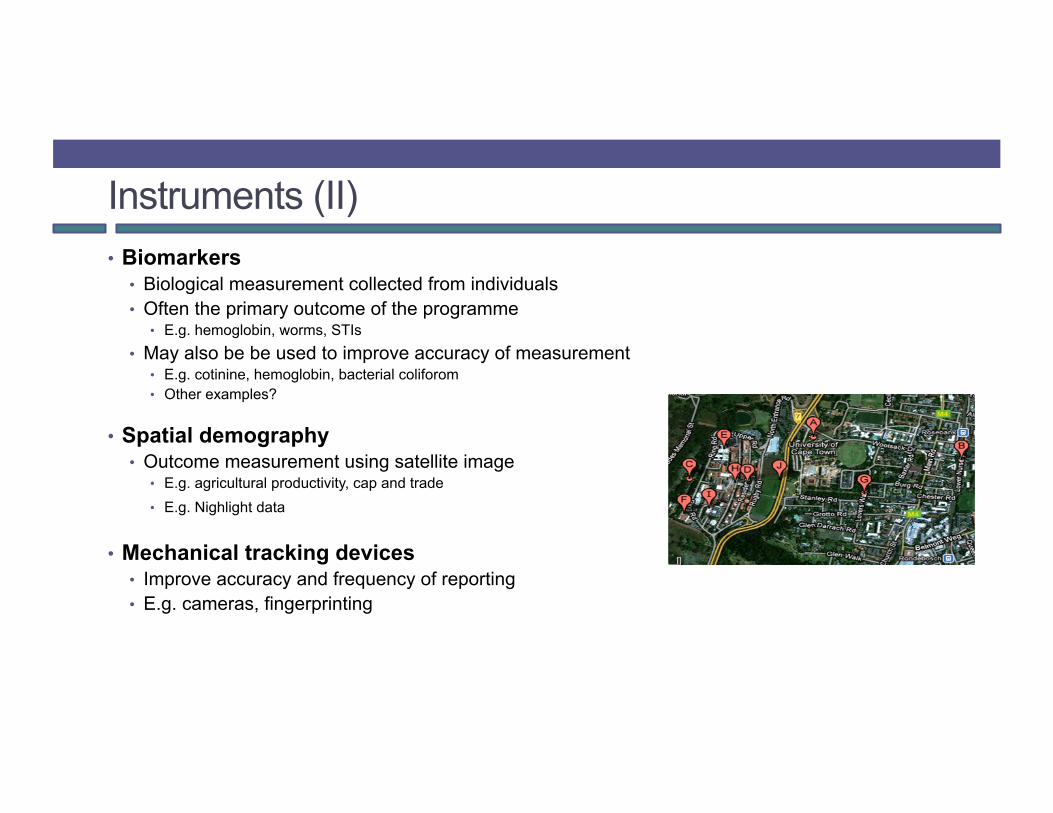
Instruments (II) • Biomarkers
• Biological measurement collected from individuals • Often the primary outcome of the programme
• E.g. hemoglobin, worms, STIs • May also be be used to improve accuracy of measurement
• E.g. cotinine, hemoglobin, bacterial coliforom • Other examples?
• Spatial demography • Outcome measurement using satellite image
• E.g. agricultural productivity, cap and trade • E.g. Nighlight data
• Mechanical tracking devices • Improve accuracy and frequency of reporting • E.g. cameras, fingerprinting
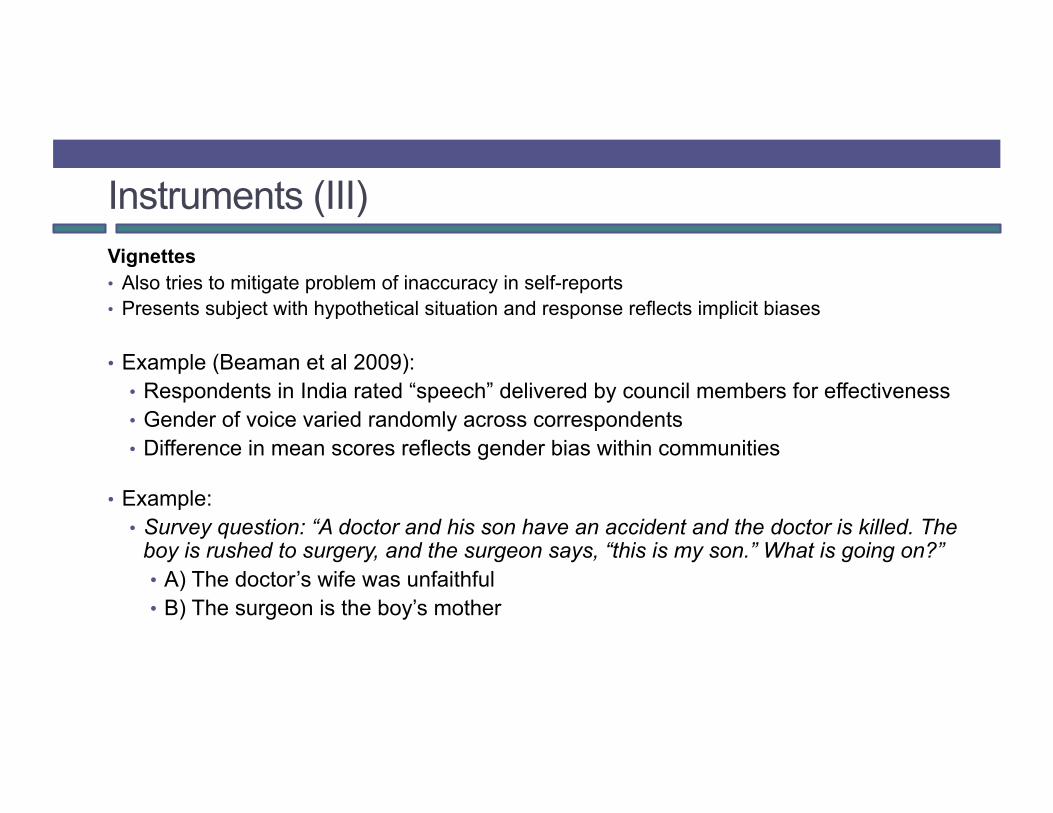
Instruments (III) Vignettes • Also tries to mitigate problem of inaccuracy in self-reports • Presents subject with hypothetical situation and response reflects implicit biases
• Example (Beaman et al 2009): • Respondents in India rated “speech” delivered by council members for effectiveness • Gender of voice varied randomly across correspondents • Difference in mean scores reflects gender bias within communities
• Example: • Survey question: “A doctor and his son have an accident and the doctor is killed. The
boy is rushed to surgery, and the surgeon says, “this is my son.” What is going on?” • A) The doctor’s wife was unfaithful • B) The surgeon is the boy’s mother
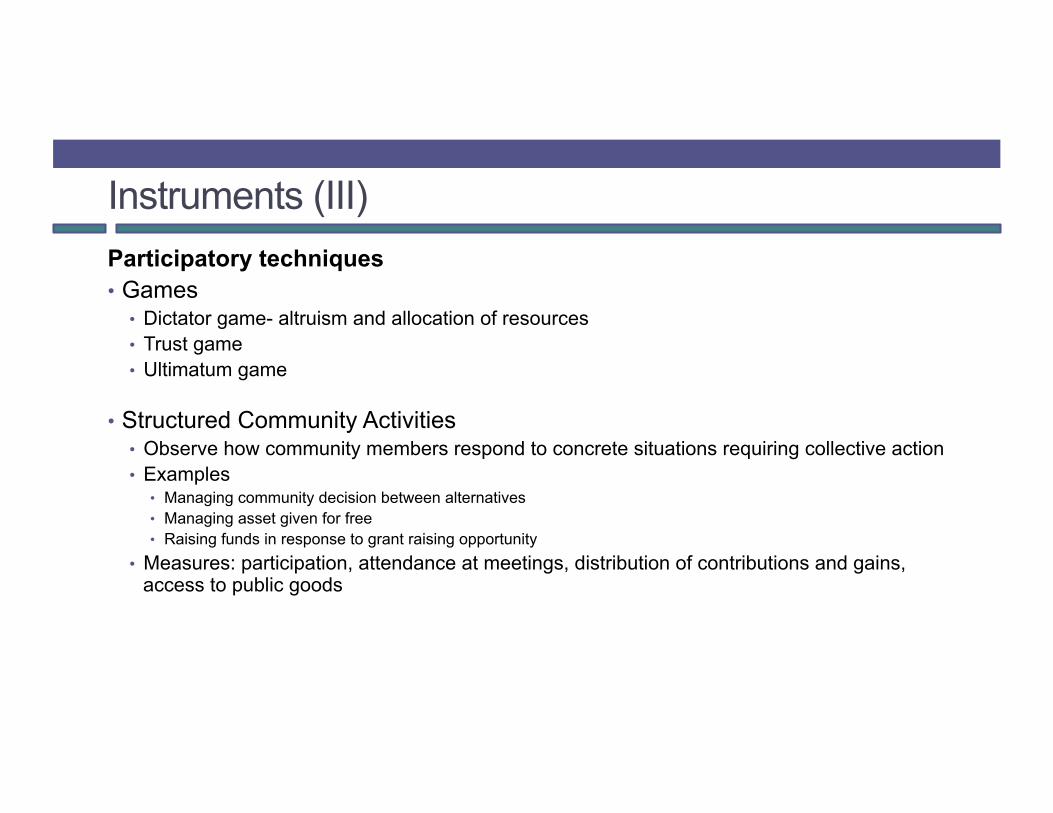
Instruments (III) Participatory techniques • Games
• Dictator game- altruism and allocation of resources • Trust game • Ultimatum game
• Structured Community Activities • Observe how community members respond to concrete situations requiring collective action • Examples
• Managing community decision between alternatives • Managing asset given for free • Raising funds in response to grant raising opportunity
• Measures: participation, attendance at meetings, distribution of contributions and gains, access to public goods
Data Collection Considerations • Ethics • Compliance • Respondent fa@gue • Quality control • Surveyor training • Surveyor (gender) composi@on
• Human subjects • Data Security • Electronic v paper • Costs

Outline 1. What should you measure ?
2. Indicators: What makes a good measure? 3. What data can you use?
4. Challenges to measurement
5. When should you measure?
(1) Things people do not know very well
(2) Things people do not want to talk about
(3) Abstract concepts
(4) Things that are not (always) directly observable
Things that are hard to measure
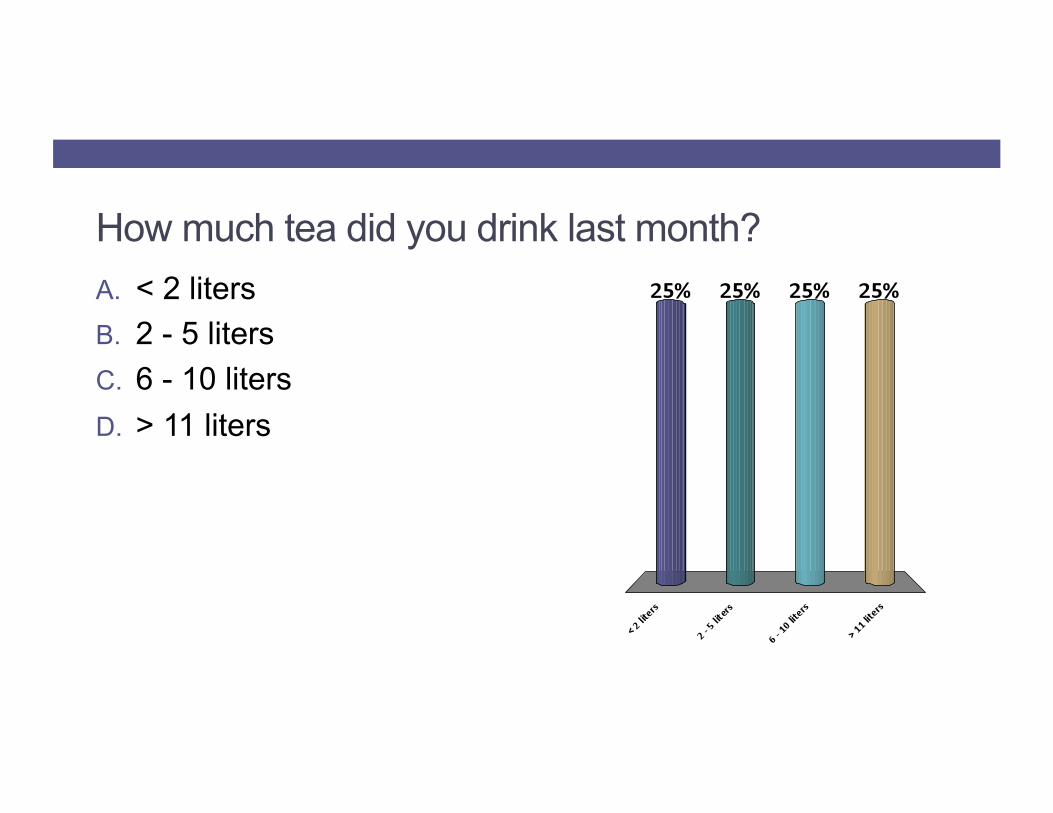
How much tea did you drink last month? A. < 2 liters B. 2 - 5 liters C. 6 - 10 liters D. > 11 liters
# What: Anything to es@mate, par@cularly across @me. Prone to recall error and poor es@ma@on • Examples: distance to health center, profit, consump@on, income, plot size
# Strategies: • Consistency checks / Triangula@on
• How much did you spend in the last week on x? How much did you spend in the last 4 weeks on x?
• Mul@ple measurements of same indicator – How many minutes does it take to walk to the health center? How many kilometers away is the health center?
• FIELD TEST!
1. Things people do not know very well
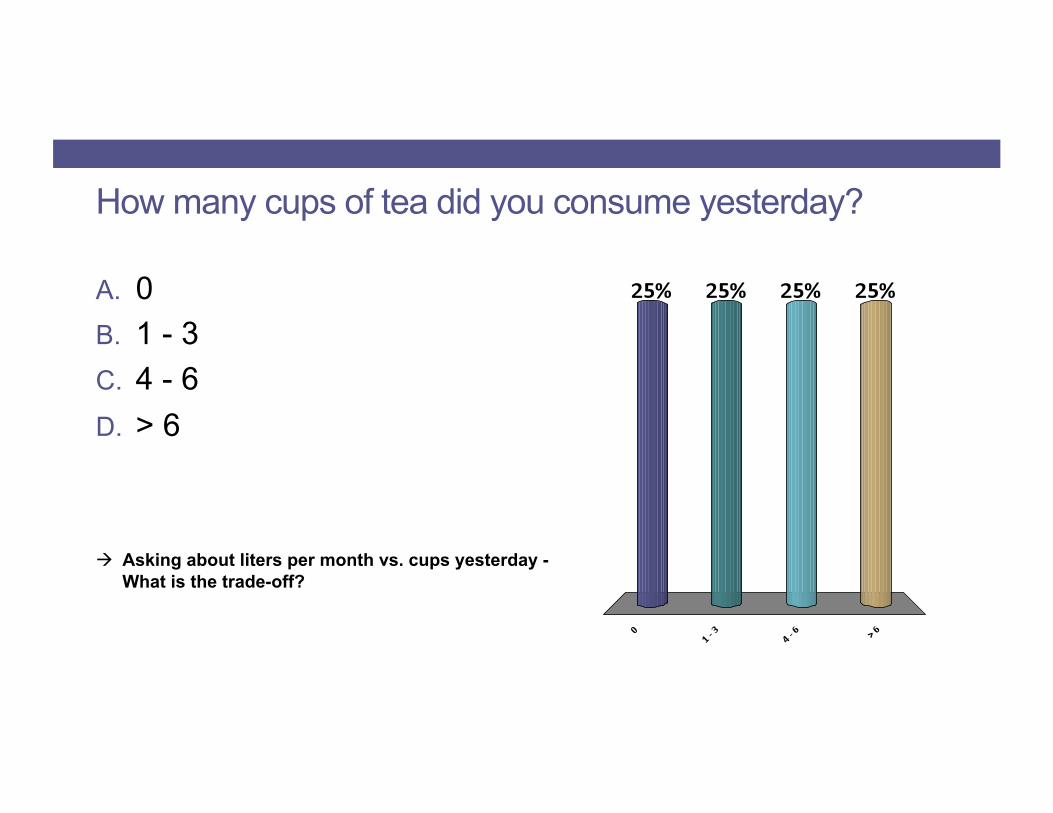
How many cups of tea did you consume yesterday?
A. 0 B. 1 - 3 C. 4 - 6 D. > 6
! Asking about liters per month vs. cups yesterday - What is the trade-off?
(1) Things people do not know very well
(2) Things people do not want to talk about
(3) Abstract concepts
(4) Things that are not (always) directly observable
What is Hard to Measure?
How frequently do you yell at your spouse?
A. Daily B. Several times per week C. Once per week D. Once per month E. Never
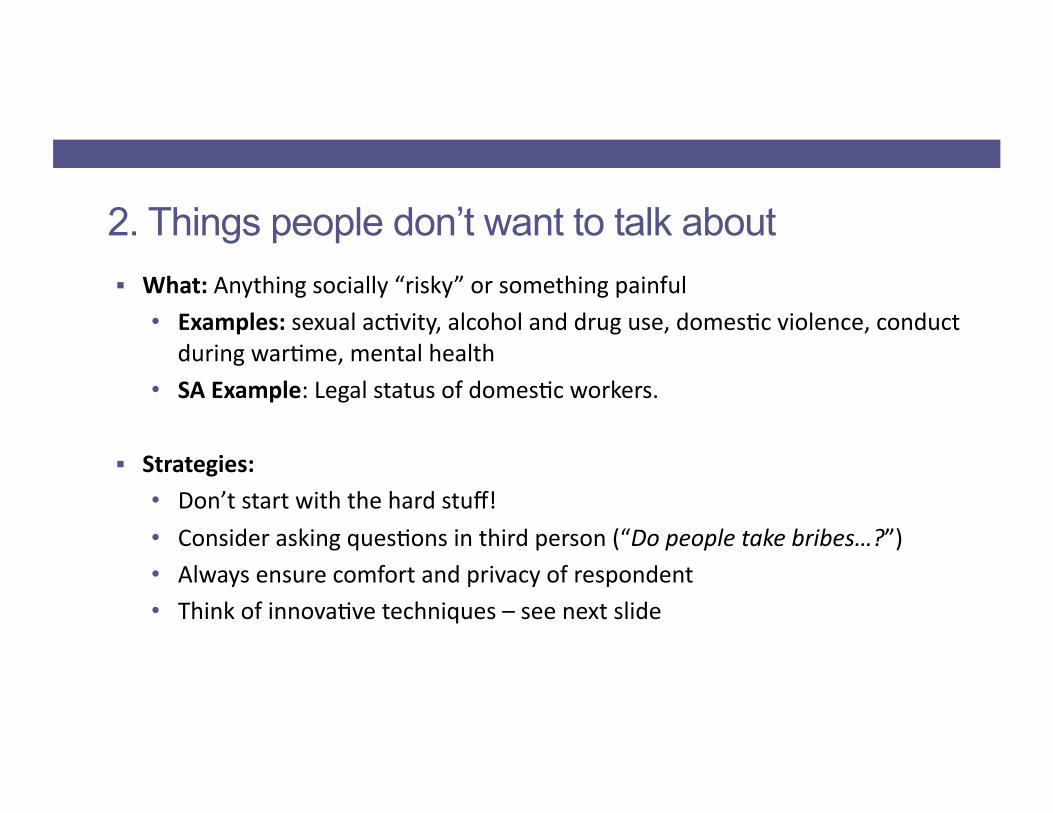
# What: Anything socially “risky” or something painful • Examples: sexual ac@vity, alcohol and drug use, domes@c violence, conduct
during war@me, mental health • SA Example: Legal status of domes@c workers.
# Strategies: • Don’t start with the hard stuff! • Consider asking ques@ons in third person (“Do people take bribes…?”) • Always ensure comfort and privacy of respondent • Think of innova@ve techniques – see next slide
2. Things people don’t want to talk about

Innovations in Data Collection I
! What are the downsides of these approaches?
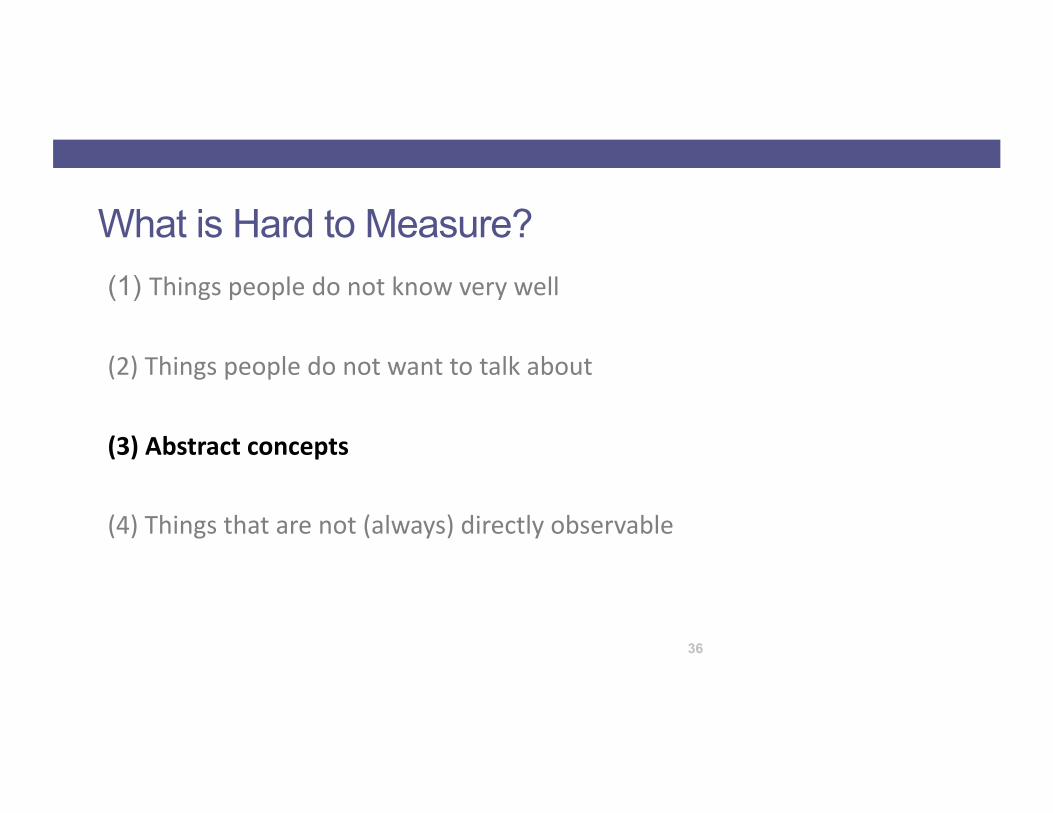
(1) Things people do not know very well
(2) Things people do not want to talk about
(3) Abstract concepts
(4) Things that are not (always) directly observable
36
What is Hard to Measure?
“I feel more empowered now than last year”
A. Strongly disagree B. Disagree C. Neither agree nor disagree D. Agree E. Strongly agree
# What: Poten@ally the most challenging and interes@ng type of difficult-‐to-‐measure indicators
• Examples: empowerment, bargaining power, social cohesion, risk aversion
# Strategies: • Define what you mean by your abstract concept
• Design a ques@on that people can relate to from their everyday life
3. Abstract concepts
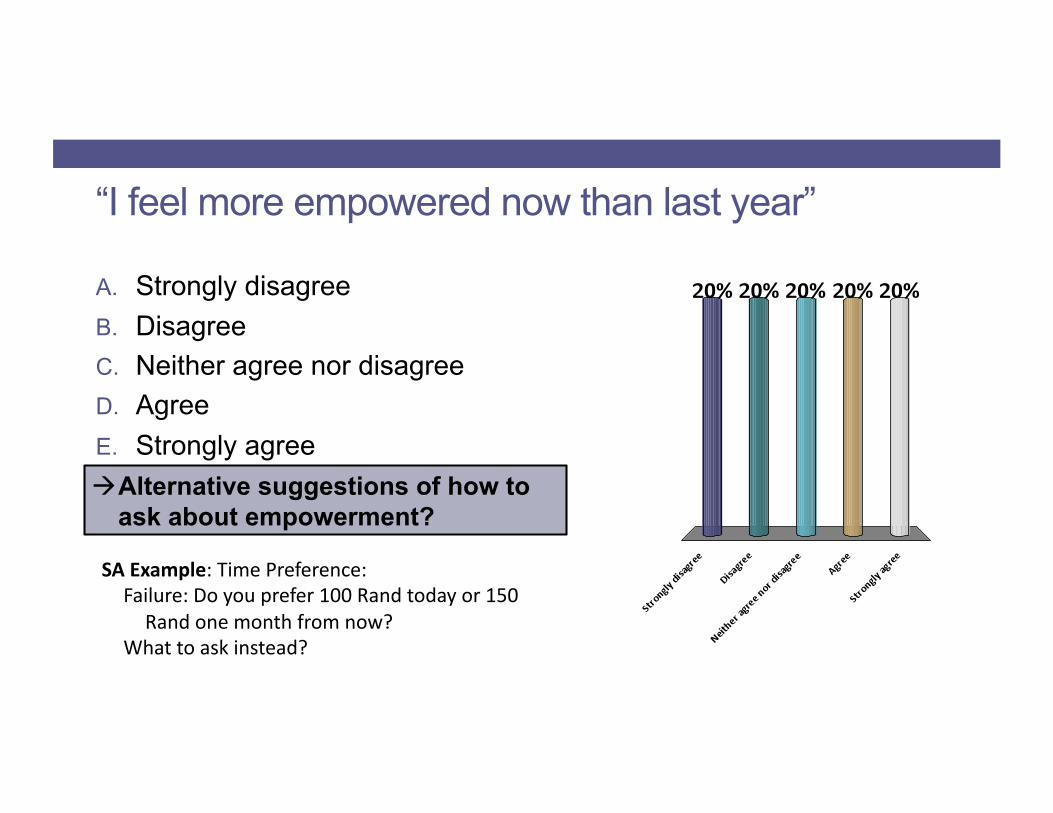
“I feel more empowered now than last year”
A. Strongly disagree B. Disagree C. Neither agree nor disagree D. Agree E. Strongly agree ! Alternative suggestions of how to
ask about empowerment?
SA Example: Time Preference: Failure: Do you prefer 100 Rand today or 150 Rand one month from now?
What to ask instead?
(1) Things people do not know very well
(2) Things people do not want to talk about
(3) Abstract concepts
(4) Things that are not (always) directly observable
What is Hard to Measure?

# What: You may want to measure outcomes that you can’t ask about directly or directly observe • Examples: corrup@on, fraud,
# Example: Embezzlement of road building funds in Indonesia ! sugges@ons of how to measure?
4. Things that aren’t Directly Observable
Outline 1. What should you measure ?
2. Indicators: What makes a good measure? 3. What data can you use?
4. Challenges to measurement
5. When should you measure?
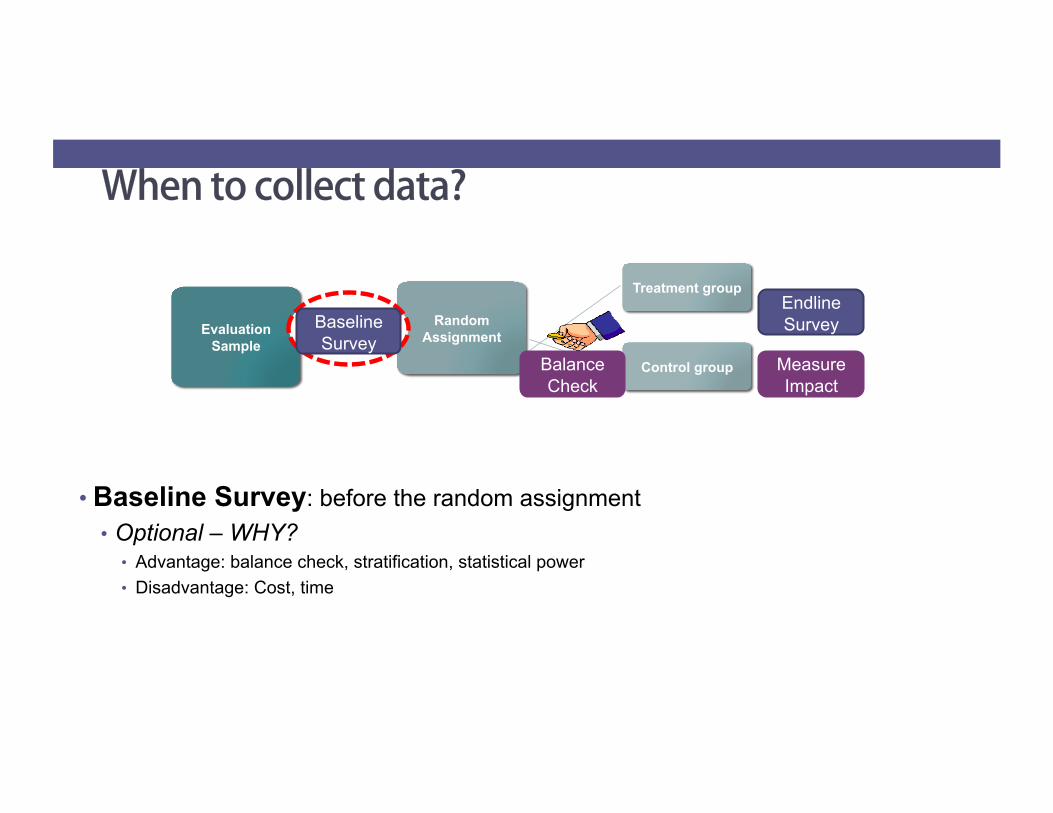
When to collect data?
• Baseline Survey: before the random assignment • Optional – WHY?
• Advantage: balance check, stratification, statistical power • Disadvantage: Cost, time
Evaluation Sample
Random Assignment
Treatment group
Control group Balance Check
Endline Survey
Measure Impact
Baseline Survey
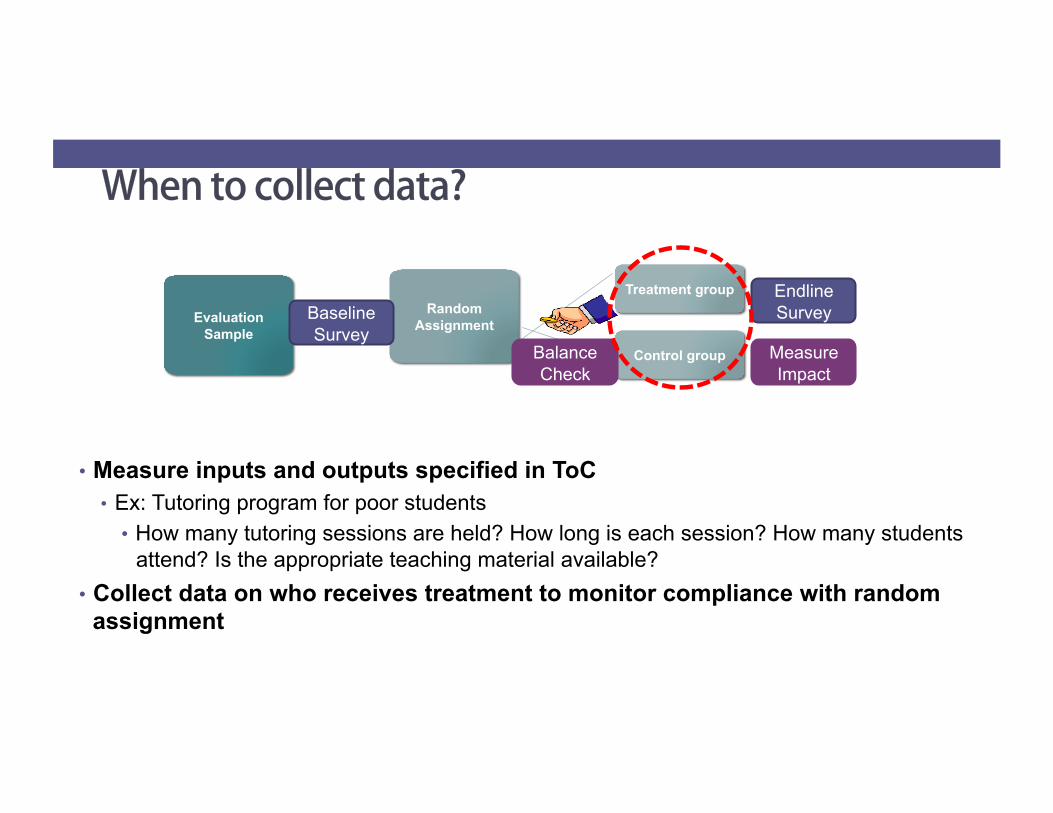
When to collect data?
• Measure inputs and outputs specified in ToC • Ex: Tutoring program for poor students
• How many tutoring sessions are held? How long is each session? How many students attend? Is the appropriate teaching material available?
• Collect data on who receives treatment to monitor compliance with random assignment
Evaluation Sample
Random Assignment
Treatment group
Control group Balance Check
Endline Survey
Measure Impact
Baseline Survey
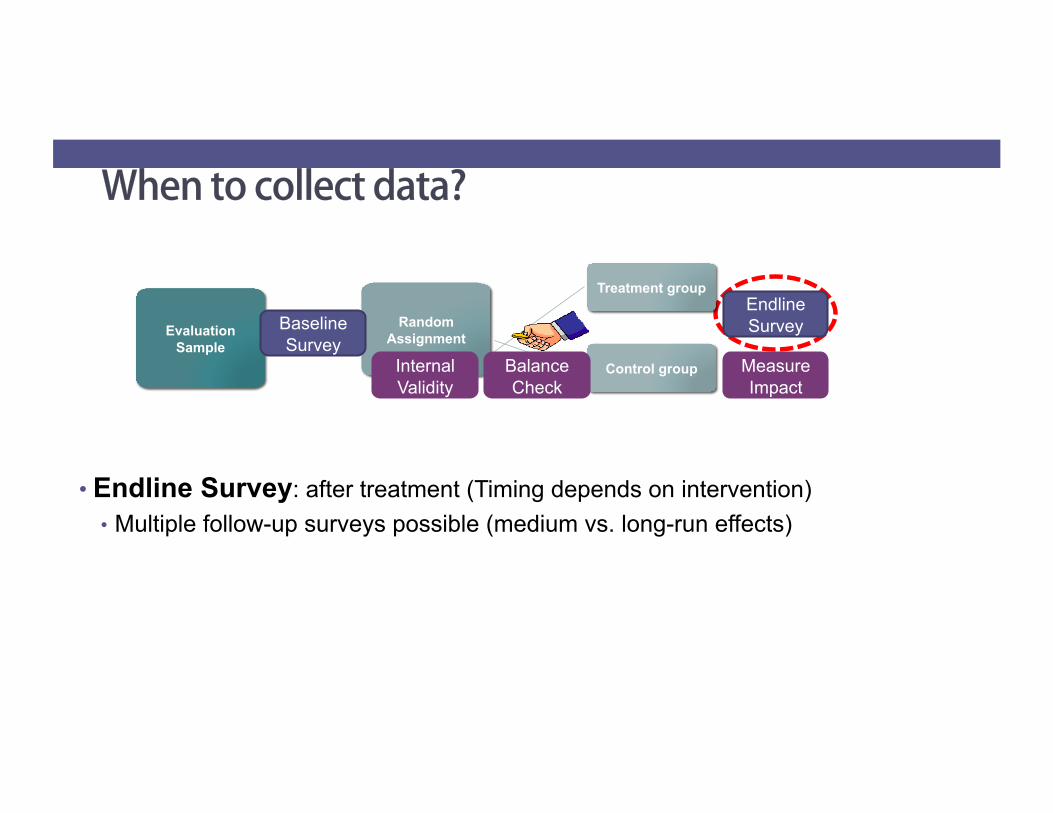
When to collect data?
• Endline Survey: after treatment (Timing depends on intervention) • Multiple follow-up surveys possible (medium vs. long-run effects)
Evaluation Sample
Random Assignment
Treatment group
Control group Internal Validity
Balance Check
Endline Survey
Measure Impact
Baseline Survey
Case Study: Skill Certification of Unemployed Youth • Idea:
• There are information asymmetries in the labour market, i.e. it is difficult for firms to identify the best applicants
• Conduct a English and Math aptitude test and issue a skill certificate that employers can use in the application process
• Identify the theory of change • Design:
1. Send out applications on behalf of job seekers and randomise whether to attach certificate
2. Randomize among job seekers who will receive certificate and measure employment outcomes
! Why study both 1. and 2.?
Summary: The Importance of Measurement for RCTs
• Randomised evalua@ons allow you to create a causal rela@onship between your outcome and your interven@on because of the sta@s@cal equivalence of the control and the treatment group.
• To iden@fy important causal rela@onships you need to measure the right things.
• The theory of change helps you iden@fy what you need to measure.
• Correct measurement methodology is essen@al for aeaining a causal rela@onship. If your measuring is incorrect you jeopardize iden@fying the correct causal rela@onship.

MEASUREMENT Martin Abel J-PAL Africa Executive Education 18-22 January 2016