MEAP 2010 Guide to reports - michigan.gov
41
Guide to Reports Fall 2010
Transcript of MEAP 2010 Guide to reports - michigan.gov

Guide to Reports
Fall 2010

MICHIGAN EDUCATIONAL ASSESSMENT PROGRAM
Table of Contents
Section 1: Introduction ............................................................................................................................................................. 3 Fall 2010 Highlights ................................................................................................................................................................ 3
Writing .............................................................................................................................................................................. 3
Science............................................................................................................................................................................. 3
Item Descriptors................................................................................................................................................................ 4 Fall 2010 MEAP Report Descriptors....................................................................................................................................... 5
Section 2: Scoring ..................................................................................................................................................................... 6 Definitions............................................................................................................................................................................... 6
Multiple Choice Item Scores ............................................................................................................................................. 6 Constructed Response Item Scores ................................................................................................................................. 6 Scale Scores..................................................................................................................................................................... 7 Performance Levels.......................................................................................................................................................... 7
MEAP Score Categories and Scale Score Ranges - Fall 2010 - Grades 3-9 ......................................................................... 9 Ranges within MEAP Performance Levels ........................................................................................................................... 10 MEAP Performance Level Change Table............................................................................................................................. 11
Section 3: Reporting ............................................................................................................................................................... 12 Individual Student Report ..................................................................................................................................................... 13 Student Label ....................................................................................................................................................................... 16 Parent Report ....................................................................................................................................................................... 18 Class Roster ......................................................................................................................................................................... 22 Item Analysis Report ............................................................................................................................................................ 26 Summary Report .................................................................................................................................................................. 32 Demographic Report ............................................................................................................................................................ 36 Comprehensive Report......................................................................................................................................................... 39
Contact Information ................................................................................................................................................................. 41
MEAP - FALL 2010 Guide to Reports 2

MICHIGAN EDUCATIONAL ASSESSMENT PROGRAM
Section 1— Introduction This guide was developed to assist educators in understanding and using the Fall 2010 Michigan Educational Assessment Program (MEAP) results. Reports prepared for the MEAP include both individual level (Individual Student Report, Parent Re-port, Class Roster, Student Label) and aggregate level reports (Comprehensive Report, Demographic Report, Item Analysis Report, Summary Report).
Aggregate reports reflect the data needed to meet state and federal legislative requirements. In accordance with these man-dates, separate aggregate results are provided for the following student populations: 1) all students, 2) students with dis-abilities, and 3) all except students with disabilities.
Reports included in district and school packets are listed in the table on page 5. Included in the table is a brief description of each report, a list of the student populations represented in the report, and the report recipients. Detailed descriptions of the reports are provided in Section 3 of this guide. Schools must distribute MEAP Parent Reports to students’ parents or guardi-ans as soon as possible after printed reports arrive, if a copy of the report has not already been distributed.
All MEAP reports are provided via the OEAA Secure Site and, when hard copies are printed, OEAA prints reports based upon a district elected printing option. Districts may have all reports printed or have just the individual student reports, parent re-ports, and student reports printed (a “green” option). When the “green” option is selected, schools may print the remaining reports from the secure site. If no option was selected by the district, the “green” option was selected automatically.
Fall 2010 Highlights
Writing In Fall 2010, the MEAP writing test was lengthened to allow a more thorough assessment of students’ writing skills. The new writing test was administered in grades 4 and 7. A narrative prompt, informational prompt and a response to a student writ-ing sample were completed by fourth and seventh grade students. Operational writing scores are reported for grades 4 and 7 using scale scores as well as analytic and holistic rubric scores that can be found at www.michigan.gov/meap.
Science The Fall 2010 science test had matrixed operational items. This means that some operational items appeared only on certain
MEAP - FALL 2010 Guide to Reports 3
MICHIGAN EDUCATIONAL ASSESSMENT PROGRAM
forms of the test. The result of this matrix design is that science is reported by form number. Some reports, such as the Item Analysis Report and the Class Roster, reflect these groupings.
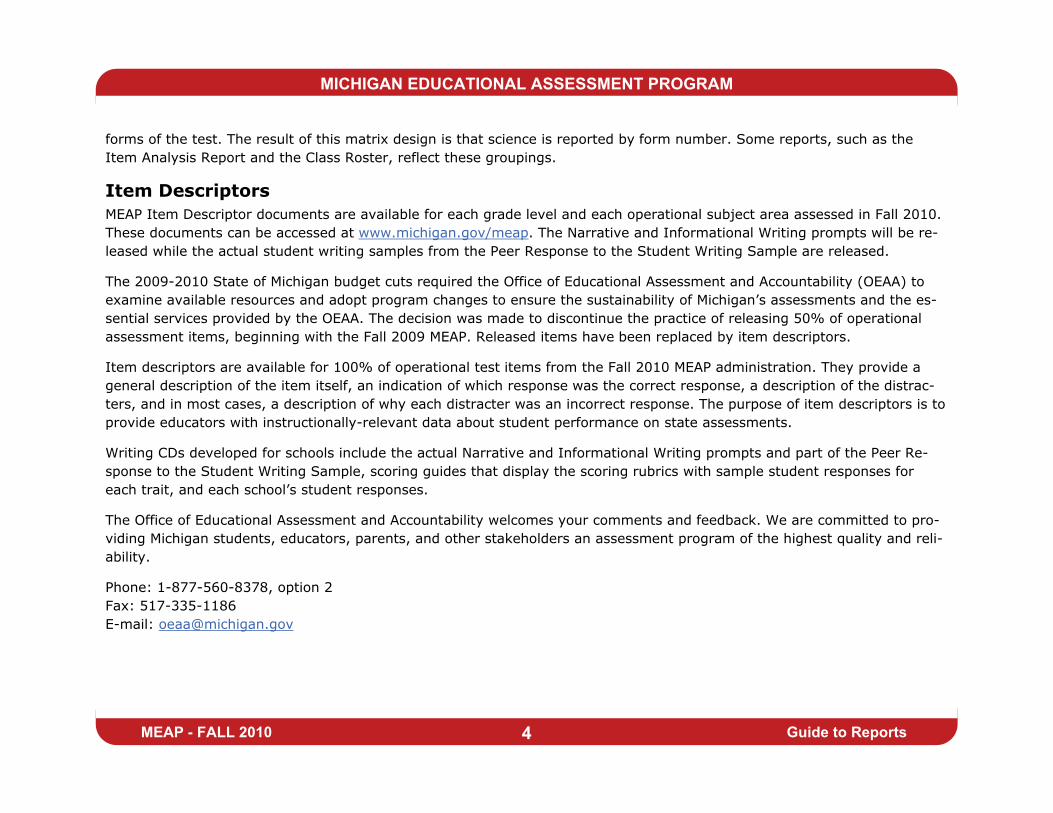
Item Descriptors MEAP Item Descriptor documents are available for each grade level and each operational subject area assessed in Fall 2010. These documents can be accessed at www.michigan.gov/meap. The Narrative and Informational Writing prompts will be re-leased while the actual student writing samples from the Peer Response to the Student Writing Sample are released.
The 2009-2010 State of Michigan budget cuts required the Office of Educational Assessment and Accountability (OEAA) to examine available resources and adopt program changes to ensure the sustainability of Michigan’s assessments and the es-sential services provided by the OEAA. The decision was made to discontinue the practice of releasing 50% of operational assessment items, beginning with the Fall 2009 MEAP. Released items have been replaced by item descriptors.
Item descriptors are available for 100% of operational test items from the Fall 2010 MEAP administration. They provide a general description of the item itself, an indication of which response was the correct response, a description of the distrac-ters, and in most cases, a description of why each distracter was an incorrect response. The purpose of item descriptors is to provide educators with instructionally-relevant data about student performance on state assessments.
Writing CDs developed for schools include the actual Narrative and Informational Writing prompts and part of the Peer Re-sponse to the Student Writing Sample, scoring guides that display the scoring rubrics with sample student responses for each trait, and each school’s student responses.
The Office of Educational Assessment and Accountability welcomes your comments and feedback. We are committed to pro-viding Michigan students, educators, parents, and other stakeholders an assessment program of the highest quality and reli-ability.
Phone: 1-877-560-8378, option 2 Fax: 517-335-1186 E-mail: [email protected]
MEAP - FALL 2010 Guide to Reports 4

MICHIGAN EDUCATIONAL ASSESSMENT PROGRAM
MEAP - FALL 2010 Guide to Reports 5
Fall 2010 MEAP Report Descriptors

MICHIGAN EDUCATIONAL ASSESSMENT PROGRAM
Section 2: Scoring
Definitions
All of the processes employed to assess overall student performance begin at the item level. There are two types of items on the MEAP: Multiple Choice (MC) items and Constructed Response (CR) items. Item scores are used to create subscores for each content area and are used in the statistical models and transformations that result in scale scores.
Multiple Choice Item Scores The majority of the MEAP is comprised of multiple choice items. On these items, students select from the available options, only one of which is a correct response to the item. Students who select only the correct option receive a score of one (1) on a multiple choice item. Students who select one of the incorrect options, multiple options, or did not respond receive a score of zero (0). The string of responses from the multiple choice items (e.g. 1,0,0,0,1,…,1) serve as input for the statistical mod-els used to derive scale scores. Multiple choice items are scanned and scored by computer.
Constructed Response Item Scores In Fall 2010, the reading and writing tests contained operational constructed response items. The reading operational item was a 3-point reading comprehension item. The rubric used to score each grade-level reading comprehension item contains language directly from the reading passage, such that publishing the rubric would compromise the reading passage itself. For this reason, the scoring rubric is not included in this guide; however, an item descriptor for each grade level is published in the Item Descriptors located on the MEAP website (www.michigan.gov/meap).
Constructed response items requiring extended written responses are evaluated by human scorers. The technique used to score the operational reading items is called holistic scoring; the most widely used scoring method for large-scale assess-ments. Guided by precise criteria, scorers review a response for an overall or ‘whole’ impression and assign a score. Extensive professional practice and research have refined and validated the critical steps that ensure consistency in scoring. Scorers are trained to evaluate writing, not writers. Scorers are trained to ignore extraneous factors such as neat-ness and to focus on the strengths of responses rather than the weaknesses. Due to the high-stakes nature of these large-scale assessments, the OEAA has taken every step possible to minimize scoring subjectivity.
MEAP - FALL 2010 Guide to Reports 6

MICHIGAN EDUCATIONAL ASSESSMENT PROGRAM
Three writing constructed response items are included in the writing tests: a Narrative Writing prompt, an Informational Writing prompt and a Peer Response to the Student Writing Sample. The Narrative and Informational prompts are scored using analytic scoring rubrics. Trait ratings include 3 points per trait for Ideas (points doubled), Organization, Style and Con-ventions, and are reported in the Individual Student Report, the Parent Report and the Class Roster. The Peer Response to the Student Writing Sample is scored using a holistic rubric with ratings from 0-4 and is displayed in the reports listed above. Again, scorers are extensively trained to score student writing.
Scale Scores MEAP scale scores are created from statistical scoring models that make use of each student’s responses to both the Multiple Choice (MC) and Constructed Response (CR) items. The purpose is to model students’ overall achievement in each content area based on the Michigan Grade Level Content Expectations (GLCEs). MEAP scale scores are equated from year to year and form to form, meaning that any differences in the difficulty of items from one year to the next or from one form to the next are accounted for in the calculations of the scale score for the current cycle. Therefore, MEAP scale scores from the same grade and subject can be compared against each other regardless of the year or form of the MEAP the student took.
A simple Item Response Theory (IRT) model: the Rasch Partial Credit (1-parameter) model is used to determine the stu-dents’ ability estimates. The use of this model results in a table for each subject area that describes a one-to-one relation-ship between the number of points earned by a student and the scale score earned by the student. This one-to-one relation-ship between points earned and scale score is a by-product of the statistical scoring model used for scoring the MEAP assess-ment. Some reports are reported by subscore (domain, focal point, or discipline). Subscores are not equated from year to year, therefore, are less reliable than scale scores and provide only an approximate measure of student performance.
Performance Levels MEAP scale scores within each subject area can be described in ranges. The labels applied to these ranges are known as per-formance levels. The MEAP performance levels are: (1) Advanced, (2) Proficient, (3) Partially Proficient, and (4) Not Profi-cient. The divisions between the levels are often referred to as cut scores. Scale score and performance level range tables are located on the following pages.
The cut scores are recommended by a panel comprised of educators and other stakeholders throughout the state in a proc-ess known as standard setting. To set these standards, the panel uses detailed descriptions of what students in each of the
MEAP - FALL 2010 Guide to Reports 7
performance levels should know and be able to do. Based upon these detailed descriptions and actual assessment items, the

MICHIGAN EDUCATIONAL ASSESSMENT PROGRAM
panel recommends the score that best separates each performance level from the next to the Michigan Superintendent of Public Instruction. The Superintendent of Public Instruction then recommends the results of the standard setting (or modifi-cations of these standards) to the Michigan State Board of Education (SBE). The SBE is the authority who approves the final cut scores and performance level ranges. While the performance level descriptors necessarily differ by grade and subject area, student achievement, as defined by the obtained performance level, can be reasonably compared across subjects within a grade. Such a comparison can be used to indicate whether students are meeting Michigan grade level content ex-pectations in each subject.
MEAP - FALL 2010 8 Guide to Reports

MICHIGAN EDUCATIONAL ASSESSMENT PROGRAM
MEAP Score Categories and Scale Score Ranges
Fall 2010 — Grades 3-9
Subject Grade Level 4
Not Proficient
Level 3
Partially Proficient
Level 2
Proficient
Level 1
Advanced
Mathematics
3 205 - 278 279 - 299 300 - 326 327 - 427 4 285 - 377 378 - 399 400 - 431 432 – 554 5 358 - 476 477 - 499 500 - 526 527 – 671 6 472 - 579 580 - 599 600 - 621 622 – 761 7 581 - 675 676 - 699 700 - 721 722 – 873 8 676 - 783 784 - 799 800 - 819 820 – 961
Reading
3 194- 279 280 - 299 300 - 337 338 – 417 4 285 - 372 373 - 399 400 - 442 443 – 529 5 386 - 481 482 - 499 500 - 537 538 – 631 6 492 - 579 580 - 599 600 - 637 638 – 726 7 575 - 683 684 - 699 700 - 737 738 – 823 8 691 - 779 780 - 799 800 - 833 834 – 921
Writing 4 264 - 361 362 - 399 400 - 428 429 – 532 7 531 - 665 666 - 699 700 - 732 733 - 832
Science 5 351 - 475 476 - 499 500 - 532 533 – 661 8 665 - 780 781 - 799 800 - 831 832 - 967
Social Studies 6 483 - 586 587 - 599 600 - 618 619 - 733 9 777 - 880 881 - 899 900 - 928 929 - 1045
MEAP - FALL 2010 Guide to Reports 9

MICHIGAN EDUCATIONAL ASSESSMENT PROGRAM
Ranges within MEAP Performance Levels
Because mathematics and reading are assessed each year in grades 3 through 8, it is possible to track changes in individual students’ achievement from grade-to-grade. Tracking transitions between the four performance levels (Not Proficient, Partially Proficient, Proficient, and Advanced) can be made more precise by tracking changes within each performance level (for exam-ple, a transition from the low range of the Partially Proficient category to the high range of that same category). These small ranges are presented in the table below.
MEAP - FALL 2010 Guide to Reports 10
Subject Grade
Ranges
Not Proficient Partially Proficient Proficient Advanced
Low Mid High Low Mid High Low Mid High Low Mid High
Math
3 205-239 240-259 260-277 279-285 286-292 293-299 300-308 309-317 318-326 327-344 345-368 369-427
4 285-336 337-357 358-377 378-385 386-392 393-399 400-410 411-420 421-431 432-449 450-470 471-554
5 358-429 430-454 455-476 477-484 485-492 493-499 500-508 509-517 518-526 527-545 546-569 570-671
6 472-535 536-558 559-579 580-586 587-592 593-599 600-607 608-614 615-621 622-640 641-662 663-761
7 581-632 633-654 655-675 676-683 684-691 692-699 700-707 708-714 715-721 722-739 740-761 762-873
8 676-739 740-763 764-783 784-789 790-794 795-799 800-806 807-812 813-819 820-839 840-861 862-961
Reading
3 194-244 245-264 265-279 280-286 287-292 293-299 300-309 310-323 324-337 338-357 358-389 390-417
4 285-336 337-357 358-372 373-385 386-392 393-399 400-410 411-424 425-442 443-462 463-490 491-529
5 386-442 443-464 465-481 482-487 488-493 494-499 500-511 512-523 524-537 538-554 555-579 580-631
6 492-535 536-563 564-579 580-586 587-593 594-599 600-610 611-621 622-637 638-655 656-684 685-726
7 575-636 637-664 665-683 684-689 690-694 695-699 700-711 712-723 724-737 738-759 760-789 790-823
8 691-739 740-763 764-779 780-786 787-793 794-799 800-809 810-820 821-833 834-849 850-874 875-921

MICHIGAN EDUCATIONAL ASSESSMENT PROGRAM
MEAP Performance Level Change Table For mathematics and reading, the four performance levels have each been divided into three ranges (low, mid, and high) to enable the more precise tracking of changes in student performance. The table below delineates the transitions a student can demonstrate on these MEAP subjects from year to year. On the left side of the table is the previous year’s MEAP achievement divided into the various ranges of performance levels. Across the top of the table is the current year’s MEAP achievement. Each student’s change in performance can be described as fitting into one of these cells by looking at the com-bination of the performance in the previous grade and the current grade. For example, a student who scored in the low Profi-cient range both last year and this year will fit within the cell “M”, indicating the student is maintaining the performance level achieved in the previous year.
Transition categories are: Significant Decline (SD), Decline (D), Maintaining (M), Improvement (I), or Significant Improve-ment (SI). These categories reflect whether students are changing their performance relative to increasing expectations.
Grade X MEAP Achievement
Grade X + 1 MEAP Achievement
Not Proficient Partially Proficient Proficient Advanced
Low Mid High Low Mid High Low Mid High Low Mid High
Not
Proficient
Low M I I SI SI SI SI SI SI SI SI SI
Mid D M I I SI SI SI SI SI SI SI SI
High D D M I I SI SI SI SI SI SI SI
Partially
Proficient
Low SD D D M I I SI SI SI SI SI SI
Mid SD SD D D M I I SI SI SI SI SI
High SD SD SD D D M I I SI SI SI SI
Proficient
Low SD SD SD SD D D M I I SI SI SI
Mid SD SD SD SD SD D D M I I SI SI
High SD SD SD SD SD SD D D M I I SI
Advanced
Low SD SD SD SD SD SD SD D D M I I
Mid SD SD SD SD SD SD SD SD D D M I
High SD SD SD SD SD SD SD SD SD D D M
MEAP - FALL 2010 11 Guide to Reports

MICHIGAN EDUCATIONAL ASSESSMENT PROGRAM
Section 3: Reporting The sample reports included in this Guide to Reports are intended to provide examples of the report formats, data organiza-tion, and types of information contained in each report.
Data contained in these sample reports do not refer to any specific district, school, assessment item, or any specific student.
MEAP - FALL 2010 Guide to Reports 12

Studen Namet Ethnicity Distri Stuct IDdent Engli Lansh Learguage ner Dat o Birte h f Formerl LEP y Studen UIC t Specia Educal tion Gender Accommodation s
MICHIGAN EDUCATIONAL ASSESSMENT PROGRAM
Individual Student Report (ISR)
The intent of the Individual Student Report (ISR) is to provide a detailed description of each student’s performance in the MEAP subject areas assessed in that grade level. This report is designed to help educators identify a student’s academic strengths and areas which may need improvement. Schools may include these reports in student record files.
Section A identifies the title of the report, the subject area, the grade level, and the assessment cycle. It also lists the name of the teacher (if provided using a Class/Group ID sheet when answer documents were returned for scoring), class/group code, and the names of the school and district the student was enrolled in at the time the assessment was administered.
Section B contains student identification and demographic information, as well as a summary of the student’s performance in that subject area. The specific identification and demographic fields reported are:
Section C provides detailed information on the individual student’s performance on each assessment item. All items, except for field test items, are included. The number of points earned and the total number of points possible are reported. Fall 2010 Item Descriptor booklets can be found for each grade level and subject area on the MEAP website at www.michigan.gov/meap.
Section D appears in the ISR for reading and writing. It provides constructed response data, including the number of points possible and the number of points earned by the student. Writing trait ratings are provided for writing prompts. Condition codes are reported if applicable. If a student receives an overall score of zero (0) there will be a condition code indicating why a zero was given. A description of the condition codes is provided in the legends at the bottom of the reading and writ-ing ISRs.
MEAP - FALL 2010 Guide to Reports 13

MICHIGAN EDUCATIONAL ASSESSMENT PROGRAM
MEAP - FALL 2010 Guide to Reports 14
A
B
C

MICHIGAN EDUCATIONAL ASSESSMENT PROGRAM
MEAP - FALL 2010 Guide to Reports 15
A
B
C D

MICHIGAN EDUCATIONAL ASSESSMENT PROGRAM
Student Record Label
A Student Record Label is provided for each student assessed during the Fall 2010 cycle. The labels are mailed to the school for placement in the student record file (CA-60).
Section A contains the district name and code and the school name and code.
Section B contains the student’s name, Unique Identification Code (UIC), District Student ID (STU), if provided by the school during the Pre-ID process, date of birth, gender, and grade.
Section C contains the Subject areas assessed, the Scale Score (SS) received, the Performance Level the student attained in each subject area, and the Performance Level Change reported for students in grades 4-8.
Performance Levels
Level
1 – Advanced
Level
2 – Proficient Level 3 – Partially Proficient
Level
4 – Not Proficient
Performance Level Change Ranges SI – Significant Improvement I - Improvement M - Maintaining D - Decline SD - Significant Decline
MEAP - FALL 2010 Guide to Reports 16

MICHIGAN EDUCATIONAL ASSESSMENT PROGRAM
A
B C
MEAP - FALL 2010 Guide to Reports 17

MICHIGAN EDUCATIONAL ASSESSMENT PROGRAM
Parent Report
The intent of the Parent Report is to provide a summary description of their student’s performance in each subject area as-sessed on the MEAP. This report is designed to help parents and guardians identify the academic strengths of their student and areas that may need improvement. Information from this report may be helpful when discussing academic progress of the student with the classroom teacher(s). Please ensure that Parent Reports are distributed to parents or guardians as soon as possible after printed reports arrive at your school.
Section A provides the title of the report, the assessment cycle, the grade the student was in when the assessment was ad-ministered, the name of the student, and the student’s Unique Identification Code (UIC). It also lists the name of the school and the school district the student was enrolled in at the time the assessment was administered.
Section B consists of a brief introductory letter addressed to the parent or guardian of the student describing the purpose of the MEAP and summarizing information contained in the Parent Report.
Section C provides the student’s scale score in each subject area assessed for the current year, the performance level ob-tained in mathematics and reading for the current and previous year, and an indication of the student’s performance level change for those subjects. (Note: Grade 3 students will have “NA - Not Applicable” for the previous year’s performance level.)
Section D provides information on students’ performance level change from grade to grade in mathematics and reading.
Section E describes how the student performed in each subject area. Each subject area is divided into subscore groupings: mathematics is divided into focal points, reading into domains, and science and social studies into disciplines. For each subject area, the total points earned versus the total points possible for each subscore grouping is displayed. The brief explanation for each subject area provides the performance level the student attained and the accompanying scale score, as well as informa-tion on how the student’s performance relates to Michigan standards. For example, if a student received a Level 2 on the eighth grade mathematics assessment, that student is “Proficient” and has met grade level expectations for Michigan students.
Section F displays the new writing parent report section. The Narrative Writing and the Informational Writing prompts’ rubric scores are listed for each trait. In addition, the multiple choice test items and the Peer Response to the Student Writing Sample score (listed as Revise Drafts) is reported for each student.
MEAP - FALL 2010 Guide to Reports 18

MICHIGAN EDUCATIONAL ASSESSMENT PROGRAM
NOTE: The MEAP results for individual students are most reliable and valid at the overall scale score level for each subject. These scale scores are reliably associated with a performance level. Parents can have confidence that the reported scale scores and performance levels provide accurate information for each subject. Student subscores (at the domain, focal point, or discipline) are less reliable measures than scale scores and performance levels because there are fewer items per subscore grouping. The subscore results provide only an approximate measure of the student’s performance level. Parents should be careful in drawing conclusions about a student’s strengths or weaknesses at the subscore level. It is more ap-propriate to use this subscore information together with classroom assessment data, information provided by the student’s teacher(s), and other performance information to guide learning activities.
MEAP - FALL 2010 Guide to Reports 19

MICHIGAN EDUCATIONAL ASSESSMENT PROGRAM
MEAP - FALL 2010 Guide to Reports 20
A
B
DC

MICHIGAN EDUCATIONAL ASSESSMENT PROGRAM
MEAP - FALL 2010 Guide to Reports 21
E
F

MICHIGAN EDUCATIONAL ASSESSMENT PROGRAM
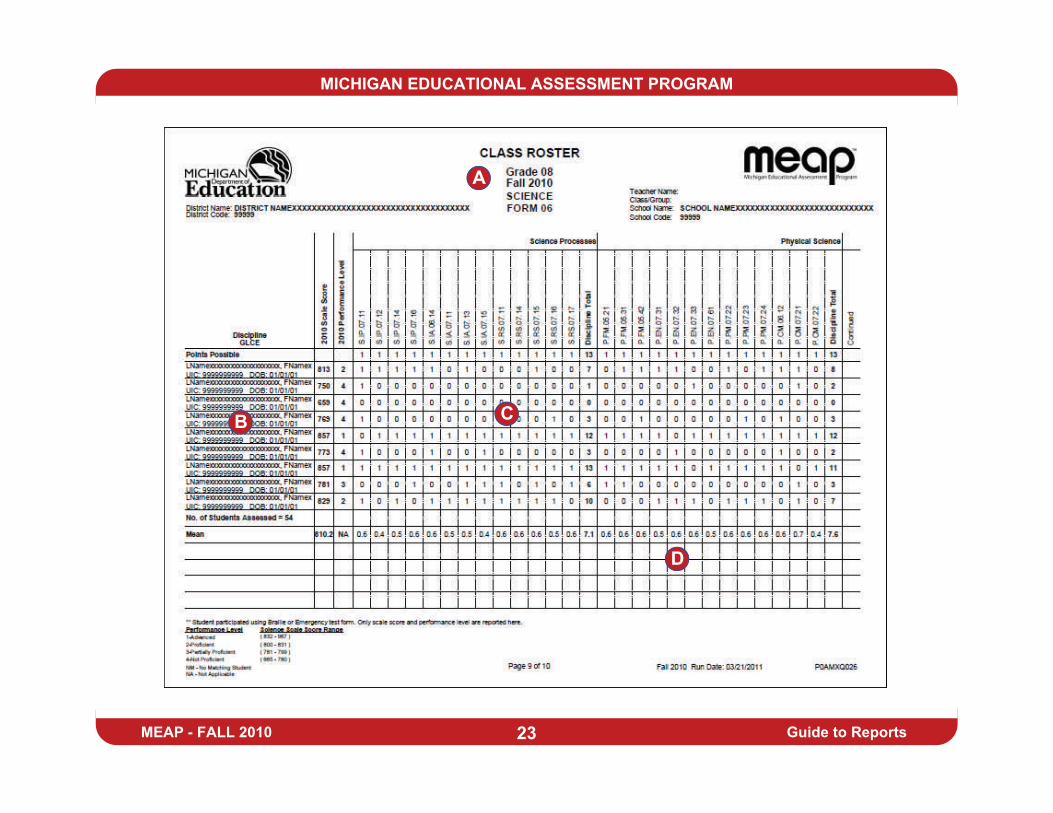
Class Roster
The Class Roster provides summary score information for each subscore grouping (domain, focal point, or discipline) and GLCE assessed within each subject area, as well as detailed information for each student assessed. This report may include multiple pages to report all subscore groupings and GLCEs (see two-page samples on the following pages). This report will be sorted by class/group code (if a Class/Group ID Sheet was returned to the scoring contractor or a class/group code was added during Tested Roster). The Writing Class Roster reports the multiple choice test items results on the first page of the report. The sec-ond roster page will display the Narrative, Informational and Peer Response results for each student. Science results are dis-played by form number.
Section A identifies the title of the report, the grade level reported, the assessment cycle, the subject area and, for science, the form number. The teacher name, class/group code, the school name and code, and the district name and code are also provided.
Section B lists each student’s name followed by their Unique Identification Code (UIC), and Date of Birth (DOB). The scale score and performance level attained by the student for the current year are reported for all subjects. Previous year perform-ance level, as well as the performance level change, are reported for mathematics and reading.
Section C provides the following information for each subscore grouping and GLCE, detailed by student:
GLCE assessed Number of points possible Number of points earned by the student Reading constructed response and writing prompt rubric scores and condition codes for reading and writing
Section D reports the number of students assessed within each class/group code and the mean score for each subscore grouping and GLCE.
MEAP - FALL 2010 Guide to Reports 22
MICHIGAN EDUCATIONAL ASSESSMENT PROGRAM
MEAP - FALL 2010 Guide to Reports 23
A
B C
D

MICHIGAN EDUCATIONAL ASSESSMENT PROGRAM
MEAP - FALL 2010 Guide to Reports 24
A
B C
D

MICHIGAN EDUCATIONAL ASSESSMENT PROGRAM
MEAP - FALL 2010 Guide to Reports 25
A
B C
D

MICHIGAN EDUCATIONAL ASSESSMENT PROGRAM
Item Analysis Report
The Item Analysis Report provides summary information for each multiple choice item and each constructed response item on the assessment, including the primary Michigan GLCE measured by each item. The summary information reports the percent-age of students selecting each response. The Item Analysis Report is generated for three student populations:
All Students Students with Disabilities All Except Students with Disabilities
The aggregate data is reported by class/group, school, district, and state. This report may include multiple pages.
Section A identifies the title of the report, the student population included in the report, the grade level, the assessment cy-cle, and the subject area. The teacher name, class/group code, the school name and code, the district name and code, and the number of students assessed are also provided. Please note that students who participated using a Braille or Emergency test form are not included in this count.
Section B lists the Item Descriptor Number and the benchmark and GLCE being assessed for each multiple choice item. The Fall 2010 Item Descriptors for each grade level and subject area are posted on the MEAP website at www.michigan.gov/meap.
Section C indicates the percentage of students selecting each response to the multiple choice questions in section B. A plus sign (+) denotes the correct response. Science is reported for the total group on the first page, then this is followed by results by form number. Most schools will have Form 1 results along with results for the form assigned to the school/district.
Section D (applies to reading and writing only) lists the Item Descriptor Number, the GLCE being assessed, and the Mean Score for the constructed response item. The percentage of students achieving each score level are reported, as are the num-ber of student responses that received each Condition Code. A small mean comparison table for the Narrative and Informa-tional Writing prompts is provided at the bottom of the page to facilitate a quick review.
MEAP - FALL 2010 Guide to Reports 26

MICHIGAN EDUCATIONAL ASSESSMENT PROGRAM
The condition codes are reported at the individual student level on the Individual Student Report (ISR) for the Fall 2010 assessments.
Condition Codes provide a reason the student’s response received a score of zero (0). The Fall 2010 Condition Codes are listed in the lower right quadrant of the reading and writing Item Analysis Reports. The codes are the following:
A = Off topic B = Illegible or written in a language other than English
C = Blank D = Insufficient to rate E = Incorrect Answer (reading only)
Use of Item Analysis Results Some assessment items may be particularly difficult or easy. Educators may consider how well their student groups did on an assessment item or subscore grouping in relation to the state results reported. State results provide a good comparison for how easy or difficult an assessment item was for all students.
Some GLCEs may be assessed by only a single item, while other GLCEs are assessed by multiple items. A larger number of assessment items provides more reliable results. This may make interpretation of item analysis reports more difficult.
Teachers may use the Item Analysis Report to pose a hypothesis about how a group of students performed within a GLCE or a subscore grouping (domain, focal point, or discipline). This hypothesis should be further evaluated using classroom and other assessment information before making decisions to adjust curriculum or instruction.
MEAP - FALL 2010 Guide to Reports 27

MICHIGAN EDUCATIONAL ASSESSMENT PROGRAM
MEAP - FALL 2010 Guide to Reports 28
A
B C
D

MICHIGAN EDUCATIONAL ASSESSMENT PROGRAM
MEAP - FALL 2010 Guide to Reports 29
A
B C
D
D

MICHIGAN EDUCATIONAL ASSESSMENT PROGRAM
MEAP - FALL 2010 Guide to Reports 30
A
B C

MICHIGAN EDUCATIONAL ASSESSMENT PROGRAM
MEAP - FALL 2010 Guide to Reports 31
CC

MICHIGAN EDUCATIONAL ASSESSMENT PROGRAM
Summary Report
This multiple page report provides a comparative set of mean scale score information for each grade level, summarized by school, district, ISD, and state. The Summary Report is generated for three student populations:
All Students
Students with Disabilities
All Except Students with Disabilities
Section A identifies the title of the report, the level of aggregation (school, district, ISD, state), the student population re-ported, the grade level, the assessment cycle, and the subject area. School, district, and ISD names and codes are included.
Section B provides achievement summary data for multiple years for each subject area. The summary data reported in-cludes the year, the number of students assessed, the mean scale score, scale score margin of error, the percentage of stu-dents attaining each achievement level, and the percentage of students that achieved proficiency, meaning they attained either a Level 1 (Advanced) or Level 2 (Proficient) for that subject area. Four years of summary data are reported, with 2005 as the baseline year for the revised MEAP. In addition to subject area summaries, the ISD Summary Report will include Sec-tion B summary data for the current assessment cycle for each district and charter school within its boundaries.
Section C provides summary data on student performance level change compared to the previous administration of the MEAP. The summary data includes the current year and the previous year, the number and percentage of students matched across the two administrations, and the percentage of students in each sub-category of performance level change (e.g., Sig-nificant Decline, Decline, Maintaining, Improvement, and Significant Improvement) within each subject area.
Section D provides a progress table with year-to-year transition counts for students in grades 4-8 who were in the previous grade in Fall 2009, took the MEAP in both Fall 2009 and Fall 2010, and had a matching Unique Identification Code (UIC) for both Fall 2009 and Fall 2010. This data is currently provided for mathematics and reading. There is no progress table pro-vided for science, social studies, or writing. The progress tables provide the number and percentage of students matched between Fall 2009 and Fall 2010.
Section E provides summary data for each subject area score distribution at the school level only. The summary data re-ported includes the code and descriptor for each GLCE, the number of students assessed (by form number for science), the mean points earned, the total number of points possible, and the percentage of students earning each point value.
MEAP - FALL 2010 Guide to Reports 32

MICHIGAN EDUCATIONAL ASSESSMENT PROGRAM
MEAP - FALL 2010 Guide to Reports 33
A
B
C

MICHIGAN EDUCATIONAL ASSESSMENT PROGRAM
MEAP - FALL 2010 Guide to Reports 34
D

MICHIGAN EDUCATIONAL ASSESSMENT PROGRAM
MEAP - FALL 2010 Guide to Reports 35
E

MICHIGAN EDUCATIONAL ASSESSMENT PROGRAM
Demographic Report
The Demographic Report provides a summary breakdown of scores by demographic subgroup for each subject area assessed. Summary data reported includes the number of students assessed in each subgroup, the mean scale score, the percentage of students attaining each performance level, and the percentage of students in the “Advanced” and “Proficient” performance levels (Levels 1 & 2) within each subject area. The Demographic Report is generated for three student populations: All Students
Students with Disabilities All Except Students with Disabilities
The demographic subgroup scores are aggregated by school, district, ISD, and state. The demographic subgroups are:
Gender
Ethnicity Economically Disadvantaged (ED) English Language Learners (ELL) Formerly Limited English Proficient (FLEP)
Migrant
Homeless Accommodations subgroups are also reported as follows:
Standard Accommodations (All Students) Non-Standard Accommodations (All Students) Standard Accommodations (for English Language Learners) Non-Standard Accommodations (for English Language Learners)
Please note the following: 1) no summary scores are provided for subgroups containing less than ten students, and 2) stu-dents who have been enrolled in your district for less than one full academic year (LTFAY) at the time of the MEAP assess-ment administration are not reported as a subgroup on this report. Calculation of this data for AYP purposes will be deter-mined from the enrollment data submitted via the Michigan Student Data System (MSDS).
MEAP - FALL 2010 Guide to Reports 36

MICHIGAN EDUCATIONAL ASSESSMENT PROGRAM
Section A identifies the title of the report, the level of aggregation (school, district, ISD, state), the student population in-cluded in the report, the grade level, and the assessment cycle. School, district, and ISD names and codes are included, as applicable.
Section B lists the demographic subgroups, as well as the total student population being reported. Ethnicity subgroups are defined by federal requirements.
Section C reports the number of students included in the subgroup, the mean scale score, the percentage of students attain-ing each performance level, and the percentage of students in the “Advanced” and Proficient” performance levels (Levels 1 & 2) within each subject area.
Note: Results are not reported for groups of <10.
MEAP - FALL 2010 Guide to Reports 37

MICHIGAN EDUCATIONAL ASSESSMENT PROGRAM
MEAP - FALL 2010 Guide to Reports 38
A
B C

MICHIGAN EDUCATIONAL ASSESSMENT PROGRAM
Comprehensive Report Description
The Comprehensive Report provides mean scale score and performance level information for each grade level summary by subject area. The District Comprehensive Report lists data for the district, followed by each public school and PSA that is part of the district. The ISD Comprehensive Report provides the data for the ISD as a whole and for each district and Public School Academy within the ISD.
Section A identifies the title of the report, the level of aggregation (District or ISD), the student population included in the report, the grade level and the assessment cycle. District and ISD names and codes are included as applicable.
Section B identifies the ISD, district, and schools as determined by the report aggregation (District or ISD).
Section C provides the number of students assessed, the mean scale score, the percentage of students attaining each profi-ciency level, and the percentage of students that met or exceeded grade level expectations for Michigan students within each subject area.
MEAP - FALL 2010 Guide to Reports 39

MICHIGAN EDUCATIONAL ASSESSMENT PROGRAM
MEAP - FALL 2010 Guide to Reports 40
A
B
C

MICHIGAN EDUCATIONAL ASSESSMENT PROGRAM
Contact Information School administrators, teachers, and counselors should become familiar with the report layouts and information contained in this document. If you have questions after reviewing this Guide to Reports, or need additional information about MEAP admini-stration procedures, content, scheduling, appropriate assessment of or accommodations for students with disabilities or Eng-lish language learners (ELLs), please contact the Michigan Department of Education, Bureau of Assessment and Accountability, using the contact information listed below:
Bureau of Assessment and Accountability Joseph Martineau, Executive Director
Vincent Dean, Director, Office of Standards and Assessment James Griffiths, Manager, Assessment Administration and Reporting
Kate Cermak, Analyst, Assessment Administration and Reporting Sandra Spencer, MEAP Project Manager, Assessment Administration and Reporting
Andrew Middlestead, Manager, Test Development Rodger Epp, Sr. Assessment Development Coordinator—Science
Wendy Gould, Reading Coordinator Chris Dennis, Writing and Social Studies Coordinator
Kyle Ward, Mathematics Coordinator Linda Howley, Assessment Consultant for Students with Disabilities
Jennifer Paul, Assessment Consultant for English Language Learners Steven Viger, Manager, Measurement Research & Psychometrics
Phone: 1-877-560-8378, option 2 Fax: 517-335-1186
Web site: www.michigan.gov/meap E-mail: [email protected]
MEAP - FALL 2010 Guide to Reports 41