Means, Ends and Dividends - BlackRock
16
BlackRock Investment Institute March 2012 Means, Ends and Dividends Dividend Investing in a New World of Lower Yields and Longer Lives
Transcript of Means, Ends and Dividends - BlackRock
BlackRock Investment InstituteMarch 2012
Means, Ends and DividendsDividend Investing in a New World of Lower Yields and Longer Lives

[ 2 ] M E A N S , E N D S A N D D I V I D E N D S — M A R C H 2 0 1 2
What Is Inside?First Words and Main Takeaways 3
In Search of Income 4
– Invasion of the Snowbirds– Dollar Cost Ravaging– When Cash Loses Money
Investor Attitudes 6
– Theories: Irrelevance, Taxes and Bird in the Hand
– Tax-Fueled Share Buybacks– Practice: Cash Flow and Liquidity– Special Factor: Trading Costs – Real Estate Comparables
Dividend History Lessons 9
– Dividends and Total Return– Dividend Growth Is Key– Style Matters– Dividends and Inflation– Dividend Economics– Bull or Bear? We Almost Don’t Care
Dividend Investing Now 12
– Too Much Momentum? – Value is in the Eye of the Beholder – Payouts: Room to Grow
Last Words 15
About Us
The BlackRock Investment Institute leverages the firm’s expertise across asset classes, client groups and regions. The Institute’s goal is to produce information that makes BlackRock’s portfolio managers better investors and helps deliver positive investment results for clients.
Lee Kempler Executive DirectorEwen Cameron Watt Chief Investment StrategistJack Reerink Executive Editor
The opinions expressed are those of the BlackRock Investment Institute as of March 2012, and may change as subsequent conditions vary.
Quintin Price Head of BlackRock Fundamental Equity
Robert Hayes Head of Client Strategy BlackRock Multi-Asset Client Solutions
Chris Leavy Chief Investment Officer BlackRock US Fundamental Equity
Ewen Cameron Watt Chief Investment Strategist BlackRock Investment Institute

B L A C k R o C k I N V E S T M E N T I N S T I T u T E [ 3 ]
First Words and Main Takeaways
“ Do you know the only thing that gives me pleasure? It’s to see my dividends coming in.”
John D. Rockefeller
The world is graying—fast. The number of people over 65 will triple to a global total of two billion by 2050. People are also living much longer.
When it comes to investing, many retirees will first look for income. Having a predictable and lasting income stream is crucial for paying bills and peace of mind. For pension funds, insurers and endowments, steady income is critical for matching liabilities or supporting charitable goals.
This hunger for income comes at a time when traditional hunting grounds offer less game or have completely vanished. The yields of many top-rated bonds are at record lows. Some actually lose value after factoring in inflation. Some others are too good to be true or too scary to touch.
In this climate, we believe dividend investing to generate income—and income growth—is worth a good look. Surveying the current landscape for dividend investing, we conclude the following:
} High-dividend stocks tend to outperform most other assets in periods of low or no economic growth—exactly where we are now.
} Dividend growth historically has kept up with all but the most extreme inflation environments.
} There is potential for dividend growth: US and European pay-out ratios are at lows while companies are accumulating record cash piles.
} Fund flows show dividend investing has momentum but still plenty of room to grow.
Even for investors not focused on income, dividend stocks offer advantages for long-term capital growth:
} Dividend growth has been a key driver of total return in the long run.
} Reinvesting dividends has made all the difference in boosting long-term equity returns
} High dividend stocks have tended to do better than other shares in both bull and bear markets.
To be sure, dividend investing is no cure-all for fulfilling all retirement needs or closing the pension funding gap. It is a bit more complicated than buying a basket of high-yielding stocks. Consider:
} Other asset classes, including investment-grade and high-yield bonds, have tended to outperform dividend stocks during economic downturns.
} Dividend yields and growth do not impact short-term results: Capital moves will swamp dividend contributions in most 12-month periods.
} There are signs high yielders are becoming pricey by historical standards compared with growth stocks. For income investors, however, this may be a moot point.
} High-yielding stocks with no dividend growth tend to underperform those companies that increase dividends over time.
This publication focuses on the pros and cons of dividend investing. Other strategies to generate income, such as high-yield debt, real estate, alternatives, preferred shares, covered call options, real estate investment funds or energy income trusts, fall outside this publication’s scope.

[ 4 ] M E A N S , E N D S A N D D I V I D E N D S — M A R C H 2 0 1 2
In Search of Income
People are living much longer, requiring income streams that can support them for longer periods of time.
For example, the average 65-year-old in Greece will live to the age of 84 these days, according to OECD data. That is a big pension hole to plug for a country where people retire early and funds are short. In recession-struck Spain, the average 65-year-old will live an additional two decades to 85, six years longer than 40 years ago. For the UK, the numbers are similar.
For every US couple aged 65, at least one of them will live to be 92, according to a 2000 study by the Society of Actuaries. This is great news (if the couple gets along), but it is terrible for retirement provision. Japanese couples aged 65 on average live an additional 22 years these days, up from just 13 in 1960.
Globally, people on average now live to be 68 years old, up from 48 in the early 1950s, according to the United Nations. See the following chart for a breakdown by continent. This translates into higher retirement income needs.
Invasion of the Snowbirds Two demographic trends are driving investor appetite for income: much higher life expectancies and an explosion in the number of pensioners around the world.
The global retirement population will almost triple to 2 billion by 2050, according to a United Nations estimate. Numbers vary by region, with an expected doubling in the United States and Canada to 125 million retirees and a 50% increase in Europe to 236 million. See chart below.
Asia 400 mln
Europe 159 mln
North America 63 mln
Latin America 57 mln
Africa 54 mln
Oceania 5 mln
1236 mln
236 mln
125 mln
186 mln
213 mln
12 mln
2009738 Million Retirees
20502 Billion Retirees
35
30
25
15
5
10
20
0
Fund
Net
Ass
et V
alue
Time
Accumulation Creates Value Erodes ValueDecumulation
Accumulation
Buy Fewer Units Sell Fewer Units
Decumulation
Accumulation
Buy More Units Sell More Units
Decumulation
1950-1955 2005-2010
40 55
50 7060 75
40 70
65 7570 80
World Retirement BoomThe Number of People Aged 60 and older Will Triple to Two Billion
Dollar Cost RavagingSelling More of Your Investment Portfolio When Prices Are Low
Living Longer Around the WorldAverage Life Expectancy at Birth 1950-1955 and 2005-2010
Source: United Nations Population Ageing and Development 2009.
Source: United Nations Population Division, April 2011.
Source: BlackRock.
Dollar Cost Ravaging Invest a set amount of money in a particular investment or portfolio each month, and the law of the averages says you will do very well over time. You will buy fewer units when prices are high and accumulate more when prices are low. This mantra of dollar cost averaging has been drilled into every investor’s mind from the first baby steps into financial markets.
This basic value strategy may work for so-called accumulators: younger investors who are building a nest egg. It definitely does not work for those who are decumulating: Retirees who spend a set dollar amount of their savings each month to pay daily bills.

B L A C k R o C k I N V E S T M E N T I N S T I T u T E [ 5 ]
’01 ’03 ’11’07’05 ’09 ’01 ’03 ’11’07’05 ’09
6
3
-3
0
United States
Yiel
d (%
)
6
3
-3
0
’01 ’03 ’11’07’05 ’09
Japan
Yiel
d (%
)
6
3
-3
0
United Kingdom
Yiel
d (%
)
Stock Index YieldInflation Rate10-Year Government Bond Yield
Got Income?Real Bond Yields Have Turned Negative in Many Developed Markets
Source: Thomson Reuters.
Note: Stock index dividend yields based on S&P 500, TOPIX and FTSE All Shares.
In fact, dollar cost averaging becomes “dollar cost ravaging” in retirement. See previous chart. Pensioners sell more units when prices are low and fewer when prices are high. It is the mirror image of dollar cost averaging, as the chart below shows. This principle shows it is crucial for a portfolio to generate income in the decumulation period. Otherwise, the portfolio will not last very long.
When Cash Loses Money Inflation can have a devastating impact on savings over longer periods of time. For example, annual inflation of just 3% cuts the purchasing power of a $100,000 cash hoard in half over 25 years. See chart opposite.
The impact of inflation shows putting money under the mattress is not a viable long-term strategy. Nor can it be used as a bedding substitute (too much rustling).
Basic costs of living soar over time—even in periods of relatively low inflation. In the two decades ending 2008, US gas prices tripled, costs of utilities doubled and food prices rose by more than two thirds, according to the US Bureau of Labor Statistics.
It is a sobering thought for people looking to retire soon. As we have seen, most people aged 65 in the developed world can expect to live an additional 20 years. The force of inflation brings home the need to preserve real income in retirement. Two recent trends are whetting investor appetite for income even more: stretched government budgets and ultra-low bond yields in most countries.
It has become clear many governments are unlikely to plug widening pension funding gaps. We believe government pension outlays simply cannot keep pace with the growing number of pensioners and increased life expectancies. Many governments are already curbing spending wherever they can. As a result, people will not be able to rely on government benefits alone for adequate income.
A Savings KillerPurchasing Power of $100,000 over 25 Years in Two Inflation Scenarios
Source: BlackRock.
$100,000
$0
80,000
60,000
40,000
20,000
0 5 10 15 20 25
5% Inflation Rate3% Inflation Rate
Interest from cash and low-yielding bonds alone is unlikely to pay for retirement, especially taking into account inflation. In fact, average dividend yields now outstrip yields on benchmark 10-year government bonds in many developed markets. See chart below.
The ultra-low yields have caused pension funding gaps around the world to widen. Most countries have more than two-fifths of their pension assets in cash or in fixed income—which is earning next to nothing or actually losing money. Some even have more than 60 percent in bonds and cash, according to a Towers Watson 2012 pension assets study.
[ 6 ] M E A N S , E N D S A N D D I V I D E N D S — M A R C H 2 0 1 2
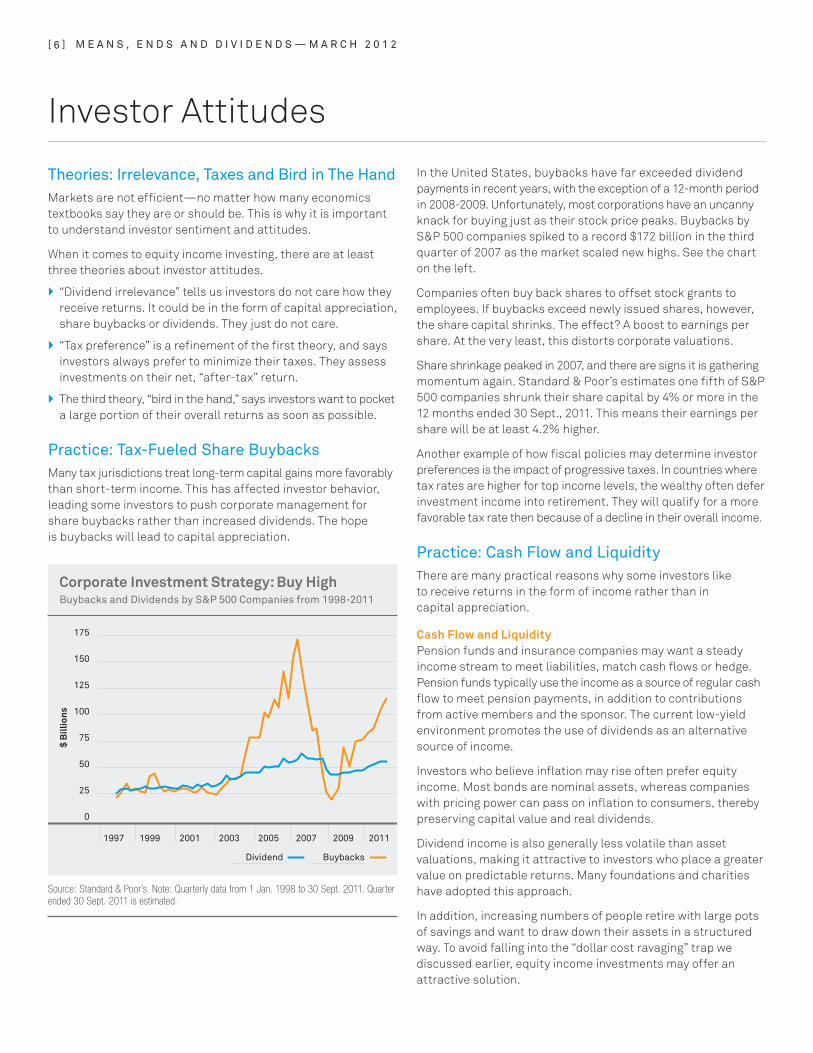
Corporate Investment Strategy: Buy HighBuybacks and Dividends by S&P 500 Companies from 1998-2011
Source: Standard & Poor’s. Note: Quarterly data from 1 Jan. 1998 to 30 Sept. 2011. Quarter ended 30 Sept. 2011 is estimated.
Theories: Irrelevance, Taxes and Bird in The HandMarkets are not efficient—no matter how many economics textbooks say they are or should be. This is why it is important to understand investor sentiment and attitudes.
When it comes to equity income investing, there are at least three theories about investor attitudes.
} “Dividend irrelevance” tells us investors do not care how they receive returns. It could be in the form of capital appreciation, share buybacks or dividends. They just do not care.
} “Tax preference” is a refinement of the first theory, and says investors always prefer to minimize their taxes. They assess investments on their net, “after-tax” return.
} The third theory, “bird in the hand,” says investors want to pocket a large portion of their overall returns as soon as possible.
Practice: Tax-Fueled Share Buybacks Many tax jurisdictions treat long-term capital gains more favorably than short-term income. This has affected investor behavior, leading some investors to push corporate management for share buybacks rather than increased dividends. The hope is buybacks will lead to capital appreciation.
In the United States, buybacks have far exceeded dividend payments in recent years, with the exception of a 12-month period in 2008-2009. Unfortunately, most corporations have an uncanny knack for buying just as their stock price peaks. Buybacks by S&P 500 companies spiked to a record $172 billion in the third quarter of 2007 as the market scaled new highs. See the chart on the left.
Companies often buy back shares to offset stock grants to employees. If buybacks exceed newly issued shares, however, the share capital shrinks. The effect? A boost to earnings per share. At the very least, this distorts corporate valuations.
Share shrinkage peaked in 2007, and there are signs it is gathering momentum again. Standard & Poor’s estimates one fifth of S&P 500 companies shrunk their share capital by 4% or more in the 12 months ended 30 Sept., 2011. This means their earnings per share will be at least 4.2% higher.
Another example of how fiscal policies may determine investor preferences is the impact of progressive taxes. In countries where tax rates are higher for top income levels, the wealthy often defer investment income into retirement. They will qualify for a more favorable tax rate then because of a decline in their overall income.
Practice: Cash Flow and LiquidityThere are many practical reasons why some investors like to receive returns in the form of income rather than in capital appreciation.
Cash Flow and LiquidityPension funds and insurance companies may want a steady income stream to meet liabilities, match cash flows or hedge. Pension funds typically use the income as a source of regular cash flow to meet pension payments, in addition to contributions from active members and the sponsor. The current low-yield environment promotes the use of dividends as an alternative source of income.
Investors who believe inflation may rise often prefer equity income. Most bonds are nominal assets, whereas companies with pricing power can pass on inflation to consumers, thereby preserving capital value and real dividends.
Dividend income is also generally less volatile than asset valuations, making it attractive to investors who place a greater value on predictable returns. Many foundations and charities have adopted this approach.
In addition, increasing numbers of people retire with large pots of savings and want to draw down their assets in a structured way. To avoid falling into the “dollar cost ravaging” trap we discussed earlier, equity income investments may offer an attractive solution.
175
150
125
100
75
50
25
0
$ B
illio
ns
BuybacksDividend
1999 2001 2003 2007 20091997 2005 2011
Investor Attitudes

6
0
1
2
3
4
5
Aver
age
Hol
ding
Per
iod
(Yea
rs)
London SE
1991 1993 1995 1997 1999 2001 2003 2005 2007 2009 2010
Tokyo ExchangeDeutsche Boerse
NYSE NASDAQ
B L A C k R o C k I N V E S T M E N T I N S T I T u T E [ 7 ]
LiquidityLiquidity—buying and selling securities with minimum price disturbance—dries up in a market crisis. This means some investors will be sellers at a time and at a price that is not of their own choosing. Investing in high-yielding assets, including dividend-paying companies, reduces or avoids the need to sell assets during those periods.
This is why a lack of liquidity can provide a powerful reason for income investing. It is especially attractive at a time when some fixed-income markets have frozen up, particularly in the eurozone. Bid-offer spreads widened and markets became shallow as the European debt crisis intensified toward the end of 2011.
Investors’ desire for liquidity is reflected in valuations of hard-to-trade privately held companies. Private firms are typically valued at sizable discounts to comparable publicly traded firms (Stanley Block, 2007,”The Liquidity Discount in Valuing Privately Owned Companies”).
Downside Protection and Upside PotentialSome investors choose to invest in high-dividend stocks as downside protection. Whenever income represents a large element of the expected total return, the time to receive back an initial investment is shorter than waiting for capital growth.
This means the investor is less dependent on long-term assumptions about capital growth. This is a good thing: The longer the time horizon, the lower the probability of a correct forecast. Income investing effectively uses a time discount that places greater value on near-term returns.
Other investors, by contrast, may be interested in dividend investing because they also want exposure to the upside of stock price appreciation.
Special Factor: Trading Costs Trading costs for most securities are small, but they can add up over time. In a period of low or modest returns, transaction costs take a proportionately bigger chunk out of the returns. In that case, investors may prefer to hold assets longer. They will choose assets for their yield rather than hoping for an expected capital gain that would require a sale transaction to realise.
The average holding period for equities declined on most stock exchanges over the last decades, although it has increased slightly since the financial crisis. For example, investors held NYSE stocks for an average of two years in 1991 but only for five months in 2008. The average holding period increased slightly to eight months in 2010. See chart above right.
We’re NOT in for the Long HaulAverage Holding Periods of Stocks
Source: World Federation of Exchanges.
Note: The average holding period is the average total market value divided by the total value of trading in each year. London Stock Exchange data are consolidated with London SE Group from 2009 after the merger with Borsa Italiana.
The trend toward shorter holding periods reflects lower transaction costs. This was spurred by innovations in information technology and increased competition thanks to deregulation. Bid-offer prices on the NYSE are now in pennies while spreads on major currency pairs are 1 to 4 basis points—a far cry from the situation two decades ago. Shorter holding periods also reflect the emergence of investment trends that generate more trading, such as exchange-traded funds and certain hedge fund strategies.
As a result, will investors just merrily trade along and not worry about the balance between capital and income as sources of return?
Not necessarily. In a prolonged period of low yields, avoidance of even very cheap transaction costs can become an important consideration.
Another incentive to hold stocks longer could result from policy moves to discourage short-term trading. A prime example is the possible introduction of so-called “Tobin taxes,” named after Nobel Laureate James Tobin, who suggested a currency transaction tax in the 1970s.
A doubling of the Swedish financial transaction tax in 1986 resulted in a 60% decline in turnover of the 11 most actively traded stocks on the Stockholm exchange (Steven Umlauf, 1993, “Transaction Taxes and the Behaviour of the Swedish Stock Market”).

[ 8 ] M E A N S , E N D S A N D D I V I D E N D S — M A R C H 2 0 1 2
Real Estate Comparables Real estate has always been a key area for income investing. Whereas most equity investors are focused on capital appreciation, rental yields underpin almost all valuation metrics in real estate investing. Real estate enhancements are mostly meant to extend or increase the rental income stream. Underlying the focus on yield are real estate’s high transaction costs and low liquidity. This plays a lesser role in equities these days, as we have seen, except during times of market stress.
Similar to equity investors, real estate investors may prefer either income or capital growth. Low-risk core real estate holdings fall into the first category. They typically are fully leased and generate a stable income stream over a set period of time. By contrast, investments in developments are for growth potential. Greenfield sites are unlikely to generate any income on the day of purchase. Development and the subsequent sale or leasing takes time and is fraught with risks of cost overruns, fewer-than-expected tenants and disappointing rents.
Rental income is often very stable. For example, rents are typically reviewed and increased once every five years or longer in the UK. This means real estate owners may miss out on a spike in rents, but it also puts a floor under the income stream. Contracts tend to be linked to indices in the eurozone, while tenants pay a set amount agreed at the start of the lease in the United States.
One of the drawbacks of real estate, illiquidity, is the counterpoint to the long-term stable income that it yields. Liquidity usually comes at a premium, as illustrated by the valuations of listed real estate investment trusts. Unlisted real estate is generally higher up the risk-return scale, and more appropriate for long-term investors such as pension funds, insurers and charitable foundations.
There is some evidence investors hang on to high-yielding stocks longer. The average stock traded on the NYSE was held three times longer than the average NASDAQ stock the past two decades, according to World Federation of Exchanges data.
This mirrors differences in yield: The top 100 NYSE stocks yield about 2.5%, almost triple the yield of the top 100 NASDAQ stocks (as measured by the dividend yields of the iShares NYSE 100 Index Fund and the PowerShares QQQ fund).
6.0
4.0
2.0
0.0
-2.0
-4.0
Rea
l Ret
urns
(%)
Total Annualized ReturnMultiple Expansion
Dividend GrowthDividend Yield
JapanUK US France Germany Australia Canada
1,5001,4001,3001,2001,1001,000
900800700600
400
100200
500
300
0
Rea
l Ret
urn
Inde
x (1
965
is 1
00)
Capital OnlyDividends Reinvested
1965 1974 1984 1994 2004 2011
B L A C k R o C k I N V E S T M E N T I N S T I T u T E [ 9 ]
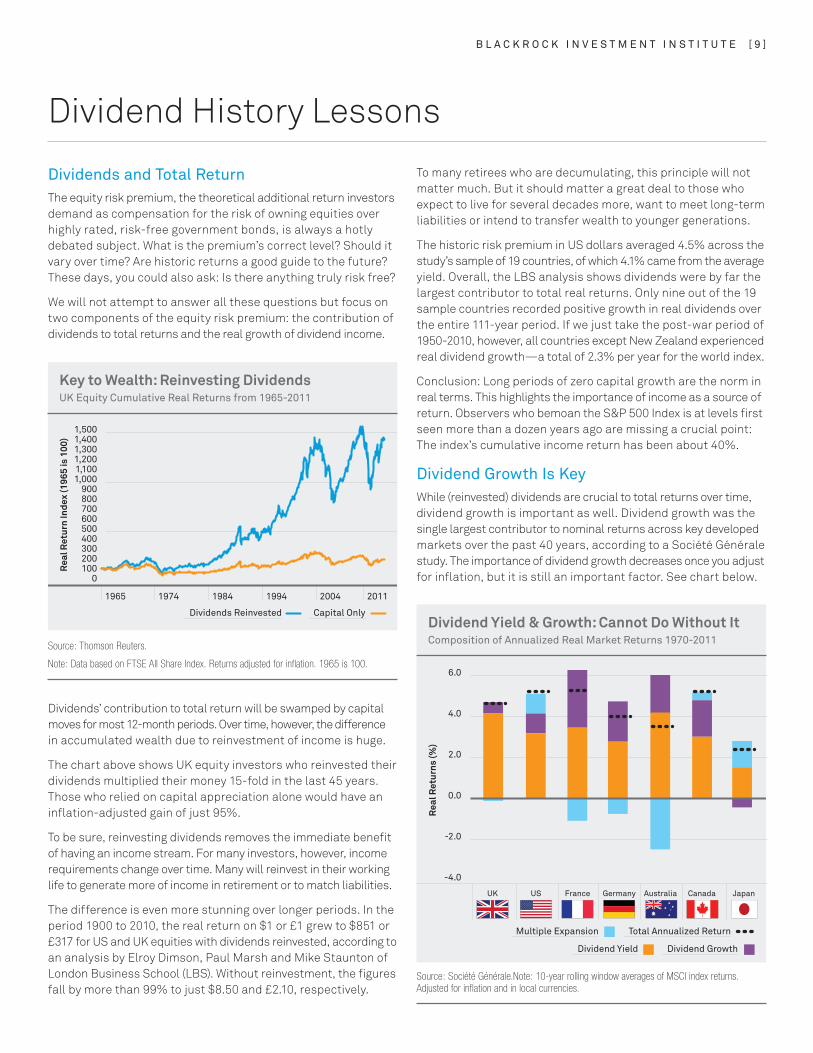
Key to Wealth: Reinvesting Dividendsuk Equity Cumulative Real Returns from 1965-2011
Source: Thomson Reuters.
Note: Data based on FTSE All Share Index. Returns adjusted for inflation. 1965 is 100.
Dividend History Lessons
Dividends and Total Return The equity risk premium, the theoretical additional return investors demand as compensation for the risk of owning equities over highly rated, risk-free government bonds, is always a hotly debated subject. What is the premium’s correct level? Should it vary over time? Are historic returns a good guide to the future? These days, you could also ask: Is there anything truly risk free?
We will not attempt to answer all these questions but focus on two components of the equity risk premium: the contribution of dividends to total returns and the real growth of dividend income.
Dividends’ contribution to total return will be swamped by capital moves for most 12-month periods. Over time, however, the difference in accumulated wealth due to reinvestment of income is huge.
The chart above shows UK equity investors who reinvested their dividends multiplied their money 15-fold in the last 45 years. Those who relied on capital appreciation alone would have an inflation-adjusted gain of just 95%.
To be sure, reinvesting dividends removes the immediate benefit of having an income stream. For many investors, however, income requirements change over time. Many will reinvest in their working life to generate more of income in retirement or to match liabilities.
The difference is even more stunning over longer periods. In the period 1900 to 2010, the real return on $1 or £1 grew to $851 or £317 for US and UK equities with dividends reinvested, according to an analysis by Elroy Dimson, Paul Marsh and Mike Staunton of London Business School (LBS). Without reinvestment, the figures fall by more than 99% to just $8.50 and £2.10, respectively.
To many retirees who are decumulating, this principle will not matter much. But it should matter a great deal to those who expect to live for several decades more, want to meet long-term liabilities or intend to transfer wealth to younger generations.
The historic risk premium in US dollars averaged 4.5% across the study’s sample of 19 countries, of which 4.1% came from the average yield. Overall, the LBS analysis shows dividends were by far the largest contributor to total real returns. Only nine out of the 19 sample countries recorded positive growth in real dividends over the entire 111-year period. If we just take the post-war period of 1950-2010, however, all countries except New Zealand experienced real dividend growth—a total of 2.3% per year for the world index.
Conclusion: Long periods of zero capital growth are the norm in real terms. This highlights the importance of income as a source of return. Observers who bemoan the S&P 500 Index is at levels first seen more than a dozen years ago are missing a crucial point: The index’s cumulative income return has been about 40%.
Dividend Growth Is keyWhile (reinvested) dividends are crucial to total returns over time, dividend growth is important as well. Dividend growth was the single largest contributor to nominal returns across key developed markets over the past 40 years, according to a Société Générale study. The importance of dividend growth decreases once you adjust for inflation, but it is still an important factor. See chart below.
Dividend Yield & Growth: Cannot Do Without ItComposition of Annualized Real Market Returns 1970-2011
Source: Société Générale.Note: 10-year rolling window averages of MSCI index returns. Adjusted for inflation and in local currencies.

10
8
6
4
2
0
Div
iden
d G
row
th (%
)
Inflation Level (%)
<2% 2-4% 4-6% 6-10% >10%
[ 10 ] M E A N S , E N D S A N D D I V I D E N D S — M A R C H 2 0 1 2
A Powerful Combo: Dividend Growth and YieldHypothetical Returns on a $10,000 Investment 1988-2011
An Inflation Hedge—Most of the TimeGlobal Dividend Growth Rates at Different Inflation Levels 1966-2011
Sources: Merrill Lynch Global Quantitative Strategy, MSCI & Worldscope.
Note: Nominal returns of stocks in the MSCI All Country World Index with above-average and below-average dividend yield and growth. Data to 31 March, 2011.
Sources: BlackRock, Bloomberg.
Note: Divided growth of S&P 500 companies in the period January 1966 – February 2011. Inflation data is the annual Consumer Price Index.
High Dividend Yield &High Dividend Growth
Higher Return/Lower Volatility
Higher Volatility/Lower Return
Higher Dividend Yield
Higher Dividend Yield& Low Dividend Growth
MSCI AllCountry World
18
16
14
12
10
6
8
Ann
ualiz
ed R
etur
n (%
)
Risk (%)
16.5 17 17.5 18 18.5
The beneficial compounding impact of dividend yields becomes increasingly pronounced over time, as does the impact of dividend growth. See the chart below.
The chart also shows high-yielding stocks with no dividend growth actually underperform the broader market. And if a company cuts its dividend, its stock price often drops. Investors then face the double whammy of lower yield and capital loss.
Style Matters How do dividend investors manage their income stream? There are four basic strategies:
1 A passive strategy that collects or reinvests the income on an index.
2 An approach based on investing in above-average yielding stocks with the objective of generating long-term superior returns. The assumption is the capital values will keep pace with the wider market. Essentially this is a straightforward “value investing” approach based on a single factor.
Value stocks outperform growth stocks over time, both in Europe (measured over 16 years), the United States (38 years) and Japan (26 years), according to a 2010 Journal of Portfolio Management research paper by Stan Beckers and Jolly Ann Thomas.
The research, which focused on the characteristics and predictability of 13 MSCI Barra styles, found dividend yield had a statistically significant risk premium in Europe, but not in the United States (it was unproven for Japan). The outcome differed by style and by region, with the correlation of dividend yield strategies between Europe and the United States at just 0.31. By contrast, volatility and momentum styles correlated 0.77 and 0.67 between the two regions, respectively. The outcome of
dividend yield strategies did not differ in economic expansions or recessions, except in the United States. There, it outperformed during recessions.
3 Investing in companies that have a better-than-average starting yield and increase their dividend payments faster than the market over time. The assumption is the market underestimates or undervalues the potential superior return.
4 Active management of a portfolio with the objective to generate income. An example is buying shares ahead of dividend payments. This is the approach followed by some equity income and insurance funds that are restricted from paying out capital as income to investors. Here the assumption is other investors will not fully discount the cash payment when shares go “ex-dividend.”
Dividends and InvestingInflation is a silent killer for savings, as we have seen. Fixed-income assets usually only provide nominal income, which invariably is eroded by rising inflation. The big exceptions are inflation-linked instruments such as US TIPS or UK Linkers.
In the inflationary 1970s, bonds were known as “certificates of confiscation.” Today, with ultra-low nominal and negative real yields, there is a good argument for reviving the old tag. Inflation does not even have to rise for this to be an apt description for many bonds. Equities can provide an inflation shelter because of capital appreciation and the ability of (some) companies to pass on price hikes to customers. Therefore, investors who want an inflation hedge may pick stocks that offer future dividend growth.
30
20
10
0
-10
-30
-20
Aver
age
Ret
urns
(%)
S&P Non-Dividend PayersS&P Equal Weight Index
S&P Dividend Payers
Bull Markets Bear Markets Overall
Low Growth High Growth
AllEquity
High Dividend Equity
Invest-mentGradeBonds
High YieldBonds
12
8
4
0
-4
-8
-12
Negative Growth
Tota
l Ret
urn
(%)
AllEquity
High Dividend Equity
Invest-mentGradeBonds
High YieldBonds
12
8
4
0
-4
-8
-12
Tota
l Ret
urn
(%)
AllEquity
High Dividend Equity
Invest-mentGradeBonds
High YieldBonds
12
8
4
0
-4
-8
-12
Tota
l Ret
urn
(%)
B L A C k R o C k I N V E S T M E N T I N S T I T u T E [ 11 ]
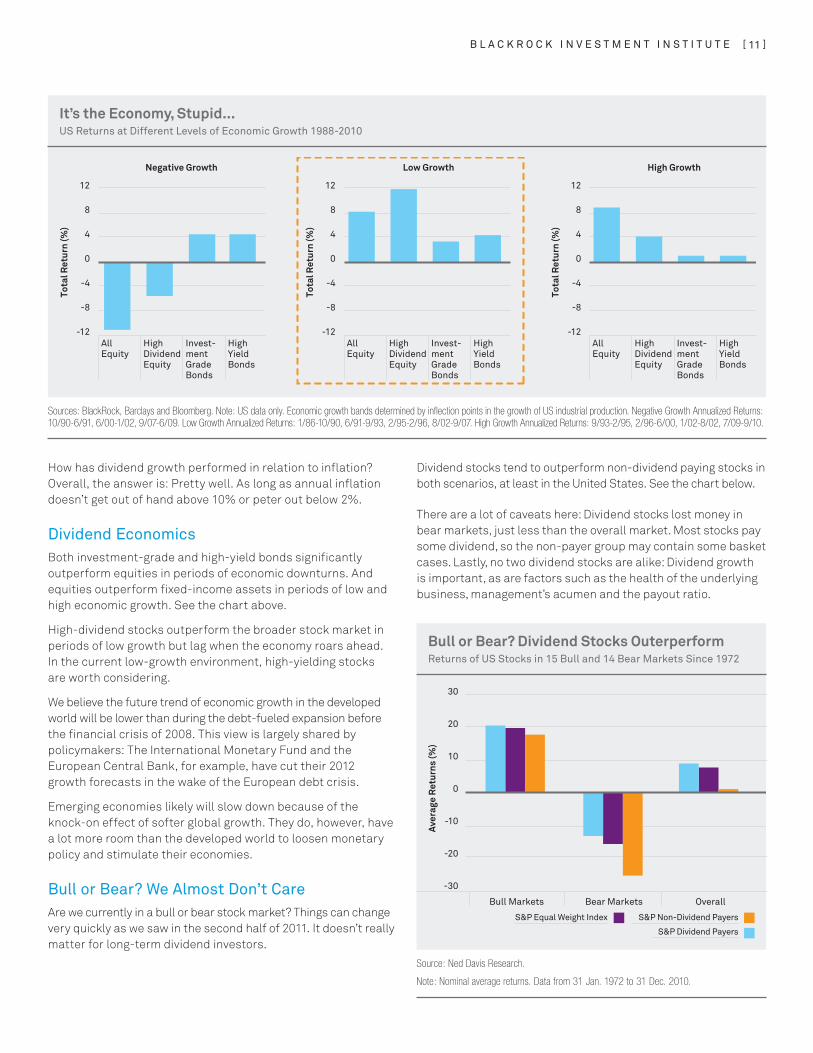
It’s the Economy, Stupid...uS Returns at Different Levels of Economic Growth 1988-2010
Sources: BlackRock, Barclays and Bloomberg. Note: US data only. Economic growth bands determined by inflection points in the growth of US industrial production. Negative Growth Annualized Returns: 10/90-6/91, 6/00-1/02, 9/07-6/09. Low Growth Annualized Returns: 1/86-10/90, 6/91-9/93, 2/95-2/96, 8/02-9/07. High Growth Annualized Returns: 9/93-2/95, 2/96-6/00, 1/02-8/02, 7/09-9/10.
How has dividend growth performed in relation to inflation? Overall, the answer is: Pretty well. As long as annual inflation doesn’t get out of hand above 10% or peter out below 2%.
Dividend Economics Both investment-grade and high-yield bonds significantly outperform equities in periods of economic downturns. And equities outperform fixed-income assets in periods of low and high economic growth. See the chart above.
High-dividend stocks outperform the broader stock market in periods of low growth but lag when the economy roars ahead. In the current low-growth environment, high-yielding stocks are worth considering.
We believe the future trend of economic growth in the developed world will be lower than during the debt-fueled expansion before the financial crisis of 2008. This view is largely shared by policymakers: The International Monetary Fund and the European Central Bank, for example, have cut their 2012 growth forecasts in the wake of the European debt crisis.
Emerging economies likely will slow down because of the knock-on effect of softer global growth. They do, however, have a lot more room than the developed world to loosen monetary policy and stimulate their economies.
Bull or Bear? We Almost Don’t CareAre we currently in a bull or bear stock market? Things can change very quickly as we saw in the second half of 2011. It doesn’t really matter for long-term dividend investors.
Dividend stocks tend to outperform non-dividend paying stocks in both scenarios, at least in the United States. See the chart below.
There are a lot of caveats here: Dividend stocks lost money in bear markets, just less than the overall market. Most stocks pay some dividend, so the non-payer group may contain some basket cases. Lastly, no two dividend stocks are alike: Dividend growth is important, as are factors such as the health of the underlying business, management’s acumen and the payout ratio.
Bull or Bear? Dividend Stocks OuterperformReturns of uS Stocks in 15 Bull and 14 Bear Markets Since 1972
Source: Ned Davis Research.
Note: Nominal average returns. Data from 31 Jan. 1972 to 31 Dec. 2010.

400
300
200
100
0
-100
-300
-200
Net
Fun
d Fl
ows
in $
Bill
ions
2007 2008 2009 2010 2011
Total Bond Total Equity Capital Appreciation
IncomeGrowth & Income
2.5 25
2.0 20
1.5 15
1.0 10
0.5 5
0.0 0
-0.5 -5
Net
Fun
d Fl
ows
in $
Bill
ions
Percentage of AUM
2008 2009 2010 2011
2.5
2.0
1.5
1.0
0.5
0.0
-0.5
25
20
15
10
5
0
-5
Net
Fun
d Fl
ows
in $
Bill
ions
Percentage of AUM
2008 2009 2010 2011
[ 12 ] M E A N S , E N D S A N D D I V I D E N D S — M A R C H 2 0 1 2
Dividend Investing Now
Too Much Momentum?There is evidence investors are warming to dividend investing. For example, net inflows into iShares dividend funds have been positive for 14 of the last 16 quarters, and show a rising trend. See the chart below.
Dividend fund inflows have started to make up a bigger percentage of iShares’ inflows. They rose to 26% of the global equity total in the fourth quarter, up from 6% a year earlier.
Momentum Is BuildingiShares Dividend Fund Flows 2008-2011
Time for a ReversalFund Flows Into uS Equity and Bond Funds 2007-2011
Low-Dividend Stocks Are Getting CheaperEarnings Yield Gap Between High- and Low- Dividend Stocks in Russell 1,000 Index
Source: BlackRock.
Note: Bars represent quarterly in- and out-flows into iShares DVY, HDV, IDV and PFF funds. The line represents what percentage fund flows made up of total assets under management in the segment that quarter.
Source: BlackRock and Russell Investments.
Note: Earnings yield differential is based on subtracting the earnings yield of the bottom quintile of dividend payers in the Russell 1000 Index from the top quintile. Monthly data from 29 Nov. 1985 to 31 Oct. 2011
Source: Investment Company Institute.
Note: Total US equity and bond flows include both domestic and foreign open-ended funds. Excludes exchange-traded funds and closed-end funds.
Is dividend investing too popular? Or in financial speak: Is this trade too crowded?
The answer is: Probably not—yet.
On the one hand, it is clear investors are starting to catch on to the idea of generating equity income in a world starved for yield.
On the other hand, it appears there is room for a lot more. For example, flows into actively managed US equity income funds still pale in comparison to overall flows into US taxable fixed-income funds. Investors put $20 billion of new money into the first group in the first 11 months of 2011, compared with $120 billion into the latter group, according to Strategic Insight.
The chart above right shows the comparative fund flows into US equity and bond mutual funds over the past five years, illustrating the dominance of fixed-income fund flows.
Value Is in the Eye of the BeholderThis brings us to another question: Do dividend stocks still offer good value?
9
8
7
6
5
4
3
2
1
0
Earn
ings
Yie
ld D
iffe
rent
ial (
%)
’85 ’87 ’89 ’91 ’93 ’95 ’97 ’99 ’01 ’03 ’05 ’07 ’09 ’11

70
60
50
40
30
20
Div
iden
d Pa
yout
Rat
io (%
)
’85 ’87 ’89 ’91 ’93 ’95 ’97 ’99 ’01 ’03 ’05 ’07 ’09 ’11
Pan-EuropeUS
25
20
15
10
5
Pric
e/Ea
rnin
gs R
atio
’87 ’89 ’91 ’93 ’95 ’97 ’99 ’01 ’03 ’05 ’07 ’09 ’11
Second QuintileFirst Quintile
B L A C k R o C k I N V E S T M E N T I N S T I T u T E [ 13 ]
In the International Bargain BinForward Price/Earnings Ratios of Non-uS Developed Market Dividend Stocks 1987-2011
Room to GrowDividend Payout Ratios for European and uS Companies 1986-2011
Source: Empirical Research Partners.
Note: First and second quintile capitalization-weighted data to 1 Dec. 2011. Custom universe that consist of the top 85% market capitalization in each of 23 developed countries in five regions: Canada, UK, Continental Europe, Japan and Asia ex-Japan.
Source: Empirical Research Partners.
Note: Data based on 6-month moving averages. Data from December 1986 to July 2011.
High yielders usually have traded at a discount to the overall market and to growth stocks in particular. One reason is many high dividend payers are slow growing, reducing the odds for a jump in their stock prices.
Another reason is how we read and hear about the stock market. With all the attention focused on equity prices and the performance of stock market indices, sales teams and portfolio managers find it easier to explain their investment decisions by focusing on capital appreciation than on dividends.
The dividend discount has been narrowing, however, in the recent “lost decade” for stocks as equity investors started to look for both income and stability. The differential between dividend and growth stocks is now at record lows for US stocks, making high-dividend stocks relatively expensive by historical standards. See previous chart.
The flipside of this argument? US investors, fed up with the stock market’s poor capital appreciation in the past decade, have reassessed the value of dividend stocks. In addition, it is no use comparing higher-dividend stocks with lower-dividend stocks if your primary focus is equity income.
The trend toward a new appreciation for dividend stocks is not as pronounced in other regions.
Top non-US dividend stocks are reasonably priced at less than 10 times forward earnings, according to Empirical Research Partners. This is the only time that has happened since the early 1990s with the exception of the 2008-2009 financial crisis. In addition, the top quintile of dividend payers is still valued at a
discount to the second quintile in non-US developed markets, Empirical Research shows. See previous chart.
Even the top dividend payers among US large-capitalization stocks remain good value by absolute standards, trading at less than 12 times forward earnings, according to Empirical. This is the cheapest they have been in the last decade, with the exception of the period during the recent financial crisis.
Payouts: Room to Grow As we have seen before, stocks with a high dividend yield but low dividend growth tend to underperform the broader market.
This is why it is important to review payout ratios—what percentage of earnings companies pay out in dividends. Dividend payout is a function of many factors. Earnings growth is one of them, while strength of balance sheet and current payout levels are others.
While earnings growth is currently moderating, company balance sheets have more cash and are stronger than ever. Payout ratios are modest around the world, and at record lows in the United States. See the chart below.
The 27% payout ratio of US companies is about half the market’s historical average. We would expect to see a return to “normal” payout ratios and an opportunity for investors to collect even higher levels of income. The case for Europe is weaker with payout ratios averaging more than 40%—low but not unusually low.

20
18
16
14
12
10
8
6
4
0
2
Earn
ings
Yie
ld (%
)
’85 ’87 ’89 ’91 ’93 ’95 ’97 ’99 ’01 ’03 ’05 ’07 ’09 ’11
Expensive
Cheap
Low PayoutHigh Payout
3,000
2,500
2,000
1,500
1,000
500
0
Div
iden
d Ch
ange
s
Increases Resumptions Decreases
2004 2005 2006 2007 2008 2009 2010 2011
[ 14 ] M E A N S , E N D S A N D D I V I D E N D S — M A R C H 2 0 1 2
On the UpswingDividend Changes by uS Companies 2004-2011
Free Cash Flow = ValueValuation of High and Low Dividend Stocks Among Free Cash Flow Companies
Source: Standard & Poor’s.
Note: Dividend announcements by companies listed on the New York Stock Exchange, NASDAQ and American Stock Exchange. Increases are regular dividend increases and special dividends. Decreases are dividend cuts and omissions. Quarterly data from 1 Jan. 2004 to 30 Sept. 2011. Quarter ended 30 Sept. 2011 is estimated.
Sources: BlackRock and Russell Investments.
Note: Earnings yield of high- and low-dividend paying companies that are in the top quintile of free cash flow companies in the Russell 1000 Index. Monthly data from 29 Nov. 1985 to 31 Oct. 2011.
Dividend payments have indeed been on the rise in the US market. After sliding in 2009, more companies are increasing dividends and fewer are cutting. See chart above.
The key question is: Will the current low-dividend payers increase payouts?
It is impossible to answer this question without drilling down to the individual company—and even then it is tough to divine corporate management’s intentions and ability to deliver.
Indeed, payout ratios are but one factor investors should consider in selecting stocks for dividend growth. Others include the strength of the underlying business, the economic environment, management’s acumen and the company’s history of payouts.
We can, however, say which companies at least have the capability to raise dividends.
This is why it is worth focusing on companies with strong free cash flows. Overall, these companies offer good value—the best in a decade in the US market with the exception of the financial crisis of 2008-2009.
Of the companies with strong cash flows (defined here as the top quintile of the Russell 1000 Index), the ones that pay no or few dividends now trade at a discount to the high yielders. This is unusual—at least in recent history—and suggests US companies with strong cash flows and low dividends currently offer compelling value. See the chart below.

B L A C k R o C k I N V E S T M E N T I N S T I T u T E [ 15 ]
Last Words
} Dividend yields and dividend growth are also crucial components of total return. As a result, they offer an appealing investment strategy for investors who take the long view and are not forced to sell assets prematurely.
} There are signs dividend stocks have become pricey in comparison with growth stocks, particularly in the US market. And there is a lot of momentum behind dividend investing—arguably too much momentum for comfort.
} On the other hand, dividend stocks remain reasonably priced by their own historical standards—including in the US market. Dividend fund flows pale in comparison with investor monies going into taxable bond funds. And the key to outperformance is dividend growth, not yield.
} Companies have plenty of room to increase dividends because they currently are paying out a low percentage of earnings. Recent trends confirm US companies have been raising dividends.
} Research suggests the best values for capital appreciation are now companies with strong cash flows that have the ability to raise dividends rather than the ones that currently pay out high dividends.
} Living longer and low interest rates do not seem like a problem—unless you are actually getting older or have to match your portfolio’s liabilities. The bottom line: Dividend stocks can be a means to an end in the new world of longer lives and lower yields.
The search for income has only just started. The size of the global retirement population will triple by 2050, people are growing much older and pension benefits are diminishing.
} Investors hunting for yield have few places to go. Current income from cash and low-yielding “risk-free” bonds is not enough because inflation will inevitably erode purchasing power.
} Selling a set dollar amount of portfolio assets each month to pay living expenses turns into “dollar cost ravaging.” This strategy guarantees the portfolio will not last long because the investor always sells more assets when prices are low.
} Dividend stocks can generate income, grow income and offer the potential of capital appreciation.
} Analysis suggests the current low-growth environment is optimal for high-yielding equities. Global economic growth is expected to be slow for some time due to the fallout of the European debt crisis, global banks shedding assets, high unemployment rates and spending cuts by corporations and governments.
} The pre-crisis levels of growth are unlikely to return any time soon because they were enhanced by enormous amounts of leverage. Watch out when economic growth turns negative. In such a climate, high-dividend stocks underperform other assets such as investment-grade and high-yield corporate bonds. And investors run the risk of the double whammy of a dividend cut and stock price fall.

Not FDIC Insured • May Lose Value • No Bank Guarantee
The opinions expressed are as of March 2012 and may change as subsequent conditions vary. The information and opinions contained in this material are derived from proprietary and non-proprietary sources deemed by BlackRock®, Inc. and/or its subsidiaries (together, ‘BlackRock’) to be reliable, are not necessarily all inclusive and are not guaranteed as to accuracy. There is no guarantee that any forecasts made will come to pass. Any investments named within this material may not necessarily be held in any accounts managed by BlackRock. Reliance upon information in this material is at the sole discretion of the reader. Past performance is no guarantee of future results. This material is for distribution only to those types of recipients as provided below and should not be relied upon by any other persons. This material is provided for informational purposes only and does not constitute a solicitation in any jurisdiction in which such solicitation is unlawful or to any person to whom it is unlawful. Moreover, it neither constitutes an offer to enter into an investment agreement with the recipient of this document nor an invitation to respond to it by making an offer to enter into an investment agreement. This material may contain ‘forward-looking’ information that is not purely historical in nature. Such information may include, among other things, projections, forecasts, estimates of yields or returns, and proposed or expected portfolio composition. Moreover, where certain historical performance information of other investment vehicles or composite accounts managed by BlackRock, Inc. and/or its subsidiaries (together, ‘BlackRock’) has been included in this material and such performance information is presented by way of example only. No representation is made that the performance presented will be achieved, or that every assumption made in achieving, calculating or presenting either the forward-looking information or the historical performance information herein has been considered or stated in preparing this material. Any changes to assumptions that may have been made in preparing this material could have a material impact on the investment returns that are presented herein by way of example. This material is not intended to be relied upon as a forecast, research or investment advice, and is not a recommendation, offer or solicitation to buy or sell any securities or to adopt any investment strategy. The opinions expressed are as of 10.11.2011 and may change as subsequent conditions vary. The information and opinions contained in this material are derived from proprietary and non-proprietary sources deemed by BlackRock to be reliable, are not necessarily all-inclusive and are not guaranteed as to accuracy. There is no guarantee that any forecasts made will come to pass. Any investments named within this material may not necessarily be held in any accounts managed by BlackRock. Reliance upon information in this material is at the sole discretion of the reader. Past performance is no guarantee of future results. In the US this material is for institutional investors only. In the UK issued by BlackRock Investment Management (UK) Limited (authorised and regulated by the Financial Services Authority). Registered office: 12 Throgmorton Avenue, London, EC2N 2DL. Registered in England No. 2020394. Tel: 020 7743 3000. For your protection, telephone calls are usually recorded. BlackRock is a trading name of BlackRock Investment Management (UK) Limited. In Hong Kong, the information provided is issued by BlackRock (Hong Kong) Limited. In Singapore, the information provided is distributed by BlackRock Investment Management (Singapore) Limited and is for distribution to institutional investors (as defined in section 4A of the Securities and Futures Act, Chapter 289 of Singapore (the ‘SFA’) and accredited investors (as defined in section 4A of the SFA) only. For distribution in EMEA, Korea, and Taiwan for Professional Investors only (or ‘professional clients’, as such term may apply in relevant jurisdictions).In Japan, not for use with individual investors. In Canada, this material is intended for accredited investors only. This material is being distributed/issued in Australia and New Zealand by BlackRock Financial Management, Inc. (‘BFM’), which is a United States domiciled entity and is exempted under Australian CO 03/1100 from the requirement to hold an Australian Financial Services License and is regulated by the Securities and Exchange Commission under US laws which differ from Australian laws. In Australia this product is only offered to ‘wholesale’ and ‘professional’ investors within the meaning of the Australian Corporations Act). In New Zealand, this presentation is offered to institutional and wholesale clients only. It does not constitute an offer of securities to the public in New Zealand for the purpose of New Zealand securities law. BFM believes that the information in this document is correct at the time of compilation, but no warranty of accuracy or reliability is given and no responsibility arising in any other way for errors and omissions (including responsibility to any person by reason of negligence) is accepted by BFM, its officers, employees or agents. For Institutional and Professional Clients in Latin America only. This material is solely for educational purposes only and does not constitute an offer or a solicitation to sell or a solicitation of an offer to buy any shares of any securities (nor shall any such securities be offered or sold to any person) in any jurisdiction within Latin America in which an offer, solicitation, purchase or sale would be unlawful under the securities law of that jurisdiction. No information discussed herein can be provided to the general public in Latin America. UAE: BlackRock Advisors (UK) Limited is regulated by the Dubai Financial Services Authority in the DIFC and authorised and regulated by the Financial Services Authority in the UK, has issued this document for access by Professional Clients and no other person should rely upon them information contained within it. The financial services to which the document relates are only available to Professional Clients. Dubai: BlackRock Advisors (UK) Limited which is regulated by the Dubai Financial Services Authority in the DIFC and authorised and regulated by the Financial Services Authority in the UK, has issued this document for access by Professional Clients and no other person should rely upon them information contained within it. The financial services to which the document relates are only available to Professional Clients Saudi Arabia: The financial services to which the document relates may only be offered and sold in the Kingdom of Saudi Arabia in accordance with Article 4 of the Investment Funds Regulations issued on December 24, 2006 (the ‘Regulations’) Article 4(b)(4) of the Regulations states that, if investment fund units are offered to no more than 200 clients in the Kingdom of Saudi Arabia and the minimum amount payable per client is not less than SAR 1 million or an equivalent amount in another currency, such offer of investment fund units shall be deemed a private placement for purposes of regulation. Investors are informed that Article 4(g) of the Regulations places restrictions on secondary market activity with respect to such investment fund units. Kuwait: This document is not for general circulation to the public in Kuwait nor will the fund be sold to the public in Kuwait. The fund has not been licensed for offering in Kuwait. Bahrain: The fund represents and warrants that it has not made and will not make any invitation to the public in the Kingdom of Bahrain to subscribe to the interests in the fund and that this document will not be issued, disseminated, or made available to the public generally. Qatar: Persons or entities to whom this document has been issued understands, acknowledges and agrees that this document has not been approved by the Qatar Central Bank, or any other government agency or authority in Qatar. Oman: Persons or entities to whom this document has been issued understands, acknowledges, and agrees that his document has not been registered or approved by the Central Bank of Oman or any other government agency or authority in Oman. This document contains general information only and is not intended to represent general or specific investment advice. The information does not take into account your financial circumstances. An assessment should be made as to whether the information is appropriate for you having regard to your objectives, financial situation and needs.
FOR MORE INFORMATION: www.blackrock.com
©2012 BlackRock, Inc. All Rights Reserved. BLACKROCK, BLACKROCK SOLUTIONS, ALADDIN, iSHARES, LIFEPATH, SO WHAT DO I DO WITH MY MONEY, INVESTING FOR A NEW WORLD and BUILT FOR THESE TIMES are registered and unregistered trademarks of BlackRock, Inc. or its subsidiaries in the United States and elsewhere. All other trademarks are those of their respective owners.
Lit. No. DIV-INVEST-WP-0312 AC6075-0312