Means based Transit Fare Pricing Study
56
– over – Regional Means-Based Transit Fare Pricing Study Technical Advisory Committee (TAC) Meeting #4 Metropolitan Transportation Commission Bay Area Metro Center Ohlone Room, 1 st Floor 375 Beale Street, San Francisco Friday, December 16, 2016 10:00 a.m. – 12:00 p.m. AGENDA 1. Introductions (5 minutes) All 2. Notes from TAC Meeting #3* Jennifer Yeamans 3. Study Progress to Date and TAC Meeting Goals* (5 minutes) Project manager will recap study activities to date and discuss the goals for TAC Meeting #4. Jennifer Yeamans 4. Draft Alternatives Analysis of Scenarios* (60 minutes) The consultant team will present draft findings of the formal alternatives analysis and identification of preferred scenario(s) for TAC input and discussion, as well as proposed next steps based on these findings. Joe Speaks 5. Draft Project Overview Report* (40 minutes) The consultant team will present the draft project overview final report for TAC comment and feedback. The purpose of this report is to summarize the overall project purpose, findings, and recommendations. Joe Speaks 6. Next Steps / Schedule* (5 minutes) Project manager will review the upcoming project activities and schedule. Jennifer Yeamans 7. Public Comment (5 minutes) * Denotes attachment in packet. MTC Staff Liaison: Contact Melanie Choy at 415.778.6607 or [email protected] regarding this agenda.
-
Upload
adina-levin -
Category
Government & Nonprofit
-
view
204 -
download
0
Transcript of Means based Transit Fare Pricing Study
– over –
Regional Means-Based Transit Fare Pricing Study
Technical Advisory Committee (TAC) Meeting #4 Metropolitan Transportation Commission
Bay Area Metro Center
Ohlone Room, 1st Floor
375 Beale Street, San Francisco
Friday, December 16, 2016
10:00 a.m. – 12:00 p.m.
AGENDA
1. Introductions (5 minutes) All
2. Notes from TAC Meeting #3* Jennifer Yeamans
3. Study Progress to Date and TAC Meeting Goals* (5 minutes)
Project manager will recap study activities to date and discuss the goals for
TAC Meeting #4.
Jennifer Yeamans
4. Draft Alternatives Analysis of Scenarios* (60 minutes)
The consultant team will present draft findings of the formal alternatives
analysis and identification of preferred scenario(s) for TAC input and
discussion, as well as proposed next steps based on these findings.
Joe Speaks
5. Draft Project Overview Report* (40 minutes)
The consultant team will present the draft project overview final report for
TAC comment and feedback. The purpose of this report is to summarize the
overall project purpose, findings, and recommendations.
Joe Speaks
6. Next Steps / Schedule* (5 minutes)
Project manager will review the upcoming project activities and schedule.
Jennifer Yeamans
7. Public Comment (5 minutes)
* Denotes attachment in packet.
MTC Staff Liaison: Contact Melanie Choy at 415.778.6607 or [email protected] regarding this agenda.

Public Comment: The public is encouraged to comment on agenda items at Committee meetings by completing a request-to-speak card
(available from staff) and passing it to the Committee secretary. Public comment may be limited by any of the procedures set forth in Section
3.09 of MTC's Procedures Manual (Resolution No. 1058, Revised) if, in the chair's judgment, it is necessary to maintain the orderly flow of
business.
Meeting Conduct: If this meeting is willfully interrupted or disrupted by one or more persons rendering orderly conduct of the meeting
unfeasible, the Chair may order the removal of individuals who are willfully disrupting the meeting. Such individuals may be arrested. If
order cannot be restored by such removal, the members of the Committee may direct that the meeting room be cleared (except for representatives of the press or other news media not participating in the disturbance), and the session may continue.
Record of Meeting: Committee meetings are recorded. Copies of recordings are available at a nominal charge, or recordings may be listened to at MTC offices by appointment. Audiocasts are maintained on MTC's Web site (mtc.ca.gov) for public review for at least one year.
Accessibility and Title VI: MTC provides services/accommodations upon request to persons with disabilities and individuals who are
limited-English proficient who wish to address Committee matters. For accommodations or translations assistance, please call 415.778.6757 or 415.778.6769 for TDD/TTY. We require three working days’ notice to accommodate your request.
可及性和法令第六章:MTC根據要求向希望來委員會討論有關事宜的殘疾人士及英語有限者提供服務/方便。需要便利設施或翻譯
協助者,請致電415.778.6757或 415.778.6769 TDD / TTY。我們要求您在三個工作日前告知,以滿足您的要求。
Acceso y el Titulo VI: La MTC puede proveer asistencia/facilitar la comunicación a las personas discapacitadas y los individuos con
conocimiento limitado del inglés quienes quieran dirigirse al Comité. Para solicitar asistencia, por favor llame al número 415.778.6757 o al 415.778.6769 para TDD/TTY. Requerimos que solicite asistencia con tres días hábiles de anticipación para poderle proveer asistencia.
Attachments are sent to Committee members, key staff and others as appropriate. Copies will be available at the meeting.
All items on the agenda are subject to action and/or change by the Committee. Actions recommended by staff are subject to change by the Committee.

Item 2
Meeting Notes Regional Means-Based Transit Fare Pricing Study Technical Advisory Committee (TAC) Meeting #3 Thursday, August 4, 2016 10:00 am-12:00 pm Metropolitan Transportation Commission Ohlone Room, 1st Floor 375 Beale Street, San Francisco 94105
Attendees: Asha Agrawal Mineta Transportation Institute/San Jose State University
Jennifer Yeamans Yeamans Consulting
Joe Speaks CH2M HILL
Celestine Do CH2M HILL
Pat Piras Public
Tom Harais ECCTA
April Mo SFCTA
Yeying Huang SFCTA
Barbara Duffy Marin Transit
Randolph Hudson Contra Costa Employment and Human Services
Cathleen Sullivan Alameda County Transportation Commission
Kimberly Koempel Alameda County Transportation Commission
Bob Allen Urban Habitat
Charlotte Barham BART
David Weir MTC
Melanie Choy MTC
Anne Richman MTC
Kenneth Folan MTC
Scott Lane MTC Policy Advisory Council South Bay
Nathan Landau AC Transit
Brytanee Brown Transform
Introductions
MTC staff member introduced the new MTC project manager, Jennifer Yeamans of Yeamans
Consulting, and the goals of the study and this meeting
Evaluation of Alternative Means-Based Transit Fare Scenarios Discussion
Consultant staff summarized key highlights from Draft Technical Memorandum #3: Evaluation of
Alternative Means-Based Transit Fare Scenarios
Consultant staff introduced the three Affordability scenarios and two Revenue Generating
scenarios analyzed, emphasizing that the scenarios need to be refined in terms of scale and
policy decisions.
TAC member question: Does low income definition of under $35,000 a year account for
household size? MTC staff said that the $35,000 figure is based on the region’s average
household size of two to three persons in relation to 200% of the federal poverty guidelines.
Regional Means-Based Transit Fare Pricing Study August 4, 2016 Meeting Notes TAC Meeting #3: Alternatives Evaluation Page 2
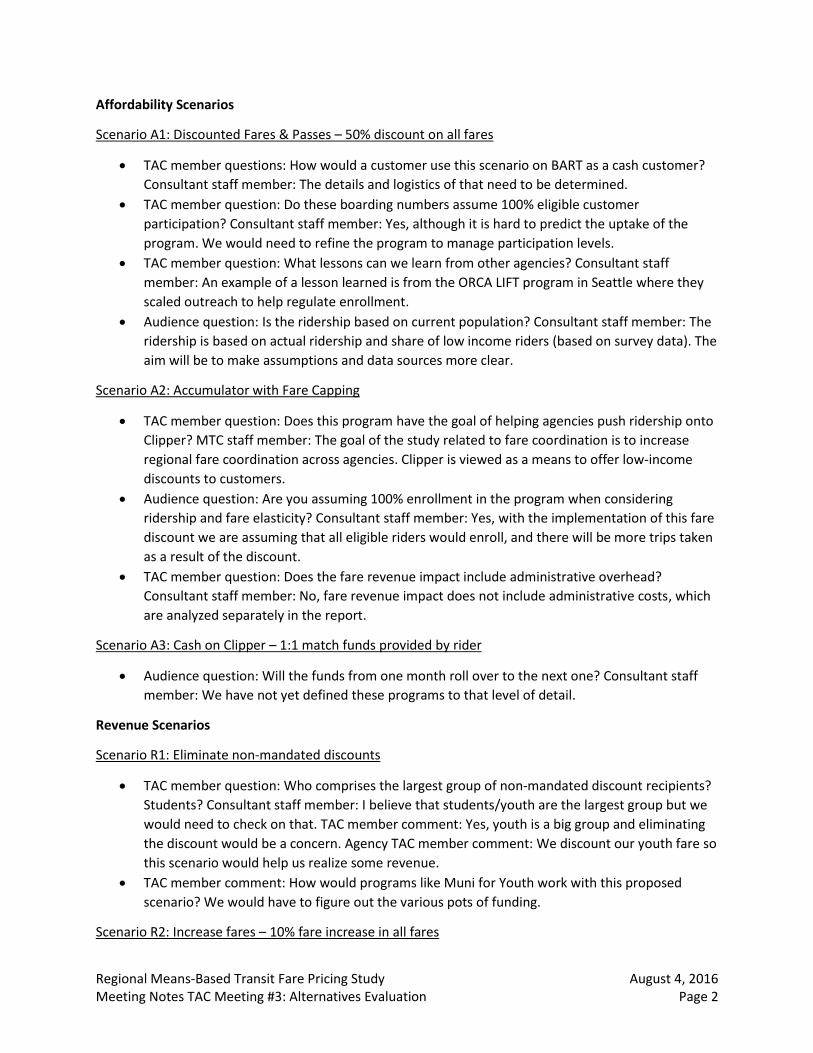
Affordability Scenarios
Scenario A1: Discounted Fares & Passes – 50% discount on all fares
TAC member questions: How would a customer use this scenario on BART as a cash customer?
Consultant staff member: The details and logistics of that need to be determined.
TAC member question: Do these boarding numbers assume 100% eligible customer
participation? Consultant staff member: Yes, although it is hard to predict the uptake of the
program. We would need to refine the program to manage participation levels.
TAC member question: What lessons can we learn from other agencies? Consultant staff
member: An example of a lesson learned is from the ORCA LIFT program in Seattle where they
scaled outreach to help regulate enrollment.
Audience question: Is the ridership based on current population? Consultant staff member: The
ridership is based on actual ridership and share of low income riders (based on survey data). The
aim will be to make assumptions and data sources more clear.
Scenario A2: Accumulator with Fare Capping
TAC member question: Does this program have the goal of helping agencies push ridership onto
Clipper? MTC staff member: The goal of the study related to fare coordination is to increase
regional fare coordination across agencies. Clipper is viewed as a means to offer low-income
discounts to customers.
Audience question: Are you assuming 100% enrollment in the program when considering
ridership and fare elasticity? Consultant staff member: Yes, with the implementation of this fare
discount we are assuming that all eligible riders would enroll, and there will be more trips taken
as a result of the discount.
TAC member question: Does the fare revenue impact include administrative overhead?
Consultant staff member: No, fare revenue impact does not include administrative costs, which
are analyzed separately in the report.
Scenario A3: Cash on Clipper – 1:1 match funds provided by rider
Audience question: Will the funds from one month roll over to the next one? Consultant staff
member: We have not yet defined these programs to that level of detail.
Revenue Scenarios
Scenario R1: Eliminate non-mandated discounts
TAC member question: Who comprises the largest group of non-mandated discount recipients?
Students? Consultant staff member: I believe that students/youth are the largest group but we
would need to check on that. TAC member comment: Yes, youth is a big group and eliminating
the discount would be a concern. Agency TAC member comment: We discount our youth fare so
this scenario would help us realize some revenue.
TAC member comment: How would programs like Muni for Youth work with this proposed
scenario? We would have to figure out the various pots of funding.
Scenario R2: Increase fares – 10% fare increase in all fares
Regional Means-Based Transit Fare Pricing Study August 4, 2016 Meeting Notes TAC Meeting #3: Alternatives Evaluation Page 3
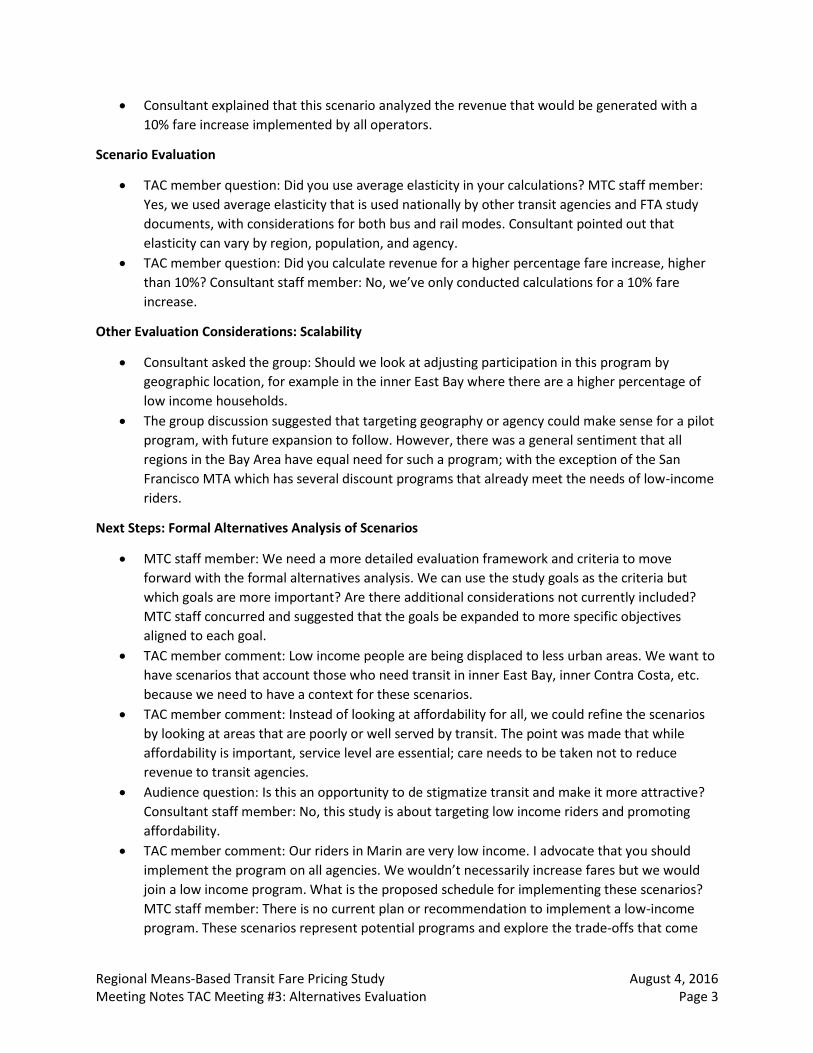
Consultant explained that this scenario analyzed the revenue that would be generated with a
10% fare increase implemented by all operators.
Scenario Evaluation
TAC member question: Did you use average elasticity in your calculations? MTC staff member:
Yes, we used average elasticity that is used nationally by other transit agencies and FTA study
documents, with considerations for both bus and rail modes. Consultant pointed out that
elasticity can vary by region, population, and agency.
TAC member question: Did you calculate revenue for a higher percentage fare increase, higher
than 10%? Consultant staff member: No, we’ve only conducted calculations for a 10% fare
increase.
Other Evaluation Considerations: Scalability
Consultant asked the group: Should we look at adjusting participation in this program by
geographic location, for example in the inner East Bay where there are a higher percentage of
low income households.
The group discussion suggested that targeting geography or agency could make sense for a pilot
program, with future expansion to follow. However, there was a general sentiment that all
regions in the Bay Area have equal need for such a program; with the exception of the San
Francisco MTA which has several discount programs that already meet the needs of low-income
riders.
Next Steps: Formal Alternatives Analysis of Scenarios
MTC staff member: We need a more detailed evaluation framework and criteria to move
forward with the formal alternatives analysis. We can use the study goals as the criteria but
which goals are more important? Are there additional considerations not currently included?
MTC staff concurred and suggested that the goals be expanded to more specific objectives
aligned to each goal.
TAC member comment: Low income people are being displaced to less urban areas. We want to
have scenarios that account those who need transit in inner East Bay, inner Contra Costa, etc.
because we need to have a context for these scenarios.
TAC member comment: Instead of looking at affordability for all, we could refine the scenarios
by looking at areas that are poorly or well served by transit. The point was made that while
affordability is important, service level are essential; care needs to be taken not to reduce
revenue to transit agencies.
Audience question: Is this an opportunity to de stigmatize transit and make it more attractive?
Consultant staff member: No, this study is about targeting low income riders and promoting
affordability.
TAC member comment: Our riders in Marin are very low income. I advocate that you should
implement the program on all agencies. We wouldn’t necessarily increase fares but we would
join a low income program. What is the proposed schedule for implementing these scenarios?
MTC staff member: There is no current plan or recommendation to implement a low-income
program. These scenarios represent potential programs and explore the trade-offs that come
Regional Means-Based Transit Fare Pricing Study August 4, 2016 Meeting Notes TAC Meeting #3: Alternatives Evaluation Page 4
with such a program. Results of this study and whether there is any recommendation is yet to
be determined.
MTC staff member: The program will be more cost effective if means testing is centralized.
TAC member comment: We ought to be implementing this program throughout the Bay Area.
TAC member comment: Goal 2 – Building Regional Consistency – is distinctly less important,
lovely to have but a potential barrier to bringing a program into existence. Goals 1 & 3 are
distinctly more important to bringing benefits to low-income riders.
TAC member question: Are we attempting to standardize fares? MTC staff member: Fare policy
standardization is not a goal of this study, but developing some kind of standard discount could
help make the program easier to understand and implement.
TAC member comment: Goal 1 – increase affordability – is a high priority. Riders served in
Antioch and outer regions have grown substantially. We can redirect money from agencies with
more affluent demographic to less affluent areas with transit. However, Goal 3 – developing a
financially viable and administratively feasible program – needs to be the number one goal.
TAC member comment: We need to contextualize what $100M means when considering a low-income support program. This is a very substantial sum of money when compared to what we spend on affordable housing and food assistance?
Audience comment: Affordability is important but it does not do any good if transit is not available. Consultant staff member: The intention is to build transit, not tear it down. This is the reason we have also scaled potential funding sources to offer policy makers as a way to replace any lost revenues.
Audience comment: Goal 2 is nice to have. We need to refine our scope. Are you looking at low income riders or low income residents? The former have access to transit already. Are you providing affordability for the occasional or frequent rider? Break down Goal 1 to distinguish between occasional or frequent riders.
Audience comment: There is no significant variation in financially viability amongst the scenarios, which does not help guide policy makers toward any one of these solutions. The other goals need to be expanded to specific policy objectives to help choose a program.
TAC member comment: AC Transit did a survey that most riders use transit pretty often so a policy focusing on frequent riders would help AC Transit.
TAC member comment: Even without a discount, the accumulator would benefit the low-income rider by not requiring a large purchase up front. I want the accumulator. If you fail to provide a meaningful discount, you still have this useful mechanism. If it is subsidized, that is even better.
Audience comment: What about restaurant workers who bike because they cannot afford a Clipper pass? We need this program to focus on occasional riders in addition to frequent riders with more and free transfers. We need to come up with simple and easy messaging. Simplify message to reach out to people. How do we get people to trust us to get means tested?
MTC staff member: should we include an additional scenario, such as the Interagency Pass? Have we analyzed enough? The group felt that the likely policy and administrative hurdles were already significant, and that an Interagency Pass seemed like an even greater challenge that may not be realistic to take on with this program.
Regional Means-Based Transit Fare Pricing Study August 4, 2016 Meeting Notes TAC Meeting #3: Alternatives Evaluation Page 5
TAC: It is already complicated with existing scenarios so we should leave out additional scenario. Use Goals 1 & 3 and leave out G2. Break out core rider targets vs. periphery riders, Clipper users vs. those who choose not to use Clipper. Focus on core riders using Clipper.
TAC member comment: There is a lot of material to digest. Keeping it simple is key. Focus on low income riders who have to get to work. Welfare system has tremendous requirements for work, and we should help reimburse riders for transit to get to work. We should lean on technology for solutions.
Audience comment: There is an opportunity to have people ride more with an accumulator. We can invest in deep outreach and teach someone to use Clipper.
TAC: We need to address the issue of easily acquiring a Clipper card. This is currently seen by some to be a barrier.
TAC: I like Affordability scenario A1 with 50% discount because it’s intuitive and easy to understand. Accumulators are more complicated to explain.
Audience comment: We need to determine what low income people we are targeting. Goal 1 could be expanded with sub-criteria such as rider frequency, cash payment options, reaching those in greatest need, overlap with existing programs, simplicity for users, and participation goals/scalability. Do we just build features of a scenario on a smaller scale with limited resources or meet the actual need?
TAC member comment: If we increase the administrative burden for the scenarios, it will be harder to implement. Minimizing administrative burden to transit agencies is important.
Audience comment: I’m interested in a hybrid system with accumulator as well as cash on the card. Perhaps users get credit for referring other low income riders to this program. Consultant commented that combining the features of all scenarios could make a great product to meet various rider needs, but it creates a program that is more expensive, more complicated, and takes longer to implement.
Audience comment: We can learn from Plan Bay Area’s outreach efforts and roll this program out as consistent with the goals and requirements previously established.
MTC staff member: With this discussion, it appears that the TAC does not want to analyze an additional scenario.
Upcoming Work
MTC staff member: We need to identify more detailed evaluation parameters for program. The comments and opinions expressed in this meeting will help us develop those specific policy objectives.

—over—
Item 3 TAC Meeting #2 ItemTAC
TO: Regional Means-Based Transit Fare Pricing Study
Technical Advisory Committee (TAC) Members DATE: December 9, 2016
FR: Jennifer Yeamans, Yeamans Consulting
RE: Project Update and TAC Meeting #4 Goals
Study Recap and Progress to Date
At your last TAC meeting, the TAC reviewed detailed quantitative and qualitative analysis of the
five study scenarios. Three affordability scenarios were chosen to elucidate different
mechanisms for structuring and delivering discounted fares to low-income riders, as follows:
A1: Discounted Fares and Passes: low-income riders can purchase discounted fares and
passes.
A2: Accumulator with Monthly Cap: low-income riders would allow riders to purchase
pass products (such as monthly passes) in small increments rather than paying the full
price of the pass up-front. After a set amount has been reached for the pass period, all
remaining trips in the pass period would be free for low-income riders.
A3: Cash on Clipper: low-income riders would receive a stipend in the form of cash
value added to a Clipper card, which could be used to ride any transit service in the
region accepting Clipper for payment.
Two revenue-generating scenarios were selected to analyze the levels of new fare revenues that
might be generated to offset the discounts provided in the affordability scenarios.
R1: Eliminate Non-Mandated Cash Discounts: eliminate all fare discounts beyond
those that comply with minimum Federal requirements, which are to provide half-fare
discounts to seniors 65 and older, persons with disabilities, and Medicare card-holders,
and apply only to off-peak hours and cash fare payments.
R2: Increase Fare Increases for Non-Low-Income Riders: raises transit fares in the
region by 10%.
In addition, the TAC reviewed and provided input on an evaluation framework to analyze the
scenarios and determine whether a preferred scenario might be identified. The consensus was the
that the study’s three major goals should constitute the basic evaluation criteria for the scenarios:
1. Make transit more affordable for the Bay Area’s low-income residents.
2. Move towards a more consistent regional standard for fare discount policies.

3. Define a transit affordability solution that is financially viable and administratively
feasible, and does not adversely affect the transit system’s service levels and performance.
TAC members suggested that the affordability and feasibility goals should be given equal weight
in the scenario evaluation and be weighted more than the regional-consistency goals.
TAC Meeting #4 Goals
At TAC Meeting #4 on December 16, project staff and consultants will seek input on the on the
formal evaluation of the alternatives, a draft of which is included in this packet as Draft
Technical Memorandum #4.
In addition, the project team will introduce a draft study overview report which is intended to
provide a summary overview of the study in its entirety, including the project’s origin and
purpose, an overview of the research conducted about peer and related programs, the analysis
and evaluation of the five scenarios, and findings and recommended next steps. The study team
also seeks comment and feedback from the TAC on this draft overview document.
For more information, please contact the study’s project manager Jennifer Yeamans at 415-845-
9838 or [email protected].

F ina l Dra f t
Regional Means-Based Transi t Fare Pr ic ing Study
Technical Memorandum #4: Alternatives Evaluation and
Recommended Actions
Prepared for
375 Beale Street San Francisco, California 94105
December 07, 2016
Item 4

December 7, 2016
Table of Contents
1.0 Original Study Goals .......................................................................................................................... 1
2.0 Affordability and Revenue Generating Scenarios ............................................................................. 1
Affordability Scenarios .............................................................................................................................. 1
Revenue Generating Scenarios ................................................................................................................. 1
3.0 Policy Direction and Prioritization .................................................................................................... 2
4.0 Recommendations ............................................................................................................................ 3
Affordability Scenarios .............................................................................................................................. 4
Revenue Generating Scenarios ................................................................................................................. 4
5.0 Next Steps ......................................................................................................................................... 5
Policy Implementation .............................................................................................................................. 5
Technical Implementation ........................................................................................................................ 7
Pilot Program ............................................................................................................................................ 8
Appendix A: Evaluation of Objectives ........................................................................................................ 12

Regional Means-Based Transit Fare Pricing Study: Alternatives Evaluation and Recommended Actions
December 7, 2016 1
Three affordability and two revenue generating scenarios were evaluated for the Regional Means-Based
Transit Fare Pricing Study and presented in Technical Memorandum #3: Evaluation of Alternative
Means-Based Transit Fare Scenarios. The purpose of this memorandum is to evaluate the scenario
analysis results in the context of the study goals and identify recommended actions based on the
evaluation results. Based on this evaluation, two scenarios emerge as preferred alternatives.
1.0 Original Study Goals The original goals of the Regional Means-Based Transit Fare Pricing Study served as the basic criteria for
evaluating the fare scenarios and identifying the preferred alternatives:
1. Make transit more affordable for the Bay Area’s low income residents.
2. Move towards a more consistent regional standard for fare discount policies.
3. Define a transit affordability solution that is financially viable and administratively feasible, and does not adversely affect the transit system’s service levels and performance.
2.0 Affordability and Revenue Generating Scenarios Alternatives identified as Affordability scenarios would provide a discount for low income riders;
Revenue Generating scenarios would provide revenue to off-set some of the fare revenue losses of a
low income program.
Affordability Scenarios A1 – Discounted Fares and Passes for Low Income Riders This scenario would create an additional discount category for low income persons, which would allow
individuals below a certain income threshold to pay fares or purchase passes at discounted prices.
A2 – Accumulator with Monthly Cap for Low Income Riders Accumulators are alternatives to pass products. They cap fares or provide bonus trips based on a
threshold (number of boardings or value of fares paid) within a defined period of time. Accumulators
with caps effectively allow riders to purchase the benefits of pass products (e.g., monthly passes) in
small increments rather than requiring payment of the full price of the pass up-front. In this scenario,
fares would be capped on a monthly basis, and the cap would be set lower for low income riders than
for the general population.
A3 – Cash on Clipper® for Low Income Riders With this scenario, low income riders would receive a stipend in the form of cash value added to a
Clipper® card. This stipend could be used to ride any transit service in the region. In this scenario, the
stipend would be provided on a one-to-one match basis, with each dollar added by the rider matched
with a stipend dollar. This scenario would not require changes to transit operators’ fare policies.
Revenue Generating Scenarios R1 – Eliminate Non-Mandated Cash Fare Discounts This scenario would generate revenue to help fund a low income transit fare program by eliminating all
fare discounts beyond those that meet Federal requirements (i.e. half-fare discounts on cash fares and

Regional Means-Based Transit Fare Pricing Study: Alternatives Evaluation and Recommended Actions
December 7, 2016 2
during off-peak hours for seniors age 65 and older, persons with disabilities, and Medicare recipients).
Discounts beyond those that are federally mandated would be eliminated and riders currently
benefitting from those discounts would pay full fares, although some of those customers would likely
become eligible for the low income program.
R2 – Implement a 10% Fare Increase This scenario would generate additional fare revenue by raising transit fares in the region by 10% across-
the-board. The fare increase would apply to all fare products of all Bay Area transit agencies.
Bay Area transit agencies set their own fare policies and fares and decisions about fare changes like
these are made by each agency. Eliminating non-mandated fare discounts (R1) is proposed as a regional
concept, but would require policy changes by each transit agency’s Board of Directors. While not
infeasible, eliminating non-mandated fares would involve the one-time reversal of longstanding policy.
This would be a lengthy, decentralized, controversial endeavor that could span several years and may
not result in changes at all agencies. Similarly, a 10% fare increase (R2) would require changes to each
individual agency’s fare policies. However, the process for fare increases and the required justification is
more predictable. The revenue raised by a 10% fare increase (on the order of $66 million) could help to
offset fare revenue losses, which will vary depending on implementation details of the chosen scenario
and could be implemented as a phased (2- or 3-step) fare increase, depending on the agencies’ other
fare revenue needs and priorities.
3.0 Policy Direction and Prioritization Throughout the study, MTC provided policy direction and guidance for a low income fare program,
including the structures and assumptions behind the Affordability and Revenue Generating scenarios
and the resulting ridership and fare revenue projections that are included in Technical Memorandum #3.
Following the delivery of that memo, the Study’s Technical Advisory Committee (TAC) met to review the
ridership and fare revenue projections and also provided the following broad-based input on policy
direction for a means-based fare pricing program for the Bay Area:
Affordability was further defined as helping all qualifying riders similarly every month up to the
budgetary limits of the program. It does not necessarily favor certain subgroups of low income
riders over others. While improving affordability is considered to be the primary policy
objective, it can be relative:
A 50% discount is comparable to FTA’s mandated discounts for seniors and persons with
disabilities, and is an appropriate level of discount to provide a meaningful benefit to users.
Any discount would be viewed as helpful, as long as program qualification, enrollment, and
participation is simple, straightforward, and streamlined for agencies and users alike.
Feasibility was further defined to include nearer-term implementation that does not rely on
Clipper 2, which may still be several years away from full implementation.
Reliance on Clipper to distribute subsidies is neither a key concern nor a major potential barrier;
having a cash-paying option is not essential to a low income program.

Regional Means-Based Transit Fare Pricing Study: Alternatives Evaluation and Recommended Actions
December 7, 2016 3
Limiting participation to a specific geographic area of the region was seen by some members of
the TAC as potentially troublesome, unless the geographic limitation is part of a phased
implementation or a pilot program.
Based on the original MTC study direction, the established study goals, and the TAC’s feedback, the
CH2M team conducted a weighting and prioritization analysis with the following objectives:
1. Rider Affordability: Achieving this goal is a top priority for the program and as such it has a total
weight of 40%. This goal is defined by financial affordability and ease of access through
objectives such as ease of enrollment and participation, provision of the same discount to all
eligible individuals, and means testing based on eligibility for another social program such as
CalFresh to facilitate eligibility assessment and access to the program.
2. Administrative Feasibility & Financial Viability: Along with Rider Affordability, this goal is
weighted as a top priority. It also has a total weight of 40%. This goal is defined by objectives
such as scalability to available funding, centralized and electronic management,
implementability under the current Clipper® system, and providing Clipper®-only payment to
minimize agency overhead.
3. Consistent Regional Standard: This goal is weighted as a secondary priority after the primary goals of Rider Affordability and Administrative Feasibility & Financial Viability. Because consistency was seen as less central to a program compared to affordability and feasibility, it has been assigned a lower weighting (20%). Throughout the study, MTC staff and study participants continually emphasized that regional consistency is desirable, especially with respect to using Clipper®, making any low-income discount program available throughout the region, and developing universal standards for program qualification. However, study participants also recognized that changing agency fare policy to create a region-wide multi-agency fare structure would be complex and could become a barrier to timely implementation of any low-income program. With these complexities in mind, the TAC suggested that the study should prioritize a scenario that does not depend on new multi-agency fare policy. MTC staff maintains that coordinated regional fare policy could benefit all riders, but also acknowledges the significant implementation barriers that come with any scenario that depends on region-wide multi-agency fare policy.
4.0 Recommendations The goal weightings and the resulting Scenario scores are summarized in the following table:
Study Goals Weight A1: Discounted Fares & Passes
A2: Accumulator
A3: Cash on Clipper
Affordability 40% 4.30 2.80 3.80
Administration & Feasibility 40% 1.25 1.63 4.38
Regional Consistency 20% 4.00 3.00 4.50
Weighted Score 100% 3.00 2.40 4.20
Based on these weightings, A3 – Cash on Clipper for Low Income Riders has the highest score and A1 –

Regional Means-Based Transit Fare Pricing Study: Alternatives Evaluation and Recommended Actions
December 7, 2016 4
Discounted Fares and Passes for Low Income Riders ranks second. The qualitative evaluation process is
documented in the matrix provided in Appendix A: Evaluation of Objectives.
Affordability Scenarios Among the three Affordability Scenarios and based on the criteria defined here, A3 – Cash on Clipper
scores the highest against two of the study goals and overall. It is the most feasible and would require
the least administrative effort to implement. All scenarios support regional consistency through the use
of Clipper® and standardized eligibility requirements; but A3 scored slightly higher for not depending
upon the adoption of new regional fare policy which could be a barrier to timely implementation. This
scenario ranks lower than A1 (Discounted Fares and Passes) against the Affordability goal, primarily
because it does not provide the same discount to all eligible individuals; instead, the value of the stipend
depends on the frequency of travel, based on the value riders add to their Clipper® cards.
The second-ranked scenario, A1 – Discounted Fares and Passes, scores the highest on Affordability and
the second highest on both Administration & Feasibility and the Regional Consistency goal. With
respect to Affordability, A1 ranks the highest of the three scenarios on providing the same discount to
all eligible individuals since every fare paid from stored value and every pass purchased would be
discounted at the same rate. One of the assumptions behind this scenario is that it would require the
creation of a new Clipper® fare category for low income riders, making it more difficult from an
Administrative Feasibility perspective. Scenario A1 would have scored more favorably if it relied on an
existing Clipper® discount-fare category (such as RTC) rather than depending on the creation of a new
low income fare category to be implemented fully on Clipper®.
Scenario A2 – Accumulator with Monthly Cap ranks the lowest of the three scenarios. While optimism
about the potential of accumulators varied among stakeholders, improving the ranking of this scenario
would require reworking the objectives and their weightings in order to prioritize regional fare policy
coordination and accommodate a longer implementation timeline dependent on C2 implementation. It
would also necessitate a more detailed exploration of the financial impacts and viability of capping,
given the complex revenue impacts. If there is sufficient interest in the accumulator alternative,
consideration could be given to implementing it at a later time, with the rollout of C2 and the
introduction of accumulators regionwide.
It is also imperative to recognize that there are substantial unfunded costs as well as potential service
implications associated with each of the Affordability Scenarios if implemented in fully unconstrained
terms, as discussed in Technical Memorandum #3. Those concerns were generally considered in the
evaluation process, but the precise impacts depend on the final program design and rate of adoption.
Those concerns would need to be addressed before any of the three scenarios can be recommended for
potential implementation.
Revenue Generating Scenarios Changes to each agency’s fare policy will be complicated and will need to be discussed at the agency
level, in conjunction with regional plans to fund and implement a low income program. The Revenue
Generating scenarios suggest that revenues on the order of $53-$66 million could be raised if all of the

Regional Means-Based Transit Fare Pricing Study: Alternatives Evaluation and Recommended Actions
December 7, 2016 5
transit providers either eliminated all non-mandated fare discounts or successfully implemented a 10%
across-the-board fare increase.
Decisions to make fare changes of this nature must be made by each agency’s policy board. Fare
changes of this scale are likely to be extremely difficult to implement consistently across the region by
all operators and on the same timeline, particularly considering the agencies’ other fare revenue needs.
Although increasing fare revenues represents one potential long-term funding source for providing low-
income fare discounts, the timing of, and revenue from, individual agency fare increases will be
inconsistent. Consequently, additional non-agency funding and implementation resources would need
to be identified and considered depending on how a program might be developed and what financial
and policy assumptions are maintained.
5.0 Next Steps As MTC continues to develop the concept of a regional means-based transit pricing program for the Bay
Area, there are both policy and technical decisions that will need to be made. CH2M also recommends
conducting a pilot program to test the viability of the program.
At this point in the study, MTC staff members and the TAC have participated in discussions about
defining and evaluating conceptual program alternatives. The region’s transit agencies are represented
on the TAC by AC Transit, BART, Marin Transit, Petaluma Transit, SFMTA, and VTA; the TAC also includes
organizations representing low income/equity concerns (Mineta Transportation Institute, Urban
Habitat) and providing human services (Alameda County Social Services Agency, Contra Costa County
Employment and Human Services Development).
A next step will be to share the study’s findings and recommendations with all Bay Area transit agencies
and set initial direction through a plan to pilot one or both of the top-ranked Affordability alternatives.
Policy Implementation Implementing or piloting a means-based transit pricing program will require setting specific policies for
program parameters. A similar approach was taken with the ORCA LIFT program, which uses the ORCA
smart card to successfully deliver reduced fares to riders who meet income thresholds on several transit
providers in the Seattle region.
Target Population and Income Threshold: Provide clear eligibility definitions, including the
income thresholds and residency requirements that must be met to qualify for the program. For
the alternatives evaluation, all residents of the nine Bay Area counties were considered
potentially eligible; the income eligibility threshold was set at 200% of the federal poverty level.
Discount Structure: Select the alternative(s) (e.g., A1 – Discounted Fares and Passes and/or A3 -
Cash on Clipper®) that will be piloted. Both of these alternatives evaluated 50% discounts and
there is general agreement among TAC participants that the program should provide a 50%
discount if that is feasible within the scope of the program. The results of a pilot should help to

Regional Means-Based Transit Fare Pricing Study: Alternatives Evaluation and Recommended Actions
December 7, 2016 6
confirm whether this is the “right” level for eligible transit users, the Bay Area transit providers,
and MTC.
Geographic Scope: Assuming that the program will be available for customers of transit
providers throughout the nine county region, determine whether it should be implemented in
phases, with different parts of the region and transit agencies coming on line at different times,
and if so, how to phase it. Part of this decision will also be where to conduct a pilot program
and which agencies should participate.
Means Testing: Specify how eligibility will be assessed, considering opportunities to partner
with Bay Area social service agencies. Conceptually, a means-based transit pricing program
would take advantage of the existing network of service agencies to manage program eligibility,
similar in principle to VTA’s UPLIFT and TAP programs, and the ORCA LIFT program in the Seattle
area. These agencies would leverage their existing eligibility assessment procedures and
expertise to verify incomes, determine eligibility for the transit fare program, and issue a
credential to confirm eligibility.
Income Verification: This process will require agreement with agencies to verify income. One
approach that could be piloted would be to have agencies that assess eligibility issue the transit
credential to anyone eligible for a pre-existing program such as CalFresh, thereby minimizing the
additional costs to verify and certify eligibility since no additional documentation would be
required. This approach best supports the criterion that enrollment and participation should be
easy and based on eligibility for another social program. Otherwise, the forms of
documentation acceptable for confirming income for employed, self-employed, and
unemployed individuals will need to be specified and there will likely be a cost, as in Seattle,
associated with assessing, verifying and certifying eligibility.
Build Consensus: If the program is to be successful and sustainable, there will need to be
agreement on a shared regional approach to the program across transit providers, social,
human, and health service agencies, and community organizations, as well as agreement among
the transit providers and MTC on the scope and structure of the program. The impact of
potential fare revenue losses on farebox recovery ratios as well as implications of increased
ridership for service levels and operating costs are concerns to the agencies. Consensus on the
merits of the program and agreement on cost sharing strategies will likely be part of the
conversation, particularly with the four transit agencies (AC Transit, BART, SFMTA, VTA) that
account for 90% of the region’s transit trips.
Compliance: Like the eligibility assessment process, the fare pricing and/or payment structure
should be convenient. It will also likely require a Title VI and Environmental Justice analysis. In
addition, use of Clipper cards will require consistency with Clipper program requirements
concerning confidentiality of users’ personally identifiable information.

Regional Means-Based Transit Fare Pricing Study: Alternatives Evaluation and Recommended Actions
December 7, 2016 7
Technical Implementation The technical implementation could vary greatly depending on which scenario is chosen and the final
program definition. However, general implementation milestones can be laid out regardless of the
program specifics.
Based on CH2M’s experience with similar projects in the Bay Area, program definition activities could
take two to four months. Contracting activities could take four to six months. Start-up of non-technical
services (such as means-testing) could take four to eight months (depending on staffing). And technical
systems implementation could take four to eight months (but could be conducted concurrently with
start-up activities). Overall, technical implementation could take 10 to 18 months.
If technical systems implementation is mostly external to Clipper® (as with A3), then technical
implementation would not depend on current Clipper® priorities and 18 months may be the high
estimate for bringing a program into existence. If technical system implementation is internal to
Clipper® (as with A1), then technical implementation would likely be pushed out significantly (a year or
more) due to pre-existing program implementation priorities.
Key Implementation Milestones: Program Specification: An approved technical document detailing workflow processes,
business rules, non-Clipper® system requirements (e.g., external tracking of participants if
required), and Clipper® updates (e.g., required software and business rule changes).
Means-Testing Function Definition: An approved document outlining the means-testing policy
and eligibility testing program. This is a major undertaking that will benefit from existing means-
based eligibility programs outside of transit, and the current paratransit eligibility testing
expertise within transit, as well as the experience of other regional transit systems’ low income
programs, such as ORCA LIFT.
Program Staffing: Identify qualified staff either at MTC and/or among participating transit
agencies to develop the project implementation plan and implement the program.
Project Implementation Plan: An implementation plan including schedule, budget, and staff
resources required.
Means-Testing Contracting: If means-testing is contracted to a third party, then the program
sponsor would either need to manage a formal bid process to select a vendor, or develop
contractual relationships with multiple means-testing partners, such as social service agencies.
Since this is a regional programs, there is also the question of which agency should hold and
manage such contracts.
Clipper Vendor Proposal and Negotiation: The Clipper® vendor (Cubic) would provide a
proposed approach, cost, and schedule for implementation of the specification.
Regional Means-Based Transit Fare Pricing Study: Alternatives Evaluation and Recommended Actions
December 7, 2016 8
Technical Implementation: The project implementation team collaborates with the Clipper®
vendor (Cubic) to implement the system changes.
Means-Testing Implementation: The project implementation team would collaborate with the
means-testing vendor (TBD) to stand up a means-testing program: develop informational
materials, hire and train staff (TBD), acquire or expand facilities, set up technical systems
(application database, reporting systems, etc.), create an appeals process, outreach to social
service agencies, and other related tasks.
Technical Testing: Clipper® changes are lab tested to assure that the features are implemented
according to the business rules, then user tested in the field to ensure the features are rolled
out correctly to the entire system.
Friendly User Testing: The system goes live with a very small set of “friendly users” who are
selected for their ability to test the full breadth of services (including means-testing), features,
and locations. These users have direct and immediate contact to the implementation team so
that problems can be addressed rapidly and fixes put in place before launch.
Soft Launch: The program goes live to the public, but targets only a subset of users to slowly
build the user base. Ensure that human systems scale and tracking and reporting systems are in
place.
Hard Launch: Actively promote the program to all qualified participants. Monitor program
through established tracking and reporting systems.
Pilot Program Program scenarios A1 and A3 could be further defined and explored through one or more pilot
programs to test feasibility. The purpose of a pilot program would be to answer the following key
questions:
What is the actual rider demand for a low income program – what percentage of qualified riders
will actually sign up for the program?
How fast will qualified riders sign up and can (should) adoption rates be managed through
outreach efforts and/or eligibility restrictions?
Does the program result in rider behavior changes – do people ride more if the fare is reduced?
What will be the actual costs (lost revenues and operating costs) at full-scale implementation?
Despite the demographics and fare modeling work conducted as part of this study, a pilot test remains
the best way to provide a better understanding of the likely revenue loss and behavior change that
would come with a low income program. (Cost projections provided in Technical Memorandum #3 were
“maximum costs” that assumes 100% program adoption – an adoption rate that peer programs have not
achieved. Actual program costs are likely to be lower.) Given the limited examples of low income

Regional Means-Based Transit Fare Pricing Study: Alternatives Evaluation and Recommended Actions
December 7, 2016 9
programs around the country and the unique context for launching a Bay Area program, it is difficult to
accurately project the scale and pace of program adoption without a pilot.
A successful pilot test will inform these key questions quickly and cost-effectively. Other possible
objectives for the pilot, such as testing the logistics of means-testing or the technical workings of a
particular scenario, are secondary.
Pilot Program Option #1 One concept for a quick and cost-effective pilot would be to temporarily issue RTC Discount Clipper®
Cards to individuals who have already qualified for one or more means-tested programs, such as
CalFresh. The RTC Clipper card is a version of Clipper created for passengers under 65 with qualifying
disabilities and provides discounted fares to eligible riders. This pilot would be most similar to a test of
A1, Discounted Fares and Passes, where the existing Clipper RTC fare category serves in lieu of
implementing a new fare discount category for eligible low-income riders, which the A1 analysis
indicated would be costly and time-intensive to implement broadly under existing Clipper technology.
Pilot means-testing is already defined and implemented; one discount card would be issued for
each CalFresh card. No new means-testing program needs to be created for this pilot, but a
mechanism for utilizing existing means-testing processes in partnership with social service
providers would need to be identified and supported.
Pilot discounts are already defined and implemented; transit agencies would agree to honor
existing RTC fares for qualified low-income riders. Current RTC discounts vary by agency and do
not align precisely with the 50% discount analyzed in scenario A1, but they are close. If current
RTC discounts can be used as an interim proxy, then no new discounts need to be programmed
into Clipper®.
RTC cards already make use of a photo ID to reduce fraud.
A unique series of Clipper serial numbers could be created to separate monitoring of the means-
based program separately from the established RTC program.
The pilot program could be created quickly by issuing the policy directive to allow CalFresh cardholders
to qualify for a special RTC discount card. The pilot would track the uptake and usage of such cards for
the duration of the pilot, after which the pilot cards would be disabled. RTC card issuance centers would
need to be prepared for a surge in applications, but no other technical preparation would be required.
Program enrollment could be restricted or expanded depending on the number of means-based
programs (in addition to CalFresh) accepted as verification of low income status under the pilot
program.
Extending the RTC discount program to low income riders would provide a relatively straightforward
way to test demand, uptake, and behavior change. However, because this pilot would rely on other
programs to define eligibility, it would not help establish the precise policy boundaries of a transit-
Regional Means-Based Transit Fare Pricing Study: Alternatives Evaluation and Recommended Actions
December 7, 2016 10
specific means-testing program. And because the pilot would rely on existing RTC discounts, it would not
allow for the development of low income-specific discounts for each agency.
Pilot Program Option #2 A second pilot concept would test scenario A3, Cash on Clipper, using a well-defined sub-target
population. For example, local clients of existing social service programs could be offered the benefits of
the pilot program. Those willing to participate could be given pilot Clipper® accounts. Using current
Clipper® functionality, monthly cash subsidies could be added electronically to those pilot accounts.
This approach would effectively implement the A3 program for the limited number of individuals
selected for the pilot program. It provides a contained and straightforward way to test and document
demand, uptake, and behavior change. Like Option #1, it would not help establish the precise policy
boundaries of a transit-specific means-testing program. However, the pilot could answer the key
questions set out at the beginning of the pilot.
Pilot Program Implementation Regardless of which of these pilot programs is pursued, next steps to initiate a pilot include:
Confirm Pilot Study Objectives: Confirm all pilot objectives. Recommended objectives include
developing a predictive adoption rate, refine estimated costs based on adoption, observe
behavior changes (especially increases in ridership), identify barriers to participation.
Define Specific Study Methodology: Clear program objectives will help determine which of the
two pilot program options to flesh out to create a complete study methodology including data
collection and analysis. To develop a predictive program adoption rate on which to base future
costs, careful attention must be paid to the pilot study population and pre-pilot and post-pilot
data gathering.
Establish Simple Pilot Participation Criteria: The initial pilot should rely on existing means-
testing programs, rather than develop new means-testing infrastructure from scratch
specifically for a pilot.
Define Partnerships with Social Service Organizations: Social service organizations have already
been involved in this study and will be important partners in identifying and potentially
qualifying participants for the program. They will also be important to the outreach and
communication required for program success.
Define Technical Program Parameters: Social service partner organization should be active
participants in defining how the program is administered and data gathered on participants.
Solicit Participants: Develop the outreach and enrollment materials in conjunction with the
frontline staff at social service organizations.

Regional Means-Based Transit Fare Pricing Study: Alternatives Evaluation and Recommended Actions
December 7, 2016 11
Manage the Technical Program: Program management will include enrollment, creation of pilot
accounts, clearance and consent for access to those accounts, planned data collection and
management for both user and activity data.
Analyze and Report on Participation Rates and Behavior Changes: In accordance with the pilot
program objectives and the data methodology established earlier in the project. This analysis
will provide new inputs to predict costs at full implementation.
Determine potential long-term funding sources for an ongoing subsidy beyond the pilot
program phase.

Regional Means-Based Transit Fare Pricing Study: Alternatives Evaluation and Recommended Actions
December 7, 2016 12
Appendix A: Evaluation of Objectives
Weighting totals 100% with different weight assigned to objectives related to Rider Affordability (40%,
Administrative Feasibility & Financial Viability (40%), and Regional Consistency (20%).
Scoring Scale is from 1-5 with 1 being the lowest and worst score, and 5 being the highest and best score.
Weight A1 A2 A3
Provides a discount to low income individuals 12 4 4 4
Enrollment and participation is easy 10 4 3 4
Program eligibility and means testing is based on eligibility
for another social program (e.g., CalFresh)10 4 4 4
Provides the same discount to all eligible individuals,
regardless of frequency of travel8 5 0 3
Readily scalable to available program funding 8 1 3 5
Reasonable agency resources and costs 8 1 2 5
Program can be managed centrally and electronically 3 1 3 5
Impact on agency-specific farebox recovery ratios is <1% 5 0 0 0
Minimizes agency overhead by providing Clipper-only
payment (no cash option)3 0 5 5
Can be implemented within three years 5 3 0 5
Can be implemented under the current Clipper system 5 2 0 5
Can be implemented using existing fare products 3 2 0 5
Builds regional consistency through program eligibility
requirements, and use of Clipper10 4 4 4
Does not depend upon implementation of regional fare
policy or products (but does not preclude it either)10 4 2 5
100
Weighted Average Score 3.0 2.4 4.2
RID
ER A
FFO
RD
AB
ILIT
YA
DM
INIS
TRA
TIV
E FE
ASI
BIL
ITY
& F
INA
NC
IAL
VIA
BIL
ITY
REG
ION
AL
CO
NSI
STEN
CY
Supports regional fare coordination, policy, or products

Item 5
Dra f t
Regional Means-Based Transi t Fare Pr ic ing Study
Project Overview Final Report
Prepared for
375 Beale Street San Francisco, California 94105
December 7, 2016

Regional Means-Based Transit Fare Pricing Study: Project Overview Final Report – DRAFT
1 DECEMBER 7, 2016
Table of Contents
Introduction ................................................................................................................................................. 2
Study Methodology and Stakeholder Involvement ...................................................................................... 2
Existing Policies and Conditions .................................................................................................................... 4
Developing Low-Income Fare Affordability Scenarios .................................................................................. 5 Proposed Fare Affordability Scenarios............................................................................................. 6
1. The Big Idea ..................................................................................................................... 6 2. Discounted low Income fares and/or pass program....................................................... 6 3. Discounted off-peak fares ............................................................................................... 6 4. Regional interagency pass .............................................................................................. 6 5. Make transfers more affordable ..................................................................................... 7 6. Monthly fare or trip accumulators ................................................................................. 7 7. Add cash to Clipper Card for low income riders ............................................................. 7 8. Increase use of existing discounts/reduce barriers to existing discounts ...................... 7
Proposed Revenue Generating Scenarios ........................................................................................ 7 A. Eliminate non-mandated cash discounts/eliminate proxies for low income ................ 7 B. Eliminate discounted fare products (e.g., monthly passes) .......................................... 8 C. Implement fare increases for non-low income riders ................................................... 8
Quantitative and Qualitative Evaluation....................................................................................................... 8 Affordability Scenarios ..................................................................................................................... 8 Revenue Generating Scenarios ........................................................................................................ 8 Evaluation Results ............................................................................................................................ 8
A1 – Discounted Fares and Passes for Low Income Riders ................................................. 9 A2 – Accumulator with Monthly Cap for Low Income Riders ........................................... 10 A3 – Cash on Clipper® for Low Income Riders .................................................................. 11 R1 – Eliminate Non-Mandated Cash Discounts ................................................................ 13 R2 – Implement Fare Increases......................................................................................... 14
Means Testing ............................................................................................................................................. 15
Alternatives Evaluation, Recommended Actions ........................................................................................ 16
Next Steps ................................................................................................................................................... 17 Technical Implementation ............................................................................................................. 17 Pilot Program ................................................................................................................................. 17
Appendix A: notes ...................................................................................................................................... A-1
Appendix B: Quantitative Analysis Results ............................................................................................... A-2
Appendix C: Impacts on Farebox Recovery ............................................................................................ A-13

Regional Means-Based Transit Fare Pricing Study: Project Overview Final Report – DRAFT
2 DECEMBER 7, 2016
Introduction
The goal of the Regional Means-Based Transit Fare Pricing Study is to answer three interrelated questions:
Is there a way to make transit more affordable for the Bay Area’s low income residents?
How can the region best move towards a more consistent regional standard for fare discount
policies?
Is there a transit affordability solution that is financially viable and administratively feasible,
and does not adversely affect the transit system’s service levels and performance?
In pursuit of these goals, this study has developed a range of scenarios for implementing a regional means-based transit fare program in the nine-county Bay Area. This study considered the feasibility of implementing and funding these scenarios.
MTC has been involved in identifying affordability barriers to transit and promoting solutions through regional policy initiatives for more than ten years. These include the Coordinated Public Transit-Human Services Transportation Plan, the Lifeline Transportation Program, and the 2012 means-based fare discount funding requests, the Regional Transportation Plan, the Transit Sustainability Project, and the Community Based Transportation Planning Program. Although MTC does not determine specific fare policies for individual transit operators, MTC does have statutory authority to promote regional transit coordination.
Study Methodology and Stakeholder Involvement
MTC Staff established the study goals as part of the RFP process initiated in the second half of 2014. In March 2015, the CH2M team was retained as lead technical consultant to conduct research, provide quantitative and qualitative analysis, support community outreach, and document findings in accordance with the defined scope and work plan.
The questions posed in the study goals have been answered in a series of four technical memorandums, each with a distinct focus:
Technical Memorandum #1: Existing Policies and Conditions
Technical Memorandum #2: Alternative Fare Scenarios
Technical Memorandum #3: Evaluation of Alternative Fare Scenarios
Technical Memorandum #4: Preferred Alternative Fare Scenarios
A Technical Advisory Committee (TAC) was established early in the study to provide initial input and subsequent feedback on each of the technical memorandums. The TAC consists of a broad-based group of stakeholders including representatives from the Alameda-Contra Costa Transit District (AC Transit), the Alameda County Social Services Agency Workforce and Benefits Administration, Bay Area Rapid Transit District (BART), the Contra Costa County Employment and Human Services Department, Marin Transit, Petaluma Transit, San Francisco Municipal Transportation Agency, San Jose State University’s Mineta Transportation Institute, Urban Habitat, and the Santa Clara Valley Transportation Authority (VTA).
The TAC met four times over the course of the study, between May 2015 and December 2016, to review each of the four technical memoranda and also provided assistance with data collection.

Regional Means-Based Transit Fare Pricing Study: Project Overview Final Report – DRAFT
3 DECEMBER 7, 2016
Early in the study, meetings and telephone interviews were also conducted with representatives of health and human service agencies serving Bay Area low income communities, as part of the process for understanding current needs and structuring low income program alternatives. Later, two community focus groups were assembled as part of the Evaluation of Alternative Fare Scenarios – one in San Jose and one in Vallejo. Low income riders were asked to articulate their needs for discount transit fare products, and their opinions regarding the products and policies being considered.
Research on peer low income programs was conducted early in the study and the results are summarized in Technical Memorandum #1, Policies and Conditions.
The ridership and revenue impacts of each affordability and revenue-generating scenario were evaluated using FARES, CH2M’s fare analysis model, as described in Technical Memorandum #3, Evaluation of Alternative Means-Based Transit Fare Scenarios. Key assumptions and data sources used in evaluating ridership and revenue impacts include:
Ridership and fare revenue impacts were analyzed by market segment (i.e., rider groups characterized by rider category (adult, senior/disabled, youth, etc.) and income (e.g., low income adult, non-low income senior) for AC Transit, BART, Caltrain, Golden Gate, SFMTA, SamTrans, and VTA and Marin Transit1. For the remaining 16 agencies, ridership and fare revenue impacts were estimated only for “low income” and “non-low income” rider groups and not distinguished by rider category).
On-board survey results provided by MTC were used to estimate the percentage of low income riders by transit operator. In the absence of household size data, a household income of $35,000 (which approximates 200% of the Federal Poverty Level (FPL) for an average Bay Area household size, which is between two and three persons) was generally used as the eligibility threshold.
The FARES model uses elasticities to estimate the impact of a fare change on ridership. For example, if a fare elasticity is assumed to be -0.33, a 10% increase in fare price will result in a 3.3% decrease in ridership and vice versa – a 10% decrease in price will result in a 3.3% increase in ridership. It is generally assumed that lower income riders are more sensitive to price and therefore their price elasticities are higher, while higher income riders tend to be less sensitive to price and exhibit lower price elasticities.
The CH2M FARES model was used to calculate maximum program adoption and resulting program cost (revenue loss). Using local survey data and statistics on qualified riders, the study has established an upper limit on potential cost. Although it is reasonable to assume that not every qualified rider will take advantage of a low income fare program (and that actual costs would be lower than the maximum) there is no basis to estimate how much below the maximum costs might be.
1 In the past, Golden Gate Transit provided much of Marin Transit’s service and performance data reported by MTC combined the two agencies. As a result, Marin Transit was included with Golden Gate among the transit providers that were analyzed at the market segment level.
Regional Means-Based Transit Fare Pricing Study: Project Overview Final Report – DRAFT
4 DECEMBER 7, 2016
Existing Policies and Conditions
Technical Memorandum #1: Existing Policies and Conditions provides the results of the first phase of the study, an existing conditions analysis that included:
Discussions with Bay Area social service agencies
Review of existing means-based fare discounts offered by Bay Area transit providers
Research into other means-based pricing and transit affordability programs in the Bay Area and
North America.
Technical Memorandum #1 includes a description of the current conditions and policies in the Bay Area that have implications for low income residents as well as means-based programs that have been undertaken in other regions and by other sectors. It also includes a statement of the project goals and the results of discussions of project objectives with study stakeholders and potential performance measures for use in assessing how well proposed policy changes meet study goals and objectives.
The key findings of this Policies and Conditions background review served as the foundation for crafting preliminary means-based transit fare scenarios for the Bay Area in the next task of this study. High-level findings include:
The region’s four largest transit agencies (SFMTA, AC Transit, BART, and VTA) account for 90%
of the region’s transit trips.
Transportation is the third-largest budget item for low income households in California’s
metropolitan areas. For low income households, only housing and food expenditures constitute
larger budget shares than transportation expenditures.
A majority of transit riders are low income. Approximately half of Bay Area transit riders are
very low income (household income under $25,000) and three-quarters are low income
(household income under $50,000). While three-quarters of disabled passengers are very low
income, only about half of seniors are.
Among Bay Area transit riders, the lowest income riders make shorter trips than higher
income riders, traveling less than one-third the distance of the highest income riders. Low
income riders generally use local bus systems at higher rates while upper-income riders use the
region’s long-distance transit modes at higher rates.
Low income transit discount programs have evolved over time. The broad variety of the
programs that have been developed reflect the diversity of needs that transit operators have
chosen to address. Transit agencies generally offer two categories of low income transit
discount programs: bulk ticket sales programs and other low income programs. The programs
are targeted at different populations. Bulk sales are generally not intended to address on-going
needs, but rather are designed to meet immediate needs. Other low income programs (e.g.,
Free Muni, ORCA LIFT) are intended to meet longer-term on-going needs.
Health and social service organizations can be key partners in low income transit discount
programs. In the Bay Area, these organizations are key partners in both SFMTA’s Lifeline and
VTA’s UPLIFT and TAP programs. School districts are also partners with transit operators in low
income discount programs targeting Bay Area students (SFMTA, Marin Transit, and SolTrans). In

Regional Means-Based Transit Fare Pricing Study: Project Overview Final Report – DRAFT
5 DECEMBER 7, 2016
addition, using social service agencies provides potential opportunities to help enroll
participants into other programs, such as Medi-Cal and CalFresh. Opportunities also exist to
streamline means testing by linking eligibility to existing programs, such as Medi-Cal or CARE
programs.
MTC presented these findings to the Technical Advisory Committee (TAC) on May 28, 2015. In
response to the findings in the memorandum, the TAC wanted to ensure that the study would also:
Create a fare pricing and/or payment structure that is convenient and compliant with applicable regulations, including Title VI.
Establish clear and consistent definitions of “low income” and “resident.”
Support transit operator farebox recovery and financial objectives to ensure the program can be successful and sustainable – and if needed, identify funding source(s) to offset revenue and cost impacts.
Build consensus for a shared regional approach across Bay Area transit operators, social service agencies, community organizations, and external stakeholders.
Ensure program scenarios are appropriate for the region’s four largest transit agencies (SFMTA, AC Transit, BART, and VTA) that account for 90% of the region’s transit trips.
Support low income individuals who make up the majority of Bay Area transit riders and whose households rank transportation as their third largest expense, behind housing and food2.
Establish a well administered means-based testing program to verify eligibility for low income programs, if required.
Review existing discount programs to see how they currently support low income riders, whether their policy objectives are being met, or if those programs could be adjusted to better serve low income riders.
Consider how to partner with Bay Area health and human services agencies.
Developing Low-Income Fare Affordability Scenarios
Technical Memorandum #1, Policies and Conditions, established the existing conditions and
demographics of low income transit riders. Informed by that memo and feedback from the TAC, the
CH2M study team with MTC staff developed a wide-ranging set of draft low-income fare affordability
scenarios for consideration by the TAC. Those draft scenarios were documented in Technical
Memorandum #2, Alternative Fare Scenarios.
Eight different fare affordability scenarios were proposed, based on the overall program objectives, national peer examples, local expertise in Bay Area transit fare policy, and findings of the previous task. Developing and reviewing these draft scenarios exposed three key requirements for a successful low income program:
A clear and consistent definition of “low income” and “resident,”
2 As discussed in Regional Means-Based Transit Fare Pricing Study Technical Memorandum #1: Policies and Conditions, Section 1.1.2 Literature Review.
Regional Means-Based Transit Fare Pricing Study: Project Overview Final Report – DRAFT
6 DECEMBER 7, 2016
A fair means-based testing program to verify eligibility for low income programs
Pricing and payment that is convenient and compliant with applicable regulations (e.g., Title VI).
The second technical memo explores these challenges and considers the following building blocks for the alternative fare scenarios proposed:
Discount Structure: What discount and/or other policy tool will be implemented?
Geographic Scope: Which operators will participate? Will it be an opt-in program? Will there be
a limited demonstration project? Will there be regional consistency in discounts offered?
Target Population & Income Threshold: Who is the target market? What income threshold will
be used to determine eligibility?
Means-Testing: Who will conduct the means-testing if eligibility assessments are required?
Distribution: How will the benefits or discounts be distributed?
Fare Media: What media will be used to distribute the discounts (e.g., Clipper, paper)?
Proposed Fare Affordability Scenarios Seven scenarios were defined for making transit fares more affordable for low income riders in the Bay Area. An eighth scenario combined several of the affordability scenarios into a multi-pronged, high-impact “Big Idea” scenario.
1. The Big Idea
Combining several different approaches (of those described below in scenarios 2-8) into one “Big Idea” could result in a multi-pronged, high-impact scenario. One example of how several different approaches might be combined include:
Discounted low Income fares and/or pass program (see scenario #2)
Peak/off-peak pricing (see scenario #3)
Fare accumulators (see scenario #6)
Eliminate non-mandated cash discounts (see Revenue Generating opportunity ‘A’)
2. Discounted low Income fares and/or pass program
Offering low income riders a region-wide discount (potentially 50%) on all fares and passes, whether paid by cash or Clipper®.
3. Discounted off-peak fares
Offering all riders, regardless of income, a fare discount during off-peak hours. Two-thirds of low income riders travel during the off-peak while only half of higher income riders travel during the off-peak. This option minimizes program administration by offering discounts to all riders and eliminating the need for means-testing.
4. Regional interagency pass
Similar to the BART/Muni Adult “A” Fast Pass, this scenario would establish a regional pass that would allow unlimited rides on multiple operators within a defined geographic area. An interagency pass provides the flexibility for riders to use multiple operators, facilitating interagency transfers while minimizing the cost to transfer. Based on rider survey data, low income riders are more likely to transfer

Regional Means-Based Transit Fare Pricing Study: Project Overview Final Report – DRAFT
7 DECEMBER 7, 2016
to reach their final destinations. However, introducing a pass to facilitate interagency travel will not necessarily address the high upfront cost that may not be affordable for low income riders.
5. Make transfers more affordable
Offering free, discounted, or time-extended interagency transfers would increase affordability of trips that require use of multiple operators in the absence of an interagency or regional pass. While offering a small discount on interagency transfers (e.g., $0.50) does improve affordability, the fare for the entire trip may still create a financial burden to low income riders. Offering a day pass in lieu of intra-agency transfers would further increase affordability, especially on transit systems designed to require transferring to complete a trip.
6. Monthly fare or trip accumulators
Also referred to as fare capping, best fares, or fair fares, this scenario establishes a mechanism that allows low income riders to pay individual fares for each boarding up to a “cap,” at which time the rider automatically earns a monthly pass so that future rides during that month are free.
7. Add cash to Clipper Card for low income riders
This scenario would provide a cash value, transit-only subsidy to low income riders who qualify. Transit agencies would not be required to make changes to their established fares.
8. Increase use of existing discounts/reduce barriers to existing discounts
Several transit operators offer discounted fares and/or passes (e.g., youth passes, senior/disabled passes, monthly passes) that are sometimes underutilized due to a variety of barriers. This scenario would identify those barriers and implement strategies to mitigate them.
Proposed Revenue Generating Scenarios The fare policy scenarios outlined above are all intended to reduce fares paid by low income riders. Therefore, they are expected to reduce overall fare revenue for the transit agencies. While scenarios selected for further evaluation are not required to be revenue neutral, each scenario should be consistent with the study goal to be “administratively viable and financially feasible, and not adversely affect the transit system’s service levels and performance.” Therefore, complementary revenue generation strategies were developed to consider how lost revenue might be replaced.
In developing the revenue generating scenarios, the study team tried to identify new, non-traditional revenue opportunities that might only make sense only once the region is committed to fully implementing a low income fare program.
A. Eliminate non-mandated cash discounts/eliminate proxies for low income
The Federal Transit Administration requires its grantees to provide half fare discounts for seniors, persons with disabilities, and Medicare cardholders on one-way fares during off-peak periods. Eliminating the discounts that transit agencies choose to offer that exceed these requirements could generate additional revenue. However, a low income program that ensured all low income riders, regardless of rider category, had access to discounts might eliminate the need for these non-mandated discounts.

Regional Means-Based Transit Fare Pricing Study: Project Overview Final Report – DRAFT
8 DECEMBER 7, 2016
B. Eliminate discounted fare products (e.g., monthly passes)
Additional revenue could be generated by eliminating fare products, such as monthly passes, that provide discounts to all riders, regardless of financial need. Transit operators have traditionally offered passes to provide discounts to their most frequent and loyal riders, and to simplify fare payment and fare collection. However, with Clipper, passes are no longer needed to simplify fare collection and eliminating these discounts could generate additional fare revenue.
C. Implement fare increases for non-low income riders
Additional revenue could be generated by implementing fare increases. Revenue increases from non-low income riders can help offset revenue losses from offering a low income program.
Quantitative and Qualitative Evaluation
The TAC met with MTC staff and the CH2M study team on August 3, 2015 to review and provide feedback on the alternative fare and revenue scenarios. That feedback was considered in staff’s decision to narrow and refine the alternatives, which were reviewed by MTC’s Programming and Allocations Committee in December 2015. From the preliminary fare alternative and fee generating scenarios outlined in Technical Memorandum #2, three fare affordability scenarios and two revenue generating scenarios were selected for further definition and analysis.
Affordability Scenarios A1 – Discounted Fares and Passes for Low Income Riders
A2 – Accumulator with Monthly Cap for Low Income Riders
A3 – Cash on Clipper® for Low Income Riders
Revenue Generating Scenarios R1 – Eliminate Non-Mandated Cash Discounts
R2 – Implement Fare Increases
Evaluation Results Each of the five scenarios is described here in greater detail, including program-specific parameters as well as the results of qualitative and quantitative evaluations, which were provided in Technical Memorandum #3, Quantitative and Qualitative Evaluation. Agency-specific and region-wide ridership and fare revenue impacts were developed for each scenario. Region-wide impacts are summarized below, under each scenario description. Agency-specific ridership and fare revenue forecasts assume full implementation and utilization of each low income program in Year 1 – in effect, defining the maximum potential impacts and exposure. In actually implementing low income programs, other agencies have found that uptake is more gradual and their experiences as well the results of any pilot program could help scale a Bay Area program. Despite efforts earlier in the study to avoid means-testing, all scenarios include means testing to verify income and that is a critical aspect of implementing and managing a low income program, even though it may limit the reach of the program and would not benefit those that do not meet the criteria. As noted in Next Steps, it may be possible to reduce the complexities of means testing by accepting individuals who are already qualified for one of more means-tested programs, such as CalFresh.

Regional Means-Based Transit Fare Pricing Study: Project Overview Final Report – DRAFT
9 DECEMBER 7, 2016
A1 – Discounted Fares and Passes for Low Income Riders
Most transit operators currently offer discounted cash fares or pass products to seniors, persons with disabilities, and youth. This scenario would create an additional discount category for low income persons, which would allow individuals below a certain income threshold to pay fares or purchase passes at a discount.
Parameters
50% discount on all agency-specific cash fares and Clipper® stored value fares.
Advantages
Offering specialized low income fares and passes and requiring eligibility assessments, similar to the Seattle ORCA LIFT program, provides a way to offer discounted fares to a specific target population without requiring discounted fares for those who do not qualify.
Clipper® cards would be issued as IDs to individuals who qualify for means-based price discounts. The cards could be used only as proof or eligibility or for both identification and fare payment.
Can be implemented by all Bay Area operators, regardless of fare structure, including those that do not offer pass products and those that are not yet on the Clipper® system.
Extending the discount to cash and stored value fares as well as to monthly passes makes the discount affordable to as many riders as possible. Offering only a discounted pass (and not a trip-based cash or stored value discount) would not address the high up-front cost that may make monthly passes unaffordable for low income riders.
Disadvantages
Riders who wish to use a Clipper® card to store value or discounted passes would need to be able to load value or products onto their cards in advance of use.
It may be necessary to issue the Clipper® card with a photo if it is used to allow riders to obtain discounts on cash fares. While some programs, including Seattle’s ORCA LIFT, have avoided using distinguishing IDs (such as photo IDs or differently colored cards), other agencies do not have that concern and do require photos (e.g., Tucson’s SunGo ID & Card).
Bay Area transit operators have different base fares, pass multiples, and transfer policies. Implementation on a regional basis will require handling multiple price points, different service types/distances traveled (e.g., local bus vs. regional rail), and other different fare policies, making it difficult to implement across operators.
Quantitative Analysis
Region-wide impacts were estimated as follows:
A1 (Cash/Pass Discounts) Annual Ridership Impact (millions)
Annual Fare Revenue Impact (millions)
Low Income Riders 24.7 -$79.6
Non-Low Income Riders 0.0 $0.0
Total 24.7 -$79.6 Note: Ridership and fare revenue forecasts assume unconstrained, full implementation and utilization in Year 1.

Regional Means-Based Transit Fare Pricing Study: Project Overview Final Report – DRAFT
10 DECEMBER 7, 2016
Qualitative Analysis
Transit would become more affordable for the Bay Area’s low income residents. Based on these eligibility thresholds, this alternative is estimated to increase transit trips among low income riders by 24.7 million (4.7%) to 544.4 million annually, if fully implemented and utilized.
This approach would achieve a more consistent regional standard of 50% discount on fares in the Bay Area, if it were adopted by all operators.
The financial viability of this alternative will depend on the ability to cover fare revenue losses of up to $79.6 million plus implementation costs.
A2 – Accumulator with Monthly Cap for Low Income Riders
Accumulators are alternatives to pass products that cap fares or provide bonus trips based on a threshold (number of boardings or value of fares paid) within a defined period of time. Accumulators with monthly caps would allow riders to purchase pass products (e.g., monthly passes) in small increments rather than paying the full price of the pass up-front. For example, if the fare is $2.50 and the monthly pass price is $100, $2.50 would be deducted from the rider’s Clipper® card on each boarding until the $100 "cap" is reached (with the 40th boarding). After that, all trips would be free for the rest of the month. In this scenario, fares would be capped on a monthly basis, and the cap would be set lower for low income riders than for the general population.
Parameters
50% discount on fare caps for low income riders on agency-specific fare accumulators.
Separate fare caps for low income riders and all other riders.
Accumulators are agency-specific; inter-agency transfer and monthly pass agreements are not included.
Advantages
Clipper® business rules would afford low income riders the best fare possible. Frequent riders have the ability to obtain unlimited travel advantages of a monthly pass even if they are unable to afford the upfront cost of a monthly pass.
Even riders who do not qualify as low income riders may find an accumulator program beneficial because they are able to spread out the cost of a monthly pass over the course of many boardings.
While infrequent riders may not travel enough to reach the monthly cap, they also would not need to purchase a monthly product in advance and risk underutilizing it.
Disadvantages
Fare capping primarily benefits those riders who travel frequently enough to reach the cap. Alternatively, instead of capping low income fares at half the cap for general public users, the per-trip fare could also be discounted by 50%.
Fare capping would require a Clipper® card to pay fares using stored value, track fares paid toward the cap, and provide free trips once the cap is reached. Fare capping could not be provided to riders paying cash fares. Focus group participants observed that it would be a burden to access the discounts if they were limited to Clipper®.

Regional Means-Based Transit Fare Pricing Study: Project Overview Final Report – DRAFT
11 DECEMBER 7, 2016
With accumulators and fare capping, agencies may lose revenue associated with riders who previously purchased monthly passes but underused them.
Implementation of a monthly fare cap is not possible with the current generation of Clipper® due to memory limitations with the current Clipper® card. This scenario therefore is not viable until the roll-out of the next generation Clipper® system that is anticipated to start in 2019 at the earliest.
The Bay Area transit agencies have different base fares, pass multiples, and transfer policies. Implementation of accumulators throughout the region will require handling multiple price points, different service types/distances traveled (e.g., local bus vs. regional rail), and other different fare policies, making it difficult to implement a single regional accumulator across all operators.
Agencies that do not currently offer pass products may not wish to develop a low income pass product.
Quantitative Analysis
Region-wide impacts were estimated as follows:
A2 (Fare Capping) Annual Ridership Impact (millions)
Annual Fare Revenue Impact (millions)
Low Income Riders 23.3 -$64.2
Non-Low Income Riders 0.0 $0.0
Total 23.3 -$64.2 Note: Ridership and fare revenue forecasts assume unconstrained, full implementation and utilization in Year 1.
Qualitative Analysis
Transit would become more affordable for the Bay Area’s low income residents. Based on these eligibility thresholds, this alternative is estimated to increase transit trips among low income riders by 23.3 million to 252.1 million annually, if fully implemented and utilized.
This approach would achieve the goal of a more consistent regional standard for discounting fares in the Bay Area, if it was adopted by all operators. It would provide a consistent 50% discount on the price of a monthly pass to all eligible riders paying fares from Clipper® stored value, as well as the advantages of fare capping, which would provide the benefit of a monthly pass to riders who currently may be unable to afford one.
The financial viability of this alternative will depend on the ability to cover fare revenue losses of up to $64.2 million plus development and implementation costs.
A3 – Cash on Clipper® for Low Income Riders
The Cash on Clipper® scenario would provide a transit-only “cash” subsidy to eligible low income riders by adding funds to the stored value on a Clipper® card, to match funds added by the rider, effectively providing a 50% fare discount on fares paid with stored value. The subsidy could take the form of a stored value credit to eligible riders’ Clipper® cards, similar to a pre-tax transit benefit. Other methods of value distribution besides Clipper®, such as paper-based commuter checks or benefits cards, could be developed but are not recommended.

Regional Means-Based Transit Fare Pricing Study: Project Overview Final Report – DRAFT
12 DECEMBER 7, 2016
Parameters
The scenario evaluated here assumes that stored value added by eligible riders would be matched dollar-for-dollar, with no cap on the bonus that could be added, effectively providing a 50% discount on pay-per-trip stored value usage. Under this scenario, subsidies would be provided by MTC from a regional pool of funds, not by individual transit agencies.
Advantages
Riders are able to spend their Cash on Clipper® transit dollars on any/all transit agencies, thereby providing access to the entire regional transit system.
This option accommodates established transit fares and fare structures. It requires no changes to transit agencies’ established fares and therefore may be more feasible to implement.
Transit agencies could gain fare revenue from additional trips induced by the program (discounted fares would be paid by riders and matched by the regional funding pool).
Implementation on Clipper® speeds the distribution of value, minimizes the transferability of value, and reduces the potential for fraud, but enables and requires tracking and monitoring to minimize fraudulent use.
Disadvantages
There is a potential for fraud associated with the use of alternative methods of transit value distribution, such as more readily transferrable paper-based commuter checks or benefits cards, if the program is made available outside of Clipper®.
Quantitative Analysis
Region-wide impacts were estimated as follows:
A3 (Cash on Clipper®) Annual Ridership Impact (millions)
Annual Fare Revenue Impact (millions)
Low Income Riders 26.1 -$75.5
Non-Low Income Riders 0.0 $0.0
Total 26.1 -$75.5 Note: Ridership and fare revenue forecasts assume unconstrained, full implementation and utilization in Year 1.
For each operator, it is assumed that 70% of low income riders not currently using Clipper® would migrate to Clipper® to take advantage of the Cash on Clipper® program.
Qualitative Analysis
Transit would become more affordable for the Bay Area’s low income residents. Based on these eligibility thresholds, this alternative is estimated to increase transit trips among low income riders by 26.1 million to 254.9 million annually, if fully implemented and utilized.
Although Cash on Clipper® is designed to provide a consistent 50% discount to all eligible riders paying fare using Clipper® stored value, this approach would neither provide regional fare policy coordination nor simplify riders’ fare payment experiences.
The financial viability of the Cash on Clipper® alternative will depend on the ability to cover revenue fare losses of up to $75.5 million plus implementation costs

Regional Means-Based Transit Fare Pricing Study: Project Overview Final Report – DRAFT
13 DECEMBER 7, 2016
R1 – Eliminate Non-Mandated Cash Discounts
This scenario would generate revenue to help fund a low income transit fare program by eliminating all fare discounts beyond those that comply with Federal requirements. Federal regulations require transit systems that that use FTA formula funds, which includes virtually all Bay Area transit operators, to provide half-fare discounts to seniors (at a minimum, those riders who are age 65 and older), persons with disabilities, and Medicare recipients, but only during off-peak hours and on cash fares. There are currently no federal requirements for fare discounts for youth or low income persons.
Under this scenario, discounts beyond those that are federally mandated would be eliminated. However, many of those customers would become eligible for the low income program, thereby directing subsidies to those who need a discount – and collecting full fares from those that are not low-income.
Parameters
Federally-mandated half fare discounts available only on cash and Clipper® stored value fares and only during off-peak.
Retain free/reduced fixed route fares for ADA paratransit eligible riders.
No discounted passes for youth, seniors, persons with disabilities, Medicare recipients; other (full fare) passes and pass programs retained.
Advantages
Reducing the number and variety of discounts offered provides funding for a low income program designed to address the needs of those who are most in need of transit fare discounts.
Eliminating the variety of reduced fare programs simplifies fare policies, makes fare policies more consistent across the region in keeping with the overall goal of this study, and reduces administrative costs of managing several different discount fare programs.
Retaining mandated discounts on fares paid using Clipper® stored value reinforces the use of Clipper® regionally as well as the use of a specially programmed low income Clipper® card to support a Bay Area low income program.
Retaining free/reduced fares on fixed route services for riders who are eligible for ADA paratransit services encourages the use of lower cost fixed route services.
Disadvantages
Requires action by each transit agency’s policy board and may be extremely difficult to accomplish consistently on a regional basis.
Limiting discounts to off-peak periods would require time-sensitive (peak/off-peak) pricing, which is currently neither part of the Clipper® functionality nor of many operators’ fare-collection mechanisms, such as on-board fareboxes.
May have a negative impact on transit ridership throughout the Bay Area.

Regional Means-Based Transit Fare Pricing Study: Project Overview Final Report – DRAFT
14 DECEMBER 7, 2016
Quantitative Analysis
Region-wide impacts were estimated as follows:
R1 (Eliminate Discounts) Annual Ridership Impact (millions)
Annual Fare Revenue Impact (millions)
Low Income Riders -13.0 $30.4
Non-Low Income Riders -7.5 $22.9
Total -20.5 $53.2 Note: Ridership and fare revenue forecasts assume unconstrained, full implementation and utilization in Year 1.
Qualitative Analysis
By providing revenue that would help to offset the fare revenue reductions that would occur with the implementation of a low income transit fare program, this approach would help to assure that transit would become more affordable and sustainable for low income Bay Area residents.
Eliminating these discounts would increase fares for many transit users, thereby reducing transit use by nearly 21 million trips (approximately 4.1%).
By eliminating the many agency-specific discounts, this approach would assist in coordinating and simplifying the fare options offered across Bay Area transit agencies.
R2 – Implement Fare Increases
This scenario would consider the revenue generating effects of raising fares on all fare products throughout the region by 10%. It would always be paired with one of the Affordability Scenarios so the net impact would be to decrease fares for low income riders.
Parameters
Increase all cash and non-cash fares by 10% Retain existing discounted fare options and products
Advantages
Provides funding for a low income program designed to address the needs of those who are most in need of transit fare discounts.
Maintains each agency’s existing fare policies and structures.
Disadvantages
Increases fares by 10% for all riders on all Bay Area transit systems, modes and routes.
Increasing all fares by 10% will require action by each transit agency’s policy board and may be difficult to accomplish on a regional basis.
Increasing all fares by 10% may negatively impact Bay Area transit ridership.

Regional Means-Based Transit Fare Pricing Study: Project Overview Final Report – DRAFT
15 DECEMBER 7, 2016
Quantitative Analysis
Region-wide impacts were estimated as follows:
R2 (10% Fare Increase) Annual Ridership Impact (millions)
Annual Fare Revenue Impact (millions)
Low Income Riders -6.7 $20.9
Non-Low Income Riders -7.2 $45.5
Total -13.9 $66.3
Note: Ridership and fare revenue forecasts assume unconstrained, full implementation and utilization in Year 1.
Qualitative Analysis
This approach would not change the fare options offered by Bay Area transit agencies and would neither improve fare coordination and simplification nor make fares more consistent across the agencies that provide transit services.
Increasing fares would increase fares for all transit users and potentially reduce transit use by nearly 14 million trips (approximately 2.7%).
The financial viability of any low income program depends on the ability to cover the fare revenue losses that the transit operators will experience. This revenue scenario has the potential to recapture most of the revenues lost by implementing a low income program.
Means Testing
In all of the Affordability scenarios analyzed, a reduced fare or fare subsidy is offered to those riders who qualify as low income. Identifying those riders who qualify will require means testing to verify income. Regardless of how means testing is conducted, an ID providing evidence of eligibility must be issued to serve as proof of low income qualification. A specially programmed low income Clipper® card could be created to serve this purpose, as well as a convenient way for riders to pay fares.
Means testing involves two steps:
Income Verification: Establishing an income verification process will require agreement on forms of documentation that are acceptable for confirming income.
Eligibility Determination: Eligibility determination involves reviewing income verification documentation, providing eligibility determinations, and distributing low income transit fare program identification cards.
The eligibility determination function could be managed in-house by one or more (or all) transit agencies and/or MTC, or outsourced to social service agencies or to a contractor similar to the Bay Area’s RTC program contractor. Outsourcing would require MTC or a designated lead transit agency partner to manage the contract(s).

Regional Means-Based Transit Fare Pricing Study: Project Overview Final Report – DRAFT
16 DECEMBER 7, 2016
The following table provides rough order of magnitude estimates for program startup costs and ongoing operations costs required to develop and manage a regional means testing function, based on the study’s analysis:
In-House Low In-House High Outsourced Low Outsourced High
1-Time Startup Costs $600,000 $1,000,000 $550,000 $800,000
Total Annual Operations $1,350,000 $1,650,000 $1,020,000 $1,520,000
1st Year Startup + Ops $1,950,000 $2,650,000 $1,570,000 $2,320,000
Because the scenarios are only minimally defined, a range of implementation variables are likely to affect both the program cost and the cost of means testing. The future products offered, the number of riders targeted, the promotional goals of the program, and the number of staff dedicated to the program will determine the full range of eventual costs.
Alternatives Evaluation, Recommended Actions
Throughout the study, MTC staff provided policy direction and guidance for a low income fare program. The TAC also served as a resource, providing feedback on the structures and assumptions behind the Affordability and Revenue Generating scenarios and the resulting ridership and fare revenue projections. The TAC met on August 4, 2016 to review the ridership and fare revenue projections and also provided the following broad-based input on policy direction for a Bay Area means-based fare pricing program:
Affordability was further defined as helping all qualifying riders similarly every month up to the budgetary limits of the program. It does not necessarily favor certain subgroups of low income riders over others. While improving affordability is considered to be the primary policy objective, it can be relative:
A 50% discount is comparable to FTA’s mandated discounts for seniors and persons with disabilities, and is an appropriate level of discount to provide a meaningful benefit to users.
Any discount would be viewed as helpful, as long as program qualification, enrollment, and participation is simple, straightforward, and streamlined for agencies and users alike.
Feasibility was further defined to include nearer-term implementation that does not rely on C2, which may still be years away from full implementation.
Accessibility to Clipper® is neither a key concern nor a major potential barrier with using Clipper® to distribute subsidies; having a cash-paying option is not essential to a low income program.
Limiting participation to a specific geographic area of the region was seen by some members of the TAC as potentially troublesome, unless the geographic limitation is part of a phased implementation or a pilot program.
With the analysis complete and TAC and MTC feedback received, CH2M conducted a weighting and prioritization analysis to determine the final set of preferred scenarios, using the following criteria:
1. Rider Affordability: This goal is weighted as a top priority for the program. This goal is defined by financial affordability and ease of access through objectives such as easy enrollment and

Regional Means-Based Transit Fare Pricing Study: Project Overview Final Report – DRAFT
17 DECEMBER 7, 2016
participation, provision of the same discount to all eligible individuals, and means testing based on eligibility for another social program such as CalFresh.
2. Administrative Feasibility & Financial Viability: Along with Rider Affordability, this goal is weighted as a top priority. This goal is defined by objectives such as scalability to available funding, central and electronic management, implementability under the current Clipper system, and Clipper-only payment to minimize agency overhead.
3. Consistent Regional Standard: This goal is weighted as a secondary priority. This goal is defined by objectives that emphasize consistent eligibility requirements and the use of Clipper, but do not depend upon implementation of new region-wide fare policy or products. This reflects a recognition that a implementing regional fare policy could become a barrier to timely implementation of a low-income program.
Based on the weighting of these goals and objectives listed above, two preferred Affordability fare scenarios emerged as the optimal choices: A1, Discounted Fares and Passes for Low Income Riders and A3, Cash on Clipper. Revenue generating scenarios will need to be considered at the agency level if agencies are to help fund and implement a low income program. We recommend that MTC provide regional policy support to agencies for fare increases (R2) as a partial long-term program funding strategy, while also recognizing that the timing of, and revenue from, individual agency fare increases may be inconsistent from agency to agency. Consequently, additional non-agency funding and implementation resources may need to be identified.
Next Steps
If MTC chooses to advance the concept of a regional means-based transit pricing program for the Bay Area, there are many policy and technical decisions that need to be made. A next step will be to share the study’s findings and recommendations with all Bay Area transit agencies and set initial direction through a plan to pilot one or both of the top-ranked alternatives.
Technical Implementation Based on CH2M’s experience with similar projects in the Bay Area, program definition activities could take two to four months. Contracting activities could take four to six months. Start-up of non-technical services (such as means-testing) could take four to eight months (depending on staffing). And technical systems implementation could take four to eight months (but could be conducted concurrently with start-up activities). Overall, technical implementation could take 10 to 18 months. However, this estimate could vary significantly depending on how Clipper system integration is managed and whether the current Clipper vendor is required to make changes to the current clipper system.
Pilot Program A limited pilot program could be a near-term alternative to full-scale implementation. A useful pilot program would test rider demand, uptake rate, behavior change, and establish likely costs of a full-scale implementation (due to lost revenues and implementation and ongoing costs), and identify any problems with the proposed implementation.
Two pilot program options have been put forward. Pilot Option #1 is to temporarily issue RTC Discount Clipper Cards to individuals who have already qualified for one or more means-tested programs, such as CalFresh. This program would be most similar to A1, Discounted Fares and Passes.

Regional Means-Based Transit Fare Pricing Study: Project Overview Final Report – DRAFT
18 DECEMBER 7, 2016
The pilot program could be created quickly by issuing the policy directive to allow CalFresh cardholders to qualify for an RTC discount card. The pilot would track the uptake and usage of such cards for the duration of the pilot, after which time the pilot cards would be deactivated. RTC card issuance centers would need to be prepared for a surge in applications, but no other technical preparation would be required. Program enrollment could be restricted or expanded depending on the number of means-based programs (in addition to CalFresh) accepted as verification of low income status under the pilot program.
Pilot Option #2 would test scenario A3, Cash on Clipper, using a well-defined sub-target population. For example, local clients of existing social service programs could be offered the benefits of the pilot program. Those willing to participate could be given pilot Clipper® accounts. Using current Clipper® functionality, monthly cash subsidies could be added electronically to those pilot accounts.
Each of these pilot options provide a contained and straightforward way to test and document demand, uptake rate, and behavior change. This is the key information needed to define a means-testing process that reaches the target population, and to establish a solid multi-year budget that meets the needs of both low income riders and the transit agencies that provide vital daily service to these individuals.

Regional Means-Based Transit Fare Pricing Study: Project Overview Final Report – DRAFT
DECEMBER 7, 2016 A-1
Appendix A, notes
The following two appendices are reprinted in their entirety from Technical Memorandum #3, Evaluation of Alternatives. They have retained their original titles of Appendix B and C to avoid confusion.
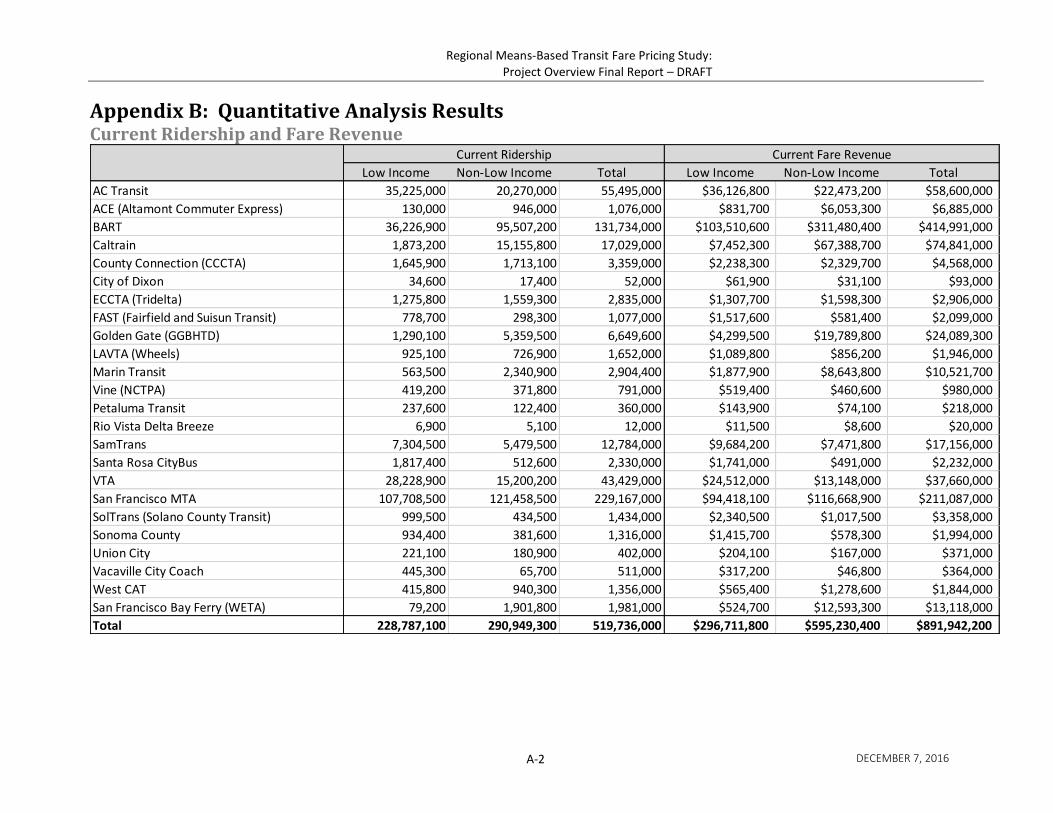
Regional Means-Based Transit Fare Pricing Study: Project Overview Final Report – DRAFT
DECEMBER 7, 2016 A-2
Appendix B: Quantitative Analysis Results Current Ridership and Fare Revenue
Low Income Non-Low Income Total Low Income Non-Low Income Total
AC Transit 35,225,000 20,270,000 55,495,000 $36,126,800 $22,473,200 $58,600,000
ACE (Altamont Commuter Express) 130,000 946,000 1,076,000 $831,700 $6,053,300 $6,885,000
BART 36,226,900 95,507,200 131,734,000 $103,510,600 $311,480,400 $414,991,000
Caltrain 1,873,200 15,155,800 17,029,000 $7,452,300 $67,388,700 $74,841,000
County Connection (CCCTA) 1,645,900 1,713,100 3,359,000 $2,238,300 $2,329,700 $4,568,000
City of Dixon 34,600 17,400 52,000 $61,900 $31,100 $93,000
ECCTA (Tridelta) 1,275,800 1,559,300 2,835,000 $1,307,700 $1,598,300 $2,906,000
FAST (Fairfield and Suisun Transit) 778,700 298,300 1,077,000 $1,517,600 $581,400 $2,099,000
Golden Gate (GGBHTD) 1,290,100 5,359,500 6,649,600 $4,299,500 $19,789,800 $24,089,300
LAVTA (Wheels) 925,100 726,900 1,652,000 $1,089,800 $856,200 $1,946,000
Marin Transit 563,500 2,340,900 2,904,400 $1,877,900 $8,643,800 $10,521,700
Vine (NCTPA) 419,200 371,800 791,000 $519,400 $460,600 $980,000
Petaluma Transit 237,600 122,400 360,000 $143,900 $74,100 $218,000
Rio Vista Delta Breeze 6,900 5,100 12,000 $11,500 $8,600 $20,000
SamTrans 7,304,500 5,479,500 12,784,000 $9,684,200 $7,471,800 $17,156,000
Santa Rosa CityBus 1,817,400 512,600 2,330,000 $1,741,000 $491,000 $2,232,000
VTA 28,228,900 15,200,200 43,429,000 $24,512,000 $13,148,000 $37,660,000
San Francisco MTA 107,708,500 121,458,500 229,167,000 $94,418,100 $116,668,900 $211,087,000
SolTrans (Solano County Transit) 999,500 434,500 1,434,000 $2,340,500 $1,017,500 $3,358,000
Sonoma County 934,400 381,600 1,316,000 $1,415,700 $578,300 $1,994,000
Union City 221,100 180,900 402,000 $204,100 $167,000 $371,000
Vacaville City Coach 445,300 65,700 511,000 $317,200 $46,800 $364,000
West CAT 415,800 940,300 1,356,000 $565,400 $1,278,600 $1,844,000
San Francisco Bay Ferry (WETA) 79,200 1,901,800 1,981,000 $524,700 $12,593,300 $13,118,000
Total 228,787,100 290,949,300 519,736,000 $296,711,800 $595,230,400 $891,942,200
Current Ridership Current Fare Revenue
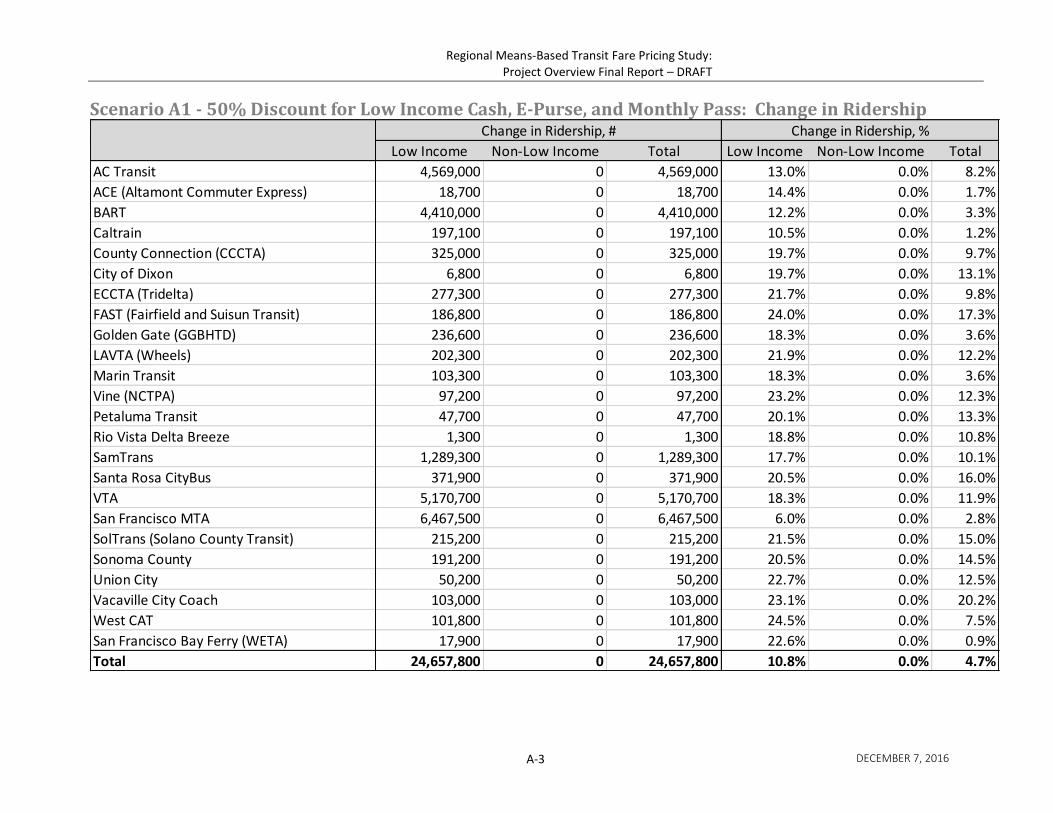
Regional Means-Based Transit Fare Pricing Study: Project Overview Final Report – DRAFT
DECEMBER 7, 2016 A-3
Scenario A1 - 50% Discount for Low Income Cash, E-Purse, and Monthly Pass: Change in Ridership
Low Income Non-Low Income Total Low Income Non-Low Income Total
AC Transit 4,569,000 0 4,569,000 13.0% 0.0% 8.2%
ACE (Altamont Commuter Express) 18,700 0 18,700 14.4% 0.0% 1.7%
BART 4,410,000 0 4,410,000 12.2% 0.0% 3.3%
Caltrain 197,100 0 197,100 10.5% 0.0% 1.2%
County Connection (CCCTA) 325,000 0 325,000 19.7% 0.0% 9.7%
City of Dixon 6,800 0 6,800 19.7% 0.0% 13.1%
ECCTA (Tridelta) 277,300 0 277,300 21.7% 0.0% 9.8%
FAST (Fairfield and Suisun Transit) 186,800 0 186,800 24.0% 0.0% 17.3%
Golden Gate (GGBHTD) 236,600 0 236,600 18.3% 0.0% 3.6%
LAVTA (Wheels) 202,300 0 202,300 21.9% 0.0% 12.2%
Marin Transit 103,300 0 103,300 18.3% 0.0% 3.6%
Vine (NCTPA) 97,200 0 97,200 23.2% 0.0% 12.3%
Petaluma Transit 47,700 0 47,700 20.1% 0.0% 13.3%
Rio Vista Delta Breeze 1,300 0 1,300 18.8% 0.0% 10.8%
SamTrans 1,289,300 0 1,289,300 17.7% 0.0% 10.1%
Santa Rosa CityBus 371,900 0 371,900 20.5% 0.0% 16.0%
VTA 5,170,700 0 5,170,700 18.3% 0.0% 11.9%
San Francisco MTA 6,467,500 0 6,467,500 6.0% 0.0% 2.8%
SolTrans (Solano County Transit) 215,200 0 215,200 21.5% 0.0% 15.0%
Sonoma County 191,200 0 191,200 20.5% 0.0% 14.5%
Union City 50,200 0 50,200 22.7% 0.0% 12.5%
Vacaville City Coach 103,000 0 103,000 23.1% 0.0% 20.2%
West CAT 101,800 0 101,800 24.5% 0.0% 7.5%
San Francisco Bay Ferry (WETA) 17,900 0 17,900 22.6% 0.0% 0.9%
Total 24,657,800 0 24,657,800 10.8% 0.0% 4.7%
Change in Ridership, # Change in Ridership, %

Regional Means-Based Transit Fare Pricing Study: Project Overview Final Report – DRAFT
DECEMBER 7, 2016 A-4
Scenario A1 - 50% Discount for Low Income Cash, E-Purse, and Monthly Pass: Change in Fare Revenue
Low Income Non-Low Income Total Low Income Non-Low Income Total
AC Transit -$9,229,300 $0 -$9,229,300 -25.5% 0.0% -15.7%
ACE (Altamont Commuter Express) -$309,600 $0 -$309,600 -37.2% 0.0% -4.5%
BART -$38,023,800 $0 -$38,023,800 -36.7% 0.0% -9.2%
Caltrain -$2,374,600 $0 -$2,374,600 -31.9% 0.0% -3.2%
County Connection (CCCTA) -$705,200 $0 -$705,200 -31.5% 0.0% -15.4%
City of Dixon -$19,500 $0 -$19,500 -31.5% 0.0% -21.0%
ECCTA (Tridelta) -$444,900 $0 -$444,900 -34.0% 0.0% -15.3%
FAST (Fairfield and Suisun Transit) -$558,000 $0 -$558,000 -36.8% 0.0% -26.6%
Golden Gate (GGBHTD) -$1,381,300 $0 -$1,381,300 -32.1% 0.0% -5.7%
LAVTA (Wheels) -$372,600 $0 -$372,600 -34.2% 0.0% -19.1%
Marin Transit -$603,300 $0 -$603,300 -32.1% 0.0% -5.7%
Vine (NCTPA) -$186,000 $0 -$186,000 -35.8% 0.0% -19.0%
Petaluma Transit -$45,900 $0 -$45,900 -31.9% 0.0% -21.1%
Rio Vista Delta Breeze -$3,500 $0 -$3,500 -30.4% 0.0% -17.5%
SamTrans -$2,979,600 $0 -$2,979,600 -30.8% 0.0% -17.4%
Santa Rosa CityBus -$564,500 $0 -$564,500 -32.4% 0.0% -25.3%
VTA -$7,521,100 $0 -$7,521,100 -30.7% 0.0% -20.0%
San Francisco MTA -$12,603,000 $0 -$12,603,000 -13.3% 0.0% -6.0%
SolTrans (Solano County Transit) -$790,300 $0 -$790,300 -33.8% 0.0% -23.5%
Sonoma County -$459,000 $0 -$459,000 -32.4% 0.0% -23.0%
Union City -$71,900 $0 -$71,900 -35.2% 0.0% -19.4%
Vacaville City Coach -$113,300 $0 -$113,300 -35.7% 0.0% -31.1%
West CAT -$211,300 $0 -$211,300 -37.4% 0.0% -11.5%
San Francisco Bay Ferry (WETA) -$183,900 $0 -$183,900 -35.0% 0.0% -1.4%
Total -$79,755,600 $0 -$79,755,600 -26.9% 0.0% -8.9%
Change in Fare Revenue, %Change in Fare Revenue, $

Regional Means-Based Transit Fare Pricing Study: Project Overview Final Report – DRAFT
DECEMBER 7, 2016 A-5
Scenario A2 - Low Income Monthly Accumulator, Cap at 50% of Monthly Pass: Change in Ridership
Low Income Non-Low Income Total Low Income Non-Low Income Total
AC Transit 4,822,500 0 4,822,500 13.7% 0.0% 8.7%
ACE (Altamont Commuter Express) 9,700 0 9,700 7.5% 0.0% 0.9%
BART 3,432,300 0 3,432,300 9.5% 0.0% 2.6%
Caltrain 183,000 0 183,000 9.8% 0.0% 1.1%
County Connection (CCCTA) 196,800 0 196,800 12.0% 0.0% 5.9%
City of Dixon 3,800 0 3,800 11.0% 0.0% 7.3%
ECCTA (Tridelta) 155,000 0 155,000 12.1% 0.0% 5.5%
FAST (Fairfield and Suisun Transit) 103,700 0 103,700 13.3% 0.0% 9.6%
Golden Gate (GGBHTD) 202,300 0 202,300 15.7% 0.0% 3.0%
LAVTA (Wheels) 121,400 0 121,400 13.1% 0.0% 7.3%
Marin Transit 88,400 0 88,400 15.7% 0.0% 3.0%
Vine (NCTPA) 53,800 0 53,800 12.8% 0.0% 6.8%
Petaluma Transit 25,900 0 25,900 10.9% 0.0% 7.2%
Rio Vista Delta Breeze 700 0 700 10.1% 0.0% 5.8%
SamTrans 991,100 0 991,100 13.6% 0.0% 7.8%
Santa Rosa CityBus 197,900 0 197,900 10.9% 0.0% 8.5%
VTA 3,651,200 0 3,651,200 12.9% 0.0% 8.4%
San Francisco MTA 8,685,300 0 8,685,300 8.1% 0.0% 3.8%
SolTrans (Solano County Transit) 132,600 0 132,600 13.3% 0.0% 9.2%
Sonoma County 101,800 0 101,800 10.9% 0.0% 7.7%
Union City 24,100 0 24,100 10.9% 0.0% 6.0%
Vacaville City Coach 60,400 0 60,400 13.6% 0.0% 11.8%
West CAT 65,200 0 65,200 15.7% 0.0% 4.8%
San Francisco Bay Ferry (WETA) 11,600 0 11,600 14.6% 0.0% 0.6%
Total 23,320,400 0 23,320,400 10.2% 0.0% 4.5%
Change in Ridership, # Change in Ridership, %

Regional Means-Based Transit Fare Pricing Study: Project Overview Final Report – DRAFT
DECEMBER 7, 2016 A-6
Scenario A2 - Low Income Monthly Accumulator, Cap at 50% of Monthly Pass: Change in Fare Revenue
Low Income Non-Low Income Total Low Income Non-Low Income Total
AC Transit -$8,409,700 $0 -$8,409,700 -23.3% 0.0% -14.4%
ACE (Altamont Commuter Express) -$179,800 $0 -$179,800 -21.6% 0.0% -2.6%
BART -$27,436,700 $0 -$27,436,700 -26.5% 0.0% -6.6%
Caltrain -$2,027,000 $0 -$2,027,000 -27.2% 0.0% -2.7%
County Connection (CCCTA) -$464,100 $0 -$464,100 -20.7% 0.0% -10.2%
City of Dixon -$11,800 $0 -$11,800 -19.1% 0.0% -12.7%
ECCTA (Tridelta) -$274,800 $0 -$274,800 -21.0% 0.0% -9.5%
FAST (Fairfield and Suisun Transit) -$345,100 $0 -$345,100 -22.7% 0.0% -16.4%
Golden Gate (GGBHTD) -$1,121,800 $0 -$1,121,800 -26.1% 0.0% -4.7%
LAVTA (Wheels) -$244,700 $0 -$244,700 -22.5% 0.0% -12.6%
Marin Transit -$490,000 $0 -$490,000 -26.1% 0.0% -4.7%
Vine (NCTPA) -$114,500 $0 -$114,500 -22.0% 0.0% -11.7%
Petaluma Transit -$27,500 $0 -$27,500 -19.1% 0.0% -12.6%
Rio Vista Delta Breeze -$2,200 $0 -$2,200 -19.1% 0.0% -11.0%
SamTrans -$2,237,000 $0 -$2,237,000 -23.1% 0.0% -13.0%
Santa Rosa CityBus -$332,800 $0 -$332,800 -19.1% 0.0% -14.9%
VTA -$5,443,700 $0 -$5,443,700 -22.2% 0.0% -14.5%
San Francisco MTA -$13,834,700 $0 -$13,834,700 -14.7% 0.0% -6.6%
SolTrans (Solano County Transit) -$530,400 $0 -$530,400 -22.7% 0.0% -15.8%
Sonoma County -$270,700 $0 -$270,700 -19.1% 0.0% -13.6%
Union City -$39,000 $0 -$39,000 -19.1% 0.0% -10.5%
Vacaville City Coach -$73,200 $0 -$73,200 -23.1% 0.0% -20.1%
West CAT -$147,500 $0 -$147,500 -26.1% 0.0% -8.0%
San Francisco Bay Ferry (WETA) -$128,800 $0 -$128,800 -24.5% 0.0% -1.0%
Total -$64,187,700 $0 -$64,187,700 -21.6% 0.0% -7.2%
Change in Fare Revenue, %Change in Fare Revenue, $

Regional Means-Based Transit Fare Pricing Study: Project Overview Final Report – DRAFT
DECEMBER 7, 2016 A-7
Scenario A3 - Low Income Clipper E-Purse with Bonus Value, at 1 to 1 Match: Change in Ridership
Low Income Non-Low Income Total Low Income Non-Low Income Total
AC Transit 5,849,500 0 5,849,500 16.6% 0.0% 10.5%
ACE (Altamont Commuter Express) 13,300 0 13,300 10.2% 0.0% 1.2%
BART 4,794,200 0 4,794,200 13.2% 0.0% 3.6%
Caltrain 209,300 0 209,300 11.2% 0.0% 1.2%
County Connection (CCCTA) 259,500 0 259,500 15.8% 0.0% 7.7%
City of Dixon 5,200 0 5,200 15.0% 0.0% 10.0%
ECCTA (Tridelta) 205,800 0 205,800 16.1% 0.0% 7.3%
FAST (Fairfield and Suisun Transit) 125,900 0 125,900 16.2% 0.0% 11.7%
Golden Gate (GGBHTD) 262,200 0 262,200 20.3% 0.0% 3.9%
LAVTA (Wheels) 146,200 0 146,200 15.8% 0.0% 8.8%
Marin Transit 114,500 0 114,500 20.3% 0.0% 3.9%
Vine (NCTPA) 67,800 0 67,800 16.2% 0.0% 8.6%
Petaluma Transit 35,800 0 35,800 15.1% 0.0% 9.9%
Rio Vista Delta Breeze 1,000 0 1,000 14.5% 0.0% 8.3%
SamTrans 1,161,900 0 1,161,900 15.9% 0.0% 9.1%
Santa Rosa CityBus 273,500 0 273,500 15.0% 0.0% 11.7%
VTA 4,507,600 0 4,507,600 16.0% 0.0% 10.4%
San Francisco MTA 7,554,100 0 7,554,100 7.0% 0.0% 3.3%
SolTrans (Solano County Transit) 161,700 0 161,700 16.2% 0.0% 11.3%
Sonoma County 140,600 0 140,600 15.0% 0.0% 10.7%
Union City 33,300 0 33,300 15.1% 0.0% 8.3%
Vacaville City Coach 70,800 0 70,800 15.9% 0.0% 13.9%
West CAT 84,500 0 84,500 20.3% 0.0% 6.2%
San Francisco Bay Ferry (WETA) 14,400 0 14,400 18.2% 0.0% 0.7%
Total 26,092,900 0 26,092,900 11.4% 0.0% 5.0%
Change in Ridership, # Change in Ridership, %
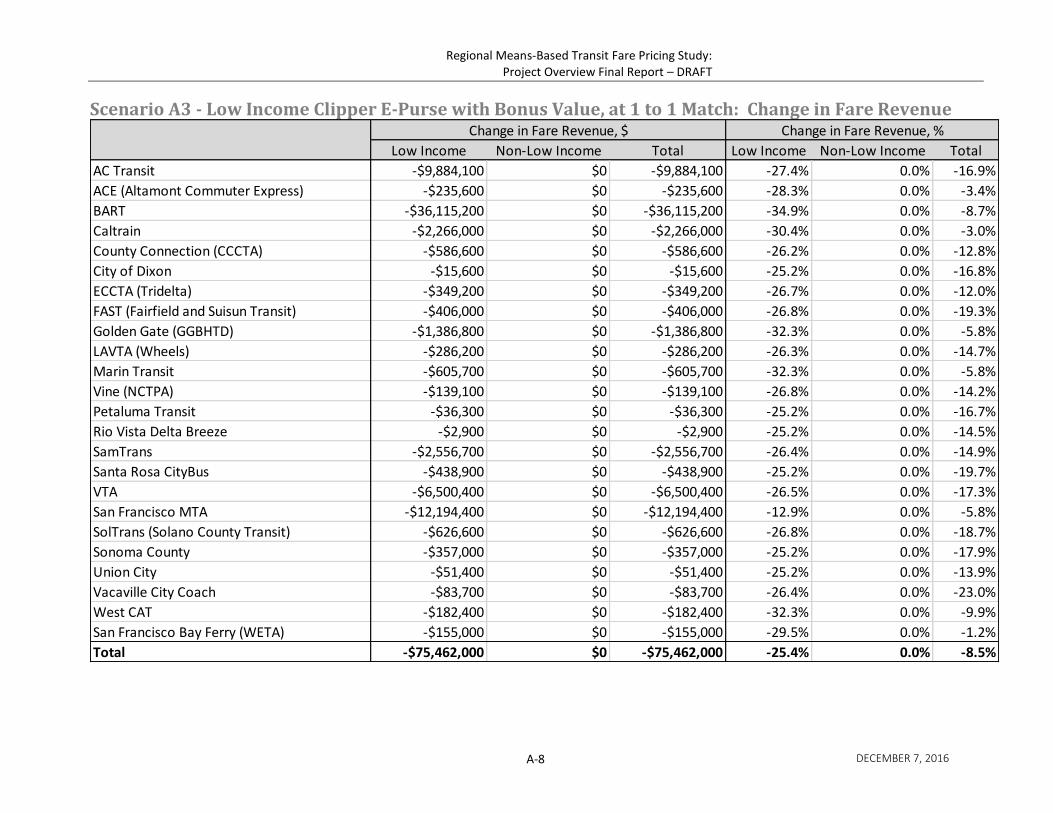
Regional Means-Based Transit Fare Pricing Study: Project Overview Final Report – DRAFT
DECEMBER 7, 2016 A-8
Scenario A3 - Low Income Clipper E-Purse with Bonus Value, at 1 to 1 Match: Change in Fare Revenue
Low Income Non-Low Income Total Low Income Non-Low Income Total
AC Transit -$9,884,100 $0 -$9,884,100 -27.4% 0.0% -16.9%
ACE (Altamont Commuter Express) -$235,600 $0 -$235,600 -28.3% 0.0% -3.4%
BART -$36,115,200 $0 -$36,115,200 -34.9% 0.0% -8.7%
Caltrain -$2,266,000 $0 -$2,266,000 -30.4% 0.0% -3.0%
County Connection (CCCTA) -$586,600 $0 -$586,600 -26.2% 0.0% -12.8%
City of Dixon -$15,600 $0 -$15,600 -25.2% 0.0% -16.8%
ECCTA (Tridelta) -$349,200 $0 -$349,200 -26.7% 0.0% -12.0%
FAST (Fairfield and Suisun Transit) -$406,000 $0 -$406,000 -26.8% 0.0% -19.3%
Golden Gate (GGBHTD) -$1,386,800 $0 -$1,386,800 -32.3% 0.0% -5.8%
LAVTA (Wheels) -$286,200 $0 -$286,200 -26.3% 0.0% -14.7%
Marin Transit -$605,700 $0 -$605,700 -32.3% 0.0% -5.8%
Vine (NCTPA) -$139,100 $0 -$139,100 -26.8% 0.0% -14.2%
Petaluma Transit -$36,300 $0 -$36,300 -25.2% 0.0% -16.7%
Rio Vista Delta Breeze -$2,900 $0 -$2,900 -25.2% 0.0% -14.5%
SamTrans -$2,556,700 $0 -$2,556,700 -26.4% 0.0% -14.9%
Santa Rosa CityBus -$438,900 $0 -$438,900 -25.2% 0.0% -19.7%
VTA -$6,500,400 $0 -$6,500,400 -26.5% 0.0% -17.3%
San Francisco MTA -$12,194,400 $0 -$12,194,400 -12.9% 0.0% -5.8%
SolTrans (Solano County Transit) -$626,600 $0 -$626,600 -26.8% 0.0% -18.7%
Sonoma County -$357,000 $0 -$357,000 -25.2% 0.0% -17.9%
Union City -$51,400 $0 -$51,400 -25.2% 0.0% -13.9%
Vacaville City Coach -$83,700 $0 -$83,700 -26.4% 0.0% -23.0%
West CAT -$182,400 $0 -$182,400 -32.3% 0.0% -9.9%
San Francisco Bay Ferry (WETA) -$155,000 $0 -$155,000 -29.5% 0.0% -1.2%
Total -$75,462,000 $0 -$75,462,000 -25.4% 0.0% -8.5%
Change in Fare Revenue, %Change in Fare Revenue, $

Regional Means-Based Transit Fare Pricing Study: Project Overview Final Report – DRAFT
DECEMBER 7, 2016 A-9
Scenario R1 - Eliminate Non-Mandated Discounts (Retain Only 50% Senior/Disabled Discount on Cash Fares During Off-Peak Periods): Change in Ridership
Low Income Non-Low Income Total Low Income Non-Low Income Total
AC Transit -2,502,200 -972,700 -3,474,900 -7.1% -4.8% -6.3%
ACE (Altamont Commuter Express) -1,700 -11,000 -12,800 -1.3% -1.2% -1.2%
BART -1,529,400 -1,037,400 -2,566,800 -4.2% -1.1% -1.9%
Caltrain -62,600 -129,500 -192,200 -3.3% -0.9% -1.1%
County Connection (CCCTA) -43,200 -40,900 -84,100 -2.6% -2.4% -2.5%
City of Dixon -900 -400 -1,300 -2.6% -2.3% -2.5%
ECCTA (Tridelta) -34,600 -38,500 -73,100 -2.7% -2.5% -2.6%
FAST (Fairfield and Suisun Transit) -33,200 -11,600 -44,800 -4.3% -3.9% -4.2%
Golden Gate (GGBHTD) -52,500 -57,900 -110,300 -4.1% -1.1% -1.7%
LAVTA (Wheels) -39,200 -28,100 -67,300 -4.2% -3.9% -4.1%
Marin Transit -22,900 -25,300 -48,200 -4.1% -1.1% -1.7%
Vine (NCTPA) -31,100 -25,100 -56,200 -7.4% -6.8% -7.1%
Petaluma Transit -13,900 -6,500 -20,400 -5.9% -5.3% -5.7%
Rio Vista Delta Breeze -800 -500 -1,300 -11.6% -9.8% -10.8%
SamTrans -261,200 -148,800 -410,000 -3.6% -2.7% -3.2%
Santa Rosa CityBus -84,500 -21,700 -106,300 -4.6% -4.2% -4.6%
VTA -567,400 -261,400 -828,800 -2.0% -1.7% -1.9%
San Francisco MTA -7,563,800 -4,611,400 -12,175,200 -7.0% -3.8% -5.3%
SolTrans (Solano County Transit) -63,300 -25,100 -88,400 -6.3% -5.8% -6.2%
Sonoma County -52,100 -19,400 -71,500 -5.6% -5.1% -5.4%
Union City -11,500 -8,500 -20,000 -5.2% -4.7% -5.0%
Vacaville City Coach -18,000 -2,400 -20,400 -4.0% -3.7% -4.0%
West CAT -7,300 -15,000 -22,300 -1.8% -1.6% -1.6%
San Francisco Bay Ferry (WETA) -1,400 -29,500 -30,900 -1.8% -1.6% -1.6%
Total -12,998,600 -7,528,900 -20,527,500 -5.7% -2.6% -3.9%
Change in Ridership, # Change in Ridership, %

Regional Means-Based Transit Fare Pricing Study: Project Overview Final Report – DRAFT
DECEMBER 7, 2016 A-10
Scenario R1 - Eliminate Non-Mandated Discounts (Retain Only 50% Senior/Disabled Discount on Cash Fares During Off-Peak Periods): Change in Fare Revenue
Low Income Non-Low Income Total Low Income Non-Low Income Total
AC Transit $4,662,200 $2,132,500 $6,794,700 12.9% 9.5% 11.6%
ACE (Altamont Commuter Express) $38,500 $291,000 $329,500 4.6% 4.8% 4.8%
BART $10,615,400 $8,442,100 $19,057,500 10.3% 2.7% 4.6%
Caltrain $638,300 $1,553,600 $2,191,900 8.6% 2.3% 2.9%
County Connection (CCCTA) $124,300 $135,300 $259,600 5.6% 5.8% 5.7%
City of Dixon $3,500 $1,800 $5,300 5.7% 5.8% 5.7%
ECCTA (Tridelta) $75,100 $96,100 $171,200 5.7% 6.0% 5.9%
FAST (Fairfield and Suisun Transit) $140,600 $56,400 $196,900 9.3% 9.7% 9.4%
Golden Gate (GGBHTD) $275,600 $343,700 $619,200 6.4% 1.7% 2.6%
LAVTA (Wheels) $100,500 $82,600 $183,100 9.2% 9.6% 9.4%
Marin Transit $120,400 $150,100 $270,500 6.4% 1.7% 2.6%
Vine (NCTPA) $88,500 $82,300 $170,800 17.0% 17.9% 17.4%
Petaluma Transit $18,800 $10,100 $28,900 13.1% 13.6% 13.3%
Rio Vista Delta Breeze $3,200 $2,500 $5,700 27.8% 29.1% 28.5%
SamTrans $552,500 $377,300 $929,700 5.7% 5.0% 5.4%
Santa Rosa CityBus $177,200 $52,300 $229,500 10.2% 10.7% 10.3%
VTA $747,200 $388,700 $1,135,900 3.0% 3.0% 3.0%
San Francisco MTA $11,401,600 $7,888,600 $19,290,300 12.1% 6.8% 9.1%
SolTrans (Solano County Transit) $334,100 $152,200 $486,300 14.3% 15.0% 14.5%
Sonoma County $175,600 $75,100 $250,700 12.4% 13.0% 12.6%
Union City $23,300 $20,000 $43,300 11.4% 12.0% 11.7%
Vacaville City Coach $27,700 $4,300 $32,000 8.7% 9.2% 8.8%
West CAT $20,700 $49,000 $69,700 3.7% 3.8% 3.8%
San Francisco Bay Ferry (WETA) $18,700 $468,000 $486,600 3.6% 3.7% 3.7%
Total $30,383,300 $22,855,500 $53,238,800 10.2% 3.8% 6.0%
Change in Fare Revenue, %Change in Fare Revenue, $

Regional Means-Based Transit Fare Pricing Study: Project Overview Final Report – DRAFT
DECEMBER 7, 2016 A-11
Scenario R2 - 10% Across-the-Board Fare Increase: Change in Ridership
Scenario R2 - 10% Across-the-Board Fare Increase: Change in Fare Revenue
Low Income Non-Low Income Total Low Income Non-Low Income Total
AC Transit -1,090,100 -571,100 -1,661,100 -3.1% -2.8% -3.0%
ACE (Altamont Commuter Express) -2,800 -17,900 -20,700 -2.2% -1.9% -1.9%
BART -785,000 -1,802,100 -2,587,100 -2.2% -1.9% -2.0%
Caltrain -40,600 -286,000 -326,500 -2.2% -1.9% -1.9%
County Connection (CCCTA) -50,900 -48,200 -99,200 -3.1% -2.8% -3.0%
City of Dixon -1,100 -500 -1,600 -3.2% -2.9% -3.1%
ECCTA (Tridelta) -39,500 -43,900 -83,400 -3.1% -2.8% -2.9%
FAST (Fairfield and Suisun Transit) -24,100 -8,400 -32,500 -3.1% -2.8% -3.0%
Golden Gate (GGBHTD) -39,900 -151,000 -190,900 -3.1% -2.8% -2.9%
LAVTA (Wheels) -28,600 -20,500 -49,100 -3.1% -2.8% -3.0%
Marin Transit -17,400 -65,900 -83,400 -3.1% -2.8% -2.9%
Vine (NCTPA) -13,000 -10,500 -23,400 -3.1% -2.8% -3.0%
Petaluma Transit -7,400 -3,400 -10,800 -3.1% -2.8% -3.0%
Rio Vista Delta Breeze -200 -100 -400 -2.9% -2.0% -3.3%
SamTrans -226,000 -154,400 -380,400 -3.1% -2.8% -3.0%
Santa Rosa CityBus -56,200 -14,400 -70,700 -3.1% -2.8% -3.0%
VTA -872,100 -428,100 -1,300,200 -3.1% -2.8% -3.0%
San Francisco MTA -3,332,000 -3,420,600 -6,752,600 -3.1% -2.8% -2.9%
SolTrans (Solano County Transit) -30,900 -12,200 -43,200 -3.1% -2.8% -3.0%
Sonoma County -28,900 -10,700 -39,700 -3.1% -2.8% -3.0%
Union City -6,800 -5,100 -11,900 -3.1% -2.8% -3.0%
Vacaville City Coach -13,800 -1,900 -15,600 -3.1% -2.9% -3.1%
West CAT -12,900 -26,500 -39,400 -3.1% -2.8% -2.9%
San Francisco Bay Ferry (WETA) -2,500 -53,600 -56,000 -3.2% -2.8% -2.8%
Total -6,722,700 -7,156,900 -13,879,600 -2.9% -2.5% -2.7%
Change in Ridership, # Change in Ridership, %

Regional Means-Based Transit Fare Pricing Study: Project Overview Final Report – DRAFT
DECEMBER 7, 2016 A-12
Low Income Non-Low Income Total Low Income Non-Low Income Total
AC Transit $2,383,300 $1,551,200 $3,934,500 6.6% 6.9% 6.7%
ACE (Altamont Commuter Express) $63,400 $479,700 $543,100 7.6% 7.9% 7.9%
BART $8,035,000 $25,156,200 $33,191,200 7.8% 8.1% 8.0%
Caltrain $567,600 $5,340,200 $5,907,800 7.6% 7.9% 7.9%
County Connection (CCCTA) $147,600 $160,800 $308,400 6.6% 6.9% 6.8%
City of Dixon $4,100 $2,100 $6,200 6.6% 6.8% 6.7%
ECCTA (Tridelta) $86,200 $110,300 $196,500 6.6% 6.9% 6.8%
FAST (Fairfield and Suisun Transit) $100,100 $40,100 $140,200 6.6% 6.9% 6.7%
Golden Gate (GGBHTD) $282,800 $1,361,800 $1,644,600 6.6% 6.9% 6.8%
LAVTA (Wheels) $71,900 $59,100 $131,000 6.6% 6.9% 6.7%
Marin Transit $123,900 $596,500 $720,400 6.6% 6.9% 6.8%
Vine (NCTPA) $34,300 $31,800 $66,000 6.6% 6.9% 6.7%
Petaluma Transit $9,500 $5,100 $14,600 6.6% 6.9% 6.7%
Rio Vista Delta Breeze $800 $600 $1,300 7.0% 7.0% 6.5%
SamTrans $638,900 $515,700 $1,154,600 6.6% 6.9% 6.7%
Santa Rosa CityBus $114,800 $33,900 $148,700 6.6% 6.9% 6.7%
VTA $1,616,600 $907,200 $2,523,800 6.6% 6.9% 6.7%
San Francisco MTA $6,226,700 $8,050,000 $14,276,700 6.6% 6.9% 6.8%
SolTrans (Solano County Transit) $154,400 $70,200 $224,600 6.6% 6.9% 6.7%
Sonoma County $93,400 $39,900 $133,300 6.6% 6.9% 6.7%
Union City $13,500 $11,500 $25,000 6.6% 6.9% 6.7%
Vacaville City Coach $20,900 $3,200 $24,200 6.6% 6.8% 6.6%
West CAT $37,300 $88,300 $125,600 6.6% 6.9% 6.8%
San Francisco Bay Ferry (WETA) $34,600 $869,100 $903,700 6.6% 6.9% 6.9%
Total $20,861,600 $45,484,400 $66,346,000 7.0% 7.6% 7.4%
Change in Fare Revenue, %Change in Fare Revenue, $

Regional Means-Based Transit Fare Pricing Study: Project Overview Final Report – DRAFT
DECEMBER 7, 2016 A-13
Appendix C: Impacts on Farebox Recovery
NOTE: Operating costs for Golden Gate and Marin Transit are currently available only as a combined total for both agencies, so it has not been possible to calculate separate farebox recovery ratios for those two agencies.
Current A1 A2 A3 R1 R2
AC Transit 18.8% 15.9% 16.1% 15.7% 21.0% 20.1%
ACE (Altamont Commuter Express) 45.2% 43.2% 44.0% 43.7% 47.4% 48.8%
BART 73.1% 66.4% 68.3% 66.7% 76.5% 79.0%
Caltrain 62.7% 60.7% 61.0% 60.8% 64.5% 67.6%
County Connection (CCCTA) 16.5% 14.0% 14.8% 14.4% 17.4% 17.6%
City of Dixon 15.6% 12.4% 13.6% 13.0% 16.5% 16.7%
ECCTA (Tridelta) 18.4% 15.6% 16.7% 16.2% 19.5% 19.7%
FAST (Fairfield and Suisun Transit) 24.8% 18.2% 20.7% 20.0% 27.2% 26.5%
Golden Gate (GGBHTD) / Marin Transit 23.1% 21.8% 22.1% 21.8% 23.7% 24.7%
LAVTA (Wheels) 13.8% 11.2% 12.1% 11.8% 15.1% 14.7%
Vine (NCTPA) 14.6% 11.8% 12.9% 12.5% 17.1% 15.6%
Petaluma Transit 16.4% 12.9% 14.3% 13.7% 18.6% 17.5%
Rio Vista Delta Breeze 5.6% 4.6% 4.9% 4.8% 7.1% 5.9%
SamTrans 16.8% 13.9% 14.6% 14.3% 17.7% 17.9%
Santa Rosa CityBus 21.5% 16.0% 18.3% 17.3% 23.7% 22.9%
VTA 11.8% 9.4% 10.1% 9.8% 12.2% 12.6%
San Francisco MTA 30.4% 28.5% 28.4% 28.6% 33.1% 32.4%
SolTrans (Solano County Transit) 34.6% 26.5% 29.2% 28.2% 39.6% 36.9%
Sonoma County 17.2% 13.3% 14.9% 14.2% 19.4% 18.4%
Union City 11.3% 9.1% 10.1% 9.8% 12.7% 12.1%
Vacaville City Coach 20.3% 14.0% 16.2% 15.6% 22.1% 21.7%
West CAT 23.8% 21.1% 21.9% 21.5% 24.7% 25.5%
San Francisco Bay Ferry (WETA) 50.7% 50.0% 50.2% 50.1% 52.6% 54.2%
Total 37.5% 34.1% 34.8% 34.3% 39.7% 40.3%
Farebox Recovery

Item 6
Next Steps and Project Schedule
Project Schedule
Below is the schedule of past and anticipated future activities for the study.
Activity Timeframe
Study Kickoff March 2015
Information Gathering Session with Social Service Agencies and
Nonprofit Organizations that serve Low-Income Persons April 2015
TAC Meeting #1: Existing Conditions & Implications for
Developing Scenarios May 2015
TAC Meeting #2: Review Draft Alternative Scenarios and Seek
Feedback August 2015
Focus Groups with Low Income Residents (Existing and Potential
Transit Riders) September 2015
Final Selection of Five Scenarios December 2015
Quantitative and Qualitative Evaluation of Five Scenarios Early 2016
TAC Meeting #3: Review Scenario Evaluation Results August 2016
Complete Alternatives Analysis and Draft Report November 2016
TAC Meeting #4: Review Alternatives Analysis and Draft Report December 2016
Present Draft Report to Commission (or Committee) February 2017
Final Report March 2017
Next Steps: Stakeholder Input and Commission or Committee Presentation
Following finalization of the alternatives analysis task, the consultant will compile the study
tasks into a final draft report for review interested stakeholders, including the Partnership Transit
Finance Working Group, MTC’s Policy Advisory Council, and others. MTC staff anticipates the
draft report and stakeholder feedback will be presented to MTC for input by the Commission or
Committee in February 2017, followed by a final report summarizing and incorporating feedback
received.