MBMC Copyright c 2007 by The McGraw-Hill Companies, Inc. All rights reserved. Sept. 23-Oct. 4...
72
MB MC Copyright c 2007 by The McGraw-Hill Companies, Inc. All rights reserved. Sept. 23-Oct. 4 Essential Question- What is Supply and Demand? Learning Goal- To compare/contrast supply and demand. SCALE: 4- To compare/contrast supply and demand, and analyze how that affects personal finance. 3- To compare/contrast supply and demand. 2- To define supply and demand. 1- No Understanding. Slide 1
-
Upload
juliet-cooper -
Category
Documents
-
view
213 -
download
0
Transcript of MBMC Copyright c 2007 by The McGraw-Hill Companies, Inc. All rights reserved. Sept. 23-Oct. 4...
MB MC
Copyright c 2007 by The McGraw-HillCompanies, Inc. All rights reserved.
Sept. 23-Oct. 4
Essential Question- What is Supply and Demand?
Learning Goal- To compare/contrast supply and demand.SCALE:
4- To compare/contrast supply and demand, and analyze how that affects personal finance.
3- To compare/contrast supply and demand.
2- To define supply and demand.
1- No Understanding.
Slide 1

MB MC
Copyright c 2007 by The McGraw-HillCompanies, Inc. All rights reserved.
AN INTRO TO SUPPLY AND DEMAND- SEPT. 23
ENGLISH AUCTION: HOW TO APPLY ECONOMICS
I will be selling an announced number of M&M packets through an English auction to derive a classroom demand curve. In the same lecture I will give each student a packet of M&Ms and buys back an announced number of packets through a reverse English auction to derive a classroom supply curve.
Slide 2
MB MC
Copyright c 2007 by The McGraw-HillCompanies, Inc. All rights reserved.
AUCTION: DEMAND
I am now going to run a classroom auction. Please listen carefully as I read the instructions for this auction. I am passing out blank index cards and you should each take ONE card. You should not write anything on this card until told to do so.
I (the teacher) will be auctioning off to the highest bidders "fun size" M&M packets (1.69 oz), which you can see here in my hand. I will sell up to three packets. You can each purchase a maximum of one packet. Prior to participating in the auction, think about the maximum price at which you would be willing to buy an M&M packet. You will be required to pay in U.S. currency, so please do not bid values above $0 if you are not prepared to pay.
Slide 3

MB MC
Copyright c 2007 by The McGraw-HillCompanies, Inc. All rights reserved.
Demand
The auction begins with every student standing, so please stand up now. I am writing on the board the starting price for the auction, which will be $0. I will then begin to increase the price. By remaining standing, you are indicating that you would be willing to buy a packet of M&Ms at the price most recently announced. If at any point in the auction, the announced price rises above the maximum price at which you are willing to buy a packet, you should sit down.
When you sit down, please write on your index card the price that came before the announced price that caused you to sit down. In other words, write down the price that was either equal to or less than the maximum price that you were willing to pay for the M&M packet. You do not write anything else on the card.
Slide 4

MB MC
Copyright c 2007 by The McGraw-HillCompanies, Inc. All rights reserved.
Demand
The price will rise until three or fewer students remain standing. At this point the price stops rising and all bidders still standing will pay this price in exchange for a packet of M&Ms. I ask that these winning bidders estimate the maximum amount that they were willing to pay for the M&M packet, if the price had continued rising, and write it down on their index cards.
We will then graph the results: DATA ENTRY WEBSITE
http://www.econport.org/content/teaching/modules/DemandSupply/DemandExp.html
Slide 5
MB MC
Copyright c 2007 by The McGraw-HillCompanies, Inc. All rights reserved.
AUCTION: SUPPLY
I am now going to run another classroom auction that is similar to the previous one we ran with the exception that instead of selling M&M packets through the auction, I will be buying M&M packets. Please listen carefully as I read the instructions for this auction. I am passing out blank index cards and you should each take ONE card. You should not write anything on this card until told to do so. I am also passing around "fun size" M&M packets (1.69 oz). You should each take just ONE packet. Please do not take any more than one packet.
I (the teacher) will be purchasing up to three M&M packets from students in the classroom. You can sell a maximum of one packet each. Prior to participating in the auction, think about the minimum price at which you would be willing to sell your M&M packet to me
Slide 6
MB MC
Copyright c 2007 by The McGraw-HillCompanies, Inc. All rights reserved.
SUPPLY
The auction begins with every student standing, so please stand up now. I am writing on the board the starting price for the auction, which will be $3. I will then begin to decrease the price. By remaining standing, you are indicating that you would be willing to sell your packet of M&Ms at the price most recently announced. If at any point in the auction, the announced price drops below the minimum price at which you are willing to sell a packet, you should sit down.
When you sit down, please write on your index card the price that came before the announced price that caused you to sit down. In other words, write down the price that was either equal to or greater than the minimum price that you were willing to accept for giving up your M&M packet. You do not write anything else on the card.
Slide 7
MB MC
Copyright c 2007 by The McGraw-HillCompanies, Inc. All rights reserved.
SUPPLY
The price will decline until three or fewer students remain standing. At this point the price stops declining and all bidders still standing will receive this price in exchange for a packet of M&Ms. We ask that these winning bidders estimate the minimum amount that they were willing to accept for giving up their M&M packet, if the price had continued declining, and write it down on their index cards.
MARKET ANALYSIS: DATA ENTRY-
Slide 8
MB MC
Copyright c 2007 by The McGraw-HillCompanies, Inc. All rights reserved.
Slide 9
Supply and Demand: BELLWORK- Sept. 24
How do consumers get the goods and services they want in the right quantities and qualities?
MB MC
Copyright c 2007 by The McGraw-HillCompanies, Inc. All rights reserved.
BELLWORK- ANSWER
Some goods and services are allocated by the market forces of supply and demand
Slide 10
MB MC
Copyright c 2007 by The McGraw-HillCompanies, Inc. All rights reserved.
Slide 11
Supply and Demand: An Introduction
Why do some goods and services have shortages or surpluses and others do not?Some good and supplies services are
regulated by government

MB MC
Copyright c 2007 by The McGraw-HillCompanies, Inc. All rights reserved.
Slide 12
What, How, and For Whom?
Three Problems All Economic Systems Must AddressWhat should be produced?How should it be produced?For whom will it be produced?
MB MC
Copyright c 2007 by The McGraw-HillCompanies, Inc. All rights reserved.
Slide 13
What, How, and For Whom?
Free-Market or Capitalist Economic SystemIndividual choices determine:
Which careers to pursueWhich products to produce or buyWhen to start and shut-down a businessWho gets what is decided by individual
preferences and purchasing power

MB MC
Copyright c 2007 by The McGraw-HillCompanies, Inc. All rights reserved.
READING DAY
Students will read Freakonomics during the rest of their class in preparation to address Question 2 in their Freakonomics Paper.
Slide 14

MB MC
Copyright c 2007 by The McGraw-HillCompanies, Inc. All rights reserved.
Bellwork- Sept. 25
Define a Capitalistic Economy
Slide 15
MB MC
Copyright c 2007 by The McGraw-HillCompanies, Inc. All rights reserved.
Slide 16
Buyers and Sellers In Markets
MarketConsists of all buyers and sellers of a good
or service What do you think?
What determines the price of pizza, gasoline, a car wash, or other goods and services?
MB MC
Copyright c 2007 by The McGraw-HillCompanies, Inc. All rights reserved.
Slide 17
Buyers and Sellers In Markets
The Demand CurveA schedule or graph that tells us the
quantity of a good that buyers wish to buy at each price
MB MC
Copyright c 2007 by The McGraw-HillCompanies, Inc. All rights reserved.
Slide 18
Buyers and Sellers In Markets
A Property of DemandAs price of a good or service goes down
the quantity consumers wish to buy will increase
Therefore, the demand curve is downward-sloping

MB MC
Copyright c 2007 by The McGraw-HillCompanies, Inc. All rights reserved.
Slide 19
The Daily DemandCurve for Pizza in Chicago
Price($ per slice)
Quantity(1000s of slices per day)
4
8
2
16
3
12
Demand
MB MC
Copyright c 2007 by The McGraw-HillCompanies, Inc. All rights reserved.
DEMAND ACTIVITY
http://www.bized.co.uk/learn/economics/markets/mechanism/interactive/part1.htm
Slide 20

MB MC
Copyright c 2007 by The McGraw-HillCompanies, Inc. All rights reserved.
SEPT. 26th- Bellwork
Define Demand- what is it?
Slide 21
MB MC
Copyright c 2007 by The McGraw-HillCompanies, Inc. All rights reserved.
Slide 22
Buyers and Sellers In Markets
The Demand CurveWhy do buyers purchase a greater quantity
at lower prices and vice-versa?The substitution effectThe income effect
MB MC
Copyright c 2007 by The McGraw-HillCompanies, Inc. All rights reserved.
Slide 23
Buyers and Sellers In Markets
The Substitution EffectThe change in the quantity demanded of a
good that results because buyers switch to substitutes when the price of the good changes
MB MC
Copyright c 2007 by The McGraw-HillCompanies, Inc. All rights reserved.
Slide 24
Buyers and Sellers In Markets
The Income EffectThe change in the quantity demanded of a
good that results because a change in the price of a good changes the buyer’s purchasing power
MB MC
Copyright c 2007 by The McGraw-HillCompanies, Inc. All rights reserved.
Slide 25
Buyers and Sellers In Markets
The Cost-Benefit PrincipleThe reservation price is the benefit the buyer
receives from the goodThe cost of the good is its market priceIf the reservation price (benefit) exceeds the
market price (cost) the consumer will purchase the good
At higher prices, benefit will exceed cost for a smaller quantity than at lower prices
MB MC
Copyright c 2007 by The McGraw-HillCompanies, Inc. All rights reserved.
Slide 26
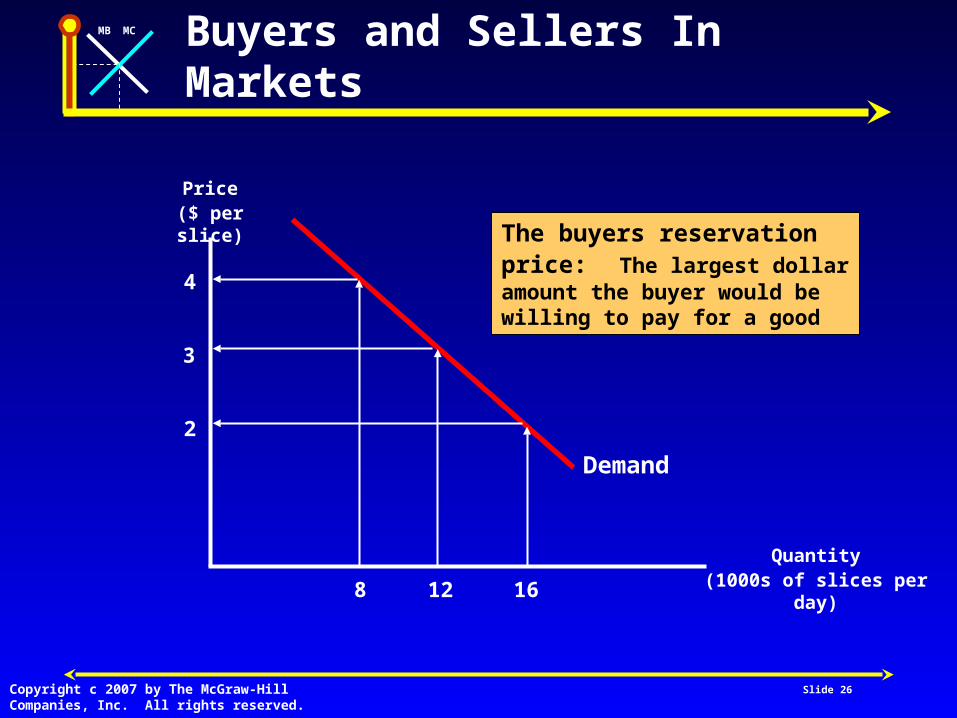
Buyers and Sellers In Markets
Price($ per slice)
Quantity(1000s of slices per day)
Demand
8 12 16
The buyers reservation price: The largest dollar amount the buyer would be willing to pay for a good
4
2
3

MB MC
Copyright c 2007 by The McGraw-HillCompanies, Inc. All rights reserved.
Slide 27
Buyers and Sellers In Markets
Horizontal Interpretation
Price determines quantity demanded
Price($ per slice)
4
2
3
8 12 16
Demand

MB MC
Copyright c 2007 by The McGraw-HillCompanies, Inc. All rights reserved.
Slide 28
Buyers and Sellers In Markets
Vertical Interpretation
Quantity measures the marginal buyer’s reservation price
Price($ per slice)
4
2
3
8 12 16
Demand

MB MC
Copyright c 2007 by The McGraw-HillCompanies, Inc. All rights reserved.
What do people want to wear?-Demand Activity
http://www.econedlink.org/lessons/index.php?lid=458&type=student
Slide 29
MB MC
Copyright c 2007 by The McGraw-HillCompanies, Inc. All rights reserved.
Bellwork- 9/27
Why do businesses look to the consumer to determine the supply?
Slide 30
MB MC
Copyright c 2007 by The McGraw-HillCompanies, Inc. All rights reserved.
An Intro to Supply and Demand
The Toy Market- Supply and Demand
Slide 31

MB MC
Copyright c 2007 by The McGraw-HillCompanies, Inc. All rights reserved.
Bellwork- Sept. 30th
How many hours do you spend studying every night?
Slide 32
MB MC
Copyright c 2007 by The McGraw-HillCompanies, Inc. All rights reserved.
How many hours would you study if you were paid $1 an hour?
$10 an hour? If you would study more at a higher
price, you are following the Law of Supply.
Slide 33
MB MC
Copyright c 2007 by The McGraw-HillCompanies, Inc. All rights reserved.
Slide 34
Buyers and Sellers In Markets
The Supply CurveA curve or schedule showing the quantity
of a good that sellers wish to sell at each price

MB MC
Copyright c 2007 by The McGraw-HillCompanies, Inc. All rights reserved.
Slide 35
Buyers and Sellers In Markets
QuestionWill the opportunity cost of producing
additional units of pizza increase or decrease?
MB MC
Copyright c 2007 by The McGraw-HillCompanies, Inc. All rights reserved.
Slide 36
Buyers and Sellers In Markets
The Supply CurveSellers must receive a higher price to
produce additional units of product to cover the higher opportunity costs of each additional unit
MB MC
Copyright c 2007 by The McGraw-HillCompanies, Inc. All rights reserved.
Slide 37
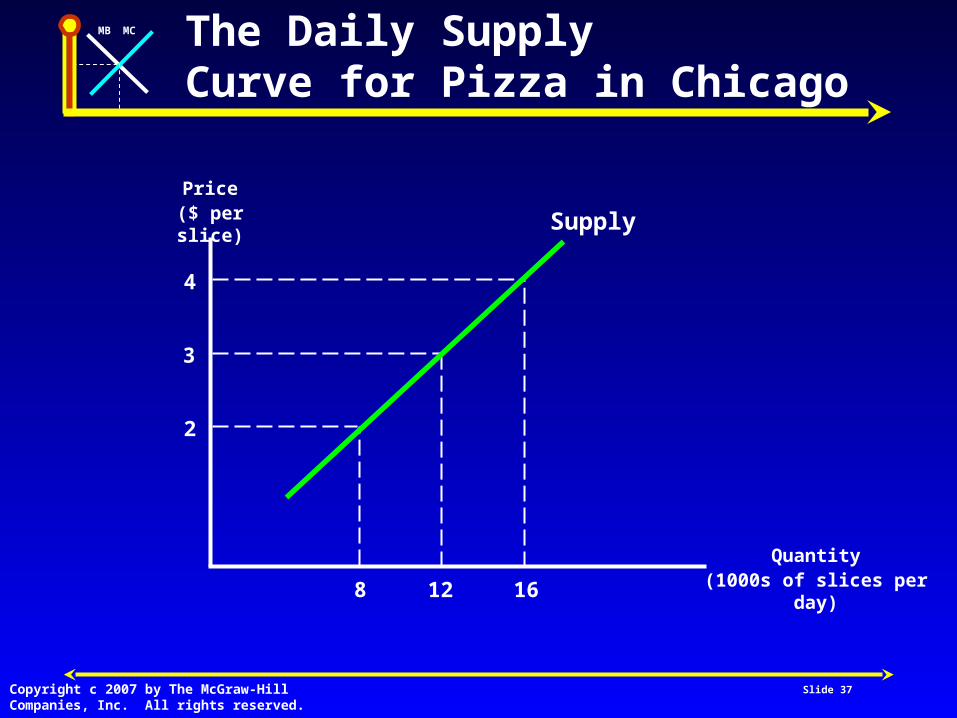
The Daily SupplyCurve for Pizza in Chicago
Price($ per slice)
Quantity(1000s of slices per day)
4
2
3
8 12 16
Supply
MB MC
Copyright c 2007 by The McGraw-HillCompanies, Inc. All rights reserved.
Slide 38
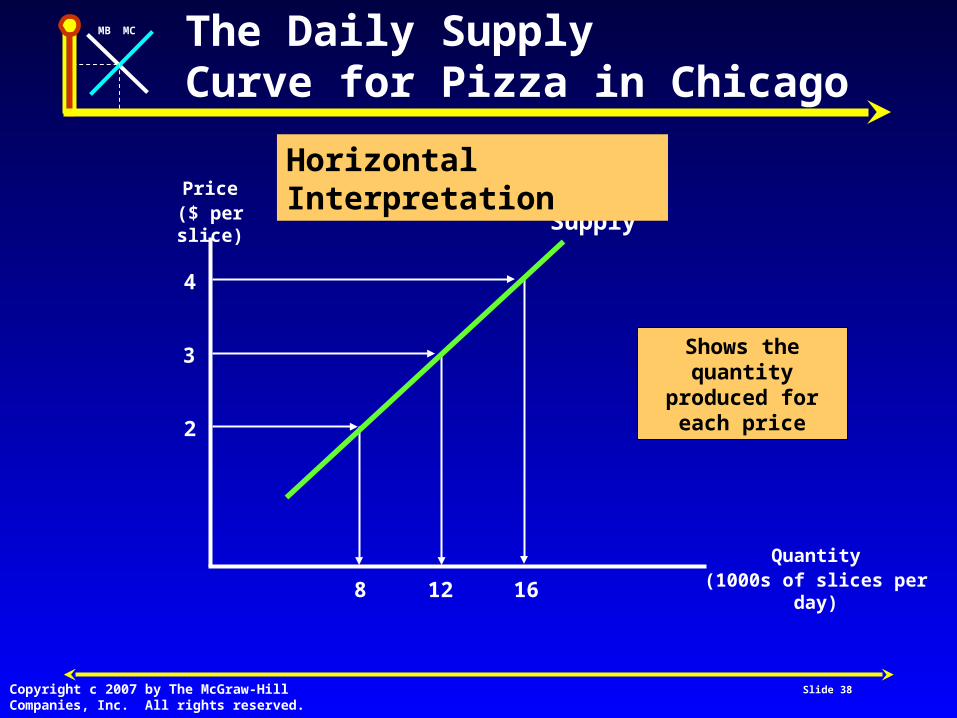
The Daily SupplyCurve for Pizza in Chicago
Price($ per slice)
Quantity(1000s of slices per day)
4
2
3
8 12 16
Supply
Horizontal Interpretation
Shows the quantity produced
for each price
MB MC
Copyright c 2007 by The McGraw-HillCompanies, Inc. All rights reserved.
Slide 39
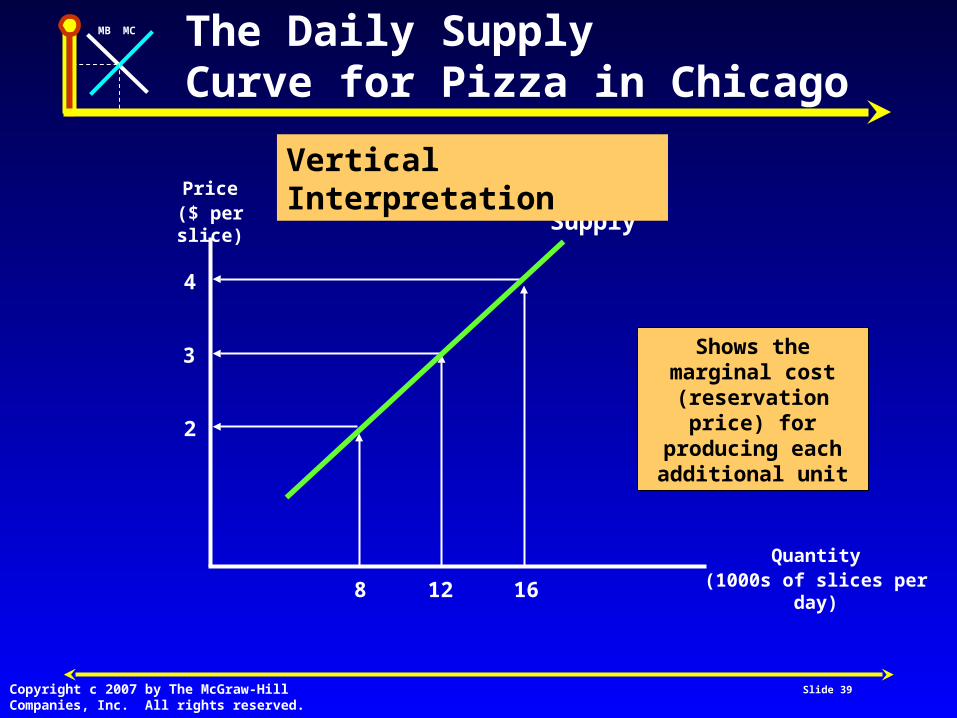
The Daily SupplyCurve for Pizza in Chicago
Price($ per slice)
Quantity(1000s of slices per day)
4
2
3
8 12 16
Supply
Vertical Interpretation
Shows the marginal cost (reservation
price) for producing each additional unit
MB MC
Copyright c 2007 by The McGraw-HillCompanies, Inc. All rights reserved.
Slide 40
Seller’s Reservation PriceThe smallest dollar amount for which a
seller would be willing to sell an additional unit, generally equal to marginal cost
The Daily SupplyCurve for Pizza in Chicago
MB MC
Copyright c 2007 by The McGraw-HillCompanies, Inc. All rights reserved.
Thus, the Law of Supply states that the quantity supplied varies directly with its price.
In other words, if prices are high, suppliers will offer greater quantities for sale.
If prices are low, they will offer smaller quantities for sale.
Slide 41
MB MC
Copyright c 2007 by The McGraw-HillCompanies, Inc. All rights reserved.
video
http://www.econedlink.org/interactives/index.php?iid=221&type=student
Slide 42
MB MC
Copyright c 2007 by The McGraw-HillCompanies, Inc. All rights reserved.
Bellwork-Oct. 1
Define Supply, why do demand and supply go hand-in-hand?
Slide 43

MB MC
Copyright c 2007 by The McGraw-HillCompanies, Inc. All rights reserved.
Students will read article, to prepare them for the day’s activity.
http://www.econedlink.org/interactives/index.php?iid=221&type=student
Slide 44
MB MC
Copyright c 2007 by The McGraw-HillCompanies, Inc. All rights reserved.
Slide 45
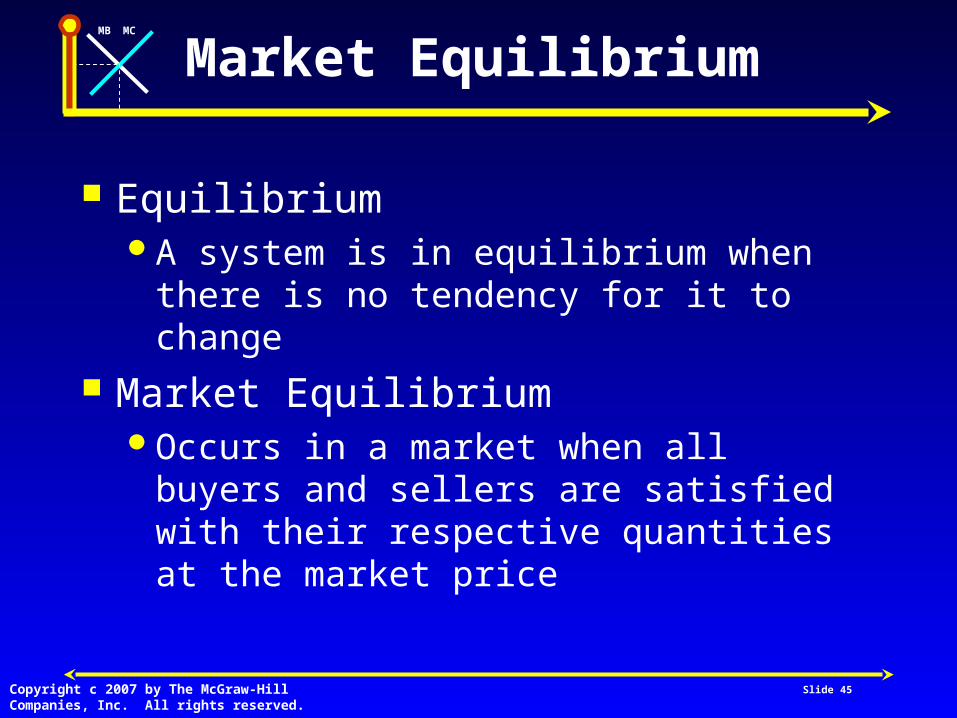
Market Equilibrium
EquilibriumA system is in equilibrium when there is no
tendency for it to change Market Equilibrium
Occurs in a market when all buyers and sellers are satisfied with their respective quantities at the market price
MB MC
Copyright c 2007 by The McGraw-HillCompanies, Inc. All rights reserved.
Slide 46
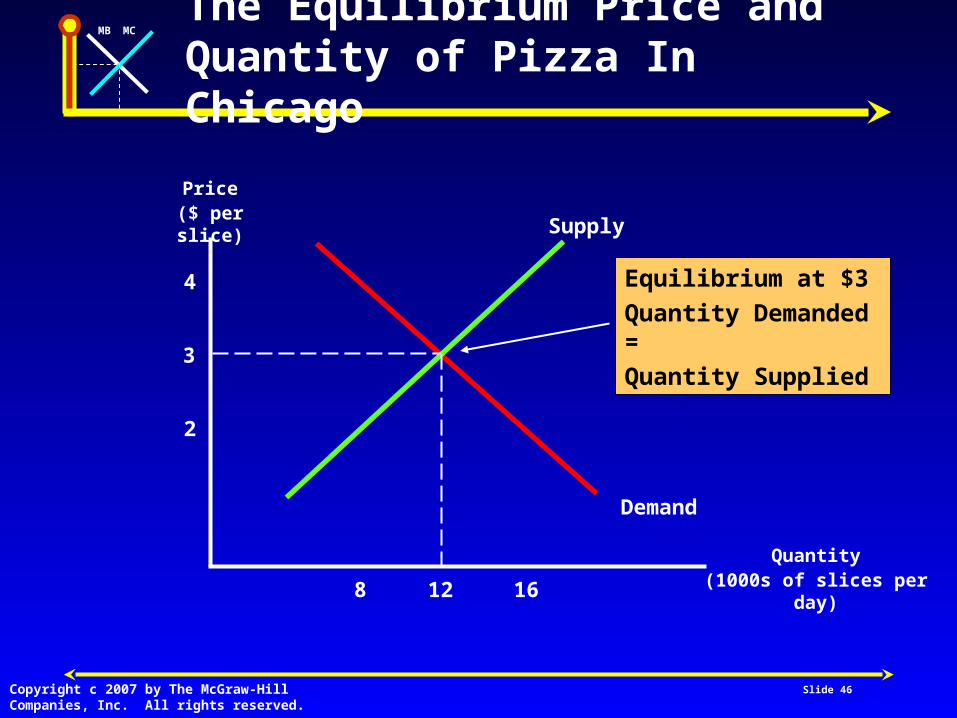
The Equilibrium Price and Quantity of Pizza In Chicago
Price($ per slice)
Quantity(1000s of slices per day)
4
2
3
8 12 16
Supply
Demand
Equilibrium at $3
Quantity Demanded =
Quantity Supplied
MB MC
Copyright c 2007 by The McGraw-HillCompanies, Inc. All rights reserved.
Slide 47
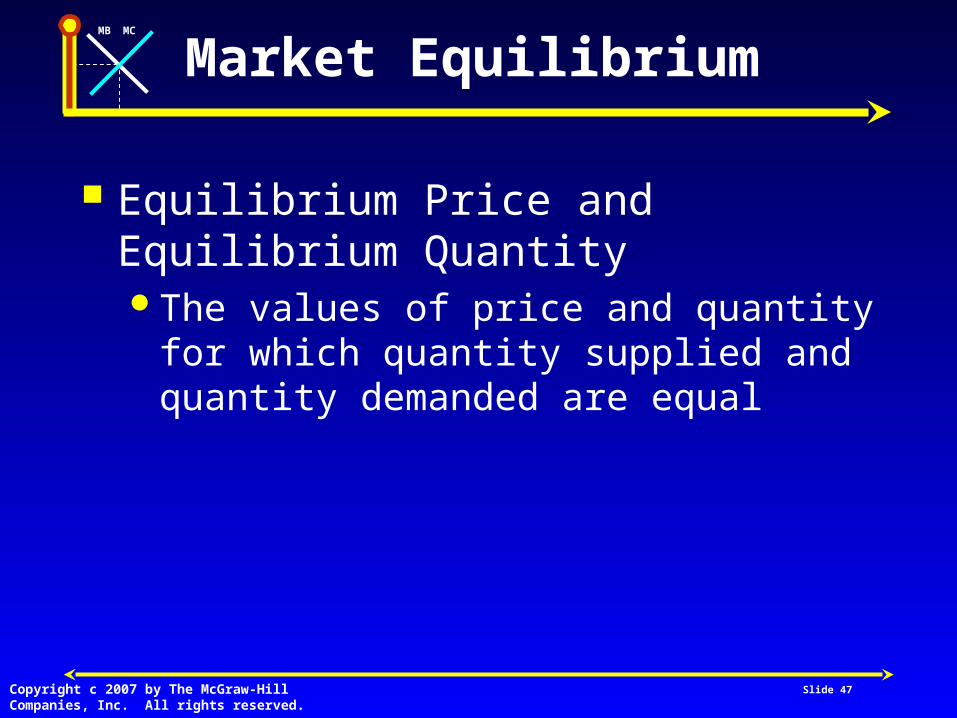
Market Equilibrium
Equilibrium Price and Equilibrium QuantityThe values of price and quantity for which
quantity supplied and quantity demanded are equal

MB MC
Copyright c 2007 by The McGraw-HillCompanies, Inc. All rights reserved.
Slide 48
What Do You Think?Would buyers prefer a lower price than the
equilibrium price?Would sellers prefer a higher price than the
equilibrium price?
Market Equilibrium
MB MC
Copyright c 2007 by The McGraw-HillCompanies, Inc. All rights reserved.
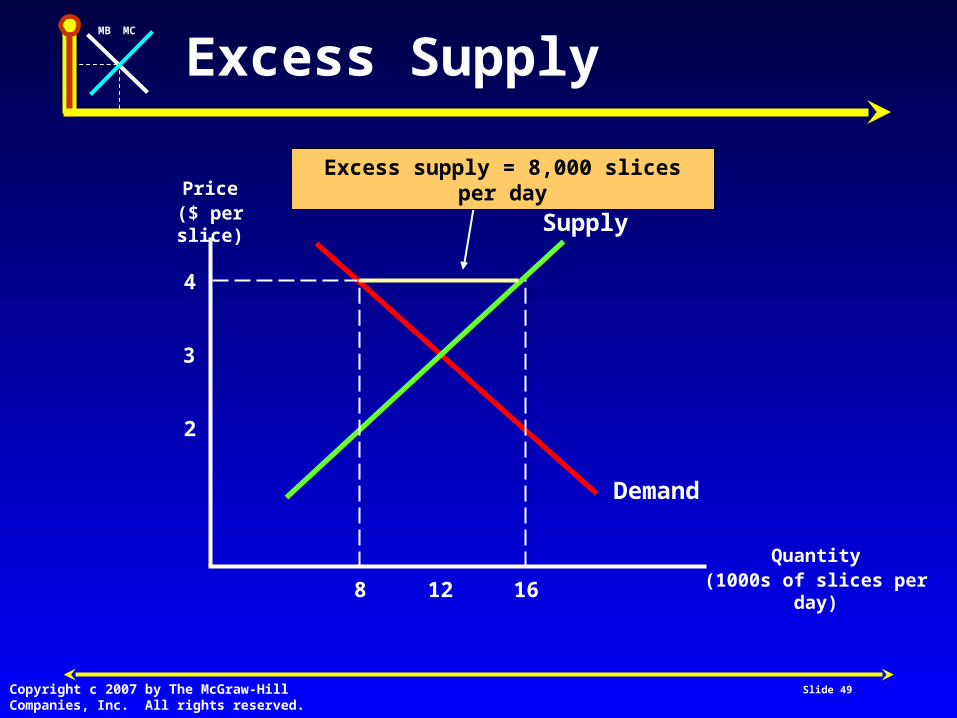
Slide 49
Excess Supply
Price($ per slice)
Quantity(1000s of slices per day)
4
2
3
8 12 16
Supply
Demand
Excess supply = 8,000 slices per day

MB MC
Copyright c 2007 by The McGraw-HillCompanies, Inc. All rights reserved.
Slide 50
Excess Demand
Price($ per slice)
Quantity(1000s of slices per day)
4
2
3
8 16
Excess demand = 8,000slices per day
Supply
Demand
MB MC
Copyright c 2007 by The McGraw-HillCompanies, Inc. All rights reserved.
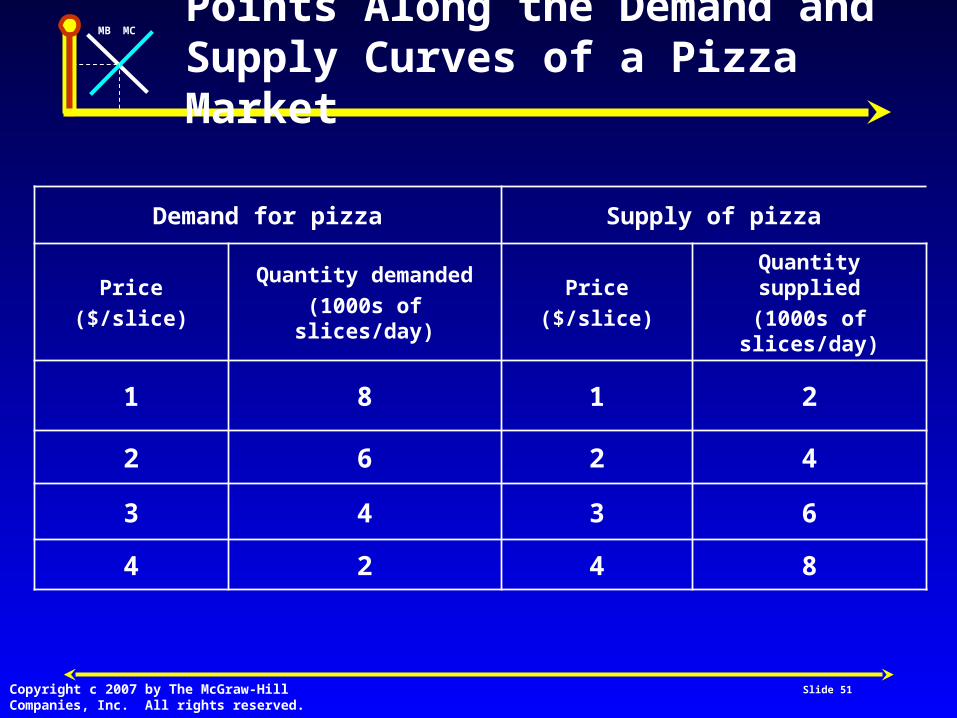
Slide 51
Points Along the Demand and Supply Curves of a Pizza Market
Demand for pizza Supply of pizza
Price
($/slice)
Quantity demanded
(1000s of slices/day)
Price
($/slice)
Quantity supplied
(1000s of slices/day)
1 8 1 2
2 6 2 4
3 4 3 6
4 2 4 8

MB MC
Copyright c 2007 by The McGraw-HillCompanies, Inc. All rights reserved.
Slide 52
Graphing Supply and Demand and Finding the Equilibrium Price and Quantity
Price($per slice)
Quantity(1000s of slices per day)
5
2
3
4
1
4
102
Demand
0 6 8
Supply
2.50
5
The Equilibrium Price = $2.50The Equilibrium Quantity = 5
MB MC
Copyright c 2007 by The McGraw-HillCompanies, Inc. All rights reserved.
Activity
Students will complete worksheet. This is your Exit Slip for today’s class.
http://www.econedlink.org/lessons/docs_lessons/747_ChangingYourPrice15.pdf
Slide 53

MB MC
Copyright c 2007 by The McGraw-HillCompanies, Inc. All rights reserved.
Slide 54
What Do You Think?Is the market equilibrium always an ideal
outcome for all market participants?
Bellwork- Oct. 2

MB MC
Copyright c 2007 by The McGraw-HillCompanies, Inc. All rights reserved.
READING DAY- Oct. 2
Students will read Freakonomics in preparation for their next paper due date.
Slide 55

MB MC
Copyright c 2007 by The McGraw-HillCompanies, Inc. All rights reserved.
Bellwork: Oct. 3
Why do prices always change on gas? (hint: think current events)
Slide 56
MB MC
Copyright c 2007 by The McGraw-HillCompanies, Inc. All rights reserved.
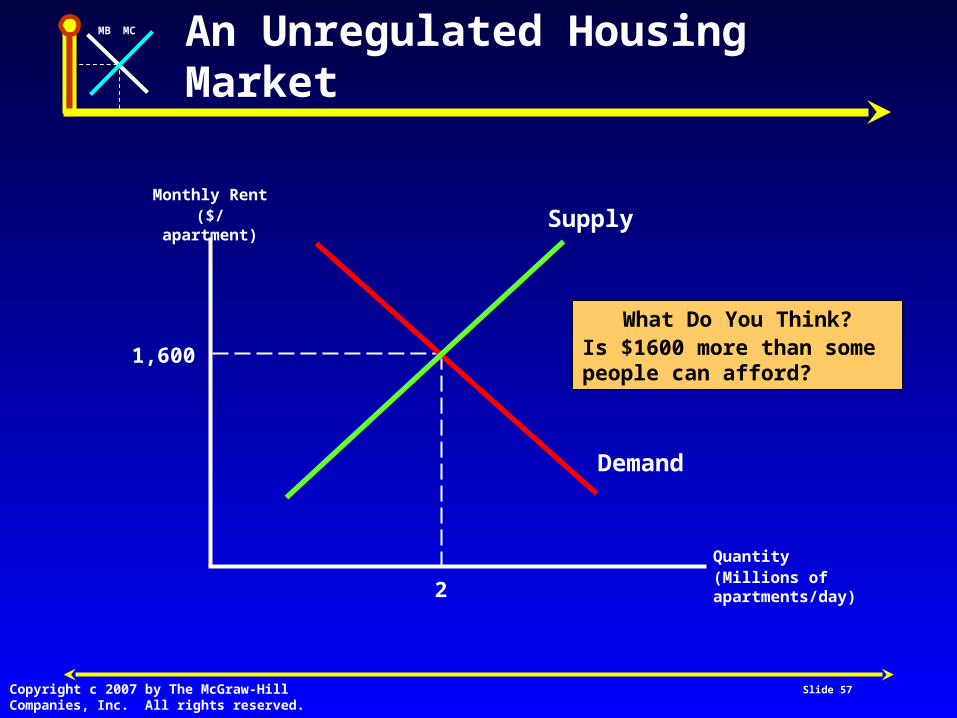
Slide 57
An Unregulated Housing Market
Monthly Rent($/apartment)
Quantity(Millions of apartments/day)
1,600
2
Supply
Demand
What Do You Think?Is $1600 more than some people can afford?
MB MC
Copyright c 2007 by The McGraw-HillCompanies, Inc. All rights reserved.
Slide 58
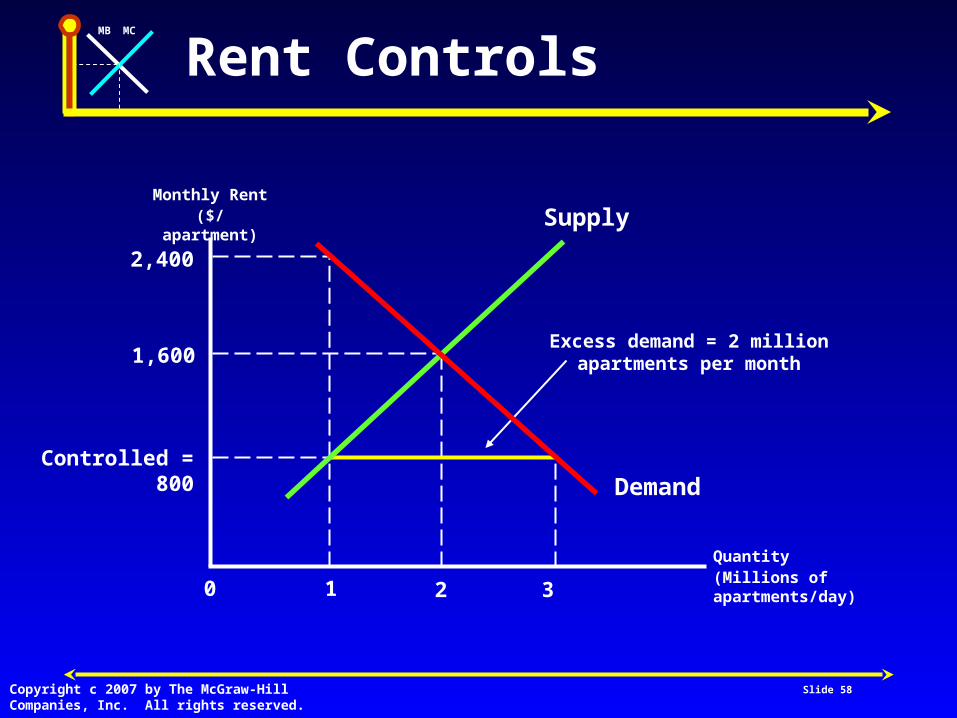
Rent Controls
Monthly Rent($/apartment)
Quantity(Millions of apartments/day)
1,600
2
Supply
Demand
2,400
Controlled = 800
1 30
Excess demand = 2 million apartments per month
MB MC
Copyright c 2007 by The McGraw-HillCompanies, Inc. All rights reserved.
Slide 59
Market Equilibrium
Rent Controls ReconsideredOther consequences of rent controls
Maintenance will decline and housing quality will fall
Illegal paymentsCreation of co-ops and conversion to
condominiumsReduction in household mobilityDiscrimination
MB MC
Copyright c 2007 by The McGraw-HillCompanies, Inc. All rights reserved.
Slide 60
Market Equilibrium
What do you think?How can we make housing affordable for
poor people without using rent ceilings?
MB MC
Copyright c 2007 by The McGraw-HillCompanies, Inc. All rights reserved.
Slide 61
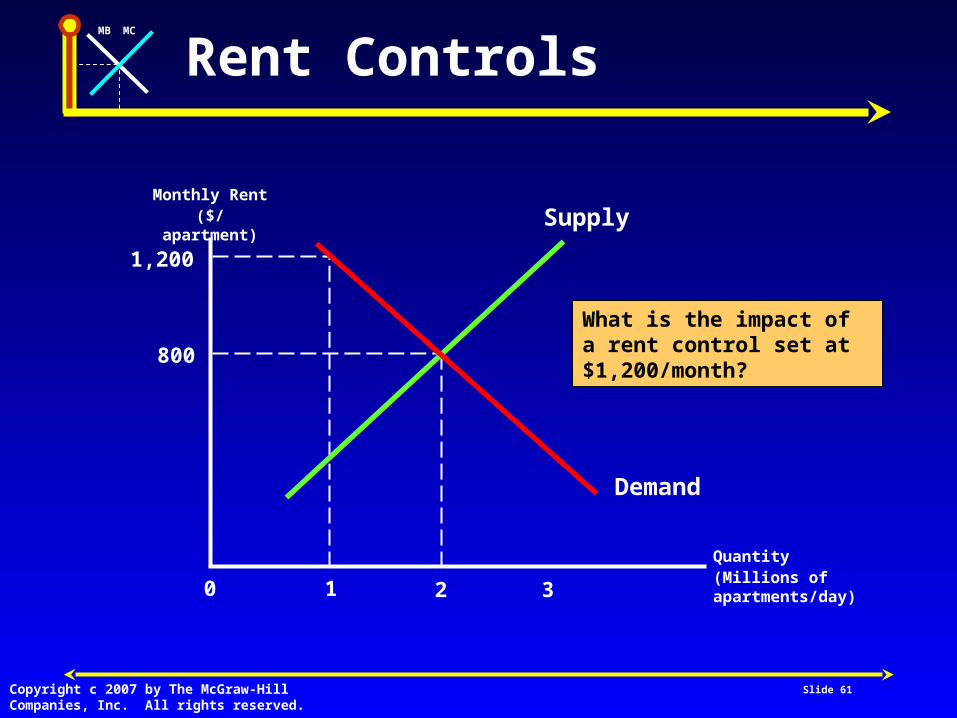
Rent Controls
Monthly Rent($/apartment)
Quantity(Millions of apartments/day)
800
2
Supply
Demand
1,200
1 30
What is the impact of a rent control set at $1,200/month?
MB MC
Copyright c 2007 by The McGraw-HillCompanies, Inc. All rights reserved.
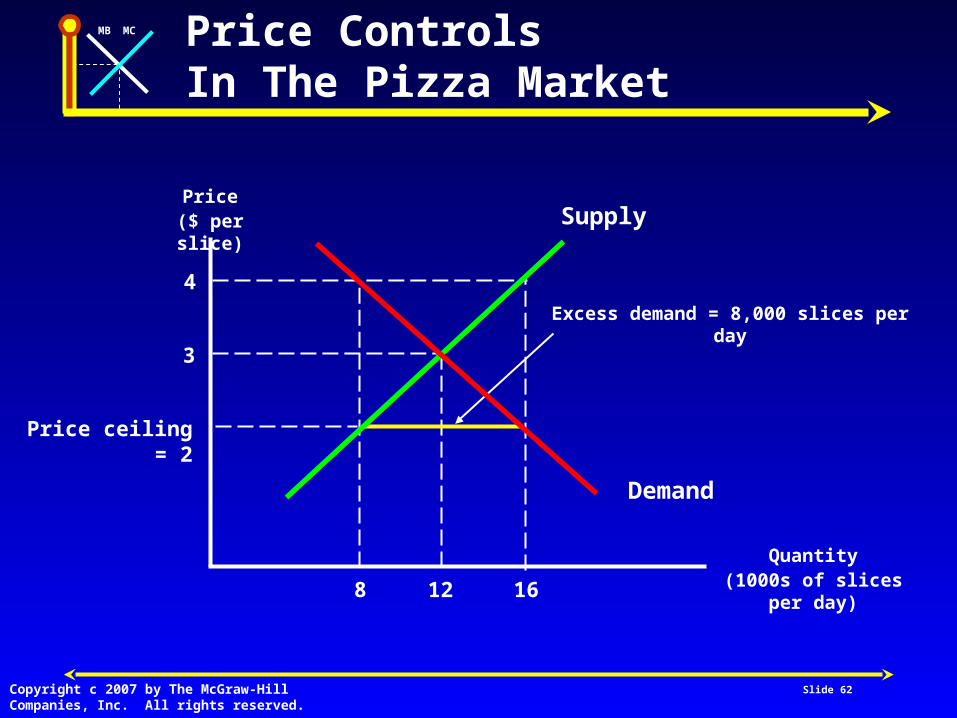
Slide 62
Price Controls In The Pizza Market
Price($ per slice)
Quantity(1000s of slices per day)
Supply
Demand
Excess demand = 8,000 slices per day
4
Price ceiling = 2
3
8 12 16

MB MC
Copyright c 2007 by The McGraw-HillCompanies, Inc. All rights reserved.
Slide 63
Market Equilibrium
Pizza Price Controls?Market responses to a pizza price ceiling
Long linesPreferential treatment to selected customersAlternative pricing strategiesPoorer quality ingredientsBlack-market pizzas
MB MC
Copyright c 2007 by The McGraw-HillCompanies, Inc. All rights reserved.
Reading
http://web.archive.org/web/20071109111737/http://www.cnn.com/US/9706/15/rent.control/
Slide 64
MB MC
Copyright c 2007 by The McGraw-HillCompanies, Inc. All rights reserved.
Price Ceiling Questions
1. Make a list of who wins and who loses under rent control.
2. What happens to all of the dissatisfied apartment-seekers? Make a list of alternative rationing devices.
3. How do rent controls affect the following?
Amount of new rental property
Quality of rental property
Age of population
4. How would you predict residents of rent-controlled units would vote on a referendum to repeal rent-control laws?
Slide 65

MB MC
Copyright c 2007 by The McGraw-HillCompanies, Inc. All rights reserved.
Bellwork: Oct. 4
Are there any substitutes for gasoline?
Slide 66
MB MC
Copyright c 2007 by The McGraw-HillCompanies, Inc. All rights reserved.
Slide 67
Predicting and Explaining Changes In Prices and Quantities
Gasoline Activity: http://www.stlouisfed.org/education_resources/assets/lesson_plans/07ITV_ShiftingCurves.pdf
MB MC
Copyright c 2007 by The McGraw-HillCompanies, Inc. All rights reserved.
Slide 68
Predicting and Explaining Changes In Prices and Quantities
Shifts in DemandChanges In Demand
An increase (decrease) in the demand for a good will shift the demand curve to the right (left)
MB MC
Copyright c 2007 by The McGraw-HillCompanies, Inc. All rights reserved.
Slide 69
Predicting and Explaining Changes In Prices and Quantities
A Change In IncomeNormal Good
One whose demand increases (decreases) when the incomes of buyers increase (decrease)

MB MC
Copyright c 2007 by The McGraw-HillCompanies, Inc. All rights reserved.
Slide 70
Predicting and Explaining Changes In Prices and Quantities
A Change In IncomeInferior Good
One whose demand decreases (increases) when the incomes of buyers increase (decrease)

MB MC
Copyright c 2007 by The McGraw-HillCompanies, Inc. All rights reserved.
Slide 71
Predicting and Explaining Changes In Prices and Quantities
Factors that Shift DemandPrice of complementsPrice of substitutesIncomePreferencesPopulation of potential buyersExpectations
MB MC
Copyright c 2007 by The McGraw-HillCompanies, Inc. All rights reserved.
Slide 72
Predicting and Explaining Changes In Prices and Quantities
Factors that Shift SupplyCosts of productionTechnologyWeatherNumber of suppliersExpectations