May N. Sule, Michael. R. Templeton and Tom Bond*
17
Rejection of organic micro-pollutants from water by a tubular, hydrophilic pervaporative membrane designed for irrigation applications May N. Sule, Michael. R. Templeton and Tom Bond* Department of Civil and Environmental Engineering, Imperial College London SW7 2AZ, UK *Corresponding author. Email: [email protected]. Telephone: +44(0)207 594 6018 Email addresses for other authors: [email protected]; [email protected] Page 21 of 37 URL: http:/mc.manuscriptcentral.com/tent Environmental Technology 1 2 3 4 5 6 7 8 9 10 11 12 13 14 15 16 17 18 19 20 21 22 23 24 25 26 27 28 29 30 31 32 33 34 35 36 37 38 39 40 41 42 43 44 45 46 47 48 49 50 51 52 53 54 55 56 57 58 59 60
Transcript of May N. Sule, Michael. R. Templeton and Tom Bond*

Rejection of organic micro-pollutants from water by a tubular, hydrophilic
pervaporative membrane designed for irrigation applications
May N. Sule, Michael. R. Templeton and Tom Bond*
Department of Civil and Environmental Engineering, Imperial College London SW7 2AZ,
UK
*Corresponding author. Email: [email protected]. Telephone: +44(0)207 594 6018
Email addresses for other authors: [email protected]; [email protected]
Page 21 of 37
URL: http:/mc.manuscriptcentral.com/tent
Environmental Technology
123456789101112131415161718192021222324252627282930313233343536373839404142434445464748495051525354555657585960

Abstract
The links between chemical properties, including those relating to molecular size, solubility,
hydrophobicity and vapour pressure, and rejection of model aromatic micro-pollutants by a
tubular, hydrophilic polymer pervaporation membrane designed for irrigation applications
was investigated. Open air experiments were conducted at room temperature for individual
solutions of fluorene, naphthalene, phenol, 1,2-dichlorobenzene, 1,2-diethylbenzene and 2-
phenoxyethanol. Percentage rejection generally increased with increased molecular size for
the model micro-pollutants (47% - 86%). Molecular weight and logKow had the strongest
positive relationships with rejection, as demonstrated by respective correlation coefficients of
r = 0.898 and 0.824. Rejection was also strongly negatively correlated with aqueous
solubility and H-bond δ. However, properties which relate to vapour phase concentrations of
the micro-pollutants were not well correlated with rejection. Thus, physicochemical
separation processes, rather than vapour pressure, drives removal of aromatic contaminants
by the investigated pervaporation tube. This expanded knowledge could be utilised in
considering practical applications of pervaporative irrigation systems for treating organic-
contaminated waters such as oilfield produced waters.
Keywords: Pervaporation, membrane, irrigation, micro-pollutants, hydrophilic.
Introduction
Water scarcity is driving the need for technologies that will allow the treatment of polluted
source waters for human activities, such as drinking water production and irrigation. For
example, in some parts of the world, it may be desirable for the waters resulting from oil/gas
production to be put to such beneficial re-use applications. However, such waters are
typically highly saline and often contain at least trace amounts of a range of environmentally
Page 22 of 37
URL: http:/mc.manuscriptcentral.com/tent
Environmental Technology
123456789101112131415161718192021222324252627282930313233343536373839404142434445464748495051525354555657585960

harmful organic contaminants. In oilfield-produced water these include aromatic compounds
benzene, toluene, ethylbenzene and xylenes, known collectively as ‘BTEX’, as well as
polynuclear aromatic hydrocarbons (PAHs), phenols and other compounds [1]. While a
variety of technologies have been previously investigated for BTEX removal, including
membrane bioreactors [2], a biotrickling filter [3] and a variety of adsorbents [4], low energy
methods for selective removal of such micro-pollutants from water would be advantageous.
In this study, the removal of representative aromatic micro-pollutants using a hydrophilic
tubular pervaporative membrane designed for irrigation applications was investigated.
Pervaporation (i.e. permeation and evaporation) is a separation process in which a multi-
component liquid is passed across a non-porous, selectively permeable membrane that
preferentially transports one or more of the components. The three key steps involved in the
process are dissolution, diffusion and evaporation [5, 6]. This approach can potentially be
used as an irrigation technology is for a tube made of a pervaporative polymer to be filled
with water and buried in soils at approximately the root level of the target crops, with water
pervaporating across the membrane wall and contaminants held within the tube (periodic
flushing would be required to prevent accumulation of the contaminants within the tube).
The removal of salts using these pervaporation tubes has been previously demonstrated [7].
However, there is very limited information available about how effective this technology is
for rejecting pollutants found in oilfield-produced water. Hence, the aim of this study was to
investigate the rejection of organic micro-pollutants by the tubular pervaporative polymer
membrane. Fluorene, naphthalene, phenol, 1,2-diethylbenzene, 2-phenoxyethanol, and 1,2-
dichlorobenzene were used as model aromatic micro-pollutants.
Materials and methods
Page 23 of 37
URL: http:/mc.manuscriptcentral.com/tent
Environmental Technology
123456789101112131415161718192021222324252627282930313233343536373839404142434445464748495051525354555657585960

The polymer membrane that was used in this research was a non-porous, hydrophilic
membrane composed of a thermoplastic block copolymer of the polyester family synthesised
by Du Pont de Nemours International SA, Geneva and extruded into a corrugated tubular
form, with inner corrugated diameter of 19mm, outer corrugated diameter of 23mm,
membrane thickness of 0.75 mm, and ridge width of 7mm. This corresponds to a linear mass
of 90 g per metre length of tube. Analytical grade 1,2-diethyl benzene, 1,2-dichlorobenzene,
2-phenoxyethanol, phenol, naphthalene, and fluorene were obtained from Sigma-Aldrich,
Dorset, UK. Structures and selected properties [8, 9, 10] for model micro-pollutants are given
in Table 1. Molecular weight, molecular volume and kinetic diameter were selected as they
are related to molecular size. Various other properties were selected on the basis that they are
linked to solubility: the octanol/water partition coefficient (logKow, a measure of
hydrophobicity), aqueous solubility and H-bond δ. The latter may require some introduction.
H-bond δ (or δH) is the hydrogen bonding interaction contribution (or H-bond cohesion
(solubility) parameter) obtained from Hansen’s solubility parameters [10]. It has previously
been used to quantify hydrogen bonding interactions between polymer molecules and
solvents and is therefore relevant to pervaporation applications [10, 11]. Finally, boiling
point, Henry’s Law constant, and vapour pressure were selected as they are associated with
gaseous concentrations of the model micro-pollutants. Vapour pressure values were
calculated using the Antoine equation:
log �� = A − �� ����.�� (1)
Where VP = vapour pressure, T = temperature and A, B and C are compound-specific
coefficients (Antoine’s A, B and C coefficients).
The strength of linear relationships between removal and physicochemical properties of the
organic compounds were evaluated using Pearson product-moment correlation coefficients.
Page 24 of 37
URL: http:/mc.manuscriptcentral.com/tent
Environmental Technology
123456789101112131415161718192021222324252627282930313233343536373839404142434445464748495051525354555657585960

These can take values between -1 (total negative correlation) and 1 (total positive
correlation).
Permeation/diffusion tests were undertaken in the open air to evaluate the rate of water and
contaminant transport across the tubular polymer membrane [12, 13]. For experiments with
the model micro-pollutants, each end of a 400 mm length of the tubular membrane was
inserted into a neoprene tube leaving 350 mm of the PV tubular membrane for pervaporation
to occur. Both ends were tightly wound with parafilm to seal all gaps between the PV tube
and neoprene tube. The tubes were filled with contaminant solution and then the ends were
tightly plugged with rubber bungs and sealed. The two ends of the sealed pipe were each
clamped to a retort stand leaving the remainder of the tube suspended (in air) in a
temperature-controlled laboratory at 21±1oC (Figure 1). In order to simulate real-life
conditions no attempts were made to control humidity. The tubes were unclamped and
weighed daily to measure mass change and consequently calculate permeate flux. At the end
of an experimental run, the concentration of the contaminant solution in the tube was
measured using UV-Vis spectrophotometry (Shimadzu UV-2401 PC). In these experiments,
no provision was made to maintain a high vapour pressure gradient across the membrane,
unlike in Quinones-Bolanos et al. (2005), to more closely simulate the conditions of a tube
buried in soil with no vacuum applied. Rather, in this work, the driving force was the vapour
pressure difference between the surrounding ambient environment and that in the solvent
filled tube.
-Insert Table 1-
The permeate flux J� was quantified as the mass water (Mw) permeating through the
membrane per unit of time (t) per unit area (A)
Ji = ���� (2)
Page 25 of 37
URL: http:/mc.manuscriptcentral.com/tent
Environmental Technology
123456789101112131415161718192021222324252627282930313233343536373839404142434445464748495051525354555657585960

Rejection of contaminants was calculated in terms of an enrichment factor, the ratio between
the concentration of the contaminant in the permeate (Cperm) to that in the feed (Cfeed) [14],
� = ��� !��" (3)
In this study the feed concentration and volume was measured directly and the permeate
concentration calculated indirectly from measurements made to the feed solution:
� = ( $×&$)�( !×&!) !×(&$�&!� ∆)*�+,��) (4)
Where Ci and Cf are respectively the initial and final concentration of feed solution, while Vi
and Vf are respectively the initial and final volume of feed solution and ∆M is the change in
membrane mass. Use of this equation is based on the assumption that the amount of
contaminant remaining inside the membrane is insignificant. In addition, control experiments
were undertaken using non-pervaporative plastic tubes of similar dimensions to the actual
pervaporation tubes. These demonstrated no significant change in concentrations of the
model contaminants over the experimental timescale studied. It is also worth noting that
boiling points of the model contaminants are relatively high at 181 – 295 ˚C (Table 1), so
volatilisation into any headspace present was not expected to be important.
Percentage rejection (R) was then calculated as:
%. = /1 − � !1 · 100 (5)
where Cp and Cf are calculated as defined above.
All experiments were undertaken for 7 days in at least triplicate. UV-Vis spectrophotometry
was applied to quantify the aromatic micro-pollutants. The quantification wavelengths used
Page 26 of 37
URL: http:/mc.manuscriptcentral.com/tent
Environmental Technology
123456789101112131415161718192021222324252627282930313233343536373839404142434445464748495051525354555657585960
for the different compounds were 193 nm for 1,2-diethyl benzene, 254 nm for naphthalene,
fluorene, 2-phenoxyethanol and phenol [15, 16], and 220 nm for 1,2-dichlorobenzene. The
starting concentrations of the micro-pollutants reflects the different aqueous solubilities of the
compounds and also typical concentrations in oifield produced waters.
Results
Effect of organic micro-pollutants on water flux
The average water flux ranged between 3.7 x 10⁻²
- 3.9 x 10⁻²
L (m-2
·h-1
) for the micro-
pollutant solutions and 5.5 x 10⁻²
L (m-2
·h-1
) for pure water (Table 2). The reduction in water
flux associated with the organic contaminants can be explained by multiple factors. Reduced
water flux and sorption in the presence of inorganic salts, relative to equivalent pure water
values, for the same pervaporation membrane as used in this study have been reported
previously [7]. This trend can be explained by the addition of solutes to water increasing
entropy and also lowering the chemical potential of the solution [18]. These changes will also
be reflected in reduced adsorption and vapour pressure, which can be viewed as the escaping
tendency of the solute [19] and which will reduce overall flux. Concentration polarisation at
the membrane surface may also play a role in the reduced flux [20].
-Insert Figure 1-
-Insert Table 2-
Rejection of organic micro-pollutants
There was a wide variation in removal efficiency (% rejection) for the different micro-
pollutants (47% - 86%) (Table 2). Fluorene was best removed (86%) while phenol was least
removed 47%. The difference between the molar volume of water (18 cm3) and of the model
micropollutants (89.11 – 122.85 cm3) favoured the selective permeation of water over the
micro-pollutants. Water is both preferentially dissolved and transported over larger molecules
Page 27 of 37
URL: http:/mc.manuscriptcentral.com/tent
Environmental Technology
123456789101112131415161718192021222324252627282930313233343536373839404142434445464748495051525354555657585960

in hydrophilic membranes due to its smaller molecular size [11]. In addition, Berens [22]
found that diffusion coefficient (D) decreases with increasing permeate weight, size
(molecular volume) and cross sectional area of the penetrant. Similarly, Shao and Huang
[11], reported that the diffusion coefficient of a permeate through a polymer is a strong
function of the size and shape of the permeate, and Park et al. [23] reported that the intrinsic
diffusion coefficient D of a solvent in samples decreased with an increase in the average
molecular diameter dm of the solute. Diffusion coefficients tend to decrease with increasing
contaminant molecular volume because of the higher activation energy required for diffusion
through a polymer matrix. When molecular weight and chemical nature are the same,
molecules with smaller cross-section diffuse faster [24, 25, 26].
-Insert Figure 2-
Hydrogen-bonding interaction has also been proposed as a dominant factor controlling the
selectivity toward water in hydrophilic pervaporation process [27]. In this study, an enhanced
propensity for hydrogen-bonding influenced the rejection of phenol (δh = 14.9) and 2-
phenoxyethanol (δh = 14.3), as these compounds had the lowest removal of 47% and 58%
respectively, whereas fluorene, which has the second lowest hydrogen bonding parameter
among the seven studied compounds (δh = 1.7), was best rejected. The compound with the
lowest hydrogen bonding was 1,2 diethylbenzene (δh = 1), for which 66% rejection was
observed. This might also be linked to the latter’s higher water solubility of 70 mg/L and
initial feed concentration of 68 mg/L, compared to fluorene’s water solubility of 1.98 mg/L
and initial feed concentration of 1.75 mg/L.
The rejection of the model micro-pollutants was also affected by the logKow values (Figure
2). Organic compounds with logKow > 3 had a better removal rate than those with log Kow < 2
Figure 2; Table 1). Sangam and Rowe [24] reported a decrease in diffusion coefficient D of
compounds with high log Kow values. The fact that flourene, with the highest molecular
Page 28 of 37
URL: http:/mc.manuscriptcentral.com/tent
Environmental Technology
123456789101112131415161718192021222324252627282930313233343536373839404142434445464748495051525354555657585960
volume of 188 cm3, was best rejected supports this explanation. Since each of these
properties appears to play a role, Pearson product-moment correlations were applied to the
data to examine the relative importance of the properties on contaminant rejection and how
the properties themselves are interrelated (Table 3).
-Insert Table 3-
The strongest positive correlation coefficients involving rejection were with molecular
weight, logKow and kinetic diameter: r = 0.898, 0.824 and 0.696, respectively (Table 3).
These three properties were all positively correlated with one another: r values from 0.607-
0.964 (Table 3). Thus, rejection increases with both molecular size and hydrophobicity of the
model compounds, as might be expected for a hydrophilic membrane. However, since logKow
also increases with molecular weight for the studied contaminants it is an intractable matter to
disentangle their relative importance. Aqueous solubility and H-bond δ were both strongly
negatively correlated with rejection, respective r values being -0.852 and -0.828 (Table 3).
These two properties were negatively correlated with molecular weight and logKow, as shown
by r values from -0.669 to -0.984 (Table 3). One again, this illustrates the interlinked nature
of the chemical properties, as micropollutants which were best removed by the membrane
tended to be among the largest and most hydrophobic compounds and therefore also had low
aqueous solubility and low propensity for hydrogen bonding. Boiling point, theoretical
vapour pressure values and Henry’s Law constants were not well correlated with rejection
(Table 3; r = 0.566, 0.065 and 0.179, respectively). Also note that vapour pressure was not
strongly correlated with any of the molecular properties related to molecular size (i.e.
molecular weight, molecular volume, kinetic diameter), r≤0.597 for all. As expected, vapour
pressure values were strongly correlated with Henry’s Law constants (r = 0.918; Table 3).
Overall, this indicates that physicochemical separation processes, as evidenced by the
correlations involving properties associated with molecular weight, hydrophobicity and
Page 29 of 37
URL: http:/mc.manuscriptcentral.com/tent
Environmental Technology
123456789101112131415161718192021222324252627282930313233343536373839404142434445464748495051525354555657585960

aqueous solubility, rather than vapour pressure, actually drives removal of aromatic
contaminants by the investigated pervaporation tube. As mentioned above, the three
conceptual steps in the pervaporation process are dissolution, diffusion and evaporation,
although there is uncertainty regarding exactly in which location of the membrane these
occur. Overall, the calculated correlations suggest that molecular sieving, hydrophobicity and
hydrogen bonding are the most influential mechanisms determining the rejection of organics
by this type of membrane.
Conclusions
Rejection of organic contaminants by the tubular, hydrophilic pervaporative membrane in this
study increased with the size of aromatic micro-pollutant. Solubility, hydrophobicity and
hydrogen-bonding also played a role. Molecular weight and logKow had the strongest positive
relationships with rejection, as demonstrated by respective correlation coefficients of r =
0.898 and 0.824. Rejection was also strongly negatively correlated with aqueous solubility
and H-bond δ. However, properties which relate to vapour phase concentrations of the micro-
pollutants were not well correlated with rejection. Thus, physicochemical separation
processes, rather than vapour pressure, drives removal of aromatic contaminants by the
investigated pervaporation tube. Based on these experiments, the application of hydrophilic
pervaporative membranes for treating organics-contaminated waters might pose some risks to
the long-term quality of the surrounding soil and plant life, depending on the particular
organic compounds present in the water; this research provides evidence of relationships that
can be used as a basis for assessing whether such organics are likely to permeate into the soils
or not.
Page 30 of 37
URL: http:/mc.manuscriptcentral.com/tent
Environmental Technology
123456789101112131415161718192021222324252627282930313233343536373839404142434445464748495051525354555657585960

Acknowledgements
We gratefully acknowledge the funding for this work provided by the Research Partnership to
Secure Energy for America (RPSEA) under Project Number 09123-11. The authors also
acknowledge the in-kind support and guidance of Mark Tonkin of DTI-r Ltdm, Audrey Cally,
Jean-Maurice Griffon and Christophe Chervin of DuPont, and Dr Jonathan Brant of the
University of Wyoming. The PhD studentship of first author was funded by the Petroleum
Technology Development Fund (PTDF) of Nigeria.
References
1. Neff JM, Johnsen S, Frost TK, Røe Utvik TI, Durell GS. Oil well produced water
discharges to the North Sea. Part II: Comparison of deployed mussels (Mytilus edulis) and
the DREAM model to predict ecological risk. Mar Environ Res. 2006;62:224-46.
2. Zhao K, Xiu G, Xu L, Zhang D, Zhang X, Deshusses MA. Biological treatment of
mixtures of toluene and n‐hexane vapours in a hollow fibre membrane bioreactor. Environ.
Technol. 2011;32:617-23.
3. Wang X-Q, Lu B-H, Zhou X-X, Li W. Evaluation of o-xylene and other volatile
organic compounds removal using a xylene-acclimated biotrickling filter. Environ. Technol.
2013;34:2691-9.
4. Shahriari H, Fernandes L, Tezel FH. Investigation of organic, inorganic and synthetic
adsorbents for the pretreatment of landfill leachate. Environ. Technol.. 2008;29:543-52.
5. Wijmans JG, Baker RW. The solution-diffusion model: a review. J Membrane Sci.
1995;107:1-21.
6. Baker R. Membrane Technology and Applications. Second ed. Chichester, UK: John
Wiley & Sons Ltd; 2004.
7. Sule M, Jiang J, Templeton M, Huth E, Brant J, Bond T. Salt rejection and water flux
through a tubular pervaporative polymer membrane designed for irrigation applications.
Environ Technol. 2013;34:1329-39.
8. Chemspider. Chemical data base search 2015 [cited 2015 22 October 2015].
Available from: http://www.chemspider.com/Search.aspx.
9. Yaws CL, Narasimhan P, K. , Gabbula C. Yaws' Handbook of Antoine Coefficients
for Vapor Pressure (2nd Electronic Edition): Knovel. Online version available at:
http://app.knovel.com/hotlink/toc/id:kpYHACVPEH/yaws-handbook-antoine/yaws-
handbook-antoine; 2009 [rom: URL|.
10. Hansen CM. Hansen Solubility Parameters. A User’s Handbook. Second Edition.
Boca Raton, FL, USA: CRC Press; 2007.
11. Shao P, Huang RYM. Polymeric membrane pervaporation. J. Membrane Sci.
2007;287:162-79.
12. Park JK, Sakti JP, Hoopes JA. Transport of organic compounds in thermoplastic
geomembranes .1. Mathematical model. J. Environ. Eng.(ASCE). 1996;122:800-6.
13. Islam MZ, Rowe RK. Permeation of BTEX through unaged and aged HDPE
geomembranes. J. Geotech. Geoenviron. Eng. 2009;135:1130-40.
Page 31 of 37
URL: http:/mc.manuscriptcentral.com/tent
Environmental Technology
123456789101112131415161718192021222324252627282930313233343536373839404142434445464748495051525354555657585960

14. Quiñones-Bolaños E, Zhou H, Soundararajan R, Otten L. Water and solute transport
in pervaporation hydrophilic membranes to reclaim contaminated water for micro-irrigation.
J. Membrane Sci. 2005;252:19-28.
15. Shaw DG, Maczynski A, Goral M, Wisniewska-Goclowska B, Skrzecz A, Owczarek
I, Blazej K, Haulait-Pirson M-C, Hefter GT, Huyskens PL, Kapuku F, Maczynska Z,
Szafranski A. IUPAC-NIST Solubility Data Series. 81. Hydrocarbons with Water and
Seawater—Revised and Updated. Part 9. C10 Hydrocarbons with Water. J. Phys. Chem. Ref.
Data. 2006;35:93-151.
16. Shaw DG, Maczynski A, Goral M, Wisniewska-Goclowska B, Skrzecz A, Owczarek
I, Blazej K, Haulait-Pirson M-C, Hefter GT, Kapuku F, Maczynska Z, Szafranski A. IUPAC-
NIST Solubility Data Series. 81. Hydrocarbons with Water and Seawater—Revised and
Updated. Part 11. C13–C36 Hydrocarbons with Water. J. Phys. Chem. Ref. Data.
2006;35:687-784.
17. ISO/IEC. 17025: General requirements for the competence of testing and calibration
laboratories. The International Organization for Standardization (ISO) and the International
Electrotechnical Commission (IEC) Genva, Switzerland: ISO/IEC; 2005.
18. Atkins PW. Physical Chemistry. Fifth ed. Oxford, Melbourne, Tokyo: Oxford
University Press; 1994.
19. Bartell FE, Thomas TL, Fu Y. Thermodynamics of adsorption from solutions. IV.
Temperature dependence of adsorption. J. Phys. Chem. 1951;55:1456-62.
20. Wijmans JG, Athayde AL, Daniels R, Ly JH, Kamaruddin HD, Pinnau I. The role of
boundary layers in the removal of volatile organic compounds from water by pervaporation. J
Membrane Sci. 1996;109:135-46.
21. Böddeker KW, Bengtson G, Bode E. Pervaporation of low volatility aromatics from
water. J. Membrane Sci. 1990;53:143-58.
22. Berens AR. Prediction of organic chemical permeation through PVC pipe. Journal
AWWA. 1985;77:57-64.
23. Park JK, Bontoux L, Holsen TM, Jenkins D, Selleck RE. Permeation of polybutylene
pipe and gasket material by organic chemicals. Journal AWWA. 1991;83:71-8.
24. Sangam HP, Rowe RK. Migration of dilute aqueous organic pollutants through HDPE
geomembranes. Geotext. Geomembranes. 2001;19:329-57.
25. Joo JC, Kim JY, Nam K. Mass transfer of organic compounds in dilute aqueous
solutions into high density polyethylene geomembranes. J. Environ. Eng. (ASCE).
2004;130:175-83.
26. Rowe RK, Mukunoki T, Sangam HP. Benzene, toluene, ethylbenzene, m&p-xylene,
o-xylene diffusion and sorption for a geosynthetic clay liner at two temperatures. J. Geotech.
Geoenviron. Eng. 2005;131:1211-21.
27. Semenova SI, Ohya H, Soontarapa K. Hydrophilic membranes for pervaporation: An
analytical review. Desalination. 1997;110:251-86.
Page 32 of 37
URL: http:/mc.manuscriptcentral.com/tent
Environmental Technology
123456789101112131415161718192021222324252627282930313233343536373839404142434445464748495051525354555657585960
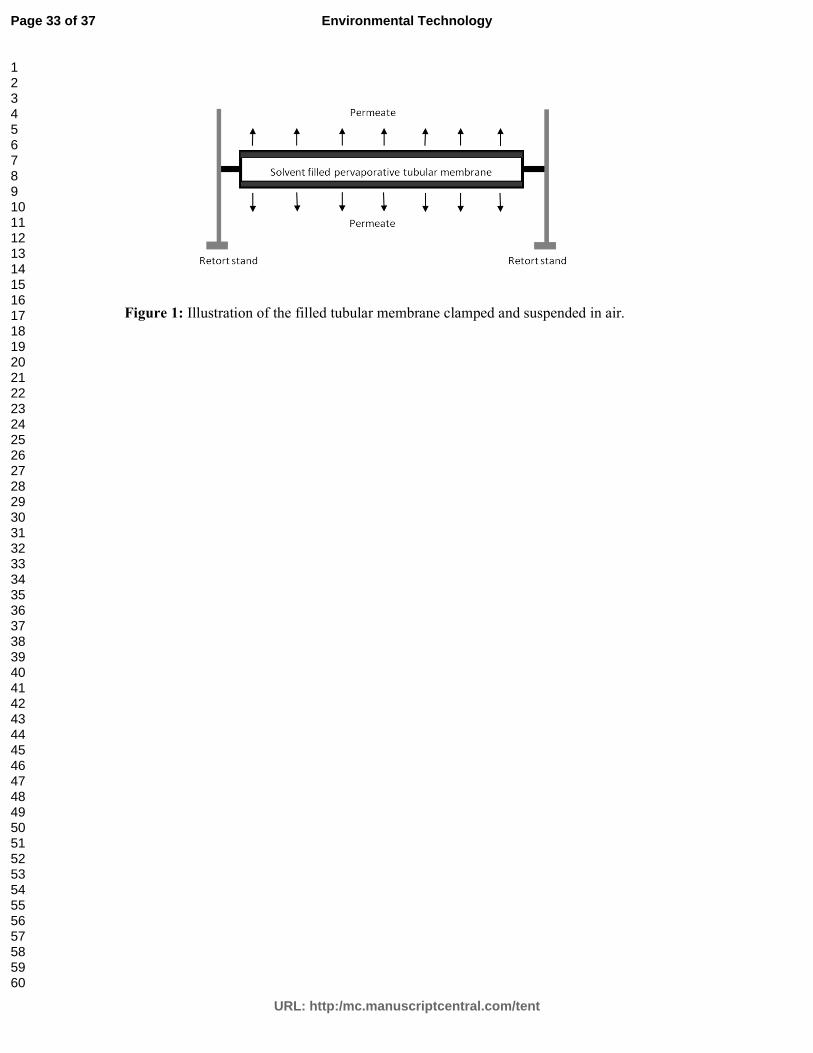
Figure 1: Illustration of the filled tubular membrane clamped and suspended in air.
Page 33 of 37
URL: http:/mc.manuscriptcentral.com/tent
Environmental Technology
123456789101112131415161718192021222324252627282930313233343536373839404142434445464748495051525354555657585960

1
a.
b.
c.
Figure 2: Percentage rejection versus (a) molecular volume (b) hydrogen bonding parameter
values, and (c) log Kow values for fluorene, naphthalene, phenol, 1,2-diethylbenzene, 2-
phenoxyethanol, and 1,2-dichlorobenzene.
phenol 2 phenoxyethanol
naphthalene1,2 DCB
fluorene
1,2 DEB
water0
10
20
30
40
50
60
70
80
90
100
0 50 100 150 200
% r
eje
ctio
n
molecular volume cm3
phenol
2 phenoxyethanol
naphthalene1,2 DCB
fluorene
1,2 DEB
water0
10
20
30
40
50
60
70
80
90
100
0 5 10 15 20 25 30 35 40 45
% r
eje
ctio
n
Hydrogen bond δh
phenol
2 phenoxyethanol naphthalene
1,2 DCB
fluorene
1,2 DEB
0
10
20
30
40
50
60
70
80
90
100
0.0 0.5 1.0 1.5 2.0 2.5 3.0 3.5 4.0 4.5
% r
eje
ctio
n
Log Kow
Page 34 of 37
URL: http:/mc.manuscriptcentral.com/tent
Environmental Technology
123456789101112131415161718192021222324252627282930313233343536373839404142434445464748495051525354555657585960

Table 1: Structures and properties of model contaminants [8, 9, 10]
Compound Structure Molecular
weight Density
Molar
volume1
Aqueous
solubility logKow
Boiling
point
H-bond
δ
Kinetic
diameter
Henry’s
Law
constant2
Vapour pressure
@ 25 ˚C3
g�mol-1 g�cm-3 cm3� mol-1
mg�L-1 ˚C MPa1/2 Å atm-
m3/mol mm Hg
Fluorene
166 1.2 138 2 4.2 295 1.7 9.62E-05 0.008
Naphthalene
128 1.1 112 31 3.4 218 5.9 7.2 4.40E-04 0.077
Phenol
94 1.1 88 8000 1.5 182 14.9 6.6 3.33E-07 0.296
1,2-Diethylbenzene
134 0.9 153 70 4.1 183 1.0 7.8 2.61E-03 1.200
2-Phenoxyethanol
138 1.1 125 3000 1.2 246 14.3 4.72E-08 0.011
1,2-Dichlorobenzene
147 1.3 113 140 3.4 181 3.4 7.3 1.92E-03 1.480
1 = calculated from molecular weight/density. 2 = experimental value. 3 = calculated from the Antoine equation, see the manuscript text. Correlations involving Antoine coefficients a, b and c are shown in Table 3, but these coefficients have been excluded from Table 1 due to lack of space.
Page 35 of 37
URL: http:/mc.manuscriptcentral.com/tent
Environmental Technology
123456789101112131415161718192021222324252627282930313233343536373839404142434445464748495051525354555657585960
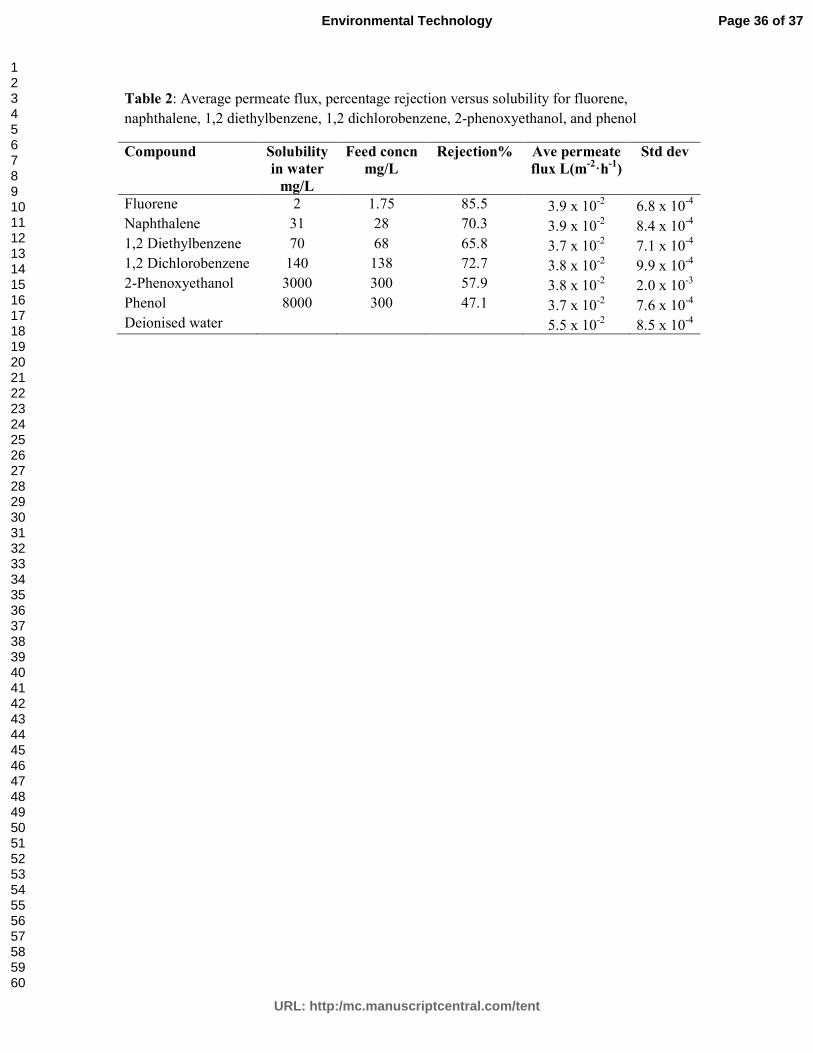
Table 2: Average permeate flux, percentage rejection versus solubility for fluorene,
naphthalene, 1,2 diethylbenzene, 1,2 dichlorobenzene, 2-phenoxyethanol, and phenol
Compound Solubility
in water
mg/L
Feed concn
mg/L
Rejection% Ave permeate
flux L(m-2
·h-1
)
Std dev
Fluorene 2 1.75 85.5 3.9 x 10⁻²
6.8 x 10⁻⁴
Naphthalene 31 28 70.3 3.9 x 10⁻²
8.4 x 10⁻⁴
1,2 Diethylbenzene 70 68 65.8 3.7 x 10⁻²
7.1 x 10⁻⁴
1,2 Dichlorobenzene 140 138 72.7 3.8 x 10⁻²
9.9 x 10⁻⁴
2-Phenoxyethanol 3000 300 57.9 3.8 x 10⁻²
2.0 x 10⁻³
Phenol 8000 300 47.1 3.7 x 10⁻²
7.6 x 10⁻⁴
Deionised water 5.5 x 10⁻²
8.5 x 10⁻⁴
Page 36 of 37
URL: http:/mc.manuscriptcentral.com/tent
Environmental Technology
123456789101112131415161718192021222324252627282930313233343536373839404142434445464748495051525354555657585960

Table 3: Pearson product-moment correlation coefficients between chemical properties and rejection values
%
rejection
Mol
weight Density
Molar
volume
Aqueous
solubility logKow
Boiling
point H-bond δ
Kinetic
diameter
Henry's
Law
constant
A1 B
1 C
1
Mol. weight 0.898
Density 0.431 0.402
Molar volume 0.563 0.686 -0.386
Aqueous sol. -0.852 -0.812 -0.172 -0.711
logKow 0.824 0.607 0.009 0.629 -0.805
Boiling point 0.566 0.645 0.288 0.353 -0.278 0.139
H-bond δ -0.828 -0.669 -0.040 -0.676 0.853 -0.984 -0.099
Kinetic
diameter 0.696 0.773 -0.381 0.977 -0.841 0.964 -0.002 -0.955
Henry's Law
constant 0.179 0.169 -0.308 0.489 -0.494 0.561 -0.584 -0.650 0.895
Antoine’s A1 -0.369 -0.052 -0.061 -0.065 0.547 -0.678 0.463 0.665 -0.658 -0.622
Antoine’s B
1 0.404 0.613 0.194 0.400 -0.112 -0.004 0.913 0.004 0.090 -0.491 0.694
Antoine’s C
1 0.559 0.701 0.076 0.659 -0.437 0.536 0.240 -0.618 0.613 0.471 0.057 0.460
Vap pressure 0.065 0.071 -0.051 0.193 -0.290 0.377 -0.696 -0.485 0.597 0.918 -0.551 -0.542 0.469
A, B and C are used as abbreviations for Antoine’s coefficients A, B and C
Page 37 of 37
URL: http:/mc.manuscriptcentral.com/tent
Environmental Technology
123456789101112131415161718192021222324252627282930313233343536373839404142434445464748495051525354555657585960