May 2015 Official Website Presentation From Swallow Financial
18
How To Invest For The Best Returns In 2015
-
Upload
swallow-financial-planning -
Category
Economy & Finance
-
view
33 -
download
0
Transcript of May 2015 Official Website Presentation From Swallow Financial

How To Invest For The Best ReturnsIn 2015

04/15/2023 Investment Presentation 2/17
Presentation Objectives
Outline the benefits of asset-backed investments for long-term returns.
Differentiate between under and abnormal performance of multiple assets.
Fully justify the need for asset diversification.
Present the risk-return relationship, as well as its numerous comfort zones.
Reinforce why Swallow upholds passive management rather than active.

04/15/2023 Investment Presentation 3/17
Preamble… Throughout these notes we have tried wherever possible to use 20 years of data.
May 1994
Inflation = 2.55%Bank Base Rate = 5.13%
FTSE 100 = 2,970bbbbb
MARCH 1995Inflation=0.9% | Bank Base Rate=0.5% | FTSE100=6,773
MARCH 2015
Generate £10,000 of income.
Aim:
Security:
10 Year GILT.
Cost: £492,610 (ignoring costs)
Inflation=3.51% | Bank Base Rate=6.63% | FTSE100=3137
Aim:
Cost:
£115,473 (ignoring costs)
Security: 10 Year GILT.
Generate £10,000 of income.
This is equivalent to an Annualised Growth Rate of 7.52%. Had the FTSE 100 grown by the same sum it would now be at 13,375. (Bank of England and FTSE statistics).

04/15/2023 Investment Presentation 4/17
Over the long-term, assets tend to perform better than cash or inflation:
Assets or Cash?
19961998
20002002
20042006
20082010
20122014-100%
0%
100%
200%
300%
400%
500%
600%
700%
800%
900%
Asset Growth March 1995 to March 2015
FTSE 100
International Equities
Emerging Markets
Property
Global Bonds
Cash
RPI
Year
To
tal
Gro
wth
04/15/2023 Investment Presentation 5/17
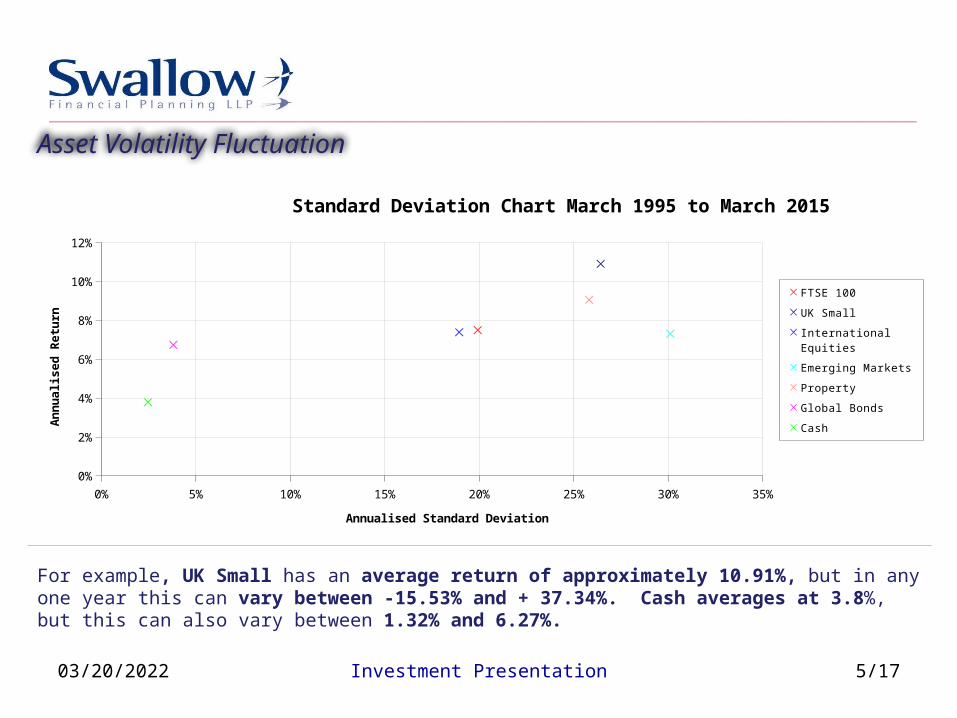
For example, UK Small has an average return of approximately 10.91%, but in any one year this can vary between -15.53% and + 37.34%. Cash averages at 3.8%, but this can also vary between 1.32% and 6.27%.
Asset Volatility Fluctuation
0% 5% 10% 15% 20% 25% 30% 35%0%
2%
4%
6%
8%
10%
12%
Standard Deviation Chart March 1995 to March 2015
FTSE 100
UK Small
International Equities
Emerging Markets
Property
Global Bonds
Cash
Annualised Standard Deviation
An
nu
alis
ed
Re
turn

04/15/2023 Investment Presentation 6/17
Empirical evidence has shown that if you combine asset classes the end result is greater than that of the composite parts. By choosing uncorrelated assets you can achieve reasonable returns in most markets as when some assets are going down, others normally rise.
Correlation of 1.0 indicates a perfect association | Correlation of 0 indicates no relation | Correlation of -1.0 indicates perfect disassociation
03/1995 to 05/2015
Asset Relationships: Antagonistic

04/15/2023 Investment Presentation 7/17
We propose 7 different risk categories for our clients. These are based on your FinaMetrica score (1 to 100). If you would like to know how we reach a ranking, please refer to our Risk Profile notes.
So the most cautious investor (i.e. with a FinaMetrica score of less than 20) is the wary one. On the other hand, the high risk investor (with a score of 90 +) is “Gung Ho”, holding the most volatile assets.
Matching Assets and Risk
Investment Option
Investor Type
FIXED/CASH PROPERTY EQUITIES TOTAL
UK Intl UK Intl UK International
Core Value Small Main Markets
Emerging Markets
1 Wary 90.00% 10.00% - 100.00%
2 Cautious 60.00% 15.00% 10.00% 5.00% 10.00% - 100.00%
3 Prudent 30.00% 20.00% 15.00% 5.00% 15.00% 5.00% 10.00% 100.00%
4 Balanced 15.00% 10.00% 15.00% 10.00% 15.00% 5.00% 5.00% 20.00% 5.00% 100.00%
5 Adventurous 5.00% 5.00% 15.00% 5.00% 20.00% 10.00% 5.00% 27.50% 7.50% 100.00%
6 Speculative - - 10.00% 5.00% 23.00% 10.00% 10.00% 27.00% 15.00% 100.00%
7 High Risk - 10.00% 20.00% 20.00% 30.00% 20.00% 100.00%

04/15/2023 Investment Presentation
1996
1997
1998
1999
2000
2001
2002
2003
2004
2005
2006
2007
2008
2009
2010
2011
2012
2013
2014
2015-100%
0%
100%
200%
300%
400%
500%
600%
700%
800%
High Risk Portfolio v Asset Class March 1995 to March 1995
High Risk FTSE 100 UK Value UK Small International Equities Emerging Markets
Year
To
tal
Gro
wth
8/17
The High Risk portfolio contains the other asset classes and has beaten all but UK Small whilst generating far less volatile returns (Total growth over 20 years: 455%)
Combining Assets to Reduce Return Volatility: 1

04/15/2023 Investment Presentation
199619971998199920002001200220032004200520062007200820092010201120122013201420150%
100%
200%
300%
400%
500%
600%
700%
800%
900%
Prudent Portfolio v Asset Class March 1995 to March 2015
Prudent Global Bonds Property FTSE 100 UK Value International Equities
Year
To
tal
Gro
wth
9/17
Again, the Prudent portfolio contains the other asset classes. Having fallen below Property, it has however narrowly finished second best whilst generating far less volatile returns. (Total return over 20 years: 342%)
Combining Assets to Reduce Return Volatility: 2
Alex
Changed the prasing here so that it matches the graph, whilst still making the point.

04/15/2023 Investment Presentation 10/17
Risk is the uncertainty of an investment performing better or worse than expected. This is also called the standard deviation from the norm. If we look at the returns for the above asset classes over 20 years we have a table as follows:
As you can see, the use of a mixture of assets overall generates better returns at lower risk than does an equivalent asset class.
Combining Assets to Reduce Return Volatility: 3
In About 70% of Time Periods Data Series Annualised Return Standard Deviation Minimum Return Maximum Return Global Bonds 6.74% 3.82% 2.92% 10.56% Cautious 6.17% 5.10% 1.08% 11.27% Balanced 8.95% 14.89% ( 5.94%) 23.84% International Equities 7.39% 18.94% ( 11.55%) 26.34%
FTSE 100 7.50% 19.93% ( 12.43%) 27.43% High Risk 8.95% 22.40% ( 13.45%) 31.35% Property 9.06% 25.82% ( 16.76%) 34.88% UK Small 10.91% 26.44% ( 15.53%) 37.34% Emerging Markets 7.31% 30.12% ( 22.81%) 37.43%
04/15/2023 Investment Presentation 11/17
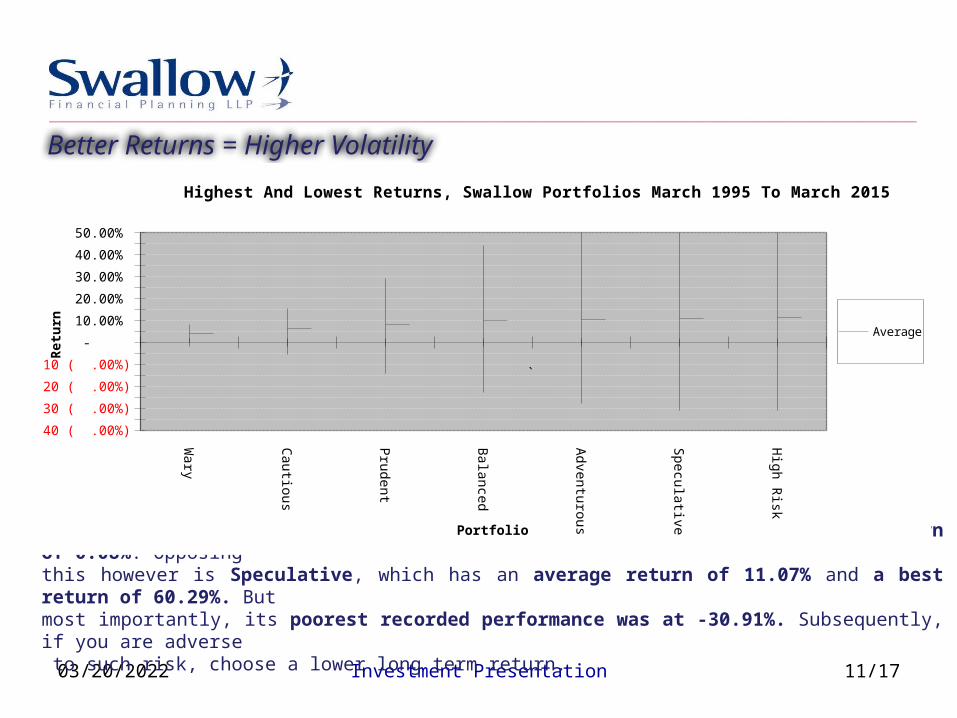
Wary has an average return of 4.19%, a best return of 8.21% and a worst return of 0.08%. Opposing this however is Speculative, which has an average return of 11.07% and a best return of 60.29%. But most importantly, its poorest recorded performance was at -30.91%. Subsequently, if you are adverse to such risk, choose a lower long term return.
Better Returns = Higher Volatility
Wary
Cautious
Prudent
Balanced
Adventurous
Speculative
High R
isk
40 ( .00%)
30 ( .00%)
20 ( .00%)
10 ( .00%)
-
10.00%
20.00%
30.00%
40.00%
50.00%
Highest And Lowest Returns, Swallow Portfolios March 1995 To March 2015
Average
Portfolio
Ret
urn
`

04/15/2023 Investment Presentation 12/17
If you look at the best and worst returns from a selection of our recommended portfolios, you will observe the following:
Long-Term Return Certainty
Best/Worst Returns Between March 1995 to March 2015
If you do not require your money for 10+ years , then you can afford a greater amount of risk knowing that the return is more likely to be as expected.
04/15/2023 Investment Presentation
1 2 3 4 5 6 7 8 9 10 11 12 13 14 15 16 17 18 19 20
£10,000
£15,000
£20,000
£25,000
£30,000
No charges
Passive
Active
Years
Va
lue
13/17
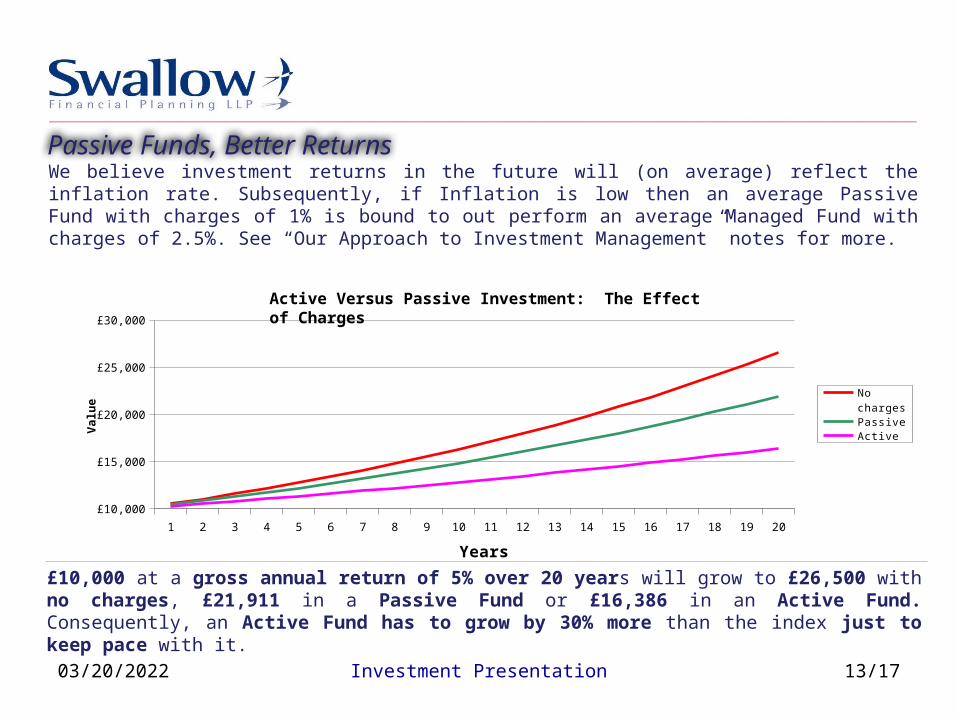
We believe investment returns in the future will (on average) reflect the inflation rate. Subsequently, if Inflation is low then an average Passive Fund with charges of 1% is bound to out perform an average Managed Fund with charges of 2.5%. See “Our Approach to Investment Management” notes for more.
£10,000 at a gross annual return of 5% over 20 years will grow to £26,500 with no charges, £21,911 in a Passive Fund or £16,386 in an Active Fund. Consequently, an Active Fund has to grow by 30% more than the index just to keep pace with it.
Passive Funds, Better Returns
Active Versus Passive Investment: The Effect of Charges

04/15/2023 Investment Presentation 14/17
If that is not enough to convince the sceptics, the 2013 ratio of US mutual fund new investments was 62% Passive 38% Active.
Managed Funds Do Not Beat The IndexHere are some facts to stir the pot:
Global EquityUK EquityEuropean EquityUS EquityEmerging Markets EquityGlobal BondsGBP Diversified BondsEuro Diversified BondsUS Divsified bonds
83%65%78%80%75%82%79%99%99%
% of Fund Managers Underperforming from 1999 to 2013 (Including Funds Wound Up)
(Vanguard approx, calculations made using Morningstar Data)

04/15/2023 Investment Presentation 15/17
The Graham and Campbell study of 237 market timing newsletters showed that less than 25% of the “experts” predicted the right outcome once, let alone consistently. If we cannot get the asset timing right, we believe clients should remain invested in their optimum asset classes.
FTSE 100 UK Value UK Small International Equities Emerging Markets Property Global Bonds Cash
Do Not Time The Market!
March 2006
March 2007
March 2008
March 2009
March 2010
March 2011
March 2012
March 2013
March 2014
March 2015
60.96% 19.16% 20.65% 5.84% 80.84% 18.17% 6.52% 29.74% 22.60% 28.91% 49.96% 17.00% 6.29% 3.74% 72.81% 12.44% 4.83% 23.69% 8.72% 20.38% 33.17% 16.92% 5.73% ( 19.65%) 71.66% 12.36% 3.05% 17.96% 8.10% 13.28% 29.58% 9.32% ( 3.76%) ( 26.56%) 66.37% 9.10% 1.24% 15.45% 6.66% 6.34% 28.81% 6.84% ( 6.26%) ( 28.17%) 50.42% 7.44% 0.80% 13.36% 0.61% 4.10% 25.99% 5.24% ( 17.77%) ( 37.27%) 43.36% 7.30% 0.45% 7.70% 0.38% 1.43% 4.70% 4.95% ( 17.95%) ( 38.72%) 6.68% 4.28% ( 4.81%) 4.30% ( 8.16%) 0.41% 3.70% 0.98% ( 24.01%) ( 49.47%) 0.42% 0.49% ( 8.26%) 0.36% ( 9.84%) ( .27%)

04/15/2023 Investment Presentation 16/18
The benefits of Diversification.
What is your risk position?
The long-term returns of different sectors and their
antagonistic relationships.
Passive Investment strategies.
20 Year financial Landscape
Fixed Interest Rate Investment yields’
should go up! Fundamental interest
is currently approximately 0%.
Property: Capital value of commercial property could fall alongside rising interest rates.Property: But rising
new build costs invites inflation
proofing over the long term
Macro: Future equity values are uncertain due to competition
turbulence.
SummaryThroughout this report, we have proposed a wide array of considerations. Yet at all times, we have made an explicit effort to retain a perspective centred around the Client’s best interests. The foundation to our evaluation has subsequently been based on the following:
Investment Forecast Sectors

04/15/2023 Investment Presentation 17/17
Disclosure and Fund Information
The graphs and schedules within this presentation would not have been possible without access to the Dimensional Fund Advisors Ltd back tested database of funds. The funds we have used were somewhat restricted due to the desire to show 20 years performance (many indices are only 5 to 10 years old). The specific indices we have used are:
Citigroup World Government Bond Index 1-30+ Years (hedged)Dimensional Global Short-Dated Bond Index (gross of fees, hedged in )Dimensional Small Cap IndexDimensional Value IndexFTSE 100 IndexFTSE All-Share IndexMSCI Emerging Markets Index (gross div.)MSCI World ex UK Index (gross div.)S&P Global Property Index (gross div.)S&P Global REIT Index (gross div.)One-Month Treasury BillsRetail Price Index
In addition we have used Bank of England data concerning interest rates and related issues. Wherever possible we have included dividend income in the returns so as to compare all investments on a like for like basis.
• We have taken no account of charges (except in our comments re active fund managers) although clearly charges have a major effect on long term performance.
• We have taken no account of taxation within our figures. At present in the UK capital gains tax is at a maximum of 28% and income tax is at a maximum of 45%. This makes a colossal difference to the end return on your investments.
• Performance data shown represents past performance. Past performance is no guarantee of future results and current performance may be higher or lower than the performance shown.
And finally, whilst we have tried our best to ensure that we have presented you with an accurate and well reasoned presentation any advice we give to clients must be client specific and not of a generalised nature. E.&.O.E.

Thank You