May 14, 2010
133
May 14, 2010 PHILIPPINE STOCK EXCHANGE Listing and Disclosure Department Exchange Road, Ortigas Center, Pasig City Attention: Ms. Janet A. Encarnacion Head, Disclosure Department Subject: Vista Land & Lifescapes, Inc.: Definitive Information Statement Gentlemen: Please see attached SEC Form 20-IS, Definitive Information Statement filed today for the Company’s Annual Stockholders’ Meeting on June 15, 2010. Very truly yours, BRIAN N. EDANG Officer-in-Charge
Transcript of May 14, 2010

May 14, 2010 PHILIPPINE STOCK EXCHANGE Listing and Disclosure Department Exchange Road, Ortigas Center, Pasig City Attention: Ms. Janet A. Encarnacion Head, Disclosure Department Subject: Vista Land & Lifescapes, Inc.: Definitive Information Statement Gentlemen: Please see attached SEC Form 20-IS, Definitive Information Statement filed today for the Company’s Annual Stockholders’ Meeting on June 15, 2010. Very truly yours, BRIAN N. EDANG Officer-in-Charge

COVER SHEET
C S 2 0 0 7 0 3 1 4 5S.E.C. Registration Number
V I S T A L A N D & L I F E S C A P E S , I N C .
(Registrant’s Full Name)
L A S P I N A S B U S I N E S S C E N T E RN A T I O N A L R O A D , T A L O N , L A SP I N A S C I T Y
(Business Address: No. Street/City/Province)
Brian N. Edang 887-2264 loc 107
Contact Person Registrant Telephone Number
1 2 3 1 20-IS
Definitive Information Statement
0 6 1 5
Month Day FORM TYPE Month Day Calendar Year Annual Meeting
Secondary License Type, If Applicable
Dept. Requiring this Doc. Amended Articles Number/Section
Total Amount of Borrowings
Total No. of Stockholders Domestic Foreign
---------------------------------------------------------------------------------------------------------- To be accomplished by SEC Personnel concerned
File Number LCU
Document I.D. Cashier

On the Security Ownership of Certain Beneficial Owners, page 4, we have consolidated the shareholdings of Fine Properties, Inc. and Adelfa Properties, Inc. under the name of Fine Properties, Inc. and added a footnote explaining that said consolidation is on account of the merger of the two companies which took effect on March 30, 2010. We hope you will find the attached DIS and the foregoing explanatory notes in order and clear this DIS for release to the shareholders of the Company soonest. Thank you very much. Very truly yours,
RICARDO B. TAN, JR. Compliance Officer & CIO


2
SECURITIES AND EXCHANGE COMMISSION
SEC FORM 20-IS
INFORMATION STATEMENT PURSUANT TO SECTION 20 OF THE SECURITIES REGULATION CODE
1. Check the appropriate box:
[ ] Preliminary Information Statement [X] Definitive Information Statement
2. Name of Registrant as specified in its charter: VISTA LAND & LIFESCAPES, INC. 3. Philippines Province, country or other jurisdiction of incorporation or organization 4. SEC Identification Number CS200703145 5. BIR Tax Identification Code 006-652-678-000 6. 3rd Level Starmall Las Piñas C.V. Starr Avenue, Philamlife Village, Pamplona, Las Piñas City 1746 . Address of principal office Postal Code
7. Registrant’s telephone number, including area code (632) 874-5758 / (632) 872-6947 8. Date, time and place of the meeting of security holders June 15, 2010, 9:00 a.m. Monte di Portofino, Portofino Subdivision, Daang Hari, Las Piñas City 9. Approximate date on which the Information Statement is first to be sent or given to security
holders May 21, 2010 10. Securities registered pursuant to Sections 8 and 12 of the Code or Sections 4 and 8 of the
RSA: Title of Each Class Number of Shares of Common Stock Outstanding or Amount of Debt Outstanding Common Shares (3/31/2010) 8,538,740,614 Shares 11. Are any or all of registrant's securities listed in a Stock Exchange? Yes __x____ No _______
The Registrant’s common shares are listed on the Philippine Stock Exchange.
WE ARE NOT ASKING YOU FOR A PROXY AND YOU ARE REQUESTED NOT TO SEND US A PROXY

3
PART I
INFORMATION STATEMENT GENERAL INFORMATION Date, time and place of meeting of security holders. Date: June 15, 2010 Time: 9:00 a.m. Place: Monte di Portofino, Portofino Subdivision, Daang Hari, Las Piñas City The corporate mailing address of the principal office of the Registrant is 3rd Level Starmall Las Piñas C.V. Starr Avenue, Philamlife Village, Pamplona, Las Piñas City, Philippines. This Information Statement shall be sent to security holders as soon as practicable after the approval hereof by the Securities and Exchange Commission, but not later than May 21, 2010.
Dissenters' Right of Appraisal There are no corporate matters or action that will entitle a shareholder to exercise a right of appraisal as provided under Section 81, Title X, of the Corporation Code of the Philippines (“Corporation Code”). Any stockholder of the Registrant shall have the right to dissent and demand payment of the fair value of his shares only in the following instances, as provided by the Corporation Code:
(1) In case any amendment to the articles of incorporation has the effect of changing or restricting the rights of any stockholder or class of shares, or of authorizing preferences in any respect superior to those outstanding shares of any class, or of extending or shortening the term of corporate existence;
(2) In case of sale, lease, exchange, transfer, mortgage, pledge or other disposition of all or substantially all of the corporate property and assets;
(3) In case of merger or consolidation; and (4) In case of investments in another corporation, business or purpose.
The appraisal right, when available, may be exercised by any stockholder who shall have voted against the proposed corporate action, by making a written demand on the corporation within thirty (30) days after the date on which the vote was taken, for payment of the fair value of his shares; Provided, That failure to make the demand within such period shall be deemed a waiver of the appraisal right. A stockholder must have voted against the proposed corporate action in order to avail himself of the appraisal right. If the proposed corporate action is implemented or effected, the corporation shall pay to such stockholder upon surrender of his certificate(s) of stock representing his shares, the fair value thereof as of the day prior to the date on which the vote was taken, excluding any appreciation or depreciation in anticipation of such corporate action. If within a period of sixty (60) days from the date the corporate action was approved by the stockholders, the withdrawing stockholder and the corporation cannot agree on the fair value of the shares, it shall be determined and appraised by three (3) disinterested persons, one of whom shall be named by the stockholder, another by the corporation and the third by the two thus chosen. The findings of the majority of appraisers shall be final, and their award shall be paid by the corporation within thirty (30) days after such award is made: Provided, that no payment shall be made to any dissenting stockholder unless the corporation has unrestricted retained earnings in its books to cover such payment; and Provided, Further, That upon payment by the corporation of the agreed or awarded price, the stockholder shall forthwith transfer his shares to the corporation.
4
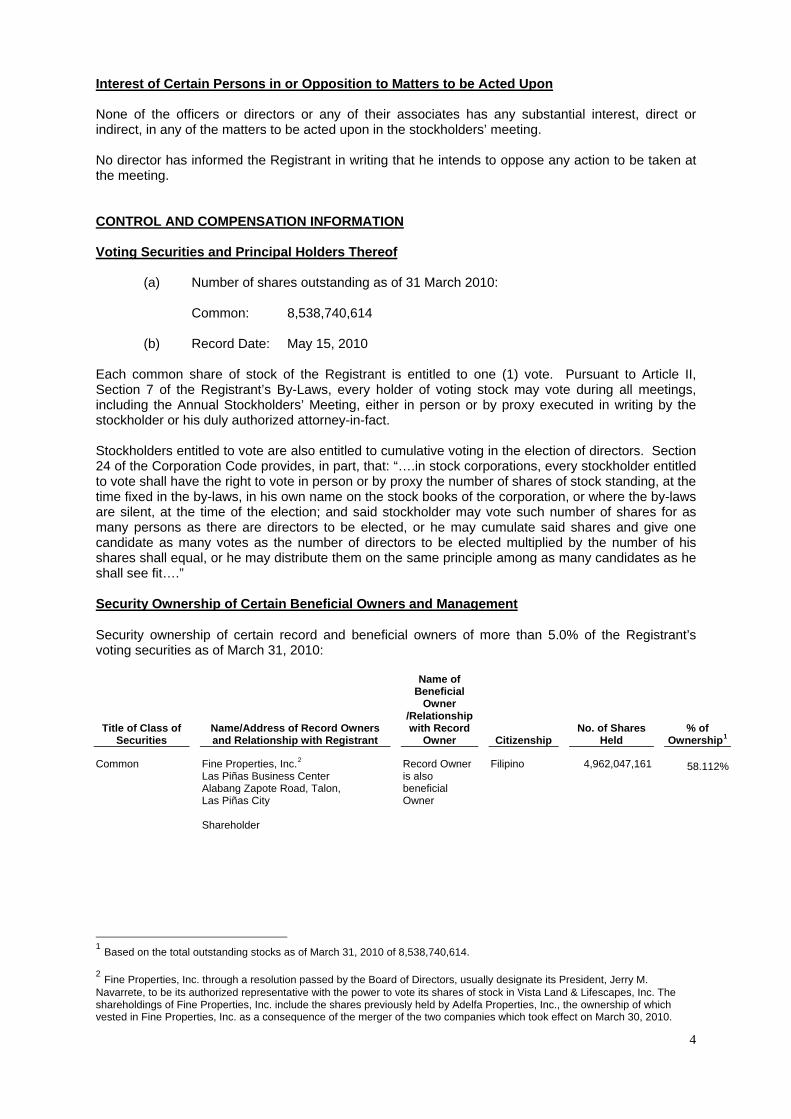
Interest of Certain Persons in or Opposition to Matters to be Acted Upon None of the officers or directors or any of their associates has any substantial interest, direct or indirect, in any of the matters to be acted upon in the stockholders’ meeting. No director has informed the Registrant in writing that he intends to oppose any action to be taken at the meeting. CONTROL AND COMPENSATION INFORMATION
Voting Securities and Principal Holders Thereof
(a) Number of shares outstanding as of 31 March 2010:
Common: 8,538,740,614 (b) Record Date: May 15, 2010 Each common share of stock of the Registrant is entitled to one (1) vote. Pursuant to Article II, Section 7 of the Registrant’s By-Laws, every holder of voting stock may vote during all meetings, including the Annual Stockholders’ Meeting, either in person or by proxy executed in writing by the stockholder or his duly authorized attorney-in-fact. Stockholders entitled to vote are also entitled to cumulative voting in the election of directors. Section 24 of the Corporation Code provides, in part, that: “….in stock corporations, every stockholder entitled to vote shall have the right to vote in person or by proxy the number of shares of stock standing, at the time fixed in the by-laws, in his own name on the stock books of the corporation, or where the by-laws are silent, at the time of the election; and said stockholder may vote such number of shares for as many persons as there are directors to be elected, or he may cumulate said shares and give one candidate as many votes as the number of directors to be elected multiplied by the number of his shares shall equal, or he may distribute them on the same principle among as many candidates as he shall see fit….” Security Ownership of Certain Beneficial Owners and Management
Security ownership of certain record and beneficial owners of more than 5.0% of the Registrant’s voting securities as of March 31, 2010:
Title of Class of Securities
Name/Address of Record Owners and Relationship with Registrant
Name of Beneficial
Owner /Relationship with Record
Owner Citizenship No. of Shares
Held % of
Ownership1
Common Fine Properties, Inc.2 Las Piñas Business Center Alabang Zapote Road, Talon, Las Piñas City Shareholder
Record Owner is also beneficial Owner
Filipino 4,962,047,161 58.112%
1 Based on the total outstanding stocks as of March 31, 2010 of 8,538,740,614. 2 Fine Properties, Inc. through a resolution passed by the Board of Directors, usually designate its President, Jerry M. Navarrete, to be its authorized representative with the power to vote its shares of stock in Vista Land & Lifescapes, Inc. The shareholdings of Fine Properties, Inc. include the shares previously held by Adelfa Properties, Inc., the ownership of which vested in Fine Properties, Inc. as a consequence of the merger of the two companies which took effect on March 30, 2010.
5
Title of Class of Securities
Name/Address of Record Owners and Relationship with Registrant
Name of Beneficial
Owner /Relationship with Record
Owner Citizenship No. of Shares
Held % of
Ownership3
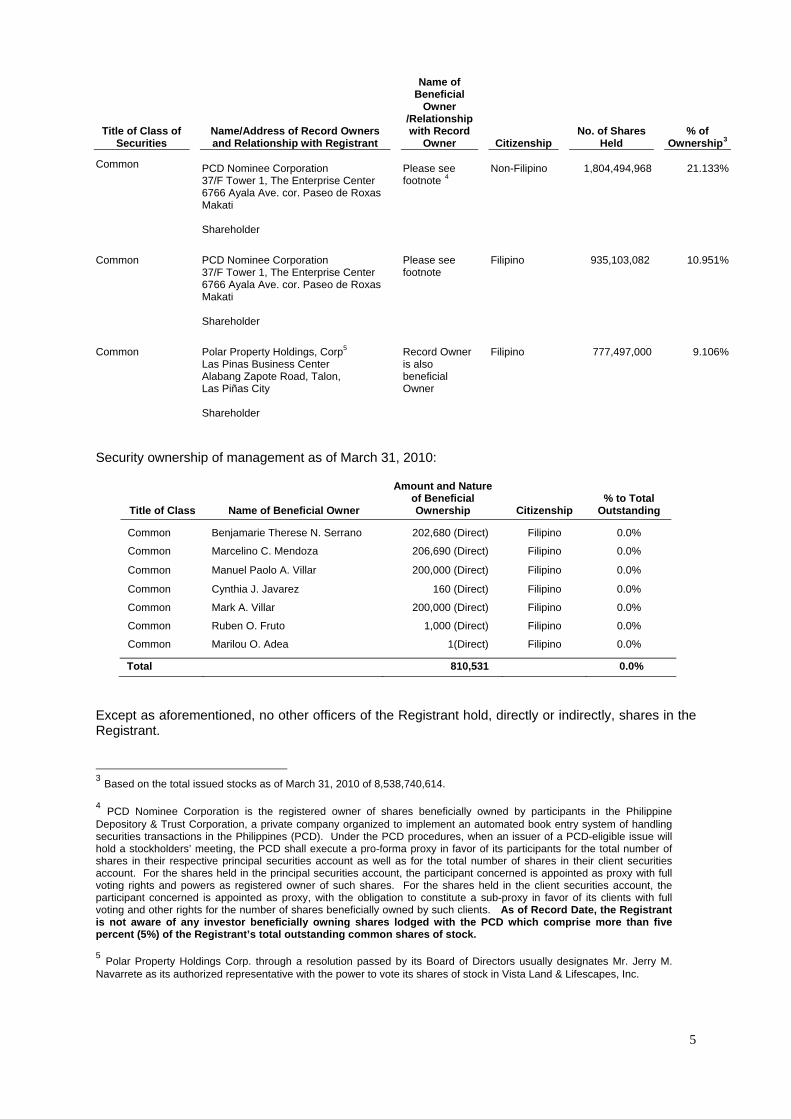
Common PCD Nominee Corporation 37/F Tower 1, The Enterprise Center 6766 Ayala Ave. cor. Paseo de Roxas Makati Shareholder
Please see footnote 4
Non-Filipino
1,804,494,968
21.133%
Common Common
PCD Nominee Corporation 37/F Tower 1, The Enterprise Center 6766 Ayala Ave. cor. Paseo de Roxas Makati Shareholder Polar Property Holdings, Corp5 Las Pinas Business Center Alabang Zapote Road, Talon, Las Piñas City Shareholder
Please see footnote Record Owner is also beneficial Owner
Filipino Filipino
935,103,082
777,497,000
10.951%
9.106%
Security ownership of management as of March 31, 2010:
Title of Class Name of Beneficial Owner
Amount and Nature of Beneficial Ownership Citizenship
% to Total Outstanding
Common Benjamarie Therese N. Serrano 202,680 (Direct) Filipino 0.0%
Common Marcelino C. Mendoza 206,690 (Direct) Filipino 0.0%
Common Manuel Paolo A. Villar 200,000 (Direct) Filipino 0.0%
Common Cynthia J. Javarez 160 (Direct) Filipino 0.0%
Common Mark A. Villar 200,000 (Direct) Filipino 0.0%
Common Ruben O. Fruto 1,000 (Direct) Filipino 0.0%
Common Marilou O. Adea 1(Direct) Filipino 0.0%
Total 810,531 0.0%
Except as aforementioned, no other officers of the Registrant hold, directly or indirectly, shares in the Registrant. 3 Based on the total issued stocks as of March 31, 2010 of 8,538,740,614. 4 PCD Nominee Corporation is the registered owner of shares beneficially owned by participants in the Philippine Depository & Trust Corporation, a private company organized to implement an automated book entry system of handling securities transactions in the Philippines (PCD). Under the PCD procedures, when an issuer of a PCD-eligible issue will hold a stockholders’ meeting, the PCD shall execute a pro-forma proxy in favor of its participants for the total number of shares in their respective principal securities account as well as for the total number of shares in their client securities account. For the shares held in the principal securities account, the participant concerned is appointed as proxy with full voting rights and powers as registered owner of such shares. For the shares held in the client securities account, the participant concerned is appointed as proxy, with the obligation to constitute a sub-proxy in favor of its clients with full voting and other rights for the number of shares beneficially owned by such clients. As of Record Date, the Registrant is not aware of any investor beneficially owning shares lodged with the PCD which comprise more than five percent (5%) of the Registrant’s total outstanding common shares of stock. 5 Polar Property Holdings Corp. through a resolution passed by its Board of Directors usually designates Mr. Jerry M. Navarrete as its authorized representative with the power to vote its shares of stock in Vista Land & Lifescapes, Inc.

6
Changes in Control The Registrant is not aware of any voting trust agreements or any other similar agreements which may result in a change in control of the Registrant. No change in control of the Registrant has occurred since the beginning of its last fiscal year. Directors and Executive Officers of the Registrant Term of Office Each director holds office until the annual meeting of stockholders held next after his election and his successor shall have been elected and qualified, except in case of death, resignation, disqualification or removal from office. The term of office of the officers is coterminous with that of directors that elected or appointed them. Background Information The following are the names, ages and citizenship of the incumbent directors/independent directors of the Registrant:
Name Age Position Citizenship
Marcelino C. Mendoza 55 Chairman of the Board Filipino
Benjamarie Therese N. Serrano 47 Director, President & Chief Executive Officer Filipino
Manuel Paolo A. Villar 33 Director, Chief Financial Officer Filipino
Cynthia J. Javarez 46 Director, Controller Filipino
Mark A. Villar 31 Director Filipino
Ruben O. Fruto 71 Independent Director Filipino
Marilou O. Adea 59 Independent Director Filipino
The following are the names, ages, positions and citizenship of the incumbent officers and advisors of the Registrant:
Name Age Position Citizenship
Gemma M. Santos 47 Corporate Secretary Filipino
Maribeth C. Tolentino 44 Managing Director of Camella Homes Filipino
Jerylle Luz C. Quismundo 46 Managing Director of Communities Philippines Filipino
Mary Lee S. Sadiasa 40 Managing Director of Brittany and Crown Asia Filipino
The following states the business experience of the incumbent directors and officers of the Registrant for the last five (5) years:
Marcelino C. Mendoza, Chairman of the Board. Mr. Mendoza, 55, is the Chief Operating Officer of MGS Corporation. He was President of Camella Homes, Inc. from 2001 to 2003, and Chief Operating Officer of Communities Philippines, Inc. from 1992 to 1995. He has a Masters Degree in Business Administration (Ateneo de Manila University) and a Certificate in Advance Course in Successful Communities from the Harvard University Graduate School of Design. Mr. Mendoza is a member of the Phi Kappa Phi International Honor Society. Well respected in the Philippine real estate industry, Mr. Mendoza has served as President and Chairman of the Board (1996 to 1998) and Board Adviser (1999 to present) of the Subdivision and Housing Developers Association (SHDA).
Benjamarie Therese N. Serrano, Director, President & Chief Executive Officer. Ms. Serrano, 47, graduated from the University of Philippines with a degree of Bachelor of Arts in Economics and from the Asian Institute of Management with a degree of Master of Business Management. She is presently the President and Chief Executive Officer of Vista Land. She has been President of Brittany Corporation since 2004 up to the present. She was Chief Operating Officer of Crown Asia from 1995 to 2003 after holding various other positions in the MB Villar Group of Companies since 1991. She was also connected with the AFP Retirement and Separation Benefits System from 1985 to 1988.
7
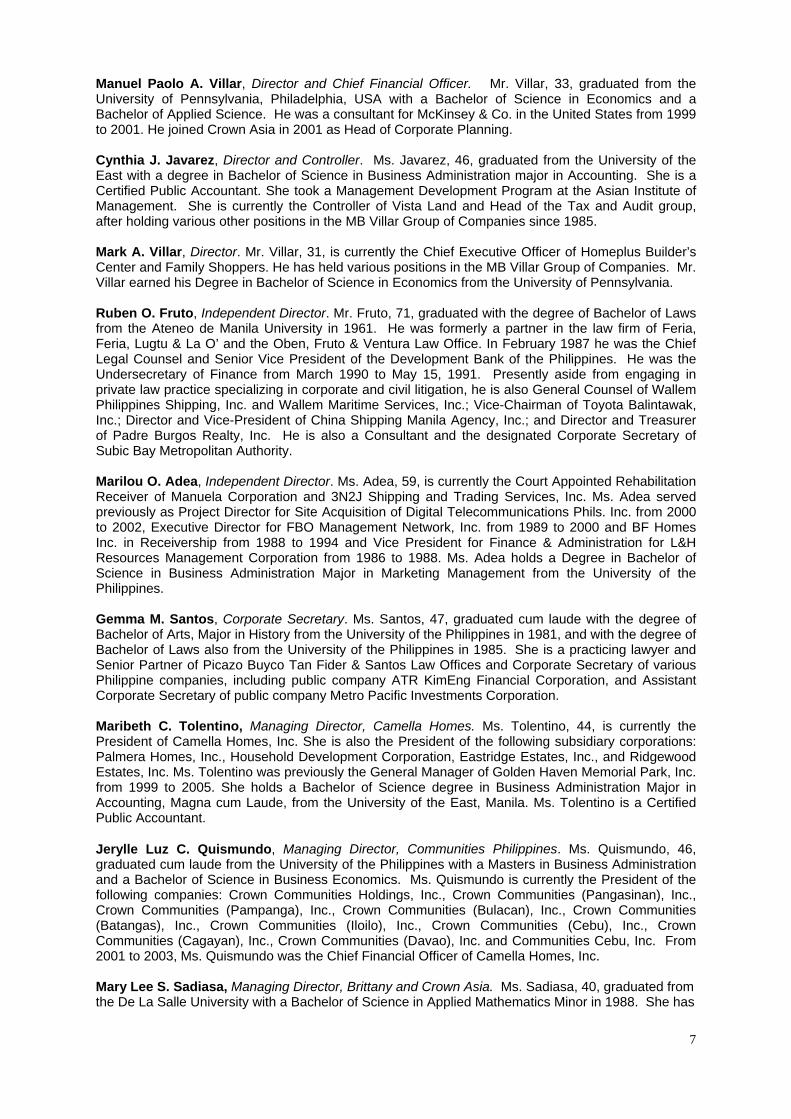
Manuel Paolo A. Villar, Director and Chief Financial Officer. Mr. Villar, 33, graduated from the University of Pennsylvania, Philadelphia, USA with a Bachelor of Science in Economics and a Bachelor of Applied Science. He was a consultant for McKinsey & Co. in the United States from 1999 to 2001. He joined Crown Asia in 2001 as Head of Corporate Planning. Cynthia J. Javarez, Director and Controller. Ms. Javarez, 46, graduated from the University of the East with a degree in Bachelor of Science in Business Administration major in Accounting. She is a Certified Public Accountant. She took a Management Development Program at the Asian Institute of Management. She is currently the Controller of Vista Land and Head of the Tax and Audit group, after holding various other positions in the MB Villar Group of Companies since 1985. Mark A. Villar, Director. Mr. Villar, 31, is currently the Chief Executive Officer of Homeplus Builder’s Center and Family Shoppers. He has held various positions in the MB Villar Group of Companies. Mr. Villar earned his Degree in Bachelor of Science in Economics from the University of Pennsylvania. Ruben O. Fruto, Independent Director. Mr. Fruto, 71, graduated with the degree of Bachelor of Laws from the Ateneo de Manila University in 1961. He was formerly a partner in the law firm of Feria, Feria, Lugtu & La O’ and the Oben, Fruto & Ventura Law Office. In February 1987 he was the Chief Legal Counsel and Senior Vice President of the Development Bank of the Philippines. He was the Undersecretary of Finance from March 1990 to May 15, 1991. Presently aside from engaging in private law practice specializing in corporate and civil litigation, he is also General Counsel of Wallem Philippines Shipping, Inc. and Wallem Maritime Services, Inc.; Vice-Chairman of Toyota Balintawak, Inc.; Director and Vice-President of China Shipping Manila Agency, Inc.; and Director and Treasurer of Padre Burgos Realty, Inc. He is also a Consultant and the designated Corporate Secretary of Subic Bay Metropolitan Authority. Marilou O. Adea, Independent Director. Ms. Adea, 59, is currently the Court Appointed Rehabilitation Receiver of Manuela Corporation and 3N2J Shipping and Trading Services, Inc. Ms. Adea served previously as Project Director for Site Acquisition of Digital Telecommunications Phils. Inc. from 2000 to 2002, Executive Director for FBO Management Network, Inc. from 1989 to 2000 and BF Homes Inc. in Receivership from 1988 to 1994 and Vice President for Finance & Administration for L&H Resources Management Corporation from 1986 to 1988. Ms. Adea holds a Degree in Bachelor of Science in Business Administration Major in Marketing Management from the University of the Philippines. Gemma M. Santos, Corporate Secretary. Ms. Santos, 47, graduated cum laude with the degree of Bachelor of Arts, Major in History from the University of the Philippines in 1981, and with the degree of Bachelor of Laws also from the University of the Philippines in 1985. She is a practicing lawyer and Senior Partner of Picazo Buyco Tan Fider & Santos Law Offices and Corporate Secretary of various Philippine companies, including public company ATR KimEng Financial Corporation, and Assistant Corporate Secretary of public company Metro Pacific Investments Corporation. Maribeth C. Tolentino, Managing Director, Camella Homes. Ms. Tolentino, 44, is currently the President of Camella Homes, Inc. She is also the President of the following subsidiary corporations: Palmera Homes, Inc., Household Development Corporation, Eastridge Estates, Inc., and Ridgewood Estates, Inc. Ms. Tolentino was previously the General Manager of Golden Haven Memorial Park, Inc. from 1999 to 2005. She holds a Bachelor of Science degree in Business Administration Major in Accounting, Magna cum Laude, from the University of the East, Manila. Ms. Tolentino is a Certified Public Accountant.
Jerylle Luz C. Quismundo, Managing Director, Communities Philippines. Ms. Quismundo, 46, graduated cum laude from the University of the Philippines with a Masters in Business Administration and a Bachelor of Science in Business Economics. Ms. Quismundo is currently the President of the following companies: Crown Communities Holdings, Inc., Crown Communities (Pangasinan), Inc., Crown Communities (Pampanga), Inc., Crown Communities (Bulacan), Inc., Crown Communities (Batangas), Inc., Crown Communities (Iloilo), Inc., Crown Communities (Cebu), Inc., Crown Communities (Cagayan), Inc., Crown Communities (Davao), Inc. and Communities Cebu, Inc. From 2001 to 2003, Ms. Quismundo was the Chief Financial Officer of Camella Homes, Inc. Mary Lee S. Sadiasa, Managing Director, Brittany and Crown Asia. Ms. Sadiasa, 40, graduated from the De La Salle University with a Bachelor of Science in Applied Mathematics Minor in 1988. She has

8
held various positions in the MB Villar Group of Companies from 1988 until she assumed the position of Division Head of Brittany Corporation since 2005. All of the incumbent Directors named above, have one year term of office and have been nominated for re-election to the Board of Directors. The By-Laws of the Registrant conforms with SRC Rule 38, as amended, with regard to the nomination of independent directors of the Registrant. Article III, Sections 2-A and 3 of the Registrant’s By-Laws provide as follows:
“Section 2-A. Independent Directors – The Corporation shall have at least two (2)
independent directors or at least twenty percent (20%) of the entire Board membership, whichever is lesser.
The independent directors shall have all the qualifications and none of the
disqualifications set forth in Section 38 of the Securities Regulation Code and its Implementing Rules and Regulations, as the same may be amended from time to time. [As approved by the Board of Directors and the Stockholders at their respective meetings held on 16 March 2007].
Section 3. Election and Term - The Board of Directors shall be elected during
each regular meeting of stockholders and shall hold office for one (1) year and until their successors are elected and qualified.
A nomination committee is hereby created which may be organized from time to
time upon determination of the Board of Directors. The nomination committee shall be composed of at least three (3) members, one of whom shall be an independent director. The nomination committee shall have the following functions: (A) formulate screening policies to enable the committee to effectively review the qualification of the nominees for independent directors; and (B) conduct nominations for independent directors prior to the stockholders’ meeting in accordance with the procedures set forth in Rule 38 of the Amended Implementing Rules and Regulations of the Securities Regulation Code, as the same may be amended from time to time. [As approved by the Board of Directors and the Stockholders at their respective meetings held on 16 March 2007].”
On the other hand, SRC Rule 38, as amended, provides in part as follows:
“8. Nomination and Election of Independent Director/s The following rules shall be applicable to all covered companies: A. The Nomination Committee (the "Committee") shall have at least three (3)
members, one of whom is an independent director. It shall promulgate the guidelines or criteria to govern the conduct of the nomination. The same shall be properly disclosed in the Registrant's information or proxy statement or such other reports required to be submitted to the Commission.
B. Nomination of independent director/s shall be conducted by the Committee prior to a stockholders' meeting. All recommendations shall be signed by the nominating stockholders together with the acceptance and conformity by the would-be nominees.
C. The Committee shall pre-screen the qualifications and prepare a final list of all candidates and put in place screening policies and parameters to enable it to effectively review the qualifications of the nominees for independent director/s.
D. After the nomination, the Committee shall prepare a Final List of Candidates which shall contain all the information about all the nominees for independent directors, as required under Part IV (A) and (C) of Annex "C" of SRC Rule 12, which list, shall be made available to the Commission and to all stockholders through the filing and distribution of the Information Statement, in accordance with SRC Rule 20, or in such other reports the Registrant is required to submit to the Commission. The name of the person or group of persons who recommended the nomination of the independent director shall be identified in such report including any relationship with the nominee.
E. Only nominees whose names appear on the Final List of Candidates shall be eligible for election as Independent Director/s. No other nominations shall be entertained after the Final List of Candidates shall have been prepared. No further nominations shall be entertained or allowed on the floor during the actual annual stockholders'/memberships' meeting.”
9
The Registrant has complied with the guidelines on the nomination and election of independent directors set forth in Rule 38 of the Amended Implementing Rules and Regulations of the Securities Regulation Code. The nominated independent directors, namely, Mr. Ruben O. Fruto and Ms. Marilou Adea were duly nominated by Ms. Evelyn Guerrero, a registered shareholder of the Registrant who is not a director, officer or substantial shareholder of the Registrant and who is not related to either of the said nominees. The Nominations Committee of the Registrant is composed of Mr. Marcelino Mendoza, Chairman, and Messrs. Mark Villar and Ruben Fruto, members. Directors elected during the annual meeting of stockholders will hold office for one year until their successors are duly elected and qualified. A director who was elected to fill any vacancy holds office only for the unexpired term of his predecessor. No Director has resigned or declined to stand for re-election to the Board of Directors since the date of the last annual stockholders’ meeting due to disagreement with the Registrant on any matter relating to the Registrant’s operations, policies or practices. The Registrant has no other significant employee other than its Executive Officers. Mr. Manuel Paolo A. Villar and Mr. Mark A. Villar, who are both directors of the Registrant, are siblings. Except for said relationship, none of the aforementioned Directors or Executive Officers is related to the others by consanguinity or affinity within the fourth civil degree. Except as disclosed in the Annual Report of the Registrant (SEC Form 17-A) for the year ended December 31, 2009, the Registrant has not had any transaction during the last two (2) years in which any Director or Executive Officer or any of their immediate family members had a direct or indirect interest. None of the aforementioned Directors or Executive Officers is or has been involved in any criminal or bankruptcy proceeding, or is or has been subject to any judgment of a competent court barring or otherwise limiting his involvement in any type of business, or has been found to have violated any securities laws during the past five (5) years and up to the latest date. Compensation of Directors and Executive Officers Executive Compensation
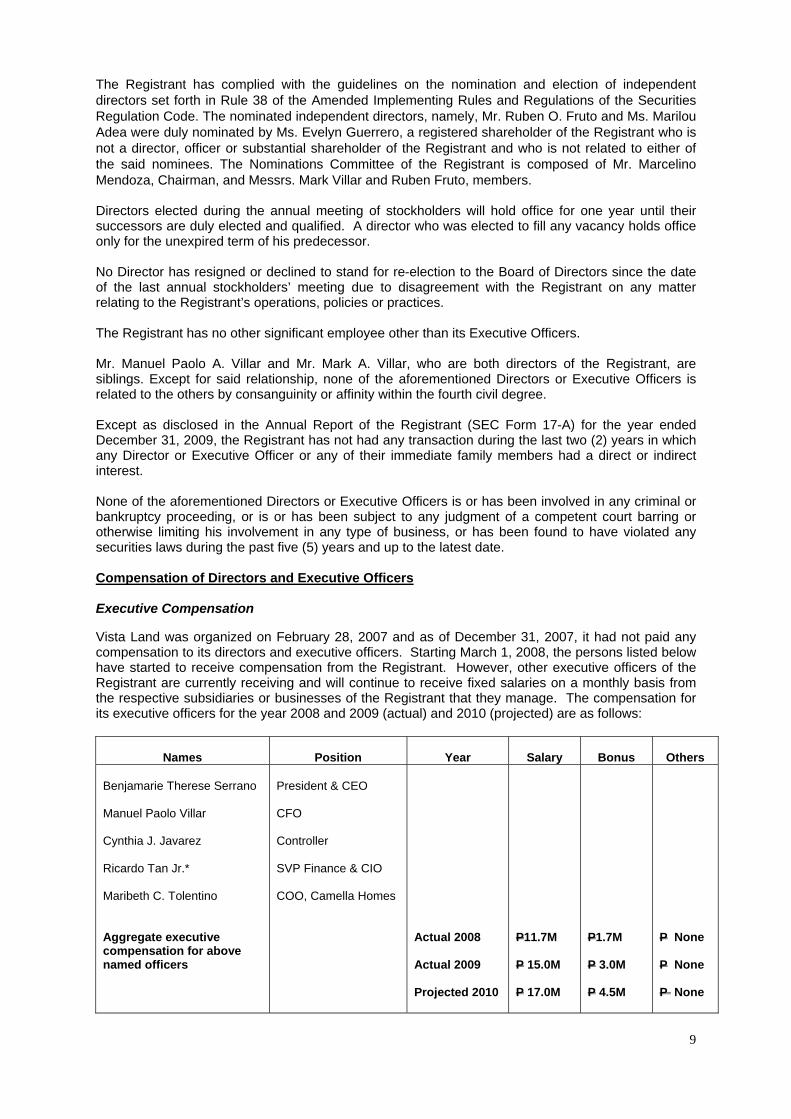
Vista Land was organized on February 28, 2007 and as of December 31, 2007, it had not paid any compensation to its directors and executive officers. Starting March 1, 2008, the persons listed below have started to receive compensation from the Registrant. However, other executive officers of the Registrant are currently receiving and will continue to receive fixed salaries on a monthly basis from the respective subsidiaries or businesses of the Registrant that they manage. The compensation for its executive officers for the year 2008 and 2009 (actual) and 2010 (projected) are as follows:
Names Position Year Salary
Bonus Others
Benjamarie Therese Serrano Manuel Paolo Villar Cynthia J. Javarez Ricardo Tan Jr.* Maribeth C. Tolentino Aggregate executive compensation for above named officers
President & CEO CFO Controller SVP Finance & CIO COO, Camella Homes
Actual 2008 Actual 2009 Projected 2010
P11.7M P 15.0M P 17.0M
P1.7M P 3.0M P 4.5M
P None P None P None

10
Aggregate compensation of all other officers and directors, unnamed
Actual 2008 Actual 2009 Projected 2010
P74.5M P85.3M P93.8M
P10.1M P11.6M P12.7M
P−None P−None P−None
*Effective January 22, 2008
Standard arrangements
Other than payment of reasonable per diem of P=20,000 per non-executive director for every meeting, there are no standard arrangements pursuant to which directors of the Company are compensated, or are to be compensated, directly or indirectly by the Company’s subsidiaries, for any services provided as a director for 2008 and 2009.
Other arrangements
There are no other arrangements pursuant to which any director of the Company was compensated, or is to be compensated, directly or indirectly by the Company’s subsidiaries, during 2008 or 2009 for any service provided as a director.
Employment contract between the company and executive officers
There are no special employment contracts between Vista Land and the named executive officers.
Warrants and options held by the executive officers and directors
There are no outstanding warrants or options held by the Company’s CEO, the named executive officers, and all officers and directors as a group.
Significant employee While the Company values the contribution of each of its executive and non-executive employees, the Company believes there is no non-executive employee that the resignation or loss of whom would have a material adverse impact on the business of the Company. Other than standard employment contracts, there are no special arrangements with non-executive employees of the Company. Independent Public Accountants The auditing firm of SGV & Co. is being recommended for election as external auditor for the current year.
Representatives of the said firm are expected to be present at the annual stockholders’ meeting and will have the opportunity to make a statement if they desire to do so, and are expected to be available to respond to appropriate questions. In 2009, the Registrant’s auditors did not perform any substantial non-audit services for the Registrant. Changes in and Disagreement with Accountants on Accounting and Financial Disclosure Since the incorporation of the Registrant in 2007, there was no instance where the Registrant’s public accountants resigned or indicated that they decline to stand for re-election or were dismissed nor was there any instance where the Registrant had any disagreement with its public accountants on any accounting or financial disclosure issue. The 2009 audit of the Registrant is in compliance with paragraph (3)(b)(iv) of SRC Rule 68, as amended, which provides that the external auditor should be rotated, or the handling partner changed, every five (5) years or earlier.

11
For Changes in Accounting Policies, refer to Note 2 - Summary of Significant Accounting Policies under Changes in Accounting Policies and Disclosures discussion on the Consolidated Financial Statements as of and for the years ended December 31, 2007, 2008 and 2009 included in this report. Audit Committee’s Approval Policies and Procedures
In relation to the audit of the Registrant's annual financial statements, the Registrant's Corporate Governance Manual provides that the audit committee shall, among other activities, (i) evaluate significant issues reported by the external auditors in relation to the adequacy, efficiency and effectiveness of policies, controls, processes and activities of the Registrant; (ii) ensure that other non-audit work provided by the external auditors are not in conflict with their functions as external auditors; and (iii) ensure the compliance of the Registrant with acceptable auditing and accounting standards and regulations. The Audit Committee of the Registrant is composed of Ms. Marilou Adea, Chairman, and Mr. Ruben Fruto and Ms. Cynthia Javarez, members. Audit and Audit-Related Fees The following table sets out the aggregate fees billed for each of the last two years for professional services rendered by SGV & Co.
2008 2009 (In P Thousands) Audit and Audit-Related Fees:
Fees for services that are normally provided by the external auditor in connection with statutory and regulatory filings or engagements P10,000 P 11,000
All other fees ̶ ̶Total P10,000 P 11,000
SGV & Co. does not have any direct or indirect interest in the Company
Tax Fees Except as provided above, the Registrant did not pay any tax fees and other fees to its external auditors. OTHER MATTERS Action with Respect to Reports The following reports will be submitted for approval by the stockholders: 1. The President's Report; and 2. Audited Financial Statements for the year 2009. Other Proposed Actions 1. Ratification of all acts and resolutions of the Board of Directors and Management for the year
2009 as set forth in the minutes of the meetings of the Board of Directors held during the same period and in the disclosures that have been duly filed with the SEC and the PSE. These minutes cover various resolutions of the Board, including those approving the extension of the share buyback program of the Registrant, authorizing the acquisition of Vista Residences, Inc. (formerly Polar Mines Realty Ventures, Inc.) in exchange for treasury shares of the Registrant, declaring cash dividend, authorizing the opening of bank accounts and securities trading accounts and designating the Registrant’s authorized signatories for various transactions in the normal course of business of the Registrant.
2. Election of External Auditors.

12
Voting Procedures Manner of voting
In all items for approval, except in the election of directors, each share of stock entitles its registered owner to one vote. For the purpose of electing directors, a stockholder may vote such number of his shares for as many persons as there are directors to be elected or he may cumulate said shares and give one candidate as many votes as the number of directors to be elected multiplied by the number of his shares shall equal, or he may distribute them in the same principle among as many candidates as he shall see fit. Unless required by law, or demanded by a stockholder present or represented at the meeting and entitled to vote thereat, voting need not be by ballot and will be done by show of hands.
Voting requirements
(a) With respect to the election of directors, candidates who received the highest number of
votes shall be declared elected. (b) With respect to the adoption of the Audited Financial Statements for the year ended 31
December 2009, as well as the approval or ratification of the other actions set forth under the heading “Other Proposed Actions” above, the vote of majority of the outstanding capital stock entitled to vote and represented in the meeting is required to approve such matters.
Method of counting votes The Corporate Secretary will be responsible for counting votes based on the number of shares entitled to vote owned by the stockholders who are present or represented by proxies at the Annual Meeting of the stockholders. UPON THE WRITTEN REQUEST OF A STOCKHOLDER, THE REGISTRANT UNDERTAKES TO FURNISH SAID STOCKHOLDER A COPY OF SEC FORM 17-A FREE OF CHARGE, EXCEPT FOR EXHIBITS ATTACHED THERETO WHICH SHALL BE CHARGED AT COST. ANY WRITTEN REQUEST FOR A COPY OF SEC FORM 17-A SHALL BE ADDRESSED AS FOLLOWS:
Vista Land & Lifescapes, Inc. 3rd Level Starmall Las Piñas C.V. Starr Avenue, Philamlife Village, Pamplona,
Las Piñas City, Philippines
Attention: Brian N. Edang
13
PART II
MANAGEMENT REPORT I. FINANCIAL STATEMENTS The Consolidated Financial Statements of the Registrant as of and for the year ended December 31, 2009 are incorporated herein in the accompanying Index to Financial Statements and Supplementary Schedules. II. INFORMATION ON INDEPENDENT ACCOUNTANT
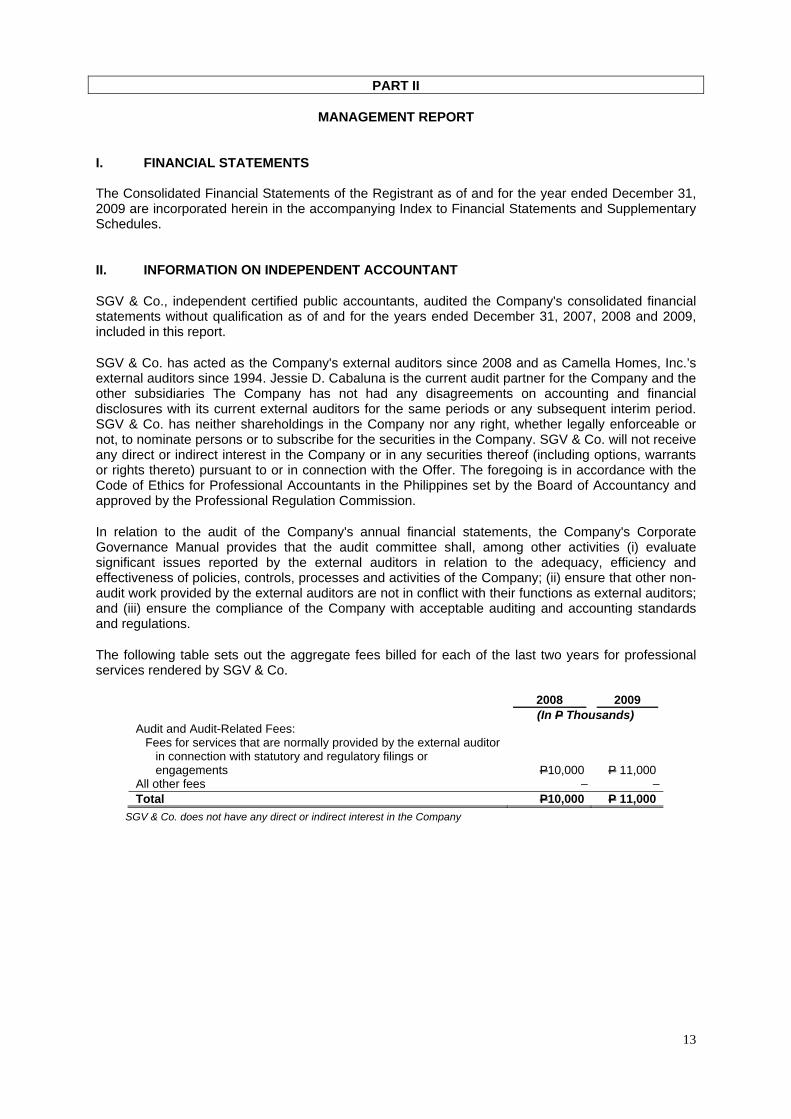
SGV & Co., independent certified public accountants, audited the Company's consolidated financial statements without qualification as of and for the years ended December 31, 2007, 2008 and 2009, included in this report.
SGV & Co. has acted as the Company's external auditors since 2008 and as Camella Homes, Inc.’s external auditors since 1994. Jessie D. Cabaluna is the current audit partner for the Company and the other subsidiaries The Company has not had any disagreements on accounting and financial disclosures with its current external auditors for the same periods or any subsequent interim period. SGV & Co. has neither shareholdings in the Company nor any right, whether legally enforceable or not, to nominate persons or to subscribe for the securities in the Company. SGV & Co. will not receive any direct or indirect interest in the Company or in any securities thereof (including options, warrants or rights thereto) pursuant to or in connection with the Offer. The foregoing is in accordance with the Code of Ethics for Professional Accountants in the Philippines set by the Board of Accountancy and approved by the Professional Regulation Commission.
In relation to the audit of the Company's annual financial statements, the Company's Corporate Governance Manual provides that the audit committee shall, among other activities (i) evaluate significant issues reported by the external auditors in relation to the adequacy, efficiency and effectiveness of policies, controls, processes and activities of the Company; (ii) ensure that other non-audit work provided by the external auditors are not in conflict with their functions as external auditors; and (iii) ensure the compliance of the Company with acceptable auditing and accounting standards and regulations.
The following table sets out the aggregate fees billed for each of the last two years for professional services rendered by SGV & Co.
2008 2009 (In P Thousands) Audit and Audit-Related Fees:
Fees for services that are normally provided by the external auditor in connection with statutory and regulatory filings or engagements
P10,000 P 11,000
All other fees ̶ ̶Total P10,000 P 11,000
SGV & Co. does not have any direct or indirect interest in the Company

14
III. MANAGEMENT’S DISCUSSION AND ANALYSIS OR PLAN OF OPERATION REVIEW OF YEAR END 2009 VS YEAR END 2008 RESULTS OF OPERATIONS Revenues Real Estate The Company recorded revenue from real estate sales of P=9,629.7 million in the year ended December 31, 2009, a decrease of 8% from P=10,435.8 million in same period last year. This was primarily attributable to the decline in the sales take up starting 3rd quarter of 2008 where most of the revenue for the year 2009 came from and the effect of the extension of the payment period for the buyer’s equity from 12 months to 18 months which was introduced last year. The Company uses the Percentage of completion method of revenue recognition where revenue is recognized in reference to the stages of development of the properties.
• Real estate revenue of Camella Homes decreased by 23% to P=2,884.13 million in the year ended December 31, 2009 from P=3,726.0 million in the year ended December 31, 2008. This was primarily attributable to the decline in the sales take up starting 3rd quarter of 2008 where most of the revenue for the year ended 2009 came from and the effect of the extension of the payment period for the buyer’s equity from 12 months to 18 months which was introduced last year. Camella Homes caters to the affordable segment of the market.
• Real estate revenue of Communities Philippines increased to P=3,618.2 million in the year
ended December 31, 2009, an increase of 5% from P=3,463.2 million in the year ended December 31, 2008. This higher revenue was principally due to the increased completion of sold inventories for the year of the Company’s various projects from various areas outside Mega Manila.
• Real estate revenue of Crown Asia decreased by 23% to P=1,264.8 million in the year ended December 31, 2009 from P=1,632.2 million in the year ended December 31, 2008. The decrease in the revenue was primarily attributable to the decline in the sales take up starting 3rd quarter of 2008 where most of the revenue for the year ended of 2009 came from and the effect of the extension of the payment period for the buyer’s equity from 12 months to 18 months which was introduced last year. Crown Asia is Vista Land’s business unit for the middle income segment of the market
• Real estate revenue of Brittany decreased by 16% to P=1,352.5 million in the year ended December 31, 2009 from P=1,614.4 million in the same period last year. The decrease in the revenue was primarily attributable to the decline in the sales take up starting 3rd quarter of 2008 where most of the revenue for the year ended of 2009 came from and the effect of the extension of the payment period for the buyer’s equity from 12 months to 18 months which was introduced last year. Brittany caters to the high-end segment of the market.
• Real estate revenue from Vista Residences for the year ended December 31, 2009 amounted to P=510.1 million.
Equity in net gain of an associate Equity in net gain of an associate increased by P=35.7 million due to the higher net income reported by an associate. Miscellaneous Miscellaneous income decreased by 18% to P=279.7 million in the year ended December 31, 2009 from P342.8 million in the year ended December 31, 2008 due to decrease in real estate sales deposit forfeitures.

15
Costs and Expenses Cost and expenses increased by 2% to P=8,000.0 million in the year ended December 31, 2009 from P7,856.6 million in the year ended December 31, 2008. Costs and Expenses as a percentage of real estate revenue increased from 75% in the year ended December 31, 2008 to 83% in the year ended December 31, 2009. The 2% net increase in the account was primarily attributable to the following:
• Cost of real estate sales decreased by 5% to P=5,004.0 million in the year ended December 31, 2009 from P5,273.0 million in the year ended December 31, 2008. This was primarily due to the decrease in the overall recorded sales of Vista Land’s business units.
• Interest and financing charges increased by 51% to P=593.0 million in the year ended
December 31, 2009 from P391.4 million in the year ended December 31, 2008. This was due to the increased level of interest bearing payables during the period.
• Unrealized foreign exchange loss decreased significantly from P=180.9 million in the year ended December 31, 2008 to P0.6 million in the year ended December 31, 2009 due to partial settlement of foreign currency denominated liability.
Loss on Settlement of Loan The Company recorded a loss on settlement of loan amounting to P318.8 million from the settlement of long-term notes amounting to P1,019.8 million (US $28.53 million) pertaining to unamortized discount. Provision for Income Tax Provision for income tax was P=513.5 million in the year ended December 31, 2009 and P=920.9 million in the year ended December 31, 2008 representing a decrease of P=407.4 million. The decrease was primarily due to the change in the regular corporate income tax rate from 35% in the year ended December 31, 2008 to 30% in the year ended December 31, 2009 and a lower taxable income reported for the period. Net Income As a result of the foregoing, the Company’s net income decreased by 19% to P=2,299.4 million in the year ended December 31, 2009 from P2,833.1 million in the year ended December 31, 2008. For the year ended December 31, 2009, there were no seasonal aspects that had a material effect on the financial condition or results of operations of the Company. Neither were there any trends, events or uncertainties that have had or that are reasonably expected to have a material impact on the net sales or revenues or income from continuing operations. The Company is not aware of events that will cause a material change in the relationship between the costs and revenues. There are no significant elements of income or loss that did not arise from the Company’s continuing operations. FINANCIAL CONDITION As of December 31, 2009 vs. December 31, 2008 Total assets as of December 31, 2009 were P=55,072.5 million compared to P52,669.4 million as of December 31, 2008, or a 5% increase. This was due to the following:
• Cash and cash equivalents including short term cash investments posted a significant decrease of P=1,897.9 million, from P5,044.5 million as of December 31, 2008 to P=3,146.6 million as of December 31, 2009 due to partial retirement of long-term debt and payments of working capital expenses.

16
• Real estate for sale and development increased by 14% to P28,721.7 million as of December 31, 2009 from P=25,246.6 million as of December 31, 2008 due primarily to acquisitions of lands for future development as well as opening of new projects.
• Investment in an associate increased by 7% from P647.7 million to P693.7 million due to the recognition of share in the higher net income of an associate.
• Advances to real estate joint ventures decreased by P=98.0 million from P1,648.9 million as of
December 31, 2008 to P=1,550.9 as of December 31, 2009 due to the increase in payments made to joint venture partners.
• Other assets increased by 67% from P1,196.8 million as of December 31, 2008 to P=2,004.6
million as of December 31, 2009 due primarily to the increase in prepaid expenses, input vat, creditable withholding taxes and miscellaneous deposits.
Total liabilities as of December 31, 2009 were P=19,688.0 million compared to P19,652.8 million as of December 31, 2008. The change was due to the following:
• Interest bearing bank loans and loans payable representing the sold portion of the Company’s installment contracts receivables with recourse, increased by 31% to P=4,556.5 million as of December 31, 2009 from P3,488.7 million as of December 31, 2008 due to availment of additional loans and selling of in-house receivables during the year.
• Accounts and other payables increased by 36% from P=4,005.5 million as of December 31,
2008 to P=5,430.0 million as of December 31, 2009 due primarily to the increase in accrued expenses and accounts payable to suppliers. The increase in these accounts is due to the on-going construction of some of the Company’s condominium development projects.
• Customers’ advances and deposits decreased by 18% from P4,437.7 million as of December 31, 2008 to P=3,638.5 million as of December 31, 2009 due to the decrease in the minimum amount of advances and deposits required from buyers during the initial stage of a sale transaction.
• Liabilities for purchased land decreased by 30% from P2,632.8 million as of December 31,
2008 to P=1,848.6 million as of December 31, 2009 due to payments made during the year.
• Due to related parties decreased by 53% from P910.4 million as of December 31, 2008 to P428.9 million as of December 31, 2009 due to the payment of advances to related parties made during the year.
• Income tax payable decreased by 24% million from P125.0 million as of December 31, 2008
to P=95.5 million as of December 31, 2009 primarily due to the change in the regular corporate income tax rate from 35% in the year ended December 31, 2008 to 30% in the year ended December 31, 2009.
• Pension liability increased by P117.7 million from P14.8 million as of December 31, 2008 to P=
132.5 million as of December 31, 2009 due to actuarial adjustments made during the year.
• Deferred tax liabilities (net) posted an increase of 22% from P2,145.8 million as of December 31, 2008 to P=2,625.8 million as of December 31, 2009. The increase was due primarily to the increase in unrealized gain on real estate transactions and unamortized discount on long term notes.
• Long Term Notes including Long Term Commercial Papers decreased by 66% from P1,474.6
million as of December 31, 2008 to P=495.4 million as of December 31, 2009 due primarily to partial retirement of long-term debt.
Total stockholder’s equity increased to P=35,384.5 million as of December 31, 2009 from P33,016.6 million as of December 31, 2008 due to the net income reported for the period and increase in additional paid in capital and issuance of treasury shares arising from the acquisition of Polar Mines Realty Ventures, Inc.,

17
Considered as the top five key performance indicators of the Company as shown below:
Notes:
(a) Current Ratio: This ratio is obtained by dividing the Current Assets of the Company by its Current liabilities. This ratio is used as a test of the
Company’s liquidity.
(b) Debt-to-equity ratio: This ratio is obtained by dividing the Company’s Total Liabilities by its Total Equity. The ratio reveals the proportion of
debt and equity a company is using to finance its business. It also measures a company’s borrowing capacity.
(c) Interest expense/Income before interest expense: This ratio is obtained by dividing interest expense for the period by its income before interest
expense. This ratio shows whether a company is earning enough profits before interest to pay its interest cost comfortably
(d) Return on assets: This ratio is obtained by dividing the Company’s net income by its total assets. This measures the Company’s earnings in
relation to all of the resources it had at its disposal.
(e) Return on equity: This ratio is obtained by dividing the Company’s net income by its total equity. This measures the rate of return on the
ownership interest of the Company’s stockholders.
Because there are various calculation methods for the performance indicators above, the Company’s presentation of such may not be comparable to
similarly titled measures used by other companies.
Current ratio as of December 31, 2009 posted a lower ratio from that of December 31, 2008 mainly due to lower level of cash and cash equivalents due to various payments made during the year and increase in the accounts and other payables and current portion of bank loans. Debt-to-equity ratio improved due to the increase in the total stockholders’ equity brought about by the net income reported for the period, increase in additional paid in capital and issuance of treasury shares arising from the acquisition of Polar Mines Realty Ventures, Inc., and decrease in total liabilities due to partial retirement of long-term notes. Interest expense as a percentage of income before interest expense increased in the year ended December 31, 2009 compared to the ratio for the year ended December 31, 2008 due to an increase in interest expense arising from higher level of interest bearing liabilities for the period. Return on asset posted a lower ratio for December 31, 2009 compared to that on December 31, 2008 due primarily to the lower level of real estate revenues and net income and higher level of total assets for the period. Return on equity decreased due to lower net income and higher stockholders’ equity reported in the year ended December 31, 2009.
Material Changes to the Company’s Balance Sheet as of December 31, 2009 compared to December 31, 2008 (increase/decrease of 5% or more)
Cash and cash equivalents including short term cash investments decreased by 38% from P=5,044.5 million as of December 31, 2008 to P=3,146.6 million as of December 31, 2009 due to partial retirement of long-term debt and payments of working capital expenses.
Real estate for sale and development increased by 14% from P25,246.6 million as of December 31, 2008 to P=28,721.7 million as of December 31, 2009 due primarily to acquisitions of lands for future development as well as opening of new projects. Advances to real estate joint ventures decreased by P=98.0 million from P1,648.9 million as of December 31, 2008 to P=1,550.9 as of December 31, 2009 due to the increase in payments made to joint venture partners.
Key Performance Indicators 12/31/2009 12/31/2008 Current ratio (a) 3.20:1 3.34:1 Debt-to-equity ratio (b) 0.56:1 0.60:1 Interest expense/Income before Interest expense (c) 17.4% 9.4% Return on assets (d) 4.2% 5.4% Return on equity (e) 6.5% 8.6%

18
Investment in an associate increased by 7% from P647.7 million to P693.7 million due to the recognition of share in the higher net income of an associate.
Other assets increased by 67% from P1,196.8 million as of December 31, 2008 to P=2,004.6 million as of December 31, 2009 due primarily to the increase in prepaid expenses, input vat, creditable withholding taxes and miscellaneous deposits. Interest bearing bank loans and loans payable representing the sold portion of the Company’s installment contracts receivables with recourse, increased by 31% to P=4,556.5 million as of December 31, 2009 from P3,488.7 million as of December 31, 2008 due to availment of additional loans and selling of in-house receivables during the year. Accounts and other payables increased by 36% from P=4,005.5 million as of December 31, 2008 to P=5,430.0 million as of December 31, 2009 due primarily to the increase in accrued expenses and accounts payable to suppliers. The increase in those accounts is due to the on-going construction of some of the Company’s condominium development projects. Customers’ advances and deposits decreased by 18% from P4,437.7 million as of December 31, 2008 to P=3,638.5 million as of December 31, 2009 due to the decrease in the minimum amount of advances and deposits required from buyers during the initial stage of a sale transaction. Liabilities for purchased land decreased by 30% from P2,632.8 million as of December 31, 2008 to P=1,848.6 million as of December 31, 2009 due to payments made during the year. Due to related parties decreased by 53% from P910.4 million as of December 31, 2008 to P428.9 million as of December 31, 2009 due to the payment of advances to related parties made during the year.
Income tax payable decreased by 24% million from P125.0 million as of December 31, 2008 to P=95.5 million as of December 31, 2009 primarily due to change in the regular corporate income tax rate from 35% in the year ended December 31, 2008 to 30% in the year ended December 31, 2009. Pension liability increased by 796% from P14.8 million as of December 31, 2008 to P=132.5 million as of December 31, 2009 due to actuarial adjustments made during the year. Deferred tax liabilities (net) posted an increase of 22% from P2,145.8 million as of December 31, 2008 to P=2,625.8 million as of December 31, 2009. The increase was due primarily to the increase in unrealized gain on real estate transactions and unamortized discount on long term notes. Long Term Notes including Long Term Commercial Papers decreased by 66% from P1,474.6 million as of December 31, 2008 to P=495.4 million as of December 31, 2009 due primarily to partial retirement of long-term debt. Total stockholder’s equity increased to P=35,384.5 million as of December 31, 2009 from P33,016.6 million as of December 31, 2008 due to the net income reported for the period and increase in additional paid in capital and issuance of treasury shares arising from the acquisition of Polar Mines Realty Ventures, Inc.
Material Changes to the Company’s Statement of income for the year ended December 31, 2009 compared to the year ended December 31, 2008 (increase/decrease of 5% or more)
Revenue from real estate sales decreased by 8% from P=10,435.8 million in the year ended December 31, 2008 to P=9,629.7 million in the year ended December 31, 2009 mainly due to the decline in the sales take up starting 3rd quarter of 2008 where most of the revenue for the year 2009 came from and the effect of the extension of the payment period for the buyer’s equity from 12 months to 18 months which was introduced last year. The Company uses the Percentage of completion method of revenue recognition where revenue is recognized in reference to the stages of development of the properties.
19
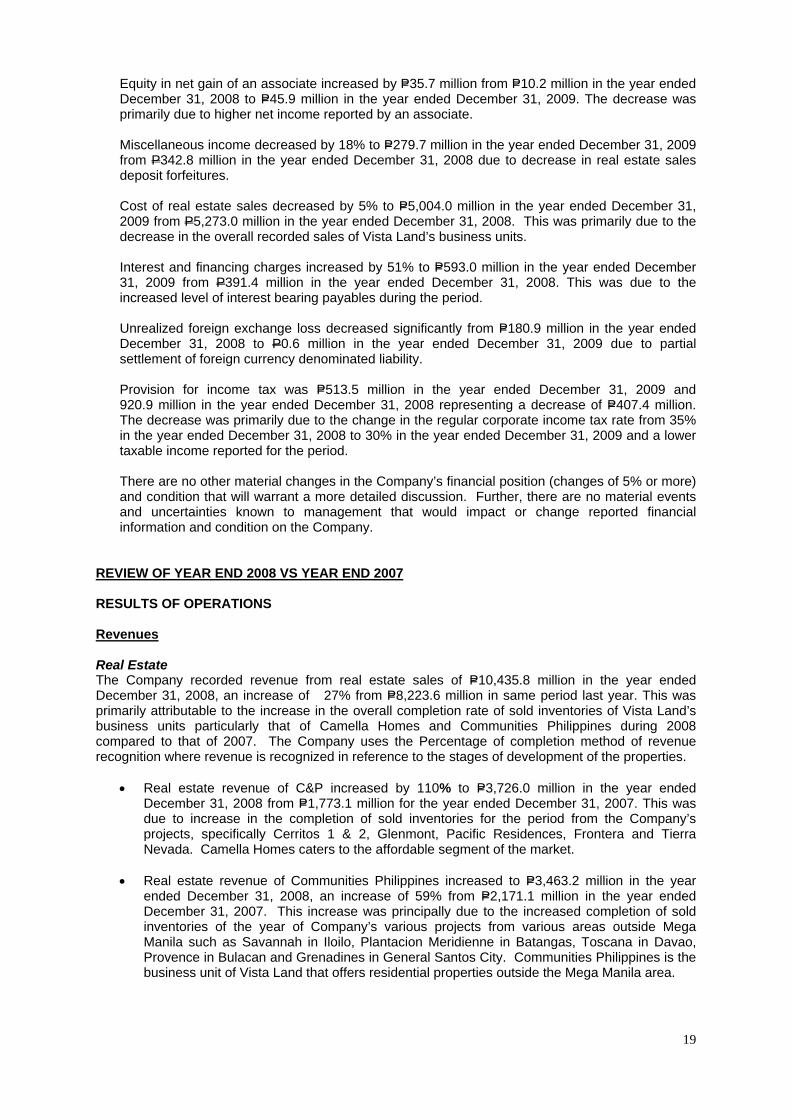
Equity in net gain of an associate increased by P=35.7 million from P=10.2 million in the year ended December 31, 2008 to P=45.9 million in the year ended December 31, 2009. The decrease was primarily due to higher net income reported by an associate.
Miscellaneous income decreased by 18% to P=279.7 million in the year ended December 31, 2009 from P342.8 million in the year ended December 31, 2008 due to decrease in real estate sales deposit forfeitures.
Cost of real estate sales decreased by 5% to P=5,004.0 million in the year ended December 31, 2009 from P5,273.0 million in the year ended December 31, 2008. This was primarily due to the decrease in the overall recorded sales of Vista Land’s business units.
Interest and financing charges increased by 51% to P=593.0 million in the year ended December 31, 2009 from P391.4 million in the year ended December 31, 2008. This was due to the increased level of interest bearing payables during the period.
Unrealized foreign exchange loss decreased significantly from P=180.9 million in the year ended December 31, 2008 to P0.6 million in the year ended December 31, 2009 due to partial settlement of foreign currency denominated liability.
Provision for income tax was P=513.5 million in the year ended December 31, 2009 and 920.9 million in the year ended December 31, 2008 representing a decrease of P=407.4 million. The decrease was primarily due to the change in the regular corporate income tax rate from 35% in the year ended December 31, 2008 to 30% in the year ended December 31, 2009 and a lower taxable income reported for the period. There are no other material changes in the Company’s financial position (changes of 5% or more) and condition that will warrant a more detailed discussion. Further, there are no material events and uncertainties known to management that would impact or change reported financial information and condition on the Company.
REVIEW OF YEAR END 2008 VS YEAR END 2007 RESULTS OF OPERATIONS Revenues Real Estate The Company recorded revenue from real estate sales of P=10,435.8 million in the year ended December 31, 2008, an increase of 27% from P=8,223.6 million in same period last year. This was primarily attributable to the increase in the overall completion rate of sold inventories of Vista Land’s business units particularly that of Camella Homes and Communities Philippines during 2008 compared to that of 2007. The Company uses the Percentage of completion method of revenue recognition where revenue is recognized in reference to the stages of development of the properties.
• Real estate revenue of C&P increased by 110% to P=3,726.0 million in the year ended December 31, 2008 from P=1,773.1 million for the year ended December 31, 2007. This was due to increase in the completion of sold inventories for the period from the Company’s projects, specifically Cerritos 1 & 2, Glenmont, Pacific Residences, Frontera and Tierra Nevada. Camella Homes caters to the affordable segment of the market.
• Real estate revenue of Communities Philippines increased to P=3,463.2 million in the year
ended December 31, 2008, an increase of 59% from P=2,171.1 million in the year ended December 31, 2007. This increase was principally due to the increased completion of sold inventories of the year of Company’s various projects from various areas outside Mega Manila such as Savannah in Iloilo, Plantacion Meridienne in Batangas, Toscana in Davao, Provence in Bulacan and Grenadines in General Santos City. Communities Philippines is the business unit of Vista Land that offers residential properties outside the Mega Manila area.
20
• Real estate revenue of Crown Asia decreased by 13% to P=1,632.2 million in the year ended December 31, 2008 from P=1,877.0 million in the year ended December 31, 2007. The decline in the revenue was due to the decrease in the completion of sold inventories of the Company for the period. Brittany caters to the high-end segment of the market.
• Real estate revenue of Brittany decreased by 33% to P=1,614.4 million in the year ended
December 31, 2008 from P=2,401.8 million in the same period last year. The decline in the revenue was due to the decrease in the completion of sold inventories of the Company for the period. Brittany caters to the high-end segment of the market.
Unrealized foreign exchange gain (loss) Unrealized foreign exchange gain decreased by 191.6% resulting to an unrealized forex loss of P=180.9 million in the year ended December 31, 2008 from an unrealized foreign exchange gain P197.5 million in the year ended December 31, 2007. This was due to the depreciation of the reporting currency for the period. Interest Income Interest income increased to P=821.7 million in the year ended December 31, 2008 from P813.6 million in the year ended December 31, 2007. There is only a 1% increase in the interest due to some foregone interest from sold receivables. Miscellaneous Miscellaneous income decreased by 3% to P=342.8 million in the year ended December 31, 2008 from P354.6 million in the year ended December 31, 2007 due to decrease in real estate sales deposit forfeitures. Gain on restructuring The Company recorded a non-recurring gain on restructuring of P1,443.5 million in the year ended December 31, 2007 as a result of Camella Homes’ restructuring of its foreign currency denominated obligation, FRN. Costs and Expenses Cost and expenses increased by 18% to P=7,856.6 million in the year ended December 31, 2008 from P6,512.3 million in the year ended December 31, 2007 but as a percentage of real estate sales, Costs and Expenses as a percentage of real estate revenue improved from 79% in the year ended December 31, 2007 to 75% in the year ended December 31, 2008. The 18% increase in the account was primarily attributable to the following:
• Cost of real estate sales increased by 31% to P=5,273.0 million in the year ended December 31, 2008 from P4,031.4 million in the year ended December 31, 2007. This was primarily due an increase in the overall recorded sales of Vista Land’s four business units.
• Operating expenses increased by 10% to P=2,011.2 million in the year ended December 31,
2008 from P1,837.6 million in the year ended December 31, 2007. This was primarily due to the following:
o an increase in the advertising and promotions to P=552.3 million in the year ended
December 31, 2008 from P380.2 million in the year ended December 31, 2007 resulting from aggressive marketing activities for the year;
o an increase in commissions to P=434.3 million in the year ended December 31, 2008
from P408.2 million in the year ended December 31, 2007 due to increased real estate sales; and
o an increase in professional to P=230.5 million in the year ended December 31, 2008
from P173.2 million in the year ended December 31, 2007 primarily due to increase in fees made to various external services rendered to the Company.
21
• Interest and financing charges decreased by 39% to P=391.4 million in the year ended December 31, 2008 from P643.4 million in the year ended December 31, 2007. This was due reduced level of interest bearing payables during the period.
Provision for Income Tax Provision for income tax was P=920.9 million in the year ended December 31, 2008 and P=1,169.7 million in the year ended December 31, 2007, representing a decrease P=248.8 million. The decrease was due to the recognition of the deferred tax liability from the gain on restructuring recorded in 2007 and none in 2008. Net Income As a result of the foregoing, the Company’s net income increased by 18% to P=2,833.1 million in the year ended December 31, 2008 from P3,469.0 million in the year ended December 31, 2007. For the year ended December 31, 2008, there were no seasonal aspects that had a material effect on the financial condition or results of operations of the Company. Neither were there any trends, events or uncertainties that have had or that are reasonably expected to have a material impact on the net sales or revenues or income from continuing operations. The Company is not aware of events that will cause a material change in the relationship between the costs and revenues. There are no significant elements of income or loss that did not arise from the Company’s continuing operations. FINANCIAL CONDITION As of December 31, 2008 vs. December 31, 2007 Total assets as of December 31, 2007 were P=52,251.9 million compared to P44,440.2 million as of December 31, 2007, or an 18% increase. This was due to the following:
• Cash and cash equivalents including short term cash investments in 2007 posted a significant decrease of P=1,773.4 million, from P6,818.0 million as of December 31, 2007 to P=5,044.5 million as of December 31, 2008 due to payments of working capital expenses.
• Receivables increased by 45% from P12,476.9 million as of December 31, 2007 to P=18,072.9
million as of December 31, 2008 due to higher sales recognized for the period.
• Real estate for sale and development increased by 15% from P21,950.5 million as of December 31, 2007 to P=25,246.6 million as of December 31, 2008 due primarily to acquisitions of lands for future development as well as opening of new projects.
• Property and equipment increased by 30% from P72.7 million as of December 31, 2007 to P=
94.8 million as of December 31, 2008 due primarily to additions of transportation equipment and other fixed assets.
• Advances to real estate joint ventures increased by P=135.8 million, from P1,513.1 million as
of December 31, 2007 to P=1,648.9 as of December 31, 2008 due to the increase in advances given to joint venture partners.
• Other assets increased by 80% from P666.7 million as of December 31, 2007 to P=1,196.8
million as of December 31, 2008 due primarily to increase in creditable withholding taxes, input vat and miscellaneous deposits and others.
Total liabilities as of December 31, 2008 were P=19,235.3 million compared to P13,169.6 million as of December 31, 2007, or a 46% increase. This was due to the following:
• Interest bearing bank loans decreased by 64% to P=92.3 million as of December 31, 2008 from P254.8 million as of December 31, 2007 due to payments made during the year.
22
• Loans payable, representing the sold portion of the Company’s installment contracts receivables with recourse, increased significantly by 100.0% to P3,372.3 million as of December 31, 2008 from nil as of December 31, 2007 due to the selling of in-house receivables during the year.
• Accounts and other payables increased by 23% from P3,254.3 million as of December 31,
2007 to P=4,005.5 million as of December 31, 2008 due primarily to the increase in accrued expenses and accounts payable to suppliers. The increase in those accounts is due to the on-going construction of some of the Company’s condominium development projects.
• Customers’ advances and deposits increased by 22% from P3,640.6 million as of December
31, 2007 to P=4,437.7 million as of December 31, 2008 due to an increase in the number of uncontracted accounts.
• Liabilities for purchased land increased by 8% from P2,445.6 million as of December 31, 2007
to P=2,632.8 million as of December 31, 2008 due to new acquisitions of land for future development.
• Due to related parties increased by 72% from P530.1 million as of December 31, 2007 to
P910.4 million as of December 31, 2008 due to the proceeds of advances from related parties.
• Income tax payable increased by P=13.5 million from P111.4 million as of December 31, 2007
to P=125.0 million as of December 31, 2008 due to a higher taxable income for the period.
• Pension liability decreased by 85% from P100.0 million as of December 31, 2007 to P=14.8 million as of December 31, 2008 due to actuarial adjustments.
• Deferred tax liabilities posted a significant increase of 33% from P1,610.7 million as of
December 31, 2007 to P=2,145.8 million as of December 31, 2008. The increase in the increase in the sales that will be subjected to tax only upon collection and not during the recognition of the revenue.
• Long Term Notes including Long Term Commercial Papers increased by 23% from P1,221.9
million as of December 31, 2007 to P=1,498.6 million as of December 31, 2008 due to foreign exchange translation.
Total stockholder’s equity increased to P=32,967.4 million as of December 31, 2008 from P31,239.0 million as of December 31, 2007 net profit realized for the year reduced by the dividends paid and treasury shares. Minority interest decreased by 56% from P31.6 million as of December 31, 2007 to P=49.2 million as of December 31, 2008 due mainly minority share in net income for the year. Considered as the top five key performance indicators of the Company as shown below:
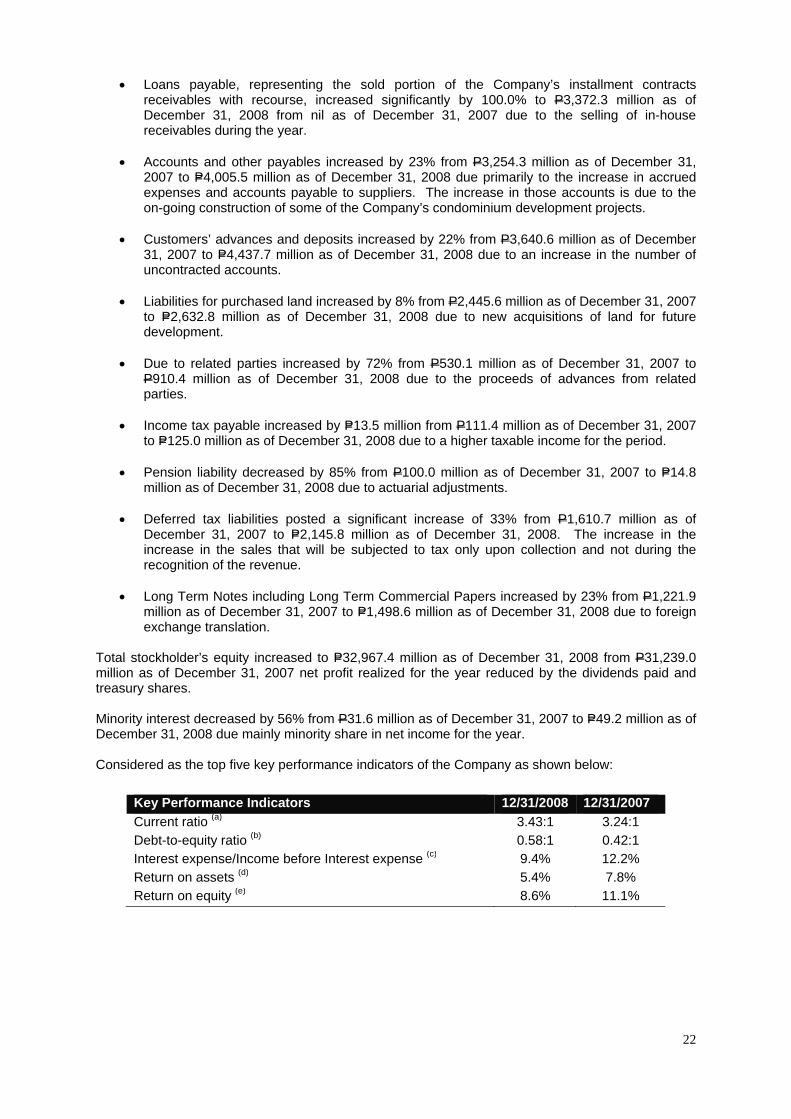
Key Performance Indicators 12/31/2008 12/31/2007 Current ratio (a) 3.43:1 3.24:1 Debt-to-equity ratio (b) 0.58:1 0.42:1 Interest expense/Income before Interest expense (c) 9.4% 12.2% Return on assets (d) 5.4% 7.8% Return on equity (e) 8.6% 11.1%

23
Notes:
(f) Current Ratio: This ratio is obtained by dividing the Current Assets of the Company by its Current liabilities. This ratio is used as a test of the
Company’s liquidity.
(g) Debt-to-equity ratio: This ratio is obtained by dividing the Company’s Total Liabilities by its Total Equity. The ratio reveals the proportion of
debt and equity a company is using to finance its business. It also measures a company’s borrowing capacity.
(h) Interest expense/Income before interest expense: This ratio is obtained by dividing interest expense for the period by its income before interest
expense. This ratio shows whether a company is earning enough profits before interest to pay its interest cost comfortably
(i) Return on assets: This ratio is obtained by dividing the Company’s net income by its total assets. This measures the Company’s earnings in
relation to all of the resources it had at its disposal.
(j) Return on equity: This ratio is obtained by dividing the Company’s net income by its total equity. This measures the rate of return on the
ownership interest of the Company’s stockholders.
Because there are various calculation methods for the performance indicators above, the Company’s presentation of such may not be comparable to
similarly titled measures used by other companies.
Current ratio as of December 31, 2008 improved from that of December 31, 2007 due to a significant increase in the receivables accounts and the slight increase in the account and other payables account. The increase in receivables was due to higher sales recognized for the period Debt-to-equity ratio’s slightly increased was due increase in the total liabilities. The increase in the total liabilities was due primarily to the increase in the loans payable which represents the Company’s proceeds from sold receivables. Interest expense as a percentage of income before interest expense was reduced in the year ended December 31, 2008 compared to the ratio for the year ended December 31, 2008 due to a reduction in the interest expense from interest bearing liabilities for the period. Return on asset posted a lower ratio for December 31, 2008 compared to that on December 31, 2007 due primarily to the higher net income posted in the prior year which includes a significant one-time restructuring gain. Return on equity decreased due to the higher net income for the year ended December 31, 2008 compared to that of December 31, 2007. The higher net income posted in the prior year includes a significant one-time restructuring gain.
Material Changes to the Company’s Balance Sheet as of December 31, 2008 compared to December 31, 2007 (increase/decrease of 5% or more)
Cash and cash equivalents including short term cash investments increased by 26% from P=6,818.0 million as of December 31, 2007 to P=5,044.5 million as of December 31, 2008 due to payments of working capital expenses. Receivables increased by 45% from P12,476.9 million as of December 31, 2007 to P=18,072.9 million as of December 31, 2008 due to higher sales recognized for the period. Real estate for sale and development increased by 15% from P21,950.5 million as of December 31, 2007 to P=25,246.6 million as of December 31, 2008 due primarily to acquisitions of lands for future development as well as opening of new projects. Property and equipment increased by 30% from P72.7 million as of December 31, 2007 to P=94.8 million as of December 31, 2008 due primarily to additions of transportation equipment and other fixed assets. Advances to real estate joint ventures increased by 9% from P1,513.1 million as of December 31, 2007 to P=1,648.9 as of December 31, 2008 due to the increase in advances given to joint venture partners.

24
Other assets increased by 80% from P666.7 million as of December 31, 2007 to P=1,196.8 million as of December 31, 2008 due primarily to increase in creditable withholding taxes, input vat and miscellaneous deposits and others. Bank loans decreased by 64% from P254.8 million as of December 31, 2007 to P=92.3 million as of December 31, 2008 due to payments made during the year. Loans payable increased by 100.0% from nil as of December 31, 2007 to P3,372.3 million as of December 31, 2008 due to the selling of in-house receivables during the year. Accounts and other payables increased by 23% from P3,254.3 million as of December 31, 2007 to P=4,005.5 million as of December 31, 2008 due primarily to the increase in accrued expenses and accounts payable to suppliers. The increase in those accounts is due to the on-going construction of some of the Company’s condominium development projects. Customers’ advances and deposits increased by 22% from P3,640.6 million as of December 31, 2007 to P=4,437.7 million as of December 31, 2008 due to an increase in the number of uncontracted accounts. Liabilities for purchased land increased by 8% from P2,445.6 million as of December 31, 2007 to P=2,632.8 million as of December 31, 2008 due to new acquisitions of land for future development. Due to related parties increased by 72% from P530.1 million as of December 31, 2007 to P910.4 million as of December 31, 2008 due to the proceeds of advances from related parties.
Income tax payable increased by 12% from P111.4 million as of December 31, 2007 to P=125.0 million as of December 31, 2008 due to a higher taxable income for the period. Pension liability decreased by 85% from P100.0 million as of December 31, 2007 to P=14.8 million as of December 31, 2008 due to actuarial adjustments. Deferred tax liabilities posted a significant increase of 33% from P1,610.7 million as of December 31, 2007 to P=2,145.8 million as of December 31, 2008. The increase in the increase in the sales that will be subjected to tax only upon collection and not during the recognition of the revenue. Long Term Notes including Long Term Commercial Papers increased by 23% from P1,221.9 million as of December 31, 2007 to P=1,498.6 million as of December 31, 2008 due to foreign exchange translation. Total stockholders’ equity increased by 6% from P=31,270.5 million as of December 31, 2007 to P=33,016.6 million as of December 31, 2008 due to the net profit realized for the year reduced by the dividends paid and treasury shares.
Material Changes to the Company’s Statement of income for the year ended December 31, 2008 compared to the year ended December 31, 2007 (increase/decrease of 5% or more)
Revenue from real estate sales increased by 27% from P=8,223.6 million in the year ended December 31, 2007 to P=10,435.8 million in the year ended December 31, 2008 mainly due to increase in the completion of sold inventories of Vista Land’s business units. Unrealized foreign exchange gain decreased by 191.6% resulting to an unrealized forex loss of P=180.9 million in the year ended December 31, 2008 from an unrealized foreign exchange gain P197.5 million in the year ended December 31, 2007. This was due to the depreciation of the reporting currency for the period. Operating expenses increased by 10% from P=1,837.6 million in the year ended December 31, 2007 to P=2,011.2 million in the year ended December 31, 2008 mainly due to increase in marketing and selling expenses, particularly advertising and promotions and commissions resulting from aggressive marketing activities as well as increase in the professional fees due to increase in fees made to various external services rendered to the Company.
25
Interest and financing charges decreased by 39% from P=643.4 million in the year ended December 31, 2007 to P=391 million in the year ended December 31, 2008 due to the increase in the interest due to some foregone interest from sold receivables. Provision for income tax increased by 21% from P=1,169.7 million in the year ended December 31, 2007 to P=920.9 million in the year ended December 31, 2008 due to the recognition of the deferred tax liability from the gain on restructuring recorded in 2007 and none in 2008. There are no other material changes in the Company’s financial position (changes of 5% or more) and condition that will warrant a more detailed discussion. Further, there are no material events and uncertainties known to management that would impact or change reported financial information and condition on the Company.
IV. NATURE AND SCOPE OF BUSINESS Vista Land & Lifescapes, Inc. (Vista Land) was incorporated in Metro Manila, Philippines, on February 28, 2007 as an investment holding company. The Registrant through its subsidiaries harnesses more than 30 years of professional expertise in residential real estate development, and believes it has established a nation-wide presence, superior brand recognition and proven track record. Its projects include master-planned developments and stand-alone residential subdivisions which offer lots and/or housing units to customers in the low-cost (which includes socialized housing), affordable, middle-income and high-end market segments. The Registrant operates through four distinct business units:
• Brittany5. Brittany caters to the high-end market segment in Mega Manila, offering luxury houses in master-planned communities, priced at P=9.0 million or above. In 2004, Brittany ventured into the high-rise residential condominium segment with the launch of Marfori Residences at Muntinlupa City, Metro Manila and has since launched two more vertical projects including Mosaic, in the Makati Central Business District;
• Crown Asia6. Crown Asia caters to the middle market housing segment in Mega Manila, primarily offering houses priced between P=3.5 million and P=9 million;
• Camella Homes7. For over 30 years, Camella Homes has been servicing the low-cost (including socialized) housing segment (houses priced below P=1.3 million) and the affordable housing segment (houses priced between P=1.3 million and P=3.5 million) in the Mega Manila area.; and
• Communities Philippines8. Communities Philippines offers residential properties outside the Mega Manila area in the low-cost, affordable and middle market segments. The Registrant believes Communities Philippines has the widest coverage of developments in the regions outside Mega Manila of any homebuilder in the Philippines. Communities Philippines offers housing under the “Camella” and “Crown Asia” brands and utilizes Camella Homes’ and Crown Asia’s expertise and designs to offer houses in regional areas that it believes are on par, in terms of quality, with the developments in the Mega Manila area. These projects were located in key cities and municipalities, covering most of the Philippines’ main urban areas, including Pangasinan, Pampanga, Bulacan, Batangas, Bacolod, Iloilo, Cebu, Leyte, Cagayan de Oro, General Santos and Davao.
• Vista Residences9. Vista Residences caters the development and selling of residential high-rise condominium projects across the Philippines. Vertical home projects involve dealing with longer gestation periods and requirements that are different from those of horizontal homes.
5 Brittany Corporation 6 Crown Asia Properties, Inc. 7 Camella Homes, Inc. 8 Composed of Communities Batangas, Inc., Communities Bulacan, Inc., Communities Cagayan, Inc., Communities Cebu, Inc., Communities Davao, Inc., Communities General Santos, Inc., Communities Iloilo, Inc., Communities Isabela, Inc., Communities Leyte, Inc., Communities Naga, Inc., Communities Negros Occidental, Inc., Communities Pampanga, Inc., Communities Pangasinan, Inc., Communities Tarlac, Inc. 9 Vista Residences, Inc.

26
V. MARKET FOR REGISTRANT’S COMMON EQUITY AND RELATED STOCKHOLDERS MATTERS
Market Information Registrant’s common shares are listed with the Philippine Stock Exchange. The Registrant was listed on June 25, 2007.
2010 2009 2008 Quarter High Low Close High Low Close High Low Close
1st 2.16 1.78 2.08 1.12 0.69 0.78 6.00 3.00 3.00 2nd - - - 1.78 0.72 1.60 3.50 2.65 3.00 3rd - - - 2.80 1.54 2.32 2.90 1.68 1.82 4th - - - 2.30 1.78 1.88 1.84 0.94 1.02
The market capitalization of VLL as of December 31, 2009, based on the closing price of P1.88/share, was approximately P16.1billion. As of April 30, 2010, VLL’s market capitalization stood at P16.2billion based on the P1.90/share closing price. Stockholders There are approximately 1,119 holders of common equity security of the Company as of March 31, 2010 (based on the number of accounts registered with the Stock Transfer Agent). The following are the top 20 holders of the common securities of the Company:
Stockholder’s Name No. of Common Shares
Percentage (of Common Shares1)
1 Fine Properties, Inc. 4,962,047,161 58.112% 2 PCD Nominee Corporation (Non-Filipino) 1,804,494,968 21.133% 3 PCD Nominee Corporation (Filipino) 935,103,082 10.951% 4 Polar Property Holdings, Corp. 777,497,000 9.106% 5 Bestimes Investment Limited 26,814,493 0.314% 6 ML&H Corporation 10,983,363 0.129% 7 Althorp Holdings, Inc. 5,000,000 0.059% 8 Cedar Commodities, Inc. 3,970,000 0.046% 9 Barclays Bank PLC 3,565,800 0.042%
10 John T. Lao 1,602,000 0.019% 11 Alberto B. Carlos 500,000 0.006% 12 Sulficio Tagud, Jr. &/or Ester Tagud 401,000 0.005% 13 Tomas L. Chua 400,000 0.005% 14 Luisito T. Hizon &/or Eva A. Hizon 353,000 0.004% 15 Federal Homes, Inc. 324,850 0.004% 16 Christian A. Aguilar 290,617 0.003% 17 John Peter C. Yu Yu &/ Juan G. 280,000 0.003% 18 Chan Chak Ching 250,000 0.003% 19 Marcelino C. Mendoza 206,690 0.002% 20 Vivencio Jose Ma. F. Bonifacio &/or Maria Adiel S. Bonifacio 206,000 0.002%
8,534,290,024 99.948% 1 based on the total shares issued of 8,538,740,614 Dividends
P0.033 per share Cash Dividend Declaration Date: November 23, 2009 Record date: December 8, 2009 Payment date: December 29, 2009

27
P0.064 per share Cash Dividend Declaration Date: April 2, 2008 Record date: April 17, 2008 Payment date: May 14, 2008
Dividend Policy
The Registrant's Board is authorized to declare dividends. A cash dividend declaration does not require any further approval from the Registrant's shareholders. A stock dividend declaration requires the further approval of shareholders representing not less than two-thirds of the Registrant's outstanding capital stock. Dividends may be declared only from unrestricted retained earnings.
In relation to foreign shareholders, dividends payable may not be remitted using foreign exchange sourced from the Philippine banking system unless the investment was first registered with the Banko Sentral ng Pilipinas.
The Registrant is allowed under Philippine laws to declare property and stock dividends, subject to certain requirements.
Record Date
Pursuant to existing Philippine SEC rules, cash dividends declared by a company must have a record date not less than 10 nor more than 30 days from the date the cash dividends are declared. With respect to stock dividends, the record date is to be not less than 10 or more than 30 days from the date of shareholder approval, provided however, that the set record date is not to be less than 10 trading days from receipt by the PSE of the notice of declaration of stock dividend. In the event that a stock dividend is declared in connection with an increase in authorized capital stock, the corresponding record date is to be fixed by the Philippine SEC.
Dividends
The Registrant declares dividends to shareholders of record, which are paid from the Registrant's unrestricted retained earnings. Since its incorporation, the Registrant has not declared or paid any cash dividends. None of the Registrant’s subsidiaries has declared or paid any cash dividends in the preceding five fiscal years.
The Registrant intends to maintain an annual cash dividend payment ratio for its Shares of approximately 20% of its consolidated net income from the preceding fiscal year, subject to the requirements of the applicable laws and regulations and the absence of circumstances which may restrict the payment of such dividends. Circumstances which could restrict the payment of cash dividends include, but are not limited to, when the Registrant undertakes major projects and developments requiring substantial cash expenditures or when it is restricted from paying cash dividends by its loan covenants. The Registrant's Board, may, at any time, modify such dividend payout ratio depending upon the results of operations and future projects and plans of the Registrant. Recent Sale of Unregistered Securities None Stock Options None

28
VI. COMPLIANCE WITH LEADING PRACTICE ON CORPORATE GOVERNANCE
The Company’s Board has adopted a Manual on Corporate Governance on March 31, 2007. The Company’s Manual on Corporate Governance describes the terms and conditions by which the Company intends to conduct sound corporate governance practices that are consistent with the relevant laws and regulations of the Republic of the Philippines, and which seek to enhance business transparency and build shareholder value.
Ultimate responsibility and oversight of the Company’s adherence to superior corporate governance practices rests with the Board of Directors. As a policy matter, the Board will hold monthly meetings, at which any number of relevant corporate governance issues may be raised for discussion.
Practical oversight of the Company’s corporate governance standards is exercised through the Board’s three standing committees:
The Audit Committee is charged with internal audit oversight over all of the Company’s business transactions and the effective management of risk.
The Nomination Committee is charged with ensuring that potential candidates for the Board are fully qualified as well as ensuring that the Board maintains adequate independent membership.
The Compensation and Remuneration Committee is charged with ensuring that fair and competitive compensation policies are maintained.
The Company is committed to building a solid reputation for sound corporate governance practices, including a clear understanding by its Directors of the Company’s strategic objectives, structures to ensure that such objectives are realized, systems to ensure the effective management of risks and the systems to ensure the Company’s obligations are identified and discharged in all aspects of its business. Each January, the Company will issue a certification to the Philippines Securities and Exchange Commission and the Philippine Stock Exchange that it has fulfilled its corporate governance obligations.
As of December 31, 2009, there are no known material deviations from the Company’s Manual of Corporate governance. The Company is taking further steps to enhance adherence to principles and practices of good corporate governance
29
PART III
SIGNATURES
Pursuant to the requirements of the Securities Regulation Code, the issuer has duly caused this report to be signed on behalf by the undersigned hereunto duly authorized. VISTA LAND & LIFESCAPES, INC. Registrant By: RICARDO B. TAN JR. Compliance Officer & CIO Date: May 14, 2010

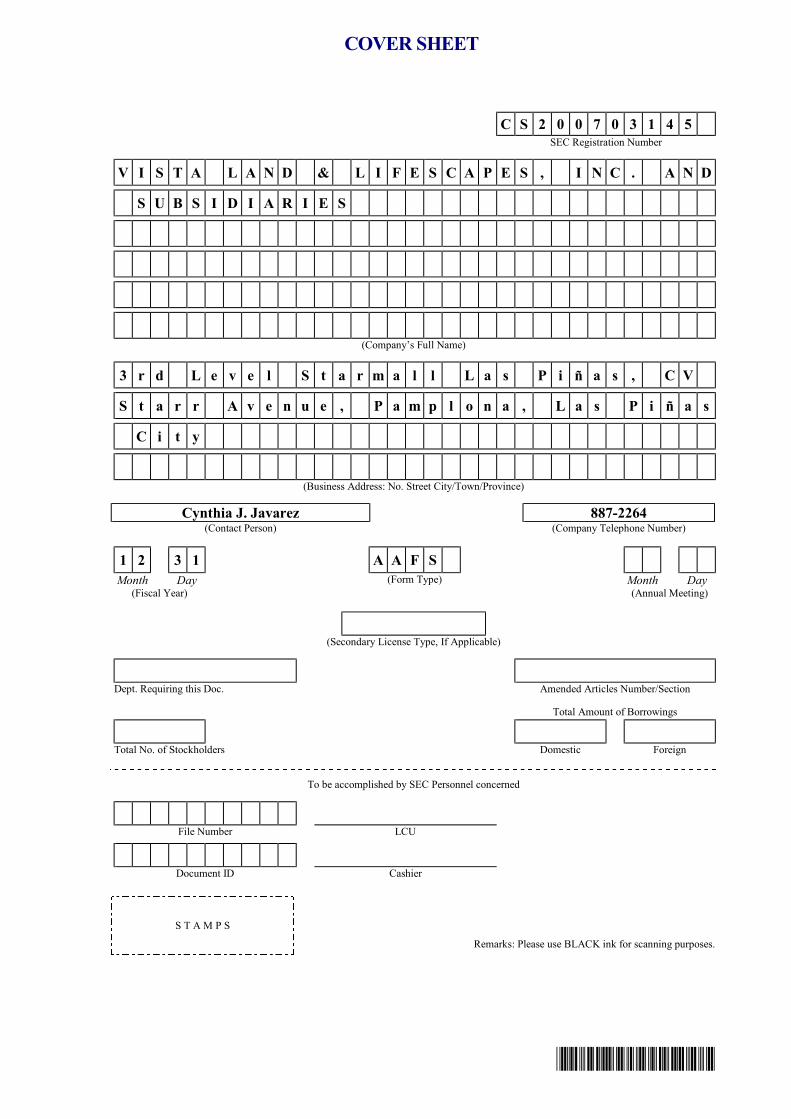
*SGVMC114033*
C S 2 0 0 7 0 3 1 4 5 SEC Registration Number
V I S T A L A N D & L I F E S C A P E S , I N C . A N D S U B S I D I A R I E S
(Company’s Full Name)
3 r d L e v e l S t a r m a l l L a s P i ñ a s , C V S t a r r A v e n u e , P a m p l o n a , L a s P i ñ a s C i t y
(Business Address: No. Street City/Town/Province)
Cynthia J. Javarez 887-2264 (Contact Person) (Company Telephone Number)
1 2 3 1 A A F S Month Day (Form Type) Month Day
(Fiscal Year) (Annual Meeting)
(Secondary License Type, If Applicable)
Dept. Requiring this Doc. Amended Articles Number/Section Total Amount of Borrowings
Total No. of Stockholders Domestic Foreign
To be accomplished by SEC Personnel concerned
File Number LCU
Document ID Cashier
S T A M P S Remarks: Please use BLACK ink for scanning purposes.
COVER SHEET

*SGVMC114033*
INDEPENDENT AUDITORS’ REPORT The Stockholders and the Board of Directors Vista Land & Lifescapes, Inc. 3rd Level Starmall Las Piñas CV Starr Avenue, Pamplona, Las Piñas City We have audited the accompanying consolidated financial statements of Vista Land & Lifescapes, Inc. and Subsidiaries, which comprise the consolidated statements of financial position as at December 31, 2009 and 2008, and the consolidated statements of comprehensive income, consolidated statements of changes in equity and consolidated statements of cash flows for each of the three years in the period ended December 31, 2009, and a summary of significant accounting policies and other explanatory notes. Management’s Responsibility for the Financial Statements Management is responsible for the preparation and fair presentation of these consolidated financial statements in accordance with Philippine Financial Reporting Standards. This responsibility includes: designing, implementing and maintaining internal control relevant to the preparation and fair presentation of consolidated financial statements that are free from material misstatement, whether due to fraud or error; selecting and applying appropriate accounting policies; and making accounting estimates that are reasonable in the circumstances. Auditors’ Responsibility Our responsibility is to express an opinion on these consolidated financial statements based on our audits. We conducted our audits in accordance with Philippine Standards on Auditing. Those standards require that we comply with ethical requirements and plan and perform the audit to obtain reasonable assurance whether the financial statements are free from material misstatement. An audit involves performing procedures to obtain audit evidence about the amounts and disclosures in the financial statements. The procedures selected depend on the auditors’ judgment, including the assessment of the risks of material misstatement of the financial statements, whether due to fraud or error. In making those risk assessments, the auditors consider internal control relevant to the entity’s preparation and fair presentation of the financial statements in order to design audit procedures that are appropriate in the circumstances, but not for the purpose of expressing an opinion on the effectiveness of the entity’s internal control. An audit also includes evaluating the appropriateness of accounting policies used and the reasonableness of accounting estimates made by management, as well as evaluating the overall presentation of the financial statements.
SyCip Gorres Velayo & Co. 6760 Ayala Avenue 1226 Makati City Philippines
Phone: (632) 891 0307 Fax: (632) 819 0872 www.sgv.com.ph BOA/PRC Reg. No. 0001 SEC Accreditation No. 0012-FR-2
A member firm of Ernst & Young Global Limited

*SGVMC114033*
- 2 -
We believe that the audit evidence we have obtained is sufficient and appropriate to provide a basis for our audit opinion. Opinion In our opinion, the consolidated financial statements present fairly, in all material respects, the financial position of Vista Land & Lifescapes, Inc. and Subsidiaries as of December 31, 2009, and 2008, and their financial performance and their cash flows for each of the three years in the period ended December 31, 2009 in accordance with Philippine Financial Reporting Standards. SYCIP GORRES VELAYO & CO. Jessie D. Cabaluna Partner CPA Certificate No. 36317 SEC Accreditation No. 0069-AR-2 Tax Identification No. 102-082-365 PTR No. 2087369, January 4, 2010, Makati City April 12, 2010
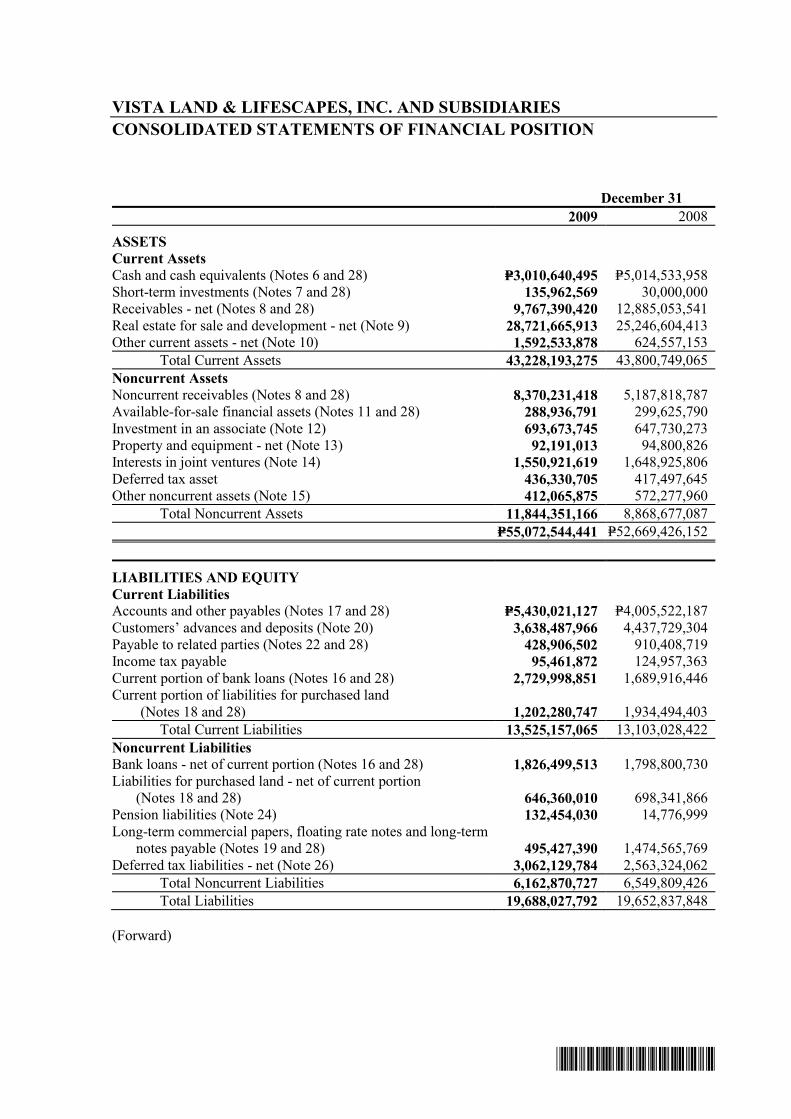
*SGVMC114033*
VISTA LAND & LIFESCAPES, INC. AND SUBSIDIARIES CONSOLIDATED STATEMENTS OF FINANCIAL POSITION December 31 2009 2008
ASSETS Current Assets Cash and cash equivalents (Notes 6 and 28) P=3,010,640,495 P=5,014,533,958 Short-term investments (Notes 7 and 28) 135,962,569 30,000,000 Receivables - net (Notes 8 and 28) 9,767,390,420 12,885,053,541 Real estate for sale and development - net (Note 9) 28,721,665,913 25,246,604,413 Other current assets - net (Note 10) 1,592,533,878 624,557,153 Total Current Assets 43,228,193,275 43,800,749,065 Noncurrent Assets Noncurrent receivables (Notes 8 and 28) 8,370,231,418 5,187,818,787 Available-for-sale financial assets (Notes 11 and 28) 288,936,791 299,625,790 Investment in an associate (Note 12) 693,673,745 647,730,273 Property and equipment - net (Note 13) 92,191,013 94,800,826 Interests in joint ventures (Note 14) 1,550,921,619 1,648,925,806 Deferred tax asset 436,330,705 417,497,645 Other noncurrent assets (Note 15) 412,065,875 572,277,960 Total Noncurrent Assets 11,844,351,166 8,868,677,087 P=55,072,544,441 P=52,669,426,152
LIABILITIES AND EQUITY Current Liabilities Accounts and other payables (Notes 17 and 28) P=5,430,021,127 P=4,005,522,187 Customers’ advances and deposits (Note 20) 3,638,487,966 4,437,729,304 Payable to related parties (Notes 22 and 28) 428,906,502 910,408,719 Income tax payable 95,461,872 124,957,363 Current portion of bank loans (Notes 16 and 28) 2,729,998,851 1,689,916,446 Current portion of liabilities for purchased land
(Notes 18 and 28) 1,202,280,747 1,934,494,403 Total Current Liabilities 13,525,157,065 13,103,028,422 Noncurrent Liabilities Bank loans - net of current portion (Notes 16 and 28) 1,826,499,513 1,798,800,730 Liabilities for purchased land - net of current portion
(Notes 18 and 28) 646,360,010 698,341,866 Pension liabilities (Note 24) 132,454,030 14,776,999 Long-term commercial papers, floating rate notes and long-term notes payable (Notes 19 and 28) 495,427,390 1,474,565,769 Deferred tax liabilities - net (Note 26) 3,062,129,784 2,563,324,062 Total Noncurrent Liabilities 6,162,870,727 6,549,809,426 Total Liabilities 19,688,027,792 19,652,837,848 (Forward)

*SGVMC114033*
- 2 - December 31 2009 2008
Equity (Notes 2 and 29) Equity attributable to equity holders of Vista Land &
Lifescapes, Inc. Capital stock P=8,538,740,614 P=8,538,740,614 Additional paid-in capital 19,328,509,860 19,305,275,668 Retained earnings 7,517,266,175 5,739,787,852 Unrealized gain on available-for-sale financial assets – 472,619 Treasury shares (Notes 4 and 29) – (616,885,476) 35,384,516,649 32,967,391,277 Minority interest – (49,197,027) Total Equity 35,384,516,649 33,016,588,304 P=55,072,544,441 P=52,669,426,152 See accompanying Notes to Consolidated Financial Statements.

*SGVMC114033*
VISTA LAND & LIFESCAPES, INC. AND SUBSIDIARIES CONSOLIDATED STATEMENTS OF COMPREHENSIVE INCOME Years Ended December 31 2009 2008 2007
REVENUE Real estate P=9,629,663,010 P=10,435,822,103 P=8,223,600,691 Interest income (Note 21) 857,296,120 821,702,486 813,641,406 Equity in net income of an associate (Note 12) 45,943,472 10,225,092 110,691,548 Dividend income 194,340 – – Unrealized foreign exchange gains – – 197,504,392 Miscellaneous income (Note 25) 279,747,532 342,809,558 361,984,749 10,812,844,474 11,610,559,239 9,707,422,786 Gain from restructuring (Note 19) – – 1,443,542,689 10,812,844,474 11,610,559,239 11,150,965,475
COSTS AND EXPENSES Real estate 5,003,984,152 5,273,025,863 4,031,363,221 Operating expenses (Note 23) 2,083,572,435 2,011,234,962 1,837,561,481 Interest and other financing charges (Note 21) 592,982,136 391,415,253 643,368,110 Unrealized foreign exchange losses 611,212 180,896,764 – Loss on settlement of loan (Note 19) 318,810,422 – – 7,999,960,357 7,856,572,842 6,512,292,812
INCOME BEFORE INCOME TAX 2,812,884,117 3,753,986,397 4,638,672,663
PROVISION FOR INCOME TAX (Note 26) 513,475,947 920,850,348 1,169,663,599
NET INCOME 2,299,408,170 2,833,136,049 3,469,009,064
OTHER COMPREHENSIVE INCOME Unrealized gain on available-for-sale financial assets (Note 11) − 472,619 −
TOTAL COMPREHENSIVE INCOME P=2,299,408,170 P=2,833,608,668 P=3,469,009,064
NET INCOME ATTRIBUTABLE TO: Equity holders of Vista Land & Lifescapes, Inc. P=2,299,408,170 P=2,819,203,031 P=3,463,493,788 Minority interests − 13,933,018 5,515,276 P=2,299,408,170 P=2,833,136,049 P=3,469,009,064
TOTAL COMPREHENSIVE INCOME ATTRIBUTABLE TO:
Equity holders of Vista Land & Lifescapes, Inc. P=2,299,408,170 P=2,819,675,650 P=3,463,493,788 Minority interests − 13,933,018 5,515,276 P=2,299,408,170 P=2,833,608,668 P=3,469,009,064
Basic/Diluted Earnings Per Share (Note 27) P=0.27 P=0.33 P=0.48
Basic/Diluted Earnings Per Share Excluding Gain from Restructuring (Note 27) P=0.27 P=0.33 P=0.28 See accompanying Notes to Consolidated Financial Statements.
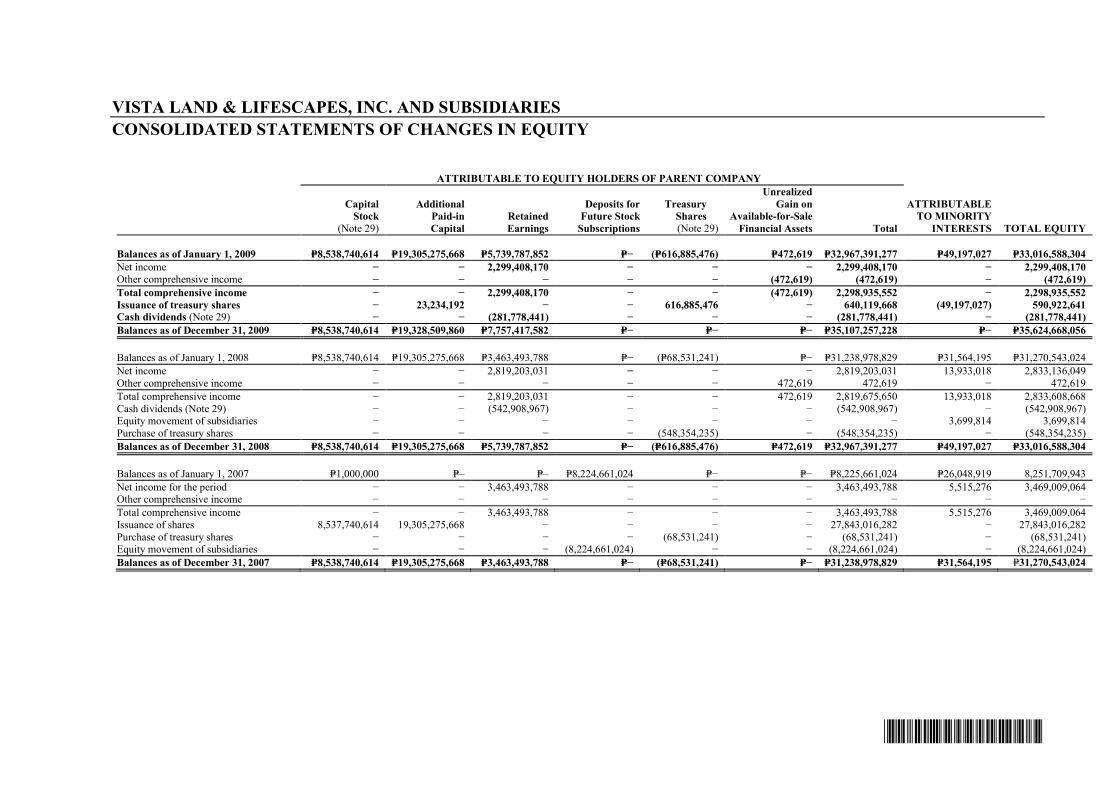
*SGVMC114033*
VISTA LAND & LIFESCAPES, INC. AND SUBSIDIARIES CONSOLIDATED STATEMENTS OF CHANGES IN EQUITY ATTRIBUTABLE TO EQUITY HOLDERS OF PARENT COMPANY
Capital Stock
(Note 29)
Additional Paid-in Capital
Retained Earnings
Deposits for Future Stock
Subscriptions
Treasury Shares (Note 29)
Unrealized Gain on
Available-for-Sale Financial Assets Total
ATTRIBUTABLE TO MINORITY
INTERESTS TOTAL EQUITY Balances as of January 1, 2009 P=8,538,740,614 P=19,305,275,668 P=5,739,787,852 P=− (P=616,885,476) P=472,619 P=32,967,391,277 P=49,197,027 P=33,016,588,304 Net income − − 2,299,408,170 − − − 2,299,408,170 − 2,299,408,170 Other comprehensive income − − − − − (472,619) (472,619) − (472,619) Total comprehensive income − − 2,299,408,170 − − (472,619) 2,298,935,552 − 2,298,935,552 Issuance of treasury shares − 23,234,192 − − 616,885,476 − 640,119,668 (49,197,027) 590,922,641 Cash dividends (Note 29) − − (281,778,441) − − − (281,778,441) − (281,778,441) Balances as of December 31, 2009 P=8,538,740,614 P=19,328,509,860 P=7,757,417,582 P=− P=− P=− P=35,107,257,228 P=− P=35,624,668,056 Balances as of January 1, 2008 P=8,538,740,614 P=19,305,275,668 P=3,463,493,788 P=− (P=68,531,241) P=− P=31,238,978,829 P=31,564,195 P=31,270,543,024 Net income − − 2,819,203,031 − − − 2,819,203,031 13,933,018 2,833,136,049 Other comprehensive income − − − − − 472,619 472,619 − 472,619 Total comprehensive income − − 2,819,203,031 − − 472,619 2,819,675,650 13,933,018 2,833,608,668 Cash dividends (Note 29) − − (542,908,967) − − − (542,908,967) − (542,908,967) Equity movement of subsidiaries − − − − − − − 3,699,814 3,699,814 Purchase of treasury shares − − − − (548,354,235) − (548,354,235) − (548,354,235) Balances as of December 31, 2008 P=8,538,740,614 P=19,305,275,668 P=5,739,787,852 P=− (P=616,885,476) P=472,619 P=32,967,391,277 P=49,197,027 P=33,016,588,304 Balances as of January 1, 2007 P=1,000,000 P=– P=– P=8,224,661,024 P=− P=− P=8,225,661,024 P=26,048,919 8,251,709,943 Net income for the period − − 3,463,493,788 − − − 3,463,493,788 5,515,276 3,469,009,064 Other comprehensive income − − − − − − − − − Total comprehensive income − − 3,463,493,788 − − − 3,463,493,788 5,515,276 3,469,009,064 Issuance of shares 8,537,740,614 19,305,275,668 − − − − 27,843,016,282 − 27,843,016,282 Purchase of treasury shares − − − − (68,531,241) − (68,531,241) − (68,531,241) Equity movement of subsidiaries − − − (8,224,661,024) − − (8,224,661,024) − (8,224,661,024) Balances as of December 31, 2007 P=8,538,740,614 P=19,305,275,668 P=3,463,493,788 P=− (P=68,531,241) P=− P=31,238,978,829 P=31,564,195 P=31,270,543,024

*SGVMC114033*
VISTA LAND & LIFESCAPES, INC. AND SUBSIDIARIES CONSOLIDATED STATEMENTS OF CASH FLOWS Years Ended December 31 2009 2008 2007
CASH FLOWS FROM OPERATING ACTIVITIES Income before income tax P=2,812,884,117 P=3,753,986,397 P=4,638,672,663 Adjustments for: Interest income (Note 21) (857,296,120) (821,702,486) (813,641,406) Interest expense 592,982,136 391,415,253 643,368,110 Unrealized foreign exchange (gains) losses 611,212 180,896,764 (923,697,068) Actuarial loss (gain) (Note 24) 128,575,800 (85,267,936) (20,856,700) Depreciation and amortization (Notes 13 and 23) 95,162,392 46,472,247 43,002,460 Equity in net loss (earnings) of an associate (Note 12) (45,943,472) (10,225,092) (110,691,548) Provision for probable losses (Note 23) 11,079,149 8,419,703 21,216,869 Dividend income (194,340) Loss on retirement of property and equipment – (1,785,876) – Gain from restructuring – – (1,443,542,689) Operating income before working capital changes 2,737,860,874 3,462,208,974 2,033,830,691 Increase in: Receivables (76,439,871) (5,525,016,510) (4,588,454,620) Real estate for sale and development (3,475,061,500) (3,126,349,502) (2,421,887,477) Other assets (807,764,640) (519,125,077) (80,487,102) Increase (decrease) in: Accounts and other payables 1,424,498,940 751,242,688 409,353,754 Customers’ advances and deposits (799,241,338) 797,091,656 1,327,604,308 Pension liabilities (10,898,769) – – Net cash flows used in operations (1,007,046,304) (4,159,947,771) (3,320,040,446) Dividend received 194,340 Interest received 857,296,120 742,352,183 813,641,406 Interest paid (592,982,136) (373,914,823) – Income tax paid (303,150,182) (372,263,089) (65,955,593) Net cash flows used in operating activities (1,045,688,162) (4,163,773,500) (2,572,354,633)
CASH FLOWS FROM INVESTING ACTIVITIES Purchased of short-term investments (105,962,569) – (1,540,260,676) Collection from short-term investment – 1,510,260,676 – Purchase of available-for-sale financial assets 10,216,380 5,561,653 112,844,900 Disposal of investments in an associate – – (258,520,144) Increase in advances to real estate joint ventures 98,004,187 (135,779,154) (377,025,700) Acquisition of property and equipment (Note 13) (92,552,579) (70,379,252) (46,678,737) Net cash provided by (used in) investing activities (90,294,581) 1,309,663,923 (2,109,640,357) (Forward)
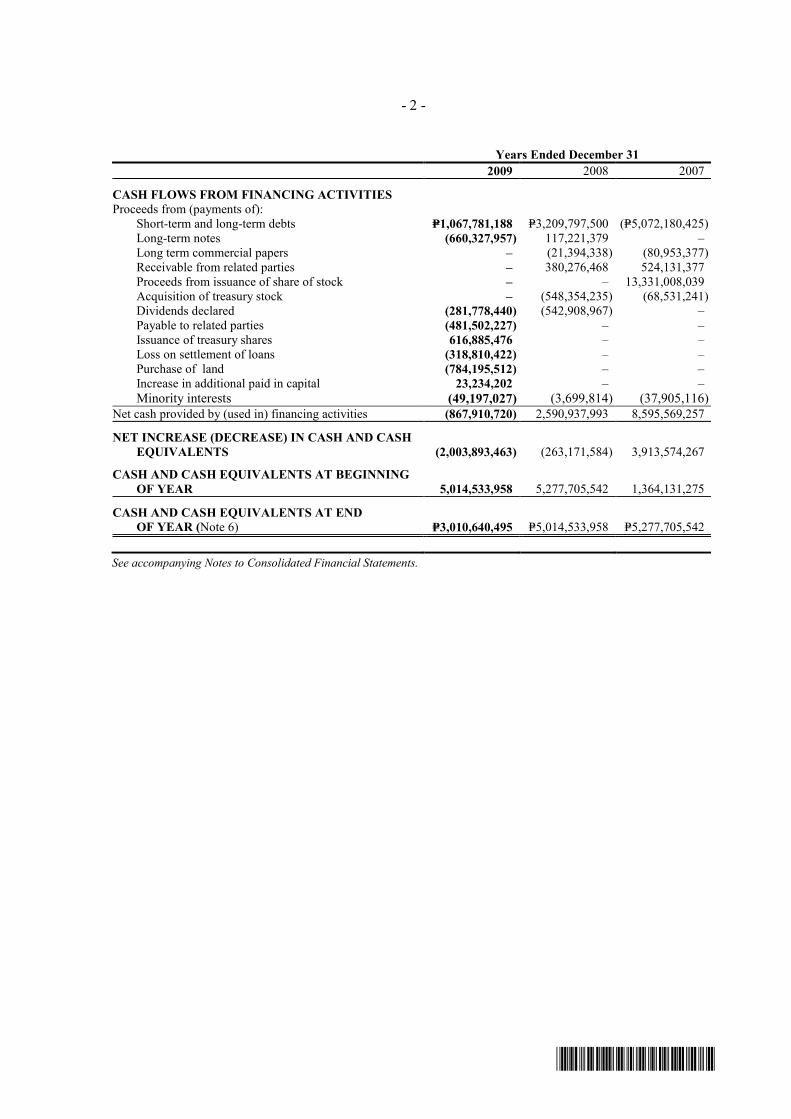
*SGVMC114033*
- 2 - Years Ended December 31 2009 2008 2007
CASH FLOWS FROM FINANCING ACTIVITIES Proceeds from (payments of): Short-term and long-term debts P=1,067,781,188 P=3,209,797,500 (P=5,072,180,425) Long-term notes (660,327,957) 117,221,379 – Long term commercial papers – (21,394,338) (80,953,377) Receivable from related parties – 380,276,468 524,131,377 Proceeds from issuance of share of stock – – 13,331,008,039 Acquisition of treasury stock – (548,354,235) (68,531,241) Dividends declared (281,778,440) (542,908,967) – Payable to related parties (481,502,227) – – Issuance of treasury shares 616,885,476 – – Loss on settlement of loans (318,810,422) – – Purchase of land (784,195,512) – – Increase in additional paid in capital 23,234,202 – – Minority interests (49,197,027) (3,699,814) (37,905,116) Net cash provided by (used in) financing activities (867,910,720) 2,590,937,993 8,595,569,257
NET INCREASE (DECREASE) IN CASH AND CASH EQUIVALENTS (2,003,893,463) (263,171,584) 3,913,574,267
CASH AND CASH EQUIVALENTS AT BEGINNING OF YEAR 5,014,533,958 5,277,705,542 1,364,131,275
CASH AND CASH EQUIVALENTS AT END OF YEAR (Note 6) P=3,010,640,495 P=5,014,533,958 P=5,277,705,542 See accompanying Notes to Consolidated Financial Statements.
- 3 -
*SGVMC114033*
VISTA LAND & LIFESCAPES, INC. AND SUBSIDIARIES NOTES TO CONSOLIDATED FINANCIAL STATEMENTS 1. Corporate Information
Vista Land & Lifescapes, Inc. (the Parent Company) was incorporated in the Republic of the Philippines and registered with the Securities and Exchange Commission (SEC) on February 28, 2007. The Parent Company’s registered office address and principal place of business is 3rd Level Starmall Las Piñas, CV Starr Avenue, Pamplona, Las Piñas City. The Parent Company is a publicly listed investment holding company which is 33.88% owned by Fine Properties, Inc, 24.24% owned by Adelfa Properties, Inc., 9.11% owned by Polar Property Holdings, Inc. and rest by the public. The Parent Company is the holding company of the Vista Group (the Group) which is comprised of the following domestic subsidiaries: 1) Camella Homes, Inc. (CHI) and Subsidiaries; 2) Brittany Corporation (Brittany); 3) Crown Asia Properties, Inc. (CAPI); 4) Communities Philippines, Inc. (CPI) and Subsidiaries; and 5) Vista Residences, Inc. (Formerly Polar Mines Realty Ventures, Inc.) (VRI) The Group is engaged mainly in the development of residential subdivisions and construction of housing and condominium units. The Group offers a range of products from socialized and affordable housing to middle income and high-end subdivision house and lots and condominium projects. Camella Homes, Inc. and Subsidiaries On October 30, 2007, SEC approved the merger between Palmera Homes, Inc., Eastridge Estates, Inc., Ridgewood Estates, Inc. and Household Development Corp. (HDC), the latter being the surviving entity. All of these entities are within the group of Camella Homes. HDC did not issue any consideration in exchange for the shares of the three other subsidiaries. HDC and the Parent Company has accounted for this transaction as reorganization of entities under common control, using pooling of interest method. Accordingly, the accompanying consolidated financial statements have been prepared as if the current corporate structure had been in existence in all periods presented. On August 15, 2008, the shareholders ratified the Board of Directors (BOD) approval of the amendment of the name of the corporation from “C & P Homes, Inc.” to “Camella Homes, Inc.” Likewise, the shareholders ratified the BOD resolution to change the par value of shares from P=1.00 per share to P=10,000 per share. The amendments in the articles of incorporation was approved by SEC on March 12, 2009, to increase the par value from P=1.00 per share to P=10,000 per share and correspondingly decrease the number of shares comprising the authorized capital stock of CHI from seven (7) billion to 700,000 shares.
Crown Asia Properties, Inc. On August 13, 2008, SEC approved the merger between Symmetrical Ventures, Inc., Crown Asia Properties (North), Inc., and CAPI, the latter being the surviving entity. CAPI did not issue any consideration in exchange for the shares accounted for this transaction and accounted this transaction as reorganization of entities under common control, using pooling of interest method. Accordingly, the accompanying consolidated financial statements have

- 4 -
*SGVMC114033*
been prepared as if the current corporate structure had been in existence in all periods presented.
Communities Philippines, Inc. and Subsidiaries At a meeting on August 6, 2008, the BOD approved the increase of the authorized capital of CPI from fifty million pesos (P=50,000,000) divided into five hundred thousand (500,000) shares with par value of one hundred pesos (P=100) per share to one billion (10,000,000,000) divided into ten million (10,000,000) shares with par value of one hundred pesos (P=100) per share. Also, on the same date, the BOD and the stockholders amended the corporate name from “Crown Communities Holdings, Inc” to “Communities Philippines, Inc.” The SEC approved the increase of capital stock and the application of change in corporate name on September 24, 2008. Out of the increase in the authorized capital stock of CPI, the amount of five hundred million (P=500,000,000) pesos has been actually subscribed by the Parent Company and the amount of five hundred four million three hundred seventy-two thousand nine hundred (P=504 million) pesos has been paid, inclusive of premium, by way of assignment of shares of stocks on the following subsidiaries: • Communities Cebu, Inc. • Communities Davao, Inc. • Communities Iloilo, Inc. • Communities Pampanga, Inc. In 2009, the BOD and the stockholders approved the change in the corporate names of CPI’s subsidiaries which was approved by SEC on various dates as follows:
Former Name Current Name Date ApprovedCommunities Philippines Cam. Sur, Inc. Communities Naga, Inc. March 13, 2009 Crown Communities (Batangas), Inc. Communities Batangas, Inc. April 1, 2009 Crown Communities (Bulacan), Inc. Communities Bulacan, Inc. July 31, 2009 Crown Communities (Cagayan), Inc. Communities Cagayan, Inc. April 15, 2009 Crown Communities (Cebu), Inc. Communities Cebu, Inc. June 30, 2009 Crown Communities (Davao), Inc. Communities Davao, Inc. April 3, 2009 Crown Communities (Iloilo), Inc. Communities Iloilo, Inc. April 16, 2009 Crown Communities (Pampanga), Inc. Communities Pampanga, Inc. April 3, 2009 Crown Communities (Pangasinan), Inc. Communities Pangasinan, Inc. July 7, 2009
Moreover, the BOD and stockholders approved the change of registered address of all fourteen (14) subsidiaries under CPI which has now a uniform principal address at Mezzanine Floor, Starmall Complex, EDSA cor. Shaw Blvd., Mandaluyong City. The SEC subsequently approved the amendment on various dates above. Vista Residences, Inc. On October 29, 2009, the Group acquired from Polar Property, through the Parent Company, 97.50% voting shares of VRI in exchange of 320,686,000 treasury shares valued at P=660.61 million. The Parent Company accounted for the acquisition using the purchase method. On December 4, 2009, the BOD and the stockholders approved the change in the corporate name from “Polar Mines Realty Ventures, Inc.” to “Vista Residences, Inc. “. On January 29, 2010, the SEC approved the change in corporate name.

- 5 -
*SGVMC114033*
2. Basis of Preparation and Summary of Significant Accounting Policies
Basis of Preparation The consolidated financial statements of the Group have been prepared on historical cost basis. The consolidated financial statements are presented in Philippine Peso (P=), the Parent Company’s functional currency. Amounts are rounded off to the nearest Philippine Peso unit unless otherwise indicated. Statement of Compliance The consolidated financial statements are prepared in compliance with Philippine Financial Reporting Standards (PFRS). Basis of Consolidation The consolidated financial statements comprise the financial statements of the Group as at December 31, 2009 and 2008 and for each of the three years in the period ended December 31, 2009. The consolidated financial statements include the financial statements of the Parent Company and the following domestic subsidiaries: Percentages equity interest 2009 2008 2007 Brittany 100.00% 100.00% 100.00% CAPI 100.00 100.00 100.00 CHI 100.00 100.00 100.00 Household Development Corp. 100.00 100.00 100.00 Mandalay Resources Corp. 100.00 100.00 100.00 C&P International Limited 100.00 100.00 100.00 CPI 100.00 100.00 100.00 Communities Batangas, Inc. 100.00 100.00 100.00 Communities Bulacan, Inc. 100.00 100.00 100.00 Communities Cagayan, Inc. 100.00 100.00 100.00 Communities Cebu, Inc. 100.00 100.00 100.00 Communities Davao, Inc. 100.00 100.00 100.00 Communities General Santos, Inc. 100.00 100.00 – Communities Iloilo, Inc. 100.00 100.00 100.00 Communities Isabela, Inc. 100.00 100.00 – Communities Leyte, Inc. 100.00 100.00 – Communities Naga, Inc. 100.00 100.00 100.00 Communities Negros Occidental, Inc. 100.00 100.00 – Communities Pampanga, Inc. 100.00 100.00 100.00 Communities Pangasinan, Inc. 100.00 100.00 100.00 Communities Tarlac, Inc. 100.00 100.00 – VRI 100.00 – – Subsidiaries are consolidated from the date of acquisition, being the date on which the Group obtains control, and continue to be consolidated until the date that such control ceases. Control is achieved when the Group has the power to govern the financial and operating decisions of an entity so as to obtain benefits from its activities. The results of subsidiaries acquired or disposed during the year are included in the consolidated statement of comprehensive income from the date of the acquisition or up to the date of disposal, as

- 6 -
*SGVMC114033*
appropriate. Except as stated otherwise, the consolidated financial statements are prepared using uniform accounting policies for like transactions and other events in similar circumstances. All significant intercompany balances and transactions, including intercompany profits and unrealized profits and losses, were eliminated during consolidation in accordance with the accounting policy on consolidation. Minority interests represent the portion of profit or loss and net assets in subsidiaries not wholly owned by the Parent Company and are presented separately in the consolidated statement of comprehensive income and consolidated statement of changes in equity and within the equity section in the consolidated statement of financial position, separately from the Parent Company’s equity. Adoption of New and Amended Accounting Standards and Interpretations
The accounting policies adopted are consistent with those of the previous financial year except for the following new and amended Standards and Philippine Interpretations which became effective on January 1, 2009. Except as otherwise indicated, the adoption of the new and amended standards and Philippine Interpretations did not have a significant impact on the Group’s consolidated financial statements.
• PFRS 1, First-time Adoption of Philippine Financial Reporting Standards - Cost of an
Investment in a Subsidiary, Jointly Controlled Entity or Associate The amendment allows an entity, in its separate financial statements, to determine the cost of investments in subsidiaries, jointly controlled entities or associates (in its opening PFRS financial statements) as one of the following amounts: (a) cost determined in accordance with PAS 27, Consolidated and Separate Financial Statements; (b) at the fair value of the investment at the date of transition to PFRS, determined in accordance with PAS 39, Financial Instruments: Recognition and Measurement; or (c) previous carrying amount (as determined under generally accepted accounting principles) of the investment at the date of transition to PFRS.
• PFRS 2, Share-based Payment - Vesting Condition and Cancellations
This Standard has been revised to clarify the definition of a vesting condition and prescribes the treatment for an award that is effectively cancelled. It defines a vesting condition as a condition that includes an explicit or implicit requirement to provide services. It further requires nonvesting conditions to be treated in a similar fashion to market conditions. Failure to satisfy a nonvesting condition that is within the control of either the entity or the counterparty is accounted for as cancellation. However, failure to satisfy a nonvesting condition that is beyond the control of either party does not give rise to a cancellation.
• PFRS 8, Operating Segments
It replaces PAS 14, Segment Reporting, and adopts a full management approach to identifying, measuring and disclosing the results of an entity’s operating segments. The information reported would be that which management uses internally for evaluating the performance of operating segments and allocating resources to those segments. Such information may be different from that reported in the consolidated statement of financial position and consolidated statement of income and the company will provide explanations and reconciliations of the differences. This Standard is only applicable to an entity that has debt or equity instruments that are traded in a public market or that files (or is in the process of filing) its financial statements with a securities commission or
- 7 -
*SGVMC114033*
similar party. The Group has adopted this Standard and the disclosures are shown in Note 5.
• Amendments to PAS 1, Presentation of Financial Statements
In accordance with the amendments to PAS 1, the statement of changes in equity shall include only transaction with owners, while non-owner changes will be presented in equity as a single line with details included in a separate statement. Owners are defined as holders of instruments classified as equity. In addition, the amendments to PAS 1 provides for the introduction of a new statements of comprehensive income that combines all items of income and expenses recognized in the profit or loss together with ‘other comprehensive income’. Entities may choose to present all items in one statement, or to present two linked statements, a separate statement of income and a statement of comprehensive income. These amendments also require additional requirements in the presentation of the statements of financial position and owner’s equity as well as additional disclosures to be included in the financial statements. Adoption of these amendments resulted in the following: (a) change in the title from consolidated balance sheet to consolidated statement of financial position; and (b) change in the presentation of changes in equity and other comprehensive income - non-owner changes in equity are now presented in the consolidated statement of comprehensive income. The Company elected to use a single statement of comprehensive income.
• Amendments to PFRS 7, Financial Instruments: Disclosures - Improving Disclosures
about Financial Instruments The amendments to PFRS 7 introduce enhanced disclosures about fair value measurement and liquidity risk. The amendments to PFRS 7 require fair value measurements for each class of financial instruments to be disclosed by the source of inputs, using the following three-level hierarchy: (a) Level 1 - quoted prices (unadjusted) in active markets for identical assets or liabilities; (b) Level 2 - inputs other than quoted prices included in Level 1 that are observable for the asset or liability, either directly (as prices) or indirectly (derived from prices); and (c) Level 3 - inputs for the asset or liability that are not based on observable market data (unobservable inputs). The level within which the fair value measurement is categorized must be based on the lowest level of input to the instrument’s valuation that is significant to the fair value measurement in its entirety. Additional disclosures required in the amendments to PFRS 7 are shown in Note 28. The amendments to PFRS 7 also introduce two major changes in liquidity risk disclosures as follows: (a) exclusion of derivative liabilities from maturity analysis unless the contractual maturities are essential for an understanding of the timing of the cash flows and (b) inclusion of financial guarantee contracts in the contractual maturity analysis based on the maximum amount guaranteed.
• Amendment to PAS 23, Borrowing Costs
The Standard has been revised to require capitalization of borrowing costs when such costs relate to a qualifying asset. A qualifying asset is an asset that necessarily takes a substantial period of time to get ready for its intended use or sale. The Group’s previous policy was to expense borrowing costs as they were incurred. In accordance to the transitional provisions of the amended PAS 23, the Group has adopted this standard on a prospective basis. Therefore, borrowing costs are capitalized on qualifying assets with a commencement date on or after January 1, 2009. No changes were made on the

- 8 -
*SGVMC114033*
borrowing costs incurred until that date that have previously been expensed. In 2009, a total of P=7.98 million borrowing costs have been capitalized on qualifying assets and were included in the “Real estate inventories” account (see Note 9).
• Amendments to PAS 32, Financial Instruments: Presentation, and PAS 1, Presentation
of Financial Statements - Puttable Financial Instruments and Obligations Arising on Liquidation These amendments specify, among others, that puttable financial instruments will be classified as equity if they have all of the following specified features: (a) the instrument entitles the holder to require the entity to repurchase or redeem the instrument (either on an ongoing basis or on liquidation) for a pro rata share of the entity’s net assets; (b) the instrument is in the most subordinate class of instruments, with no priority over other claims to the assets of the entity on liquidation; (c) all instruments in the subordinate class have identical features; (d) the instrument does not include any contractual obligation to pay cash or financial assets other than the holder’s right to a pro rata share of the entity’s net assets; and (e) the total expected cash flows attributable to the instrument over its life are based substantially on the profit or loss, a change in recognized net assets, or a change in the fair value of the recognized and unrecognized net assets of the entity over the life of the instrument.
• Philippine Interpretation IFRIC 13, Customer Loyalty Programmes
This Interpretation requires customer loyalty award credits to be accounted for as a separate component of the sales transaction in which they are granted and therefore part of the fair value of the consideration received is allocated to the award credits and realized in income over the period that the award credits are redeemed or has expired.Philippine Interpretation
• IFRIC 16, Hedges of a Net Investment in a Foreign Operation This Interpretation provides guidance on identifying foreign currency risks that qualify for hedge accounting in the hedge of net investment; where within the group the hedging instrument can be held in the hedge of a net investment; and how an entity should determine the amount of foreign currency gains or losses, relating to both the net investment and the hedging instrument, to be recycled on disposal of the net investment.
Improvements to PFRS effective in 2009 In May 2008, the International Accounting Standards Board (IASB) issued its first omnibus of amendments to certain Standards, primarily with a view to removing inconsistencies and clarifying wording. These are the separate transitional provisions for each Standard. Except as otherwise indicated, the adoption of these new Standards did not have a significant impact on the Group’s consolidated financial statements:
• PFRS 2, Share-based Payments • PFRS 5, Noncurrent Assets Held for Sale and Discontinued Operations • PAS 16, Property, Plant and Equipment • PAS 18, Revenue • PAS 19, Employee Benefits • PAS 23, Borrowing Costs • PAS 28, Investments in Associates • PAS 31, Interests in Joint Ventures • PAS 36, Impairment of Assets • PAS 38, Intangible Assets • PAS 39, Financial Instruments: Recognition and Measurement
- 9 -
*SGVMC114033*
• PAS 40, Investment Property Future Changes in Accounting Policies The Group will adopt the following standards and interpretations enumerated below when these become effective. Except as otherwise indicated, the Group does not expect the adoption of these new and amended standards and Philippine Interpretations to have significant impact on its consolidated financial statements.
Effective in 2010
• Revised PFRS 3, Business Combinations and PAS 27, Consolidated and Separate
Financial Statements The revised PFRS 3 will become effective for annual periods beginning on or after July 1, 2009. It introduces a number of changes in the accounting for business combinations that will impact the amount of goodwill recognized, the reported results in the period that an acquisition occurs, and future reported results. The revised PAS 27 requires, among others, that (a) change in ownership interests of a subsidiary (that do not result in loss of control) will be accounted for as an equity transaction and will have no impact on goodwill nor will it give rise to a gain or loss; (b) losses incurred by the subsidiary will be allocated between the controlling and noncontrolling interests (previously referred to as ‘minority interests’); even if the losses exceed the noncontrolling equity investment in the subsidiary; and (c) on loss of control of a subsidiary, any retained interest will be remeasured to fair value and this will impact the gain or loss recognized on disposal. The changes introduced by the revised PFRS 3 and PAS 27 must be applied prospectively and will affect future acquisitions and transactions with noncontrolling interests.
• Amendments to PAS 27, Consolidated and Separate Financial Statements - Cost of an Investment in a Subsidiary, Jointly Controlled Entity or Associate Amendments to PAS 27 will be effective for annual periods beginning on or after July 1, 2009 which has changes in respect of the holding companies’ separate financial statements, including, (a) the deletion of ‘cost method’, making the distinction between pre- and post-acquisition profits no longer required; and (b) in cases of reorganizations where a new parent is inserted above an existing parent of the group (subject to meeting specific requirements), the cost of the subsidiary is the previous carrying amount of its share of equity items in the subsidiary rather than its fair value. All dividends will be recognized in the statement of financial performance. However, the payment of such dividends requires the entity to consider whether there is an indicator of impairment.
• Amendment to PAS 39, Financial Instruments: Recognition and Measurement -Eligible hedged items This Amendment, which will be effective for annual periods beginning on or after July 1, 2009, addresses only the designation of a one-sided risk in a hedged item, and the designation of inflation as a hedged risk or portion in particular situations. The amendment clarifies that an entity is permitted to designate a portion of the fair value changes or cash flow variability of a financial instrument as a hedged item.
• Amendment to PFRS 2, Share-based Payments - Group Cash-settled Share-based Payment Transactions The amendments to PFRS 2, effective for annual periods beginning on or after January 1, 2010, clarify the scope and the accounting for group cash-settled share-based payment transactions.

- 10 -
*SGVMC114033*
• Philippine Interpretation IFRIC 17, Distribution of Noncash Assets to Owners
This Interpretation is effective for annual periods beginning on or after July 1, 2009 with early application permitted. It provides guidance on how to account for noncash distributions to owners. The Interpretation clarifies when to recognize a liability, how to measure it and the associated assets, and when to derecognize the asset and liability.
• Philippine Interpretation IFRIC 18, Transfer of Assets to Customers
This Interpretation provides guidance to all entities that receive from customers an item of property, plant and equipment or cash for the acquisition or construction of such item and such item is used to connect the customer to a network or to provide ongoing access to a supply of goods or services, or both. The Interpretation requires an assessment of whether an item of property, plant and equipment or cash for the acquisition or construction of such item meets the definition of an asset. If the terms of the agreement are within the scope of this interpretation, a transfer of an item of property, plant and equipment would be an exchange for dissimilar goods or services. Consequently, the exchange is regarded as a transaction which generates revenue. This Interpretation is to be applied prospectively to transfer of assets from customers received in periods beginning on or after July 1, 2009. Entities may however choose to apply this interpretation to earlier periods, provided valuations can be obtained at the time the transfer occurred.
Effective in 2012
• Philippine Interpretation IFRIC 15, Agreements for the Construction of Real Estate
This Interpretation, which will be effective January 1, 2012, covers accounting for revenue and associated expenses by entities that undertake the construction of real estate directly or through subcontractors. This Interpretation requires that revenue on construction of real estate be recognized only upon completion, except when such contract qualifies as construction contract to be accounted for under PAS 11, Construction Contracts, or involves rendering of services in which case revenue is recognized based on stage of completion. Contracts involving provision of services with the construction materials and where the risks and reward of ownership are transferred to the buyer on a continuous basis will also be accounted for based on stage of completion.
Improvements to PFRS effective 2010 The omnibus amendments to PFRS issued in 2009 were issued primarily with a view to removing inconsistencies and clarifying wording. The following amendments are effective for annual periods financial years January 1, 2010 except otherwise stated. The Group has not yet adopted the following amendments and anticipates that these changes will have no material effect on the consolidated financial statements. • PFRS 2, Share-based Payment
It clarifies that the contribution of a business on formation of a joint venture and combinations under common control are not within the scope of PFRS 2 even though they are out of scope of PFRS 3. The amendment is effective for financial years on or after July 1, 2009.
• PFRS 5, Noncurrent Assets Held for Sale and Discontinued Operations
It clarifies that the disclosures required in respect of noncurrent assets and disposal groups classified as held for sale or discontinued operations are only those set out in PFRS 5. The disclosure requirements of other PFRS only apply if specifically required

- 11 -
*SGVMC114033*
for such noncurrent assets or discontinued operations. • PFRS 8, Operating Segment Information
It clarifies that segment assets and liabilities need only be reported when those assets and liabilities are included in measures that are used by the chief operating decision maker.
• PAS 1, Presentation of Financial Statements
It clarifies that the terms of a liability that could result, at anytime, in its settlement by the issuance of equity instruments at the option of the counterparty do not affect its classification.
• PAS 7, Statement of Cash Flows
It explicitly states that only expenditure that results in a recognized asset can be classified as a cash flow from investing activities.
• PAS 17, Leases
It removes the specific guidance on classifying land as a lease. Prior to the amendment, leases of land were classified as operating leases. The amendment now requires that leases of land are classified as either ‘finance’ or ‘operating’ in accordance with the general principles of PAS 17. The amendment will be applied retrospectively.
• PAS 36, Impairment of Assets
It clarifies that the largest unit permitted for allocating goodwill, acquired in a business combination, is the operating segment as defined in PFRS 8 before aggregation for reporting purposes.
• PAS 38, Intangible Assets It clarifies that if an intangible asset acquired in a business combination is identifiable only with another intangible asset, the acquirer may recognize the group of intangible assets as a single asset provided the individual assets have similar useful lives. Also, it clarifies that the valuation techniques presented for determining the fair value of intangible assets acquired in a business combination that are not traded in active markets are only examples and are not restrictive on the methods that can be used.
• PAS 39, Financial Instruments: Recognition and Measurement
It clarifies the following: (a) That a prepayment option is considered closely related to the host contract when the
exercise price of a prepayment option reimburses the lender up to the approximate present value of lost interest for the remaining term of the host contract.
(b) That the scope exemption for contracts between an acquirer and a vendor in a business combination to buy or sell an acquiree at a future date applies only to binding forward contracts, and not derivative contracts where further actions by either party are still to be taken.
(c) That gains or losses on cash flow hedges of a forecast transaction that subsequently results in the recognition of a financial instrument or on cash flow hedges of recognized financial instruments should be reclassified in the period that the hedged forecast cash flows affect profit or loss.
• Philippine Interpretation IFRIC 9, Reassessment of Embedded Derivatives
It clarifies that it does not apply to possible reassessment at the date of acquisition, to embedded derivatives in contracts acquired in a business combination between entities or businesses under common control or the formation of joint venture.
- 12 -
*SGVMC114033*
• Philippine Interpretation IFRIC 16, Hedge of a Net Investment in a Foreign Operation
It states that, in a hedge of a net investment in a foreign operation, qualifying hedging instruments may be held by any entity or entities within the group, including the foreign operation itself, as long as the designation, documentation and effectiveness requirements of PAS 39 that relate to a net investment hedge are satisfied.
Significant Accounting Policies Cash and Cash Equivalents Cash includes cash on hand and in banks. Cash equivalents are short-term, highly liquid investments that are readily convertible to known amounts of cash with original maturities of three months or less from dates of placement and that are subject to an insignificant risk of change in value. Financial Instruments Date of recognition The Group recognizes a financial asset or a financial liability on the consolidated statement of financial position when it becomes a party to the contractual provisions of the instrument. Purchases or sales of financial assets that require delivery of assets within the time frame established by regulation or convention in the marketplace are recognized on the trade date, which is the date when the Group commits to purchase or sell the asset. Initial recognition of financial instruments All financial assets and financial liabilities are initially recognized at fair value. Except for financial assets and liabilities at fair value through profit or loss (FVPL), the initial measurement of financial assets and liabilities include transaction costs. The Group classifies its financial assets in the following categories: financial assets at FVPL, held-to-maturity (HTM) financial assets, available-for-sale (AFS) financial assets, and loans and receivables. The Group classifies its financial liabilities as financial liabilities at FVPL or other financial liabilities. The classification depends on the purpose for which the investments were acquired and whether these are quoted in an active market. The financial assets of the Group are of the nature of loans and receivable and AFS financial assets, while its financial liabilities are of the nature of other financial liability. Management determines the classification at initial recognition and re-evaluates such designation, where allowed and appropriate, at every reporting date. Determination of fair value The fair value for financial instruments traded in active markets at the reporting date is based on its quoted market price or dealer price quotations (bid price for long positions and ask price for short positions), without any deduction for transaction costs. When current bid and asking prices are not available, the price of the most recent transaction provides evidence of the current fair value as long as there has not been a significant change in economic circumstances since the time of the transaction.
For all other financial instruments not listed in an active market, the fair value is determined by using appropriate valuation techniques. Valuation techniques include net present value techniques, comparison to similar instruments for which market observable prices exist, option pricing models, and other relevant valuation models. Day 1 profit Where the transaction price in a non-active market is different to the fair value from other observable current market transactions in the same instrument or based on a valuation

- 13 -
*SGVMC114033*
technique whose variables include only data from observable market, the Group recognizes the difference between the transaction price and fair value (a ‘Day 1’ profit) in the consolidated statement of comprehensive income unless it qualifies for recognition as some other type of asset or liability. In cases where inputs to the valuation technique are not observable, the difference between the transaction price and model value is only recognized in the consolidated statement of comprehensive income when the inputs become observable or when the instrument is derecognized. For each transaction, the Group determines the appropriate method of recognizing the ‘Day 1’ profit amount. Loans and receivables Loans and receivables are nonderivative financial assets with fixed or determinable payments that are not quoted in an active market. They are not entered into with the intention of immediate or short-term resale and are not classified as financial assets held-for-trading, designated as AFS or as financial assets at FVPL. Receivables are recognized initially at fair value, which normally pertains to the billable amount. After initial measurement, loans and receivables are subsequently measured at amortized cost using the effective interest rate method, less allowance for impairment losses. Amortized cost is calculated by taking into account any discount or premium on acquisition and fees that are an integral part of the effective interest rate. The amortization, if any, is included in the consolidated statement of comprehensive income. The losses arising from impairment of receivables are recognized in the consolidated statement of comprehensive income. These financial assets are included in current assets if maturity is within 12 months from the reporting date. Otherwise, these are classified as noncurrent assets. This accounting policy applies primarily to the Group’s cash and cash equivalents, short-term investments and receivables. AFS financial assets AFS financial assets are nonderivative financial assets that are designated as such or do not qualify to be classified or designated as financial assets at FVPL, HTM investments or loans and receivables. These are purchased and held indefinitely, and may be sold in response to liquidity requirements or changes in market conditions. After initial measurement, AFS financial assets are measured at fair value. The unrealized gains and losses arising from the fair valuation of AFS financial assets are excluded from reported earnings and are reported in the other comprehensive income (OCI). When the investment is disposed of, the cumulative gain or loss previously recognized in OCI is recognized as miscellaneous income in the statement of comprehensive income. Where the Group holds more than one investment in the same security these are deemed to be disposed of on a first-in first-out basis. Interest earned on holding AFS financial assets are reported as interest income using the effective interest rate. Dividends earned on holding AFS financial assets are recognized in the statement of income as part of miscellaneous income when the right of the payment has been established. The losses arising from impairment of such investments are recognized as provisions on impairment losses in the consolidated statement of comprehensive income. When the fair value of AFS financial assets cannot be measured reliably because of lack reliable estimates of future cash flows and discount rates necessary to calculate the fair value of unquoted equity instruments, these investments are carried at cost, less any impairment losses.
- 14 -
*SGVMC114033*
The Group’s AFS financial assets pertain to unquoted equity securities included under “Available-for-sale-financial assets” account in the consolidated statement of financial position. Other financial liabilities Other financial liabilities are initially recognized at the fair value of the consideration received less directly attributable transaction costs. After initial recognition, other financial liabilities are subsequently measured at amortized cost using the effective interest method. Gains and losses are recognized in the consolidated statement of comprehensive income when the liabilities are derecognized, as well as through the amortization process. This accounting policy applies primarily to the Group’s bank loans, accounts and other payables, liabilities for purchased land, payable to related parties, long-term commercial papers, floating rate notes payable, and long-term notes and other liabilities that meet the above definition (other than liabilities covered by other accounting standards, such as pension liability and income tax payable). Derecognition of Financial Assets and Financial Liabilities Financial asset A financial asset (or, where applicable, a part of a group of financial assets) is derecognized where: (a) the rights to receive cash flows from the assets have expired; (b) the Group retains the right to receive cash flows from the asset, but has assumed an obligation to pay them in full without material delay to a third-party under a “pass-through” arrangement; or (c) the Group has transferred its right to receive cash flows from the asset and either: (i) has transferred substantially all the risks and rewards of the asset, or (ii) has neither transferred nor retained the risks and rewards of the asset but has transferred control of the asset. Where the Group has transferred its rights to receive cash flows from an asset or has entered into a pass-through arrangement, and has neither transferred nor retained substantially all the risks and rewards of the asset nor transferred control of the asset, the asset is recognized to the extent of the Group’s continuing involvement in the asset. Continuing involvement that takes the form of a guarantee over the transferred asset is measured at the lower of the original carrying amount of the asset and the maximum amount of consideration that the Group could be required to repay. Financial liability A financial liability is derecognized when the obligation under the liability is discharged or cancelled or has expired. Where an existing financial liability is replaced by another from the same lender on substantially different terms, or the terms of an existing liability are substantially modified, such an exchange or modification is treated as a derecognition of the original liability and the recognition of a new liability, and the difference in the respective carrying amounts is recognized in the consolidated statement of comprehensive income. Impairment of Financial Assets The Group assesses at each reporting date whether there is objective evidence that a financial asset or group of financial assets is impaired. A financial asset or a group of financial assets is deemed to be impaired if, and only if, there is objective evidence of impairment as a result of one or more events that has occurred after the initial recognition of the asset (an incurred

- 15 -
*SGVMC114033*
‘loss event’) and that loss event (or events) has an impact on the estimated future cash flows of the financial asset or the group of financial assets that can be reliably estimated. Evidence of impairment may include indications that the borrower or a group of borrowers is experiencing significant financial difficulty, default or delinquency in interest or principal payments, and where observable data indicate that there is measurable decrease in the estimated future cash flows, such as changes in arrears or economic conditions that correlate with defaults. Loans and receivables For loans and receivables carried at amortized cost, the Group first assesses whether an objective evidence of impairment exists individually for financial assets that are individually significant. If there is objective evidence that an impairment loss has been incurred, the amount of the loss is measured as the difference between the assets’ carrying amount and the present value of the estimated future cash flows (excluding future credit losses that have not been incurred). If it is determined that no objective evidence of impairment exists for an individually assessed financial asset, the asset, together with the other assets that are not individually significant and were thus not individually assessed for impairment, is included in a group of financial assets with similar credit risk characteristics and that group of financial assets is collectively assessed for impairment. Assets that are individually assessed for impairment and for which an impairment loss is or continues to be recognized are not included in a collective assessment of impairment.
For the purpose of a collective evaluation of impairment, financial assets are grouped on the basis of such credit risk characteristics as selling price of the lots and residential houses, past-due status and term. Future cash flows in a group of financial assets that are collectively evaluated for impairment are estimated on the basis of historical loss experience for assets with credit risk characteristics similar to those in the group. Historical loss experience is adjusted on the basis of current observable data to reflect the effects of current conditions that did not affect the period on which the historical loss experience is based and to remove the effects of conditions in the historical period that do not exist currently. The methodology and assumptions used for estimating future cash flows are reviewed regularly by the Group to reduce any differences between loss estimates and actual loss experience.
The carrying amount of the asset is reduced through use of an allowance account and the amount of loss is charged to the consolidated statement of comprehensive income. Loans, together with the associated allowance accounts, are written off when there is no realistic prospect of future recovery and all collateral has been realized. If, in a subsequent year, the amount of the estimated impairment loss decreases because of an event occurring after the impairment was recognized, the previously recognized impairment loss is reversed. Any subsequent reversal of an impairment loss is recognized in the consolidated statement of comprehensive income, to the extent that the carrying value of the asset does not exceed its amortized cost at the reversal date. AFS financial assets carried at fair value In case of equity investments classified as AFS financial assets, impairment indicators would include a significant or prolonged decline in the fair value of the investments below their corresponding cost. Where there is evidence of impairment, the cumulative loss - measured as the difference between the acquisition cost and the current fair value, less any impairment loss on that financial asset previously recognized in the consolidated statement of

- 16 -
*SGVMC114033*
comprehensive income - is removed from OCI and recognized in profit or loss. Impairment losses on equity investments are not reversed through the profit and loss. Increases in fair value after impairment are recognized directly in OCI. AFS financial assets carried at cost If there is an objective evidence that an impairment loss on an unquoted equity instrument that is not carried at fair value because its fair value cannot be reliably measured, the amount of the loss is measured as the difference between the carrying amount and the present value of estimated future cash flows discounted at the current market rate of return for a similar financial asset. Offsetting Financial Instruments Financial assets and financial liabilities are offset and the net amount reported in the consolidated statement of financial position if, and only if, there is a currently enforceable legal right to offset the recognized amounts and there is an intention to settle on a net basis, or to realize the asset and settle the liability simultaneously. Real Estate Inventories Real estate inventories consists of properties acquired or being constructed for sale in the ordinary course of business, rather than to be held for rental or capital appreciation, is held as inventory and is measured at the lower of cost and net realizable value (NRV).
Cost includes: • Acquisition cost of subdivision land • Amounts paid to contractors for construction and development of subdivision land and
residential units • Borrowing costs, planning and design costs, cost of site preparation, professional fees for
legal services, property transfer taxes, construction overheads and other related costs.
Nonrefundable commissions paid to sales or marketing agents on the sale of real estate units are expensed when paid. NRV is the estimated selling price in the ordinary course of the business, based on market prices at the reporting date and discounted for the time value of money, if material, less costs to complete and the estimated costs of sale. Valuation allowance is provided for subdivision land for sale and development, residential units for sale and development and undeveloped land when the NRV of the properties are less than their carrying amounts. The cost of inventory recognized in profit or loss on disposal is determined with reference to the specific costs incurred on the property sold and an allocation of any non-specific costs based on the relative size of the property sold. Investment in an Associate The investment in an associate is accounted for under the equity method of accounting. An associate is an entity in which the Group has significant influence and which is neither a subsidiary nor a joint venture. An investment is accounted for using the equity method from the day it becomes an associate. On acquisition of investment, the excess of the cost of investment over the investor’s share in the net fair value of the investee’s identifiable assets, liabilities and contingent liabilities is included in the carrying amount of the investment and not amortized. Any excess of the investor’s share of the net fair value of the associate’s identifiable assets,
- 17 -
*SGVMC114033*
liabilities and contingent liabilities over the cost of the investment is excluded from the carrying amount of the investment, and is instead included as income in the determination of the share in the earnings of the investees. Under the equity method, the investment in the investee companies is carried in the consolidated statement of financial position at cost plus post-acquisition changes in the Group’s share in the net assets of the investee companies, less any impairment in values. The consolidated statement of comprehensive income reflects the share of the results of the operations of the investee companies reflected as “Equity in net income of an associate”. The Group’s share of post-acquisition movements in the investee’s equity reserves is recognized directly in equity. Profits and losses resulting from transactions between the Group and the investee company are eliminated to the extent of the interest in the investee company and for unrealized losses to the extent that there is no evidence of impairment of the asset transferred. Dividends received are treated as a reduction of the carrying value of the investment.
The Group discontinues applying the equity method when their investment in investee company are reduced to zero. Accordingly, additional losses are not recognized unless the Group has guaranteed certain obligations of the investee company. When the investee company subsequently reports net income, the Group will resume applying the equity method but only after its share of that net income equals the share of net losses not recognized during the period the equity method was suspended. The reporting date of the investee company and the Group is identical with and its accounting policies conform to those used by the Group for like transactions and events in similar circumstances. Interests in Joint Ventures Interests in joint ventures (JV) represent one or more assets, usually in the form of cash, contributed to, or acquired for the purpose of the joint venture and dedicated to the purposes of the JV. The assets are used to obtain benefits for the venturers. Each venturer may take a share of the output from the assets and each bears an agreed share of the expenses incurred. These JV do not involve the establishment of a corporation, partnership or other entity, or a financial structure that is separate from the venturers themselves. Each venturer has control over its share of future economic benefits through its share of the jointly controlled asset. Property and Equipment Property and equipment, except for land, are carried at cost less accumulated depreciation and amortization and any impairment in value. Land is carried at cost less any impairment in value. The initial cost of property and equipment consists of its construction cost or purchase price and any directly attributable costs of bringing the asset to its working condition and location for its intended use. Subsequent costs are capitalized as part of property and equipment only when it is probable that future economic benefits associated with the item will flow to the Group and the cost of the items can be measured reliably. All other repairs and maintenance are charged against current operations as incurred. Depreciation and amortization of property and equipment commences once the property and equipment are available for use and computed using the straight-line basis over the estimated useful life of property and equipment as follows:
- 18 -
*SGVMC114033*
Years Building 20 Transportation equipment 2 to 5 Office furniture, fixtures and equipment 2 to 5 Construction equipment 2 to 5 Other fixed assets 1 to 5
The useful life and depreciation and amortization method are reviewed annually to ensure that the period and method of depreciation and amortization are consistent with the expected pattern of economic benefits from items of property and equipment. When property and equipment are retired or otherwise disposed of, the cost of the related accumulated depreciation and amortization and accumulated provision for impairment losses, if any, are removed from the accounts and any resulting gain or loss is credited to or charged against current operations.
System Development Costs Costs associated with developing or maintaining computer software programs are recognized as an expense as incurred. Costs, that are directly associated with identifiable and unique software controlled by the Group and will generate economic benefits exceeding costs beyond one year, are recognized as intangible assets to be measured at cost less accumulated amortization and provision for probable losses, if any. Expenditures which enhance or extend the performance of computer software programs beyond their original specifications are recognized as capital improvements and added to the original cost of the software. System development costs, recognized as assets, are amortized using the straight-line method over their useful lives, but not exceeding a period of three years. Where an indication of impairment exists, the carrying amount of computer system development costs is assessed and written down immediately to its recoverable amount. Business Combination Business combination between entities under common control Business combination between entities under common control is accounted under historical cost basis similar to pooling of interest method. Under pooling of interest method, the assets and liabilities of the combining entities are reflected at their carrying amounts. No adjustments are made to reflect fair values, or recognize any new assets or liabilities. No ‘new’ goodwill is recognized as a result of the combination. The only goodwill that is recognized is any existing goodwill relating to either of the combining entities. Any difference between the consideration paid and the equity ‘acquired’ is reflected in additional-paid-in capital. The consolidated statement of comprehensive income reflects the results of the combining entities for the full year, irrespective of when the combination took place. Comparatives are presented as if the entities had always been combined. The combined entities accounted for by the pooling of interests method reports results of operations for the period in which the combination occurs as though the entities had been combined as of the beginning of the period. The effects of intercompany transactions on current assets, current liabilities, revenue, and cost of sales for the periods presented and on retained earnings at the beginning of the periods presented are eliminated to the extent possible. Similarly, statements of financial position and other financial information of the separate entities as of the beginning of the period are presented as though the entities had been combined at that date. Financial statements and financial information of the separate entities
- 19 -
*SGVMC114033*
presented for prior years are also restated on a combined basis to furnish comparative information. Business combination (other than under common control) and goodwill (negative goodwill) Business combinations involving entities not under common control, that qualified for purchase method. The cost of an acquisition is measured as the fair value of the assets given, equity instruments issued and liabilities incurred or assumed at the date of exchange, plus costs directly attributable to the acquisition. Identifiable assets (including previously unrecognized intangible assets) acquired and liabilities and contingent liabilities assumed in a business combination are measured initially at fair values at the date of acquisition, irrespective of the extent of any minority interest.
Goodwill is initially measured at cost being the excess of the cost of the business combination over the Group’s share in the net fair value of the acquiree’s identifiable assets, liabilities and contingent liabilities. If the cost of the acquisition is less than the fair value of the net assets of the subsidiary acquired, the difference is recognized directly in the profit and loss.
After initial recognition, goodwill is measured at cost less any accumulated impairment loss. For the purpose of the impairment testing, goodwill acquired in a business combination is, from the acquisition date, allocated to each of the Group’s cash generating unit (CGU) that are expected to benefit from the synergies of the combination, irrespective of whether other assets or liabilities of the acquiree are assigned to those units. If the initial accounting for a business combination can only be determined on a provisional basis by the end of the period in which the combination is effected because either the fair values to be assigned to the acquiree’s identifiable assets, liabilities or contingent liabilities or the cost of the combination can be determined only provisionally, the Parent Company accounts for the combination using those provisional values. The Parent Company recognizes any adjustment to those provisional values as a result of completing the initial accounting within 12 months from the acquisition date. Impairment of Nonfinancial Assets The Group assesses as at reporting date whether there is an indication that its nonfinancial asset may be impaired. If any such indication exists, or when annual impairment testing for an asset is required, the Group makes an estimate of the asset’s recoverable amount. An asset’s recoverable amount is calculated as the higher of the asset’s or CGU’s fair value less costs to sell and its value in use or its net selling price and is determined for an individual asset, unless the asset does not generate cash inflows that are largely independent of those assets or groups of assets. Where the carrying amount of an asset exceeds its recoverable amount, the asset is considered impaired and is written down to its recoverable amount. In assessing value in use, the estimated future cash flows are discounted to their present value using a pre-tax discount rate that reflects current market assessment of the time value of money and the risks specific to the asset. Impairment losses of continuing operations are recognized in the consolidated statement of comprehensive income in those expense categories consistent with the function of the impaired asset. For assets excluding goodwill, an assessment is made at each reporting date as to whether there is an indication that previously recognized impairment losses may no longer exist or may have decreased. If such indication exists, the recoverable amount is estimated. A previously recognized impairment loss is reversed only if there has been a change in the estimates used to determine the asset’s recoverable amount since the last impairment loss was recognized. If that is the case, the carrying amount of the asset is increased to its recoverable

- 20 -
*SGVMC114033*
amount. That increased amount cannot exceed the carrying amount that would have been determined, net of depreciation and amortization, had no impairment loss been recognized for the asset in prior years. Such reversal is recognized in the consolidated statement of comprehensive income unless the asset is carried at revalued amount, in which case the reversal is treated as revaluation increase in the other comprehensive income. After such reversal, the depreciation and amortization charge is adjusted in future periods to allocate the asset’s revised carrying amount, less any residual value, on a systematic basis over its remaining useful life. The following criteria are also applied in assessing impairment of specific assets:
Investments in an associate After application of the equity method, the Group determines whether it is necessary to recognize any additional impairment loss with respect to the Group’s net investment in the investee companies. The Group determines at each reporting date whether there is any objective evidence that the investment in an associate is impaired. If this is the case, the Group calculates the amount of impairment as being the difference between the fair value and the carrying value of the investee company and recognizes the difference in the consolidated statement of comprehensive income.
Revenue and Cost Recognition Real estate revenue Real estate revenue and cost from completed projects is accounted for using the full accrual method. The percentage of completion method is used to recognize income from sales of projects where the Group has material obligations under the sales contract to complete the project after the property is sold. Under this method, revenue is recognized as the related obligations are fulfilled, measured principally in relation to cost incurred to date over the total cost of the project. When a sale of real estate does not meet the requirements for revenue recognition, the sale is accounted for under the deposit method. Under this method, revenue is not recognized, and the receivable from the buyer is not recorded. The real estate inventories continue to be reported on the consolidated statement of financial position as “Real estate inventories” and the related liability as deposits under “Customers’ advances and deposits”.
Any excess of collections over the recognized receivables are included in the “Customers’ advances and deposits” account in the liabilities section of the consolidated statement of financial position.
Interest income Interest is recognized as it accrues (using the effective interest method i.e, the rate that exactly discounts estimated future cash receipts through the expected life of the financial instrument to the net carrying amount of the financial asset). Pension Cost Pension cost is actuarially determined using the projected unit credit method. This method reflects services rendered by employees up to the date of valuation and incorporates assumptions concerning employees’ projected salaries. Actuarial valuations are conducted with sufficient regularity, with option to accelerate when significant changes to underlying assumptions occur. Pension cost includes current service cost, interest cost, expected return on any plan assets, actuarial gains and losses and the effect of any curtailments or settlements.

- 21 -
*SGVMC114033*
The Group recognizes gains or losses on curtailment or settlement of a defined benefit plan when the curtailment or settlement occurs. Losses on settlements or curtailments are measured at the date on which the Group becomes demonstrably committed to the transaction. Gains on settlements or curtailments are measured at the date on which all parties, whose consent is required, are irrevocably committed. The gains or losses on curtailment or settlement shall comprise the following: • any resulting change in the present value of the defined benefit obligation;
• any resulting change in fair value of plans; and • any related actuarial gains and losses and past service cost that had not previously been
recognized. The net pension liability recognized in the consolidated statement of financial position in respect of the defined benefit pension plan is the present value of the defined benefit obligation at the reporting date less the fair value of the plan assets, together with adjustments for unrecognized actuarial gains or losses and past service costs that shall be recognized in later periods. The defined benefit obligation is calculated by an independent actuary using the projected unit credit method. The present value of the defined benefit obligation is determined using risk-free interest rate of government bonds that have terms to maturity approximating to the terms of the related pension liability or applying a single weighted average discount rate that reflects the estimated timing and amount of benefit payments. The actuarial gains and losses arising from experience adjustments and changes in actuarial assumptions are immediately charged to or credited to profit or loss. Past service cost, if any, is recognized immediately in income, unless the changes to the pension plan are conditional on the employees remaining in service for a specified period of time (the vesting period). In this case, the past service cost is amortized on a straight-line basis over the vesting period.
Income Taxes Current tax Current tax assets and liabilities for the current and prior periods are measured at the amount expected to be recovered from or paid to the taxation authorities. The tax rates and tax laws used to compute the amount are those that are enacted or substantially enacted by the reporting date. Deferred tax Deferred income tax is provided using the liability method on temporary differences, with certain exceptions, at the reporting date between the tax bases of assets and liabilities and their carrying amounts for financial reporting purposes. Deferred tax liabilities are recognized for all taxable temporary differences, with certain exceptions. Deferred tax assets are recognized for all deductible temporary differences, carryforward benefit of unused tax credits from excess of minimum corporate income tax (MCIT) over the regular corporate income tax and unused net operating loss carryover (NOLCO), to the extent that it is probable that taxable profit will be available against which the deductible temporary differences and carryforward of unused tax credits from MCIT and

- 22 -
*SGVMC114033*
NOLCO can be utilized. The carrying amount of deferred tax assets is reviewed at each reporting date and reduced to the extent that it is no longer probable that sufficient taxable profits will be available to allow the deferred tax assets to be utilized. Unrecognized deferred tax assets are reassessed at each reporting date and are recognized to the extent that it has become probable that future taxable profit will allow the deferred tax asset to be recovered. Deferred tax assets and liabilities are measured at the tax rate that is expected to apply in the period when the asset is realized or the liability is settled, based on tax rates and tax laws that have been enacted or substantially enacted at the reporting date. Deferred tax assets and deferred tax liabilities are offset if a legally enforceable right exists to set off current tax assets against current tax liabilities, and the deferred taxes relate to the same taxable entity and the same taxation authority. Commission The Group recognizes commission when services are rendered by the broker. The commission expense is accrued upon receipt of down payment from the buyer comprising a substantial portion of the contract price and the capacity to pay and credit worthiness of buyers have been reasonably established for sales under the deferred cash payment arrangement. Operating Leases Leases where the lessor retains substantially all the risks and benefits of the ownership of the asset are classified as operating leases. Fixed lease payments are recognized as expense on a straight-line basis over the lease term while the variable rent is recognized as an expense based on the terms of the lease contract.
Foreign Currency Transactions and Translations Each entity in the Group determines its own functional currency and items included in the financial statements of each entity are measured using that functional currency. Transactions in foreign currencies are initially recorded in the functional currency rate ruling at the date of the transaction. Monetary assets and liabilities denominated in foreign currencies are retranslated at the functional currency rate of exchange ruling at the reporting date. All differences are taken to the consolidated statement of comprehensive income. Nonmonetary items measured at fair value in a foreign currency are translated using the exchange rates at the date when the fair value was determined. Provisions Provisions are recognized when the Group has a present obligation (legal or constructive) as a result of a past event, it is probable that an outflow of resources embodying economic benefits will be required to settle the obligation and a reliable estimate can be made of the amount of the obligation. Where the Group expects a provision to be reimbursed, the reimbursement is recognized as a separate asset but only when the reimbursement is virtually certain. If the effect of the time value of money is material, provisions are determined by discounting the expected future cash flows at a pre-tax rate that reflects current market assessments of the time value of money and, where appropriate, the risks specific to the liability. Where discounting is used, the increase in the provision due to the passage of time is recognized as interest expense. Provisions are reviewed at each reporting date and adjusted to reflect the current best estimate.
- 23 -
*SGVMC114033*
Borrowing costs Interest and other financing costs incurred during the construction period on borrowings used to finance property development are capitalized as part of development costs (included in “Real estate inventories and development” account in the statement of financial position). Capitalization of borrowing costs commences when the activities to prepare the asset are in progress and expenditures and borrowing costs are being incurred. Capitalization of borrowing costs ceases when substantially all the activities necessary to prepare the asset for its intended use or sale are complete. If the carrying amount of the asset exceeds its recoverable amount, an impairment loss is recorded.
The interest capitalized is calculated using the Parent Company’s weighted average cost of borrowings after adjusting for borrowings associated with specific developments. Where borrowings are associated with specific developments, the amounts capitalized is the gross interest incurred on those borrowings less any investment income arising on their temporary investment. Interest is capitalized from the commencement of the development work until the date of practical completion. The capitalization of finance costs is suspended if there are prolonged periods when development activity is interrupted. Interest is also capitalized on the purchase cost of a site of property acquired specifically for redevelopment but only where activities necessary to prepare the asset for redevelopment are in progress. Treasury Stock Treasury stock is recorded at cost and is presented as a deduction from equity. When the shares are retired, the capital stock account is reduced by its par value and the excess of cost over par value upon retirement is debited to additional paid-in capital when the shares were issued and to retained earnings for the remaining balance.
Basic and Diluted Earnings Per Share (EPS) EPS is computed by dividing net income for the year attributable to common stockholders by the weighted average number of common shares issued and outstanding during the year adjusted for any subsequent stock dividends declared. Diluted EPS is computed by dividing net income for the year by the weighted average number of common shares issued and outstanding during the year after giving effect to assumed conversion of potential common shares. The calculation of diluted earnings per share does not assume conversion, exercise, or other issue of potential common shares that would have an antidilutive effect on earnings per share.
Segment Reporting The Group’s operating businesses are organized and managed separately according to the nature of the products and services provided, with each segment representing a strategic business unit that offers different products and serves different markets. Financial information on business segments is presented in Note 5. Contingencies Contingent liabilities are not recognized in the consolidated financial statements. These are disclosed unless the possibility of an outflow of resources embodying economic benefits is remote. Contingent assets are not recognized in the consolidated financial statements but disclosed when an inflow of economic benefits is probable. Subsequent Events Post year-end events that provide additional information about the Group’s position at the reporting date (adjusting events) are reflected in the consolidated financial statements. Post year-end events that are not adjusting events are disclosed in the notes to the consolidated

- 24 -
*SGVMC114033*
financial statements when material. 3. Significant Accounting Judgments and Estimates
The preparation of the consolidated financial statements in compliance with PFRS requires management to make estimates and assumptions that affect the amounts reported in the consolidated financial statements and accompanying notes. The estimates and assumptions used in the consolidated financial statements are based upon management’s evaluation of relevant facts and circumstances as at the date of the consolidated financial statements. Actual results could differ from such estimates. Estimates and judgments are continually evaluated and are based on historical experience and other factors, including expectations of future events that are believed to be reasonable under the circumstances. Judgments In the process of applying the accounting policies, management has made the following judgments, apart from those involving estimations, which have the most significant effect on the amounts recognized in the consolidated financial statements:
Revenue recognition Selecting an appropriate revenue recognition method for a particular real estate sale transaction requires certain judgments based on, among others: • Buyer’s commitment on the sale which may be ascertained through the significance of
the buyer’s initial investment; and • Stage of completion of the project. The Group’s revenue recognition policies require management to make use of estimates and assumptions that may affect the reported amounts of revenues and costs. The Group’s revenue from real estate sales are recognized based on the percentage-of-completion and the completion rate is measured principally on the basis of the estimated completion of a physical proportion of the contract work, and by reference to the actual costs incurred to date over the estimated total costs of the project. The related balances from real estate transactions follow:
2009 2008 2007 Revenue P=9,629,663,010 P=10,435,822,103 P=8,223,600,691 Costs of real estate 5,003,984,152 5,273,025,863 4,031,363,221
Operating lease commitments - the Group as lessee The Group has entered into contract of lease for some of the office space it occupies. The Group has determined that all significant risks and benefits of ownership on these properties will be retained by the lessor. In determining significant risks and benefits of ownership, the Group considered, among others, the significance of the lease term as compared with the estimated useful life of the related asset. Impairment of AFS financial assets carried at cost The Group follows the guidance of PAS 39 in determining when an asset is impaired. This determination requires significant judgment. In making this judgment, the Group evaluates, among other factors, the duration and extent to which the fair value of an investment is less

- 25 -
*SGVMC114033*
than its cost; the financial health of and near-term business outlook of the investee, including factors such as industry and sector performance, changes in technology and operational and financing cash flow. Contingencies The Group is currently involved in various legal proceedings. The estimate of probable costs for the resolution of these claims has been developed in consultation with outside counsel handling the defense in these matters and is based upon an analysis of potential results. The Group currently does not believe that these proceedings will have a material effect on the Group’s financial position (see Note 31). Management’s Use of Estimates The key assumptions concerning the future and other key sources of estimation uncertainty at the reporting date , that have a significant risk of causing a material adjustment to the carrying amounts of assets and liabilities within the next financial year are discussed below. Revenue and cost recognition The Group’s revenue recognition policies require management to make use of estimates and assumptions that may affect the reported amounts of revenue and costs. The Group’s revenue from real estate is recognized based on the percentage of completion measured principally on the basis of the estimated completion of a physical proportion of the contract work, and by reference to the actual costs incurred to date over the estimated total costs of the project. Estimating allowance for impairment losses on receivables The Group maintains allowances for impairment losses based on the result of the individual and collective assessment under PAS 39. For both individual and collective assessment, the Group is required to obtain the present value of estimated cash flows using the receivable’s original effective interest rate. The estimated cash flows considers the management’s estimate of proceeds from the disposal of the collateral less cost to repair, cost to sell and return of deposit due to the defaulting party. The cost to repair and cost to sell are based on historical experience. The methodology and assumptions used for the individual and collective assessments are based on management’s judgments and estimates made for the year. The balance of the Group’s receivable, net of allowance for impairment loss amounted to P=18,137.62 million and P=18,072.87 million as of December 31, 2009 and 2008, respectively (see Note 8). Evaluation of asset impairment The Group reviews investments in associates and jointly controlled entities, investment properties, property and equipment and other noncurrent assets for impairment of value. This includes considering certain indications of impairment such as significant changes in asset usage, significant decline in assets’ market value, obsolescence or physical damage of an asset, plans in the real estate projects, significant underperformance relative to expected historical or projected future operating results and significant negative industry or economic trends. As described in the accounting policy, the Group estimates the recoverable amount as the higher of the net selling price and value in use. In determining the present value of estimated future cash flows expected to be generated from the continued use of the assets, the Group is required to make estimates and assumptions that may affect investments in an associate, interest in joint ventures, property and equipment, and other assets. See Notes 12, 14 and 15 for the related balances. Evaluation of net realizable value of real estate for sale and development
- 26 -
*SGVMC114033*
The Group reviews real estate for sale and development for probable impairment in value. The management’s judgment in determining if the real estate for sale and development is impaired is based on the assessment of the asset’s estimated net selling price and the management’s plan in discontinuing the real estate projects. Estimated selling price is derived from publicly available market data and historical experience, while estimated selling costs are basically commission expense based on historical experience. Management would also obtain the services of an independent appraiser to determine fair value of undeveloped land based on the latest selling prices of the properties of the same characteristics of the undeveloped land. The Real estate inventories amounted to P=28,721.67 million and P=25,246.60 million as of December 31, 2009 and 2008, respectively (see Note 9). Estimating useful lives of property and equipment The Group estimates the useful lives of property and equipment based on the period over which the assets are expected to be available for use. The estimated useful lives of property and equipment are reviewed at least annually and are updated if expectations differ from previous estimates due to physical wear and tear and technical or commercial obsolescence on the use of these property and equipment. It is possible that future results of operations could be materially affected by changes in these estimates brought about by changes in factors mentioned above. The Property and equipment amounted to P=92.19 million and P=94.80 million as of December 31, 2009 and December 31, 2008, respectively (see Note 13).
Deferred tax assets The Group reviews the carrying amounts of deferred income taxes at each reporting date and reduces deferred tax assets to the extent that it is no longer probable that sufficient taxable profit will be available to allow all or part of the deferred tax assets to be utilized. However, there is no assurance that the Group will generate sufficient taxable profit to allow all or part of deferred tax assets to be utilized. The Group looks at its projected performance in assessing the sufficiency of future taxable income. The balance of deferred tax assets amounted to P=147.32 million and P=417.50 million as of December 31, 2009 and 2008, respectively (see Note 26). Estimating pension obligation and other retirement benefits The determination of the Group’s pension liabilities is dependent on selection of certain assumptions used by actuaries in calculating such amounts. Those assumptions are described in Note 23 and include among others, discount rates, expected returns on plan assets and rates of salary increase. While the Group believes that the assumptions are reasonable and appropriate, significant differences in actual experience or significant changes in assumptions may materially affect retirement obligations. The pension liabilities amounted to P=132.45 million and P=14.78 million as of December 31, 2009 and 2008, respectively (see Note 24). Fair value of financial instruments Where the fair values of financial assets and financial liabilities recorded in the consolidated statement of financial position cannot be derived from active markets, they are determined using internal valuation techniques using generally accepted market valuation models. The inputs to these models are taken from observable markets where possible, but where this is not feasible, estimates are used in establishing fair values. These estimates may include considerations of liquidity, volatility, and correlation. Certain financial assets and liabilities were initially recorded at its fair value by using the discounted cash flow methodology (see Note 28).

- 27 -
*SGVMC114033*
4. Business Combinations
Acquisition of VRI On October 29, 2009, the Parent Company, acquired from Polar Property Holdings, Inc. (PPHI) and various shareholders 100% ownership of VRI in exchange of 320,686,000 treasury shares valued at P=660.61 million plus P=1.00 million cash. The fair value of the shares is the published price of the shares of the Parent Company at the acquisition date. The Parent Company accounted for the acquisition using the purchase method. The Group has acquired VRI to consolidate the development and selling of all vertical and high-rise condominium projects of the Group under a new brand name “Vista Residences”. The brand consolidation is intended to have a clearer and stronger market identity of the Group’s vertical development projects. Moreover, the acquisition of VRI is part of the Group’s strategic focus to broaden its real estate portfolio and increase its revenue base. The Group indirectly acquired four mixed residential and commercial condominium projects namely, the Symphony Tower 1, Presidio Complex, Madison Place Tower and Crown Tower. Accordingly, VRI’s financial statements are consolidated on a line-by-line basis with that of the Group as of December 31, 2009. The accounting for business combination was done provisionally due to lack of proper fair value estimate of assets acquired and liabilities assumed as of to date.
Following is a summary of the fair value of the identifiable assets and liabilities assumed of VRI as at the date of acquisition:
Fair value on the date of
acquisition Assets Cash and cash equivalents P=15,838,024 Receivables 644,357,268 Real estate inventories and development 500,032,234 Property and equipment - net 6,266,266 Receivable from related parties 386,720,835 Deferred tax asset - net 23,330,697 Prepayments and other assets 181,357,628 1,757,902,952 Liabilities Bank loans 268,158,856 Accounts and other payables 286,113,295 Customers’ deposits 213,628,981 Due to related parties 311,586,318 Income tax payable 282,942 Pension liabilities 16,519,400 1,096,289,792 Total identifiable net assets at fair value 661,613,160 Goodwill arising on acquisition – Purchase consideration transferred P=661,613,160
- 28 -
*SGVMC114033*
Receivables were valued at its carrying amount as of date of acquisition. None of the receivables have been impaired and that is expected that the full contractual amount can be collected. From the date of acquisition, VRI has contributed P=510.05 million of revenue and P=84.36 million to the income before income tax of the Group. If the combination had taken place at the beginning of the year, revenue would have been P=1.15 billion and the net income for the Group would have been P=195.01 million. Analysis of net cash acquired from the business combination follows:
Net cash acquired with the subsidiary (included in the cash flows from investing activities)
P=15,838,024
Transaction costs of the acquisition (included in the cash flows from operating activities)
(2,500,000)
Cash paid to minority holders of VRI (1,000,000) Net cash flow on the acquisition P=12,338,024
The Parent Company issued 320,686,000 treasury shares as consideration for the 97.50% interest in VRI. The fair value of the shares is the published price of the shares of the Parent Company at the acquisition date. The fair value of consideration transferred amounted to P=661.61 million. The transaction costs of P=2.0 million have been expensed and are included in administrative expenses.
5. Segment Information
For management purposes, the Group’s operating segments are organized and managed separately according to the nature of the products provided, with each segment representing a strategic business unit that offers different products and serves different markets. The Group has two reportable operating segments as follows: Horizontal Projects The housing market segment of the Group that caters on the development and selling of residential lots and units, and affordable housing units and lots. Vertical Projects This segment caters the development and selling of residential high-rise condominium projects across the Philippines. Vertical home projects involve dealing with longer gestation periods and requirements that are different from those of horizontal homes. Management monitors the operating results of its business units separately for the purpose of making decisions about resource allocation and performance assessment. Segment performance is evaluated based on segment operating income or loss before income tax. Segment operating income or loss before income tax is based on the same accounting policies as consolidated operating income or loss. The Group has no intersegment revenues. Group financing (including interest income and interest expense and other financing charges), equity in net income of an associate, unrealized foreign exchange gains and losses and income taxes are managed on a group basis and are not allocated to operating segments. No operating segments have been aggregated to form the above reportable operating business segments. The chief operating decision-maker has been identified as the chief executive officer

- 29 -
*SGVMC114033*
(CODM). The CODM reviews the Group’s internal reports in order to assess performance of the Group. The financial information about the operations of these business segments for the three years ended December 31 is summarized below (amounts in thousands):
2009
Horizontal
Vertical Adjustments and
Eliminations Total Real Estate Revenue P=7,736,870 P=1,892,793 P=– P=9,629,663 Cost of Real Estate 3,835,286 1,168,698 – 5,003,984 Gross Profit 3,901,584 724,095 – 4,625,679 Operating expenses 1,727,246 356,327 – 2,083,573 Segment income before income tax 2,174,338 367,768 – 2,542,106 Interest income 845,927 11,369 – 857,296 Equity in net income of an associate
(Note 12) 45,943 – – 45,943 Miscellaneous income 237,225 42,523 – 279,748 Interest and other financing charges
(Note 21) (454,755) (138,227) – (592,982) Unrealized foreign exchange gain (loss) (11,653) 11,042 – (611) Dividend income 194 – – 194 Loss on debt settlement (Note 19) (318,810) – – (318,810) Income before income tax 2,518,409 294,475 – 2,812,884 Provision for income tax 508,642 4,834 – 513,476 Net income P=2,009,767 P=289,641 P=– P=2,299,408 Other Information Segment assets P=47,491,219 P=6,162,384 P=– P=53,653,603 Investment in an associate (Note 11) 693,674 – – 693,674 Deferred tax assets 147,323 – – 147,323 AFS financial assets 288,937 – – 288,937 Total Assets P=48,621,153 P=7,678,182 (P=1,515,798) P=54,783,537 Segment liabilities P=10,910,981 P=5,286,011 P=– P=16,196,992 Payable to related parties – 1,944,704 (1,515,798) 428,906 Deferred tax liabilities 2,532,971 – – 2,532,971 Total Liabilities P=13,443,952 P=7,230,715 (P=1,515,798) P=19,158,869 Capital expenditures P=4,251,632 P=3,802,857 P=– P=8,054,489 Depreciation and amortization (Note 13) 84,994 10,168 – 95,162 Provision for impairment losses (Note 8) – 11,079 – 11,079
2008
Horizontal
Vertical Adjustments and
Eliminations Total Real Estate Revenue P=9,592,486 P=843,336 P=– P=10,435,822 Cost of Real Estate 4,736,773 536,253 – 5,273,026 Gross Profit 4,855,713 307,083 – 5,162,796 Operating expenses 1,798,594 212,641 – 2,011,235 Segment income before income tax 3,057,119 94,442 – 3,151,561 Interest income 818,619 3,083 – 821,702 Equity in net income of an associate 10,225 – – 10,225 Miscellaneous income 321,936 20,874 – 342,810 Interest and other financing charge
(Note 21) (319,294) (72,121) – (391,415) Unrealized foreign exchange loss (180,897) – – (180,897) Income before income tax 3,707,708 46,278 – 3,753,986 Provision for income tax 918,047 2,803 – 920,850 Net income P=2,789,661 P=43,475 P=– P=2,833,136
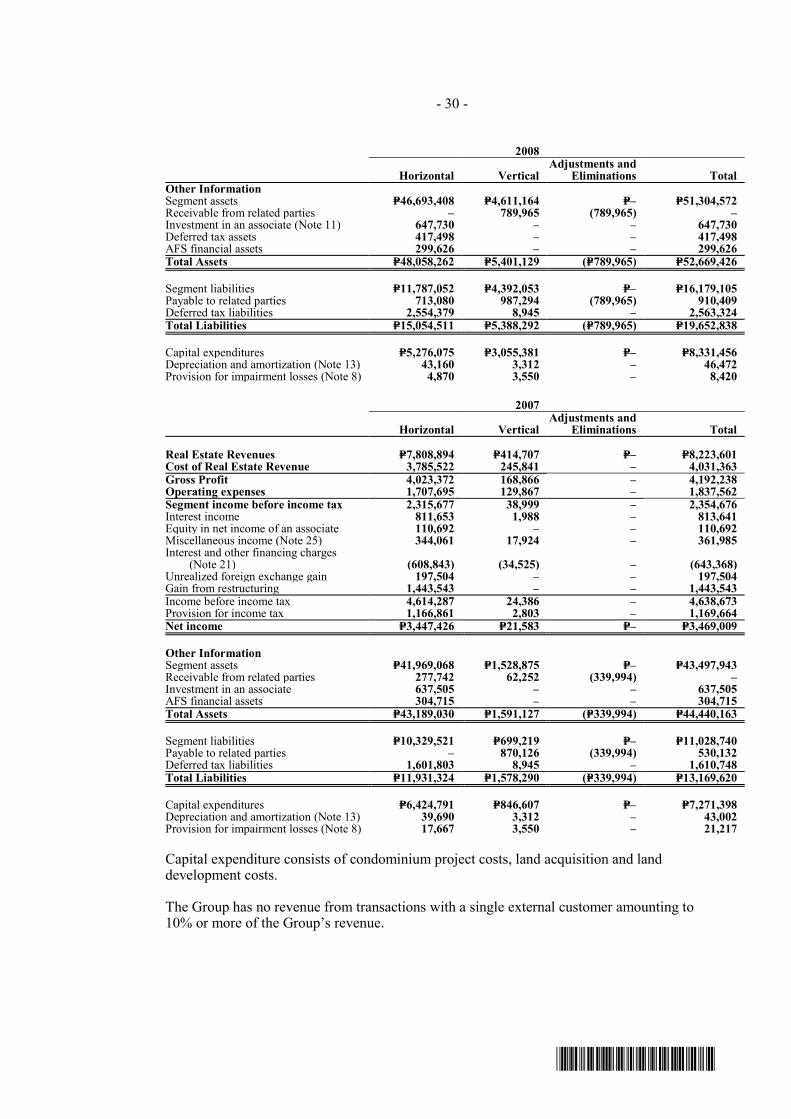
- 30 -
*SGVMC114033*
2008
Horizontal
Vertical Adjustments and
Eliminations Total Other Information Segment assets P=46,693,408 P=4,611,164 P=– P=51,304,572 Receivable from related parties – 789,965 (789,965) – Investment in an associate (Note 11) 647,730 – – 647,730 Deferred tax assets 417,498 – – 417,498 AFS financial assets 299,626 – – 299,626 Total Assets P=48,058,262 P=5,401,129 (P=789,965) P=52,669,426 Segment liabilities P=11,787,052 P=4,392,053 P=– P=16,179,105 Payable to related parties 713,080 987,294 (789,965) 910,409 Deferred tax liabilities 2,554,379 8,945 – 2,563,324 Total Liabilities P=15,054,511 P=5,388,292 (P=789,965) P=19,652,838 Capital expenditures P=5,276,075 P=3,055,381 P=– P=8,331,456 Depreciation and amortization (Note 13) 43,160 3,312 – 46,472 Provision for impairment losses (Note 8) 4,870 3,550 – 8,420
2007
Horizontal
Vertical Adjustments and
Eliminations Total Real Estate Revenues P=7,808,894 P=414,707 P=– P=8,223,601 Cost of Real Estate Revenue 3,785,522 245,841 – 4,031,363 Gross Profit 4,023,372 168,866 – 4,192,238 Operating expenses 1,707,695 129,867 – 1,837,562 Segment income before income tax 2,315,677 38,999 – 2,354,676 Interest income 811,653 1,988 – 813,641 Equity in net income of an associate 110,692 – – 110,692 Miscellaneous income (Note 25) 344,061 17,924 – 361,985 Interest and other financing charges
(Note 21) (608,843) (34,525) – (643,368) Unrealized foreign exchange gain 197,504 – – 197,504 Gain from restructuring 1,443,543 – – 1,443,543 Income before income tax 4,614,287 24,386 – 4,638,673 Provision for income tax 1,166,861 2,803 – 1,169,664 Net income P=3,447,426 P=21,583 P=– P=3,469,009 Other Information Segment assets P=41,969,068 P=1,528,875 P=– P=43,497,943 Receivable from related parties 277,742 62,252 (339,994) – Investment in an associate 637,505 – – 637,505 AFS financial assets 304,715 – – 304,715 Total Assets P=43,189,030 P=1,591,127 (P=339,994) P=44,440,163 Segment liabilities P=10,329,521 P=699,219 P=– P=11,028,740 Payable to related parties – 870,126 (339,994) 530,132 Deferred tax liabilities 1,601,803 8,945 – 1,610,748 Total Liabilities P=11,931,324 P=1,578,290 (P=339,994) P=13,169,620 Capital expenditures P=6,424,791 P=846,607 P=– P=7,271,398 Depreciation and amortization (Note 13) 39,690 3,312 – 43,002 Provision for impairment losses (Note 8) 17,667 3,550 – 21,217 Capital expenditure consists of condominium project costs, land acquisition and land development costs. The Group has no revenue from transactions with a single external customer amounting to 10% or more of the Group’s revenue.

- 31 -
*SGVMC114033*
6. Cash and Cash Equivalents
This account consists of:
2009 2008 Cash on hand P=10,004,852 P=5,946,046 Cash in banks 2,193,867,216 2,418,260,334 Cash equivalents 806,768,427 2,590,327,578 P=3,010,640,495 P=5,014,533,958
Cash in banks earns interest at the prevailing bank deposit rates. Cash equivalents are short-term investments that are made for varying periods of up to three months depending on the immediate cash requirements of the Group and earn interest at the respective short-term investment rates.
7. Short-term Cash Investments
Short-term cash investments consist of money market placements with maturities of more than three months up to one year and earn interest at the prevailing short-term investments rates ranging from 5.00% to 6.50% in 2009 and 5.0% to 8.5% in 2008.
8. Receivables
This account consists of:
2009 2008Installment contract receivables (Note 28) P=15,702,478,476 P=16,019,521,931Accounts receivable - contractors 1,123,224,373 2,361,336,414Accounts receivable - brokers 20,819,070 15,503,388Accounts receivable - employees 9,078,370 7,604,890Other receivables 1,606,995,302 343,766,550 18,462,595,591 18,747,733,173Less allowance for impairment losses (324,973,753) (674,860,845) 18,137,621,838 18,072,872,328Less noncurrent portion 8,370,231,418 5,187,818,787
P=9,767,390,420 P=12,885,053,541
Installment contracts receivable consist of accounts collectible in equal monthly installments with various terms up to a maximum of fifteen years. The corresponding titles to the subdivision units sold under this arrangement are transferred to the buyers only upon full payment of the contract price. The installment contracts receivable are interest bearing except for those that are with installment schemes within two years. Interest rates on installment contracts receivables ranges from 16% and 19%.
In 2008, the Group entered into various purchase agreements with financial institutions whereby the Group sold its installment contracts receivables as of December 31, 2009 and 2008. The purchase agreements provide that the Group should substitute defaulted contracts to sell with other contracts to sell of equivalent value. The Group still retains the sold receivables in the receivables account and records the proceeds from these sales as loans payable (see Note 16). The carrying value of installment contracts receivables sold amounted

- 32 -
*SGVMC114033*
to P=4,229.22 million and P=3,464.64 million in 2009 and 2008, respectively.
In 2009, the Group entered into agreement with various financial institutions whereby the Group sold its real estate receivables without recourse at discount rate of 14%. Total carrying value of receivables sold amounted to P=1.50 billion. Total net proceeds received from the purchasing banks and discount on sold receivables recorded by the Group amounted to P=1.43 billion and P=66.00 million, respectively. The discount has been included under “Interest and other financing charges” account in the consolidated statement of comprehensive income.
Receivables amounting to P=324.97 million and P=674.86 million as of December 31, 2009 and December 31, 2008, respectively, were impaired and fully provided for. Movements in the allowance for impairment losses are as follows:
2009
Receivable from
Installment Contracts
Receivable Others Total At January 1 P=88,273,035 P=586,587,810 P=674,860,845 Charges for the year 11,079,149 – 11,079,149 Reversal for the year – (349,887,092) (349,887,092) At December 31 P=88,273,035 P=236,700,718 P=324,973,753
2008
Receivable from
Installment Contracts
Receivable Others Total At January 1 P=82,840,116 P=583,601,026 P=666,441,142 Charge for the year 5,432,919 2,986,784 8,419,703 At December 31 P=88,273,035 P=586,587,810 P=674,860,845
The impairment losses above pertain to individually impaired accounts. These are presented as gross amounts before directly deducting impairment allowance. No impairment losses resulted from performing collective impairment test.
As of December 31, 2009 and 2008, receivables with a nominal amount of P=1,301.39 million and P=1,054.90 million, respectively, were recorded at amortized cost amounting to P=1,237.80 million and P=948.71 million, respectively. These are receivables that are to be collected in 2 years which are noninterest bearing. The fair value upon initial recognition is derived using discounted cash flow model using the discount rate ranging from 4.69% to 11.20% for those recognized in 2009, and from 5% to 12% for those recognized in 2008. Interest income recognized from these receivables amounted to P=84.68 million, P=79.35 million and P=24.60 million in 2009, 2008 and 2007, respectively. The unamortized discount amounted to P=89.12 million and P=126.30 million as of December 31, 2009 and 2008, respectively.
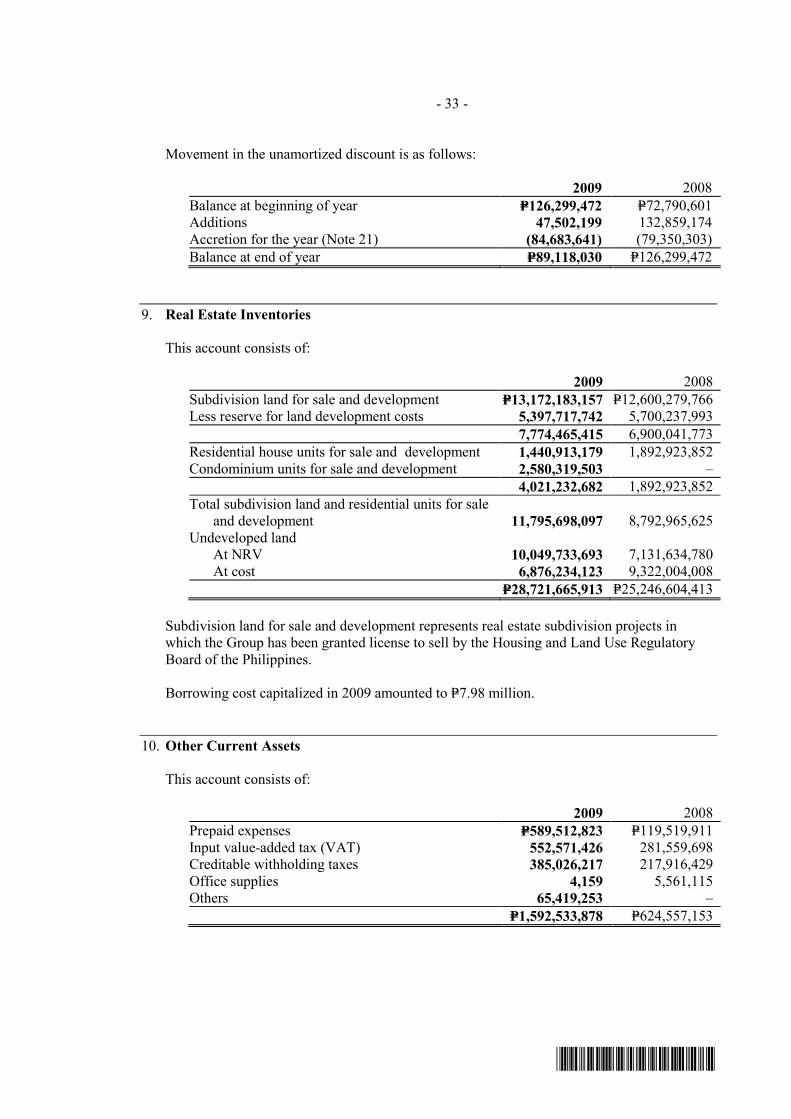
- 33 -
*SGVMC114033*
Movement in the unamortized discount is as follows:
2009 2008 Balance at beginning of year P=126,299,472 P=72,790,601 Additions 47,502,199 132,859,174 Accretion for the year (Note 21) (84,683,641) (79,350,303) Balance at end of year P=89,118,030 P=126,299,472
9. Real Estate Inventories This account consists of:
2009 2008 Subdivision land for sale and development P=13,172,183,157 P=12,600,279,766 Less reserve for land development costs 5,397,717,742 5,700,237,993 7,774,465,415 6,900,041,773 Residential house units for sale and development 1,440,913,179 1,892,923,852 Condominium units for sale and development 2,580,319,503 – 4,021,232,682 1,892,923,852 Total subdivision land and residential units for sale and development 11,795,698,097 8,792,965,625 Undeveloped land At NRV 10,049,733,693 7,131,634,780 At cost 6,876,234,123 9,322,004,008 P=28,721,665,913 P=25,246,604,413
Subdivision land for sale and development represents real estate subdivision projects in which the Group has been granted license to sell by the Housing and Land Use Regulatory Board of the Philippines. Borrowing cost capitalized in 2009 amounted to P=7.98 million.
10. Other Current Assets
This account consists of:
2009 2008 Prepaid expenses P=589,512,823 P=119,519,911 Input value-added tax (VAT) 552,571,426 281,559,698 Creditable withholding taxes 385,026,217 217,916,429 Office supplies 4,159 5,561,115 Others 65,419,253 – P=1,592,533,878 P=624,557,153
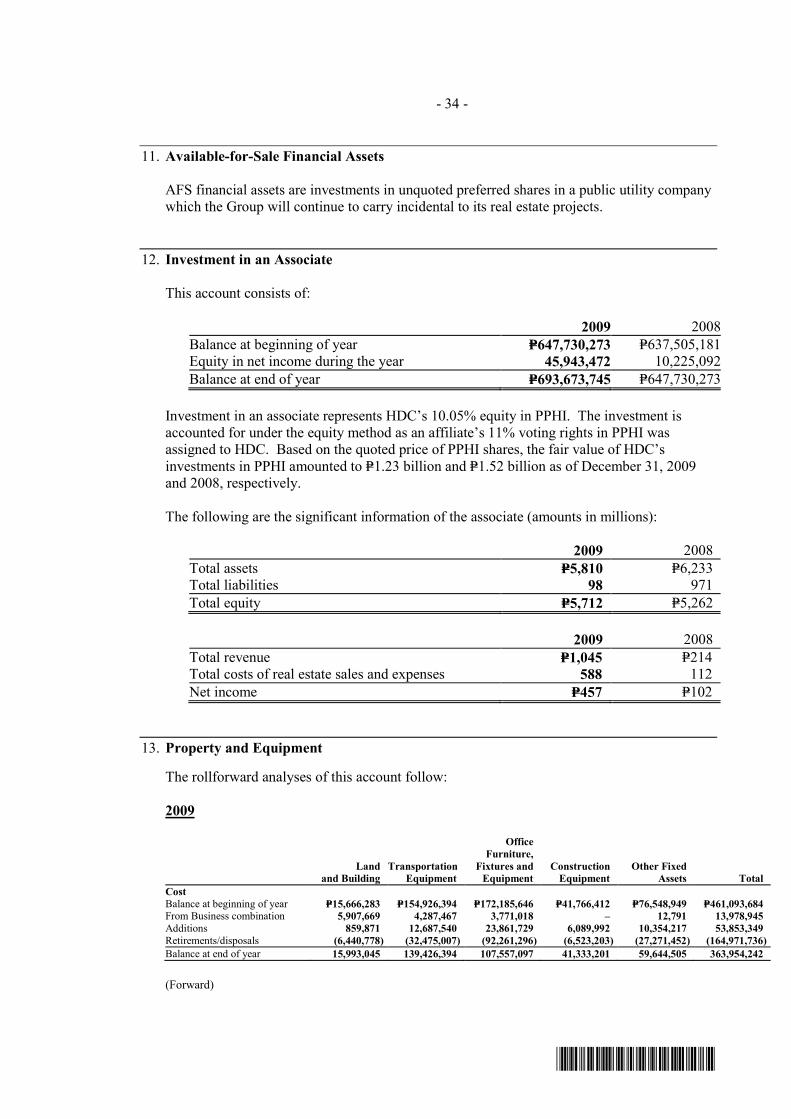
- 34 -
*SGVMC114033*
11. Available-for-Sale Financial Assets
AFS financial assets are investments in unquoted preferred shares in a public utility company which the Group will continue to carry incidental to its real estate projects.
12. Investment in an Associate
This account consists of:
2009 2008Balance at beginning of year P=647,730,273 P=637,505,181Equity in net income during the year 45,943,472 10,225,092Balance at end of year P=693,673,745 P=647,730,273
Investment in an associate represents HDC’s 10.05% equity in PPHI. The investment is accounted for under the equity method as an affiliate’s 11% voting rights in PPHI was assigned to HDC. Based on the quoted price of PPHI shares, the fair value of HDC’s investments in PPHI amounted to P=1.23 billion and P=1.52 billion as of December 31, 2009 and 2008, respectively. The following are the significant information of the associate (amounts in millions):
2009 2008 Total assets P=5,810 P=6,233 Total liabilities 98 971 Total equity P=5,712 P=5,262
2009 2008 Total revenue P=1,045 P=214 Total costs of real estate sales and expenses 588 112 Net income P=457 P=102
13. Property and Equipment
The rollforward analyses of this account follow: 2009
Land
and Building Transportation
Equipment
Office Furniture,
Fixtures and Equipment
Construction Equipment
Other Fixed Assets Total
Cost Balance at beginning of year P=15,666,283 P=154,926,394 P=172,185,646 P=41,766,412 P=76,548,949 P=461,093,684 From Business combination 5,907,669 4,287,467 3,771,018 – 12,791 13,978,945 Additions 859,871 12,687,540 23,861,729 6,089,992 10,354,217 53,853,349 Retirements/disposals (6,440,778) (32,475,007) (92,261,296) (6,523,203) (27,271,452) (164,971,736) Balance at end of year 15,993,045 139,426,394 107,557,097 41,333,201 59,644,505 363,954,242
(Forward)
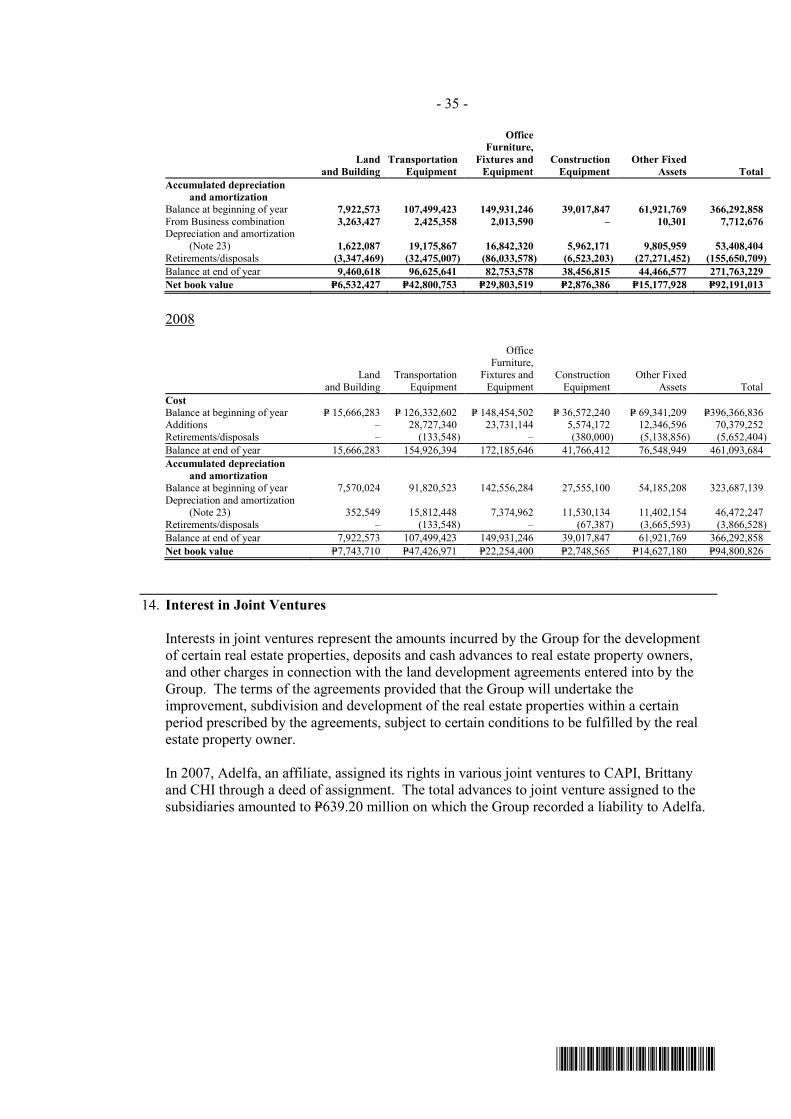
- 35 -
*SGVMC114033*
Land
and Building Transportation
Equipment
Office Furniture,
Fixtures and Equipment
Construction Equipment
Other Fixed Assets Total
Accumulated depreciation and amortization Balance at beginning of year 7,922,573 107,499,423 149,931,246 39,017,847 61,921,769 366,292,858 From Business combination 3,263,427 2,425,358 2,013,590 – 10,301 7,712,676 Depreciation and amortization (Note 23) 1,622,087 19,175,867 16,842,320 5,962,171 9,805,959 53,408,404 Retirements/disposals (3,347,469) (32,475,007) (86,033,578) (6,523,203) (27,271,452) (155,650,709) Balance at end of year 9,460,618 96,625,641 82,753,578 38,456,815 44,466,577 271,763,229 Net book value P=6,532,427 P=42,800,753 P=29,803,519 P=2,876,386 P=15,177,928 P=92,191,013
2008
Land
and Building Transportation
Equipment
Office Furniture,
Fixtures and Equipment
Construction Equipment
Other Fixed Assets Total
Cost Balance at beginning of year P= 15,666,283 P= 126,332,602 P= 148,454,502 P= 36,572,240 P= 69,341,209 P=396,366,836 Additions – 28,727,340 23,731,144 5,574,172 12,346,596 70,379,252 Retirements/disposals – (133,548) – (380,000) (5,138,856) (5,652,404) Balance at end of year 15,666,283 154,926,394 172,185,646 41,766,412 76,548,949 461,093,684 Accumulated depreciation and amortization Balance at beginning of year 7,570,024 91,820,523 142,556,284 27,555,100 54,185,208 323,687,139 Depreciation and amortization (Note 23) 352,549 15,812,448 7,374,962 11,530,134 11,402,154 46,472,247 Retirements/disposals – (133,548) – (67,387) (3,665,593) (3,866,528) Balance at end of year 7,922,573 107,499,423 149,931,246 39,017,847 61,921,769 366,292,858 Net book value P=7,743,710 P=47,426,971 P=22,254,400 P=2,748,565 P=14,627,180 P=94,800,826
14. Interest in Joint Ventures
Interests in joint ventures represent the amounts incurred by the Group for the development of certain real estate properties, deposits and cash advances to real estate property owners, and other charges in connection with the land development agreements entered into by the Group. The terms of the agreements provided that the Group will undertake the improvement, subdivision and development of the real estate properties within a certain period prescribed by the agreements, subject to certain conditions to be fulfilled by the real estate property owner. In 2007, Adelfa, an affiliate, assigned its rights in various joint ventures to CAPI, Brittany and CHI through a deed of assignment. The total advances to joint venture assigned to the subsidiaries amounted to P=639.20 million on which the Group recorded a liability to Adelfa.
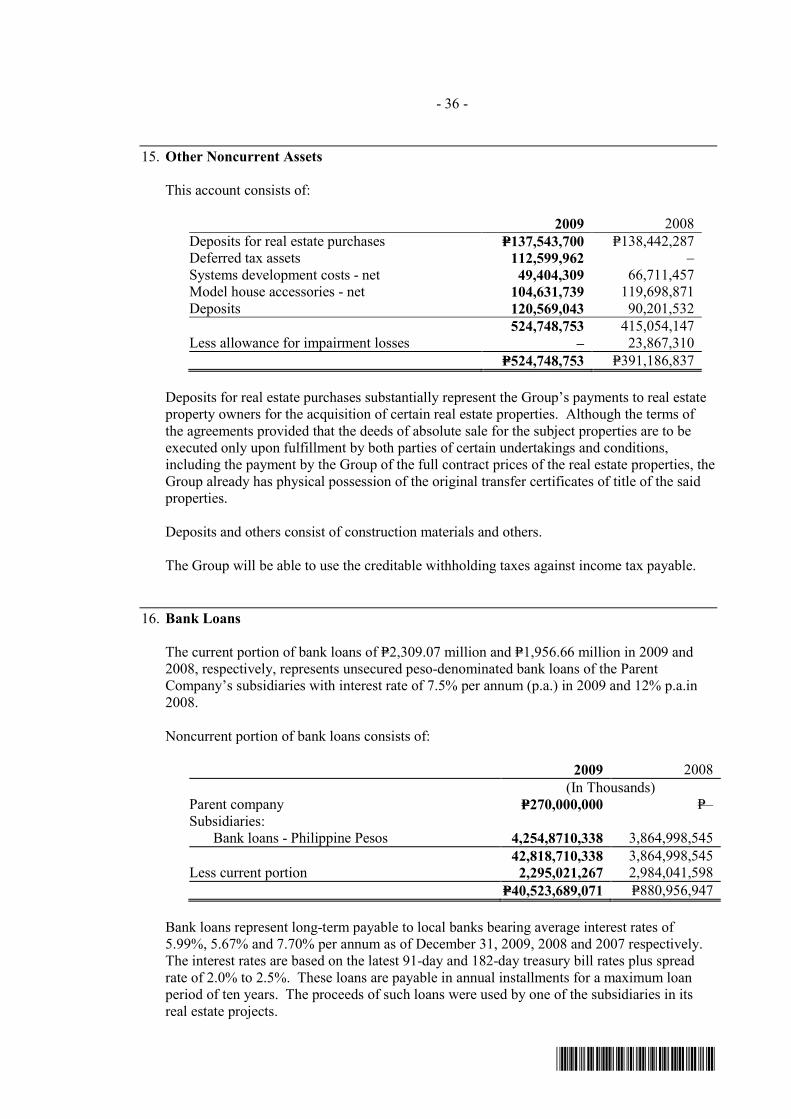
- 36 -
*SGVMC114033*
15. Other Noncurrent Assets
This account consists of:
2009 2008 Deposits for real estate purchases P=137,543,700 P=138,442,287 Deferred tax assets 112,599,962 – Systems development costs - net 49,404,309 66,711,457 Model house accessories - net 104,631,739 119,698,871 Deposits 120,569,043 90,201,532 524,748,753 415,054,147 Less allowance for impairment losses – 23,867,310 P=524,748,753 P=391,186,837
Deposits for real estate purchases substantially represent the Group’s payments to real estate property owners for the acquisition of certain real estate properties. Although the terms of the agreements provided that the deeds of absolute sale for the subject properties are to be executed only upon fulfillment by both parties of certain undertakings and conditions, including the payment by the Group of the full contract prices of the real estate properties, the Group already has physical possession of the original transfer certificates of title of the said properties. Deposits and others consist of construction materials and others. The Group will be able to use the creditable withholding taxes against income tax payable.
16. Bank Loans
The current portion of bank loans of P=2,309.07 million and P=1,956.66 million in 2009 and 2008, respectively, represents unsecured peso-denominated bank loans of the Parent Company’s subsidiaries with interest rate of 7.5% per annum (p.a.) in 2009 and 12% p.a.in 2008. Noncurrent portion of bank loans consists of:
2009 2008 (In Thousands) Parent company P=270,000,000 P=– Subsidiaries: Bank loans - Philippine Pesos 4,254,8710,338 3,864,998,545 42,818,710,338 3,864,998,545 Less current portion 2,295,021,267 2,984,041,598 P=40,523,689,071 P=880,956,947
Bank loans represent long-term payable to local banks bearing average interest rates of 5.99%, 5.67% and 7.70% per annum as of December 31, 2009, 2008 and 2007 respectively. The interest rates are based on the latest 91-day and 182-day treasury bill rates plus spread rate of 2.0% to 2.5%. These loans are payable in annual installments for a maximum loan period of ten years. The proceeds of such loans were used by one of the subsidiaries in its real estate projects.
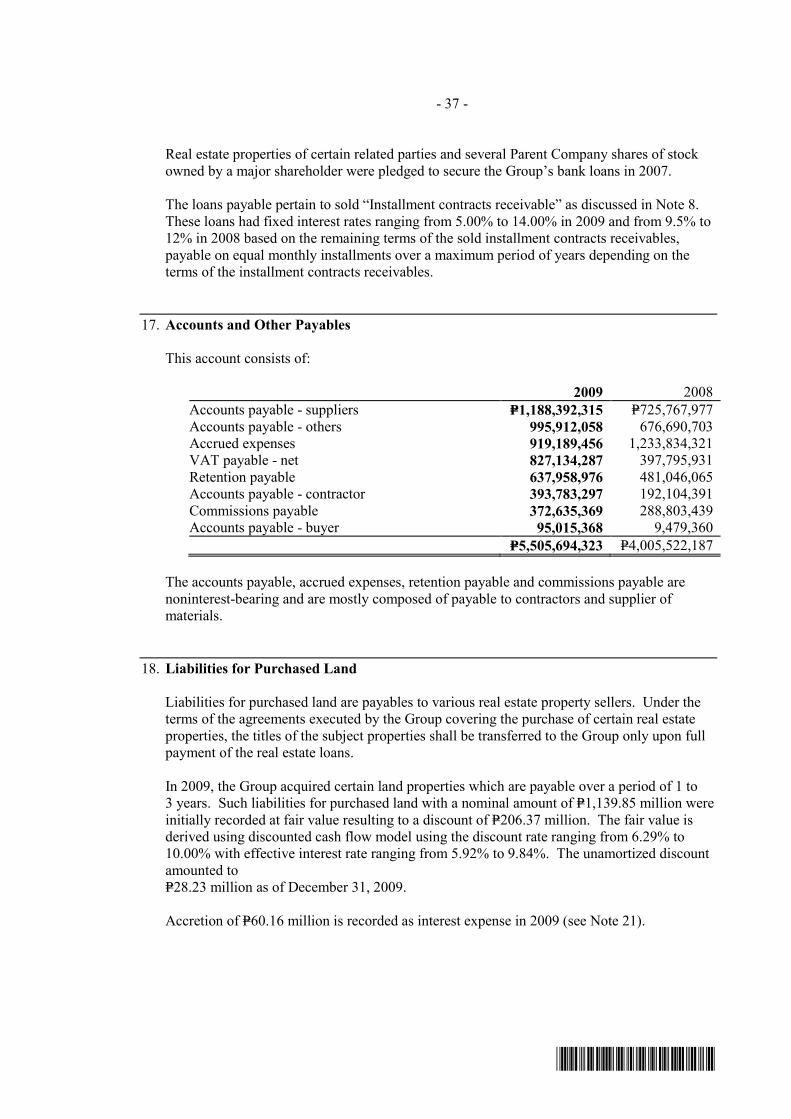
- 37 -
*SGVMC114033*
Real estate properties of certain related parties and several Parent Company shares of stock
owned by a major shareholder were pledged to secure the Group’s bank loans in 2007.
The loans payable pertain to sold “Installment contracts receivable” as discussed in Note 8. These loans had fixed interest rates ranging from 5.00% to 14.00% in 2009 and from 9.5% to 12% in 2008 based on the remaining terms of the sold installment contracts receivables, payable on equal monthly installments over a maximum period of years depending on the terms of the installment contracts receivables.
17. Accounts and Other Payables
This account consists of:
2009 2008 Accounts payable - suppliers P=1,188,392,315 P=725,767,977 Accounts payable - others 995,912,058 676,690,703 Accrued expenses 919,189,456 1,233,834,321 VAT payable - net 827,134,287 397,795,931 Retention payable 637,958,976 481,046,065 Accounts payable - contractor 393,783,297 192,104,391 Commissions payable 372,635,369 288,803,439 Accounts payable - buyer 95,015,368 9,479,360 P=5,505,694,323 P=4,005,522,187
The accounts payable, accrued expenses, retention payable and commissions payable are noninterest-bearing and are mostly composed of payable to contractors and supplier of materials.
18. Liabilities for Purchased Land
Liabilities for purchased land are payables to various real estate property sellers. Under the terms of the agreements executed by the Group covering the purchase of certain real estate properties, the titles of the subject properties shall be transferred to the Group only upon full payment of the real estate loans.
In 2009, the Group acquired certain land properties which are payable over a period of 1 to 3 years. Such liabilities for purchased land with a nominal amount of P=1,139.85 million were initially recorded at fair value resulting to a discount of P=206.37 million. The fair value is derived using discounted cash flow model using the discount rate ranging from 6.29% to 10.00% with effective interest rate ranging from 5.92% to 9.84%. The unamortized discount amounted to P=28.23 million as of December 31, 2009.
Accretion of P=60.16 million is recorded as interest expense in 2009 (see Note 21).

- 38 -
*SGVMC114033*
19. Long-term Commercial Papers, Floating Rate Notes Payable and Long-term Notes
This account consists of:
2009 2008 Long-term Commercial Papers (LTCPs) P=660,378,117 P=24,080,100 Long-term Notes (LTN) 271,870,000 1,474,565,769
Long-term Commercial Papers On October 18, 1996, the SEC approved the CHI’s issuance of LTCPs amounting to P=3.00 billion divided into two tranches with details as follows:
Tranche Series Amount Issue Date Maturity Date I A P=750,000,000 November 06, 1996 November 06, 2001 B 750,000,000 November 06, 1996 November 06, 2003 II A 750,000,000 November 13, 1996 November 13, 2001 B 750,000,000 November 13, 1996 November 13, 2003 3,000,000,000 Payments and redemptions in 2005 (694,227,154) Payments and redemptions in 2007 (70,748,408) Payments and redemptions in 2008 (21,394,338) Payments and redemptions in 2009 (22,210,100) 2,191,420,000 Conversion to equity 2005 (2,189,550,000) P=1,870,000 Series A LTCPs bear interest at one percent (1%) above the 91-day treasury bill rate while interest on Series B LTCPs bear interest at one-eighth percent (0.125%) above the 91-day treasury bill rate. Interest on both LTCP series is payable quarterly in arrears and is subject to repricing every 91 days. The LTCPs shall, however, be subject to a minimum annual interest rate of 10%. The LTCPs provide for certain restrictions and requirements with respect to, among others, the mortgage, pledge or other encumbrances or security interest whatsoever over the whole or any part of the CHI’s current and future assets or revenue, issuance or sale of commercial papers of any kind during a specified period and maintenance of certain financial ratios. On November 6 and November 13, 2001, the Series A LTCPs matured and became due. On November 6 and 13, 2003, the Series B LTCPs also matured and became due. On November 14, 2005, CHI’s stockholders approved the decrease in authorized capital stock from P=5,000,000,000 divided into 5,000,000,000 shares with par value of P=1 to P=500,000,000 divided into 500,000,000 shares with the same par value with a corresponding decrease in CHI’s issued capital from P=4,796,071,929 divided into 4,796,071,929 shares to P=479,607,192 divided into 479,607,192 shares with the same par value of P=1. The decrease in the number of issued shares reverted to additional paid-in capital of P=4,316,464,737 which can be used to partially wipe out CHI’s deficit. On the same date, CHI’s stockholders also approved the increase in CHI’s authorized capital stock from P=500,000,000 divided into 500,000,000 shares with par value of P=1 to P=7,000,000,000 divided into 7,000,000,000 shares with the same par value.
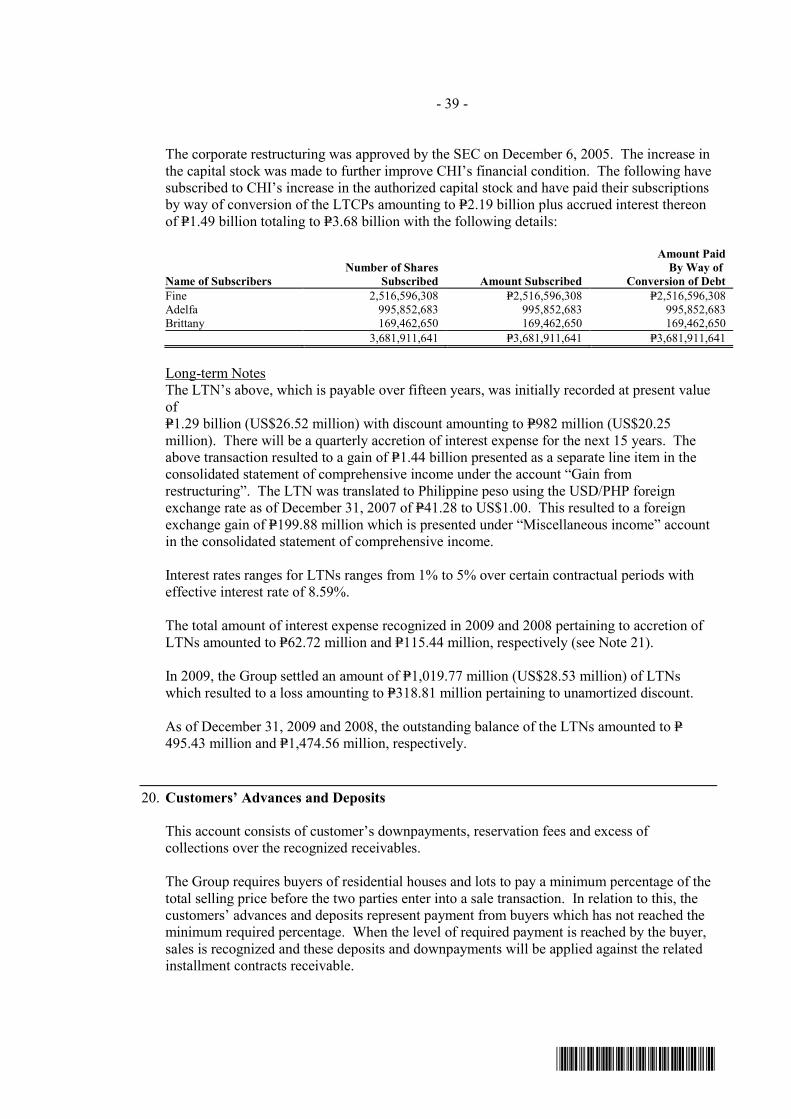
- 39 -
*SGVMC114033*
The corporate restructuring was approved by the SEC on December 6, 2005. The increase in the capital stock was made to further improve CHI’s financial condition. The following have subscribed to CHI’s increase in the authorized capital stock and have paid their subscriptions by way of conversion of the LTCPs amounting to P=2.19 billion plus accrued interest thereon of P=1.49 billion totaling to P=3.68 billion with the following details:
Name of Subscribers Number of Shares
Subscribed Amount Subscribed
Amount Paid By Way of
Conversion of Debt Fine 2,516,596,308 P=2,516,596,308 P=2,516,596,308 Adelfa 995,852,683 995,852,683 995,852,683 Brittany 169,462,650 169,462,650 169,462,650 3,681,911,641 P=3,681,911,641 P=3,681,911,641 Long-term Notes The LTN’s above, which is payable over fifteen years, was initially recorded at present value of P=1.29 billion (US$26.52 million) with discount amounting to P=982 million (US$20.25 million). There will be a quarterly accretion of interest expense for the next 15 years. The above transaction resulted to a gain of P=1.44 billion presented as a separate line item in the consolidated statement of comprehensive income under the account “Gain from restructuring”. The LTN was translated to Philippine peso using the USD/PHP foreign exchange rate as of December 31, 2007 of P=41.28 to US$1.00. This resulted to a foreign exchange gain of P=199.88 million which is presented under “Miscellaneous income” account in the consolidated statement of comprehensive income. Interest rates ranges for LTNs ranges from 1% to 5% over certain contractual periods with effective interest rate of 8.59%. The total amount of interest expense recognized in 2009 and 2008 pertaining to accretion of LTNs amounted to P=62.72 million and P=115.44 million, respectively (see Note 21). In 2009, the Group settled an amount of P=1,019.77 million (US$28.53 million) of LTNs which resulted to a loss amounting to P=318.81 million pertaining to unamortized discount. As of December 31, 2009 and 2008, the outstanding balance of the LTNs amounted to P=495.43 million and P=1,474.56 million, respectively.
20. Customers’ Advances and Deposits
This account consists of customer’s downpayments, reservation fees and excess of collections over the recognized receivables. The Group requires buyers of residential houses and lots to pay a minimum percentage of the total selling price before the two parties enter into a sale transaction. In relation to this, the customers’ advances and deposits represent payment from buyers which has not reached the minimum required percentage. When the level of required payment is reached by the buyer, sales is recognized and these deposits and downpayments will be applied against the related installment contracts receivable.

- 40 -
*SGVMC114033*
21. Interest Income and Other Financing Charges
Below are the details of interest income:
2009 2008 2007 Installment contracts receivable P=678,921,021 P=548,786,317 P=620,041,141 Cash and short term investments 117,361,853 193,565,866 168,996,110 Accretion of unamortized discount for the
two (2) year noninterest-bearing receivables (Note 8) 61,013,246 79,350,303 24,604,155
P=857,296,120 P=821,702,486 813,641,406
Interest expense and other financing charges consist of:
2009 2008 2007 Interest expense on:
Bank loans P=478,078,475 P=258,294,644 P=536,845,114 LTN 62,721,408 115,440,509 89,021,692 540,799,883 373,735,153 625,866,806
Less amounts capitalized 7,979,118 Add accretion of discount 60,161,371 17,680,100 17,501,304 P=592,982,136 P=391,415,253 P=643,368,110
The capitalization rate used to determine the borrowings eligible for capitalization is 14.5% in 2009. The total interest and other financing charges pertain to interest expense on loan and borrowings, except for the amount of P=115.44 million and P=17.68 million in 2008 and P=17.50 million in 2007, which pertain to the interest expense arising from the accretion of LTNs and liabilities for purchased land in 2007, respectively.
22. Related Party Transactions
Parties are considered to be related if one party has the ability, directly or indirectly, to control the other party in making financial and operating decisions or the parties are subject to common control or common significant influence (referred herein as affiliates). Related parties may be individuals or corporate entities.
The Group in their regular conduct of business has entered into transactions with related parties principally consisting of advances and reimbursement of expenses, development, management, marketing, leasing and administrative service agreements. Transactions entered by the Group with related parties are made at terms equivalent to those that prevail in arm’s length transactions. Outstanding balances at year-end are unsecured, interest free and settlement occurs in cash. Except as stated in Note 16, there have been no guarantees provided or received for any related party receivables or payables. For the year ended December 31, 2009 and 2008, the Group have not recorded any impairment of receivables relating to amounts owed by related parties. This assessment is undertaken each financial year by examining the financial position of the related party and the market in which the related party operates.
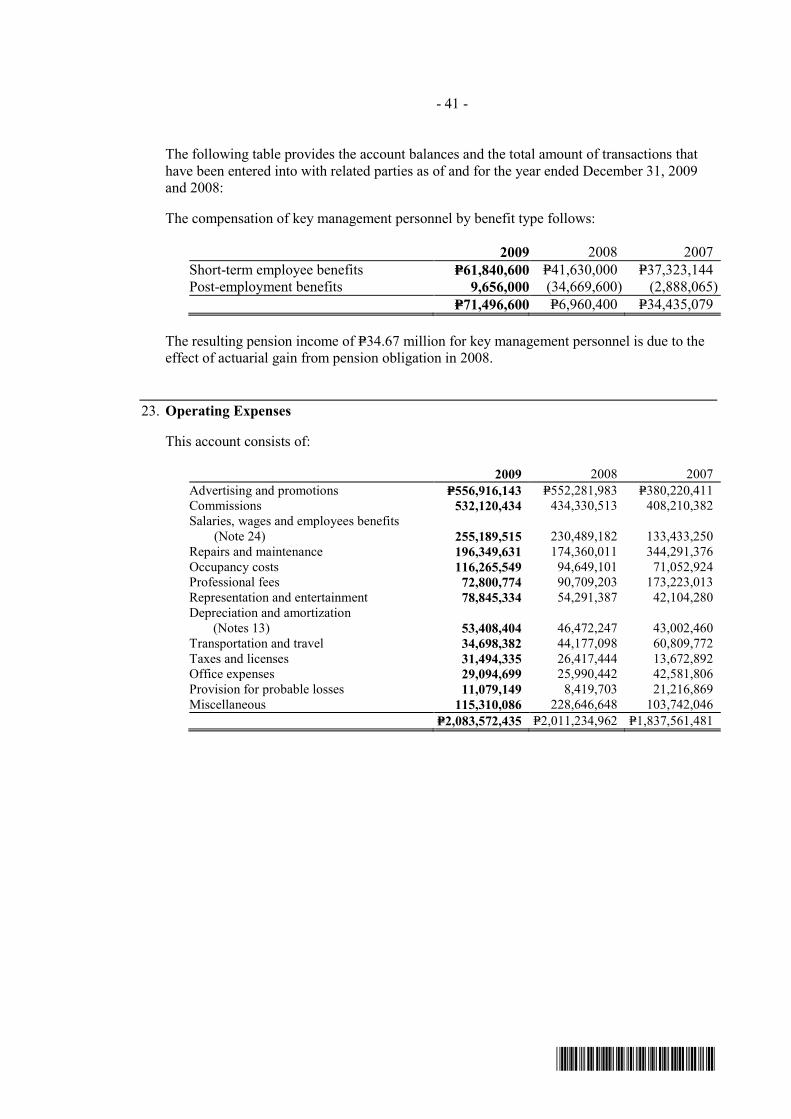
- 41 -
*SGVMC114033*
The following table provides the account balances and the total amount of transactions that have been entered into with related parties as of and for the year ended December 31, 2009 and 2008:
The compensation of key management personnel by benefit type follows:
2009 2008 2007 Short-term employee benefits P=61,840,600 P=41,630,000 P=37,323,144 Post-employment benefits 9,656,000 (34,669,600) (2,888,065) P=71,496,600 P=6,960,400 P=34,435,079
The resulting pension income of P=34.67 million for key management personnel is due to the effect of actuarial gain from pension obligation in 2008.
23. Operating Expenses
This account consists of:
2009 2008 2007 Advertising and promotions P=556,916,143 P=552,281,983 P=380,220,411 Commissions 532,120,434 434,330,513 408,210,382 Salaries, wages and employees benefits
(Note 24) 255,189,515 230,489,182 133,433,250 Repairs and maintenance 196,349,631 174,360,011 344,291,376 Occupancy costs 116,265,549 94,649,101 71,052,924 Professional fees 72,800,774 90,709,203 173,223,013 Representation and entertainment 78,845,334 54,291,387 42,104,280 Depreciation and amortization (Notes 13) 53,408,404 46,472,247 43,002,460 Transportation and travel 34,698,382 44,177,098 60,809,772 Taxes and licenses 31,494,335 26,417,444 13,672,892 Office expenses 29,094,699 25,990,442 42,581,806 Provision for probable losses 11,079,149 8,419,703 21,216,869 Miscellaneous 115,310,086 228,646,648 103,742,046 P=2,083,572,435 P=2,011,234,962 P=1,837,561,481

- 42 -
*SGVMC114033*
24. Retirement Plan
The Group has noncontributory defined benefit pension plan covering substantially all of its regular employees. The benefits are based on current salaries and years of service and compensation on the last year of employment. The components of pension cost (included in “Salaries, wages and employees benefits” under Operating expenses) in the consolidated statement of comprehensive income are as follows (see Note 23):
2009 2008 2007Current service cost P=7,842,200 P=22,623,100 P=23,472,500Interest cost on benefit obligation 4,300,000 12,924,700 11,963,200Net actuarial losses (gains) immediately recognized 116,433,600 (120,815,736) (56,292,400)Total pension expense (income) P=128,575,800 (P=85,267,936) (P=20,856,700)
The resulting total pension income of P=85.27 and P=20.86 million in 2008 and 2007, respectively, is due to the effect of actuarial gain from pension obligation immediately recognized. The actuarial gain is principally the result of changes in discount rate used as of December 31, 2008 against the January 1, 2008 rate. The gain is shown within “Miscellaneous income” in the consolidated statement of comprehensive income. The funded status and amounts recognized in the consolidated statement of financial position for the pension plan as of December 31 follow:
2009 2008 Defined benefit obligation P=150,440,899 P=14,776,999 Plan assets (17,986,869) – Liability recognized in the consolidated statement
of financial position P=132,454,030 P=14,776,999 Changes in the present value of the defined benefit obligation (included in “Pension liabilities” in the consolidated statement of financial position) are as follows:
2009 2008 Balance at January 1 P=14,776,999 P=100,044,935 Current service cost 7,842,200 22,623,100 Addition through business combination 7,088,100 – Interest cost benefit obligation 4,300,000 12,924,700 Actuarial loss (gain) 116,433,600 (120,815,736) Balance at December 31 P=150,440,899 P=14,776,999
In 2009, the Group contributed to its retirement fund a total amount of P=17,986,869. The contribution was invested in fixed income securities.
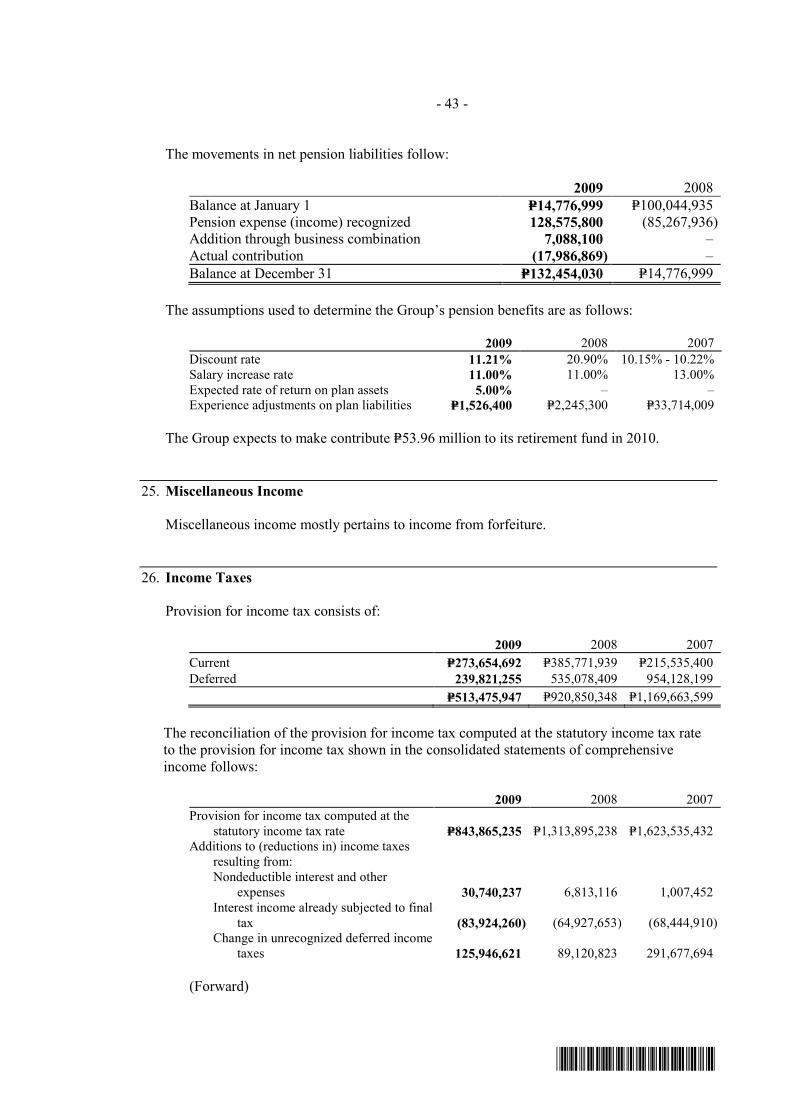
- 43 -
*SGVMC114033*
The movements in net pension liabilities follow:
2009 2008 Balance at January 1 P=14,776,999 P=100,044,935 Pension expense (income) recognized 128,575,800 (85,267,936) Addition through business combination 7,088,100 – Actual contribution (17,986,869) – Balance at December 31 P=132,454,030 P=14,776,999
The assumptions used to determine the Group’s pension benefits are as follows:
2009 2008 2007 Discount rate 11.21% 20.90% 10.15% - 10.22% Salary increase rate 11.00% 11.00% 13.00% Expected rate of return on plan assets 5.00% – – Experience adjustments on plan liabilities P=1,526,400 P=2,245,300 P=33,714,009
The Group expects to make contribute P=53.96 million to its retirement fund in 2010. 25. Miscellaneous Income
Miscellaneous income mostly pertains to income from forfeiture.
26. Income Taxes
Provision for income tax consists of:
2009 2008 2007 Current P=273,654,692 P=385,771,939 P=215,535,400 Deferred 239,821,255 535,078,409 954,128,199 P=513,475,947 P=920,850,348 P=1,169,663,599
The reconciliation of the provision for income tax computed at the statutory income tax rate to the provision for income tax shown in the consolidated statements of comprehensive income follows:
2009 2008 2007 Provision for income tax computed at the statutory income tax rate P=843,865,235 P=1,313,895,238 P=1,623,535,432 Additions to (reductions in) income taxes resulting from: Nondeductible interest and other expenses 30,740,237 6,813,116 1,007,452 Interest income already subjected to final tax (83,924,260) (64,927,653) (68,444,910) Change in unrecognized deferred income taxes 125,946,621 89,120,823 291,677,694
(Forward)

- 44 -
*SGVMC114033*
2009 2008 2007 Tax-exempt income (P=378,411,286) (P=293,440,147) (P=525,843,286) Dividend income (58,302) Effect of change in statutory tax rate (291,768) (127,321,698) (115,452,450) Equity in net income of an associate (13,783,042) (3,578,982) (41,322,774) Expired MCIT and NOLCO (10,607,488) 289,651 4,506,441 Provision for income tax P=513,475,947 P=920,850,348 P=1,169,663,599
The components of net deferred tax liabilities follow:
2009 2008 Deferred tax assets on: Allowance for probable losses P=242,526,632 P=276,611,612 NOLCO 69,062,357 59,189,643 Unrealized foreign exchange losses 56,404,406 49,051,985 Unamortized discount on receivables 19,577,290 22,793,426 Carryforward benefit of MCIT 9,023,811 6,303,562 Accrual of retirement costs 39,736,209 3,547,417 436,330,705 417,497,645 Deferred tax liabilities on: Unrealized gain on real estate transactions, unamortized discount on LTNs and others 3,062,129,784 2,563,324,062 Net deferred tax liabilities (P=2,625,799,079) (P=2,145,826,417)
As of December 31, 2009, the details of the unused tax credits from the excess of the MCIT over RCIT tax and NOLCO, which are available for offset against future income tax payable and taxable income, respectively, over a period of three (3) years from the year of inception, follow:
NOLCO
Inception Year Amount Used/Expired Balance Expiry Year 2006 35,358,292 – 35,358,292 2009 2007 3,264,093 – 3,264,093 2010 2008 158,676,425 – 158,676,425 2011 2009 P=439,125,176 P=241,826,366 P=197,298,810
MCIT
Inception Year Amount Used/Expired Balance Expiry Year 2006 9,750,821 9,750,821 – 2009 2007 12,435,865 11,244,694 1,191,171 2010 2008 5,112,391 – 5,112,391 2011 2009 P=37,525,608 P=31,222,046 P=6,303,562 Board of Investments (BOI) Incentives On various dates in 2007, the BOI issued in favor of certain subsidiaries in the Group a Certificate of Registration as a New Developer of Mass Housing Project for its 8 real estate projects in accordance with the Omnibus Investment Code of 1987. Pursuant thereto, the projects has been granted an Income Tax Holiday for a period of four years commencing

- 45 -
*SGVMC114033*
from 2007 until 2011.
Republic Act (RA) No. 9337 RA No. 9337 was enacted into law amending various provisions in the existing 1997 National Internal Revenue Code. Among the reforms introduced by the said RA was the reduction of the income tax rate from 35% to 30% beginning January 1, 2009. It further provides that nondeductible interest expense shall be reduced from 42% to 33% of interest income subjected to final tax beginning January 1, 2009.
27. Basic and Diluted Earnings Per Share
The following table presents information necessary to compute the EPS:
2009 2008 2007 Basic and Diluted Earnings Per Share a) Net income attributable to equity holders
of Parent P=2,299,408,171 P=2,819,203,031 P=3,463,493,788 b) Weighted average common shares 8,417,214,114 8,417,214,114 7,159,502,205 c) Earnings per share (a/b) P=0.27 P=0.33 P=0.48
28. Financial Assets and Liabilities
The following table sets forth the carrying values and fair values of the Group’s financial assets and liabilities recognized as of December 31, 2009 and 2008:
2009 2008 Carrying Value Fair Value Carrying Value Fair Value Financial Assets Loans and receivables Cash and cash equivalents P=3,010,640,495 P=3,010,640,495 P=5,014,533,958 P=5,014,533,958 Short-terms investments 135,962,569 135,962,569 30,000,000 30,000,000 Installment contract receivables 15,702,478,476 16,416,603,462 16,019,521,931 18,636,832,605 Other receivables 2,760,117,115 2,760,117,115 2,728,211,242 2,728,211,242 21,609,198,655 22,323,323,641 23,792,267,131 26,409,577,805 AFS financial assets 288,936,791 288,936,791 299,625,790 299,625,790 Total Financial Assets P=21,898,135,446 P=22,612,260,432 P=24,091,892,921 P=26,709,203,595 Other Financial Liabilities Bank loans P=4,135,565,744 P=4,323,645,023 P=92,338,591 P=89,921,076 Accounts and other payables 5,430,021,127 5,430,021,127 4,005,522,187 4,005,522,187 Liabilities for purchased land 1,832,752,649 1,916,103,469 2,632,836,269 1,815,770,796 LTNs 495,427,390 444,443,860 1,474,565,769 902,881,669 LTCP and FRNs 1,870,000 1,870,000 24,080,100 24,080,100 Payable to related parties 45,142,964 45,142,964 910,408,719 910,408,719 Loans payable 546,915,156 546,915,156 3,372,298,484 3,372,298,484 Total Financial Liabilities P=12,487,695,030 P=12,708,141,599 P=12,512,050,119 P=11,120,883,030
The following methods and assumptions were used to estimate the fair value of each class of financial instrument for which it is practicable to estimate such value: Cash and cash equivalents and short-term investments: Due to the short-term nature of the account, the fair value of cash and cash equivalents and short-term investments approximate the carrying amounts in the consolidated statement of financial position.
- 46 -
*SGVMC114033*
Installment contracts receivables: Estimated fair value of installment contracts receivables is based on the discounted value of future cash flows using the prevailing interest rates for similar types of receivables as of the reporting date using the remaining terms of maturity. The discount rate used ranged from 5.11% to 9.38% in 2009 and from 6.0% to 8.0% in 2008. Receivable from and payable to related parties: due to the short-term nature of the account, carrying amounts approximate fair values. Other receivables: due to the short-term nature of the account, the fair value of other receivables approximates the carrying amounts. AFS financial assets: for AFS investment in unquoted equity securities, these are carried and presented at cost since fair value is not reasonably determine due to the unpredictable nature of future cash flows and without any other suitable methods of arriving at a reliable fair value approximate its fair value.
The AFS financial assets carried at cost are preferred shares of a utility company issued to the Group as a consequence of its subscription to the electricity services of the said utility company needed for the Group’s residential units. The said preferred shares have no active market and the Group does not intend to dispose these because these are directly related to the continuity of its business. Accounts and other payables: fair values of accounts and other payables and accrued expenses and payables to affiliated companies approximate their carrying amounts in the consolidated statement of financial position due to the short-term nature of the transactions. Bank loans, liabilities for purchased land, loans payable, LTNs, LTCP and FRNs: estimated fair values of bank loans, liabilities for purchased land, loans payable, LTNs, LTCP and FRNs are based on the discounted value of future cash flows using the applicable rates for similar types of loans. Interest rates used in discounting cash flows ranges from 4.27% to 9.38% in 2009 and 6.7% to 7.5% in 2008 using the remaining terms to maturity. The Group uses the following three-level hierarchy for determining and disclosing the fair value of financial instruments by valuation technique: Level 1: quoted (unadjusted) prices in active markets for identical assets or liabilities; Level 2: other valuation techniques involving inputs other than quoted prices included in
Level 1 that are observable for the asset or liability, either directly or indirectly; and Level 3: other valuation techniques involving inputs for the asset or liability that are not based on observable market data (unobservable inputs). The Group has no financial instruments measured at fair value as of December 31, 2009.
Financial Risk Management Objectives and Policies Financial Risk The Group’s principal financial liabilities comprise of bank loans, loans payable, accounts and other payables, liabilities for purchased land and long-term commercial papers and floating rate notes payable. The main purpose of the Group’s financial liabilities is to raise finance for the Group’s operations. The Group has various financial assets such as installment contracts receivables, cash and cash equivalents and short-term investments, which arise directly from its operations. The main risks arising from the use of financial instruments are interest rate risk, foreign currency risk, credit risk and liquidity risk.
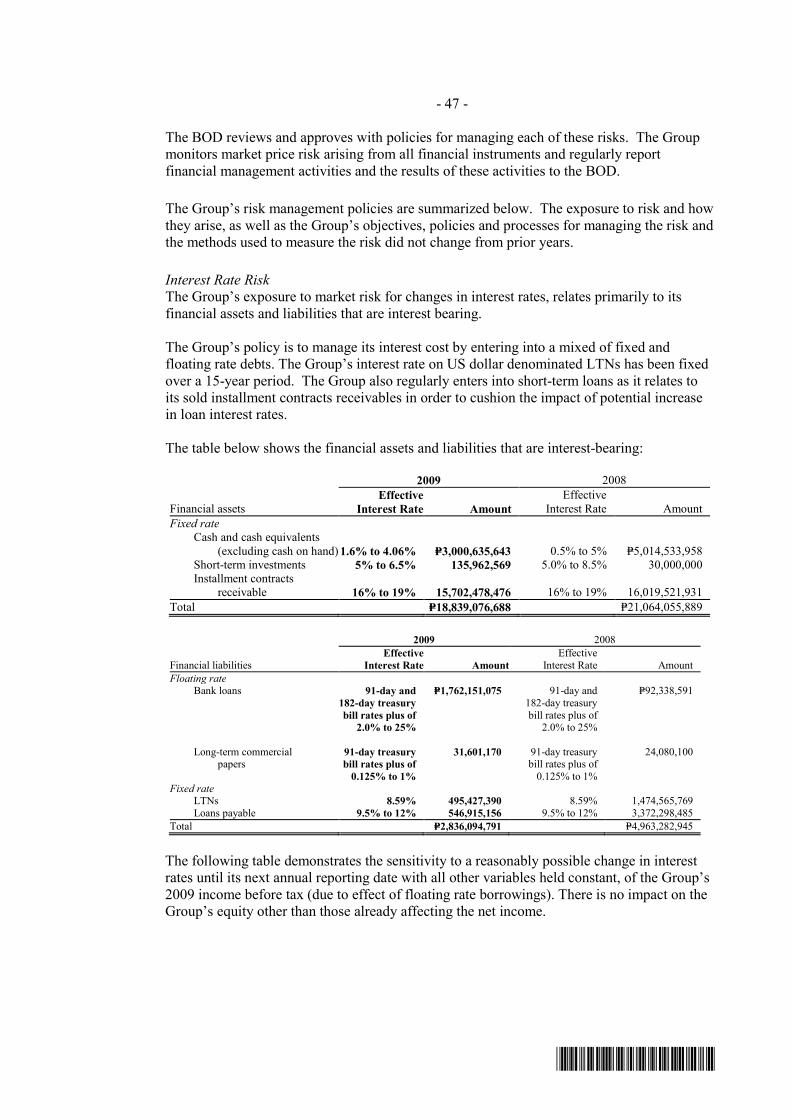
- 47 -
*SGVMC114033*
The BOD reviews and approves with policies for managing each of these risks. The Group monitors market price risk arising from all financial instruments and regularly report financial management activities and the results of these activities to the BOD. The Group’s risk management policies are summarized below. The exposure to risk and how they arise, as well as the Group’s objectives, policies and processes for managing the risk and the methods used to measure the risk did not change from prior years.
Interest Rate Risk The Group’s exposure to market risk for changes in interest rates, relates primarily to its financial assets and liabilities that are interest bearing. The Group’s policy is to manage its interest cost by entering into a mixed of fixed and floating rate debts. The Group’s interest rate on US dollar denominated LTNs has been fixed over a 15-year period. The Group also regularly enters into short-term loans as it relates to its sold installment contracts receivables in order to cushion the impact of potential increase in loan interest rates. The table below shows the financial assets and liabilities that are interest-bearing: 2009 2008
Financial assets Effective
Interest Rate Amount Effective
Interest Rate Amount Fixed rate Cash and cash equivalents (excluding cash on hand) 1.6% to 4.06% P=3,000,635,643 0.5% to 5% P=5,014,533,958 Short-term investments 5% to 6.5% 135,962,569 5.0% to 8.5% 30,000,000 Installment contracts receivable 16% to 19% 15,702,478,476 16% to 19% 16,019,521,931 Total P=18,839,076,688 P=21,064,055,889
2009 2008
Financial liabilities Effective
Interest Rate AmountEffective
Interest Rate Amount Floating rate Bank loans 91-day and P=1,762,151,075 91-day and P=92,338,591 182-day treasury 182-day treasury bill rates plus of bill rates plus of 2.0% to 25% 2.0% to 25% Long-term commercial papers
91-day treasury bill rates plus of
0.125% to 1%
31,601,170
91-day treasury bill rates plus of
0.125% to 1%
24,080,100
Fixed rate LTNs 8.59% 495,427,390 8.59% 1,474,565,769 Loans payable 9.5% to 12% 546,915,156 9.5% to 12% 3,372,298,485 Total P=2,836,094,791 P=4,963,282,945
The following table demonstrates the sensitivity to a reasonably possible change in interest rates until its next annual reporting date with all other variables held constant, of the Group’s 2009 income before tax (due to effect of floating rate borrowings). There is no impact on the Group’s equity other than those already affecting the net income.

- 48 -
*SGVMC114033*
2009 2008
Increase/decrease
in interest rate Effect on income before income tax
Increase/decrease in interest rate
Effect on income before income tax
Bank loans +25 bps P=4,405,377 +25 bps P=594,798 -25 bps (4,405,377) -25 bps (594,798) LTCP +25 bps P=79,002 +25 bps P=146,323 -25 bps (79,002) -25 bps (146,323)
There are no items that are impacted with interest rate risk which are charged directly to equity.
Foreign Exchange Risk The Group’s foreign exchange risk results primarily from movements of the Philippine peso against the United States Dollar (USD). Approximately 2.5% and 63.70% of the debt of the Group as of December 31, 2009 and 2008, respectively, are denominated in USD. The Group’s foreign currency-denominated debt comprises of the LTNs in 2008 and FRNs in 2008. Below are the carrying values and the amounts in US$ of these foreign currency denominated liabilities. There are no foreign currency denominated assets.
2009 2008
Peso US$ Peso US$ LTNs P=495,427,390 US$10,723,537 P=1,474,565,769 US$31,030,424
The following table demonstrates the sensitivity to a reasonably possible change in the US dollar exchange rate until its next annual reporting date, with all other variables held constant, of the Group’s 2008 profit before tax (due to changes in the fair value of monetary liabilities). 2009 2008
Increase/decrease in US Dollar rate
Effect on income before tax
Increase/decrease in US Dollar rate
Effect on income before tax
LTNs +0.02 bps 99,085 +0.02% (P=294,913) -0.02 bps (99,085) –0.02% 294,913
There are no items affecting equity except for those impacting profit or loss. Credit Risk The Group transacts only with recognized, creditworthy third parties. The Group’s receivables are monitored on an ongoing basis resulting to manageable exposure to bad debts. Real estate buyers are subject to standard credit check procedures, which are calibrated based on payment scheme offered. The Group’s respective credit management units conduct a comprehensive credit investigation and evaluation of each buyer to establish creditworthiness. Receivable balances are being monitored on a regular basis to ensure timely execution of necessary intervention efforts. In addition, the credit risk for installment contracts receivables is mitigated as the Group has the right to cancel the sales contract without need for any court action and take possession of the subject house in case of refusal by the buyer to pay on time the due installment contracts receivable. This risk is further mitigated because the corresponding title to the subdivision units sold under this arrangement is transferred to the buyers only upon full payment of the contract price.
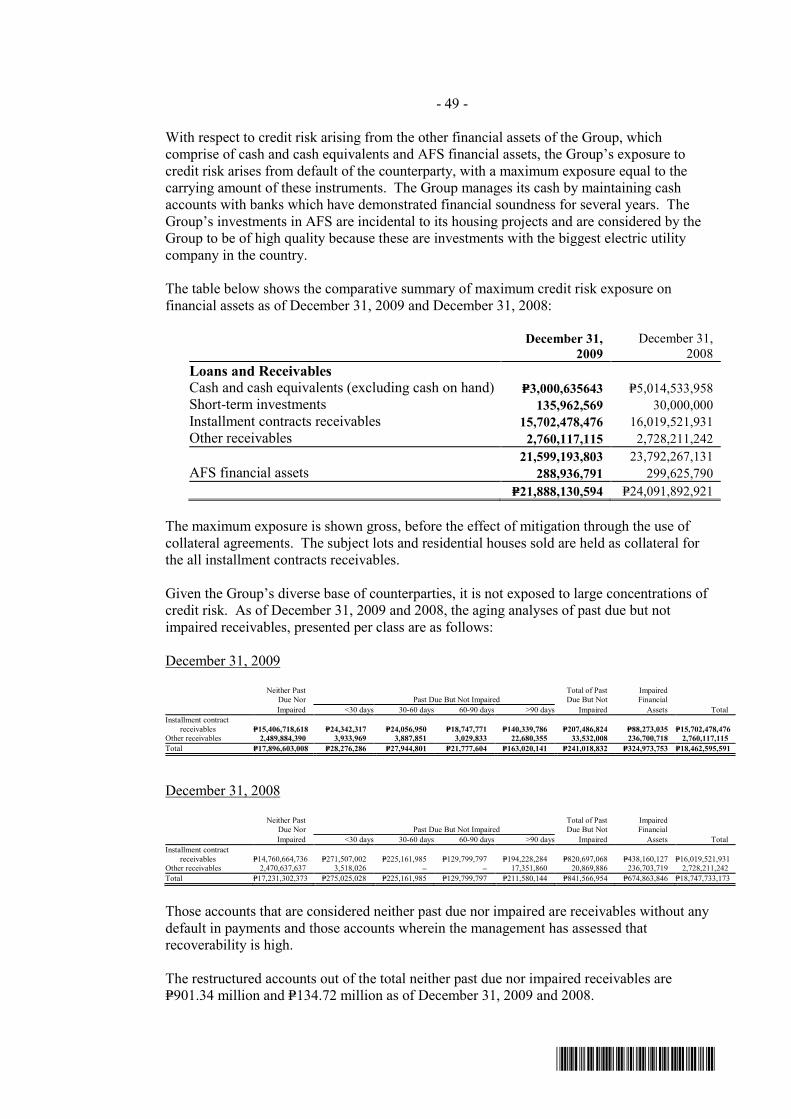
- 49 -
*SGVMC114033*
With respect to credit risk arising from the other financial assets of the Group, which comprise of cash and cash equivalents and AFS financial assets, the Group’s exposure to credit risk arises from default of the counterparty, with a maximum exposure equal to the carrying amount of these instruments. The Group manages its cash by maintaining cash accounts with banks which have demonstrated financial soundness for several years. The Group’s investments in AFS are incidental to its housing projects and are considered by the Group to be of high quality because these are investments with the biggest electric utility company in the country.
The table below shows the comparative summary of maximum credit risk exposure on financial assets as of December 31, 2009 and December 31, 2008:
December 31,
2009 December 31,
2008 Loans and Receivables Cash and cash equivalents (excluding cash on hand) P=3,000,635643 P=5,014,533,958 Short-term investments 135,962,569 30,000,000 Installment contracts receivables 15,702,478,476 16,019,521,931 Other receivables 2,760,117,115 2,728,211,242
21,599,193,803 23,792,267,131 AFS financial assets 288,936,791 299,625,790
P=21,888,130,594 P=24,091,892,921 The maximum exposure is shown gross, before the effect of mitigation through the use of collateral agreements. The subject lots and residential houses sold are held as collateral for the all installment contracts receivables. Given the Group’s diverse base of counterparties, it is not exposed to large concentrations of credit risk. As of December 31, 2009 and 2008, the aging analyses of past due but not impaired receivables, presented per class are as follows: December 31, 2009 Neither Past Total of Past Impaired Due Nor Past Due But Not Impaired Due But Not Financial Impaired <30 days 30-60 days 60-90 days >90 days Impaired Assets Total Installment contract receivables P=15,406,718,618 P=24,342,317 P=24,056,950 P=18,747,771 P=140,339,786 P=207,486,824 P=88,273,035 P=15,702,478,476 Other receivables 2,489,884,390 3,933,969 3,887,851 3,029,833 22,680,355 33,532,008 236,700,718 2,760,117,115 Total P=17,896,603,008 P=28,276,286 P=27,944,801 P=21,777,604 P=163,020,141 P=241,018,832 P=324,973,753 P=18,462,595,591
December 31, 2008 Neither Past Total of Past Impaired Due Nor Past Due But Not Impaired Due But Not Financial Impaired <30 days 30-60 days 60-90 days >90 days Impaired Assets Total Installment contract receivables P=14,760,664,736 P=271,507,002 P=225,161,985 P=129,799,797 P=194,228,284 P=820,697,068 P=438,160,127 P=16,019,521,931 Other receivables 2,470,637,637 3,518,026 – – 17,351,860 20,869,886 236,703,719 2,728,211,242 Total P=17,231,302,373 P=275,025,028 P=225,161,985 P=129,799,797 P=211,580,144 P=841,566,954 P=674,863,846 P=18,747,733,173
Those accounts that are considered neither past due nor impaired are receivables without any default in payments and those accounts wherein the management has assessed that recoverability is high. The restructured accounts out of the total neither past due nor impaired receivables are P=901.34 million and P=134.72 million as of December 31, 2009 and 2008.

- 50 -
*SGVMC114033*
The aggregate fair value of collaterals of installment contracts receivable that are past due but not impaired as of December 31, 2009 and 2008 amounted to P=2,424.1 million and P=1,317.34 million, respectively.
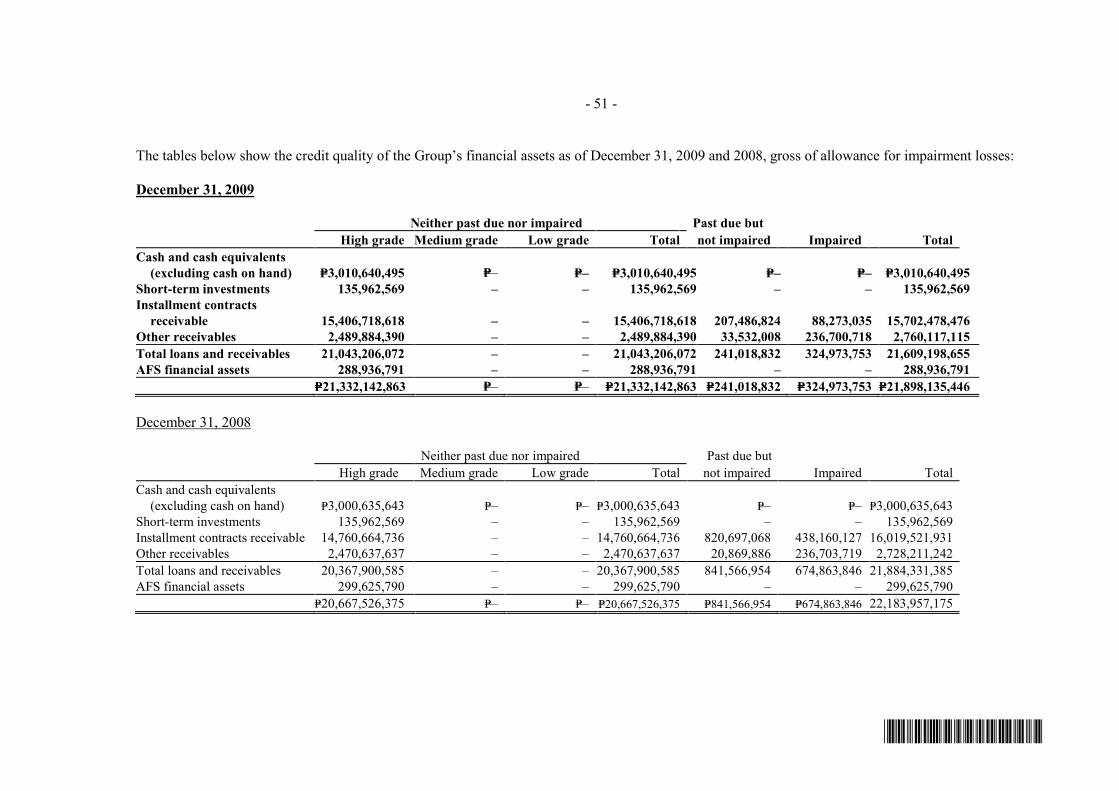
- 51 -
*SGVMC114033*
The tables below show the credit quality of the Group’s financial assets as of December 31, 2009 and 2008, gross of allowance for impairment losses: December 31, 2009
Neither past due nor impaired Past due but High grade Medium grade Low grade Total not impaired Impaired Total Cash and cash equivalents
(excluding cash on hand) P=3,010,640,495 P=– P=– P=3,010,640,495 P=– P=– P=3,010,640,495 Short-term investments 135,962,569 – – 135,962,569 – – 135,962,569 Installment contracts
receivable 15,406,718,618 – – 15,406,718,618 207,486,824 88,273,035 15,702,478,476 Other receivables 2,489,884,390 – – 2,489,884,390 33,532,008 236,700,718 2,760,117,115 Total loans and receivables 21,043,206,072 – – 21,043,206,072 241,018,832 324,973,753 21,609,198,655 AFS financial assets 288,936,791 – – 288,936,791 – – 288,936,791 P=21,332,142,863 P=– P=– P=21,332,142,863 P=241,018,832 P=324,973,753 P=21,898,135,446
December 31, 2008 Neither past due nor impaired Past due but High grade Medium grade Low grade Total not impaired Impaired Total Cash and cash equivalents
(excluding cash on hand) P=3,000,635,643 P=– P=– P=3,000,635,643 P=– P=– P=3,000,635,643 Short-term investments 135,962,569 – – 135,962,569 – – 135,962,569 Installment contracts receivable 14,760,664,736 – – 14,760,664,736 820,697,068 438,160,127 16,019,521,931 Other receivables 2,470,637,637 – – 2,470,637,637 20,869,886 236,703,719 2,728,211,242 Total loans and receivables 20,367,900,585 – – 20,367,900,585 841,566,954 674,863,846 21,884,331,385 AFS financial assets 299,625,790 – – 299,625,790 – – 299,625,790 P=20,667,526,375 P=– P=– P=20,667,526,375 P=841,566,954 P=674,863,846 22,183,957,175

- 52 -
*SGVMC114033*
High grade cash and cash equivalents and short-term investments are short-term money market placements and working cash fund placed, invested or deposited in foreign and local banks belonging to the top ten banks in the Philippines in terms of resources and profitability. The Group’s high-grade receivables pertain to receivables from related parties and third parties which, based on experience, are highly collectible or collectible on demand, and of which exposure to bad debt is not significant. Installment contract receivables under bank-financing are assessed to be high grade since accounts under bank-financing undergone credit evaluation performed by two parties, the Group and the respective bank, thus credit evaluation underwent a more stringent criteria resulting to higher probability of having good quality receivables. Medium grade accounts are active accounts with minimal to regular instances of payment default, due to ordinary/common collection issues. These accounts are typically not impaired as the counterparties generally respond to credit actions and update their payments accordingly. Low grade accounts are accounts which have probability of impairment based on historical trend. These accounts show propensity to default in payment despite regular follow-up actions and extended payment terms Based on the Group’s experience, its loans and receivables are highly collectible or collectible on demand. The receivables are collateralized by the corresponding real estate properties. In few cases of buyer defaults, the Group can repossess the collateralized properties and held it for sale in the ordinary course of business at the prevailing market price. The total of repossessed properties included in the “Real estate inventories” account in the consolidated statement of financial position amounted to P=467.30 million as of December 31, 2008. The Group performs certain repair activities on the said reposed assets in order to put their condition at a marketable state. Costs incurred in bringing the repossessed assets to its marketable state are included in their carrying amounts. The Group did not accrue any interest income on impaired financial assets. Liquidity Risk The Group monitors its cash flow position, debt maturity profile and overall liquidity position in assessing its exposure to liquidity risk. The Group maintains a level of cash deemed sufficient to finance its cash requirements. Operating expenses and working capital requirements are sufficiently funded through cash collections. The Group’s loan maturity profile is regularly reviewed to ensure availability of funding through adequate credit facilities with banks and other financial institutions. The extent and nature of exposures to liquidity risk and how they arise as well as the Group’s objectives, policies and processes for managing the risk and the methods used to measure the risk are the same for 2009 and 2008. Maturity Profile of Financial Assets and Liabilities The tables below summarize the maturity profile of the Group’s financial assets and liabilities as of December 31, 2009 and 2008 based on undiscounted contractual payments, including interest receivable and payable.

- 53 -
*SGVMC114033*
2009 On Demand
1 to 3 Months
3 to 12 Months
1 to 5 Years Total
Financial Assets ReLoans and receivables
Cash and cash equivalents P=3,010,640,495 P=– P=– P=– P=3,010,640,495 Short-term investments – 135,962,569 – – 135,962,569 Trade receivables 600,454,850 3,600,454,850 1,664,461,204 9,837,107 15,702,478,476 Other receivables 2,760,117,115 – – – 2,760,117,115 Total Loans and Receivables 3,360,571,965 3,736,417,419 1,664,461,204 9,837,107 21,609,198,655 AFS financial assets 288,936,791 – – – 288,936,791 Total undiscounted financial
assets P=3,649,508,756 P=3,736,417,419 P=1,664,461,204 P=9,837,107 P=21,898,135,446 Financial Liabilities Financial liabilities at amortized cost: Bank loans P=398,706,652 P=208,723,500 P=107,722,402 P=3,420,413,190 P=4,135,565,744 Accounts payable and other
payables 5,430,021,127 – – – 5,430,021,127 Liabilities for purchased land 730,774,218 233,283,214 52,373,094 816,322,123 1,832,752,649 LTNs – – – 495,427,390 495,427,390 LTCP and FRNs – 1,870,000 – – 1,870,000 Payable to related parties 45,142,964 – – – 45,142,964 Loans payable – – 546,915,156 – 546,915,156 Total undiscounted financial
liabilities P=6,604,644,961 P=443,876,714 P=707,010,652 P=4,732,162,703 P=12,487,695,030
2008
On Demand 1 to
3 Months 3 to
12 Months 1 to
5 Years Total Financial Assets
ReLoans and receivables Cash and cash equivalents P=5,014,533,958 P=– P=– P=– P=5,014,533,958 Short-term investments – 30,000,000 – – 30,000,000 Trade receivables 261,707,975 523,415,949 2,355,371,771 12,561,982,781 15,702,478,476 Other receivables 46,001,952 92,003,904 414,017,567 2,208,093,692 2,760,117,115 Total Loans and Receivables 307,709,927 645,419,853 2,769,389,338 14,770,076,473 23,507,129,549 AFS financial assets 288,936,791 – – – 288,936,791 Total undiscounted financial
assets P=596,646,718 P=645,419,853 P=2,769,389,338 P=14,770,076,473 P=23,796,066,340 Financial Liabilities Financial liabilities at amortized cost: Bank loans P=8,638,105 P=4,319,052 P=38,871,470 P=60,709,357 P=112,537,984 Accounts payable and other
payables 659,564,978 329,782,489 2,968,042,401 48,123,320 4,005,513,188 Liabilities for purchased land 161,207,867 322,415,734 1,450,870,802 738,986,573 2,673,480,976 LTNs – – – 1,474,565,769 1,474,565,769 Payable to related parties 75,235,027 150,470,053 677,115,239 7,588,400 910,408,719 Total undiscounted financial
liabilities P=904,645,977 P=806,987,328 P=5,134,899,912 P=2,329,973,419 P=9,176,506,636

- 54 -
*SGVMC114033*
29. Equity
Capital Stock The details of the number of shares follow:
2009 2008 Authorized 12,000,000,000 12,000,000,000 Issued 8,538,740,614 8,538,740,614 Treasury – (295,756,000) Outstanding 8,538,740,614 8,242,984,614
On March 16, 2007, the Board of Directors (BOD) and the stockholders approved the increase in authorized capital stock of the Parent Company from P=4.00 million divided into 4 million shares to P=12.00 billion divided into 12 billion shares with a par value of P=1.00 per share. The following companies have subscribed to the increase in the authorized capital stock of the Parent Company and have paid for such subscription through assignment of shares:
Subscribers No. of shares
subscribedAmount subscribed
Par Premium Total Polar Property Holdings Corp. (Polar Property) 722,615,487 P=722,615,487 P=1,055,018,611 P=1,777,634,098 Adelfa Properties, Inc. (Adelfa) 554,162,000 554,162,000 809,076,520 1,363,238,520 Cambridge Group, Inc. (Cambridge) 9,305,206 9,305,206 13,585,601 22,890,807 Althorp Holdings, Inc. (Althorp) 200,102,917 200,102,917 292,150,259 492,253,176 Fine Properties, Inc. (Fine) 22,465,846 22,465,846 32,800,134 55,265,980 Total 1,508,651,456 P=1,508,651,456 P=2,202,631,125 P=3,711,282,581
On its second subscription, Fine subscribed to 3,020.15 million shares with a par value of P=1.00 with a premium amounting to P=4,409.66 million. On March 29, 2007, the Parent Company entered into an exchange agreement with Fine, Polar Property, Adelfa, Althorp and Cambridge for the acquisition by the Parent Company of all the shares held by the aforesaid corporations in the subsidiaries, in exchange for 4,528.80 million shares of the Parent Company. On March 30, 2007, the Parent Company entered into a Memorandum of Agreement (MOA) with Fine, wherein Fine agrees to subscribe to 3,020.15 million common shares of the Parent Company which shall be paid through the assignment and conveyance by Fine in favor of the Parent Company of a total of 3,020.15 million shares of the common stock of CHI. Fine undertakes to cause its affiliates, which hold shares in CHI, to convey the CHI shares held by them in favor of the Parent Company. The transaction resulted to a premium of P=4,409.66 million. On April 25, 2007, the Parent Company entered into a sale and purchase agreement with Fine and Brittany (Major shareholders) which provided for the acquisition by the Parent Company of the Major shareholders’ 3,020.15 million shares in CHI in consideration for the Parent Company shares on the basis of one Parent Company common share for every one CHI common share based on the book value of the Parent Company shares against the adjusted book value of the CHI shares as of December 31, 2006.
- 55 -
*SGVMC114033*
The objective of the said acquisitions was to consolidate the ownership of the Subsidiaries in a new holding company, that is the Parent Company. The Parent Company has accounted for these transactions as reorganization of entities under common control, using pooling of interest method. Accordingly, the consolidated financial statements have been prepared as if the current corporate structure had been in existence throughout the periods presented. On May 3, 2007, the SEC approved the increase in authorized capital stock. The approval of SEC made effective the March 30, 2007 MOA with Fine and the April 25, 2007 sale and purchase agreement with the Parent Company and the Major shareholders. On May 7, 2007, the Parent Company filed a registration statement with the SEC for the Primary Offer of up to 1,890.52 million common shares from its unissued capital stock. In compliance with the Tender Offer Rules, the Parent Company is offering to acquire the remaining 1,890.52 million common shares owned by the common shareholders of CHI other than the Major shareholders (Minority shareholders) in exchange for up to 1,890.52 million new and unissued common shares of the Parent Company, on the same basis of one common share for every one CHI common share. On June 15, 2007, end of the tender offer period, a total of 1,858.24 million shares were tendered. The purpose of the Primary Offer is to finance, in part, the Parent Company’s planned capital expenditures and the settlement of the loans payable. The Parent Company also expects to use a portion of the net proceeds from the Primary Offer for general corporate purposes, including but not limited to, working capital requirements. On May 24, 2007, the Philippine Stock Exchange, Inc. (the Exchange) approved the initial listing by way of introduction of 6,420.32 million common shares of the Parent Company, with par value of P=1.00 per share in the first board of the Exchange at a listing price of P=2.46 per share. The approval, however, is subject to, among other conditions, compliance by the Parent Company of Article 3, Section 6 of the Revised Listing Rules which states that upon and after listing, the Parent Company shall, at all times, maintain, at least 1,000 stockholders or security holders each owning securities equivalent to at least one board lot. As of December 31, 2009 and 2008, the Parent Company has 1,123 and 1,120 shareholders, respectively. In the International Offering Circular dated July 13, 2007, the Parent Company, together with Polar Property, Calveston Investments Limited, Althorp, Cameron Global Limited, Golden Haven Memorial Park, Inc. and Cambridge (collectively referred to as ‘other selling shareholders’) offered for sale 3,105.99 million common shares with par value of P=1.00 per share. The shares offered comprised of: (i) 2,120.00 million new shares issued and offered by the Parent Company by way of a Primary Offer; and (ii) 985.99 million existing shares offered by other selling shareholders pursuant to a secondary offered by other selling shareholders pursuant to a secondary. Polar Property is an associate of the Parent Company. The entire shares offered were fully subscribed with net proceeds of P=14,013.00 million. Each shareholder will be entitled to such dividends as may be declared by the Parent Company’s BOD provided that any stock dividends declaration requires the approval of shareholders holding at least two-thirds of the Parent Company’s total outstanding capital stock.

- 56 -
*SGVMC114033*
On August 21, 2007, the Parent Company announced a second tender offer to remaining CHI minority shareholders. As of September 18, 2007, end of tender offer period, a total of 30.70 million shares were tendered. Treasury Shares On November 27, 2007, SEC approved the Parent Company’s buyback of its shares up to the extent of the total purchase price of US$25 million subject to the prevailing market price at the time of buy back over the next 12 months but subject to periodic review by the Parent Company’s management. On November 6, 2008, the Parent Company’s BOD approved the extension of the buy back for an additional of six (6) months or up to May 12, 2009.
As of December 31, 2009 and 2008, the Parent Company has bought back from the market 320,686,000 shares and 295,756,000 shares, respectively.
Retained Earnings Retained earnings as of December 31, 2008 is restricted up to the extent of the treasury shares amounting to P=616.89 million in 2008.
In accordance with SEC Memorandum Circular No. 11 issued in December 2008, the Parent Company’s retained earnings available for dividend declaration as of December 31, 2008 amounted to P=5.24 billion.
On April 1, 2009, the BOD passed and approved the cash dividend declaration for the unrestricted retained earnings of the Parent Company payable to stockholders of record at the close of business on April 17, 2009. Capital Management The primary objective of the Group’s capital management is to ensure that it maintains a strong credit rating and healthy capital ratios in order to support its business and maximize shareholder value. The Group manages its capital structure and makes adjustments to it, in light of changes in economic conditions. To maintain or adjust the capital structure, the Group may adjust the dividend payment to shareholders, return capital to shareholders or issue new shares. The following table shows the component of the Parent Company’s equity as of December 31, 2009 and 2008.
2009 2008 Total paid-up capital P=29,557,221,503 P=27,844,016,282 Retained earnings 6,317,945,433 5,739,787,852 Unrealized gain on AFS financial assets – 472,619 Treasury shares – (616,885,476) P=35,875,166,936 P=32,967,391,277
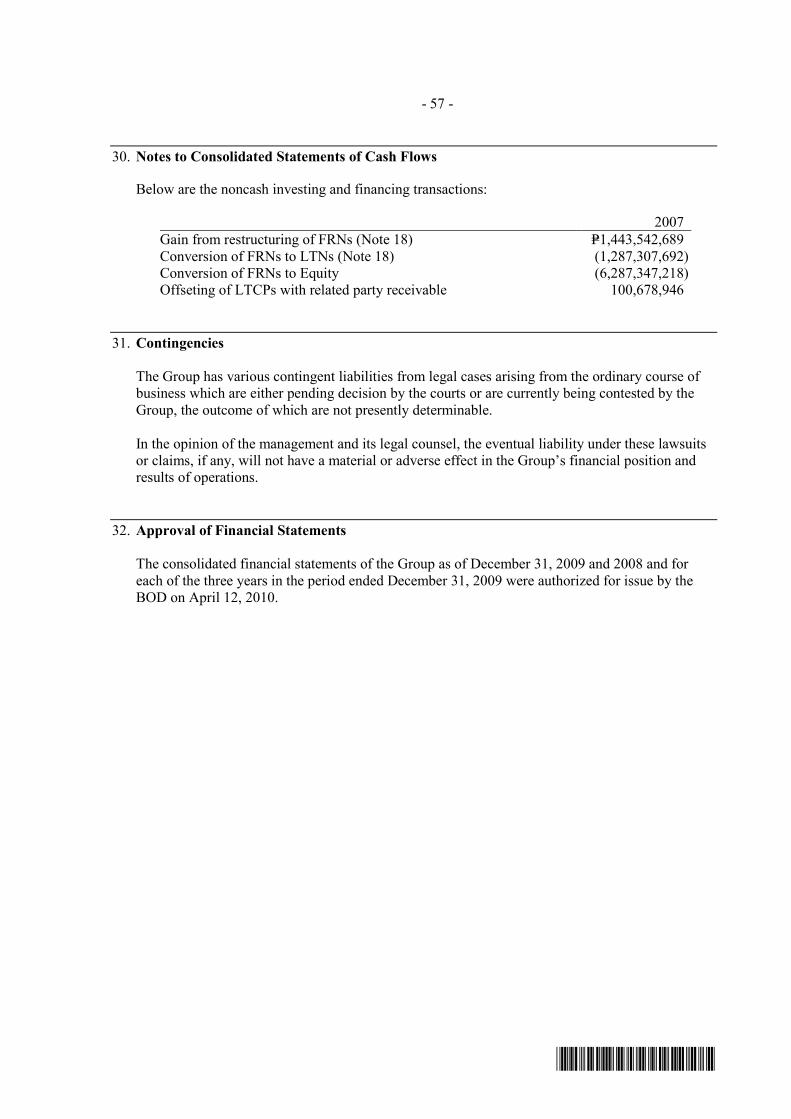
- 57 -
*SGVMC114033*
30. Notes to Consolidated Statements of Cash Flows
Below are the noncash investing and financing transactions:
2007 Gain from restructuring of FRNs (Note 18) P=1,443,542,689 Conversion of FRNs to LTNs (Note 18) (1,287,307,692) Conversion of FRNs to Equity (6,287,347,218) Offseting of LTCPs with related party receivable 100,678,946
31. Contingencies
The Group has various contingent liabilities from legal cases arising from the ordinary course of business which are either pending decision by the courts or are currently being contested by the Group, the outcome of which are not presently determinable. In the opinion of the management and its legal counsel, the eventual liability under these lawsuits or claims, if any, will not have a material or adverse effect in the Group’s financial position and results of operations.
32. Approval of Financial Statements
The consolidated financial statements of the Group as of December 31, 2009 and 2008 and for each of the three years in the period ended December 31, 2009 were authorized for issue by the BOD on April 12, 2010.

*SGVMC114033*
VISTA LAND & LIFESCAPES, INC. AND SUBSIDIARIES SUPPLEMENTARY SCHEDULE OF RETAINED EARNINGS AVAILABLE FOR DIVIDEND DECLARATION DECEMBER 31, 2009 Unappropriated retained earnings, as adjusted to available for dividend distribution, beginning P=3,256,984,197
Add: Net income actually earned/realized during the year Net income during the period closed to retained earnings 2,299,408,171 Less: Non- actual/unrealized income, net of tax Equity in net income of associate/joint venture 32,160,430
Net income actually earned during the year 2,267,247,741 Less: Dividend declarations during the year 281,778,441 1,985,469,300
TOTAL RETAINED EARNINGS, END AVAILABLE FOR DIVIDEND DECLARATION P=5,242,570,497 See accompanying Notes to Consolidated Financial Statements.

COVER SHEET
C S 2 0 0 7 0 3 1 4 5
S.E.C. Registration Number
V I S T A L A N D & L I F E S C A P E S , I N C .
(Company’s Full Name)
L A S P I N A S B U S I N E S S C E N T E RN A T I O N A L R O A D , T A L O N , L A SP I N A S C I T Y
(Business Address : No. Street/City/Province)
Brian N. Edang 887-2264 loc 107
Contact Person Company Telephone Number
1 2 3 1 17-Q 0 6 1 5Month Day FORM TYPE Month Day
Calendar Year Annual Meeting
Secondary License Type, If Applicable
Dept. Requiring this Doc. Amended Articles Number/Section
Total Amount of Borrowings
Total No. of Stockholders Domestic Foreign
---------------------------------------------------------------------------------------------------------- To be accomplished by SEC Personnel concerned
File Number LCU
Document I.D.
Cashier
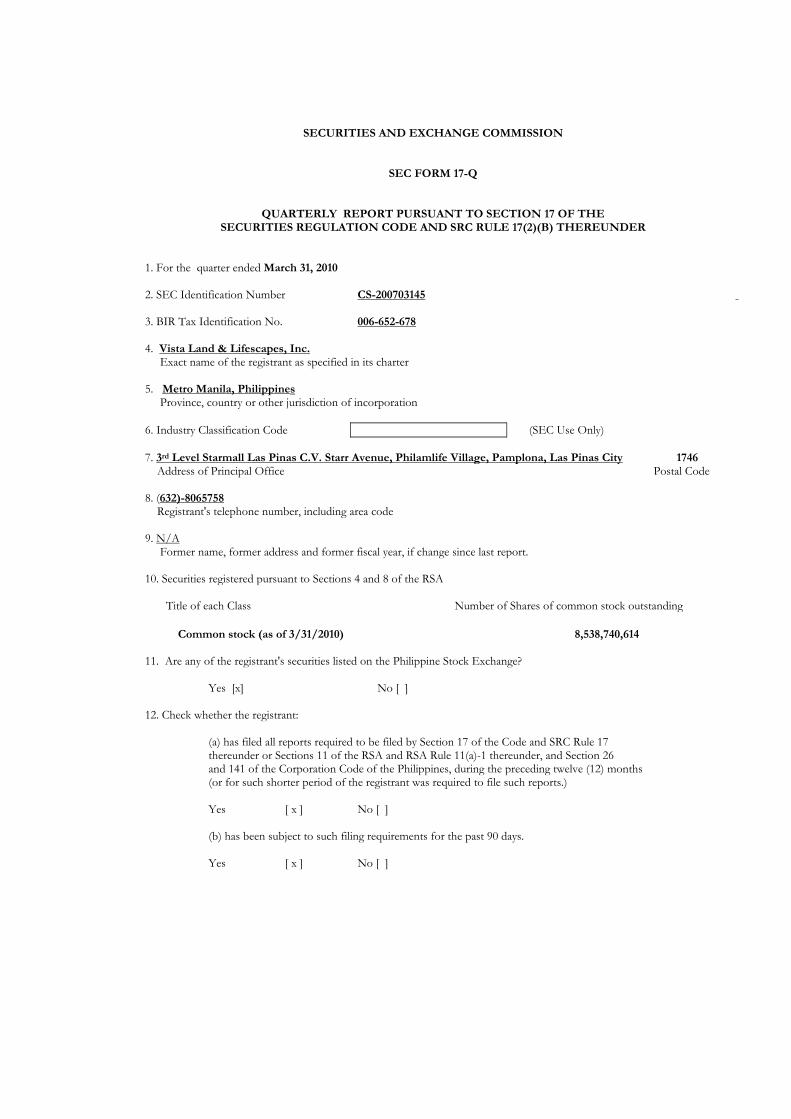
SECURITIES AND EXCHANGE COMMISSION
SEC FORM 17-Q
QUARTERLY REPORT PURSUANT TO SECTION 17 OF THE SECURITIES REGULATION CODE AND SRC RULE 17(2)(B) THEREUNDER
1. For the quarter ended March 31, 2010 2. SEC Identification Number CS-200703145 3. BIR Tax Identification No. 006-652-678 4. Vista Land & Lifescapes, Inc. Exact name of the registrant as specified in its charter 5. Metro Manila, Philippines Province, country or other jurisdiction of incorporation 6. Industry Classification Code (SEC Use Only) 7. 3rd Level Starmall Las Pinas C.V. Starr Avenue, Philamlife Village, Pamplona, Las Pinas City 1746 Address of Principal Office Postal Code 8. (632)-8065758 Registrant's telephone number, including area code 9. N/A Former name, former address and former fiscal year, if change since last report. 10. Securities registered pursuant to Sections 4 and 8 of the RSA Title of each Class Number of Shares of common stock outstanding Common stock (as of 3/31/2010) 8,538,740,614 11. Are any of the registrant's securities listed on the Philippine Stock Exchange? Yes [x] No [ ] 12. Check whether the registrant: (a) has filed all reports required to be filed by Section 17 of the Code and SRC Rule 17 thereunder or Sections 11 of the RSA and RSA Rule 11(a)-1 thereunder, and Section 26 and 141 of the Corporation Code of the Philippines, during the preceding twelve (12) months (or for such shorter period of the registrant was required to file such reports.) Yes [ x ] No [ ] (b) has been subject to such filing requirements for the past 90 days. Yes [ x ] No [ ]
TABLE OF CONTENTS PART I - FINANCIAL STATEMENTS Item 1. Financial Statements
• Consolidated Balance Sheets as of March 31, 2010 and December 31, 2009 • Consolidated Statements of Income for the three months ended March 31, 2010 and
2009 • Consolidated Statement of Changes in Stockholders Equity for the three months ended
March 31, 2010 and 2009 • Consolidated Statements of Cash Flows for the three months ended March 31, 2010 and
2009 • Notes to Consolidated Financial Statements
Item 2. Management Discussion and Analysis of Financial Condition
and Results of Operations
• 1st Quarter 2010 vs 1st Quarter 2009 • Top Five (5) Key Performance Indicators • Material Changes (5% or more)- Balance Sheet • Material Changes (5% or more)- Income Statement • Financial Condition • Commitments and Contingencies
PART II-OTHER INFORMATION Item 3. 1st Quarter 2010 Developments Item 4. Other Notes to 1st Quarter 2010 Operations and Financials

Vista Land & Lifescapes Inc. Consolidated Balance Sheets As of March 31, 2010 and December 31, 2009 (In Million Pesos) Unaudited Audited 03/31/2010 12/31/2009
ASSETS Cash and Cash Equivalents 2,516 3,147 Receivables, Net (Note 3) 19,671 18,138 Real Estate for Sale and Dev't (Note 4) 28,324 28,721 Available for sales - Financial Assets 289 289 Investments 694 694 Property and Equipment 96 92 Advances to a Real Estate JV 1,551 1,551 Other Assets 1,991 2,004Total Assets 55,132 54,636 LIABILITIES AND EQUITY Liabilities Bank Loans (Note 5) 4,508 4,557 Accounts and other payables (Note 6) 5,053 5,430 Customers' advances and deposits 3,898 3,638 Due to Related Parties 390 429 Income Tax Payable 95 95 Liabilities for unsubdivided land purchased 1,691 1,849 Pension liability 140 132 LTN (Note 7) 494 495 Deferred tax liabilities - net 2,784 2,626Total Liabilities 19,053 19,251 Equity Capital Stock 8,539 8,539 Additional paid in capital 19,329 19,329 Retained Earnings 8,211 7,517 36,079 35,385Minority interest − − Total Equity 36,079 35,385Total Liabilities & SHE 55,132 54,636
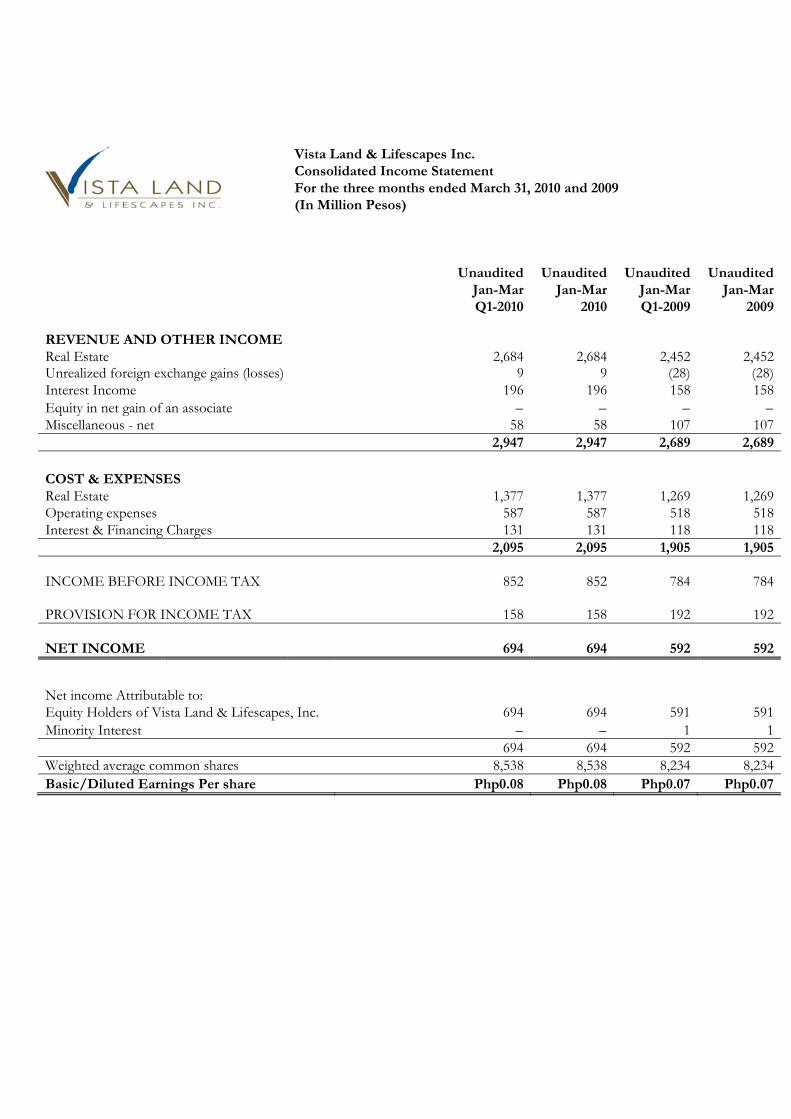
Vista Land & Lifescapes Inc.
Consolidated Income Statement For the three months ended March 31, 2010 and 2009 (In Million Pesos) Unaudited Unaudited Unaudited Unaudited Jan-Mar Jan-Mar Jan-Mar Jan-Mar Q1-2010 2010 Q1-2009 2009
REVENUE AND OTHER INCOME Real Estate 2,684 2,684 2,452 2,452Unrealized foreign exchange gains (losses) 9 9 (28) (28)Interest Income 196 196 158 158Equity in net gain of an associate − − − −Miscellaneous - net 58 58 107 107 2,947 2,947 2,689 2,689
COST & EXPENSES Real Estate 1,377 1,377 1,269 1,269Operating expenses 587 587 518 518Interest & Financing Charges 131 131 118 118 2,095 2,095 1,905 1,905
INCOME BEFORE INCOME TAX 852 852 784 784
PROVISION FOR INCOME TAX 158 158 192 192
NET INCOME 694 694 592 592
Net income Attributable to: Equity Holders of Vista Land & Lifescapes, Inc. 694 694 591 591Minority Interest − − 1 1 694 694 592 592Weighted average common shares 8,538 8,538 8,234 8,234Basic/Diluted Earnings Per share Php0.08 Php0.08 Php0.07 Php0.07

Vista Land & Lifescapes Inc. Consolidated Statement of Changes in Equity For the three months ended March 31, 2010 and 2009 (In Million Pesos) Unaudited Unaudited 31-Mar-10 31-Mar-09CAPITAL STOCK - P1 par value Authorized - 4,000,000 shares in Feb 28, 2007 and 12,000,000,000 in May 23, 2007 Issued - 1,000,000 shares in Feb 28 and 8,538,740,614 shares as of March 31, 2010 Balance at the beginning of period 8,539 8,539Issuance of capital stock − −Balance at end of period 8,539 8,539ADDITIONAL PAID-IN CAPITAL Balance at the beginning of period 19,329 19,305Issuance of treasury shares − −Charges Balance at end of period 19,329 19,305DEPOSITS FOR FUTURE STOCK SUBSCRIPTIONS Balance at beginning of period − −Equity Movements of Subsidiaries − −Balance at end of period − −RETAINED EARNINGS Balance at end beginning of period 7,517 5,740Net Income 694 591Balance at end of period 8,211 6,331 36,079 34,175Treasury Stocks − (637) 36,079 33,538
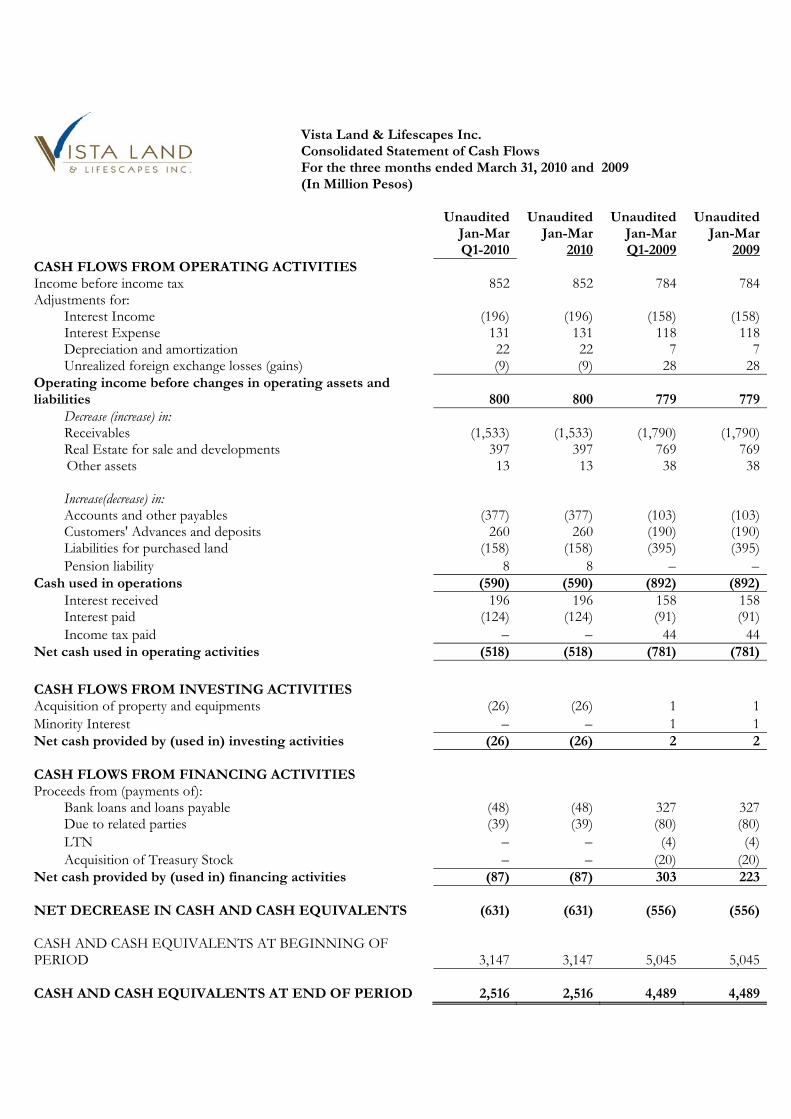
Vista Land & Lifescapes Inc. Consolidated Statement of Cash Flows For the three months ended March 31, 2010 and 2009 (In Million Pesos) Unaudited Unaudited Unaudited Unaudited Jan-Mar Jan-Mar Jan-Mar Jan-Mar Q1-2010 2010 Q1-2009 2009CASH FLOWS FROM OPERATING ACTIVITIES Income before income tax 852 852 784 784Adjustments for: Interest Income (196) (196) (158) (158) Interest Expense 131 131 118 118 Depreciation and amortization 22 22 7 7 Unrealized foreign exchange losses (gains) (9) (9) 28 28Operating income before changes in operating assets and liabilities 800 800 779 779 Decrease (increase) in: Receivables (1,533) (1,533) (1,790) (1,790) Real Estate for sale and developments 397 397 769 769 Other assets 13 13 38 38 Increase(decrease) in: Accounts and other payables (377) (377) (103) (103) Customers' Advances and deposits 260 260 (190) (190) Liabilities for purchased land (158) (158) (395) (395) Pension liability 8 8 − −Cash used in operations (590) (590) (892) (892) Interest received 196 196 158 158 Interest paid (124) (124) (91) (91) Income tax paid − − 44 44Net cash used in operating activities (518) (518) (781) (781)
CASH FLOWS FROM INVESTING ACTIVITIES Acquisition of property and equipments (26) (26) 1 1Minority Interest − − 1 1Net cash provided by (used in) investing activities (26) (26) 2 2 CASH FLOWS FROM FINANCING ACTIVITIES Proceeds from (payments of): Bank loans and loans payable (48) (48) 327 327 Due to related parties (39) (39) (80) (80) LTN − − (4) (4) Acquisition of Treasury Stock − − (20) (20)Net cash provided by (used in) financing activities (87) (87) 303 223 NET DECREASE IN CASH AND CASH EQUIVALENTS (631) (631) (556) (556) CASH AND CASH EQUIVALENTS AT BEGINNING OF PERIOD 3,147 3,147 5,045 5,045 CASH AND CASH EQUIVALENTS AT END OF PERIOD 2,516 2,516 4,489 4,489
Vista Land & Lifescapes, Inc. and Subsidiaries Notes to Consolidated Financial Statements
1. The Consolidated financial statements of Vista Land & Lifescapes, Inc. and its Subsidiaries have been prepared in accordance with accounting principles generally accepted in the Philippines, as set forth in Philippine Financial Reporting Standards (PFRS). Accounting principles/policies and methods of computation applied for the three months ended March 31, 2010 are the same as those applied in the preceding calendar year.
Adoption of New and Amended Accounting Standards and Interpretations The accounting policies adopted are consistent with those of the previous financial year except for the following new and amended Standards and Philippine Interpretations of International Financial Reporting Interpretations Committee (IFRIC) Interpretations which became effective on January 1, 2009. Except as otherwise indicated, the adoption of the new and amended Standards and Philippine Interpretations did not have a significant impact on the Group’s consolidated financial statements.
• PFRS 1, First-time Adoption of Philippine Financial Reporting Standards - Cost of an
Investment in a Subsidiary, Jointly Controlled Entity or Associate The amendment allows an entity, in its separate financial statements, to determine the cost of investments in subsidiaries, jointly controlled entities or associates (in its opening PFRS financial statements) as one of the following amounts: (a) cost determined in accordance with PAS 27, Consolidated and Separate Financial Statements; (b) at the fair value of the investment at the date of transition to PFRS, determined in accordance with PAS 39, Financial Instruments: Recognition and Measurement; or (c) previous carrying amount (as determined under generally accepted accounting principles) of the investment at the date of transition to PFRS.
• PFRS 2, Share-based Payment - Vesting Condition and Cancellations
This Standard has been revised to clarify the definition of a vesting condition and prescribes the treatment for an award that is effectively cancelled. It defines a vesting condition as a condition that includes an explicit or implicit requirement to provide services. It further requires nonvesting conditions to be treated in a similar fashion to market conditions. Failure to satisfy a nonvesting condition that is within the control of either the entity or the counterparty is accounted for as cancellation. However, failure to satisfy a nonvesting condition that is beyond the control of either party does not give rise to a cancellation.
• PFRS 8, Operating Segments
It replaces PAS 14, Segment Reporting, and adopts a full management approach to identifying, measuring and disclosing the results of an entity’s operating segments. The information reported would be that which management uses internally for evaluating the performance of operating segments and allocating resources to those segments. Such information may be different from that reported in the consolidated statement of financial position and consolidated statement of income and the company will provide explanations and reconciliations of the differences. This Standard is only applicable to an entity that has debt or equity instruments that are traded in a public market or that files (or is in the process of filing) its financial statements with a securities commission or similar party.
• Amendments to PAS 1, Presentation of Financial Statements In accordance with the amendments to PAS 1, the statement of changes in equity shall include only transaction with owners, while non-owner changes will be presented in equity as a single line with details included in a separate statement. Owners are defined as holders of instruments classified as equity.
In addition, the amendments to PAS 1 provides for the introduction of a new statements of comprehensive income that combines all items of income and expenses recognized in the profit or loss together with ‘other comprehensive income’. Entities may choose to present all items in one statement, or to present two linked statements, a separate statement of income and a statement of comprehensive income. These amendments also require additional requirements in the presentation of the statements of financial position and owner’s equity as well as additional disclosures to be included in the financial statements. Adoption of these amendments resulted in the following: (a) change in the title from consolidated balance sheet to consolidated statement of financial position; and (b) change in the presentation of changes in equity and other comprehensive income - non-owner changes in equity are now presented in the consolidated statement of comprehensive income.
• Amendments to PFRS 7, Financial Instruments: Disclosures - Improving Disclosures about
Financial Instruments The amendments to PFRS 7 introduce enhanced disclosures about fair value measurement and liquidity risk. The amendments to PFRS 7 require fair value measurements for each class of financial instruments to be disclosed by the source of inputs, using the following three-level hierarchy: (a) Level 1 - quoted prices (unadjusted) in active markets for identical assets or liabilities; (b) Level 2 - inputs other than quoted prices included in Level 1 that are observable for the asset or liability, either directly (as prices) or indirectly (derived from prices); and (c) Level 3 - inputs for the asset or liability that are not based on observable market data (unobservable inputs). The level within which the fair value measurement is categorized must be based on the lowest level of input to the instrument’s valuation that is significant to the fair value measurement in its entirety.
Additional disclosures required in the amendments to PFRS 7 are shown in Note 8. The amendments to PFRS 7 also introduce two major changes in liquidity risk disclosures as follows: (a) exclusion of derivative liabilities from maturity analysis unless the contractual maturities are essential for an understanding of the timing of the cash flows and (b) inclusion of financial guarantee contracts in the contractual maturity analysis based on the maximum amount guaranteed.
• Amendment to PAS 23, Borrowing Costs
The Standard has been revised to require capitalization of borrowing costs when such costs relate to a qualifying asset. A qualifying asset is an asset that necessarily takes a substantial period of time to get ready for its intended use or sale. The Group’s previous policy was to expense borrowing costs as they were incurred. In accordance to the transitional provisions of the amended PAS 23, the Group has adopted the Standard on a prospective basis. Therefore, borrowing costs are capitalized on qualifying assets with a commencement date on or after January 1, 2009. No changes were made on the borrowing costs incurred until that date that have previously been expensed. In 2009, a total of P=7.98 million borrowing costs have been capitalized on qualifying assets and were included in the “Real estate inventories” account (see Note 4).

• Amendments to PAS 32, Financial Instruments: Presentation, and PAS 1, Presentation of Financial Statements - Puttable Financial Instruments and Obligations Arising on Liquidation These amendments specify, among others, that puttable financial instruments will be classified as equity if they have all of the following specified features: (a) the instrument entitles the holder to require the entity to repurchase or redeem the instrument (either on an ongoing basis or on liquidation) for a pro rata share of the entity’s net assets; (b) the instrument is in the most subordinate class of instruments, with no priority over other claims to the assets of the entity on liquidation; (c) all instruments in the subordinate class have identical features; (d) the instrument does not include any contractual obligation to pay cash or financial assets other than the holder’s right to a pro rata share of the entity’s net assets; and (e) the total expected cash flows attributable to the instrument over its life are based substantially on the profit or loss, a change in recognized net assets, or a change in the fair value of the recognized and unrecognized net assets of the entity over the life of the instrument.
• Philippine Interpretation IFRIC 13, Customer Loyalty Programmes
This Interpretation requires customer loyalty award credits to be accounted for as a separate component of the sales transaction in which they are granted and therefore part of the fair value of the consideration received is allocated to the award credits and realized in income over the period that the award credits are redeemed or has expired.
• Philippine Interpretation IFRIC 16, Hedges of a Net Investment in a Foreign Operation This Interpretation provides guidance on identifying foreign currency risks that qualify for hedge accounting in the hedge of net investment; where within the group the hedging instrument can be held in the hedge of a net investment; and how an entity should determine the amount of foreign currency gains or losses, relating to both the net investment and the hedging instrument, to be recycled on disposal of the net investment.
Improvements to PFRS effective in 2009 In May 2008, the International Accounting Standards Board (IASB) issued its first omnibus of amendments to certain Standards, primarily with a view to removing inconsistencies and clarifying wording. These are the separate transitional provisions for each Standard. Except as otherwise indicated, the adoption of these new Standards did not have a significant impact on the Group’s consolidated financial statements: • PFRS 2, Share-based Payments • PFRS 5, Noncurrent Assets Held for Sale and Discontinued Operations • PAS 16, Property, Plant and Equipment • PAS 18, Revenue • PAS 19, Employee Benefits • PAS 23, Borrowing Costs • PAS 28, Investments in Associates • PAS 31, Interests in Joint Ventures • PAS 36, Impairment of Assets • PAS 38, Intangible Assets • PAS 39, Financial Instruments: Recognition and Measurement • PAS 40, Investment Property

Future Changes in Accounting Policies The Group will adopt the following Standards and Interpretations enumerated below when these become effective. Except as otherwise indicated, the Group does not expect the adoption of these new and amended Standards and Philippine Interpretations to have significant impact on its financial statements.
Effective in 2010 • Revised PFRS 3, Business Combinations and PAS 27, Consolidated and Separate Financial
Statements The revised PFRS 3 will become effective for annual periods beginning on or after July 1, 2009. It introduces a number of changes in the accounting for business combinations that will impact the amount of goodwill recognized, the reported results in the period that an acquisition occurs, and future reported results. The revised PAS 27 requires, among others, that (a) change in ownership interests of a subsidiary (that do not result in loss of control) will be accounted for as an equity transaction and will have no impact on goodwill nor will it give rise to a gain or loss; (b) losses incurred by the subsidiary will be allocated between the controlling and noncontrolling interests (previously referred to as ‘minority interests’); even if the losses exceed the noncontrolling equity investment in the subsidiary; and (c) on loss of control of a subsidiary, any retained interest will be remeasured to fair value and this will impact the gain or loss recognized on disposal. The changes introduced by the revised PFRS 3 and PAS 27 must be applied prospectively and will affect future acquisitions and transactions with noncontrolling interests.
• Amendments to PAS 27, Consolidated and Separate Financial Statements - Cost of an
Investment in a Subsidiary, Jointly Controlled Entity or Associate Amendments to PAS 27 will be effective for annual periods beginning on or after July 1, 2009 which has changes in respect of the holding companies’ separate financial statements, including, (a) the deletion of ‘cost method’, making the distinction between pre- and post-acquisition profits no longer required; and (b) in cases of reorganizations where a new parent is inserted above an existing parent of the group (subject to meeting specific requirements), the cost of the subsidiary is the previous carrying amount of its share of equity items in the subsidiary rather than its fair value. All dividends will be recognized in the statement of financial performance. However, the payment of such dividends requires the entity to consider whether there is an indicator of impairment.
• Amendment to PAS 39, Financial Instruments: Recognition and Measurement -Eligible hedged
items This Amendment, which will be effective for annual periods beginning on or after
July 1, 2009, addresses only the designation of a one-sided risk in a hedged item, and the designation of inflation as a hedged risk or portion in particular situations. The amendment clarifies that an entity is permitted to designate a portion of the fair value changes or cash flow variability of a financial instrument as a hedged item.
• Amendment to PFRS 2, Share-based Payments - Group Cash-settled Share-based Payment
Transactions The amendments to PFRS 2, effective for annual periods beginning on or after January 1, 2010, clarify the scope and the accounting for group cash-settled share-based payment transactions.
• Philippine Interpretation IFRIC 17, Distribution of Noncash Assets to Owners This Interpretation is effective for annual periods beginning on or after July 1, 2009
with early application permitted. It provides guidance on how to account for noncash distributions to owners. The Interpretation clarifies when to recognize a liability, how to measure it and the associated assets, and when to derecognize the asset and liability.
• Philippine Interpretation IFRIC 18, Transfer of Assets to Customers This Interpretation provides guidance to all entities that receive from customers an
item of property, plant and equipment or cash for the acquisition or construction of such item and such item is used to connect the customer to a network or to provide ongoing access to a supply of goods or services, or both. The Interpretation requires an assessment of whether an item of property, plant and equipment or cash for the acquisition or construction of such item meets the definition of an asset. If the terms of the agreement are within the scope of this interpretation, a transfer of an item of property, plant and equipment would be an exchange for dissimilar goods or services. Consequently, the exchange is regarded as a transaction which generates revenue. This Interpretation is to be applied prospectively to transfer of assets from customers received in periods beginning on or after July 1, 2009. Entities may however choose to apply this interpretation to earlier periods, provided valuations can be obtained at the time the transfer occurred.
Effective in 2012 • Philippine Interpretation IFRIC 15, Agreements for the Construction of Real Estate
This Interpretation, which will be effective January 1, 2012, covers accounting for revenue and associated expenses by entities that undertake the construction of real estate directly or through subcontractors. This Interpretation requires that revenue on construction of real estate be recognized only upon completion, except when such contract qualifies as construction contract to be accounted for under PAS 11, Construction Contracts, or involves rendering of services in which case revenue is recognized based on stage of completion. Contracts involving provision of services with the construction materials and where the risks and reward of ownership are transferred to the buyer on a continuous basis will also be accounted for based on stage of completion.
Improvements to PFRS effective in 2010 The omnibus amendments to PFRS issued in 2009 were issued primarily with a view to removing inconsistencies and clarifying wording. The following amendments are effective for annual periods financial years January 1, 2010 except otherwise stated. The Group has not yet adopted the following amendments and anticipates that these changes will have no material effect on the financial statements.
• PFRS 2, Share-based Payment
It clarifies that the contribution of a business on formation of a joint venture and combinations under common control are not within the scope of PFRS 2 even though they are out of scope of PFRS 3. The amendment is effective for financial years on or after July 1, 2009.
• PFRS 5, Noncurrent Assets Held for Sale and Discontinued Operations It clarifies that the disclosures required in respect of noncurrent assets and disposal groups classified as held for sale or discontinued operations are only those set out in PFRS 5. The disclosure requirements of other PFRS only apply if specifically required for such noncurrent assets or discontinued operations.

• PFRS 8, Operating Segment Information It clarifies that segment assets and liabilities need only be reported when those assets and liabilities are included in measures that are used by the chief operating decision maker.
• PAS 1, Presentation of Financial Statements
It clarifies that the terms of a liability that could result, at anytime, in its settlement by the issuance of equity instruments at the option of the counterparty do not affect its classification.
• PAS 7, Statement of Cash Flows It explicitly states that only expenditure that results in a recognized asset can be classified as a cash flow from investing activities.
• PAS 17, Leases
It removes the specific guidance on classifying land as a lease. Prior to the amendment, leases of land were classified as operating leases. The amendment now requires that leases of land are classified as either ‘finance’ or ‘operating’ in accordance with the general principles of PAS 17. The amendment will be applied retrospectively.
• PAS 36, Impairment of Assets
It clarifies that the largest unit permitted for allocating goodwill, acquired in a business combination, is the operating segment as defined in PFRS 8 before aggregation for reporting purposes.
• PAS 38, Intangible Assets
It clarifies that if an intangible asset acquired in a business combination is identifiable only with another intangible asset, the acquirer may recognize the group of intangible assets as a single asset provided the individual assets have similar useful lives. Also, it clarifies that the valuation techniques presented for determining the fair value of intangible assets acquired in a business combination that are not traded in active markets are only examples and are not restrictive on the methods that can be used.
• PAS 39, Financial Instruments: Recognition and Measurement
It clarifies the following: (a) That a prepayment option is considered closely related to the host contract
when the exercise price of a prepayment option reimburses the lender up to the approximate present value of lost interest for the remaining term of the host contract.
(b) That the scope exemption for contracts between an acquirer and a vendor in a business combination to buy or sell an acquiree at a future date applies only to binding forward contracts, and not derivative contracts where further actions by either party are still to be taken.
(c) That gains or losses on cash flow hedges of a forecast transaction that subsequently results in the recognition of a financial instrument or on cash flow hedges of recognized financial instruments should be reclassified in the period that the hedged forecast cash flows affect profit or loss.
• Philippine Interpretation IFRIC 9, Reassessment of Embedded Derivatives
It clarifies that it does not apply to possible reassessment at the date of acquisition, to embedded derivatives in contracts acquired in a business combination between entities or businesses under common control or the formation of joint venture.
• Philippine Interpretation IFRIC 16, Hedge of a Net Investment in a Foreign Operation It states that, in a hedge of a net investment in a foreign operation, qualifying hedging instruments may be held by any entity or entities within the group, including the foreign operation itself, as long as the designation, documentation and effectiveness requirements of PAS 39 that relate to a net investment hedge are satisfied.
2. Basis of Consolidation The consolidated financial statements comprise the financial statements of Vista Land and Lifescapes and its subsidiaries as at March 31, 2010 and 2009 and for period ended March 31, 2010. The financial statements of the subsidiaries are prepared for the same reporting year as the Parent Company, using consistent accounting policies. The following are the Group’s wholly subsidiaries:
• Camella Homes, Inc. (CHI) and Subsidiaries • Brittany Corporation (Brittany) • Crown Asia Properties, Inc. (CAPI) • Communities Philippines, Inc. (CPI) and Subsidiaries; and • Vista Residences, Inc. (Formerly Polar Mines Realty Ventures, Inc.) (VRI)
The Group is engaged mainly in the development of residential subdivisions and construction of housing and condominium units. The Group offers a range of products from socialized and affordable housing to middle income and high-end subdivision house and lots and condominium projects. Camella Homes, Inc. and Subsidiaries On October 30, 2007, SEC approved the merger between Palmera Homes, Inc., Eastridge Estates, Inc., Ridgewood Estates, Inc. and Household Development Corp. (HDC), the latter being the surviving entity. All of these entities are within the group of Camella Homes. HDC did not issue any consideration in exchange for the shares of the three other subsidiaries. HDC and the Parent Company has accounted for this transaction as reorganization of entities under common control, using pooling of interest method. Accordingly, the accompanying consolidated financial statements have been prepared as if the current corporate structure had been in existence in all periods presented. On August 15, 2008, the shareholders ratified the BOD approval of the amendment of the name of the corporation from “C & P Homes, Inc.” to “Camella Homes, Inc.” Likewise, the shareholders ratified the BOD resolution to change the par value of shares from P=1.00 per share to P=10,000 per share. The amendments in the articles of incorporation was approved by SEC on March 12, 2009, to increase the par value from P=1.00 per share to P=10,000 per share and correspondingly decrease the number of shares comprising the authorized capital stock of CHI from seven (7) billion to 700,000 shares. Crown Asia Properties, Inc. On August 13, 2008, SEC approved the merger between Symmetrical Ventures, Inc., Crown Asia Properties (North), Inc., and Crown Asia Properties, Inc., the latter being the surviving entity. Crown Asia Properties Inc. did not issue any consideration in exchange for the shares accounted for this transaction and accounted this transaction as reorganization of entities under common control, using pooling of interest method. Accordingly, the accompanying financial statements have been prepared as if the current corporate structure had been in existence in all periods presented.

Communities Philippines, Inc. and Subsidiaries At a meeting on August 6, 2008, the BOD approved the increase of the authorized capital of CPI from fifty million pesos (P=50,000,000) divided into five hundred thousand (500,000) shares with par value of one hundred pesos (P=100) per share to one billion (10,000,000,00) divided into ten million (10,000,000) shares with par value of one hundred pesos (P=100) per share. Also, on the same date, the BOD and the stockholders amended the corporate name from “Crown Communities Holdings, Inc” to “Communities Philippines, Inc.” The SEC approved the increase of capital stock and the application of change in corporate name on September 24, 2008. Out of the increase in the authorized capital stock of CPI, the amount of five hundred million (P=500,000,000) pesos has been actually subscribed by the Parent Company and the amount of five hundred four million three hundred seventy-two thousand nine hundred (P=504 million) pesos has been paid, inclusive of premium, by way of assignment of shares of stocks on the following subsidiaries: • Communities Cebu, Inc. • Communities Davao, Inc. • Communities Iloilo, Inc. • Communities Pampanga, Inc. In 2009, the BOD and the stockholders approved the change in the corporate names of CPI’s subsidiaries which was approved by SEC on various dates as follows:
Former Name Current Name Date ApprovedCommunities Philippines Cam. Sur, Inc. Communities Naga, Inc. March 13, 2009
Crown Communities (Batangas), Inc. Communities Batangas, Inc. April 1, 2009Crown Communities (Bulacan), Inc. Communities Bulacan, Inc. July 31, 2009Crown Communities (Cagayan), Inc. Communities Cagayan, Inc. April 15, 2009Crown Communities (Cebu), Inc. Communities Cebu, Inc. June 30, 2009Crown Communities (Davao), Inc. Communities Davao, Inc. April 3, 2009Crown Communities (Iloilo), Inc. Communities Iloilo, Inc. April 16, 2009Crown Communities (Pampanga), Inc. Communities Pampanga, Inc. April 3, 2009Crown Communities (Pangasinan), Inc. Communities Pangasinan, Inc. July 7, 2009
Moreover, the BOD and stockholders approved the change of registered address of all fifteen (15) subsidiaries under CPI which has now a uniform principal address at Mezzanine Floor, Starmall Complex, EDSA cor. Shaw Blvd., Mandaluyong City. The SEC subsequently approved the amendment on various dates above. Vista Residences, Inc. On October 29, 2009, the Group acquired from Polar Property, through the Parent Company, 97.50% voting shares of VRI in exchange of 320,686,000 treasury shares valued at P=660.61 million. The Parent Company accounted for the acquisition using the purchase method. On December 4, 2009, the BOD and the stockholders approved the change in the corporate name from “Polar Mines Realty Ventures, Inc.” to “Vista Residences, Inc. “. On January 29, 2010, the SEC approved the change in corporate name.

The consolidated financial statements include the financial statements of the Parent Company and the following domestic subsidiaries: Percentages equity interest 2009 2008 2007 Brittany 100.00% 100.00% 100.00%CAPI 100.00 100.00 100.00 CHI 100.00 100.00 100.00 Household Development Corp. 100.00 100.00 100.00 Mandalay Resources Corp. 100.00 100.00 100.00 C&P International Limited 100.00 100.00 100.00 CPI 100.00 100.00 100.00 Communities Batangas, Inc. 100.00 100.00 100.00 Communities Bulacan, Inc. 100.00 100.00 100.00 Communities Cagayan, Inc. 100.00 100.00 100.00 Communities Cebu, Inc. 100.00 100.00 100.00 Communities Davao, Inc. 100.00 100.00 100.00 Communities General Santos, Inc. 100.00 100.00 – Communities Iloilo, Inc. 100.00 100.00 100.00 Communities Isabela, Inc. 100.00 100.00 – Communities Leyte, Inc. 100.00 100.00 – Communities Naga, Inc. 100.00 100.00 100.00 Communities Negros Occidental, Inc. 100.00 100.00 – Communities Pampanga, Inc. 100.00 100.00 100.00 Communities Pangasinan, Inc. 100.00 100.00 100.00 Communities Tarlac, Inc. 100.00 100.00 – VRI 100.00 – –
Subsidiaries are consolidated from the date of acquisition, being the date on which the Group obtains control, and continue to be consolidated until the date that such control ceases. Control is achieved when the Group has the power to govern the financial and operating decisions of an entity so as to obtain benefits from its activities. The results of subsidiaries acquired or disposed during the year are included in the consolidated statement of comprehensive income from the date of the acquisition or up to the date of disposal, as appropriate.
Except as stated otherwise, the consolidated financial statements are prepared using uniform accounting policies for like transactions and other events in similar circumstances. All significant intercompany balances and transactions, including intercompany profits and unrealized profits and losses, were eliminated during consolidation in accordance with the accounting policy on consolidation.
Minority interests represent the portion of profit or loss and net assets in subsidiaries not wholly owned by the Parent Company and are presented separately in the consolidated statement of comprehensive income and consolidated statement of changes in equity and within equity in the consolidated statement of financial position, separately from the Parent Company’s equity.
3. Receivables This account consists of:
Installment Contracts Receivables: Short –term 7,684 Long-Term 9,458 17,142 Receivables from Contractors suppliers, brokers and others 2,867 20,009 Less: allowance for probable losses (338) Total Receivable, net 19,671
Installment Contracts Receivable
Short-term installment contracts receivable consists of accounts collectible in equal monthly principal installments usually within 12 to 18 months, with the entire repayment period not exceeding 24 months. The corresponding titles to the subdivision units sold under this arrangement are transferred to the buyers only upon full payment of the contract price.
To further improve much needed operating cash flows without significantly affecting
profitability, the Group shifted its focus from government-financed to internally financed sales transactions which entailed shorter repayment periods. A substantial portion of the real estate sales was internally financed under the short-term deferred cash payment arrangement.
Long-term installment contracts receivable principally consists of amounts arising from sale of
real estate subdivision units which are collectible within 2 to 15 years with interest at prevailing market rates. The corresponding titles to the subdivision units sold under this arrangement are transferred to the buyers only upon full payment of the contract price.
The following presents the breakdown of installment contracts receivable and receivables from contractors, suppliers, brokers and others by maturity dates:
Due within 1 yr Installment receivable 7,684 Receivables from Contractors suppliers, brokers and others 2,867 10,551 Due over 1 yr Installment receivable 9,458
Receivables from Contractors suppliers, brokers and
- others 9,458 Total Receivables, gross 20,009

4. Real Estate for Sale and Development
This account consists of:
Subdivision land available for sale and development represents real estate subdivision projects in which the Group has been granted license to sell by the Housing and Land Use Regulatory Board of the Philippines.
Borrowing cost capitalized in 2009 amounted to P=7.98 million.
5. Bank Loans
This account consists of:
Bank loans represent long-term payable to local banks bearing average interest rates of 8.0% and 5.99% as of March 31, 2010 and December 31, 2009, respectively. The interest rates are based on the latest 91-day and 182-day treasury bill rates plus spread rate of 2.0% to 2.5%. These loans are payable in annual installments for a maximum loan period of ten years. The loans payable pertain to sold “Installment contracts receivable”. These loans had fixed interest rates ranging from 5.00% to 14.00% in 2009 and in the three months ended March 31, 2010 based on the remaining terms of the sold installment contracts receivable, payable on equal monthly installments over a maximum period of years depending on the terms of the installment contracts receivable
Subdivision land available for sales 12,629 Less reserve for land development (4,972) 7,657 Residential units for sale and development 3,651 Total subdivision land and residential units for sale and Developments 11,308 Undeveloped land 17,016 Total 28,324
Maturity Principal Bank Loans Banco de Oro 2010 270 Bank of Commerce 2011 135 Unionbank 2015 46 451 Loans payable 4,057 Total 4,508

6. Accounts and Other Payables
This account consists of:
Accounts payable 1,479 Accrued expenses 1,389 Deferred VAT Payable 962 Retention Payable 680 Commission Payable 471 Others 72 Total 5,053
The accounts payable, accrued expenses, retention payable and commissions payable are noninterest-bearing and are mostly composed of payable to contractors and supplier of materials
7. Long Term note (LTN)
The LTN’s, which is payable over fifteen years, was initially recorded at present value of P=1.29 billion (US$26.52 million) with discount amounting to P=982 million (US$20.25 million). There will be a quarterly accretion of interest expense for the next 15 years. The above transaction resulted to a gain of P=1.44 billion presented as a separate line item in the consolidated statement of comprehensive income under the account “Gain from restructuring” in 2007. The LTN was translated to Philippine peso using the USD/Php foreign exchange rate as of December 31, 2007 of P=41.28 to US$1.00 which resulted to a foreign exchange gain of P=199.88 million which is presented under “Miscellaneous income” account in the consolidated statements of comprehensive income. Interest rates ranges for LTNs ranges from 1% to 5% over certain contractual periods with effective interest rate of 8.59%. The total amount of interest expense recognized in 2009 and the three months ended March 31, 2010 pertaining to accretion of LTNs amounted to P=62.72 million and P=8.83 million, respectively. In 2009, the Company settled an amount of P=1,019.77 million (US$28.53 million) of LTNs which resulted to a loss amounting to P=318.81 million. As of March 31, 2010 and December 31, 2009 the outstanding balance of the LTNs amounted to P=493.62 million and P=495.43 million, respectively.
8. Financial Instruments
Financial Risk Management Objectives and Policies
Capital Management The primary objective of the Group’s capital management is to ensure that it maintains a strong credit rating and healthy capital ratios in order to support its business and maximize shareholder value.
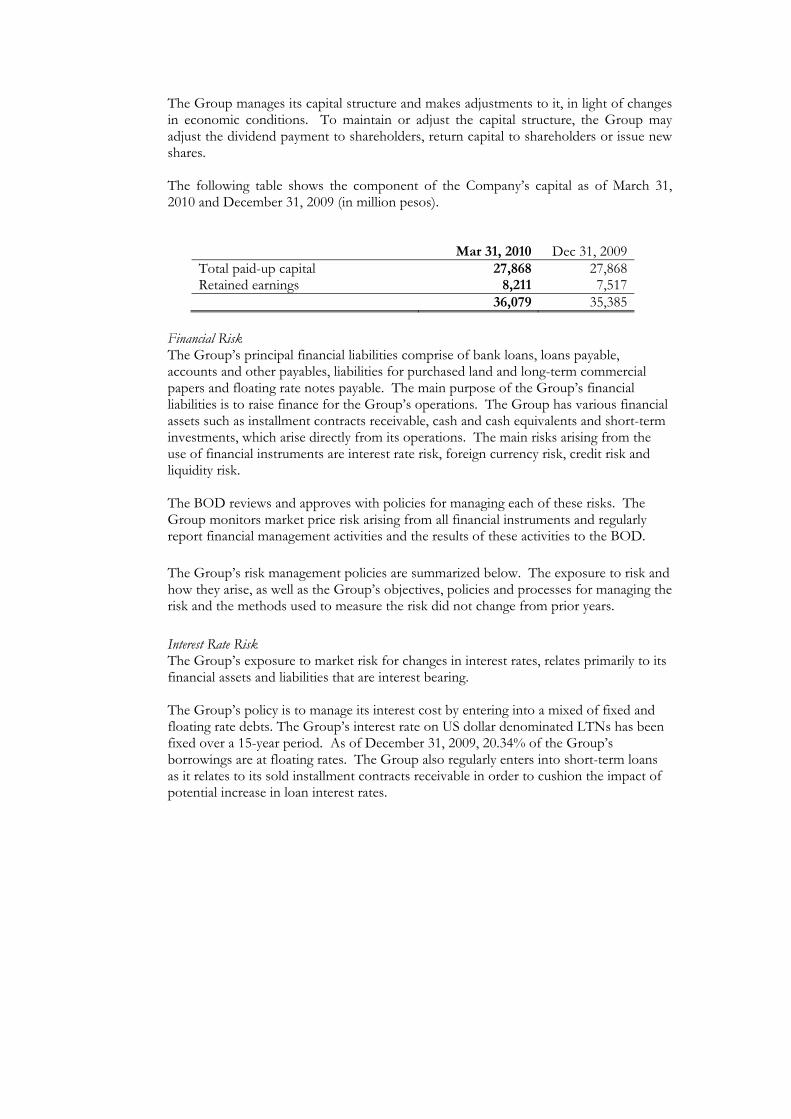
The Group manages its capital structure and makes adjustments to it, in light of changes in economic conditions. To maintain or adjust the capital structure, the Group may adjust the dividend payment to shareholders, return capital to shareholders or issue new shares.
The following table shows the component of the Company’s capital as of March 31, 2010 and December 31, 2009 (in million pesos).
Mar 31, 2010 Dec 31, 2009 Total paid-up capital 27,868 27,868 Retained earnings 8,211 7,517 36,079 35,385
Financial Risk The Group’s principal financial liabilities comprise of bank loans, loans payable, accounts and other payables, liabilities for purchased land and long-term commercial papers and floating rate notes payable. The main purpose of the Group’s financial liabilities is to raise finance for the Group’s operations. The Group has various financial assets such as installment contracts receivable, cash and cash equivalents and short-term investments, which arise directly from its operations. The main risks arising from the use of financial instruments are interest rate risk, foreign currency risk, credit risk and liquidity risk.
The BOD reviews and approves with policies for managing each of these risks. The Group monitors market price risk arising from all financial instruments and regularly report financial management activities and the results of these activities to the BOD.
The Group’s risk management policies are summarized below. The exposure to risk and how they arise, as well as the Group’s objectives, policies and processes for managing the risk and the methods used to measure the risk did not change from prior years. Interest Rate Risk The Group’s exposure to market risk for changes in interest rates, relates primarily to its financial assets and liabilities that are interest bearing.
The Group’s policy is to manage its interest cost by entering into a mixed of fixed and floating rate debts. The Group’s interest rate on US dollar denominated LTNs has been fixed over a 15-year period. As of December 31, 2009, 20.34% of the Group’s borrowings are at floating rates. The Group also regularly enters into short-term loans as it relates to its sold installment contracts receivable in order to cushion the impact of potential increase in loan interest rates.

The table below shows the financial assets and liabilities that are interest-bearing (in million pesos except for the effective interest rate):
Mar 31, 2010 Dec 31, 2009 Financial Assets
Effective Interest Rate
Amount
Effective Interest Rate
Amount
Fixed Rate Cash and cash equivalents 1.6% - 4.6% 2,377 1.6% - 4.6% 3,011 Short-term cash
Investments
5.0% - 6.5% 139
5.0% - 6.5%
136 Installment contracts
receivable
16.0% - 19.0%
17,142
16.0% - 19.0%
15,702Total 19,658 18,849 Financial Liabilities Floating Rate Bank Loans 91-day and
182-day treasury bill
rates plus spread of
2.0% to 2.5%
451 91-day and 182-day
treasury bill rates plus
spread of 2.0% to 2.5%
452
Fixed Rate LTNs 8.59% 494 8.59% 495 945 947
Foreign Exchange Risk The Group’s foreign exchange risk results primarily from movements of the Philippine peso against the United States Dollar (USD). Approximately 2.57% and 2.59% of the total liabilities of the Group as of December 31, 2009 and March 31, 2010, respectively, are denominated in USD. The Group’s foreign currency-denominated debt comprises of the LTNs. Below are the carrying values and the amounts in US$ of these foreign currency denominated liabilities. There are no foreign currency denominated assets.
Mar 31, 2010 Dec 31, 2010 Peso US$ Peso US$ LTNs 494 11 495 11
The following table demonstrates the sensitivity to a reasonably possible change in foreign exchange rate of USD/Php until its next reporting period with all other variables held constant, of the Group’s profit before tax and the Group’s equity, (due to year end translation of foreign currency denominated assets and liabilities) as of March 31, 2010:
Increase/decreasein US Dollar rate
Effect on profit before tax
LTNs +P1.00 (P11) million
-P1.00 P11 million
There are no items affecting equity except for those impacting profit or loss.
Credit Risk The Group transacts only with recognized, creditworthy third parties. The Group’s receivables are monitored on an ongoing basis resulting to manageable exposure to bad debts. Real estate buyers are subject to standard credit check procedures, which are calibrated based on payment scheme offered. The Group’s respective credit management units conduct a comprehensive credit investigation and evaluation of each buyer to establish creditworthiness.
Receivable balances are being monitored on a regular basis to ensure timely execution of necessary intervention efforts. In addition, the credit risk for installment contracts receivable is mitigated as the Group has the right to cancel the sales contract without need for any court action and take possession of the subject house in case of refusal by the buyer to pay on time the due installment contracts receivable. This risk is further mitigated because the corresponding title to the subdivision units sold under this arrangement is transferred to the buyers only upon full payment of the contract price.
With respect to credit risk arising from the other financial assets of the Group, which comprise of cash and cash equivalents and AFS financial assets, the Group’s exposure to credit risk arises from default of the counterparty, with a maximum exposure equal to the carrying amount of these instruments. The Group manages its cash by maintaining cash accounts with banks which have demonstrated financial soundness for several years. The Group’s investments in AFS are incidental to its housing projects and are considered by the Group to be of high quality because these are investments with the biggest electric utility company in the country. The maximum exposure to credit risk for the components of the balance sheet in March 31, 2010 pertains to its total receivables of P19.7 billion. The maximum exposure is shown gross, before the effect of mitigation through the use of collateral agreements. The subject lots and residential houses sold are held as collateral for the all installment contracts receivables. Given the Group’s diverse base of counterparties, it is not exposed to large concentrations of credit risk. Liquidity Risk The Group monitors its cash flow position, debt maturity profile and overall liquidity position in assessing its exposure to liquidity risk. The Group maintains a level of cash deemed sufficient to finance its cash requirements. Operating expenses and working capital requirements are sufficiently funded through cash collections. The Group’s loan maturity profile is regularly reviewed to ensure availability of funding through adequate credit facilities with banks and other financial institutions.
The extent and nature of exposures to liquidity risk and how they arise as well as the Group’s objectives, policies and processes for managing the risk and the methods used to measure the risk are the same for March 31, 2010 and December 31, 2009.
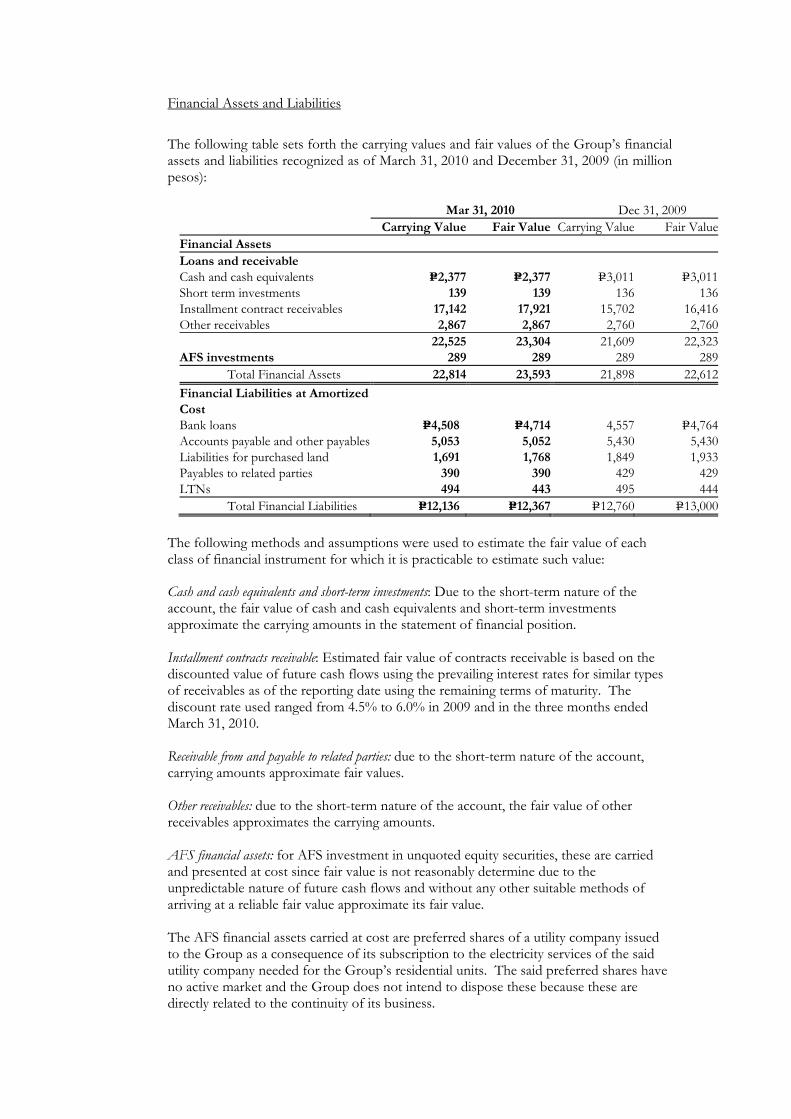
Financial Assets and Liabilities
The following table sets forth the carrying values and fair values of the Group’s financial assets and liabilities recognized as of March 31, 2010 and December 31, 2009 (in million pesos):
Mar 31, 2010 Dec 31, 2009 Carrying Value Fair Value Carrying Value Fair ValueFinancial Assets Loans and receivable Cash and cash equivalents P=2,377 P=2,377 P=3,011 P=3,011Short term investments 139 139 136 136Installment contract receivables 17,142 17,921 15,702 16,416Other receivables 2,867 2,867 2,760 2,760 22,525 23,304 21,609 22,323AFS investments 289 289 289 289 Total Financial Assets 22,814 23,593 21,898 22,612Financial Liabilities at Amortized Cost Bank loans P=4,508 P=4,714 4,557 P=4,764Accounts payable and other payables 5,053 5,052 5,430 5,430Liabilities for purchased land 1,691 1,768 1,849 1,933Payables to related parties 390 390 429 429LTNs 494 443 495 444 Total Financial Liabilities P=12,136 P=12,367 P=12,760 P=13,000
The following methods and assumptions were used to estimate the fair value of each class of financial instrument for which it is practicable to estimate such value: Cash and cash equivalents and short-term investments: Due to the short-term nature of the account, the fair value of cash and cash equivalents and short-term investments approximate the carrying amounts in the statement of financial position. Installment contracts receivable: Estimated fair value of contracts receivable is based on the discounted value of future cash flows using the prevailing interest rates for similar types of receivables as of the reporting date using the remaining terms of maturity. The discount rate used ranged from 4.5% to 6.0% in 2009 and in the three months ended March 31, 2010. Receivable from and payable to related parties: due to the short-term nature of the account, carrying amounts approximate fair values. Other receivables: due to the short-term nature of the account, the fair value of other receivables approximates the carrying amounts. AFS financial assets: for AFS investment in unquoted equity securities, these are carried and presented at cost since fair value is not reasonably determine due to the unpredictable nature of future cash flows and without any other suitable methods of arriving at a reliable fair value approximate its fair value. The AFS financial assets carried at cost are preferred shares of a utility company issued to the Group as a consequence of its subscription to the electricity services of the said utility company needed for the Group’s residential units. The said preferred shares have no active market and the Group does not intend to dispose these because these are directly related to the continuity of its business.
Accounts and other payables: fair values of accounts and other payables and accrued expenses and payables to affiliated companies approximate their carrying amounts in the statement of financial position due to the short-term nature of the transactions. Bank loans, liabilities for purchased land, loans payable, LTNs, LTCP and FRNs: estimated fair values of bank loans, liabilities for purchased land, loans payable, LTNs, LTCP and FRNs are based on the discounted value of future cash flows using the applicable rates for similar types of loans. Interest rates used in discounting cash flows ranges from 4.27% to 9.38% in 2009 and in the three months ended March 31, 2010 using the remaining terms to maturity. The Group uses the following three-level hierarchy for determining and disclosing the fair value of financial instruments by valuation technique:
The Group has no financial instruments measured at fair value as of March 31, 2010 and December 31, 2009.

MANAGEMENT DISCUSSION AND ANALYSIS OF FINANCIAL CONDITION AND RESULTS OF OPERATIONS
Results of operations covering three months ended March 31, 2010 vs. three months ended March 31, 2009 Revenues Real Estate The Company recorded revenue from real estate sales of P=2,683.5 million for the three months ended March 31, 2010, an increase of 9.4% from P=2,451.9 million in same period last year. This was primarily attributable to the increase in the overall percentage of completion of sold inventories of its business units during the three months of 2010 compared to three months of 2009. The Company uses the Percentage of completion method of revenue recognition where revenue is recognized in reference to the stages of development of the properties.
• Real estate revenue of Communities Philippines increased to P=1,012.1 million for the three months ended March 31, 2010, an increase of 36.8% from P=739.6 million for the three months ended March 31, 2009. This increase was principally due to increase in Communities Philippines’ completion of sold inventories from its various projects for the period. Communities Philippines is the business unit of Vista Land that offers residential properties outside the Mega Manila area.
• Real estate revenue of Camella Homes decreased by 13.1% to P=729.0 million for the
three months ended March 31, 2010 compared to the P=838.9 million for the three months ended March 31, 2009. This was due to slight decrease in the completion of sold inventories of various Camella Homes projects. Camella Homes caters to the low and affordable segment of the market.
• Real estate revenue of Brittany decreased by 42.4% to P=258.4 million for the three
months ended March 31, 2010 from P=448.3 million in the same period last year. This was due to the decrease in the completion of sold inventories of Brittany’s various projects. Brittany caters to the high-end segment of the market.
• Real estate revenue of Crown Asia increased by 4.5% to P=444.5 million for the three
months ended March 31, 2010 from P=425.2 million in the three months ended March 31, 2009. This was due to the increase in the completion of sold inventories of Crown Asia’s different projects period. Crown Asia is Vista Land’s business unit for the middle income segment of the market
• Real estate revenue from Vista Residences for the quarter ended March 31, 2010 amounted to P=239.5
Unrealized foreign exchange gains (losses) Unrealized foreign exchange loss of P28.0 million for the three months ended March 31, 2009 was reversed by an unrealized foreign exchange gain of P=8.6 million for the three months ended March 31, 2010 due to the appreciation of the reporting currency for the period. Interest Income Interest income increased to P=196.3 million for the three months ended March 31, 2010 from P157.7 million for the three months ended March 31, 2009. The 24.5% increase was due to the higher collection of interest for the period.
Miscellaneous Miscellaneous revenue decreased by 45.6% to P=58.1 million for the three months ended March 31, 2010 from P106.8 million in the three months ended March 31, 2009 due to decline in real estate sales deposit forfeitures.
Costs and Expenses Cost and expenses increased by 10% to P=2,094.5 million in the three months ended March 31, 2010 from P1,904.3 million in the three months ended March 31, 2009. The 10% increase in the account was primarily attributable to the following:
• Cost of real estate sales increased by 8.5% to P=1,376.8 million for the three months ended March 31, 2010 from P1,268.7 million for the three months ended March 31, 2009. This was primarily due to increase in the overall recorded sales of Vista Land’s business units.
• Operating expenses increased by 13.3% to P=586.8 million for the three months ended
March 31, 2010 from P517.9 million for the three months ended March 31, 2008. This was primarily due to the following:
o an increase in commissions to P=155.8 million for the three months ended March
31, 2010 from P147.1 million for the three months ended March 31, 2009 primarily due to increased real estate sales;
o an increase in the advertising and promotions to P=152.0 million for the three
months ended March 31, 2010 from P132.4 million for the three months ended March 31, 2009 resulting from aggressive marketing activities for the period; and
o a decrease in repairs and maintenance to P=43.9 million for the three months
ended March 31, 2010 from P46.3 million for the three months ended March 31, 2009 due to an decrease in the number of projects for repair for the period.
• Interest and financing charges increased by 11.4% to P=131.0 million for the three
months ended March 31, 2010 from P117.6 million for the three months ended March 31, 2009 due to the increase of the interest bearing payables of the Company.
Provision for Income Tax Provision for income tax was P=157.6 million in the three months ended March 31, 2010 and P=192.1 million in the three months ended March 31, 2009, representing a decrease of 18.0%. The decrease was due primarily to the lower taxable income for the period. Net Income As a result of the foregoing, the Company’s net income increased by 17.3% to P=694.3 million in the three months ended March 31, 2010 from P592.0 million in the three months ended March 31, 2009. For the three months ended March 31, 2010, there were no seasonal aspects that had a material effect on the financial condition or results of operations of the Company. Neither were there any trends, events or uncertainties that have had or that are reasonably expected to have a material impact on the net sales or revenues or income from continuing operations. The Company is not aware of events that will cause a material change in the relationship between the costs and revenues.

There are no significant elements of income or loss that did not arise from the Company’s continuing operations. Financial Condition as of March 31, 2010 vs. December 31, 2009 Total assets as of March 31, 2010 were P=55,131.7 million compared to P54,636.2 million as of December 31, 2009, or a 0.9% increase. This was due to the following:
• Cash and cash equivalents including short term cash investments posted a decline of 20%, from P3,146.6 million as of December 31, 2009 to P=2,516.4 million as of March 31, 2010 due to increase in the payments of working capital expenses.
• Receivables increased by 8.5% from P18,137.6 million as of December 31, 2009 to
P=19,671.5 million as of March 31, 2010 due to the revenue recognized for the period.
• Property and Equipment increased by 4.3% from P92.2 million as of December 31, 2009 to P=96.1 million as of March 31, 2010 due primarily to the acquisitions for the period.
Total liabilities as of March 31, 2010 were P=19,053.0 million compared to P19,251.7 million as of December 31, 2009, or a 1% decrease. This was due to the following:
• Accounts and other payables decreased by 6.9% to P=5,055.1 million as of March 31, 2010 from P5,430.0 million as of December 31, 2009 due to payments made during the period.
• Customers’ advances and deposits increased by 7.1% to P=3,897.7 million as of March 31, 2010 from P3,638.5 million as of December 31, 2009 due to a higher real time sales for the period.
• Liabilities for purchased land decreased by 8.6% from P1,848.6 million as of December 31, 2009 to P=1,690.6 million as of March 31, 2010 due to payments made during the period.
• Due to related parties decreased by 9.1% from P428.9 million as of December 31, 2009
to P=389.9 million as of March 31, 2010 due to settlements made during the period.
• Pension liabilities increased by 5.6% from P132.5 million as of December 31, 2009 to P=139.9 million as of March 31, 2010 due to accruals made during the period.
• Deferred tax liabilities (net) posted a decrease of 6.0% from P2,625.8 million as of
December 31, 2009 to P=2,783.6 million as of March 31, 2010. The increase in the account was due primarily recognition of the timing difference between the taxable and recorded revenues.
Total stockholder’s equity increased by 2.0% to P=36,078.7 million as of March 31, 2010 from P35,384.5 million as of December 31, 2009 due to the net profit realized for the period. Considered as the top five key performance indicators of the Company as shown below: Key Performance Indicators 3/31/2010 12/31/2009 Current ratio (a) 1.97:1 1.80:1 Debt-to-equity ratio (b) 0.53:1 0.54:1 Interest expense/Income before Interest expense (c) 13.3% 13.0% Return on assets (d) 1.3% 1.1% Return on equity (e) 1.9% 1.7%

Notes:
(a) Current Ratio: This ratio is obtained by dividing the Current Assets (Cash and Cash Equivalents, Short term cash investments, Current Receivables and Other
Current Assets) of the Company by its Current liabilities (Bank loans, Accounts and Other Payables, Current Portion of Bank Loans and Current Liabilities
for purchased land). This ratio is used as a test of the Company’s liquidity.
(b) Debt-to-equity ratio: This ratio is obtained by dividing the Company’s Total Liabilities by its Total Equity. The ratio reveals the proportion of debt and equity a
company is using to finance its business. It also measures a company’s borrowing capacity.
(c) Interest expense/Income before interest expense: This ratio is obtained by dividing interest expense for the period by its income before interest expense. This ratio
shows whether a company is earning enough profits before interest to pay its interest cost comfortably
(d) Return on assets: This ratio is obtained by dividing the Company’s net income by its total assets. This measures the Company’s earnings in relation to all of the
resources it had at its disposal.
(e) Return on equity: This ratio is obtained by dividing the Company’s net income by its total equity. This measures the rate of return on the ownership interest of the
Company’s stockholders.
Because there are various calculation methods for the performance indicators above, the Company’s presentation of such may not be comparable to similarly titled measures
used by other companies.
Current ratio as of March 31, 2010 improved from that of December 31, 2009 due to the increase in the accounts receivable and the decrease in the account and other payables. The increase in the accounts receivable was due to the revenue recognized for the period while the decrease in the accounts and other payables was due to payments made during the period. Return on asset was slightly higher in March 31, 2010 compared to March 31, 2009 due to the higher net income recorded for the 1st quarter of 2010. Return on equity increased due to the higher net income recorded for the 1st quarter of 2010 compared to that of the prior period.
Material Changes to the Company’s Balance Sheet as of March 31, 2010 compared to December 31, 2009 (increase/decrease of 5% or more)
Cash and cash equivalents including short term cash investments posted a decline of 20%, from P3,146.6 million as of December 31, 2009 to P=2,516.4 million as of March 31, 2010 due to increase in the payments of working capital expenses. Receivables increased by 8.5% from P18,137.6 million as of December 31, 2009 to P=19,671.5 million as of March 31, 2010 due to the revenue recognized for the period. Property and Equipment increased by 4.3% from P92.2 million as of December 31, 2009 to P=96.1 million as of March 31, 2010 due primarily to the acquisitions for the period. Accounts and other payables decreased by 6.9% from P=5,430.0 million as of December 31, 2009 to P=5,055.1 million as of March 31, 2010 due to payments made during the period. Customers’ advances and deposits increased by 7.1% from P=3,638.5 million as of December 31, 2009 to P=3,897.7 million as of March 31, 2010 due to payments made during the period. Liabilities for purchased land decreased by 8.6% from P1,848.6 million as of December 31, 2009 to P=1,690.6 million as of March 31, 2010 due to payments made during the period.

Due to related parties decreased by 9.1% from P428.9 million as of December 31, 2009 to P=389.9 million as of March 31, 2010 due to settlements made during the period.
Pension liabilities increased by 5.6% from P132.5 million as of December 31, 2009 to P=139.9 million as of March 31, 2010 due to accruals made during the period.
Deferred tax liabilities (net) posted a decrease of 6.0% from P2,625.8 million as of December 31, 2009 to P=2,783.6 million as of March 31, 2010. The increase in the account was due primarily recognition of the timing difference between the taxable and recorded revenues.
Material Changes to the Company’s Statement of income for the three months ended March 31, 2010 compared to the three months ended March 31, 2009 (increase/decrease of 5% or more)
Revenue from real estate sales increased by 9.4% from P=2,451.9 million for the three months ended March 31, 2009 to P=2,683.5 million for the three months ended March 31, 2010 mainly due to the increase in the overall percentage of completion of sold inventories of Vista Land’s business units during the three months of 2010 compared to three months of 2009. Unrealized foreign exchange losses decreased by 130.6% from a loss P=28.0 million for the three months ended March 31, 2009 to a gain of P=8.6 million for the three months ended March 31, 2010 due to the appreciation of the reporting currency for the period. Interest income increased by 24.5% from P=157.7 million for the three months ended March 31, 2009 to P=196.3 million for the three months ended March 31, 2010 due to the higher collection of interest for the period. Miscellaneous revenue decreased by 45.6% from P=106.8 million for the three months ended March 31, 2009 to P=58.1 million for the three months ended March 31, 2010 to decline in real estate sales deposit forfeitures. Operating expenses increased by 13.3% from P=517.9 million for the three months ended March 31, 2009 to P=586.8 million for the three months ended March 31, 2010 mainly due to decrease in repairs with an increase in advertising and promotions and commissions resulting from aggressive marketing activities. Interest and financing charges increased by 11.4% from P=117.6 million in the three months ended March 31, 2009 to P=131.0 million in the three months ended March 31, 2010 due to the increase of the interest bearing payables of the Company. Provision for income tax decreased by 18.0% from P=192.1 million for the three months ended March 31, 2009 to P=157.6 million for the three months ended March 31, 2010 mainly due primarily to the lower taxable income for the period. There are no other material changes in the Company’s financial position (changes of 5% or more) and condition that will warrant a more detailed discussion. Further, there are no material events and uncertainties known to management that would impact or change reported financial information and condition on the Company. The Subsidiaries are contingently liable for guarantees arising in the ordinary course of business, including surety bonds, letters of guarantee for performance and bonds for all its real estate projects. The Company is contingently liable with respect to certain lawsuits and other claims which are being contested by the subsidiaries and their legal counsels. Management and their legal counsels believe that the final resolution of these claims will not have a material effect on the consolidated financial statements.

There are no known trends or demands, commitments, events or uncertainties that will result in or that are reasonably likely to result in increasing or decreasing the Company’s liquidity in any material way. The Company sourced its capital requirements through a mix of internally generated cash, sale of liquid assets like installment contracts receivables, pre-selling and joint venture undertakings. The Company does not expect any material cash requirements beyond the normal course of the business. The Company is not in default or breach of any note, loan, lease or other indebtedness or financing arrangement requiring it to make payments. There are no events that will trigger direct or contingent financial obligation that is material to the Company, including any default or acceleration of an obligation except for those items disclosed in the 1st Quarter of 2010 Financial Statements. There are no material off-balance sheet transactions, arrangements, obligation (including contingent obligations), or other relationships of the Company with unconsolidated entities or other persons created during the reporting period except those disclosed in the 1st Quarter of 2010 Financial Statements. There are no material commitments for capital expenditures, events or uncertainties that have had or that are reasonably expected to have a material impact on the continuing operations of the Company. There were no seasonal aspects that had a material effect on the financial condition or results of operations of the Company. There are no explanatory comments on the seasonality of the operations. There are no material events subsequent to the end of the fiscal period that have not been reflected in the financial statements. There are no material amounts affecting assets, liabilities, equity, net income or cash flows that are unusual in nature; neither are there changes in estimates of amounts reported in a prior period of the current financial year. COMMITMENTS AND CONTINGENCIES The Parent Company’s subsidiaries are contingently liable for guarantees arising in the ordinary course of business, including surety bonds, letters of guarantee for performance and bonds for its entire real estate project.
PART II - OTHER INFORMATION Item 3. 1st Quarter Developments A. New Projects or Investments in another line of business or corporation.
None
B. Composition of Board of Directors Marcelino C. Mendoza Chairman of the Board Benjamarie Therese N. Serrano Director, President & CEO Manuel Paolo A. Villar Director, CFO Cynthia J. Javarez Director, Controller Mark A. Villar Director Ruben O. Fruto Independent Director Marilou Adea Independent Director Gemma M. Santos Corporate Secretary
C. Performance of the corporation or result/progress of operations.
Please see unaudited Financial Statements and Management’s Discussion and Analysis.
D. Declaration of Dividends.
P0.033 per share Cash Dividend Declaration Date: November 23, 2009 Record date: December 8, 2009 Payment date: December 29, 2009 P0.064 per share Cash Dividend Declaration Date: April 2, 2008 Record date: April 17, 2008 Payment date: May 14, 2008
E. Contracts of merger, consolidation or joint venture; contract of management, licensing,
marketing, distributorship, technical assistance or similar agreements.
None F. Offering of rights, granting of Stock Options and corresponding plans thereof.
None.
G. Acquisition of additional mining claims or other capital assets or patents, formula, real estate. Not Applicable..
H. Other information, material events or happenings that may have affected or may affect
market price of security.
None. I. Transferring of assets, except in normal course of business.
None.

Item 4. Other Notes as of 1st Quarter 2010 Operations and Financials. J. Nature and amount of items affecting assets, liabilities, equity, net income, or cash flows that
are unusual because of their nature, size, or incidents.
None. K. Nature and amount of changes in estimates of amounts reported in prior periods and their
material effect in the current period. There were no changes in estimates of amounts reported in prior interim period or prior financial years that have a material effect in the current interim period.
L. New financing through loans/ issuances, repurchases and repayments of debt and equity securities.
See Notes to Financial Statements and Management Discussion and Analysis.
M. Material events subsequent to the end of the interim period that have not been reflected in
the financial statements for the interim period. None
N. The effect of changes in the composition of the issuer during the interim period including business combinations, acquisition or disposal of subsidiaries and long term investments, restructurings, and discontinuing operations.
None O. Changes in contingent liabilities or contingent assets since the last annual balance sheet date.
None P. Existence of material contingencies and other material events or transactions during the
interim period
None. Q. Events that will trigger direct or contingent financial obligation that is material to the
company, including any default or acceleration of an obligation.
None R. Material off-balance sheet transactions, arrangements, obligations (including contingent
obligations) , and other relationships of the company with unconsolidated entities or other persons created during the reporting period. None.
S. Material commitments for capital expenditures, general purpose and expected sources of
funds.
The movement of capital expenditures being contracted arose from the regular land development and housing requirements which are well within the regular cash flow budget coming from internally generated funds.

T. Known trends, events or uncertainties that have had or that are reasonably expected to have impact on sales/revenues/income from continuing operations.
As of March 31, 2010, no known trends, events or uncertainties that are reasonably expected to have impact on sales/revenues/income from continuing operations except for those being disclosed in the 1st Quarter 2010 financial statements.
U. Significant elements of income or loss that did not arise from continuing operations.
None.
V. Causes for any material change/s from period to period in one or more line items of the
financial statements.
None.
W. Seasonal aspects that had material effect on the financial condition or results of operations. None.
X. Disclosures not made under SEC Form 17-C.
None.

SIGNATURES Pursuant to the requirements of Section 17 of the SRC and Section 141 of the Corporation Code, this report is signed on behalf of the issuer by the undersigned, thereunto duly authorized. Vista Land & Lifescapes, Inc. Issuer By: CYNTHIA J. JAVAREZ Controller Date: May 14, 2010