Mathematics Coursetaking and Achievement at the …nces.ed.gov/pubs2008/2008319.pdfMathematics...
94
U.S. DEPARTMENT OF EDUCATION NCES 2008-319 Mathematics Coursetaking and Achievement at the End of High School: Evidence from the Education Longitudinal Study of 2002 (ELS:2002) Statistical Analysis Report
Transcript of Mathematics Coursetaking and Achievement at the …nces.ed.gov/pubs2008/2008319.pdfMathematics...
U.S. DEPARTMENT OF EDUCATIONNCES 2008-319
Mathematics Coursetaking and Achievement at the End of High School:Evidence from the Education Longitudinal Study of 2002 (ELS:2002)
Statistical Analysis Report

Mathematics Coursetaking and Achievement at the End of High School:Evidence from the Education Longitudinal Study of 2002 (ELS:2002)
Statistical Analysis Report
January 2008
Robert BozickSteven J. IngelsRTI International
Jeffrey A. Owings
National Center for Education Statistics
U.S. Department of EducationNCES 2008-319
U.S. Department of EducationMargaret SpellingsSecretary
Institute of Education SciencesGrover J. WhitehurstDirector
National Center for Education StatisticsMark SchneiderCommissioner
The National Center for Education Statistics (NCES) is the primary federal entity for collecting, analyzing, and reporting data related to education in the United States and other nations. It fulfills a congressional mandate to collect, collate, analyze, and report full and complete statistics on the condition of education in the United States; conduct and publish reports and specialized analyses of the meaning and significance of such statistics; assist state and local education agencies in improving their statistical systems; and review and report on education activities in foreign countries.
NCES activities are designed to address high-priority education data needs; provide consistent, reliable, complete, and accurate indicators of education status and trends; and report timely, useful, and high-quality data to the U.S. Department of Education, the Congress, the states, other education policymakers, practitioners, data users, and the general public. Unless specifically noted, all information contained herein is in the public domain.
We strive to make our products available in a variety of formats and in language that is appropriate to a variety of audiences. You, as our customer, are the best judge of our success in communicating information effectively. If you have any comments or suggestions about this or any other NCES product or report, we would like to hear from you. Please direct your comments to
National Center for Education StatisticsInstitute of Education SciencesU.S. Department of Education1990 K Street, NWWashington, DC 20006-5651
January 2008
The NCES World Wide Web Home Page is http://nces.ed.gov.The NCES World Wide Web Electronic Catalog is http://nces.ed.gov/pubsearch.
Suggested CitationBozick, R., and Ingels, S.J. (2008). Mathematics Coursetaking and Achievement at the End of High School: Evidence from the Education Longitudinal Study of 2002 (ELS:2002) (NCES 2008-319). National Center for Education Statistics, Institute of Education Sciences, U.S. Department of Education. Washington, DC.
For ordering information on this report, write to U.S. Department of Education ED Pubs P.O. Box 1398 Jessup, MD 20794-1398
or call toll free 1-877-4ED-Pubs or order online at http://www.edpubs.org.
Content ContactJeffrey A. Owings(202) [email protected]

iii
Executive Summary Recent research shows that U.S. 15-year-olds are behind their international counterparts
in problem solving and mathematics literacy, ranking 24th of 29 nations (Lemke et al. 2004). Therefore, a key concern among policy makers and educators is improving the quantitative and analytical skills of American youth, who face job prospects in an economy that increasingly values a strong foundation in mathematics and science. One policy response has been to raise mathematics coursetaking requirements for graduation. For example, between 1987 and 2004, the number of states requiring at least 2.5 credits in mathematics for graduation increased from 12 to 26 (Council of Chief State School Officers 2004). Despite the focus on overall credit requirements, less is known about particular types of courses and their relationship with learning different types of mathematics skills and concepts—a critical piece of information for those interested in preparing American students for postsecondary training and the labor market.
Using data from the Education Longitudinal Study of 2002 (ELS:2002) this report is one of the first to examine both the course sequences that students follow during the last 2 years of high school and the level of mathematics proficiency they acquire during that period. ELS:2002 is a nationally representative longitudinal study of American students who were in the 10th grade in 2002. Students, their parents, teachers, and school administrators were interviewed and mathematics assessments were administered to students in the spring of 2002. Students were reinterviewed and retested in mathematics in the spring of 2004. Their transcripts were collected in the 2004–05 school year.
In this analysis, high school transcript information and mathematics assessment scores are used to examine coursetaking patterns and learning gains across sociodemographic characteristics of students and the types of schools they attend. These coursetaking patterns are then linked with learning gains to identify the concepts and skills learned by students who follow a particular course sequence. Differences are only reported if the comparisons were statistically significant (using t statistics with an alpha criterion of .05) and met the effect size criteria (using effect sizes [standardized mean differences] that are greater than 0.20 standard deviations for continuous variables and 5 percentage points for categorical variables). Findings from regression analyses are only reported if the coefficients have a p value of .05 or less. The main findings are summarized below.
Over the last 2 years of high school, students improved their mathematics skills. At the end of their senior year, students gave an average of 51.2 correct answers (out of 81 possible correct answers) on the mathematics assessment, compared to an average of 46.7 correct answers during their sophomore year—a gain of about 5 correct answers (about a third of a standard deviation). Because most students (94 percent) entered the second half of high school with a mastery of basic mathematics skills such as simple arithmetic and operations, most of their learning during this time was in intermediate-level mathematics skills and concepts. Specifically, the percentage of students with an understanding of simple problem solving skills grew from 53 to 65 percentage points over the second half of high school. Students learned very little of the most advanced skills such as solving multistep word problems and applying analytic logic: 96 percent of the students in the sample left high school without proficiency at this advanced level. As with many educational outcomes, learning levels and learning gains were associated with the sociodemographic characteristics of students and the types of schools they attended. High

Executive Summary
iv
socioeconomic status (SES) students, students who attended Catholic or other private schools, and students who expected to earn a bachelor’s degree exhibited gains in the most advanced areas and showed levels of proficiency at the most advanced levels at the end of high school.
Next, student transcripts were examined to understand both the types of courses that students were taking and how they relate to learning mathematics. Course sequences were identified in terms of the types of courses taken during the 2002–03 and 2003–04 school years—the 2 academic years between the mathematics assessments. The most common mathematics sequences taken during this time period were algebra II–no mathematics, followed by 13 percent of students; geometry–geometry/no mathematics, followed by 8 percent of students; and algebra II–precalculus, followed by 7 percent of students. In accord with previous research on coursetaking patterns, the most advanced course sequences—precalculus–calculus and precalculus–Advanced Placement/International Baccalaureate calculus—were more likely to be followed by Asian and White students, high SES students, students who live with both parents in the family, students who attended Catholic schools, and students who expected to earn a bachelor’s degree.
While past research has shown that more advanced courses or curricular tracks are associated with aggregate gains in learning, it has not identified the specific courses related to this growth. Toward this end, this analysis links course sequences with gains in mathematics proficiencies at different levels. The findings show that the largest overall gains are made by students who take precalculus paired with another course during the last 2 years of high school. In terms of learning in specific content areas, the largest gains in intermediate skills such as simple operations and problem solving were made by those who followed the geometry–algebra II sequence. The largest gains in advanced skills such as derivations and making inferences from algebraic expressions were made by students who took precalculus paired with another course. The smallest gains were made by students who took one mathematics course or no mathematics courses during their last 2 years.
While the findings reported here corroborate other research on the topic, readers should keep in mind that without an experimental design, establishing a causal link between coursetaking and learning is not possible. Also, ELS:2002 provides only observational data: students were not randomly assigned to schools, classrooms, course sequences, or teachers. As a consequence, establishing a causal link between coursetaking and achievement is not possible. Additionally, the analysis requires test scores at two different periods of time (sophomore and senior years), thereby excluding students who had dropped out, transferred schools, or started homeschooling.
The resulting analytic sample includes a higher proportion of students who are White, a higher proportion of students who expect to receive a bachelor’s degree or higher, and a higher proportion of students living with both their father and their mother than the full sophomore panel. Thus, the findings may not generalize to all students, particularly those who are non-White, those who have educational expectations that do not include college completion, and those who are not living with their mother and father. Readers should keep these caveats in mind when interpreting the results.
v
ForewordThe Education Longitudinal Study of 2002 (ELS:2002) provides a wealth of information
from multiple sources about the factors and circumstances related to the performance and social development of the American high school student over time. This statistical analysis report uses information from student surveys, mathematics assessments, and high school transcripts to examine how mathematics achievement across the last 2 years of high school is patterned across American high school students. This analysis also provides new information on the mathematics courses that students take during their junior and senior years, and how these courses relate to their acquisition of different mathematics skills and concepts.
We hope that the information provided in this report will be useful to a wide range of readers, including policymakers and educators interested in improving the mathematics proficiency of American youth. Additionally, we hope that the results reported here will encourage other researchers to use the ELS:2002 data.
Mark Schneider Commissioner National Center for Education Statistics
Jeffrey A. Owings Associate Commissioner Elementary/Secondary & Libraries Studies

vii
AcknowledgmentsA number of people contributed to the production of this report, and many more to the
development of the Education Longitudinal Study of 2002 (ELS:2002). In particular, we wish to thank Michael Ross and John Wirt from the National Center for Education Statistics (NCES) for the quality of their input into this document. We also would like to thank Peggy Quinn of NCES for her support of this project. We are indebted to Bruce Daniel of Kforce Government Solutions who worked tirelessly to help us set up, organize, and analyze the ELS:2002 data.
Several people provided recommendations and insight that have improved the quality and clarity of this report. We would like to thank Judy Pollack of Educational Testing Service (ETS) for methodological assistance in using and interpreting the mathematics assessment scores in ELS:2002. We also would like to thank Michael Planty of NCES who provided feedback on conceptual issues during the formative stages of this project. We are particularly grateful to Matthew Adams, Sandy Eyster, Alexandra Henning, Akemi Kinukawa, Sally Ruddy, Alison Slade, Greg Strizek, Aparna Sundaram, Xiaolei Wang, and Zeyu Xu of the American Institutes for Research (AIR) for their careful review and guidance.
Lastly, we would like to thank the document preparation, editorial, and graphics support staff of RTI: Wallace Campbell, Craig Hollingsworth, Erich Lauff, Michelle Myers, Sharon Powell, and Daliah Rainone. Their hard work and attention to detail greatly improved the final version of this report.


ix
ContentsExecutive Summary..................................................................................................................... iiiForeword.........................................................................................................................................vAcknowledgments ....................................................................................................................... viiList of Tables ................................................................................................................................ xiChapter 1 Introduction..................................................................................................................1
1.1 The Correlates of Mathematics Coursetaking...................................................................2 1.2 Research Questions...........................................................................................................4
Chapter 2 Data and Methods........................................................................................................52.1 Mathematics Achievement Assessments ..........................................................................6 2.2 Student and School Characteristics...................................................................................7 2.3 Statistical Testing..............................................................................................................72.4 Limitations of the Analysis...............................................................................................8
Chapter 3 Findings ........................................................................................................................9Chapter 4 Conclusion ..................................................................................................................33References.....................................................................................................................................35Appendix A Technical Notes and Glossary ............................................................................ A-1
A.1 Design and Implementation of the Education Longitudinal Study of 2002 (ELS:2002)................................................................................................................... A-3
A.2 Overview of ELS:2002 ................................................................................................ A-3 A.3 Study Design................................................................................................................ A-5 A.4 Statistical Procedures ................................................................................................... A-9A.5 Base-Year to First Follow-up Mathematics Tests ..................................................... A-11 A.6 Bias Analysis ............................................................................................................. A-21A.7 Glossary—Description of Transcript and Survey Variables Used ............................ A-23 A.8 Appendix A References ............................................................................................. A-26
Appendix B Standard Error Tables for Estimated Means and Proportions, with Weighted Standard Deviations and Raw Sample Sizes for Means ........................B-1


xi
List of Tables Table Page
1. Average mathematics IRT-estimated number-right scores, by selected student characteristics: 2002 and 2004.....................................................................................11
2. Average mathematics proficiency probability scores, by selected student characteristics: 2002 and 2004.....................................................................................12
3. Weighted percentage and unweighted frequency of students taking mathematics course sequences: 2002 and 2004...........................................................16
4. Percentage of students taking mathematics course sequences, by selected student characteristics: 2002 and 2004 ........................................................................18
5. Average mathematics IRT-estimated number-right scores, by mathematics course sequences: 2002 and 2004................................................................................21
6. Average mathematics proficiency probability scores, by mathematics course sequences: 2002 and 2004 ...........................................................................................23
7. Mathematics course sequences associated with the two largest gains in mathematics learning, by proficiency level: 2002 and 2004 .......................................24
8. Coefficients from an ordinary least squares (OLS) regression of 12th-grade IRT mathematics scores, by characteristic: 2002 and 2004.........................................26
9. Coefficients from an ordinary least squares (OLS) regression of 12th-grade proficiency probability mathematics scores, by characteristic: 2002 and 2004 ..........30
Appendix A Tables A-1. Unweighted base-year school sampling and eligibility, and unweighted and
weighted participation, by sampling stratum: 2004.................................................. A-7 A-2. Summary of ELS:2002 base-year response rates, by instrument: 2002 ................... A-8 A-3. Summary of ELS:2002 first follow-up response rates, by instrument: 2004 ........... A-8 A-4. Transcript component coverage rates: Percentage of base-year students with a
complete transcript, by selected characteristics (weighted): 2002 and 2004............ A-8 A-5. Number and percentage of unique mathematics items in ELS:2002 Base Year,
by content area: 2002.............................................................................................. A-13 A-6. Number and percentage of unique mathematics items in ELS:2002 first
follow-up, by content area: 2004 ............................................................................ A-13 A-7. Number and percentage of unique mathematics items per skill/cognitive
process area in ELS:2002 base year, by process/skill specifications: 2002 ........... A-13 A-8. Number and percentage of unique mathematics items per skill/cognitive
process area in ELS:2002 first follow-up, by process/skill specifications: 2004 ... A-13
List of Tables
xii
A-9. Number of items in each ELS:2002 base-year and first follow-up tests for assessing achievement in mathematics, by form: 2002 and 2004 .......................... A-14
A-10. Number of mathematics items per content area, by cognitive skill/process, and form: ELS:2002 base year through first follow-up: 2002 and 2004....................... A-15
A-11. Percentage distribution of ELS:2002 test items, by content area and mathematics test form: 2002................................................................................... A-16
A-12. IRT-estimated number-right scores and proficiency probability scores: 2002 and 2004.................................................................................................................. A-18
A-13. Results of bias analysis: sophomore panel members, analytic sample members, and analytic sample members with a designated mathematics course sequence, by student characteristics (weighted): 2002 and 2004 ........................... A-22
Appendix B Tables B-1a. Standard errors for table 1 estimates (average mathematics IRT-estimated
number-right scores, by selected student characteristics: 2002 and 2004)................B-3 B-1b. Sample size and standard deviations for table 1 estimates (average
mathematics IRT-estimated number-right scores, by selected student characteristics: 2002 and 2004) .................................................................................B-4
B-2a. Standard errors for table 2 estimates (average mathematics proficiency probability scores, by selected student characteristics: 2002 and 2004) ...................B-5
B-2b. Sample sizes and standard deviations for table 2 estimates (average mathematics proficiency probability scores, by selected student characteristics: 2002 and 2004) .................................................................................B-6
B-3. Standard errors for table 3 estimates (weighted percentage and unweighted frequency of students taking mathematics course sequences: 2002 and 2004) .........B-7
B-4. Standard errors for table 4 estimates (percentage of students taking mathematics course sequences, by selected student characteristics: 2002 and 2004). .........................................................................................................................B-8
B-5a. Standard errors for table 5 estimates (average mathematics IRT-estimated number-right scores, by mathematics course sequences: 2002 and 2004) ..............B-10
B-5b. Sample sizes and standard deviations for table 5 estimates (average mathematics IRT-estimated number-right scores, by mathematics course sequences: 2002 and 2004) ......................................................................................B-10
B-6a. Standard errors for table 6 estimates (average mathematics proficiency probability scores, by mathematics course sequences: 2002 and 2004)..................B-11
B-6b. Sample sizes and standard deviations for table 6 estimates (average mathematics proficiency probability scores, by mathematics course sequences: 2002 and 2004) ........................................................................................................B-12
1
Chapter 1 Introduction
A major focus of education policy in the United States is improving both the quality and rigor of core courses taught in schools and ensuring that all students have access to these courses. Mathematics in particular has received extensive attention, both because of its importance in an increasingly technical and global economy and because of the performance of American youth when compared with their international peers. Recent research shows that U.S. 15-year-olds continue to lag behind their international peers in mathematics—ranking 24th of 29 nations in problem solving and mathematics literacy on the 2003 Program for International Student Assessment (Lemke et al. 2004). As a means to improve proficiency in this area, many states have increased their course requirements for graduation. For example, between 1987 and 2004, the number of states requiring at least 2.5 credits in mathematics for graduation increased from 12 to 26 (Council of Chief State School Officers 2004). Accordingly, contemporary students are receiving more mathematics training than their predecessors. In 2004, high school seniors left high school with an average of 3.6 credits in mathematics, up from 2.7 in 1982 (Dalton et al. 2007). Further, contemporary students are more likely to take advanced mathematics courses. For example, 6 percent of high school seniors were taking calculus in 1982. By 2004, 14 percent of high school seniors were doing so (Dalton et al. 2007).
If students are enrolling in more mathematics courses and more high-level courses, are they necessarily developing an advanced comprehension of mathematics? The existing research indicates that mathematics achievement is associated with advanced mathematics coursetaking (Leow et al. 2004; Rock, Owings, and Lee 1994; Rock and Pollack 1995a; Scott et al. 1995; Wang and Goldschmidt 2003). However, the bulk of existing research on the topic is limited in two respects: first, possibly dissimilar courses are placed into broad categories for analytic convenience; and second, the scores used to assess achievement growth preclude the identification of specific concepts and skills students are developing and/or lacking. The implications these methodological setbacks have for understanding the relationship between curricular structures and learning are discussed in turn.
First, most studies bundle courses into broad categories to make comparisons.1 Two common methods used to assess achievement growth for those in different curricular tracks, such as an honors track, a general track, or a vocational track (Carbonaro 2005; Hallinan 1994) or to assess achievement growth for those reaching different levels of mathematics, such as calculus, algebra II, or geometry (Lee et al. 1998; Rock, Owings, and Lee 1994; Rock and Pollack 1995a; Scott et al. 1995). For example, Rock and Pollack’s (1995b) analysis of the National Education Longitudinal Study of 1988 (NELS:88) found that those whose highest mathematics course was calculus gained 5.61 points between the 10th and 12th grade on the mathematics assessment. What is obscured here are the other mathematics courses the student had taken prior to calculus. While mathematics is largely hierarchical and sequential, some students may have taken precalculus prior to calculus, others may have jumped directly into calculus from algebra II, and others may have taken another advanced course (e.g., statistics, trigonometry). These different
1 This classification approach is useful in documenting aggregate trends in coursetaking, as is in done in Dalton et al. (2007). However, it is less useful in assessing the relationship between coursetaking and achievement gains, the focus of this study.
Chapter 1. Introduction
2
pathways may provide students with different foundational skills for learning more advanced concepts. As a consequence, the gains attributed to the highest course—in this instance, calculus—may be under- or overstated.
Second, most use an aggregate measure of mathematics achievement and consequently, overlook the content of the learning involved. For example, Rock and Pollack’s finding that students who reach calculus gain 5.61 points on the NELS:88 mathematics assessment reveals little about the content of that learning. That is, are students who take calculus developing fluency in operations with real numbers, vectors, and matrices, or are they augmenting their base understanding of algebra and geometry? As most research relies on aggregated outcomes—for example, standardized composite scores or the number of correct answers on an assessment—the depth and breadth of learning and its relationship to curricular pathways is unclear. There may be differential advantages and disadvantages associated with taking a certain set of courses, and/or differential gains in learning certain mathematics skills and concepts. In most of the research, these contingencies are obscured.
This study, which uses data from the Education Longitudinal Study of 2002 (ELS:2002), improves upon past research by using information from high school transcripts to identify the exact course sequences students take and links them with achievement test scores that have been scaled to indicate different levels of mathematics proficiency. This linkage provides a more detailed understanding of the curricular pathways students travel and the types of proficiencies they acquire along the way. This chapter provides a brief background description of the pattern of mathematics coursetaking in the United States and lists the research questions. Chapter 2 describes the ELS:2002 data and the measures used in the analysis. Chapter 3 provides the results of the analysis. Chapter 4 concludes with a discussion of the findings and their limitations.
1.1 The Correlates of Mathematics Coursetaking Courses are the building blocks of schooling and the larger system of education. Linked
together across school years, courses teach students knowledge and skills unique to a particular subject area and how concepts relate to other areas of the curriculum. While courses, particularly in mathematics, are the primary means through which students learn advanced subject material, not all students take the same courses and/or course sequences.
As with many indicators of educational success, coursetaking in the United States has differed with socioeconomic status. In broad terms, students from more affluent backgrounds—families with high incomes and more highly educated parents—tend to take more advanced courses than their peers (Lee et al. 1998; Stevenson, Schiller, and Schneider 1994). For example, using transcript data in NELS:88, Hoffer, Rasinski, and Moore (1995) found that students from the highest socioeconomic quartile earned an average of 3.5 Carnegie units in mathematics during high school.2 In contrast, those in the lowest socioeconomic quartile earned an average of 2.1 Carnegie units in mathematics during high school. Other analyses of NELS:88 have revealed that students from wealthy families and students with college-educated parents are most likely to enroll in an advanced mathematics course like calculus or trigonometry (Schneider, Swanson, and Riegle-Crumb 1998). Though these studies do not identify the specific mechanism linking
2 A Carnegie unit is a standard of measurement used for secondary education that represents the completion of a course that meets one period per day for 1 year.

Chapter 1. Introduction
3
socioeconomic status with coursework, they provide firm evidence that, on average, affluence and higher parental education translate into a curricular advantage in high school mathematics.
In addition to differences according to socioeconomic status, racial/ethnic and sex differences in education are well documented. With respect to race/ethnicity, Hispanic and Black students on average tend to lag behind their White and Asian peers in school (Kao and Thompson 2003). These broad patterns are evident in the mathematics coursetaking patterns of high school students. For example, a recent analysis of ELS:2002, the data used in this paper, showed that 87 percent of Asian and 79 percent of White high school seniors reached algebra II in high school, compared to 75 percent of Black and 67 percent of Hispanic high school seniors (Dalton et al. 2007). These disparities in coursetaking have implications for learning—a substantial portion of racial/ethnic differences in student achievement has been linked to differences in coursetaking patterns. For example, differences between Black and White students on standardized tests are minimized when comparing students who have taken advanced courses at comparable rates (Berends, Lucas, and Briggs 2002; Gamoran 1987).
While the largest differences in coursetaking are along socioeconomic and racial/ethnic lines, sex differences in mathematics are also apparent. Historically, girls have trailed behind boys in mathematics coursetaking (U.S. Department of Education 1997), and some researchers maintain that this difference explains sex differences in academic achievement among elementary and high school-aged boys and girls (Oakes 1990; Pallas and Alexander 1983). However, there is evidence that the sex gap has been closing in recent years: recent research shows that rates of mathematics coursetaking and mathematics achievement performance among high school aged boys and girls is reaching parity (Dalton et al. 2007; Perkins et al. 2004). As young women make strides in this traditionally male dominated subject area, assessing how the distribution of learning opportunities varies between the sexes is currently of interest.
Though sociodemographic characteristics have been shown to be associated with coursetaking patterns and curricular experiences, different school structures affect this relationship. Most schools in the United States follow the comprehensive high school model, wherein the curriculum remains flexible and diversified to accommodate the needs of a wide range of students with different interests, skills, and aptitudes (Oakes 1985). Not all schools follow this model. Catholic high schools, for example, tend to adhere to a constrained curriculum, offering higher level academic courses, such as intermediate and advanced mathematics, to all their students (Lee et al. 1998). Additionally, when compared with their public school peers, students who enroll in Catholic schools tend to have families who are better educated and more involved in their children’s education (Coleman and Hoffer 1987; Morgan and Sorenson 1999).
Taken together, these research findings show that both background characteristics of students and the types of schools they attend are associated with their curricular experiences. Accordingly, the present analysis will explore how mathematics course sequences are distributed along these dimensions in contemporary American high schools.
Chapter 1. Introduction
4
1.2 Research Questions This study addresses the following questions:
• How much does mathematics achievement change during the last 2 years of high school and are these changes related to student background and school characteristics?
• What are the most common mathematics course sequences taken by students in the 11th and 12th grades and are these sequences related to student background and school characteristics?
• What mathematics course sequences are associated most closely with mathematics achievement?
The first question will examine learning gains in mathematics over the latter half of high school. Changes in both the level of mathematics achievement (as measured by IRT-estimated number-right scores) and the type of mathematics knowledge (as measured by proficiency probability scores) will be examined. Exploring this research question reveals whether students have improved their overall mastery of mathematics skills and identifies the content areas in which students are making (or not making) gains. Additionally, the variation of learning gains among students from different backgrounds enrolled in different kinds of schools will be assessed. This will update previous research on sociodemographic and school sector differences in achievement using a recent cohort of high school students. The second question will identify the number and types of mathematics courses most frequently taken by high school juniors and seniors and will link these course patterns with sociodemographic characteristics of students and their schools. The final question will address which course sequences are associated with the largest gains in mathematics achievement and which are associated with the smallest gains in mathematics achievement between the 10th and 12th grade, apart from student background and school characteristics.

5
Chapter 2 Data and Methods
This analysis uses data from the Education Longitudinal Study of 2002 (ELS:2002), which was designed to provide trend data about critical transitions experienced by students as they proceed through high school and into young adulthood.3 This nationally representative study of 17,590 students who were 10th-graders in 2002 was conducted by the National Center for Education Statistics (NCES).4 ELS:2002 used a two-stage sampling procedure. In the first stage, a sample of 750 high schools, both public and private, were selected with probabilities proportional to their size. In the second stage, approximately 26 students were randomly sampled from each school on the condition that they were in the 10th grade in the spring term. Of the 17,590 eligible students, 15,360 completed a survey about their school and home experiences (87 percent weighted response rate), of which 14,540 completed cognitive assessments in mathematics and reading (95 percent, weighted response rate). Their parents, teachers, principals, and librarians were surveyed as well. In the spring of 2004, about 14,710 of the originally selected sample members were reinterviewed and comprise the target population for this study: sophomores in the spring of 2002 who were respondents in both the base-year (BY) and first follow-up (F1) interviews. Their high school transcripts were collected in 2004–05 and they were reinterviewed in the spring of 2006 (2 years post on-time high school graduation).5
To be included in this analysis, sample members had to have been an in-school sophomore in 2001–02, participated in both the BY and F1 interviews, completed the mathematics assessment in the BY and F1 interviews, and had complete transcript information for the 2002–03 and 2003–04 academic years. Of the 14,710 base-year sophomores who participated in both the BY and F1 interviews, 13,330 participated in the BY mathematics assessment, of whom 9,920 participated in the F1 mathematics assessment.6 Only students who remained in their base-year schools were administered the F1 mathematics assessment. Scores were imputed for students who transferred to a new school or were still enrolled in their base-year school but were unable to participate during the in-school test administration. However, because mathematics achievement is the key variable in this analysis, these cases with imputed test scores were excluded to prevent any error in estimating learning and learning gains. Lastly, 330 cases were excluded because they had no transcript information and 130 cases were excluded because they lacked evidence of both a mathematics course and complete transcript
3 The study design and data collection was undertaken by RTI International. 4 The sample sizes are approximate because restricted-use data are used. In accordance with NCES Statistical Standards (Seastrom 2003), exact sample sizes from restricted-use data files cannot be published unless the data are perturbed in some way. The perturbation approach taken here was to round the exact sample sizes of cells to 10s or 100s. 5 More information on the design and collection procedures of ELS:2002 can be found in appendix A and in the Education Longitudinal Study of 2002: Base-Year to First Follow-up Data File Documentation (Ingels et al. 2005). 6 Scores were missing for sample members in the F1 interview because they had dropped out, transferred schools, or started homeschooling. RTI only tested students who were enrolled in their BY school in the spring of 2004. For this analysis, examining students who were continuously exposed to only one curriculum and school environment, however, provides a clearer portrait of the relationship between coursework and learning.
Chapter 2. Data and Methods
6
information for both the 2002–03 and 2003–04 years.7 The final analytic sample includes 9,460 respondents, or about 64 percent of the approximately 14,710 members of the sophomore cohort who participated in both the base-year and first follow-up interviews. A bias analysis comparing the sociodemographic composition of the analytic sample (n = 9,460) with the full sophomore panel sample (n = 14,710) is presented in section A.6 of appendix A. Compared with the full sophomore panel sample, there are higher proportions of White students, students who expect a bachelor’s degree or higher, and students living with both their father and their mother in the analytic sample. All estimates are weighted with the panel weight (F1PNLWT) and generalize (with the above qualifications about inclusion conditions) to the population of students who were sophomores in the spring of 2002. In all analyses, standard errors were adjusted for the clustered and stratified sampling design using Taylor-series linearization methods (StataCorp 2004).
2.1 Mathematics Achievement Assessments Assessments in mathematics were administered to students in their schools during the BY
and F1 survey administrations. There were multiple forms of the test. In the BY, assignment of form was based on a routing test, and in the F1, on the BY ability estimate. These tests, designed and scored using Item Response Theory (IRT), serve as “bookends” to learning that took place during the 2002–03 and the 2003–04 academic years—that is, approximately the end of sophomore year to approximately the end of senior year for on-time students.8 The BY assessment can be thought of as a pretest, or baseline, to academic experiences that take place during the second half of high school, while the F1 assessment can be thought of as a posttest. IRT uses patterns of correct, incorrect, and omitted answers to obtain achievement estimates that are comparable across different test forms within a domain.9 In estimating a student’s achievement, IRT also accounts for each test question’s difficulty, discriminating ability, and a guessing factor. For this analysis, two measures of mathematics achievement based on their performance on this test are used: IRT-estimated number-right scores and proficiency probability scores.
The IRT-estimated number-right score is an overall measure of mathematical knowledge and skill. The IRT-estimated number-right score used in this analysis is an IRT-based estimate of the number of items an examinee would have answered correctly if he or she had taken all of the items in the item pool on the multiform assessment administered to 10th-graders in ELS:2002’s predecessor study, the National Education Longitudinal Study of 1988 (NELS:88). Using common item calibration techniques for linking scales, results between NELS:88 and ELS:2002 are comparable.10 There were 81 items in the vertically scaled 10th- to 12th-grade ELS:2002 item pool. For the analytic sample used in this study, students answered an average of 47 questions correctly on the 10th-grade assessment and 51 questions correctly on the 12th-grade assessment.
7 Complete transcript information is defined in this analysis as having a transcript showing enrollment in any four courses in both the 2002–03 and 2003–04 school years. However, if the transcript did not have four courses in one school year but had information on mathematics courses, they were included in the analysis. 8 Less than 1 percent of students included in the analysis were not in the 12th grade at the time of the F1 survey administration (n = 60), likely due to grade retention. As this time span captures the academic experiences in the junior and senior years for almost the entire sample (99 percent), the phrases “junior and senior year of high school,” “latter half of high school” and “2002–03 and 2003–04 academic years” will be used interchangeably in this report. 9 For an account of IRT, see Embretson and Reise (2000) or Hambleton, Swaminathan, and Rogers (1991). 10 Development of the 1992 NELS:88 mathematics scale is documented in Rock and Pollack (1995b). The linkage of the NELS:88 scale to ELS:2002 through IRT methods is documented in Ingels et al. (2005, p. 39).
Chapter 2. Data and Methods
7
A proficiency probability score is a criterion-referenced score measuring how well an examinee performs relative to some set criterion representing mastery of knowledge and skills assessed. There are five distinct scores corresponding to five hierarchical levels (level 1 through level 5). Mastery of a higher level typically implies proficiency at lower levels. In contrast to the IRT-estimated number-right scores, which indicate overall achievement, the proficiency probability scores indicate what knowledge and skills the student does or does not possess. The five ordinal levels of mathematics proficiency include:
1. simple arithmetical operations on whole numbers, such as simple arithmetic expressions involving multiplication or division of integers;
2. simple operations with decimals, fractions, powers, and roots, such as comparing expressions, given information about exponents;
3. simple problem solving, requiring the understanding of low-level mathematical concepts, such as simplifying an algebraic expression or comparing the length of line segments illustrated in a diagram;
4. understanding of intermediate-level mathematical concepts and/or multistep solutions to word problems such as drawing an inference based on an algebraic expression or inequality; and
5. complex multistep word problems and/or advanced mathematics material such as a two-step problem requiring evaluation of functions.
The proficiency probability score at each level ranges from 0 to 1 and indicates the likelihood that a student has mastered the skills and knowledge described above (0 = no mastery, 1 = compete mastery). The mean of a proficiency probability score aggregated over a subgroup of students is analogous to an estimate of the percentage of students in the subgroup who have displayed mastery of the particular skill.11 For example, in this study, the analytic sample has a mean score of .73 for level 2 in the 10th grade. This can be interpreted as “73 percent of 10th-graders have mastered the skills and concepts of level 2.” The proficiency probabilities were computed using IRT-estimated item parameters originally calibrated in NELS:88. Appendix A provides more detailed information about the assessment framework, the distribution of the item pool across its elements, and the scaling techniques for the different scores. For the purposes of presentation and discussion, throughout this report, level 1 is considered basic skills, levels 2 and 3 are considered intermediate skills, and levels 4 and 5 are considered advanced skills.
2.2 Student and School Characteristics This analysis uses the following student background characteristics: sex, race/ethnicity,
socioeconomic status, family composition, school sector, and student’s educational expectations. Descriptions of these measures are provided in appendix A.
2.3 Statistical Testing Bivariate comparisons drawn in the text of this report have been tested for statistical
significance at the .05 level using t statistics to ensure that the differences are larger than those
11 Although probabilities of proficiency have been placed on a 0–1 scale, when aggregated they can be interpreted as a proportion. On the interpretation of a probability as a proportion, see Fleiss, Levin, and Paik (2003, p. 1).
Chapter 2. Data and Methods
8
that might be expected due to sampling variation. In analyses using a large sample, such as the one used in this report, standard errors accompanying estimates are often small and thus small differences between groups are often found to be statistically significant. Since tests of statistical significance reveal whether a relationship between variables is statistically reliable—but tell us little about the strength of the relationship—strength-of-effect measures were obtained to accompany all statistical tests and used as a second criterion to determine whether a result could be reported.
One measure of strength of effect is the effect size. Effect size is the estimated difference between the mean of population A and the mean of population B divided by the pooled standard deviation. The effect size indicates the magnitude of the estimated difference in terms of the number of standard deviations separating the means of the two groups. A standard deviation is the statistical measure of the extent to which values are spread around the mean. The reporting criterion applied to differences in means was an effect size (Cohen’s d) of 0.2, or one-fifth of a standard deviation (Cohen 1988). When evaluating effect sizes, the proficiency probability scores, like the IRT-estimated number-right scores, have been treated as means, and are subject to the 0.2 standard deviation criterion. Tables in this report, however, supply estimated proportions as well as means. Therefore for comparisons involving percentage differences between subgroups a strength-of-effect criterion was also set: the criterion for percentages was set at a minimum of 5 percentage points difference.
2.4 Limitations of the Analysis There are a number of limitations to this analysis that readers should keep in mind when
evaluating the findings reported in the next chapter. First, since ELS:2002 provides observational data, where students were not randomly assigned to schools, classrooms, or teachers, establishing a causal link between coursetaking and learning is not possible. Additionally, the analysis requires test scores at two different periods of time (sophomore and senior years), thereby excluding students who had dropped out, transferred schools, or started homeschooling. The resulting analytic sample includes a higher proportion of students who are White, a higher proportion of students who expect to receive a bachelor’s degree or higher, and a higher proportion of students living with both their father and their mother than the full ELS:2002 sophomore panel. Thus, the findings may not generalize to all students, particularly those who are non-White, those who have educational expectations that do not include college completion, and those who are not living with their mother and father.
9
Chapter 3 Findings
As noted earlier, this report addresses three principal research questions. The first of these was:
How much does mathematics achievement change during the last 2 years of high school and are these changes related to student background and school characteristics?
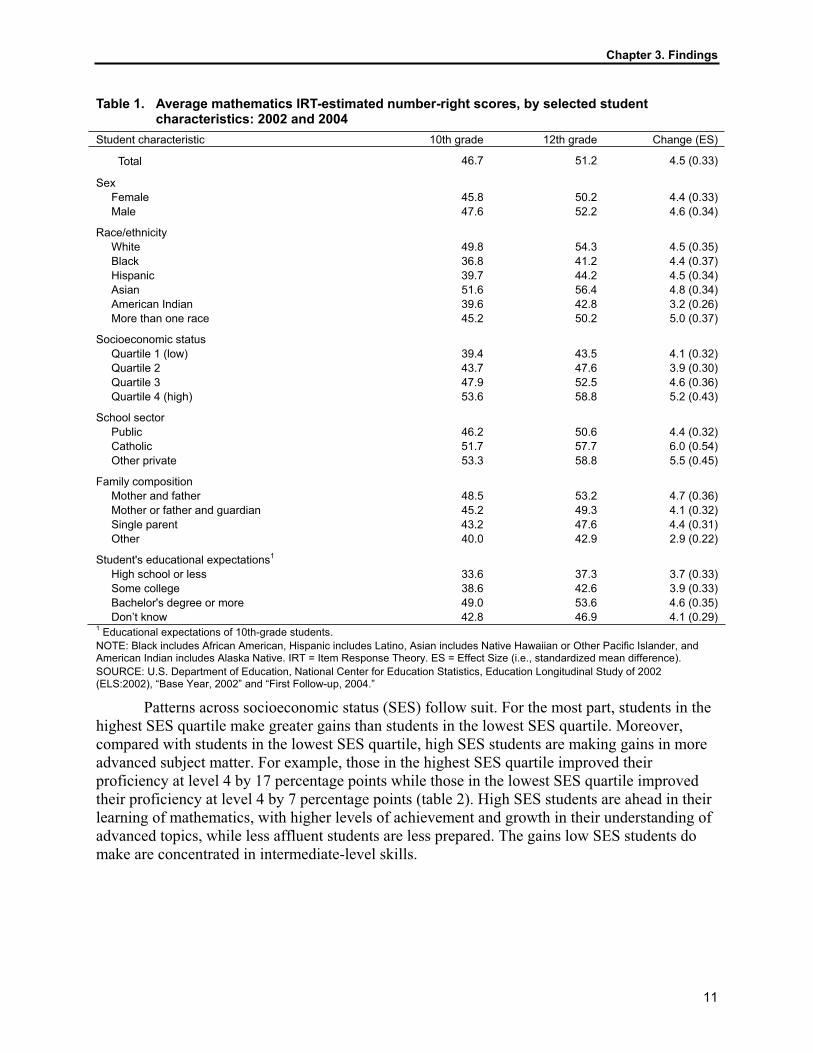
Table 1 shows the IRT-estimated number-right scores in 10th and 12th grade and changes in those scores by student background and school characteristics, and the effect sizes associated with the changes. Table 2 shows the proficiency probability in the 10th and 12th grade, changes in those scores by student background and school characteristics, and the effect sizes associated with the changes. Standard deviations corresponding to the effect sizes are shown in table B-1b and in table B-2b.
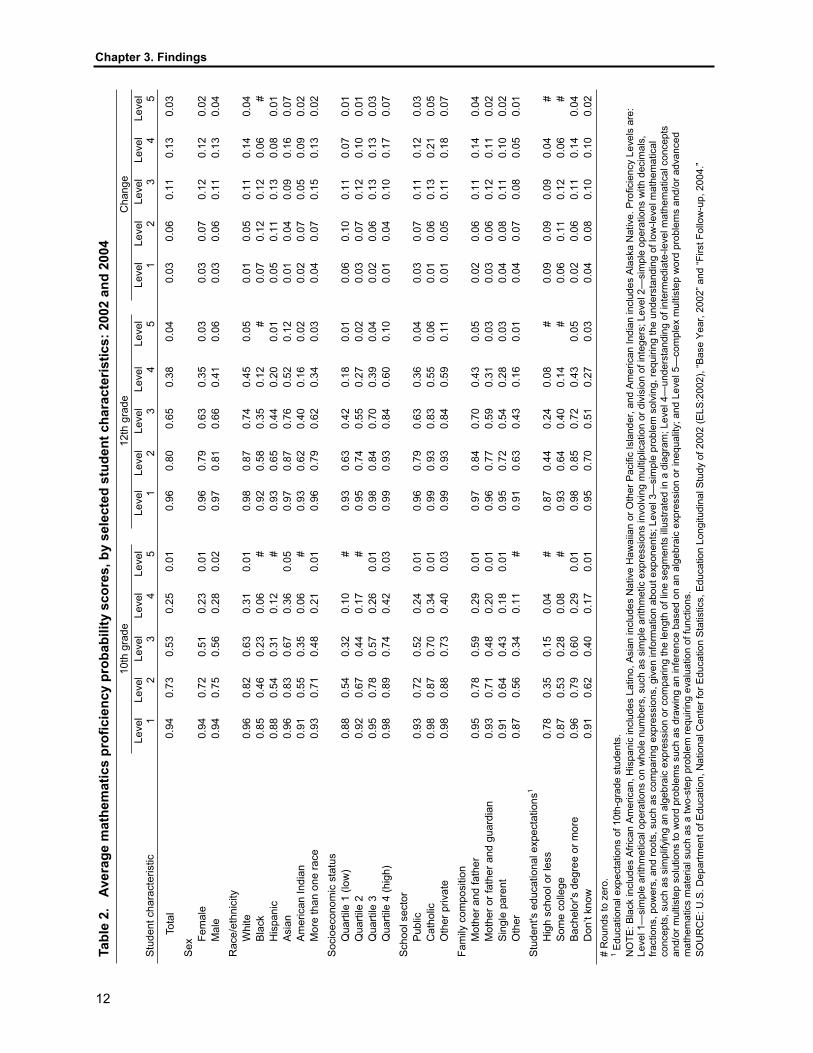
On average, students improved their performance on the mathematics assessment by about five correctly answered questions—about a third of a standard deviation (e.g., an effect size of 0.33). Additionally, all subgroups yield gains (table 1). Students in the Catholic sector made the largest gain: the effect size associated with their learning gain is a little more than half a standard deviation (0.54). The proficiency scores augment this information by detailing the levels of skills that were learned. The averages at the top of table 2 indicate that the smallest gains were made at the lowest and highest levels while the largest gains took place at levels 3 and 4. In 10th grade, 53 percent of students were proficient at level 3 and 25 percent were proficient at level 4. By the end of 12th grade, 65 percent and 38 percent were proficient at level 3 and level 4, respectively. At the highest level, gains across the second half of high school were smaller than those made in levels 2, 3, and 4. By the end of senior year, only about 4 percent of seniors had mastered the skills to be considered proficient at level 5.12
Before entering the last 2 years of high school, there are no detectable differences between boys and girls in either their number-right scores or in their level of mastery at all five proficiency levels. As measured by both gains in the number-right scores and increases in proficiency levels, on average, there are no detectable differences between girls and boys in their rate of learning across the final 2 years of high school. Additionally, upon leaving high school, there are no detectable differences between boys and girls in their number-right score nor in the level of mastery at all five levels of proficiency. These findings corroborate other contemporary research that finds increasing parity in mathematics achievement (for information on trends, see Bae et al. 2000 and Cahalan et al. 2006; for a review of the scientific evidence of gender differences in mathematics learning, see Halpern et al. 2007.
12 At the time of the F1 interview, 720 sample members who had participated in the BY interview were dropouts. These sample members are excluded from the analysis because they lack a F1 test score and thus cannot contribute to an analysis of learning gains. In accord with research in the dropout literature, these dropouts fared worse on the base-year mathematics assessment than their peers who were enrolled at the time of both the BY and F1 interviews. In the spring of 2002, these dropouts had a number-right score of 32.6. Their proficiency probability scores for the five levels were 80.7 (level 1), 37.9 (level 2), 17.1 (level 3), 4.4 (level 4), and 0.1 (level 5).
Chapter 3. Findings
10
With respect to race/ethnicity, differences noted in other national studies of achievement—for example, Hoffer, Rasinski, and Moore’s (1995) analysis of the National Education Longitudinal Study of 1988 (NELS:88)—were detected here as well. Compared with their Black and Hispanic counterparts, Asian and White students had higher number-right scores at both time points. However, there were no differences detected among racial/ethnic groups in their number-right score gains across the second half of high school. In addition to overall aggregate differences, there are disparities in the content of their learning. Asian and White students entered the second of half of high school having mastered basic mathematics skills and concepts—for example, 83 percent of Asians and 82 percent of Whites were proficient in level 2 at the end of sophomore year (table 2). Black and Hispanic students, on the other hand, entered the second half of high school with a less solid foundation in mathematics: 46 percent of Black students and 54 percent of Hispanic students were proficient at level 2 at the end of their sophomore year. Given this disadvantage, Black and Hispanic students may be less likely than their Asian and White peers to acquire the most advanced mathematics skills before graduation. Indeed, the evidence from ELS:2002 suggests this is the case: when leaving high school, 52 percent of Asian students and 45 percent of White students are proficient at level 4, compared to 20 percent of Hispanic students and 12 percent of Black students.
Chapter 3. Findings
11
Table 1. Average mathematics IRT-estimated number-right scores, by selected student characteristics: 2002 and 2004
Student characteristic 10th grade 12th grade Change (ES)
Total 46.7 51.2 4.5 (0.33)
Sex Female 45.8 50.2 4.4 (0.33) Male 47.6 52.2 4.6 (0.34)
Race/ethnicity White 49.8 54.3 4.5 (0.35) Black 36.8 41.2 4.4 (0.37) Hispanic 39.7 44.2 4.5 (0.34) Asian 51.6 56.4 4.8 (0.34) American Indian 39.6 42.8 3.2 (0.26) More than one race 45.2 50.2 5.0 (0.37)
Socioeconomic status Quartile 1 (low) 39.4 43.5 4.1 (0.32) Quartile 2 43.7 47.6 3.9 (0.30) Quartile 3 47.9 52.5 4.6 (0.36) Quartile 4 (high) 53.6 58.8 5.2 (0.43)
School sector Public 46.2 50.6 4.4 (0.32) Catholic 51.7 57.7 6.0 (0.54) Other private 53.3 58.8 5.5 (0.45)
Family composition Mother and father 48.5 53.2 4.7 (0.36) Mother or father and guardian 45.2 49.3 4.1 (0.32) Single parent 43.2 47.6 4.4 (0.31) Other 40.0 42.9 2.9 (0.22)
Student's educational expectations1 High school or less 33.6 37.3 3.7 (0.33) Some college 38.6 42.6 3.9 (0.33) Bachelor's degree or more 49.0 53.6 4.6 (0.35) Don’t know 42.8 46.9 4.1 (0.29)
1 Educational expectations of 10th-grade students. NOTE: Black includes African American, Hispanic includes Latino, Asian includes Native Hawaiian or Other Pacific Islander, and American Indian includes Alaska Native. IRT = Item Response Theory. ES = Effect Size (i.e., standardized mean difference). SOURCE: U.S. Department of Education, National Center for Education Statistics, Education Longitudinal Study of 2002 (ELS:2002), “Base Year, 2002” and “First Follow-up, 2004.”
Patterns across socioeconomic status (SES) follow suit. For the most part, students in the highest SES quartile make greater gains than students in the lowest SES quartile. Moreover, compared with students in the lowest SES quartile, high SES students are making gains in more advanced subject matter. For example, those in the highest SES quartile improved their proficiency at level 4 by 17 percentage points while those in the lowest SES quartile improved their proficiency at level 4 by 7 percentage points (table 2). High SES students are ahead in their learning of mathematics, with higher levels of achievement and growth in their understanding of advanced topics, while less affluent students are less prepared. The gains low SES students do make are concentrated in intermediate-level skills.
Chapter 3. Findings
12
Tabl
e 2.
Av
erag
e m
athe
mat
ics
prof
icie
ncy
prob
abili
ty s
core
s, b
y se
lect
ed s
tude
nt c
hara
cter
istic
s: 2
002
and
2004
10
th g
rade
12
th g
rade
C
hang
e
Stu
dent
cha
ract
eris
tic
Leve
l 1Le
vel 2
Leve
l 3Le
vel 4
Leve
l 5Le
vel 1
Leve
l 2Le
vel 3
Leve
l 4Le
vel 5
Leve
l 1Le
vel 2
Leve
l 3Le
vel 4
Leve
l 5
Tota
l 0.
94
0.73
0.
53
0.25
0.
01
0.
96
0.80
0.
65
0.38
0.
04
0.
03
0.06
0.
11
0.13
0.
03
Sex
Fem
ale
0.94
0.
72
0.51
0.
23
0.01
0.96
0.
79
0.63
0.
35
0.03
0.03
0.
07
0.12
0.
12
0.02
M
ale
0.94
0.
75
0.56
0.
28
0.02
0.97
0.
81
0.66
0.
41
0.06
0.03
0.
06
0.11
0.
13
0.04
R
ace/
ethn
icity
Whi
te
0.96
0.
82
0.63
0.
31
0.01
0.98
0.
87
0.74
0.
45
0.05
0.01
0.
05
0.11
0.
14
0.04
B
lack
0.
85
0.46
0.
23
0.06
#
0.
92
0.58
0.
35
0.12
#
0.
07
0.12
0.
12
0.06
#
His
pani
c 0.
88
0.54
0.
31
0.12
#
0.
93
0.65
0.
44
0.20
0.
01
0.
05
0.11
0.
13
0.08
0.
01
Asi
an
0.96
0.
83
0.67
0.
36
0.05
0.97
0.
87
0.76
0.
52
0.12
0.01
0.
04
0.09
0.
16
0.07
A
mer
ican
Indi
an
0.91
0.
55
0.35
0.
06
#
0.93
0.
62
0.40
0.
16
0.02
0.02
0.
07
0.05
0.
09
0.02
M
ore
than
one
race
0.
93
0.71
0.
48
0.21
0.
01
0.
96
0.79
0.
62
0.34
0.
03
0.
04
0.07
0.
15
0.13
0.
02
Soc
ioec
onom
ic s
tatu
s
Qua
rtile
1 (l
ow)
0.88
0.
54
0.32
0.
10
#
0.93
0.
63
0.42
0.
18
0.01
0.06
0.
10
0.11
0.
07
0.01
Q
uarti
le 2
0.
92
0.67
0.
44
0.17
#
0.
95
0.74
0.
55
0.27
0.
02
0.
03
0.07
0.
12
0.10
0.
01
Qua
rtile
3
0.95
0.
78
0.57
0.
26
0.01
0.98
0.
84
0.70
0.
39
0.04
0.02
0.
06
0.13
0.
13
0.03
Q
uarti
le 4
(hig
h)
0.98
0.
89
0.74
0.
42
0.03
0.99
0.
93
0.84
0.
60
0.10
0.01
0.
04
0.10
0.
17
0.07
S
choo
l sec
tor
P
ublic
0.
93
0.72
0.
52
0.24
0.
01
0.
96
0.79
0.
63
0.36
0.
04
0.
03
0.07
0.
11
0.12
0.
03
Cat
holic
0.
98
0.87
0.
70
0.34
0.
01
0.
99
0.93
0.
83
0.55
0.
06
0.
01
0.06
0.
13
0.21
0.
05
Oth
er p
rivat
e
0.98
0.
88
0.73
0.
40
0.03
0.99
0.
93
0.84
0.
59
0.11
0.01
0.
05
0.11
0.
18
0.07
Fa
mily
com
posi
tion
M
othe
r and
fath
er
0.95
0.
78
0.59
0.
29
0.01
0.97
0.
84
0.70
0.
43
0.05
0.02
0.
06
0.11
0.
14
0.04
M
othe
r or f
athe
r and
gua
rdia
n 0.
93
0.71
0.
48
0.20
0.
01
0.
96
0.77
0.
59
0.31
0.
03
0.
03
0.06
0.
12
0.11
0.
02
Sin
gle
pare
nt
0.91
0.
64
0.43
0.
18
0.01
0.95
0.
72
0.54
0.
28
0.03
0.04
0.
08
0.11
0.
10
0.02
O
ther
0.
87
0.56
0.
34
0.11
#
0.
91
0.63
0.
43
0.16
0.
01
0.
04
0.07
0.
08
0.05
0.
01
Stu
dent
's e
duca
tiona
l exp
ecta
tions
1
H
igh
scho
ol o
r les
s 0.
78
0.35
0.
15
0.04
#
0.
87
0.44
0.
24
0.08
#
0.
09
0.09
0.
09
0.04
#
Som
e co
llege
0.
87
0.53
0.
28
0.08
#
0.
93
0.64
0.
40
0.14
#
0.
06
0.11
0.
12
0.06
#
Bac
helo
r's d
egre
e or
mor
e 0.
96
0.79
0.
60
0.29
0.
01
0.
98
0.85
0.
72
0.43
0.
05
0.
02
0.06
0.
11
0.14
0.
04
Don
’t kn
ow
0.91
0.
62
0.40
0.
17
0.01
0.95
0.
70
0.51
0.
27
0.03
0.04
0.
08
0.10
0.
10
0.02
#
Rou
nds
to z
ero.
1 E
duca
tiona
l exp
ecta
tions
of 1
0th-
grad
e st
uden
ts.
NO
TE: B
lack
incl
udes
Afri
can
Amer
ican
, His
pani
c in
clud
es L
atin
o, A
sian
incl
udes
Nat
ive
Haw
aiia
n or
Oth
er P
acifi
c Is
land
er, a
nd A
mer
ican
Indi
an in
clud
es A
lask
a N
ativ
e. P
rofic
ienc
y Le
vels
are
: Le
vel 1
—si
mpl
e ar
ithm
etic
al o
pera
tions
on
who
le n
umbe
rs, s
uch
as s
impl
e ar
ithm
etic
exp
ress
ions
invo
lvin
g m
ultip
licat
ion
or d
ivis
ion
of in
tege
rs; L
evel
2—
sim
ple
oper
atio
ns w
ith d
ecim
als,
fra
ctio
ns, p
ower
s, a
nd ro
ots,
suc
h as
com
parin
g ex
pres
sion
s, g
iven
info
rmat
ion
abou
t exp
onen
ts; L
evel
3—
sim
ple
prob
lem
sol
ving
, req
uirin
g th
e un
ders
tand
ing
of lo
w-le
vel m
athe
mat
ical
co
ncep
ts, s
uch
as s
impl
ifyin
g an
alg
ebra
ic e
xpre
ssio
n or
com
parin
g th
e le
ngth
of l
ine
segm
ents
illu
stra
ted
in a
dia
gram
; Lev
el 4
—un
ders
tand
ing
of in
term
edia
te-le
vel m
athe
mat
ical
con
cept
s an
d/or
mul
tiste
p so
lutio
ns to
wor
d pr
oble
ms
such
as
draw
ing
an in
fere
nce
base
d on
an
alge
brai
c ex
pres
sion
or i
nequ
ality
; and
Lev
el 5
—co
mpl
ex m
ultis
tep
wor
d pr
oble
ms
and/
or a
dvan
ced
mat
hem
atic
s m
ater
ial s
uch
as a
two-
step
pro
blem
requ
iring
eva
luat
ion
of fu
nctio
ns.
SOU
RC
E: U
.S. D
epar
tmen
t of E
duca
tion,
Nat
iona
l Cen
ter f
or E
duca
tion
Stat
istic
s, E
duca
tion
Long
itudi
nal S
tudy
of 2
002
(ELS
:200
2), “
Base
Yea
r, 20
02” a
nd “F
irst F
ollo
w-u
p, 2
004.
”
Chapter 3. Findings
13
Much like the volume of literature comparing private and public schools (Coleman and Hoffer 1987; Morgan and Sorenson 1999), evidence from ELS:2002 shows that students in Catholic schools fare better in mathematics than their public school counterparts. On average, Catholic school students outgained public school students on the mathematics assessment (6 versus 4) and left high school with higher overall scores (58 versus 51) (table 1). There were no detected differences in the gains of students attending other private schools and public school students (5 versus 4). However, other private school students left high school with higher overall scores than their public school peers (59 versus 51). With the exception of level 4, there were no differences detected in the gains across different levels of proficiency between public school students and Catholic school students during the last 2 years of high school. At level 4, Catholic school students were about 10 percentage points ahead of their public school counterparts (table 2). There were no differences detected in the gains at the three lowest levels of proficiency between public school students and other private school students. However, other private school students outpaced their public school peers at level 4 and level 5.
Compared with public school students, other private school students left high school with greater proficiency at all five levels and Catholic school students left high school with greater proficiency at levels 1–4. There were no differences at the end of high school detected between Catholic school students and other private school students at levels 1–4. Other private school students, however, were more proficient than were Catholic school students at level 5 (11 percent versus 6 percent) (table 2).
Like school sector, family composition is also associated with learning in mathematics. While there were no differences detected in the gains of students who live with both parents in the family, single parent families, and stepparent families, students who live with both parents in the family left high school with higher number-right scores and greater proficiency at levels 2–4. For example, 43 percent of students who live with both parents in the family were proficient at level 4 compared with 31 percent of students living in stepfamilies (i.e., mother or father and guardian) and 28 percent of students living with single parents (table 2). Compared with students who live with both parents in the family, students in other family forms left high school with lower number-right scores and lower proficiencies at all five levels.
Lastly, the educational expectations of students were linked with mathematics learning. Those who expected a college degree performed better on the mathematics assessments than their peers who expected to complete high school or less—for example, those expecting a college degree answered an average of 53.6 questions correctly on the 12th-grade assessment compared with an average of 37.3 correct answers for those who expected high school or less (table 1). During the final 2 years of high school, those who expected to attend college outpaced their peers at the highest levels (level 4 and level 5), and finished high school with a greater understanding of mathematics concepts at all levels than their peers who expected a high school degree or less.
In the aggregate, these descriptive findings are neither new nor novel—educational researchers have long documented differences in mathematics achievement along key dimensions of student background. What this analysis does highlight, however, is that by mastering basic mathematics skills by their sophomore year, Asians, Whites, High-SES students, students who live with both parents in the family, students attending private schools, and students expecting a college degree are in a better position to acquire more intermediate and
Chapter 3. Findings
14
advanced skills than their peers. As the learning of mathematics skills and concepts—both basic and advanced—rests on the content and instruction received in different courses, this analysis now turns its focus to the curricular pathways that students follow.
What are the most common mathematics course sequences taken by students in the 11th and 12th grades and are these sequences related to student background and school characteristics?
As mentioned in the introduction, this study improves upon previous research on learning and coursetaking by identifying the actual course sequences students take between test administrations, rather then simply counting the number of credits earned or using broad curricular classification such as a track placement or a level (e.g., “highest mathematics”). The analysis in this report was accomplished using data from the ELS:2002 High School Transcript Study. First, all mathematics courses for which the student earned credit during 2002–03 and 2003–04,13 the 2 academic years between the 2 mathematics assessments, were classified in one of the following 16 hierarchical categories:
1. No Mathematics;
2. Basic Mathematics;
3. General Mathematics;
4. Applied Mathematics;
5. Prealgebra;
6. Algebra I;
7. Geometry;
8. Algebra II;
9. Trigonometry;
10. Other Advanced Mathematics;
11. Precalculus;
12. Statistics;
13. Advanced Placement/International Baccalaureate (AP/IB) Mathematics;
14. Calculus;
15. Advanced Placement/International Baccalaureate (AP/IB) Calculus; or
16. Other Mathematics.14
The course titles that comprise these categories are listed in appendix A. As the typical school curriculum permits one mathematics course each academic year, this study operationalizes course sequences in terms of a two-course sequence: mathematics course (if any) for which credit was earned in 2002–03 and mathematics course (if any) for which credit was earned in 2003–04.15 Of the 256 possible combinations of two course sequence courses based on
13 Earning course credit is defined by receiving a letter grade higher than an F or a “pass.” 14 “Other mathematics” is a residual category and is not considered more or less rigorous than the other 15 course categories.15 Given the structure of most school calendars and curricula, the average student enrolls in two courses during his or her junior and senior years. However, due to summer school, dual enrollment (e.g., business mathematics and geometry in the same term), or semester-long courses students could possibly take more than two courses in this time period. In the analytic sample, 12.7 percent (n = 1,200) had taken three or more mathematics courses during the 2002–03 and 2003–04 academic years. To classify these students in a way that was consistent with the majority of students who had a two-course sequence, these students were classified based sequentially on their two highest courses. For example, if the student had taken geometry, applied mathematics, and algebra II, his or her course sequence was classified as “geometry–algebra II.” The effect of this classification rule on the estimates of learning should be negligible for two reasons. First, 62 percent of these students (n = 750) have sequences that fall under “all other patterns”—the residual group excluded from key comparisons; and second, all multiple regression models control for students who took more than two courses.
Chapter 3. Findings
15
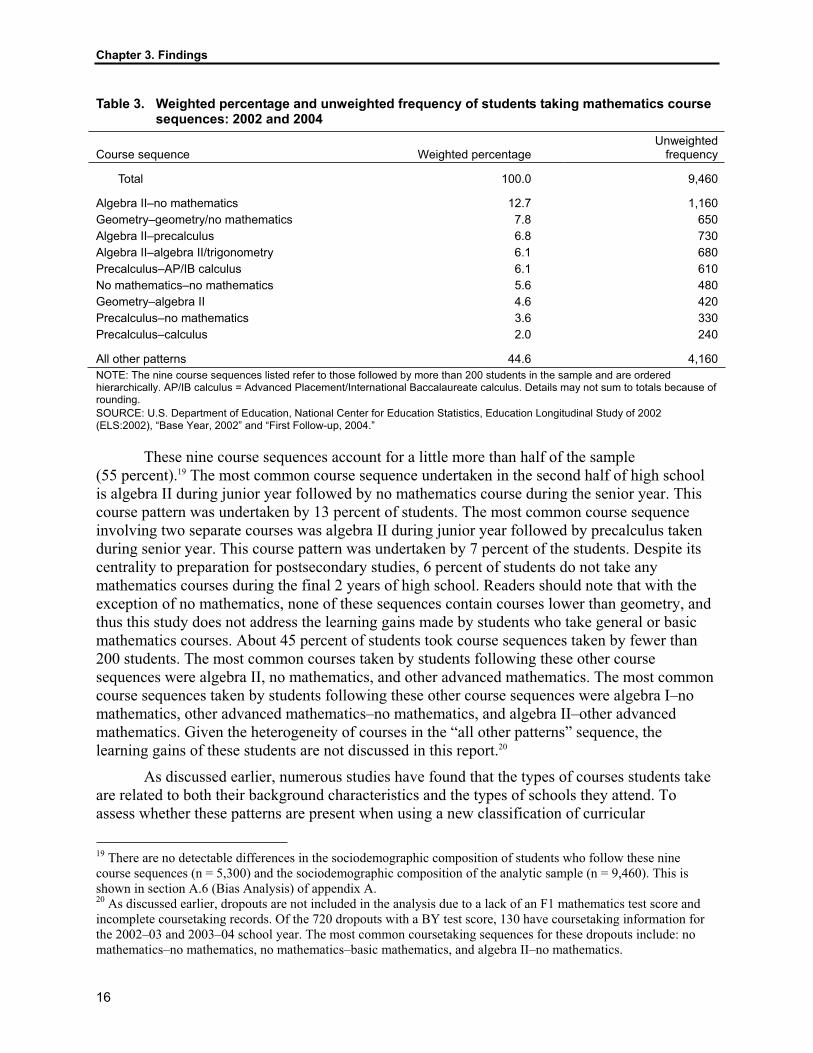
the classifications above, 180 sequences were followed by ELS:2004 sample members. Only six sequences were followed by more than 5 percent of students.
This process of constructing mathematics sequences reveals that the secondary mathematics curriculum in the United States is more diverse than once thought. For instance, analyses of NELS:88 using broader categories to classify courses found that 75 percent of students fit into one of five predefined coursetaking patterns (Burkam and Lee 2003). Aggregating course titles into broad patterns obscures some of the heterogeneity of mathematics coursetaking. Despite the relatively sequential and hierarchical nature of the subject matter, students enroll in a range of mathematics courses in their final years of high school.
The large number of course sequences precludes a succinct analysis of the learning gains for the entire analytic sample. To facilitate interpretation and to produce efficient estimates of learning, course sequences followed by more than 200 students (approximately 3 percent of the unweighted sample) form the basis of this study.16 Nine course sequences meet this criterion and are listed in table 3. In preliminary analyses (not shown), students who had followed a geometry–no mathematics sequence had similar mathematics gains as those in geometry–geometry.17 Given that these students were only exposed to geometry during the interval and that geometry is sometimes taught over the course of 2 years, they were combined into one group. This course sequence is herein referred to as geometry–geometry/no mathematics. Similarly, as trigonometry is often embedded in the content of algebra II and preliminary analyses (not shown) find no differences in their learning gains, students who had followed an algebra II–trigonometry sequence were combined with students who followed an algebra II–algebra II sequence.18 This course sequence is herein referred to as algebra II–algebra II/trigonometry. Since these two course sequences were constructed by combining courses, they should be interpreted with caution.
16 Selecting the most common course sequences yields the most pertinent information as these courses were experienced by a majority of students. These course sequences account for 55 percent of the sequences taken by students in ELS:2002. Including course sequences followed by fewer students would potentially threaten the efficiency of the estimates, particularly in a multiple regression analysis. 17 Differences in number-right score gains and differences in the proficiency probability score gains between students who followed a geometry–no mathematics sequence and students who followed a geometry–geometry sequence did not meet the .05 level for statistical significance required for this study. 18 Differences in number-right score gains and differences in the proficiency probability score gains between students who followed an algebra II–trigonometry sequence and students who followed an algebra II–algebra II sequence did not meet the .05 level for statistical significance required for this study.
Chapter 3. Findings
16
Table 3. Weighted percentage and unweighted frequency of students taking mathematics course sequences: 2002 and 2004
Course sequence Weighted percentage Unweighted
frequency
Total 100.0 9,460
Algebra II–no mathematics 12.7 1,160 Geometry–geometry/no mathematics 7.8 650 Algebra II–precalculus 6.8 730 Algebra II–algebra II/trigonometry 6.1 680 Precalculus–AP/IB calculus 6.1 610 No mathematics–no mathematics 5.6 480 Geometry–algebra II 4.6 420 Precalculus–no mathematics 3.6 330 Precalculus–calculus 2.0 240
All other patterns 44.6 4,160 NOTE: The nine course sequences listed refer to those followed by more than 200 students in the sample and are ordered hierarchically. AP/IB calculus = Advanced Placement/International Baccalaureate calculus. Details may not sum to totals because of rounding.SOURCE: U.S. Department of Education, National Center for Education Statistics, Education Longitudinal Study of 2002 (ELS:2002), “Base Year, 2002” and “First Follow-up, 2004.”
These nine course sequences account for a little more than half of the sample (55 percent).19 The most common course sequence undertaken in the second half of high school is algebra II during junior year followed by no mathematics course during the senior year. This course pattern was undertaken by 13 percent of students. The most common course sequence involving two separate courses was algebra II during junior year followed by precalculus taken during senior year. This course pattern was undertaken by 7 percent of the students. Despite its centrality to preparation for postsecondary studies, 6 percent of students do not take any mathematics courses during the final 2 years of high school. Readers should note that with the exception of no mathematics, none of these sequences contain courses lower than geometry, and thus this study does not address the learning gains made by students who take general or basic mathematics courses. About 45 percent of students took course sequences taken by fewer than 200 students. The most common courses taken by students following these other course sequences were algebra II, no mathematics, and other advanced mathematics. The most common course sequences taken by students following these other course sequences were algebra I–no mathematics, other advanced mathematics–no mathematics, and algebra II–other advanced mathematics. Given the heterogeneity of courses in the “all other patterns” sequence, the learning gains of these students are not discussed in this report.20
As discussed earlier, numerous studies have found that the types of courses students take are related to both their background characteristics and the types of schools they attend. To assess whether these patterns are present when using a new classification of curricular
19 There are no detectable differences in the sociodemographic composition of students who follow these nine course sequences (n = 5,300) and the sociodemographic composition of the analytic sample (n = 9,460). This is shown in section A.6 (Bias Analysis) of appendix A. 20 As discussed earlier, dropouts are not included in the analysis due to a lack of an F1 mathematics test score and incomplete coursetaking records. Of the 720 dropouts with a BY test score, 130 have coursetaking information for the 2002–03 and 2003–04 school year. The most common coursetaking sequences for these dropouts include: no mathematics–no mathematics, no mathematics–basic mathematics, and algebra II–no mathematics.

Chapter 3. Findings
17
experiences and this cohort of high school students, table 4 shows the percentage of students taking mathematics course sequences by student and school characteristics.
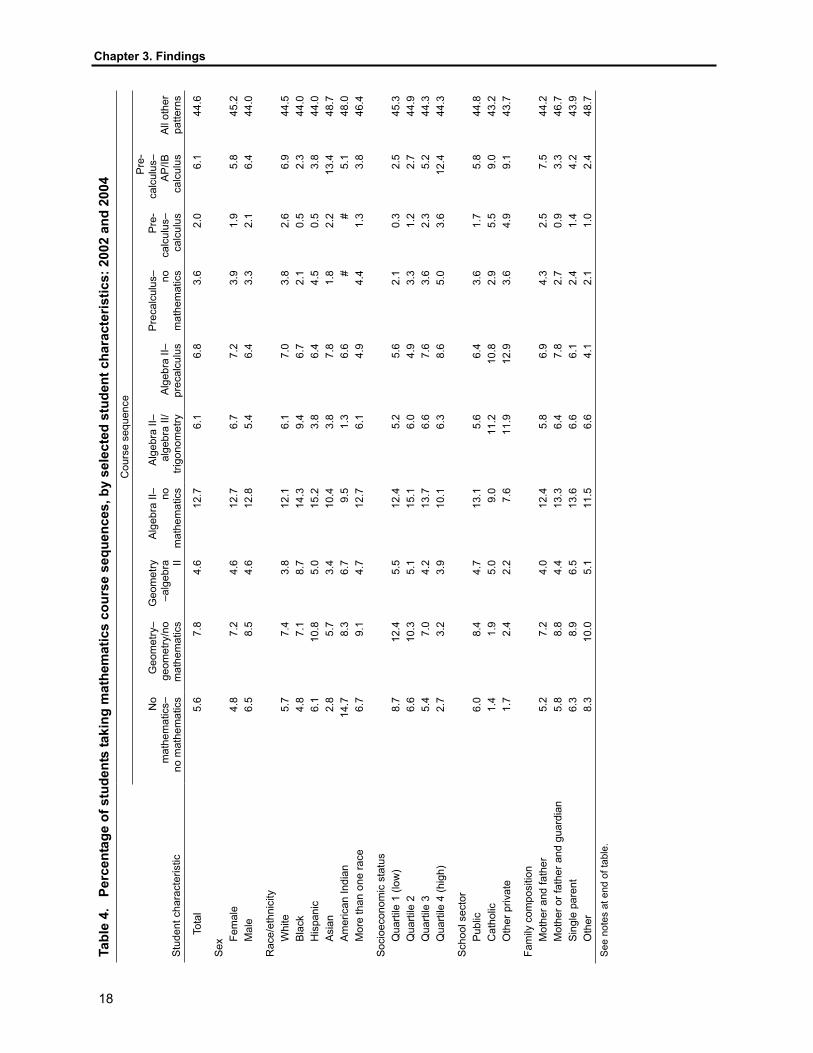
18
Chapter 3. Findings
Tabl
e 4.
Pe
rcen
tage
of s
tude
nts
taki
ng m
athe
mat
ics
cour
se s
eque
nces
, by
sele
cted
stu
dent
cha
ract
eris
tics:
200
2 an
d 20
04
Cou
rse
sequ
ence
Stu
dent
cha
ract
eris
tic
No
mat
hem
atic
s–no
mat
hem
atic
s
Geo
met
ry–
geom
etry
/no
mat
hem
atic
s
Geo
met
ry–a
lgeb
ra II
Alg
ebra
II– no
mat
hem
atic
s
Alg
ebra
II–
alge
bra
II/
trigo
nom
etry
A
lgeb
ra II
–pr
ecal
culu
s
Pre
calc
ulus
– nom
athe
mat
ics
Pre
-ca
lcul
us–
calc
ulus
Pre
-ca
lcul
us–
AP
/IBca
lcul
usA
ll ot
her
patte
rns
Tota
l 5.
67.
84.
612
.76.
1 6.
83.
62.
06.
144
.6
Sex
Fem
ale
4.8
7.2
4.6
12.7
6.7
7.2
3.9
1.9
5.8
45.2
Mal
e 6.
58.
54.
612
.85.
4 6.
43.
32.
16.
444
.0
Rac
e/et
hnic
ity
Whi
te
5.7
7.4
3.8
12.1
6.1
7.0
3.8
2.6
6.9
44.5
Bla
ck
4.8
7.1
8.7
14.3
9.4
6.7
2.1
0.5
2.3
44.0
His
pani
c 6.
110
.85.
015
.23.
8 6.
44.
50.
53.
844
.0A
sian
2.
85.
73.
410
.43.
8 7.
81.
82.
213
.448
.7A
mer
ican
Indi
an
14.7
8.3
6.7
9.5
1.3
6.6
##
5.1
48.0
Mor
e th
an o
ne ra
ce
6.7
9.1
4.7
12.7
6.1
4.9
4.4
1.3
3.8
46.4
Soc
ioec
onom
ic s
tatu
s Q
uarti
le 1
(low
) 8.
712
.45.
512
.45.
2 5.
62.
10.
32.
545
.3Q
uarti
le 2
6.
610
.35.
115
.16.
0 4.
93.
31.
22.
744
.9Q
uarti
le 3
5.
47.
04.
213
.76.
6 7.
63.
62.
35.
244
.3Q
uarti
le 4
(hig
h)
2.7
3.2
3.9
10.1
6.3
8.6
5.0
3.6
12.4
44.3
Sch
ool s
ecto
r P
ublic
6.
08.
44.
713
.15.
6 6.
43.
61.
75.
844
.8C
atho
lic
1.4
1.9
5.0
9.0
11.2
10
.82.
95.
59.
043
.2O
ther
priv
ate
1.
72.
42.
27.
611
.9
12.9
3.6
4.9
9.1
43.7
Fam
ily c
ompo
sitio
n M
othe
r and
fath
er
5.2
7.2
4.0
12.4
5.8
6.9
4.3
2.5
7.5
44.2
Mot
her o
r fat
her a
nd g
uard
ian
5.8
8.8
4.4
13.3
6.4
7.8
2.7
0.9
3.3
46.7
Sin
gle
pare
nt
6.3
8.9
6.5
13.6
6.6
6.1
2.4
1.4
4.2
43.9
Oth
er
8.3
10.0
5.1
11.5
6.6
4.1
2.1
1.0
2.4
48.7
See
note
s at
end
of t
able
.
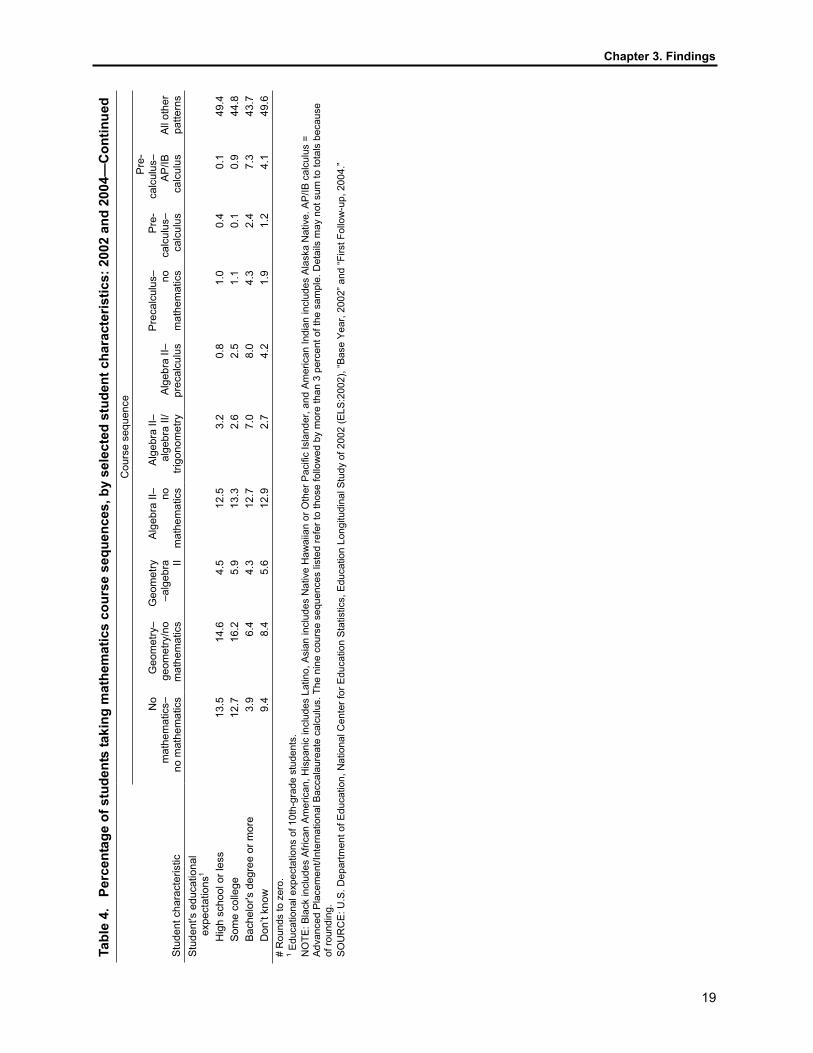
Chapter 3. Findings
19
Tabl
e 4.
Pe
rcen
tage
of s
tude
nts
taki
ng m
athe
mat
ics
cour
se s
eque
nces
, by
sele
cted
stu
dent
cha
ract
eris
tics:
200
2 an
d 20
04—
Con
tinue
dC
ours
e se
quen
ce
Stu
dent
cha
ract
eris
tic
No
mat
hem
atic
s–no
mat
hem
atic
s
Geo
met
ry–
geom
etry
/no
mat
hem
atic
s
Geo
met
ry–a
lgeb
ra II
Alg
ebra
II– no
mat
hem
atic
s
Alg
ebra
II–
alge
bra
II/
trigo
nom
etry
A
lgeb
ra II
–pr
ecal
culu
s
Pre
calc
ulus
– nom
athe
mat
ics
Pre
-ca
lcul
us–
calc
ulus
Pre
-ca
lcul
us–
AP
/IBca
lcul
usA
ll ot
her
patte
rns
Stu
dent
's e
duca
tiona
l ex
pect
atio
ns1
Hig
h sc
hool
or l
ess
13.5
14.6
4.5
12.5
3.2
0.8
1.0
0.4
0.1
49.4
Som
e co
llege
12
.716
.25.
913
.32.
6 2.
51.
10.
10.
944
.8B
ache
lor's
deg
ree
or m
ore
3.9
6.4
4.3
12.7
7.0
8.0
4.3
2.4
7.3
43.7
Don
’t kn
ow
9.4
8.4
5.6
12.9
2.7
4.2
1.9
1.2
4.1
49.6
# R
ound
s to
zer
o.
1 Edu
catio
nal e
xpec
tatio
ns o
f 10t
h-gr
ade
stud
ents
. N
OTE
: Bla
ck in
clud
es A
frica
n Am
eric
an, H
ispa
nic
incl
udes
Lat
ino,
Asi
an in
clud
es N
ativ
e H
awai
ian
or O
ther
Pac
ific
Isla
nder
, and
Am
eric
an In
dian
incl
udes
Ala
ska
Nat
ive.
AP/
IB c
alcu
lus
= Ad
vanc
ed P
lace
men
t/Int
erna
tiona
l Bac
cala
urea
te c
alcu
lus.
The
nin
e co
urse
seq
uenc
es li
sted
refe
r to
thos
e fo
llow
ed b
y m
ore
than
3 p
erce
nt o
f the
sam
ple.
Det
ails
may
not
sum
to to
tals
bec
ause
of
roun
ding
. SO
UR
CE:
U.S
. Dep
artm
ent o
f Edu
catio
n, N
atio
nal C
ente
r for
Edu
catio
n St
atis
tics,
Edu
catio
n Lo
ngitu
dina
l Stu
dy o
f 200
2 (E
LS:2
002)
, “Ba
se Y
ear,
2002
” and
“Firs
t Fol
low
-up,
200
4.”
Chapter 3. Findings
20
Much like the analysis of mathematics assessment scores, sequences of mathematics courses taken during junior and senior year of high school differed across student characteristics.With respect to sex, there were no detectable differences between boys and girls in taking course sequences containing precalculus during the last 2 years of high school: 18 percent of boys and 19 percent of girls did so. With respect to race/ethnicity, 25 and 20 percent of Asian and White students, respectively, followed course sequences that contained precalculus, compared to 15 percent of their Hispanic peers and 12 percent of their Black peers (table 4). The differences are greater when examining socioeconomic status. Almost 30 percent of students in the highest SES quartile followed pathways that included precalculus, while 11 percent of those in the lowest SES did so. This descriptive evidence shows that Blacks, Hispanics, and less affluent students were reaching advanced mathematics courses less often than their Asian, White, and more affluent peers.
Turning next to school type, 28 percent of Catholic school students have taken a sequence that included precalculus, compared to 18 percent of their public school peers. Similar patterns were found for other private school students, who were more likely than public school students to have taken a sequence containing precalculus (30 percent versus 18 percent). At the most advanced course sequence in the present analysis, precalculus-AP/IB, there were no detectable differences among the three school sectors: 6 percent of public school students and 9 percent of Catholic school students and other private school students followed this sequence during the second half of high school.
In terms of family structure, there were no detectable differences between students living with both parents and students living in a stepfamily or with a single parent in taking course sequences containing precalculus during the last 2 years of high school: 21 percent of students living with both parents, 15 percent of students living in a stepfamily, and 14 percent of students living with a single parent. However, more students living with both parents (21 percent) have taken course sequences containing precalculus during the last 2 years of high school than their peers living in other family forms (10 percent).
Lastly, students’ expectations for their future educational attainment were linked with differential curricular pathways: those who hold higher educational plans tend to take more advanced courses while those who set lower educational goals tend to take fewer advanced courses. For example, 7 percent of those who expected a college degree when enrolled in 10th grade later followed a precalculus–AP/IB calculus sequence while less than 1 percent of those who expected to attain some college and those who expected a high school degree or less did so. Moreover, 4 percent of students who expected a bachelor’s degree took no mathematics courses during the latter part of high school, compared with 14 percent of students who expected a high school diploma or less.
What mathematics course sequences are associated most closely with mathematics achievement? To answer this research question, both bivariate and multivariate techniques are used.
First, learning gains in mathematics are examined descriptively for students taking different course sequences. Next, regression techniques are used to measure the association of mathematics courses with mathematics achievement at the end of high school, apart from key factors related with these curricular pathways. Together, these analyses identify course
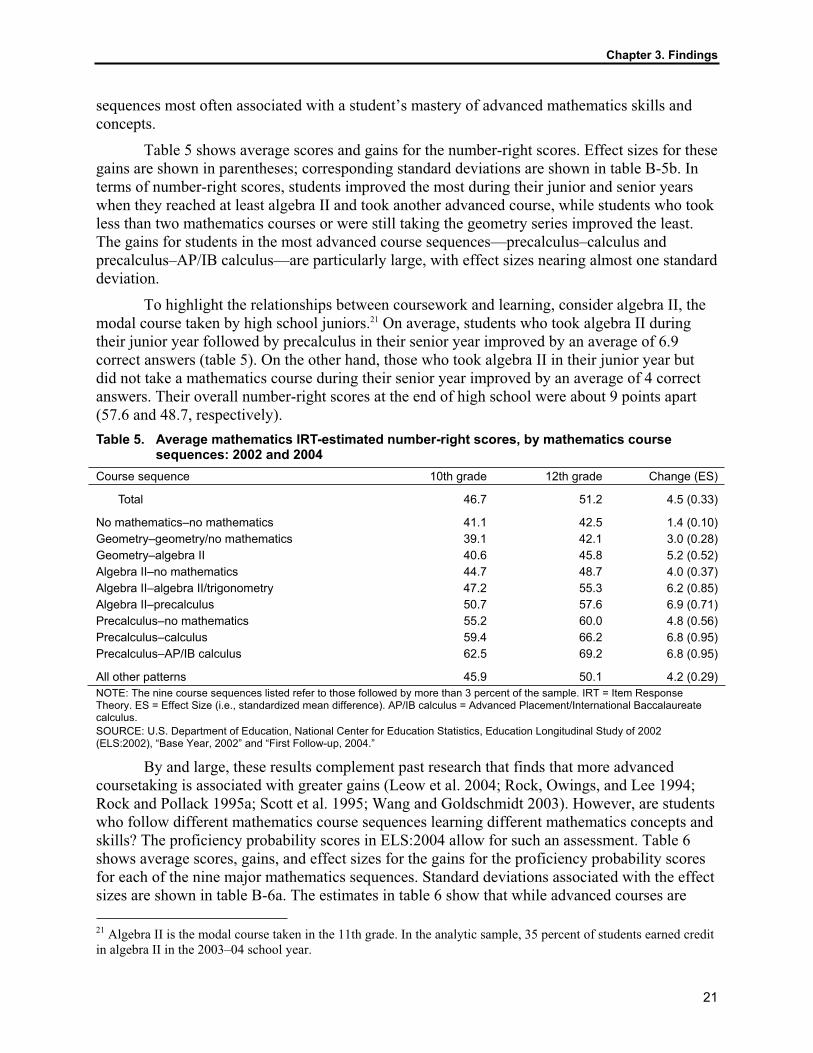
Chapter 3. Findings
21
sequences most often associated with a student’s mastery of advanced mathematics skills and concepts.
Table 5 shows average scores and gains for the number-right scores. Effect sizes for these gains are shown in parentheses; corresponding standard deviations are shown in table B-5b. In terms of number-right scores, students improved the most during their junior and senior years when they reached at least algebra II and took another advanced course, while students who took less than two mathematics courses or were still taking the geometry series improved the least. The gains for students in the most advanced course sequences—precalculus–calculus and precalculus–AP/IB calculus—are particularly large, with effect sizes nearing almost one standard deviation.
To highlight the relationships between coursework and learning, consider algebra II, the modal course taken by high school juniors.21 On average, students who took algebra II during their junior year followed by precalculus in their senior year improved by an average of 6.9 correct answers (table 5). On the other hand, those who took algebra II in their junior year but did not take a mathematics course during their senior year improved by an average of 4 correct answers. Their overall number-right scores at the end of high school were about 9 points apart (57.6 and 48.7, respectively).Table 5. Average mathematics IRT-estimated number-right scores, by mathematics course
sequences: 2002 and 2004 Course sequence 10th grade 12th grade Change (ES)
Total 46.7 51.2 4.5 (0.33)
No mathematics–no mathematics 41.1 42.5 1.4 (0.10) Geometry–geometry/no mathematics 39.1 42.1 3.0 (0.28) Geometry–algebra II 40.6 45.8 5.2 (0.52) Algebra II–no mathematics 44.7 48.7 4.0 (0.37) Algebra II–algebra II/trigonometry 47.2 55.3 6.2 (0.85) Algebra II–precalculus 50.7 57.6 6.9 (0.71) Precalculus–no mathematics 55.2 60.0 4.8 (0.56) Precalculus–calculus 59.4 66.2 6.8 (0.95) Precalculus–AP/IB calculus 62.5 69.2 6.8 (0.95)
All other patterns 45.9 50.1 4.2 (0.29) NOTE: The nine course sequences listed refer to those followed by more than 3 percent of the sample. IRT = Item Response Theory. ES = Effect Size (i.e., standardized mean difference). AP/IB calculus = Advanced Placement/International Baccalaureate calculus.SOURCE: U.S. Department of Education, National Center for Education Statistics, Education Longitudinal Study of 2002 (ELS:2002), “Base Year, 2002” and “First Follow-up, 2004.”
By and large, these results complement past research that finds that more advanced coursetaking is associated with greater gains (Leow et al. 2004; Rock, Owings, and Lee 1994; Rock and Pollack 1995a; Scott et al. 1995; Wang and Goldschmidt 2003). However, are students who follow different mathematics course sequences learning different mathematics concepts and skills? The proficiency probability scores in ELS:2004 allow for such an assessment. Table 6 shows average scores, gains, and effect sizes for the gains for the proficiency probability scores for each of the nine major mathematics sequences. Standard deviations associated with the effect sizes are shown in table B-6a. The estimates in table 6 show that while advanced courses are
21 Algebra II is the modal course taken in the 11th grade. In the analytic sample, 35 percent of students earned credit in algebra II in the 2003–04 school year.
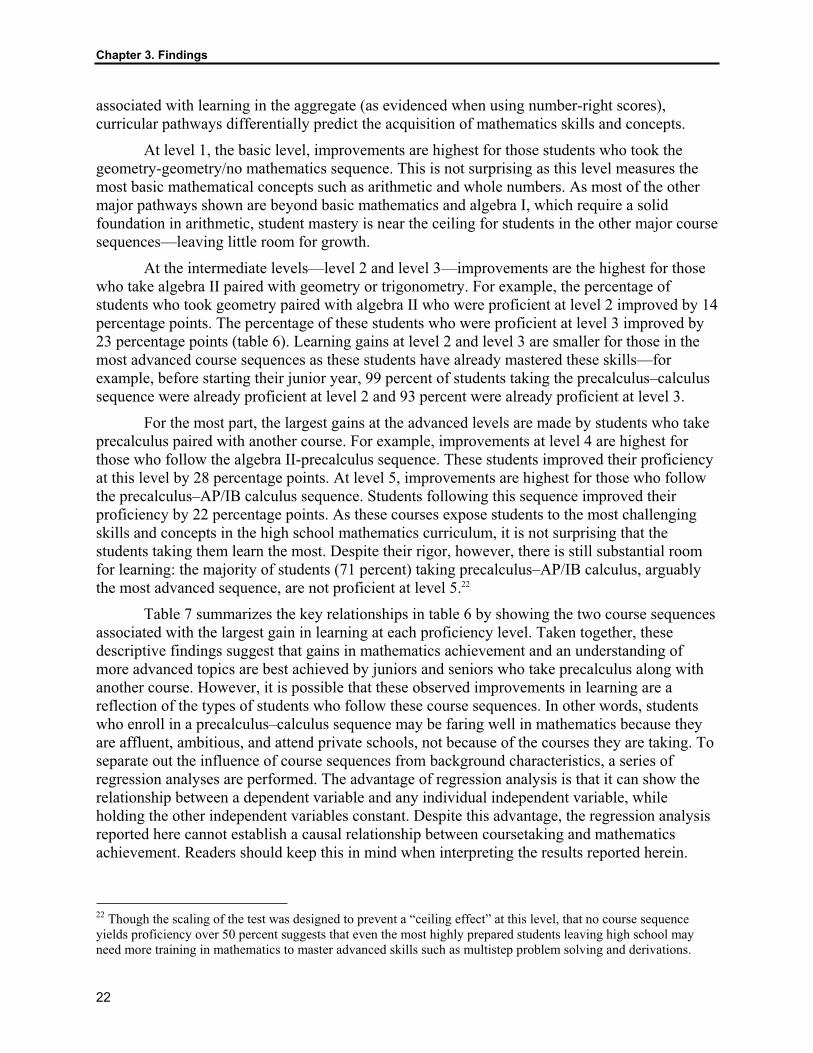
Chapter 3. Findings
22
associated with learning in the aggregate (as evidenced when using number-right scores), curricular pathways differentially predict the acquisition of mathematics skills and concepts.
At level 1, the basic level, improvements are highest for those students who took the geometry-geometry/no mathematics sequence. This is not surprising as this level measures the most basic mathematical concepts such as arithmetic and whole numbers. As most of the other major pathways shown are beyond basic mathematics and algebra I, which require a solid foundation in arithmetic, student mastery is near the ceiling for students in the other major course sequences—leaving little room for growth.
At the intermediate levels—level 2 and level 3—improvements are the highest for those who take algebra II paired with geometry or trigonometry. For example, the percentage of students who took geometry paired with algebra II who were proficient at level 2 improved by 14 percentage points. The percentage of these students who were proficient at level 3 improved by 23 percentage points (table 6). Learning gains at level 2 and level 3 are smaller for those in the most advanced course sequences as these students have already mastered these skills—for example, before starting their junior year, 99 percent of students taking the precalculus–calculus sequence were already proficient at level 2 and 93 percent were already proficient at level 3.
For the most part, the largest gains at the advanced levels are made by students who take precalculus paired with another course. For example, improvements at level 4 are highest for those who follow the algebra II-precalculus sequence. These students improved their proficiency at this level by 28 percentage points. At level 5, improvements are highest for those who follow the precalculus–AP/IB calculus sequence. Students following this sequence improved their proficiency by 22 percentage points. As these courses expose students to the most challenging skills and concepts in the high school mathematics curriculum, it is not surprising that the students taking them learn the most. Despite their rigor, however, there is still substantial room for learning: the majority of students (71 percent) taking precalculus–AP/IB calculus, arguably the most advanced sequence, are not proficient at level 5.22
Table 7 summarizes the key relationships in table 6 by showing the two course sequences associated with the largest gain in learning at each proficiency level. Taken together, these descriptive findings suggest that gains in mathematics achievement and an understanding of more advanced topics are best achieved by juniors and seniors who take precalculus along with another course. However, it is possible that these observed improvements in learning are a reflection of the types of students who follow these course sequences. In other words, students who enroll in a precalculus–calculus sequence may be faring well in mathematics because they are affluent, ambitious, and attend private schools, not because of the courses they are taking. To separate out the influence of course sequences from background characteristics, a series of regression analyses are performed. The advantage of regression analysis is that it can show the relationship between a dependent variable and any individual independent variable, while holding the other independent variables constant. Despite this advantage, the regression analysis reported here cannot establish a causal relationship between coursetaking and mathematics achievement. Readers should keep this in mind when interpreting the results reported herein.
22 Though the scaling of the test was designed to prevent a “ceiling effect” at this level, that no course sequence yields proficiency over 50 percent suggests that even the most highly prepared students leaving high school may need more training in mathematics to master advanced skills such as multistep problem solving and derivations.

Chapter 3. Findings
23
Tabl
e 6.
Av
erag
e m
athe
mat
ics
prof
icie
ncy
prob
abili
ty s
core
s, b
y m
athe
mat
ics
cour
se s
eque
nces
: 200
2 an
d 20
04
10th
gra
de
12th
gra
de
Cha
nge
Cou
rse
sequ
ence
Le
vel 1
Leve
l 2Le
vel 3
Leve
l 4Le
vel 5
Leve
l 1Le
vel 2
Leve
l 3Le
vel 4
Leve
l 5Le
vel 1
Leve
l 2Le
vel 3
Leve
l 4Le
vel 5
Tota
l 0.
94
0.73
0.
53
0.25
0.
01
0.
96
0.80
0.
65
0.38
0.
04
0.
03
0.06
0.
11
0.13
0.
03
No
mat
hem
atic
s–no
mat
hem
atic
s 0.
88
0.59
0.
37
0.14
#
0.
92
0.61
0.
40
0.16
0.
01
0.
03
0.02
0.
03
0.02
#
Geo
met
ry–g
eom
etry
/no
mat
hem
atic
s 0.
90
0.55
0.
27
0.07
#
0.
95
0.64
0.
38
0.09
#
0.
05
0.09
0.
11
0.03
#
Geo
met
ry–a
lgeb
ra II
0.
94
0.62
0.
29
0.06
#
0.
98
0.76
0.
52
0.15
#
0.
04
0.14
0.
23
0.09
#
Alg
ebra
II–n
o m
athe
mat
ics
0.96
0.
75
0.46
0.
14
#
0.98
0.
83
0.63
0.
23
#
0.02
0.
08
0.17
0.
10
# A
lgeb
ra II
–alg
ebra
II/tr
igon
omet
ry
0.98
0.
82
0.56
0.
17
#
1.00
0.
92
0.78
0.
36
0.01
0.02
0.
10
0.22
0.
20
# A
lgeb
ra II
–pre
calc
ulus
0.
98
0.88
0.
72
0.28
#
1.
00
0.95
0.
86
0.56
0.
03
0.
02
0.07
0.
15
0.28
0.
02
Pre
calc
ulus
–no
mat
hem
atic
s 0.
99
0.95
0.
84
0.45
0.
02
1.
00
0.98
0.
92
0.65
0.
03
0.
01
0.04
0.
08
0.20
0.
02
Pre
calc
ulus
–cal
culu
s 1.
00
0.99
0.
93
0.62
0.
02
1.
00
1.00
0.
98
0.86
0.
15
#
0.01
0.
05
0.24
0.
13
Pre
calc
ulus
–AP
/IB c
alcu
lus
1.00
0.
99
0.95
0.
75
0.07
1.00
1.
00
1.00
0.
93
0.29
# 0.
01
0.05
0.
18
0.22
All
othe
r pat
tern
s 0.
92
0.69
0.
52
0.26
0.
01
0.
95
0.75
0.
61
0.37
0.
04
0.
03
0.06
0.
09
0.12
0.
03
# R
ound
s to
zer
o.
NO
TE: T
he n
ine
cour
se s
eque
nces
list
ed re
fer t
o th
ose
follo
wed
by
mor
e th
an 3
per
cent
of t
he s
ampl
e. A
P/IB
cal
culu
s =
Adva
nced
Pla
cem
ent/I
nter
natio
nal B
acca
laur
eate
cal
culu
s. P
rofic
ienc
y Le
vels
are
: Lev
el 1
—si
mpl
e ar
ithm
etic
al o
pera
tions
on
who
le n
umbe
rs, s
uch
as s
impl
e ar
ithm
etic
exp
ress
ions
invo
lvin
g m
ultip
licat
ion
or d
ivis
ion
of in
tege
rs; L
evel
2—
sim
ple
oper
atio
ns w
ith
deci
mal
s, fr
actio
ns, p
ower
s, a
nd ro
ots,
suc
h as
com
parin
g ex
pres
sion
s, g
iven
info
rmat
ion
abou
t exp
onen
ts; L
evel
3—
sim
ple
prob
lem
sol
ving
, req
uirin
g th
e un
ders
tand
ing
of lo
w-le
vel m
athe
mat
ical
co
ncep
ts, s
uch
as s
impl
ifyin
g an
alg
ebra
ic e
xpre
ssio
n or
com
parin
g th
e le
ngth
of l
ine
segm
ents
illu
stra
ted
in a
dia
gram
; Lev
el 4
—un
ders
tand
ing
of in
term
edia
te-le
vel m
athe
mat
ical
con
cept
s an
d/or
mul
tiste
p so
lutio
ns to
wor
d pr
oble
ms
such
as
draw
ing
an in
fere
nce
base
d on
an
alge
brai
c ex
pres
sion
or i
nequ
ality
; and
Lev
el 5
—co
mpl
ex m
ultis
tep
wor
d pr
oble
ms
and/
or a
dvan
ced
mat
hem
atic
s m
ater
ial s
uch
as a
two-
step
pro
blem
requ
iring
eva
luat
ion
of fu
nctio
ns.
SOU
RC
E: U
.S. D
epar
tmen
t of E
duca
tion,
Nat
iona
l Cen
ter f
or E
duca
tion
Stat
istic
s, E
duca
tion
Long
itudi
nal S
tudy
of 2
002
(ELS
:200
2), “
Base
Yea
r, 20
02” a
nd “F
irst F
ollo
w-u
p, 2
004.
”
Chapter 3. Findings
24
Table 7. Mathematics course sequences associated with the two largest gains in mathematics learning, by proficiency level: 2002 and 2004
Proficiency level1Course sequence associated with
the largest gain Course sequence associated with
the second largest gain Level 1 Geometry–geometry/no mathematics Geometry–algebra II Level 2 Geometry–algebra II Algebra II–algebra II/trigonometry Level 3 Geometry–algebra II Algebra II–algebra II/trigonometry Level 4 Algebra II–precalculus Precalculus–calculus Level 5 Precalculus–AP/IB calculus Precalculus–calculus 1 Proficiency Levels are: Level 1—simple arithmetical operations on whole numbers, such as simple arithmetic expressions involvingmultiplication or division of integers; Level 2—simple operations with decimals, fractions, powers, and roots, such as comparingexpressions, given information about exponents; Level 3—simple problem solving, requiring the understanding of low-level mathematical concepts, such as simplifying an algebraic expression or comparing the length of line segments illustrated in a diagram; Level 4—understanding of intermediate-level mathematical concepts and/or multistep solutions to word problems such as drawing an inference based on an algebraic expression or inequality; and Level 5—complex multistep word problems and/or advanced mathematics material such as a two-step problem requiring evaluation of functions. NOTE: AP/IB calculus = Advanced Placement/International Baccalaureate calculus. SOURCE: U.S. Department of Education, National Center for Education Statistics, Education Longitudinal Study of 2002 (ELS:2002), “Base Year, 2002” and “First Follow-up, 2004.”
The availability of two mathematics assessments, one before students enter their junior year and one at the end of senior year, permits a more stringent assessment of learning gains. This study estimates a set of regression models where the test score from the 12th grade is used as the dependent variable and the test score from the 10th grade is used as a control variable. Using the 10th-grade test score as a control variable conditions the effects of the rest of the predictor variables on students’ initial level of mathematics proficiency (i.e., the estimated relationship for a particular covariate is conditional upon the other variables in the model). This is often referred to as the covariate adjustment or regressor variable approach to analyzing change.23
Two sets of models are estimated. First, the relationships between the course sequences and the 12th-grade number-right score are estimated. Second, the relationships between the course sequences and the five proficiency levels from the 12th grade are estimated. Both outcomes are continuous and thus, ordinary least squares (OLS) estimation is used. When a lagged version of the dependent variable (i.e., the 10th-grade score) is included in the model, as is the case in this study, the coefficients associated with the other predictor variables represent the amount of change in the dependent variable associated with a unit change in each
23 There are two general approaches to modeling change in a regression framework when the dependent variable is measured at two points in time: the change score approach and the covariate adjustment approach. In the change score approach, the dependent variable would be the difference between the F1 test score and the BY test score. This difference score would be regressed on the measures of course sequences and background characteristics. In the covariate adjustment approach, the F1 test score is used as the dependent variable and the BY test score is used as a predictor variable alongside the measures of course sequences and background variables. When the “treatment” occurs between the pretest and the posttest, and assignment to the treatment group is affected by the pretest, the covariate adjustment approach is preferable to the change score approach (Allison 1990; Maris 1998). In this study, course sequences are considered to be the “treatment” and they occur between the BY and F1 test administration. As evidenced in the descriptive statistics in tables 5 and 6, course sequences that students take at the end of high school are associated with their initial scores on the pretest. Additionally, the change score approach constrains the coefficient associated with the baseline score to 1, which is too restrictive. For these reasons, this study uses the covariate adjustment approach rather than the change score approach. In the absence of an experimental design, the covariate adjustment method greatly reduces the threat of endogeneity (i.e., that the omission of other unmeasured factors influencing both course sequences and 12th-grade test scores will bias the estimates) (Allison 1990; Maris 1998).

Chapter 3. Findings
25
independent variable in the model (Finkel 1995). With the level of achievement in 10th grade already controlled, any differences detected by the rest of the coefficients reflect achievement beyond what is already measured at the end of 10th grade—hence, the change interpretation. The first set of models is shown in table 8.24
24 None of the variables in any of the models presented in tables 8 and 9 yielded a variance inflation factor greater than 5.

Chapter 3. Findings
26
Table 8. Coefficients from an ordinary least squares (OLS) regression of 12th-grade IRT mathematics scores, by characteristic: 2002 and 2004
Model 11 Model 2
Characteristic Coefficient Standard
error Coefficient Standard
error10th-grade IRT mathematics score 0.9* 0.01 0.9* 0.01
Sex Female (reference) † † † †
Male –0.4* 0.17 –0.6* 0.16
Race/ethnicity White (reference) † † † †Black –0.8* 0.25 –1.3* 0.25 Hispanic –0.3 0.27 –0.6* 0.27 Asian 0.5 0.38 0.2 0.38 American Indian –1.6 1.02 –1.6 0.94 More than one race 0.4 0.42 0.4 0.40
Socioeconomic status Quartile 1 (low) (reference) † † † †Quartile 2 # † # †Quartile 3 0.9* 0.23 0.7* 0.22 Quartile 4 (high) 1.7* 0.26 1.3* 0.25
School sector Public (reference) † † † †Catholic 1.4* 0.22 1.0* 0.21 Other private 0.9* 0.36 0.5 0.39
Family composition Mother and father (reference) † † † †Mother or father and guardian –0.5* 0.26 –0.5 0.25 Single parent –0.2 0.19 –0.2 0.20 Other –1.7* 0.51 –1.7* 0.48
Student’s educational expectations2 High school or less (reference) † † † †Some college 0.7 0.52 0.8 0.50 Bachelor's degree 1.9* 0.43 1.5* 0.42 Don’t know 1.1* 0.51 1.0* 0.49
Course sequence No mathematics–no mathematics † † –2.8* 0.41 Geometry–geometry/no mathematics † † –1.5* 0.38 Geometry–algebra II † † 0.6 0.42 Algebra II–no mathematics (reference) † † † † Algebra II–algebra II/trigonometry † † 3.2* 0.33 Algebra II–precalculus † † 2.1* 0.37 Precalculus–no mathematics † † 1.8* 0.41 Precalculus–calculus † † 3.7* 0.45 Precalculus–AP/IB calculus † † 4.2* 0.37 All other patterns † † # †
See notes at end of table.
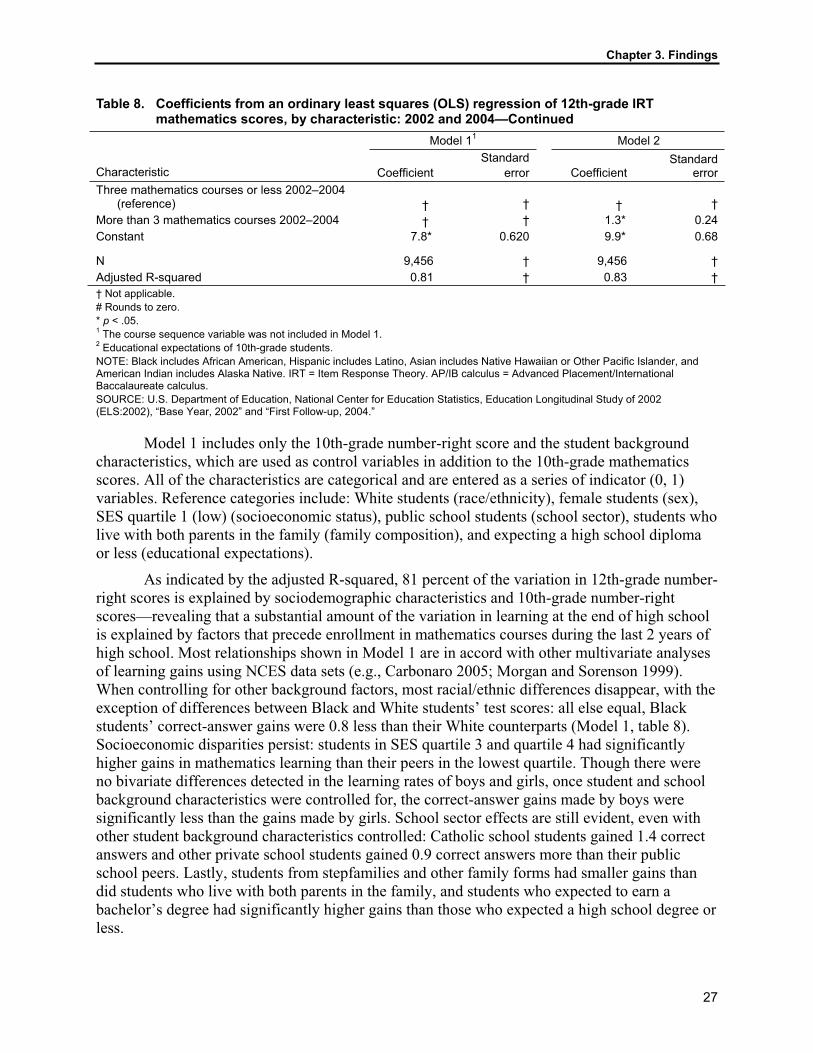
Chapter 3. Findings
27
Table 8. Coefficients from an ordinary least squares (OLS) regression of 12th-grade IRT mathematics scores, by characteristic: 2002 and 2004—Continued
Model 11 Model 2
Characteristic Coefficient Standard
error Coefficient Standard
errorThree mathematics courses or less 2002–2004
(reference) † † † †More than 3 mathematics courses 2002–2004 † † 1.3* 0.24 Constant 7.8* 0.620 9.9* 0.68
N 9,456 † 9,456 † Adjusted R-squared 0.81 † 0.83 † † Not applicable.# Rounds to zero. * p < .05. 1 The course sequence variable was not included in Model 1. 2 Educational expectations of 10th-grade students. NOTE: Black includes African American, Hispanic includes Latino, Asian includes Native Hawaiian or Other Pacific Islander, and American Indian includes Alaska Native. IRT = Item Response Theory. AP/IB calculus = Advanced Placement/International Baccalaureate calculus.SOURCE: U.S. Department of Education, National Center for Education Statistics, Education Longitudinal Study of 2002 (ELS:2002), “Base Year, 2002” and “First Follow-up, 2004.”
Model 1 includes only the 10th-grade number-right score and the student background characteristics, which are used as control variables in addition to the 10th-grade mathematics scores. All of the characteristics are categorical and are entered as a series of indicator (0, 1) variables. Reference categories include: White students (race/ethnicity), female students (sex), SES quartile 1 (low) (socioeconomic status), public school students (school sector), students who live with both parents in the family (family composition), and expecting a high school diploma or less (educational expectations).
As indicated by the adjusted R-squared, 81 percent of the variation in 12th-grade number-right scores is explained by sociodemographic characteristics and 10th-grade number-right scores—revealing that a substantial amount of the variation in learning at the end of high school is explained by factors that precede enrollment in mathematics courses during the last 2 years of high school. Most relationships shown in Model 1 are in accord with other multivariate analyses of learning gains using NCES data sets (e.g., Carbonaro 2005; Morgan and Sorenson 1999). When controlling for other background factors, most racial/ethnic differences disappear, with the exception of differences between Black and White students’ test scores: all else equal, Black students’ correct-answer gains were 0.8 less than their White counterparts (Model 1, table 8). Socioeconomic disparities persist: students in SES quartile 3 and quartile 4 had significantly higher gains in mathematics learning than their peers in the lowest quartile. Though there were no bivariate differences detected in the learning rates of boys and girls, once student and school background characteristics were controlled for, the correct-answer gains made by boys were significantly less than the gains made by girls. School sector effects are still evident, even with other student background characteristics controlled: Catholic school students gained 1.4 correct answers and other private school students gained 0.9 correct answers more than their public school peers. Lastly, students from stepfamilies and other family forms had smaller gains than did students who live with both parents in the family, and students who expected to earn a bachelor’s degree had significantly higher gains than those who expected a high school degree or less.
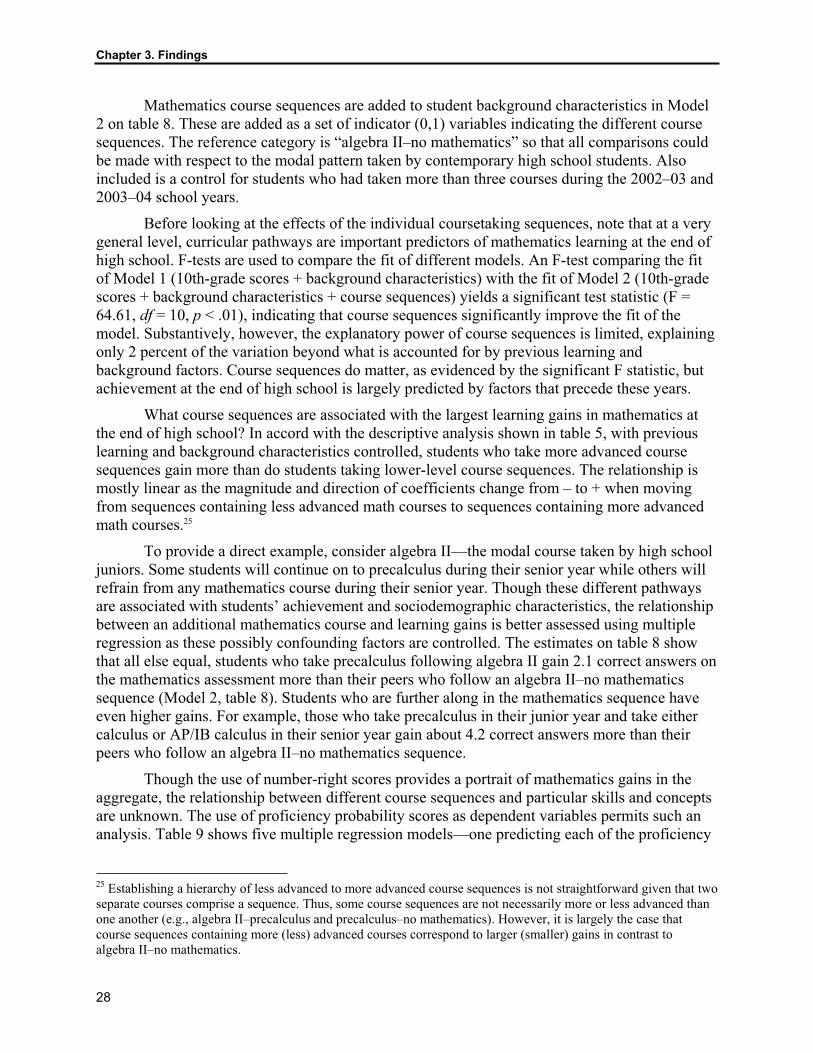
Chapter 3. Findings
28
Mathematics course sequences are added to student background characteristics in Model 2 on table 8. These are added as a set of indicator (0,1) variables indicating the different course sequences. The reference category is “algebra II–no mathematics” so that all comparisons could be made with respect to the modal pattern taken by contemporary high school students. Also included is a control for students who had taken more than three courses during the 2002–03 and 2003–04 school years.
Before looking at the effects of the individual coursetaking sequences, note that at a very general level, curricular pathways are important predictors of mathematics learning at the end of high school. F-tests are used to compare the fit of different models. An F-test comparing the fit of Model 1 (10th-grade scores + background characteristics) with the fit of Model 2 (10th-grade scores + background characteristics + course sequences) yields a significant test statistic (F = 64.61, df = 10, p < .01), indicating that course sequences significantly improve the fit of the model. Substantively, however, the explanatory power of course sequences is limited, explaining only 2 percent of the variation beyond what is accounted for by previous learning and background factors. Course sequences do matter, as evidenced by the significant F statistic, but achievement at the end of high school is largely predicted by factors that precede these years.
What course sequences are associated with the largest learning gains in mathematics at the end of high school? In accord with the descriptive analysis shown in table 5, with previous learning and background characteristics controlled, students who take more advanced course sequences gain more than do students taking lower-level course sequences. The relationship is mostly linear as the magnitude and direction of coefficients change from – to + when moving from sequences containing less advanced math courses to sequences containing more advanced math courses.25
To provide a direct example, consider algebra II—the modal course taken by high school juniors. Some students will continue on to precalculus during their senior year while others will refrain from any mathematics course during their senior year. Though these different pathways are associated with students’ achievement and sociodemographic characteristics, the relationship between an additional mathematics course and learning gains is better assessed using multiple regression as these possibly confounding factors are controlled. The estimates on table 8 show that all else equal, students who take precalculus following algebra II gain 2.1 correct answers on the mathematics assessment more than their peers who follow an algebra II–no mathematics sequence (Model 2, table 8). Students who are further along in the mathematics sequence have even higher gains. For example, those who take precalculus in their junior year and take either calculus or AP/IB calculus in their senior year gain about 4.2 correct answers more than their peers who follow an algebra II–no mathematics sequence.
Though the use of number-right scores provides a portrait of mathematics gains in the aggregate, the relationship between different course sequences and particular skills and concepts are unknown. The use of proficiency probability scores as dependent variables permits such an analysis. Table 9 shows five multiple regression models—one predicting each of the proficiency
25 Establishing a hierarchy of less advanced to more advanced course sequences is not straightforward given that two separate courses comprise a sequence. Thus, some course sequences are not necessarily more or less advanced than one another (e.g., algebra II–precalculus and precalculus–no mathematics). However, it is largely the case that course sequences containing more (less) advanced courses correspond to larger (smaller) gains in contrast to algebra II–no mathematics.

Chapter 3. Findings
29
levels. As was the case for Models 1 and 2 on table 8, all models control for proficiency measured in the 10th grade as well as background characteristics.26
Similar to the descriptive analysis, mathematics course sequences are generally unrelated to gains in proficiency at level 1. For example, with the exception of the coefficient for no mathematics–no mathematics, none of the coefficients associated with the major course sequences are significantly different from algebra II–no mathematics, the modal course sequence. This is likely because most students enter their junior year with a mastery of basic arithmetic and whole numbers; thus, there is little if any room for improvement. At the intermediate levels—level 2 and level 3—there is evidence that when compared to those who followed an algebra II–no mathematics sequence, the largest gains were made by those who followed an algebra II–precalculus sequence. They outgained their algebra II–no mathematics peers by 4 and 7 percentage points at levels 2 and 3, respectively (table 9).
In levels 1, 2, and 3, the most advanced course sequences—precalculus–calculus and precalculus–AP/IB calculus—have negative coefficients. While at first this may seem counterintuitive, recall that students in these sequences enter the second half of high school with almost complete mastery of these topics (see table 6). Therefore, they make fewer gains than their peers who are in the algebra II–no mathematics sequence.
At level 4, the largest gains relative to algebra II–no mathematics were made by those who followed the algebra II-algebra II/trigonometry sequence and those who followed one of the precalculus sequences. At the most advanced level—level 5—the largest gains were made by students who followed one of the precalculus sequences. For example, at level 5 students who followed the precalculus–calculus sequence outgained those who were in the algebra II–no mathematics sequence by 11 percentage points and students who followed the precalculus–AP/IB calculus sequence outgained those who were in the algebra II–no mathematics sequence by 20 percentage points. This complements the bivariate findings presented earlier: mastery of the most advanced skills is associated with credits earned in courses beyond algebra II, such as trigonometry, precalculus, and calculus.
Finally, in 4 of the 6 models in which course sequences were used to predict mathematics achievement outcomes in 12th grade (Model 2 in table 8 and models for levels 2, 3, and 4 in table 9), students who followed an algebra II–precalculus sequence had higher gains than their peers who followed an algebra II–no mathematics sequence. Moreover, none of the models showed any measurable differences between students who followed a geometry–algebra II sequence and those who followed an algebra II–no mathematics sequence. In essence, students who took algebra II in their junior year and did not take any mathematics courses in their senior year learned no more or less than their peers who did not reach algebra II until their senior year. On the other hand, students who reached algebra II in their junior year and then continued on to precalculus in their senior year made the most sizeable gains.
26 Since background characteristics are not the main focus of this report, the models predicting the proficiency levels including only background characteristics are not shown. Similar to the model comparisons shown in table 8, the addition of the coursetaking terms explain little of the variation in levels 1–4 beyond what is accounted for by previous learning and background factors. When the coursetaking terms are added, the adjusted R-squared remains the same (.49) for level 1, remains the same (.69) for level 2, improves from .62 to .64 for level 3, and improves from .69 to .72 for level 4. The largest growth in adjusted R-squared occurs for level 5, where the inclusion of the coursetaking terms improves 9 percent—from .38 to .47.
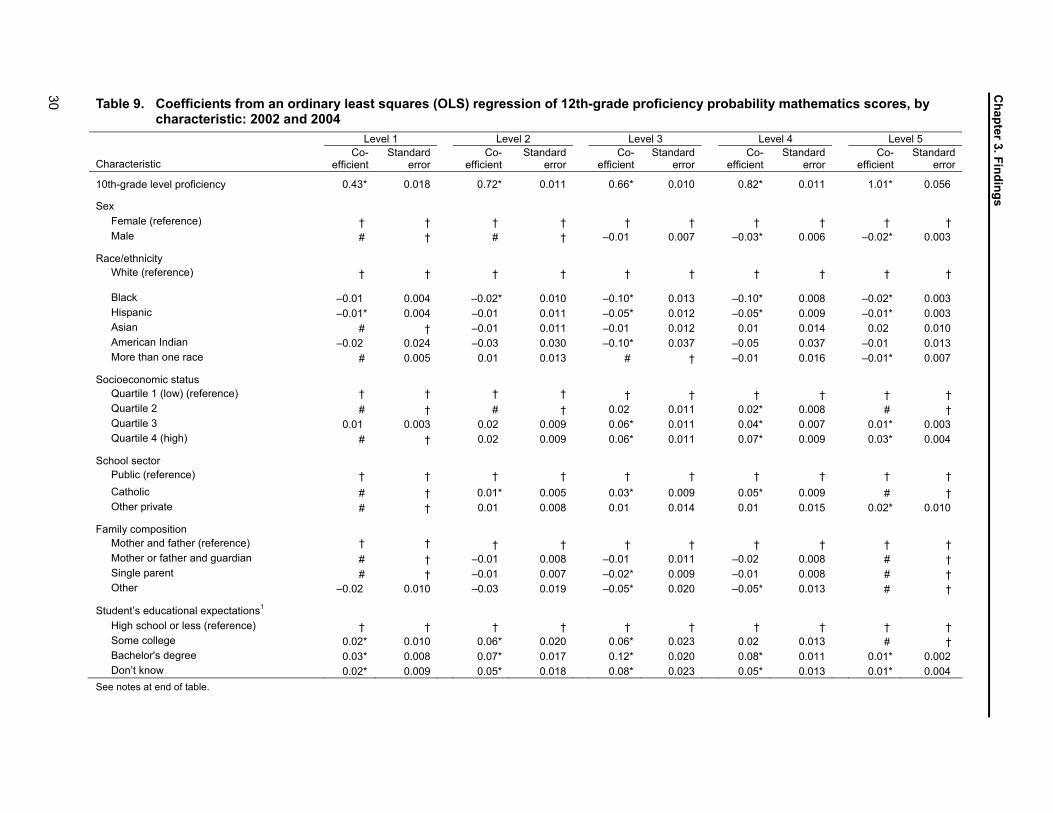
Chapter 3. Findings
30
Table 9. Coefficients from an ordinary least squares (OLS) regression of 12th-grade proficiency probability mathematics scores, by characteristic: 2002 and 2004
Level 1 Level 2 Level 3 Level 4 Level 5
Characteristic Co-
efficient Standard
error Co-
efficient Standard
error Co-
efficient Standard
error Co-
efficient Standard
error Co-
efficient Standard
error
10th-grade level proficiency 0.43* 0.018 0.72* 0.011 0.66* 0.010 0.82* 0.011 1.01* 0.056
Sex Female (reference) † † † † † † † † † † Male # † # † –0.01 0.007 –0.03* 0.006 –0.02* 0.003
Race/ethnicity White (reference) † † † † † † † † † †
Black –0.01 0.004
–0.02* 0.010
–0.10* 0.013
–0.10* 0.008
–0.02* 0.003
Hispanic –0.01* 0.004 –0.01 0.011 –0.05* 0.012 –0.05* 0.009 –0.01* 0.003 Asian # † –0.01 0.011 –0.01 0.012 0.01 0.014 0.02 0.010 American Indian –0.02 0.024 –0.03 0.030 –0.10* 0.037 –0.05 0.037 –0.01 0.013 More than one race # 0.005 0.01 0.013 # † –0.01 0.016 –0.01* 0.007
Socioeconomic status Quartile 1 (low) (reference) † † † † † † † † † † Quartile 2 # † # † 0.02 0.011 0.02* 0.008 # † Quartile 3 0.01 0.003 0.02 0.009 0.06* 0.011 0.04* 0.007 0.01* 0.003 Quartile 4 (high) # † 0.02 0.009 0.06* 0.011 0.07* 0.009 0.03* 0.004
School sector Public (reference) † † † † † † † † † † Catholic # † 0.01* 0.005 0.03* 0.009 0.05* 0.009 # † Other private # † 0.01 0.008 0.01 0.014 0.01 0.015 0.02* 0.010
Family composition Mother and father (reference) † † † † † † † † † † Mother or father and guardian # † –0.01 0.008 –0.01 0.011 –0.02 0.008 # † Single parent # † –0.01 0.007 –0.02* 0.009 –0.01 0.008 # † Other –0.02 0.010 –0.03 0.019 –0.05* 0.020 –0.05* 0.013 # †
Student’s educational expectations1 High school or less (reference) † † † † † † † † † † Some college 0.02* 0.010 0.06* 0.020 0.06* 0.023 0.02 0.013 # † Bachelor's degree 0.03* 0.008 0.07* 0.017 0.12* 0.020 0.08* 0.011 0.01* 0.002 Don’t know 0.02* 0.009 0.05* 0.018 0.08* 0.023 0.05* 0.013 0.01* 0.004
See notes at end of table.
Chapter 3. Findings
31
Table 9. Coefficients from an ordinary least squares (OLS) regression of 12th-grade proficiency probability mathematics scores, by characteristic: 2002 and 2004—Continued
Level 1 Level 2 Level 3 Level 4 Level 5
Characteristic Co-
efficient Standard
error Co-
efficient Standard
error Co-
efficient Standard
error Co-
efficient Standard
error Co-
efficient Standard
error Course sequence
No mathematics–no mathematics –0.03* 0.008 –0.09* 0.014 –0.15* 0.018 –0.06* 0.013 0.01* 0.002 Geometry–geometry/no mathematics # † –0.04* 0.014 –0.10* 0.018 –0.07* 0.011 # † Geometry–algebra II 0.01 0.004 0.02 0.018 0.02 0.023 –0.01 0.014 # † Algebra II–no mathematics (reference) † † † † † † † † † † Algebra II–algebra II/trigonometry 0.01 0.003 0.02 0.010 0.04* 0.015 0.18* 0.015 0.01* 0.004 Algebra II–precalculus 0.01 0.003 0.04* 0.012 0.07* 0.018 0.09* 0.016 # † Precalculus–no mathematics 0.01 0.004 # † 0.02 0.016 0.13* 0.020 0.01 0.009 Precalculus–calculus # † –0.02* 0.008 –0.01 0.016 0.17* 0.020 0.11* 0.020 Precalculus–AP/IB calculus # † –0.02* 0.007 –0.01 0.013 0.14* 0.017 0.20* 0.016 All other patterns –0.01* 0.003 –0.04* 0.008 –0.07* 0.012 0.03* 0.010 0.02* 0.003
Three mathematics courses or less 2002–2004 (reference) † † † † † † † † † †
More than 3 mathematics courses 2002–2004 0.01* 0.003 0.02* 0.007 0.03* 0.010 0.04* 0.010 0.01* 0.006 Constant 0.54* 0.020 0.23* 0.022 0.23* 0.024 0.09* 0.016 0.01* 0.005
N 9,456 † 9,456 † 9,456 † 9,456 † 9,456 † Adjusted R-squared 0.49 † 0.70 † 0.64 † 0.72 † 0.47 † † Not applicable. # Rounds to zero. * p < .05. 1 Educational expectations of 10th-grade students. NOTE: Black includes African American, Hispanic includes Latino, Asian includes Native Hawaiian or Other Pacific Islander, and American Indian includes Alaska Native. AP/IB calculus = Advanced Placement/International Baccalaureate calculus. Proficiency Levels are: Level 1—simple arithmetical operations on whole numbers, such as simple arithmetic expressions involving multiplication or division of integers; Level 2—simple operations with decimals, fractions, powers, and roots, such as comparing expressions, given information about exponents; Level 3—simple problem solving, requiring the understanding of low-level mathematical concepts, such as simplifying an algebraic expression or comparing the length of line segments illustrated in a diagram; Level 4—understanding of intermediate-level mathematical concepts and/or multistep solutions to word problems such as drawing an inference based on an algebraic expression or inequality; and Level 5—complex multistep word problems and/or advanced mathematics material such as a two-step problem requiring evaluation of functions. SOURCE: U.S. Department of Education, National Center for Education Statistics, Education Longitudinal Study of 2002 (ELS:2002), “Base Year, 2002” and “First Follow-up, 2004.”

33
Chapter 4 Conclusion
This study finds that at the end of their high school years, American students increase their knowledge in mathematics—mostly in intermediate-level skills and concepts. The majority of students enter their junior year with a solid proficiency in lower-level skills such as whole numbers, fractions, and decimals, and improve their understanding of intermediate skills and concepts such as algebraic relationships and logic. Despite these overall gains, most do not graduate with a solid foundation in the most advanced skills, such as derivations and multistep problems. At this level, only 4 percent are proficient, up 3 percentage points from the end of sophomore year.
This study, using data from the Education Longitudinal Study of 2002 (ELS:2002), yields mixed information on the relationships between coursetaking and learning. On the one hand, students who reach the most advanced courses such as precalculus and calculus before leaving high school are more likely to learn the most advanced skills and concepts. On the other hand, the lion’s share of learning that takes place at the end of high school is predicted by background characteristics and curricular experiences that precede the start of junior year.27 Each of these is discussed in turn.
Much like the bulk of previous research, this study finds that students who take advanced courses such as precalculus and algebra II learn more than their peers who take intermediate courses such as geometry and those who do not take mathematics courses. However, this study extends previous research by using scaled scores that permit an assessment of the specific skills and concepts being learned. While there is evidence of learning gains in mathematics during the last 2 years of high school across the board, students who follow a geometry–algebra II sequence or an algebra II–trigonometry sequence show the greatest improvement in intermediate skills, such as operations with whole numbers and basic algebraic expressions, while students who follow an algebra II–precalculus sequence or a precalculus–calculus sequence show the greatest improvements in advanced skills such as multistep analytical problems. These effects were robust when included in regression models that controlled for prior learning and key background characteristics.
While mathematics course sequences are associated with learning, most of 12th-grade achievement is explained by background factors and previous learning; mathematics courses at the end of high school explain little of the variation in achievement once background factors and previous achievement are included as controls. This is likely because these background factors and previous learning experiences are linked with their coursetaking patterns. Indeed, differences in coursetaking follow a pattern that is well documented by social scientists and replicated here in the ELS:2004 data. Students with more socioeconomic and educational resources—students from affluent families, students in two-parent homes, students who attend private schools, and students who have ambitious educational expectations—are more likely to reach the most advanced mathematics courses. Their experiences and instruction at earlier stages in schooling
27 Eighty-one percent of the variation in 12th-grade number-right scores is explained by sociodemographic characteristics and 10th-grade number-right scores.
Chapter 4. Conclusion
34
likely gives them the foundational skills to move through the hierarchy at a pace that ensures their enrollment in courses like precalculus and calculus.
Despite the strengths of this study—for example, the longitudinal design, course information from administrative records, and assessments scaled to different proficiency levels—ELS:2002, like many National Center for Education Statistics (NCES) data sets, is observational. As such, students were not randomly assigned to schools, classrooms, or course sequences—limiting the ability to establish a causal link between coursetaking and learning. Regression procedures were used to estimate the relationship between coursetaking and learning controlling for prior achievement and other observed characteristics known to shape students’ placement in different tracks/courses. Though the effects of course sequences were robust when all control variables were included, there may have been other unmeasured characteristics (e.g., student motivation, teacher engagement, etc.) that may have caused both course sequence placement and learning, thus making the relationship between coursetaking and learning spurious.
Another limitation to the study is that the course sequences for 45 percent of the analytic sample could not be examined because there were too few cases to make valid generalizations. It could well be the case that some of these course sequences are more beneficial at improving mathematics proficiency than those identified in this report. The small sample sizes, however, preclude a thorough examination of every curricular pathway undertaken by American high school students. Additionally, by creating course sequences from two separate courses, it is not possible to assess the strength of the relationship of each individual course with mathematics achievement. Lastly, compared with the target population, the analytic sample used in this study has higher proportions of White students, students who expect to attain a bachelor’s degree or higher, and students living with both their father and their mother. Readers should keep these caveats in mind when interpreting the results and conclusions of this report.
In closing, this study shows that in the last 2 years of high school, American students are improving in mathematics, but that there is room for further improvement. Proficiency scores show that by the end of high school some 38 percent had mastered intermediate mathematics skills, as compared to 25 percent of the sample 2 years before. However, only 4 percent had mastered advanced skills and concepts, compared to 1 percent 2 years earlier. This study shows that the mathematics achievement gains registered between sophomore and senior year are associated with specific coursetaking sequences. In turn, different sequences are related to the proficiency level at which the gains are taking place. The largest gains in intermediate skills were made by students who followed an algebra II-geometry sequence. The largest gains in advanced skills were made by students who followed a sequence that included precalculus paired with algebra II, calculus, or Advanced Placement/International Baccalaureate calculus. At the same time, this study shows that despite the significant relationship between mathematics coursetaking sequences and achievement gain, a greater amount of the variation in learning at the end of high school is explained by factors that precede enrollment in these coursetaking sequences.
35
ReferencesAllison, P.D. (1990). Change Scores as Dependent Variables in Regression Analysis.
Sociological Methodology 20: 93-114.
Bae, Y., Choy, S., Geddes, C. Sable, J. and Snyder, T. (2000). Educational Equity for Girls and Women (NCES 2000-030). National Center for Education Statistics, U.S. Department of Education. Washington, DC: U.S. Government Printing Office.
Berends, M., Lucas, S.R., and Briggs, R.J. (2002, March). Effects of Curricular Differentiation on Student Achievement: Longitudinal Analyses of High School Students. Invited paper presented at the Research Seminar II: Instructional and Performance Consequences of High-Poverty Schooling, The Charles Sumner School, Washington, DC.
Burkam, D.T., and Lee, V. (2003). Mathematics, Foreign Language, and Science Coursetaking and the NELS:88 Transcript Data (NCES 2003-01). National Center for Education Statistics, Institute of Education Sciences, U.S. Department of Education. Washington, DC: U.S. Government Printing Office.
Cahalan, M.W., Ingels, S.J., Burns, L.J., Planty, M., and Daniel, B. (2006). United States High School Sophomores: A Twenty-Two Year Comparison, 1980–2002 (NCES 2006-327). National Center for Education Statistics, Institute of Education Sciences, U.S. Department of Education. Washington, DC: U.S. Government Printing Office.
Carbonaro, W. (2005). Tracking, Student Effort, and Academic Achievement. Sociology of Education 78: 27-49.
Cohen, J. (1988). Statistical Power Analysis for the Behavioral Sciences (2nd ed.). Hillsdale, NJ: Erlbaum.
Coleman, J.S., and Hoffer, T. (1987). Public and Private High Schools: The Impact of Communities. New York: Basic Books.
Council of Chief State School Officers (CCSSO) (2004). State Indicators of Science and Mathematics Education 2004. Washington, DC: Author.
Dalton, B., Ingels, S., Downing, J., and Bozick, R. (2007). Moving Beyond the Basics: Advanced Mathematics and Science Coursetaking in the High School Classes of 1982, 1992, and 2004 (NCES 2007-312). National Center for Education Statistics, Institute of Education Sciences, U.S. Department of Education. Washington, DC: U.S. Government Printing Office.
Embretson, S.E., and Reise, S. (2000). Item Response Theory for Psychologists. Mahwah, NJ: Erlbaum.
Finkel, S.E. (1995). Causal Analysis with Panel Data. Thousand Oaks, CA: Sage Publications.
References
36
Fleiss, J.L., Levin, B.A., and Paik, M.C. (2003). Statistical Methods for Rates and Proportions(3rd ed.). New York: Wiley Series in Probability and Statistics.
Gamoran, A. (1987) The Stratification of High School Learning Opportunities. Sociology of Education 60: 135-155.
Hallinan, M.T. (1994). School Differences in Tracking Effects on Achievement. Social Forces72: 799-820.
Halpern, D., Aronson, J., Reimer, N., Simpkins, S., Star, J., and Wentzel, K. (2007). EncouragingGirls in Math and Science (NCER 2007-2003). National Center for Education Statistics, Institute of Education Sciences, U.S. Department of Education. Washington, DC: U.S. Government Printing Office. Retrieved from http://ncer.ed.gov.
Hambleton, R.K., Swaminathan, H., and Rogers, H.J. (1991). Fundamentals of Item Response Theory. Newbury Park, CA: Sage Publications.
Hoffer, T., Rasinski, K., and Moore, W. (1995). Social Background Differences in High School Mathematics and Science Coursetaking and Achievement (NCES 95-206). National Center for Education Statistics, U.S. Department of Education. Washington, DC: U.S. Government Printing Office.
Ingels, S.J., Pratt, D.J., Rogers, J., Siegel, P.H., and Stutts, E.S. (2005). Education Longitudinal Study of 2002: Base-Year to First Follow-up Data File Documentation (NCES 2006-344). National Center for Education Statistics, Institute of Education Sciences, U.S. Department of Education. Washington, DC: U.S. Government Printing Office.
Kao, G., and Thompson, J.S. (2003). Racial and Ethnic Stratification in Educational Achievement and Attainment. Annual Review of Sociology 29: 417-442.
Lee, V.E., Burkam, D.T., Chow-Hoy, T., Geverdt, D., and Smerdon, B.A. (1998). Sector Differences in High School Course Taking: A Private School or Catholic School Effect? Sociology of Education 71: 314-335.
Lemke, M., Sen, A., Pahlke, E., Partelow, L., Miller, D., Williams, T., Kastberg, D., and Jocelyn, L. (2004). International Outcomes of Learning in Mathematics Literacy and Problem Solving: PISA 2003 Results From the U.S. Perspective (NCES 2005-003). National Center for Education Statistics, Institute of Education Sciences, U.S. Department of Education. Washington, DC: U.S. Government Printing Office.
Leow, C., Marcus, S., Zanutto, E., and Boruch, R. (2004). Effects of Advanced Course-Taking on Math and Science Achievement: Addressing Selection Bias Using Propensity Scores. American Journal of Evaluation 25: 461-478.
Maris, E. (1998). Covariance Adjustment versus Gain Scores—Revisited. PsychologicalMethods 3: 309-327.
References
37
Morgan, S.L., and Sorenson, A. (1999). A Test of Coleman’s Social Capital Explanation of School Effects. American Sociological Review 64: 661-681.
Oakes, J. (1985). Keeping Track: How Schools Structure Inequality. New Haven, CT: Yale University Press.
Oakes, J. (1990). Opportunities, Achievement, and Choice: Women and Minority Students in Science and Mathematics. Review of Research in Education 16: 153-222.
Pallas, A.M., and Alexander, K.L. (1983). Sex Differences in Quantitative SAT Performance: New Evidence on the Differential Coursework Hypothesis. American Educational Research Journal 20: 165-182.
Perkins, R., Kleiner, B., Roey, S., Brown, J. (2004). The High School Transcript Study: A Decade of Change in Curricula and Achievement, 1990–2000 (NCES 2004-455). National Center for Education Statistics, Institute of Education Sciences, U.S. Department of Education. Washington, DC: U.S. Government Printing Office.
Rock, D.A., Owings, J., and Lee, R. (1994). Changes in Math Proficiency between 8th and 10th Grades (NCES 93-455). National Center for Education Statistics, U.S. Department of Education. Washington, DC: U.S. Government Printing Office.
Rock, D.A., and Pollack, J.M. (1995a). Mathematics Course-taking and Gains in Mathematics Achievement (NCES 95-714). National Center for Education Statistics, U.S. Department of Education. Washington, DC: U.S. Government Printing Office.
Rock, D.A., and Pollack, J.M. (1995b). Psychometric Report for the NELS:88 Base Year Through Second Follow-Up (NCES 95-382). National Center for Education Statistics, U.S. Department of Education. Washington, DC: U.S. Government Printing Office.
Schneider, B., Swanson, C.B., and Riegle-Crumb, C. (1998). Opportunities for Learning: Course Sequences and Positional Advantages. Social Psychology of Education 2: 25-53.
Scott, L.S., Rock, D.A., Pollack, J.M., and Ingels, S.J. (1995). Two Years Later: Cognitive Gains and School Transitions of NELS:88 Eighth Graders (NCES 95-436). National Center for Education Statistics, U.S. Department of Education. Washington, DC: U.S. Government Printing Office.
Seastrom, M. (2003). NCES Statistical Standards (NCES 2003-601). National Center for Education Statistics, Institute of Education Sciences, U.S. Department of Education. Washington, DC: U.S. Government Printing Office. Available: http://nces.ed.gov/pubsearch/pubsinfo.asp?pubid=2003601.
StataCorp (2004). Stata Statistical Software: Release 8.0 User’s Guide. College Station, TX: Stata Corporation.
Stevenson, D.L., Schiller, K.S., and Schneider, B. (1994). Sequences of Opportunities for Learning. Sociology of Education 67: 184-198.

References
38
U.S. Department of Education (1997). The Condition of Education 1997 (NCES 97-388). National Center for Education Statistics, U.S. Department of Education. Washington, DC: U.S. Government Printing Office.
Wang, J., and Goldschmidt, P. (2003). Importance of Middle School Mathematics on High School Students’ Mathematics Achievement. The Journal of Educational Research 97: 3-19.
A-1
Appendix A Technical Notes and Glossary

Appendix A. Technical Notes and Glossary
A-3
A.1 Design and Implementation of the Education Longitudinal Study of 2002 (ELS:2002)
The National Center for Education Statistics (NCES) of the U.S. Department of Education has collected longitudinal data for more than 30 years. Starting in 1972 with the National Longitudinal Study of the High School Class of 1972 (NLS:72) and continuing to the most recent study, the Education Longitudinal Study of 2002 (ELS:2002), NCES has collected longitudinal and trend data on the achievement and experiences of high school students, as well as postsecondary outcomes such as entry into the labor market and college enrollment and persistence.
The base year of ELS:2002 was the first stage of a new effort designed to provide data about critical transitions experienced by a cohort of sophomores in 2002 as they proceed through high school and into postsecondary education and/or their careers. The 2002 sophomore cohort was surveyed again in 2004. Starting in 2006, future follow-ups will collect data about postsecondary access and choices, postsecondary attainment, entry into the work force, family formation, voting, volunteerism, and life goals and values.
This appendix provides an overview of the base-year (BY) and first follow-up study (F1) design and methodology. This appendix also provides information on the statistical procedures employed and supplies a glossary that documents the analysis variables used in this report. Appendix B includes tables of standard errors. In addition, it reports weighted standard deviations and raw sample sizes for all means reported in tables of estimates.
A.2 Overview of ELS:2002
A.2.1 Study Objectives ELS:2002 is a longitudinal study, in which the same individuals are surveyed repeatedly
over time. Individual students are expected to be followed until about age 30; the base-year schools have been surveyed twice (they were surveyed in 2002 and again in 2004). In the high school years, ELS:2002 is an integrated multilevel study, involving multiple respondent populations, including students, their parents, their teachers, and their schools (from which data are collected at three levels: from the principal, the librarian, and a facilities checklist). This multilevel focus supplies researchers with a comprehensive picture of the students’ home, community, and school environments. This multiple-respondent perspective is unified by the fact that, for most purposes, the student is the basic unit of analysis.
The analyses presented in this report use data from the base-year and first follow-up components. Key elements from these components are summarized below.
Base Year (2002) • Baseline survey of high school sophomores.
• Cognitive tests in reading and mathematics.
• Surveys of parents, school administrators, English teachers, and mathematics teachers.

Appendix A. Technical Notes and Glossary
A-4
• Additional components for this study included a school facilities checklist and a media center/library questionnaire.
• Sample sizes of approximately 750 participating schools and over 15,000 participating sophomores.
• Oversampling of Asians and private schools.
• Design linkages (test score equating in reading and mathematics, some questionnaire items in common) with the Program for International Student Assessment (PISA) and score reporting linkages to the prior longitudinal studies (the High School and Beyond longitudinal study [HS&B] and the National Education Longitudinal Study of 1988 [NELS:88]).
First Follow-up (2004) • Follow-up in spring-term 2004, when most sample members were seniors but some
were dropouts, early graduates, or in other grades.
• Student questionnaire, dropout questionnaire, assessment in mathematics, and school administrator questionnaire administered; specially tailored instruments for early graduates and homeschooled students.
• Interviewed students who remained in their base-year school as well as those who transferred, dropped out, graduated early, or transitioned into a homeschool setting.
• High school transcript component with data collection late 2004 through early 2005 (coursetaking records for grades 9–12). Course offerings information was also collected, for the base-year school sample.
A.2.2 Base-Year and First Follow-up Study Design and Content Base-year Study Design. Seven study components comprised the base-year design:
assessments of students (achievement tests in mathematics and reading); a survey of students; surveys of parents, teachers, school administrators, and librarians; and a facilities checklist (completed by survey administrators, based on their observations at the school). The student assessments measured achievement in mathematics and reading; the baseline scores can serve as a covariate or control variable for later outcomes. Mathematics achievement was reassessed in the first follow-up, so that achievement gain over the last 2 years of high school can be measured and related to school processes and mathematics coursetaking. The student questionnaire gathered information about the student’s background, school experiences and activities, plans and goals for the future, employment and out-of-school experiences, language background, and motivation toward learning.
One parent of each participating sophomore was asked to respond to a parent survey. The parent questionnaire was designed to gauge parental aspirations for the child, home background and the home education support system, the child’s educational history prior to 10th grade, and parental interactions with and opinions about the student’s school. For each student enrolled in English or mathematics, a teacher was also selected to participate in a teacher survey. Teachers typically (but not always) reported on multiple ELS:2002 sophomores. The teacher questionnaire collected the teacher’s evaluation of the student and provided information about the teacher’s background and activities. The head librarian or media center director at each school was asked
Appendix A. Technical Notes and Glossary
A-5
to complete a library media center questionnaire, which inquired into the school’s library media center facility, its staffing, its technological resources, collection and expenditures, and scheduling and transactions. Finally, the facilities checklist was a brief observational form completed for each school. The form collected information about the condition of school buildings and facilities.
First Follow-up Study Design. In the first follow-up, the base-year schools were surveyed by means of an administrator questionnaire. Base-year students were surveyed whether in the base-year school, in a new school, or out of school. A mathematics assessment was administered to first follow-up students who were still attending their original (base-year) schools. When possible, students who had dropped out, transferred schools, or entered a homeschool setting were surveyed, but were not administered mathematics assessments. Further details on the instrumentation, sample design, data collection results, data processing, weighting and imputation, and data files available for analysis may be found in the Education Longitudinal Study of 2002: Base-Year to First Follow-up Data File Documentation (Ingels et al. 2005).1
Transcript Study Design. Transcripts were collected from sample members in late 2004 and early 2005, about 6 months to 1 year after most students had graduated from high school. Collecting the transcripts in the 2004–05 academic year allowed for more complete high school records. Transcripts were collected from the school that the students were originally sampled from in the base year (which was the only school for most sample members) and from their last school of attendance if it was learned during the first follow-up student data collection that they had transferred.
The ELS:2002 high school transcript data collection sought key pieces of information about coursetaking from the student’s official high school record—including courses taken while attending secondary school, information on credits earned, year and term a specific course was taken, and final grades. When available, other information was collected, including dates enrolled, reason for leaving school, and standardized test scores. Once collected, information (e.g., course name, credits earned, course grades) was transcribed and linked back with the student’s questionnaire and assessment data. Due to the size and complexity of the file, and because of reporting variation by school, additional variables were constructed from the raw transcript file. Further details on the instrumentation, sample design, data collection results, data processing, weighting and imputation, and data files available for analysis may be found in the Education Longitudinal Study of 2002: First Follow-up Transcript Component Data File Documentation (Bozick et al. 2006).
A.3 Study Design
A.3.1 Sampling The ELS:2002 base-year sample design began with a nationally representative, two-stage
stratified probability sample. The first stage of selection was schools; schools were selected with probability proportional to size (PPS). The public school sample was stratified by the nine U.S. Census divisions and by urbanicity (metropolitan status of urban, suburban, or rural). Private
1 See appendix reference list for full citation. The base-year first follow-up Data File Documentation can be downloaded from the NCES website at http://nces.ed.gov/pubsearch. For more comprehensive information about the base year, see Ingels et al. (2004).
Appendix A. Technical Notes and Glossary
A-6
schools (Catholic and other private) were stratified by four levels of geography (Census region) and urbanicity; private schools were oversampled. The target sample size was 800 schools. Cooperation was sought from 1,220 eligible selections. The realized sample comprised 750 participating 10th-grade schools (67 percent participation rate). The second stage of selection was students. Of 17,590 sampled students in the schools, 15,360 students participated. Some groups (e.g., Asians, students in nonpublic schools) were oversampled. The weighted student response rate was 87 percent.
The first follow-up returned to the same schools to seek their cooperation, and to base-year sophomore respondents and a sample of base-year nonrespondents, regardless of whether they had remained in the base-year school. Although 5 of the 750 base-year schools were ineligible because they no longer enrolled ELS:2002 sample members or seniors, of the eligible schools, 700 (93 percent) participated. Overall, there were 16,520 sample members (students, dropouts, homeschooled, or early graduates), of whom 14,990 participated. This analysis uses the sample of 14,710 students who were sophomores in 2001–02, participated in both the BY and F1 interviews, completed the mathematics assessment in the BY and F1 interviews, and had complete transcript information for the 2002–03 and 2003–04 academic years. Students were in the same school in the base year and follow-up survey.
A.3.2 Weighting and Imputation Weighting. A number of weights are included on the ELS:2002 data file to compensate
for unequal probabilities of selection of schools and students into the base-year sample and to adjust for the fact that not all schools and students selected into the sample actually participated. The analyses in this report are weighted with the panel weight (F1PNLWT), which accommodates analyses using sample members who participated in both the base year and first follow-up.
Imputation. For key classification variables used in this analysis, missing data were replaced with imputed values. These include: sex, race/ethnicity, family composition, educational expectations, and socioeconomic status. Single imputation (by means of a weighted sequential hot deck procedure) was implemented for missing key questionnaire variables. Multiple imputation of the mathematics ability estimate theta (theta is the point on the test scale that marks the ability of the test taker) was used to treat missing assessment data. Although (for several classes of respondents) missing test scores were imputed in ELS:2002, imputed test data have not been used in this report. Only students with two unimputed test scores are included in the analysis sample.
A.3.3 Base-Year and First Follow-up Response Rates Base-year Response Rates. Of 1,220 eligible contacted schools, 750 participated in the
study, for an overall weighted school participation rate of approximately 68 percent (62 percent unweighted). Of 17,590 selected eligible students, 15,360 participated, for a weighted student response rate of approximately 87 percent.2 (School and student weighted response rates reflect use of the base weight [design weight] and do not include nonresponse adjustments.) School and student unit nonresponse bias analyses were performed, as well as an item nonresponse bias
2 Stage 1 (school) response rates can be multiplied by stage 2 (student) response rates for a combined two-stage response rate: 68 percent * 87 percent = 59 percent.
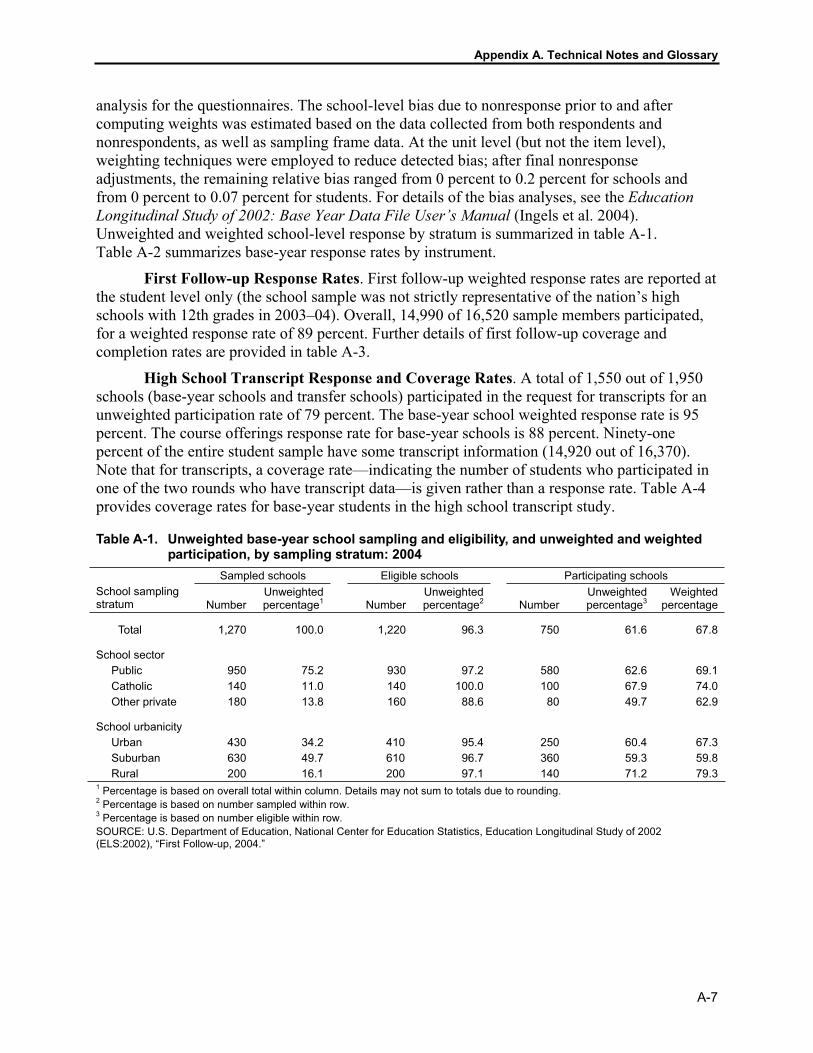
Appendix A. Technical Notes and Glossary
A-7
analysis for the questionnaires. The school-level bias due to nonresponse prior to and after computing weights was estimated based on the data collected from both respondents and nonrespondents, as well as sampling frame data. At the unit level (but not the item level), weighting techniques were employed to reduce detected bias; after final nonresponse adjustments, the remaining relative bias ranged from 0 percent to 0.2 percent for schools and from 0 percent to 0.07 percent for students. For details of the bias analyses, see the EducationLongitudinal Study of 2002: Base Year Data File User’s Manual (Ingels et al. 2004). Unweighted and weighted school-level response by stratum is summarized in table A-1. Table A-2 summarizes base-year response rates by instrument.
First Follow-up Response Rates. First follow-up weighted response rates are reported at the student level only (the school sample was not strictly representative of the nation’s high schools with 12th grades in 2003–04). Overall, 14,990 of 16,520 sample members participated, for a weighted response rate of 89 percent. Further details of first follow-up coverage and completion rates are provided in table A-3.
High School Transcript Response and Coverage Rates. A total of 1,550 out of 1,950 schools (base-year schools and transfer schools) participated in the request for transcripts for an unweighted participation rate of 79 percent. The base-year school weighted response rate is 95 percent. The course offerings response rate for base-year schools is 88 percent. Ninety-one percent of the entire student sample have some transcript information (14,920 out of 16,370). Note that for transcripts, a coverage rate—indicating the number of students who participated in one of the two rounds who have transcript data—is given rather than a response rate. Table A-4 provides coverage rates for base-year students in the high school transcript study.
Table A-1. Unweighted base-year school sampling and eligibility, and unweighted and weighted participation, by sampling stratum: 2004
Sampled schools Eligible schools Participating schools School sampling stratum Number
Unweighted percentage1 Number
Unweighted percentage2 Number
Unweighted percentage3
Weighted percentage
Total 1,270 100.0 1,220 96.3 750 61.6 67.8
School sector Public 950 75.2 930 97.2 580 62.6 69.1 Catholic 140 11.0 140 100.0 100 67.9 74.0 Other private 180 13.8 160 88.6 80 49.7 62.9
School urbanicity Urban 430 34.2 410 95.4 250 60.4 67.3 Suburban 630 49.7 610 96.7 360 59.3 59.8 Rural 200 16.1 200 97.1 140 71.2 79.3
1 Percentage is based on overall total within column. Details may not sum to totals due to rounding. 2 Percentage is based on number sampled within row. 3 Percentage is based on number eligible within row. SOURCE: U.S. Department of Education, National Center for Education Statistics, Education Longitudinal Study of 2002 (ELS:2002), “First Follow-up, 2004.”
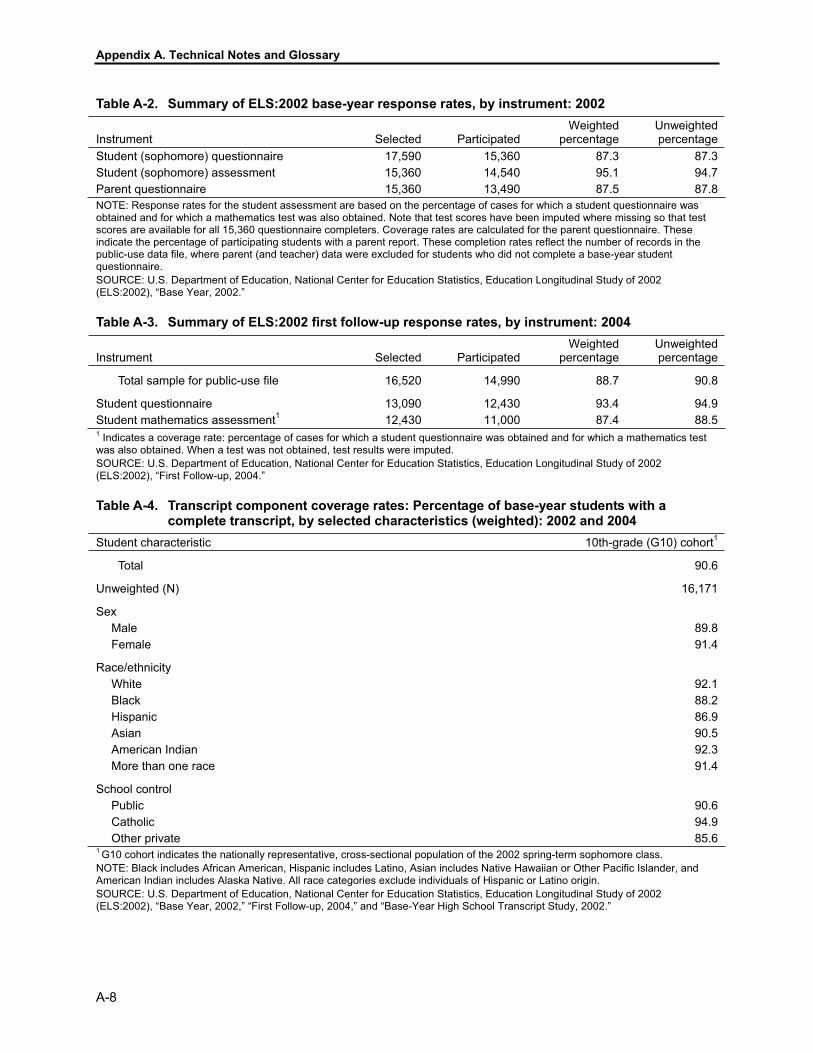
Appendix A. Technical Notes and Glossary
A-8
Table A-2. Summary of ELS:2002 base-year response rates, by instrument: 2002
Instrument Selected Participated Weighted
percentage Unweighted percentage
Student (sophomore) questionnaire 17,590 15,360 87.3 87.3 Student (sophomore) assessment 15,360 14,540 95.1 94.7 Parent questionnaire 15,360 13,490 87.5 87.8 NOTE: Response rates for the student assessment are based on the percentage of cases for which a student questionnaire was obtained and for which a mathematics test was also obtained. Note that test scores have been imputed where missing so that testscores are available for all 15,360 questionnaire completers. Coverage rates are calculated for the parent questionnaire. Theseindicate the percentage of participating students with a parent report. These completion rates reflect the number of records in the public-use data file, where parent (and teacher) data were excluded for students who did not complete a base-year student questionnaire.SOURCE: U.S. Department of Education, National Center for Education Statistics, Education Longitudinal Study of 2002 (ELS:2002), “Base Year, 2002.”
Table A-3. Summary of ELS:2002 first follow-up response rates, by instrument: 2004
Instrument Selected Participated Weighted
percentage Unweighted percentage
Total sample for public-use file 16,520 14,990 88.7 90.8
Student questionnaire 13,090 12,430 93.4 94.9 Student mathematics assessment1 12,430 11,000 87.4 88.5 1 Indicates a coverage rate: percentage of cases for which a student questionnaire was obtained and for which a mathematics testwas also obtained. When a test was not obtained, test results were imputed. SOURCE: U.S. Department of Education, National Center for Education Statistics, Education Longitudinal Study of 2002 (ELS:2002), “First Follow-up, 2004.”
Table A-4. Transcript component coverage rates: Percentage of base-year students with a complete transcript, by selected characteristics (weighted): 2002 and 2004
Student characteristic 10th-grade (G10) cohort1
Total 90.6
Unweighted (N) 16,171
Sex Male 89.8Female 91.4
Race/ethnicity White 92.1Black 88.2Hispanic 86.9Asian 90.5American Indian 92.3More than one race 91.4
School control Public 90.6Catholic 94.9Other private 85.6
1 G10 cohort indicates the nationally representative, cross-sectional population of the 2002 spring-term sophomore class. NOTE: Black includes African American, Hispanic includes Latino, Asian includes Native Hawaiian or Other Pacific Islander, and American Indian includes Alaska Native. All race categories exclude individuals of Hispanic or Latino origin. SOURCE: U.S. Department of Education, National Center for Education Statistics, Education Longitudinal Study of 2002 (ELS:2002), “Base Year, 2002,” “First Follow-up, 2004,” and “Base-Year High School Transcript Study, 2002.”
Appendix A. Technical Notes and Glossary
A-9
A.3.4 Quality of Estimates: Reliability and Validity of ELS:2002 Questionnaire and Transcript Data
Most of the items used in the ELS:2002 questionnaires were taken from prior studies, particularly HS&B and NELS:88. Given their past use with large, nationally representative samples, their measurement characteristics are well established. A number of data quality studies have been conducted using these items. Interested readers should see, in particular, Fetters, Stowe, and Owings (1984), Kaufman and Rasinski (1991), and McLaughlin and Cohen (1997). Data quality analyses for the subset of new questionnaire items used in ELS:2002 (as well as the reading and mathematics assessments) can be found in the base-year field test report (Burns et al. 2003). The base-year and base-year to first follow-up data documentation manuals (Ingels et al. 2004, 2005) also address issues of questionnaire and assessment data quality for both the ELS:2002 baseline and its first follow-up, while Bozick et al. (2006) address similar issues for the high school transcript component of the study. Data quality for the mathematics assessments is discussed in section A.5 of this appendix. While transcript data are assumed to be superior to student self-report data (the degree of difference between records sources and questionnaire responses is set out in Fetters, Stowe and Owings [1984]), archival records are not infallible data sources. Apart from problems of nonresponse (although response rates for the ELS:2002 transcript collection were high), a major records-gathering problem with a mobile longitudinal cohort is incompleteness of data. Some 14 percent of transcript respondents do not have 4 “complete” years of high school records information (Bozick et al. 2006). However, the problem of incompleteness in part reflects the fact that some records are necessarily incomplete (dropouts and those who failed to graduate with their cohort members by definition have incomplete high school records). Apart from the necessarily incomplete records of students who dropped out or did not advance in modal sequence of the cohort, full records were substantially more difficult to obtain for transfer students than for students who did not move to a new school. Since dropouts, held back, and transfer students are not represented in the analyses in this report, these nonresponse factors are substantially mitigated.
A.3.5 Survey Standard Errors Because the ELS:2002 sample design involved stratification, the disproportionate
sampling of certain strata, and clustered (i.e., multistage) probability sampling, the resulting statistics are more variable than they would have been if they had been based on data from a simple random sample of the same size. In all analyses in this report, standard errors were adjusted for the clustered and stratified sampling design using Taylor-series linearization methods.
A.4 Statistical Procedures
A.4.1 Statistical Significance: Student t Statistics Comparisons that have been discussed in the text of this report have been tested for
statistical significance (set at a probability of .05) to ensure that the differences are larger than those that might be expected due to sampling variation. The statistical comparisons in this report were based largely on the t statistic. Whether the statistical test is considered significant is determined by calculating a t value for the difference between a pair of means or proportions and

Appendix A. Technical Notes and Glossary
A-10
comparing this value to published tables of values, called critical values. The alpha level is an apriori statement of the probability that a difference exists in fact rather than by chance.
The t statistic between estimates from various subgroups presented in the tables can be computed by using the following formula:
( )22
21
21
SESE
xxt+
−= ,
where x1 and x2 are the estimates to be compared (e.g., the means of sample members in two groups), and SE1 and SE2 are their corresponding standard errors. This formula is valid only for independent estimates.
An F-test was used to compare the fit of two regression models. This test is computed using the following formula:
)()(
)()()()(
FulldfFullSSE
FulldfducedRedfFullSSEucedRedSSE
F −−
=
where Reduced is the model with fewer independent variables, Full is the model with all the independent variables, SSE is the sum square of errors, and df is the degrees of freedom. For this test the degrees of freedom are n – k , where n = the sample size and k = the number of parameters in the model. A significant F statistic indicates that the Full model is a better fit to the data than the Reduced model.
A.4.2 Effect Sizes For means (which in this report are scores from the ELS:2002 mathematics assessment),
an effect size (or standardized mean difference) has been calculated. The effect size stands as a measure of the magnitude of a difference. For purposes of comparisons drawn in this report, effect sizes (Cohen’s d) were calculated as the change in mean test scores divided by their pooled standard deviation using the following formula
2)1()1(
21
222
211
21
−+−+−
−=
nnnn
xxdσσ
A criterion of one-fifth (d = 0.2) of a standard deviation was set as the minimum effect size. Differences were only reported in the text if the comparison met two criteria: (1) statistical significance at the .05 level; and (2) the difference was greater than one-fifth of a standard deviation. For purposes of evaluating effect sizes, the proficiency probability scores, like the Item Response Theory (IRT) number-right scores, have been treated as means, and are subject to the 0.2 required effect size. For proportions, this report has adopted a simple convention of

Appendix A. Technical Notes and Glossary
A-11
reporting differences only if they are 5 percentage points or more. The effect size criterion was used because with large samples, such as the one in ELS:2002, a level of statistical significance can be reached based on differences that may be small in magnitude.3
A.4.3 Multivariate Analysis: Ordinary Least Squares Regression Ordinary least squares (OLS) regression analyses were performed to describe the
relationship between math coursetaking and achievement after controlling for student and school characteristics (tables 8 and 9). The regression coefficients generated by the OLS procedure are interpreted as a slope. The regression coefficients, or slope, indicate how many units of change in the dependent variable occur for each unit change in the independent variable controlling for all other factors included in the model. A significant positive coefficient means that for every unit change in the independent variable there is a b units increase in the dependent variable. Conversely, a significant negative coefficient means that for every unit change in the independent variable there is a b units decrease in the dependent variable. T-test comparisons were conducted using the regression coefficients produced in the analyses. The same statistical significance criteria used in the bivariate analyses (p-value of .05 or less) was used. For example, in Model 2 in table 8, the regression coefficient for precalculus–AP/IB calculus is 4.2 and is significant at the .05 level—meaning that students who follow a precalculus–AP/IB calculus course sequence improve on the math achievement exam by 4.2 more correct answers than their peers who followed an algebra II–no mathematics course sequence.
A.5 Base-Year to First Follow-up Mathematics Tests
A.5.1 The 2002 and 2004 Mathematics Assessments The purpose of the ELS:2002 assessment battery is to provide measures of student
achievement in mathematics (and reading, tested in the base year only) that can be related to student background variables and educational processes, for individuals and for population subgroups. The reading and mathematics tests must provide accurate measurement of the status of individuals at a given point in time. In addition, the mathematics test must provide accurate measurement of the acquisition of mathematics skills over time. Test Design and Format
Test specifications for the ELS:2002 base year and first follow-up were adapted from frameworks used for NELS:88. There were two levels to the framework: content areas and cognitive processes. Mathematics tests contained items in arithmetic,4 algebra, geometry, data/probability, and advanced topics. The tests also reflected cognitive process categories of
3 For more information about effect sizes, see Cohen (1988), Murphy and Myers (2004), and Seastrom (2003, Guideline 5-1-4F). 4 For those familiar with National Assessment of Educational Progress (NAEP) terminology, it should be noted that the “arithmetic” content area in NELS:88 and ELS:2002 has essentially the same meaning as “number sense” or “number properties and operations” in NAEP. The NAEP 2005 “content strands” at grade 12 are similar to but subtly different from those in NELS:88 and ELS:2002—number, geometry and measurement, algebra, and data analysis and probability (National Assessment Governing Board [NAGB] 2004). The second dimension of the NAEP framework—akin to the cognitive process or skill categories in NELS:88 and ELS:2002—was historically known as “mathematical abilities” but in the 2005 framework appears as “mathematical complexity of items.” This framework dimension encompasses, at three levels of complexity, procedural knowledge and conceptual understanding as well as problem solving, reasoning, and communication.
Appendix A. Technical Notes and Glossary
A-12
skill/knowledge, understanding/comprehension, and problem solving. The test questions were selected from previous assessments: NELS:88, NAEP, and PISA. Most, but not all base-year items, were multiple choice (about 10 percent of the base-year mathematics items were open-ended). In the first follow-up, all items were multiple choice.
Both 10th-grade and 12th-grade items were field tested in 2001, and 12th-grade items were field tested again in 2003.5 Items were selected or modified based on field test results. Final forms were assembled based on psychometric characteristics and coverage of framework categories. On the NELS:88 mathematics framework, see Rock and Pollack 1991 (chapter 2); on its adaptation to ELS:2002, see Ingels et al. 2004 (section 2.2.2.1).
The ELS:2002 assessments were designed to maximize the accuracy of measurement that could be achieved in a limited amount of testing time, while minimizing floor and ceiling effects, by matching sets of test questions to initial estimates of students’ achievement. In the base year, this was accomplished by means of a two-stage test. In 10th grade, all students received a short multiple-choice routing test, scored immediately by survey administrators who then assigned each student to a low, middle, or high difficulty second-stage form, depending on the student’s number of correct answers in the routing test. In the 12th-grade administration, students were assigned to an appropriate test form based on their performance in 10th grade. Cut points for the 12th-grade low, middle, and high forms were calculated by pooling information from the field tests for 10th and 12th grades in 2001, the 12th-grade field test in 2003, and the 10th-grade national sample. Item and ability parameters were estimated on a common scale. Growth trajectories for longitudinal participants in the 2001 and 2003 field tests were calculated, and the resulting regression parameters were applied to the 10th-grade national sample. Test forms were designed to match the projected achievement levels of the lowest and highest 25 percent, and the middle 50 percent, of the base-year sample 2 years later. Each of the test form contained 32 multiple-choice items.
In the four tables immediately below (A-5 through A-8), content and process information6 is provided about the 73 unique items that comprise the base-year, and 59 items that comprise the first follow-up, mathematics assessments. Additional tables are presented later (A-9 and A-10) that break down assignments of items by content and process by test form, and thus show the extent of overlap (any given unique item may appear on one or more forms).7 TablesA-5 and A-6 show the numbers and percentages of unique test items devoted to each content area for the base-year and first follow-up test batteries. Tables A-7 and A-8 show the number and percentages of unique test items devoted to each cognitive process area.
5 For more details about the field tests, see Burns et al. (2003) (NCES 2003-03) and appendix J of the Base-Year to First Follow-up Data File Documentation, Ingels et al. (2005) (NCES 2006-344). 6 Content by process (cognitive behavior) matrices can be useful for giving some sense of how tests have been constructed but must be interpreted with caution. Robitaille et al. (1993) make the point that such grids somewhat oversimplify the interrelatedness of elements in the scheme. Knowledge and abilities or behavior in one area of mathematics are not unconnected to knowledge and skills in other areas, and this caveat needs to be kept in mind. As the National Assessment Governing Board has remarked on its 2005 NAEP mathematics framework (NAGB 2004, p. 7), its divisions “are not intended to separate mathematics into discrete elements. Rather, they are intended to provide a helpful classification scheme that describes the full spectrum of mathematical content assessed by NAEP. Classifying items into one primary content area is not always clear cut, but doing so brings us closer to the goal of ensuring that important mathematical concepts and skills are assessed in a balanced way.” 7 There was also overlap across waves, in that some items were used both in the base year and first follow-up.

Appendix A. Technical Notes and Glossary
A-13
Table A-5. Number and percentage of unique mathematics items in ELS:2002 base year, by content area: 2002
Content area Number of items Percentage of items Arithmetic 19 26.0 Algebra 17 23.3 Geometry/measurement 20 27.4 Data analysis, statistics/probability 9 12.3 Advanced topics1 8 11.0 1 “Advanced topics” includes precalculus and analytic geometry. NOTE: To provide overlap, some items appear on more than one test form. SOURCE: U.S. Department of Education, National Center for Education Statistics, Education Longitudinal Study of 2002 (ELS:2002), “Base Year, 2002.”
Table A-6. Number and percentage of unique mathematics items in ELS:2002 first follow-up, by content area: 2004
Content area Number of items Percentage of items Arithmetic 15 25.4 Algebra 17 28.8 Geometry/ measurement 17 28.8 Data analysis, statistics/probability 4 6.8 Advanced topics1 6 10.2 1 “Advanced topics” includes precalculus and analytic geometry. NOTE: To provide overlap, some items appear on more than one test form. SOURCE: U.S. Department of Education, National Center for Education Statistics, Education Longitudinal Study of 2002 (ELS:2002), “First Follow-up, 2004.”
Table A-7. Number and percentage of unique mathematics items per skill/cognitive process area in ELS:2002 base year, by process/skill specifications: 2002
Process/skill specifications Number of items Percentage of items Procedural skills/knowledge 23 31.5 Conceptual understanding 27 37.0 Problem solving 23 31.5 NOTE: To provide overlap, some items appear on more than one test form. SOURCE: U.S. Department of Education, National Center for Education Statistics, Education Longitudinal Study of 2002 (ELS:2002), “Base Year, 2002.”
Table A-8. Number and percentage of unique mathematics items per skill/cognitive process area in ELS:2002 first follow-up, by process/skill specifications: 2004
Process/skill specifications Number of items Percentage of items Procedural skills/knowledge 17 28.8 Conceptual understanding 26 44.1 Problem solving 16 27.1 NOTE: To provide overlap, some items appear on more than one test form. SOURCE: U.S. Department of Education, National Center for Education Statistics, Education Longitudinal Study of 2002 (ELS:2002), “First Follow-up, 2004.”
Table A-9 shows the number of mathematics test items per form in the base year and first follow-up. Again, forms were assigned on the basis of performance on a routing test in the base year, but were assigned on the basis of the base-year ability estimate in the first follow-up. While all examinees received a 32-item form in 2004, the number of items ranged from 40 to 42 in the base year, except for a handful of students who received the single-stage 23-item version of the base year assessment (this abbreviated version of the test was used at two schools that had too limited testing time available to administer the full version).
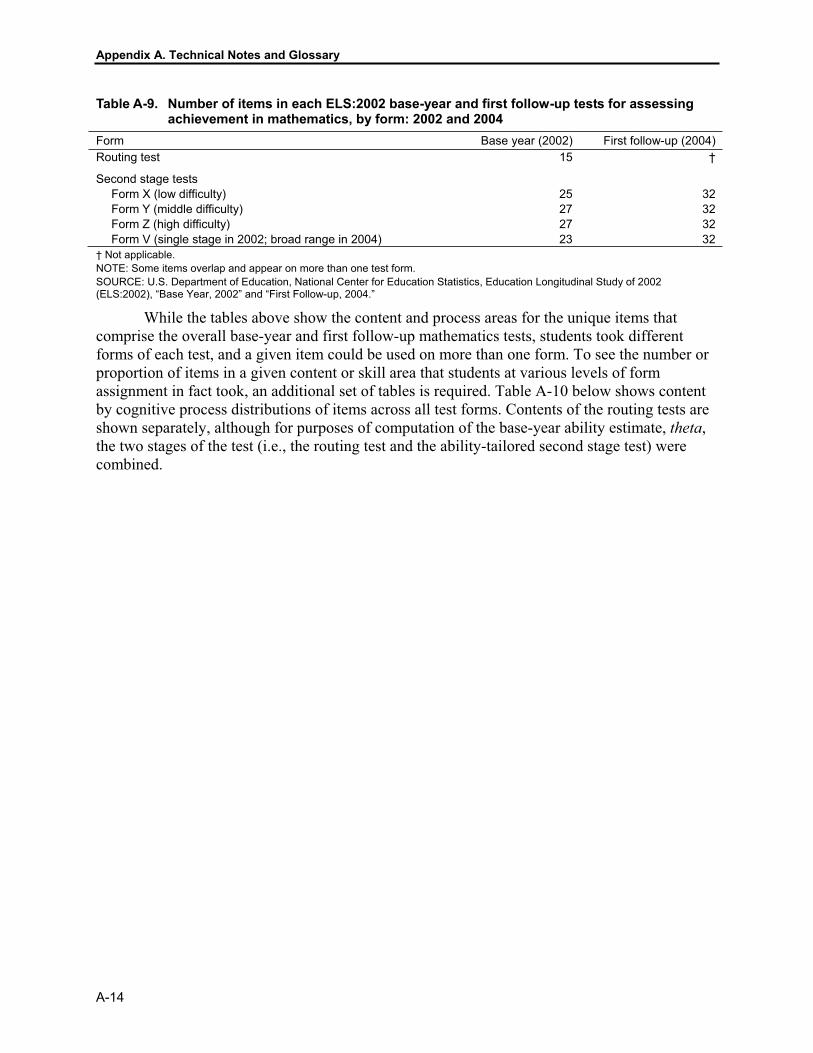
Appendix A. Technical Notes and Glossary
A-14
Table A-9. Number of items in each ELS:2002 base-year and first follow-up tests for assessing achievement in mathematics, by form: 2002 and 2004
Form Base year (2002) First follow-up (2004) Routing test 15 †
Second stage tests Form X (low difficulty) 25 32 Form Y (middle difficulty) 27 32 Form Z (high difficulty) 27 32 Form V (single stage in 2002; broad range in 2004) 23 32
† Not applicable. NOTE: Some items overlap and appear on more than one test form. SOURCE: U.S. Department of Education, National Center for Education Statistics, Education Longitudinal Study of 2002 (ELS:2002), “Base Year, 2002” and “First Follow-up, 2004.”
While the tables above show the content and process areas for the unique items that comprise the overall base-year and first follow-up mathematics tests, students took different forms of each test, and a given item could be used on more than one form. To see the number or proportion of items in a given content or skill area that students at various levels of form assignment in fact took, an additional set of tables is required. Table A-10 below shows content by cognitive process distributions of items across all test forms. Contents of the routing tests are shown separately, although for purposes of computation of the base-year ability estimate, theta,the two stages of the test (i.e., the routing test and the ability-tailored second stage test) were combined.
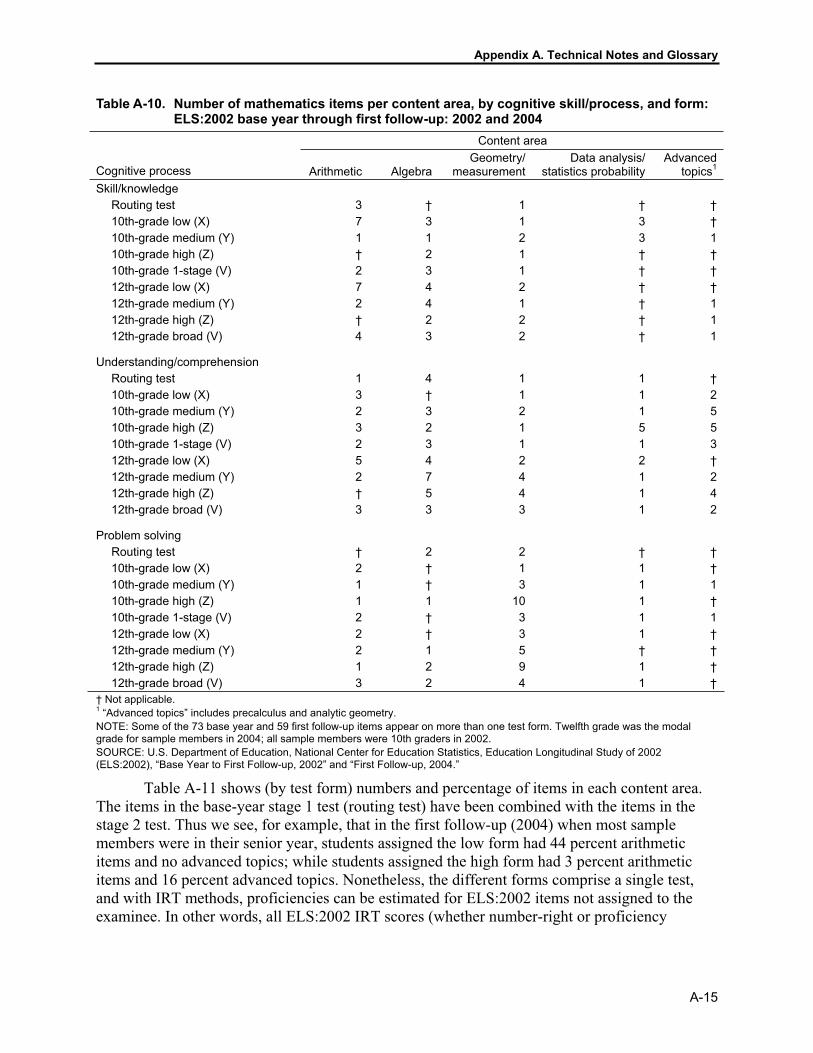
Appendix A. Technical Notes and Glossary
A-15
Table A-10. Number of mathematics items per content area, by cognitive skill/process, and form: ELS:2002 base year through first follow-up: 2002 and 2004
Content area
Cognitive process Arithmetic AlgebraGeometry/
measurement Data analysis/
statistics probability Advanced
topics1
Skill/knowledge Routing test 3 † 1 † † 10th-grade low (X) 7 3 1 3 † 10th-grade medium (Y) 1 1 2 3 1 10th-grade high (Z) † 2 1 † † 10th-grade 1-stage (V) 2 3 1 † † 12th-grade low (X) 7 4 2 † † 12th-grade medium (Y) 2 4 1 † 1 12th-grade high (Z) † 2 2 † 1 12th-grade broad (V) 4 3 2 † 1
Understanding/comprehension Routing test 1 4 1 1 † 10th-grade low (X) 3 † 1 1 2 10th-grade medium (Y) 2 3 2 1 5 10th-grade high (Z) 3 2 1 5 5 10th-grade 1-stage (V) 2 3 1 1 3 12th-grade low (X) 5 4 2 2 † 12th-grade medium (Y) 2 7 4 1 2 12th-grade high (Z) † 5 4 1 4 12th-grade broad (V) 3 3 3 1 2
Problem solving Routing test † 2 2 † † 10th-grade low (X) 2 † 1 1 † 10th-grade medium (Y) 1 † 3 1 1 10th-grade high (Z) 1 1 10 1 † 10th-grade 1-stage (V) 2 † 3 1 1 12th-grade low (X) 2 † 3 1 † 12th-grade medium (Y) 2 1 5 † † 12th-grade high (Z) 1 2 9 1 † 12th-grade broad (V) 3 2 4 1 †
† Not applicable. 1 “Advanced topics” includes precalculus and analytic geometry. NOTE: Some of the 73 base year and 59 first follow-up items appear on more than one test form. Twelfth grade was the modal grade for sample members in 2004; all sample members were 10th graders in 2002. SOURCE: U.S. Department of Education, National Center for Education Statistics, Education Longitudinal Study of 2002 (ELS:2002), “Base Year to First Follow-up, 2002” and “First Follow-up, 2004.”
Table A-11 shows (by test form) numbers and percentage of items in each content area. The items in the base-year stage 1 test (routing test) have been combined with the items in the stage 2 test. Thus we see, for example, that in the first follow-up (2004) when most sample members were in their senior year, students assigned the low form had 44 percent arithmetic items and no advanced topics; while students assigned the high form had 3 percent arithmetic items and 16 percent advanced topics. Nonetheless, the different forms comprise a single test, and with IRT methods, proficiencies can be estimated for ELS:2002 items not assigned to the examinee. In other words, all ELS:2002 IRT scores (whether number-right or proficiency

Appendix A. Technical Notes and Glossary
A-16
probability scores) measure student performance on the entire item pool regardless of which form they took.
Table A-11. Percentage distribution of ELS:2002 test items, by content area and mathematics test form: 2002
Content area
Arithmetic Algebra Geometry/
measurement Data analysis/
statistics/probability Advanced
topics Mathematics test form Percentage Number Percentage Number Percentage Number Percentage Number Percentage Number10th-grade low (X) 40.0 16 25.0 10 15.0 6 15.0 6 5.0 2 10th-grade medium (Y) 19.0 8 26.2 11 23.8 10 14.3 6 16.7 7 10th-grade high (Z) 11.9 5 31.0 13 38.1 16 7.1 3 11.9 5 10th-grade 1-stage (V) 26.1 6 26.1 6 21.7 5 8.7 2 17.4 4 12th-grade low (X) 43.8 14 21.9 7 25.0 8 9.4 3 0.0 0 12th-grade medium (Y) 18.8 6 37.5 12 31.3 10 3.1 1 9.4 3 12th-grade high (Z) 3.1 1 28.1 9 46.9 15 6.3 2 15.6 5 12th-grade broad (V) 31.3 10 25.0 8 28.1 9 6.3 2 9.4 3 NOTE: “Advanced topics” includes precalculus and analytic geometry. Detail may not sum due to rounding. Tenth-grade item summaries by forms X, Y, and Z combine the routing test and the second stage test. Twelfth grade was the model grade for sample members in 2004; all sample members were 10th-graders in 2002. SOURCE: U.S. Department of Education, National Center for Education Statistics, Education Longitudinal Study of 2002 (ELS:2002), “Base Year to First Follow-up, 2002.”
A.5.2 Scoring A.5.2.1 IRT Scoring Procedures
The scores used to describe students’ performance on the direct cognitive assessment are broad-based measures that report performance as a whole. The scores are based on Item Response Theory, which uses patterns of correct, incorrect, and omitted answers to obtain ability estimates that are comparable across different test forms.8 In estimating a student’s ability, IRT also accounts for each test question’s difficulty, discriminating ability, and a guessing factor.
IRT has several advantages over raw number-right scoring. By using the overall pattern of right and wrong responses to estimate ability, IRT can compensate for the possibility of a low-ability student guessing several difficult items correctly. If answers on several easy items are wrong, a correct difficult item is assumed, in effect, to have been guessed. Omitted items are also less likely to cause distortion of scores, as long as enough items have been answered right and wrong to establish a consistent pattern. Unlike raw number-right scoring, which necessarily treats omitted items as if they had been answered incorrectly, IRT procedures use the pattern of responses to estimate the probability of correct responses for all test questions. Finally, IRT scoring makes it possible to compare scores obtained from test forms of different difficulty. The common items present in overlapping forms and in overlapping administrations (10th grade and 12th grade) allow test scores to be placed on the same scale.
In the ELS:2002 first follow-up survey, IRT procedures were used to estimate longitudinal gains in achievement over time by using common items present in both the 10th- and 12th-grade forms. Items were pooled from both the 10th- and 12th-grade administrations and anchored to the IRT scale of the NELS:88 survey of 1988–92. Item parameters were fixed at NELS:88 values for the items that had been taken from the NELS:88 test battery and to base-year values for non-NELS:88 items. In each case, the fit of the follow-up item response data to
8 For an account of Item Response Theory, see Embretson and Reise (2000) or Hambleton, Swaminathan, and Rogers (1991).

Appendix A. Technical Notes and Glossary
A-17
the fixed parameters was evaluated, and parameters for common items whose current performance did not fit previous patterns were re-estimated, along with non-NELS:88 items new to the follow-up tests. A.5.2.2 Score Descriptions and Summary Statistics
Two different types of IRT scores are used in this report to describe students’ performance on the mathematics assessment. NELS:88-equated IRT-estimated number-right scores measure students’ performance on the whole item pool. NELS:88-equated proficiency probabilities estimate the probability that a given student would have demonstrated proficiency for each of the five mathematics levels defined for the NELS:88 survey in 1992.9
ELS:2002-NELS:88 Equating. Equating the ELS:2002 scale scores to the NELS:88 scale scores was completed through common-item or anchor equating. The ELS:2002 and NELS:88 mathematics tests shared 44 mathematics items. These common items provided the link that made it possible to obtain ELS:2002 student ability estimates on the NELS:88 ability scale. (The ELS:2002 data for 12 additional mathematics items did not fit the NELS:88 IRT parameters, so these items were not treated as common items for the purpose of equating.) Parameters for the common items were fixed at their NELS:88 values, resulting in ability estimates consistent with the NELS:88 metric.
IRT-estimated Number-right. The NELS:88-equated IRT-estimated number-right scores for mathematics are estimates of the number of items students would have answered correctly had they taken the NELS:88 exam and responded to all items in the mathematics items pool. The NELS:88 item pool contained 81 mathematics items in all test forms administered in grades 8, 10, and 12. Table A-12 provides basic statistics for base-year (BYNELS2M) and first follow-up (F1NELS2M) IRT-estimated number-right scores for ELS:2002 students, on the NELS:88 score scale. These scores are not integers because they are sums of probabilities, not counts of right and wrong answers.
Proficiency Probability Scores. Table A-12 also provides basic statistics for the five base-year (BYTX1MPP–BYTX5MPP) and five first follow-up (F1TX1MPP–F1TX5MPP) continuous proficiency probability scores. The criterion-referenced NELS:88-equated proficiency probability scores are based on clusters of items that mark different levels on the mathematics scale. Clusters of four items were identified in the NELS:88 tests that marked five hierarchical levels in mathematics:
1. Simple arithmetical operations on whole numbers, such as simple arithmetic expressions involving multiplication or division of integers;
2. Simple operations with decimals, fractions, powers, and roots, such as comparing expressions, given information about exponents;
3. Simple problem solving, requiring the understanding of low-level mathematical concepts, such as simplifying an algebraic expression or comparing the length of line segments illustrated in a diagram;
9 For further information on the NELS:88 proficiency levels, see Rock and Pollack (1995b), Psychometric Report for the NELS:88 Base Year Through Second Follow-up (NCES 95-382).

Appendix A. Technical Notes and Glossary
A-18
4. Understanding of intermediate-level mathematical concepts and/or multistep solutions to word problems such as drawing an inference based on an algebraic expression or inequality; and
5. Complex multistep word problems and/or advanced mathematics material such as a two-step problem requiring evaluation of functions.
Note that while Level 5 is based on a measurement of advanced mathematical material, the ELS:2002 mathematics test contains no calculus items. To the extent that advanced mathematics content on the ELS:2002 is limited, the present study may understate the relationship between mathematics course sequences and the acquisition of the most advanced skills and concepts. A high school student enrolled in calculus may see improved ELS:2002 test performance indirectly: the course may help keep mathematics understanding fresh and hone problem-solving skills, but there will be no direct test benefit in learning calculus content, in that there are no calculus items on the mathematics assessment.
The proficiency levels are hierarchical in the sense that mastery of a higher level typically implies proficiency at lower levels. The NELS:88-equated proficiency probabilities in ELS:2002 were computed using IRT item parameters calibrated in NELS:88. Each proficiency probability represents the probability that a student would pass a given proficiency level defined as above in the NELS:88 sample.
Table A-12 shows variable names, descriptions, and summary statistics for the NELS:88-equated number-right and proficiency probability scores.
Table A-12. IRT-estimated number-right scores and proficiency probability scores: 2002 and 2004
Variable name Description Range Weighted
meanWeighted
standard deviation
BYNELS2MMathematics—NELS-equated estimated
number right (1992 scale) 0–81 44.40 13.70
F1NELS2M Mathematics—NELS-equated estimated
number right (1992 scale) 0–81 50.10 14.20 BYTX1MPP Mathematics—level 1 0–1 .92 .20 BYTX2MPP Mathematics—level 2 0–1 .67 .42 BYTX3MPP Mathematics—level 3 0–1 .46 .46 BYTX4MPP Mathematics—level 4 0–1 .21 .33 BYTX5MPP Mathematics—level 5 0–1 .01 .07 F1TX1MPP Mathematics—level 1 0–1 .96 .12 F1TX2MPP Mathematics—level 2 0–1 .78 .37 F1TX3MPP Mathematics—level 3 0–1 .62 .45 F1TX4MPP Mathematics—level 4 0–1 .35 .41 F1TX5MPP Mathematics—level 5 0–1 .04 .14 NOTE: National Education Longitudinal Study of 1988 (NELS:88). IRT = Item Response Theory. SOURCE: U.S. Department of Education, National Center for Education Statistics, Education Longitudinal Study of 2002 (ELS:2002), “Base Year, 2002” and “First Follow-up, 2004.”
The IRT number-right and proficiency scores are derived from the IRT model and are based on all of the student’s responses to the mathematics assessment. That is, the pattern of right and wrong answers, as well as the characteristics of the assessment items themselves, is used to estimate a point on an ability continuum, and this ability estimate, theta, then provides the basis for these two types of criterion-referenced scores.

Appendix A. Technical Notes and Glossary
A-19
NELS:88-equated IRT number-right and proficiency probability scores may be used in a number of ways. Because they are calibrated on the NELS:88 scale, they may be used for cross-sectional intercohort comparisons of students’ mathematics achievement in 2004 compared with their counterparts in 1992. The NELS:88-equated number-right scores reflect performance on the whole pool of 81 NELS:88 mathematics items, whereas the proficiency probability scores are criterion-referenced scores that target a specific set of skills. The mean of a proficiency probability score aggregated over a subgroup of students is analogous to an estimate of the percentage of students in the subgroup who have displayed mastery of the particular skill.10 The proficiency probability scores are particularly useful as measures of gain, because they can be used to relate specific treatments (such as selected coursework) to changes that occur at different points along the score scale. For example, two groups may have similar gains in total scale score points, but for one group, gain may take place at an upper skill level, and for another, at a lower skill level. One would expect to see a relationship between gains in proficiency probability at a particular level and curriculum exposure, such as taking mathematics courses relevant to the skills being mastered. A.5.2.3 Psychometric Properties of the Tests
Information about the psychometric properties of the test items, the setting of difficulty levels, differential item functioning, and scoring procedures, are provided in the two field test documents (Burns et al. 2003 [NCES 2003-03, chapter 5] and Ingels et al. 2005 [NCES 2006-344, appendix J]). IRT scaling and linking procedures follow the NELS:88 precedent, using a three-parameter IRT model in PARSCALE (Muraki and Bock 1991); the NELS:88 procedure is described in Rock and Pollack (1995b). The same IRT software and procedures were used in the scaling of the Early Childhood Longitudinal Survey (ECLS-K) as detailed in Pollack et al. (2005).
Reliabilities were computed using the variance of the posterior distribution of plausible values for each test-taker’s theta (ability estimate), compared with the variance of the thetasacross the whole sample (i.e., error variance versus total variance). The reliability estimates are the proportion of “true variance” (1 minus error variance) divided by total variance (see Samejima 1994 on this procedure).
For the combined base-year and first follow-up tests, the reliability was 0.92 (this reliability is a function of the variance of repeated estimates of the IRT ability parameter [within-variance], compared with the variability of the sample as a whole) (Ingels et al. 2005). This 0.92 reliability applies to all scores derived from the IRT estimation.11
The use of IRT-scale scores and the adaptive testing approach used in ELS:2002 limit the concern that gain scores may be unreliable due to floor and ceiling effects.A.5.2.4 Indicators of Student Motivation at Both Testing Points
One major concern in measuring achievement is whether students are motivated to do their best on low-stakes tests, such as the mathematics assessment in ELS:2002. This concern may be particularly strongly felt with reference to spring-term seniors, who may be in the process of disengaging from high school in anticipation of the transition to postsecondary
10 On the interpretation of a proportion as a probability, see Fleiss, Levin, and Paik (2003, p. 1). 11 Imputed test scores were not included in reliability calculations; all test score calculations were based on actual test responses prior to the imputation of missing test scores.

Appendix A. Technical Notes and Glossary
A-20
education or the work force, and who may have had their fill of assessments, in the form of such high stakes tests as exit exams and college entrance exams. Although greatest concern may be felt about spring term seniors, concerns about motivation rightly encompass high school sophomores as well.
While there is no single definitive measure of student motivation on the tests, there are several possible indicators of the comprehensiveness and quality of the test data collected. For example, in scoring the 2002 and 2004 tests, the assessment subcontractor examined “pattern marking”12 and missing responses. In the main, they did not find evidence of pattern marking, or high levels of omitted items. For example, in the ELS:2002 first follow-up with around 11,000 mathematics assessments completed, 17 assessments were discarded for these reasons: 11 test records were deleted because tests were incomplete (fewer than 10 items answered) and 6 more because response patterns indicated lack of motivation to answer questions to the best of the student’s ability. In the base year, 10 test records were deleted because tests were incomplete (fewer than 10 items answered). Pattern marking was not observed (perhaps reflecting the fact that the test was in two stages, each stage relatively short).
Given that participation in the survey was voluntary, and that a student could have opted to not participate, or to participate by completing the questionnaire only, the student response rate may also be an indirect indicator of student test-taking motivation. Generally NAEP sees a drop in participation in grade 12, compared to grades 4 and 8. For ELS:2002’s predecessor study, NELS:88, lower participation rates were registered in 12th grade as well.13
For the ELS:2002 base year, the weighted participation rate was 87 percent. Of the 15,362 participants, 95 percent (weighted) also completed the test. (Some who did not complete the test could not be validly tested for language or disability reasons.)
For the ELS:2002 first follow-up (2004), when most sample members were high school seniors, the overall participation rate increased slightly from the base year to a weighted 89 percent. Some 87 percent (weighted) of questionnaire completers also completed the test.
12 An example of “pattern marking” would be responses of “A” for all answers or ABCABCABC through most or all of the test. Patterned responses such as “11111111…” or “12345432123454321…” or “1515151515…” can be identified by a simple algorithm sequentially comparing the difference between each test item and the next one, and calculating the variance of the absolute differences. In the first example given, the inter-item differences are always zero, in the second, always 1 or -1, and in the third, 4 or -4. In each case, the variance of the absolute differences is equal to zero, whereas for four- or five-choice test items, the variance of absolute differences for motivated respondents tends to be close to 1.0. All tests with variances of less than .5 were reviewed and those few with identifiable pattern marking were deleted. 13 Fully interpreting the senior year decline in test completion in NELS:88 is difficult. There was sample dispersion, and the policy was to test transfer students, though the resources for doing so were limited. In consequence, often a questionnaire might be completed over the telephone and the test sacrificed, despite the student’s willingness to be assessed. In contrast, in ELS:2002, transfers were ineligible for the first follow-up test and did not count against the assessment response rate—however, test scores were imputed for all transfers. No test score imputation was undertaken in NELS:88. Because studies such as NELS:88 and ELS:2002 induct their initial samples prior to 12th grade, they may be less affected by a “senioritis” phenomenon, in that students have already committed to the study and may have developed a sense of membership in the panel. Certainly for High School and Beyond (HS&B), the prior longitudinal cohort study that in its sophomore cohort most closely resembles ELS:2002 in design, participation was higher in the modally 12th-grade first follow-up than in the 10th-grade base year (and higher than the 12th-grade participation rate for the HS&B senior cohort that was selected in the same schools in 1980). (The NELS:88 second follow-up assessment data collection is discussed in Ingels, Scott, and Taylor [1998, p. 54]; for the 12th grade experience of HS&B, see Jones et al. [1983] and for ELS:2002 see Ingels et al. [2005]).
Appendix A. Technical Notes and Glossary
A-21
Looking specifically at questionnaire completion for senior cohort members who remained in the same school at both points in time—the critical analysis sample for this report—a 97 percent survey participation rate was obtained, with very little difference by subgroup. Race/ethnicity groups, for example, were all at around 97 percent (Ingels et al. 2005 [NCES 2006-344]). If voluntary participation rates are to some degree indicative of student motivation, then there is some evidence that seniors may have taken the assessment seriously.14 The overall pattern—lack of high numbers of omitted response, lack of “pattern-marking,” high test reliability,15 and high participation rates in both rounds of the study—argues for the credibility and quality of the test data. In short, while lack of motivation for some students surely affected test results in ways that could not be identified and edited out, most test takers answered all or almost all the items, and internal-consistency reliabilities were high for all subgroups examined, both in the field tests and full-scale studies. These are good indications that interpretation of test results in the aggregate should not be significantly compromised by low test-taking motivation.
A.6 Bias Analysis This analysis is based on 14,710 eligible students who had participated in the base-year
interview and the first follow-up interview. Of these, 730 did not participate in the BY mathematics assessment and 650 did not participate in the F1 mathematics assessment. The final analytic sample includes 9,460 respondents, of whom 5,300 have course sequences followed by more than 200 respondents—referred to here as those with designated mathematics course sequences. A bias analysis was conducted to assess the generalizability of the final analysis sample (n = 9,460) and those with designated course sequences (n = 5,300) compared with the target population of sophomores who participated in both the base-year interview and first follow-up interview (n = 14,710). Table A-13 shows the distributions of the student and school characteristics used in this study for each of the three samples, weighted using the panel weight (F1PNLWT).
Using the 5 percentage point threshold as a criterion for meaningful differences, the analytic sample and the analytic sample with designated course sequences differs from the target population in two ways: compared with the target population, the analytic sample and the analytic sample with designated course sequences include a higher proportion of students who are White and a higher proportion of students who expect a bachelor’s degree or higher. This is not surprising as the analysis sample excludes students who had transferred, students who were absent on the day of the test administration, and students with incomplete transcripts. This accords with other research which shows that racial/ethnic minorities are more likely to drop out relative to White students (U.S. Department of Education 1999) and that transfer behavior is associated with dropping out (Rumberger and Larson 1998)—both potentially contributing to higher rates of incomplete transcript information among these groups (Ingels et al. 1995). Additionally, compared with the full sophomore panel, the sample of those with designated mathematics course sequences contains more students living with both their father and their mother. Therefore, the analytic sample does not entirely approximate the composition of the full
14 Note that ELS:2002 sample members were given a cash incentive for participation. The effects of payment on test-taking motivation are unknown. Since test reliabilities were high and incomplete tests and pattern marking did not seem to be a problem, one interpretation might be that students made a reasonable effort, regardless of their reason for doing so. 15 Imputed test scores were not included in the calculation of reliabilities.
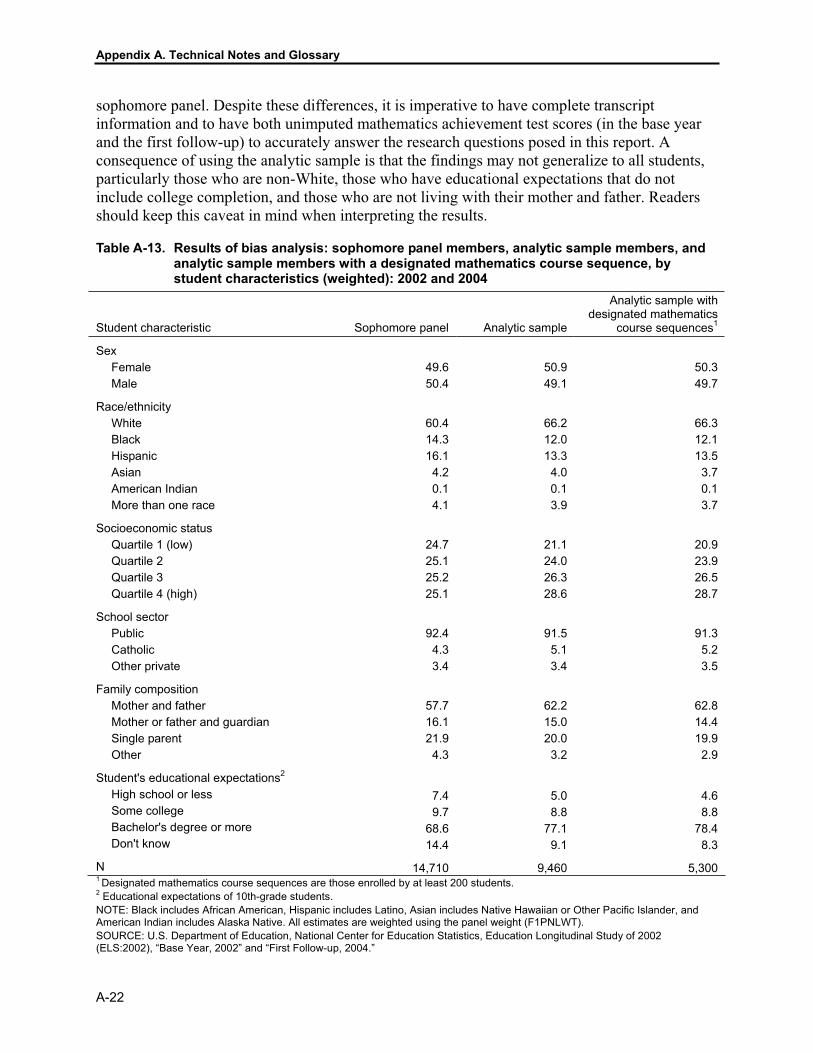
Appendix A. Technical Notes and Glossary
A-22
sophomore panel. Despite these differences, it is imperative to have complete transcript information and to have both unimputed mathematics achievement test scores (in the base year and the first follow-up) to accurately answer the research questions posed in this report. A consequence of using the analytic sample is that the findings may not generalize to all students, particularly those who are non-White, those who have educational expectations that do not include college completion, and those who are not living with their mother and father. Readers should keep this caveat in mind when interpreting the results.
Table A-13. Results of bias analysis: sophomore panel members, analytic sample members, and analytic sample members with a designated mathematics course sequence, by student characteristics (weighted): 2002 and 2004
Student characteristic Sophomore panel Analytic sample
Analytic sample with designated mathematics
course sequences1
Sex Female 49.6 50.9 50.3 Male 50.4 49.1 49.7
Race/ethnicity White 60.4 66.2 66.3 Black 14.3 12.0 12.1 Hispanic 16.1 13.3 13.5 Asian 4.2 4.0 3.7 American Indian 0.1 0.1 0.1 More than one race 4.1 3.9 3.7
Socioeconomic status Quartile 1 (low) 24.7 21.1 20.9 Quartile 2 25.1 24.0 23.9 Quartile 3 25.2 26.3 26.5 Quartile 4 (high) 25.1 28.6 28.7
School sector Public 92.4 91.5 91.3 Catholic 4.3 5.1 5.2 Other private 3.4 3.4 3.5
Family composition Mother and father 57.7 62.2 62.8 Mother or father and guardian 16.1 15.0 14.4 Single parent 21.9 20.0 19.9 Other 4.3 3.2 2.9
Student's educational expectations2 High school or less 7.4 5.0 4.6 Some college 9.7 8.8 8.8 Bachelor's degree or more 68.6 77.1 78.4 Don't know 14.4 9.1 8.3
N 14,710 9,460 5,300 1 Designated mathematics course sequences are those enrolled by at least 200 students. 2 Educational expectations of 10th-grade students. NOTE: Black includes African American, Hispanic includes Latino, Asian includes Native Hawaiian or Other Pacific Islander, and American Indian includes Alaska Native. All estimates are weighted using the panel weight (F1PNLWT). SOURCE: U.S. Department of Education, National Center for Education Statistics, Education Longitudinal Study of 2002 (ELS:2002), “Base Year, 2002” and “First Follow-up, 2004.”
Appendix A. Technical Notes and Glossary
A-23
A.7 Glossary—Description of Transcript and Survey Variables Used
Each questionnaire and transcript variable employed in analysis in this report is described below (test scores are discussed in section A.5). The topic headings are student and family demographic characteristics, student educational characteristics, and student coursetaking. Some readers may wish to consult the original questionnaires to obtain specific item wording and information about the context in which particular questions were posed. Web-published PDF files containing the base-year and first follow-up questionnaires are available at http://www.nces.ed.gov/surveys/els2002/index.asp. Some readers may desire to have further information about the construction of composite variables (such as socioeconomic status [SES]). The code used to construct these variables can be found in the ECB (Ingels et al. 2005b; NCES 2006-346). For users who would like to consult codebooks of hardcopy frequencies (including both percent and weighted percent) for the variables listed in this glossary, codebooks are also available as an appendix of the base-year to first follow-up data manual (Ingels et al. 2005a; http://nces.ed.gov/pubsearch/pubsinfo.asp?pubid=2006344). Further information about the transcript component is given in the special addendum to the base-year to first follow-up data file documentation (Bozick et al. 2006).
When the variable is available in the ELS:2002 base-year to first follow-up data file (see the public-use ECB, NCES 2006-346), the variable name appears in parentheses after the bold entry name. ELS:2002 variables used to construct a variable that is not provided in the ELS:2002 base-year data file are named in all capital letters within the descriptive text.
A.7.1 Student and Family Demographic Characteristics Race/ethnicity (F1RACE): The ELS:2002 race variables reflect new federal standards
for collecting race and ethnicity data that allow respondents to mark more than one choice for race. For base-year respondents, information on race/ethnicity was obtained from the base-year student questionnaire when available or from (in order of preference) the sampling roster, the parent questionnaire if the parent respondent was a biological parent, or logical imputation based on other questionnaire items (e.g., surname, native language). The base-year race/ethnicity questions were asked in the first follow-up for newly participating students (i.e., base-year nonrespondents).
The race/ethnicity variable for this report includes six categories: (1) American Indian or Alaska Native, non-Hispanic; (2) Asian or Pacific Islander, including Native Hawaiian, non-Hispanic; (3) Black, including African American, non-Hispanic; (4) Hispanic or Latino; (5) More than one race, non-Hispanic; and (6) White, non-Hispanic.
Sex (F1SEX): For base-year respondents, respondent sex was constructed from the base-year student questionnaire or, where missing, from (in order of preference) the school roster, logical imputation based on first name, or statistical imputation. In the first follow-up, students new to the study were asked whether their sex was male or female.
Socioeconomic status (F1SES1QU): Socioeconomic status exists as both a continuous variable and as a categorical variable based on weighted quartiles. The categorical form of the variable (F1SES1Q) divides SES1 into quartiles based on the weighted marginal distribution. It was recoded to combine the middle two categories of the SES1QU variable. Four categories result: (1) lowest quartile of SES1 (i.e., students below the 25th percentile rank for SES); (2)
Appendix A. Technical Notes and Glossary
A-24
lower middle quartile of SES1 (i.e., students whose SES percentile rank was at least 25th and below 50th); (3) upper middle quartile of SES1 (i.e., students whose SES percentile rank was at least 50th and below 75th); and (4) highest quartile of SES1 (i.e., students whose SES percentile rank was at least 75th).
F1SES1 is a NLS-72/HS&B/NELS:88-comparable composite variable constructed from parent questionnaire data when available and from imputation or student substitutions when not. SES is based on five equally weighted, standardized components: father’s/guardian’s education (F1FATHED), mother’s/guardian’s education (F1MOTHED), family income (BYINCOME), father’s/guardian’s occupational prestige score (from F1OCCUFATH), and mother’s/guardian’s occupational prestige score (from F1OCCUMOTH).
Father’s and mother’s education were based on parent report when available, otherwise student report, or if still missing, imputed. Income was based on parent questionnaire information or imputed otherwise. The parent questionnaire was the preferred source of data for mother’s and father’s occupation. Parent questionnaire respondents were asked to describe the father’s and mother’s occupations and subsequently code each into one of 17 categories. If the respondent provided only text, project staff coded the occupation. In the absence of parent questionnaire occupation data, student-supplied parent occupation text from the base year (for base-year respondents) or first follow-up (for base-year nonrespondents who responded in the first follow-up) was coded by project staff, if possible. Missing occupations were imputed. An occupation prestige value was determined based on the 1961 Duncan socioeconomic index (SEI).16
Family composition/configuration (F1FCOMP): F1FCOMP is based on BYFCOMP for base-year respondents and a surrogate for first follow-up new participants. New participants were asked to answer questions about family composition that were asked of parents in the base year. Because family composition can change over time, the variable is only an approximation, in that information was gathered at either of two time points (2002 or 2004) before combining into one measure. The nine response options include (1) Mother and father, (2) Mother and male guardian, (3) Father and female guardian, (4) Two guardians, (5) Mother only, (6) Father only, (7) Female guardian only, (8) Male guardian only, and (9) Lives with student less than half time. These categories were collapsed into four: Mother and father (1), Mother or father and guardian (2 and 3), Single parent—mother or father (5 and 6), and Other (4, 7, 8, and 9).
Educational expectations (BYSTEXP): This variable is taken directly from the student questionnaire when available and imputed otherwise. Students were asked, “As things stand now, how far in school do you think you will get?” The eight response options were (1) Less than high school graduation; (2) High school graduation or GED only; (3) Attend or complete a 2-year school course in a community college or vocational school; (4) Attend college, but not complete a 4-year degree; (5) Graduate from college; (6) Obtain a master’s degree or equivalent; (7) Obtain a Ph.D., M.D., or other advanced degree; and (8) Don’t know. These levels were collapsed into four categories: High school diploma or less (1 and 2), Some college (3 and 4), College graduate or higher (5, 6 and 7), and Don’t Know (8).
16 The Duncan SEI is a measure of occupational status based on the income level and educational attainment associated with each occupation (Duncan 1961).

Appendix A. Technical Notes and Glossary
A-25
A.7.2 Student Educational Characteristics School sector (BYSCTRL): This variable indicates the type of school attended by the
respondent in the base-year interview. There were no missing data for this variable. The resulting measure includes three school sector categories: public school, Catholic school, other private school.
A.7.3 Mathematics Achievement See section A.5 for details on the NELS:88-equated IRT-estimated number-right scores
and proficiency probability levels.
Coursetaking sequences: This variable was constructed using the student transcript course file. All mathematics courses for which the student earned credit during 2002–03 and 2003–04, the 2 academic years between the 2 mathematics assessments, were classified in one of the following 16 categories using the Classification of Secondary School Courses (CSSC) codes, the hierarchical scheme used to classify and group subject areas and courses: Category CSSC Title No Mathematics None None Basic Mathematics 270601 Basic Math 1 270602 Basic Math 2 270603 Basic Math 3 270604 Basic Math 4 General Math 270100 Mathematics, Other
General 270101 Mathematics 7 270102 Mathematics 7,
Accelerated 270103 Mathematics 8 270106 Mathematics 1 270107 Mathematics 2 541001 General Math Skills 541009 Functional Math Skills,
Not For Credit 562700 Special Education Math 562701 Resource General Math 562709 Resource General Math,
Not For Credit Applied Math 110111 Computer Appreciation;
Computer Literacy 110121 Computer Mathematics 1 110122 Computer Mathematics 2 110400 Information Sciences and
Systems, Other 110500 Systems Analysis, Other 119900 Computer and Information
Sciences, Other 270108 Science Mathematics 270109 Mathematics in the Arts 270110 Mathematics, Vocational 270111 Technical Mathematics 270114 Consumer Mathematics 270300 Applied Mathematics,
Other 541101 Functional Consumer Math
541109 Functional Consumer Math, Not For Credit
541201 Functional Vocational Math
541209 Functional Vocational Math, Not For Credit
562711 Resource Vocational Math 562719 Resource Vocational Math,
Not For Credit 562721 Resource Consumer Math 562729 Resource Consumer Math,
Not For Credit Pre algebra 270104 Mathematics 8,
Accelerated 270401 Prealgebra 270402 Algebra 1, Part 1 270403 Algebra 1, Part 2 Algebra I 270404 Algebra 1 270421 Mathematics 1, Unified 270427 Unified Math 1, Part 1 270428 Unified Math 1, Part 2 270441 Algebra and Geometry Geometry 270406 Geometry, Plane 270407 Geometry, Solid 270408 Geometry 270409 Geometry, Informal 270422 Mathematics 2, Unified 270425 Geometry, Part 1 270426 Geometry, Part 2 270429 Pre-IB Geometry Algebra II 270405 Algebra 2 270410 Algebra 3 Algebra II 270415 Algebra and Analytic
Geometry 270417 Linear Algebra; Matrix
Algebra;Trigonometry 270411 Trigonometry
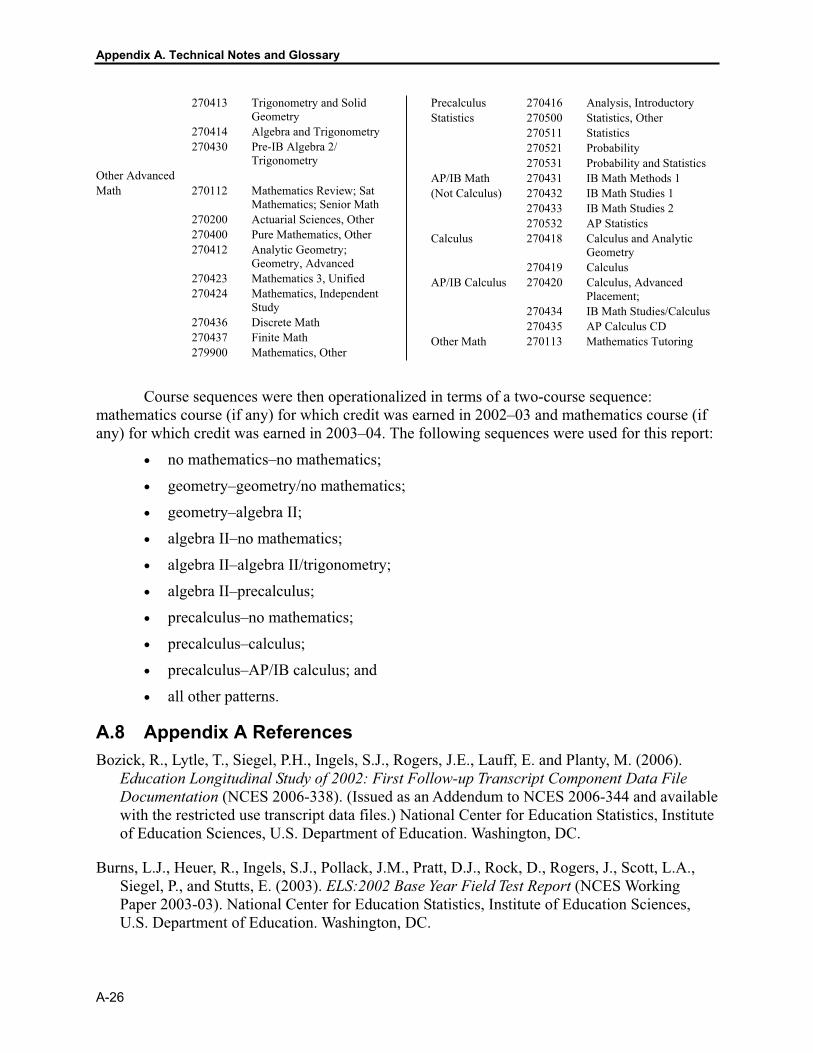
Appendix A. Technical Notes and Glossary
A-26
270413 Trigonometry and Solid Geometry
270414 Algebra and Trigonometry 270430 Pre-IB Algebra 2/
Trigonometry Other Advanced Math 270112 Mathematics Review; Sat
Mathematics; Senior Math 270200 Actuarial Sciences, Other 270400 Pure Mathematics, Other 270412 Analytic Geometry;
Geometry, Advanced 270423 Mathematics 3, Unified 270424 Mathematics, Independent
Study 270436 Discrete Math 270437 Finite Math 279900 Mathematics, Other
Precalculus 270416 Analysis, Introductory Statistics 270500 Statistics, Other 270511 Statistics 270521 Probability 270531 Probability and Statistics AP/IB Math 270431 IB Math Methods 1 (Not Calculus) 270432 IB Math Studies 1 270433 IB Math Studies 2 270532 AP Statistics Calculus 270418 Calculus and Analytic
Geometry 270419 Calculus AP/IB Calculus 270420 Calculus, Advanced
Placement; 270434 IB Math Studies/Calculus 270435 AP Calculus CD Other Math 270113 Mathematics Tutoring
Course sequences were then operationalized in terms of a two-course sequence: mathematics course (if any) for which credit was earned in 2002–03 and mathematics course (if any) for which credit was earned in 2003–04. The following sequences were used for this report:
• no mathematics–no mathematics;
• geometry–geometry/no mathematics;
• geometry–algebra II;
• algebra II–no mathematics;
• algebra II–algebra II/trigonometry;
• algebra II–precalculus;
• precalculus–no mathematics;
• precalculus–calculus;
• precalculus–AP/IB calculus; and
• all other patterns.
A.8 Appendix A References Bozick, R., Lytle, T., Siegel, P.H., Ingels, S.J., Rogers, J.E., Lauff, E. and Planty, M. (2006).
Education Longitudinal Study of 2002: First Follow-up Transcript Component Data File Documentation (NCES 2006-338). (Issued as an Addendum to NCES 2006-344 and available with the restricted use transcript data files.) National Center for Education Statistics, Institute of Education Sciences, U.S. Department of Education. Washington, DC.
Burns, L.J., Heuer, R., Ingels, S.J., Pollack, J.M., Pratt, D.J., Rock, D., Rogers, J., Scott, L.A., Siegel, P., and Stutts, E. (2003). ELS:2002 Base Year Field Test Report (NCES Working Paper 2003-03). National Center for Education Statistics, Institute of Education Sciences, U.S. Department of Education. Washington, DC.
Appendix A. Technical Notes and Glossary
A-27
Cohen, J. (1988). Statistical Power Analysis for the Behavioral Sciences (2nd ed.). Hillsdale, NJ: Erlbaum.
Duncan, O.D. (1961). A Socioeconomic Index for All Occupations. In Reiss, A., Jr. (ed)., pp. 109-138. Occupations and Social Status. New York: Free Press.
Embretson, S.E., and Reise, S. (2000). Item Response Theory for Psychologists. Mahwah, NJ: Erlbaum.
Fetters, W.B., Stowe, P.S., and Owings, J.A. (1984). Quality of Responses of High School Students to Questionnaire Items, High School and Beyond (NCES 84-216). National Center for Education Statistics, U.S. Department of Education. Washington, DC: U.S. Government Printing Office.
Fleiss, J.L., Levin, B.A., and Paik, M.C. (2003). Statistical Methods for Rates and Proportions(3rd ed.) New York: Wiley Series in Probability and Statistics.
Hambleton, R.K., Swaminathan, H., and Rogers, H.J. (1991). Fundamentals of Item Response Theory. Newbury Park, CA: Sage.
Ingels, S.J., Dowd, K.L., Taylor, J.R., Bartot, V.H., Frankel, M.R., Pulliam, P.A., and Quinn, P. (1995). National Education Longitudinal Study of 1988, Second Follow-Up: Transcript Component Data File User’s Manual (NCES 95-377). National Center for Education Statistics, U.S. Department of Education. Washington, DC: U.S. Government Printing Office.
Ingels, S. J., Scott, L. A., and Taylor, J. R. (1998). National Education Longitudinal Study of 1988 (NELS: 88) Base Year through Second Follow-Up: Final Methodology Report (NCES98-06). National Center for Education Statistics, U.S. Department of Education. Washington, DC: U.S. Government Printing Office.
Ingels, S.J., Pratt, D.J., Rogers, J., Siegel, P.H., and Stutts, E.S. (2004). Education Longitudinal Study of 2002: Base Year Data File User’s Manual (NCES 2004-405). National Center for Education Statistics, Institute of Education Sciences, U.S. Department of Education. Washington, DC: U.S. Government Printing Office. Available: http://nces.ed.gov/pubsearch.
Ingels, S.J., Pratt, D.J., Rogers, J., Siegel, P.H., and Stutts, E.S. (2005a). Education Longitudinal Study of 2002: Base-Year to First Follow-up Data File Documentation (NCES 2006-344). National Center for Education Statistics, Institute of Education Sciences, U.S. Department of Education. Washington, DC: U.S. Government Printing Office. Available: http://nces.ed.gov/pubsearch.
Ingels, S.J., Pratt, D.J., Rogers, J., Siegel, P.H., and Stutts, E.S. (2005b). Education Longitudinal Study of 2002: Base-Year to First Follow-up Data File Documentation (NCES 2006-346). National Center for Education Statistics, Institute of Education Sciences, U.S. Department of Education. Washington, DC: U.S. Government Printing Office. Available: http://nces.ed.gov/pubsearch.
Appendix A. Technical Notes and Glossary
A-28
Jones, C., Clarke, M., Mooney G., McWilliams, H., Crawford, I., Stephenson, B., and Tourangeau, R. (1983). High School and Beyond 1980 Sophomore Cohort First Follow-Up (1982) (NCES 83-214). National Center for Education Statistics, U.S. Department of Education. Washington, DC.
Kaufman, P., and Rasinski, K. (1991). Quality of the Responses of Eighth-grade Students in NELS:88 (NCES 91-487). National Center for Education Statistics, U.S. Department of Education. Washington, DC: U.S. Government Printing Office.
McLaughlin, D.H., and Cohen, J. (1997). NELS:88 Survey Item Evaluation Report (NCES 97-052). National Center for Education Statistics, U.S. Department of Education. Washington, DC: U.S. Government Printing Office.
Muraki, E.J., and Bock, R.D. (1991). PARSCALE: Parameter Scaling of Rating Data. (Computer program). Chicago, IL: Scientific Software, Inc.
Murphy, K.R., and Myers, B. (2004). Statistical Power Analysis (2nd ed.). Mahwah, NJ: Erlbaum.
National Assessment Governing Board (NAGB) (2004). Mathematics Framework for the 2005 National Assessment of Educational Progress. Washington, DC: Author.
Pollack, J.M., Najarian, M., Rock, D.A. and Atkins-Burnett, S. (2005). Early Childhood Longitudinal Study, Kindergarten Class of 1998-99 (ECLS-K), Psychometric Report for the Fifth Grade (NCES 2006-036rev). National Center for Education Statistics, Institute of Education Sciences, U.S. Department of Education. Washington, DC: U.S. Government Printing Office.
Robitaille, D.F., Schmidt, W.H., Raizen, S., McKnight, C. Britton, E., and Nicole, C. (1993). Curriculum Frameworks for Mathematics and Science (TIMSS Monograph No. 1). Vancouver, British Columbia: Pacific Educational Press.
Rock, D.A., and Pollack, J.M. (1995b). Psychometric Report for the NELS:88 Base Year Through Second Follow-Up (NCES 95-382). National Center for Education Statistics, U.S. Department of Education. Washington, DC: U.S. Government Printing Office.
Rumberger, R.W., & Larson, K.A. (1998). Student Mobility and the Increased Risk of High School Drop Out. American Journal of Education 107: 1-35.
Samejima, F. (1994). Roles of Fisher-type information in latent trait models. In H. Bozdogan (ed.), Multivariate Statistical Modeling (Volume 2 of the Proceedings of the First U.S.-Japan Conference on the Frontiers of Statistical Modeling). Dordrecht, the Netherlands: Kluwer Academic Publishers.
Seastrom, M. (2003). NCES Statistical Standards (NCES 2003-601). National Center for Education Statistics, Institute of Education Sciences, U.S. Department of Education. Washington, DC: U.S. Government Printing Office. Available: http://nces.ed.gov/pubsearch/pubsinfo.asp?pubid=2003601.

Appendix A. Technical Notes and Glossary
A-29
U.S. Department of Education (1999). The Condition of Education 1999 (NCES 99-022). National Center for Education Statistics, U.S. Department of Education. Washington, DC: U.S. Government Printing Office.

B-1
Appendix B Standard Error Tables for Estimated Means and
Proportions, with Weighted Standard Deviations and Raw Sample Sizes for Means


Appendix B. Standard Error Tables
B-3
Table B-1a. Standard errors for table 1 estimates (average mathematics IRT-estimated number-right scores, by selected student characteristics: 2002 and 2004)
Student characteristic 10th grade 12th grade Change
Total 0.29 0.29 0.08
Sex Female 0.33 0.34 0.11 Male 0.34 0.35 0.12
Race/ethnicity White 0.26 0.28 0.11 Black 0.58 0.58 0.19 Hispanic 0.60 0.60 0.22 Asian 1.00 1.06 0.35 American Indian 1.96 2.33 0.95 More than one race 0.84 0.84 0.41
Socioeconomic status Quartile 1 (low) 0.44 0.43 0.17 Quartile 2 0.40 0.42 0.18 Quartile 3 0.37 0.36 0.14 Quartile 4 (high) 0.36 0.35 0.14
School sector Public 0.31 0.31 0.09 Catholic 0.53 0.55 0.19 Other private 0.87 0.93 0.34
Family composition Mother and father 0.30 0.30 0.10 Mother or father and guardian 0.48 0.50 0.23 Single parent 0.48 0.49 0.17 Other 0.96 0.93 0.51
Student’s educational expectations1 High school or less 0.68 0.73 0.43 Some college 0.58 0.56 0.33 Bachelor's degree or more 0.29 0.30 0.09 Don’t know 0.62 0.65 0.27
1 Educational expectations of 10th-grade students. NOTE: Black includes African American, Hispanic includes Latino, Asian includes Native Hawaiian or Other Pacific Islander, and American Indian includes Alaska Native. IRT = Item Response Theory. SOURCE: U.S. Department of Education, National Center for Education Statistics, Education Longitudinal Study of 2002 (ELS:2002), “Base Year, 2002” and “First Follow-up, 2004.”

Appendix B. Standard Error Tables
B-4
Table B-1b. Sample size and standard deviations for table 1 estimates (average mathematics IRT-estimated number-right scores, by selected student characteristics: 2002 and 2004)
Student characteristic Sample (n) 10th grade 12th grade Change
Total 9,460 13.44 14.15 6.27
Sex Female 4,790 13.12 13.78 5.99 Male 4,670 13.71 14.46 6.54
Race/ethnicity White 5,800 12.38 13.13 6.14 Black 1,060 11.47 12.09 5.61 Hispanic 1,200 12.93 13.67 6.98 Asian 900 13.73 14.66 6.79 American Indian 60 11.27 13.26 7.35 More than one race 420 13.15 13.92 6.92
Socioeconomic status Quartile 1 (low) 1,900 12.58 13.09 6.53 Quartile 2 2,180 12.55 13.54 6.58 Quartile 3 2,400 12.53 13.00 5.93 Quartile 4 (high) 2,980 11.94 12.26 6.04
School sector Public 7,160 13.49 14.18 6.30 Catholic 1,400 11.12 11.45 5.43 Other private 900 11.97 12.30 6.39
Family composition Mother and father 6,070 13.13 13.81 6.19 Mother or father and guardian 1,300 12.90 13.68 6.20 Single parent 1,800 13.75 14.31 6.42 Other 290 12.74 13.27 6.80
Student's educational expectations1 High school or less 430 11.38 12.09 7.35 Some college 760 11.80 12.23 7.28 Bachelor's degree or more 7,440 12.76 13.42 6.03 Don’t know 830 13.60 14.38 6.49
1 Educational expectations of 10th-grade students. NOTE: Black includes African American, Hispanic includes Latino, Asian includes Native Hawaiian or Other Pacific Islander, and American Indian includes Alaska Native. IRT = Item Response Theory. SOURCE: U.S. Department of Education, National Center for Education Statistics, Education Longitudinal Study of 2002 (ELS:2002), “Base Year, 2002” and “First Follow-up, 2004.”
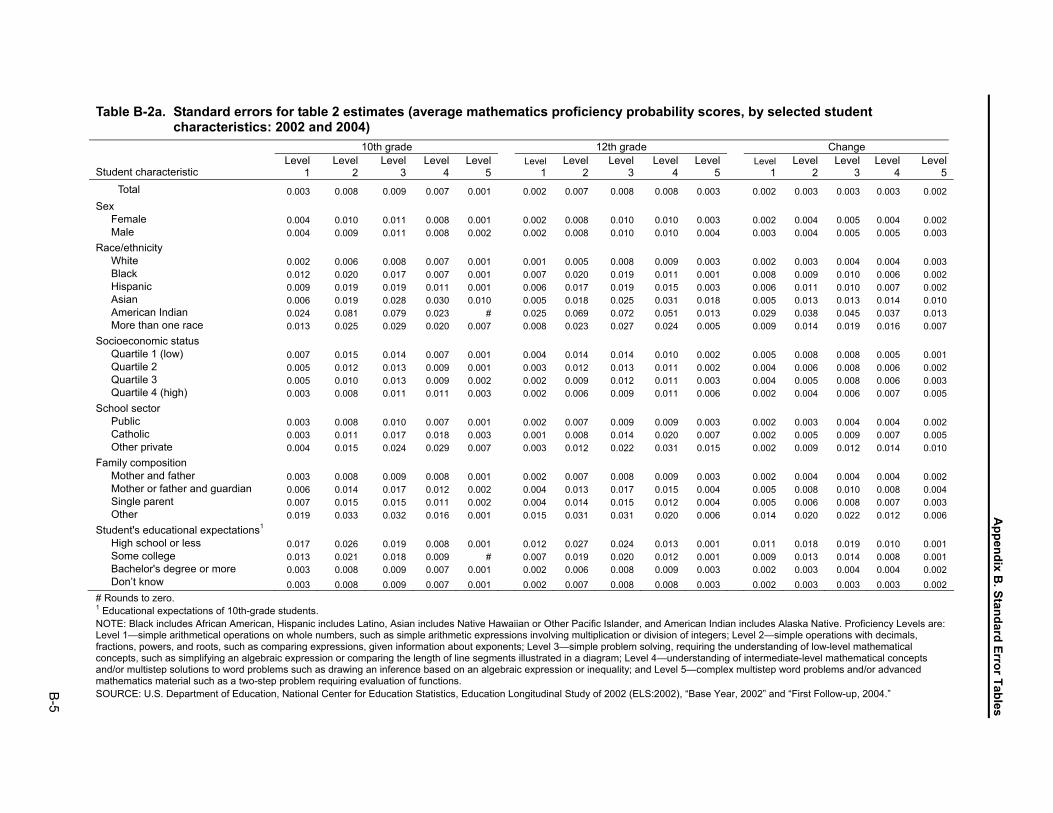
Appendix B
. Standard Error Tables
B-5
Table B-2a. Standard errors for table 2 estimates (average mathematics proficiency probability scores, by selected student characteristics: 2002 and 2004)
10th grade 12th grade Change
Student characteristic Level
1 Level
2 Level
3 Level
4 Level
5 Level
1 Level
2 Level
3 Level
4 Level
5 Level
1 Level
2 Level
3 Level
4 Level
5 Total 0.003 0.008 0.009 0.007 0.001 0.002 0.007 0.008 0.008 0.003 0.002 0.003 0.003 0.003 0.002
Sex Female 0.004 0.010 0.011 0.008 0.001 0.002 0.008 0.010 0.010 0.003 0.002 0.004 0.005 0.004 0.002 Male 0.004 0.009 0.011 0.008 0.002 0.002 0.008 0.010 0.010 0.004 0.003 0.004 0.005 0.005 0.003
Race/ethnicity White 0.002 0.006 0.008 0.007 0.001 0.001 0.005 0.008 0.009 0.003 0.002 0.003 0.004 0.004 0.003 Black 0.012 0.020 0.017 0.007 0.001 0.007 0.020 0.019 0.011 0.001 0.008 0.009 0.010 0.006 0.002 Hispanic 0.009 0.019 0.019 0.011 0.001 0.006 0.017 0.019 0.015 0.003 0.006 0.011 0.010 0.007 0.002 Asian 0.006 0.019 0.028 0.030 0.010 0.005 0.018 0.025 0.031 0.018 0.005 0.013 0.013 0.014 0.010 American Indian 0.024 0.081 0.079 0.023 # 0.025 0.069 0.072 0.051 0.013 0.029 0.038 0.045 0.037 0.013 More than one race 0.013 0.025 0.029 0.020 0.007 0.008 0.023 0.027 0.024 0.005 0.009 0.014 0.019 0.016 0.007
Socioeconomic status Quartile 1 (low) 0.007 0.015 0.014 0.007 0.001 0.004 0.014 0.014 0.010 0.002 0.005 0.008 0.008 0.005 0.001 Quartile 2 0.005 0.012 0.013 0.009 0.001 0.003 0.012 0.013 0.011 0.002 0.004 0.006 0.008 0.006 0.002 Quartile 3 0.005 0.010 0.013 0.009 0.002 0.002 0.009 0.012 0.011 0.003 0.004 0.005 0.008 0.006 0.003 Quartile 4 (high) 0.003 0.008 0.011 0.011 0.003 0.002 0.006 0.009 0.011 0.006 0.002 0.004 0.006 0.007 0.005
School sector Public 0.003 0.008 0.010 0.007 0.001 0.002 0.007 0.009 0.009 0.003 0.002 0.003 0.004 0.004 0.002 Catholic 0.003 0.011 0.017 0.018 0.003 0.001 0.008 0.014 0.020 0.007 0.002 0.005 0.009 0.007 0.005 Other private 0.004 0.015 0.024 0.029 0.007 0.003 0.012 0.022 0.031 0.015 0.002 0.009 0.012 0.014 0.010
Family composition Mother and father 0.003 0.008 0.009 0.008 0.001 0.002 0.007 0.008 0.009 0.003 0.002 0.004 0.004 0.004 0.002 Mother or father and guardian 0.006 0.014 0.017 0.012 0.002 0.004 0.013 0.017 0.015 0.004 0.005 0.008 0.010 0.008 0.004 Single parent 0.007 0.015 0.015 0.011 0.002 0.004 0.014 0.015 0.012 0.004 0.005 0.006 0.008 0.007 0.003 Other 0.019 0.033 0.032 0.016 0.001 0.015 0.031 0.031 0.020 0.006 0.014 0.020 0.022 0.012 0.006
Student's educational expectations1 High school or less 0.017 0.026 0.019 0.008 0.001 0.012 0.027 0.024 0.013 0.001 0.011 0.018 0.019 0.010 0.001 Some college 0.013 0.021 0.018 0.009 # 0.007 0.019 0.020 0.012 0.001 0.009 0.013 0.014 0.008 0.001 Bachelor's degree or more 0.003 0.008 0.009 0.007 0.001 0.002 0.006 0.008 0.009 0.003 0.002 0.003 0.004 0.004 0.002 Don’t know 0.003 0.008 0.009 0.007 0.001 0.002 0.007 0.008 0.008 0.003 0.002 0.003 0.003 0.003 0.002
# Rounds to zero. 1 Educational expectations of 10th-grade students. NOTE: Black includes African American, Hispanic includes Latino, Asian includes Native Hawaiian or Other Pacific Islander, and American Indian includes Alaska Native. Proficiency Levels are: Level 1—simple arithmetical operations on whole numbers, such as simple arithmetic expressions involving multiplication or division of integers; Level 2—simple operations with decimals, fractions, powers, and roots, such as comparing expressions, given information about exponents; Level 3—simple problem solving, requiring the understanding of low-level mathematical concepts, such as simplifying an algebraic expression or comparing the length of line segments illustrated in a diagram; Level 4—understanding of intermediate-level mathematical concepts and/or multistep solutions to word problems such as drawing an inference based on an algebraic expression or inequality; and Level 5—complex multistep word problems and/or advanced mathematics material such as a two-step problem requiring evaluation of functions. SOURCE: U.S. Department of Education, National Center for Education Statistics, Education Longitudinal Study of 2002 (ELS:2002), “Base Year, 2002” and “First Follow-up, 2004.”
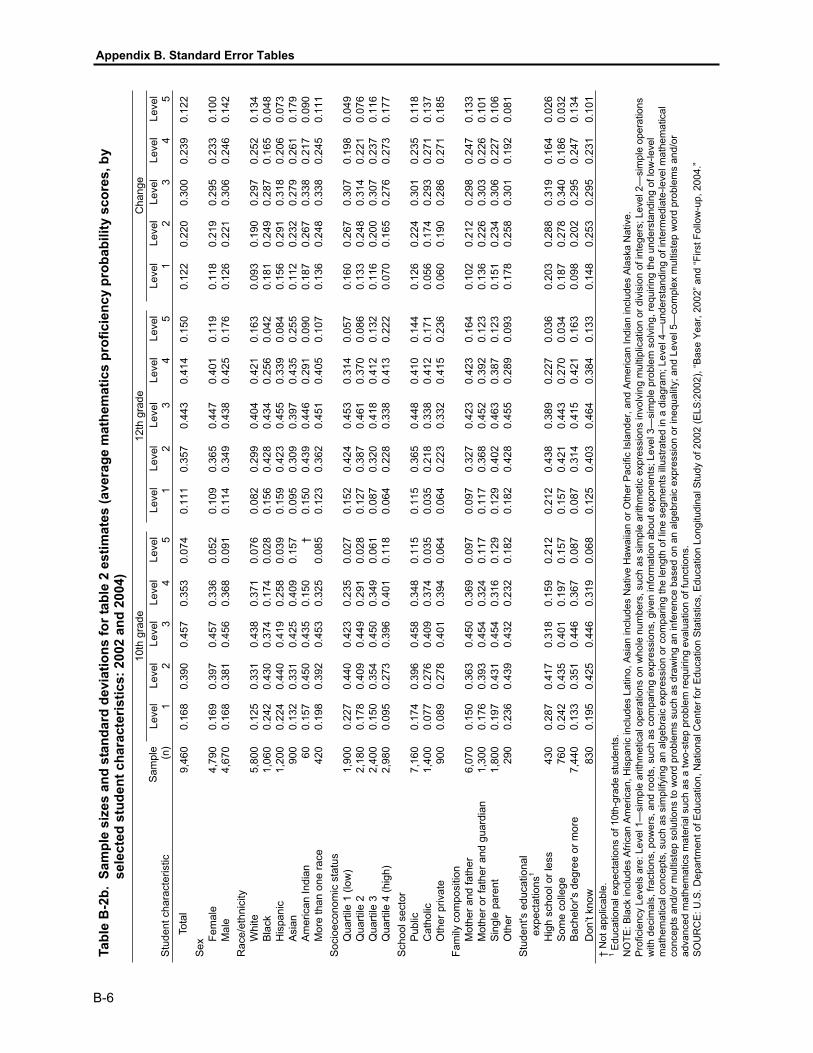
Appendix B. Standard Error Tables
B-6
Tabl
e B
-2b.
Sam
ple
size
s an
d st
anda
rd d
evia
tions
for t
able
2 e
stim
ates
(ave
rage
mat
hem
atic
s pr
ofic
ienc
y pr
obab
ility
sco
res,
by
sele
cted
stu
dent
cha
ract
eris
tics:
200
2 an
d 20
04)
10th
gra
de
12th
gra
de
Cha
nge
Stu
dent
cha
ract
eris
tic
Sam
ple (n)
Leve
l 1Le
vel 2
Leve
l 3Le
vel 4
Leve
l 5Le
vel 1
Leve
l 2Le
vel 3
Leve
l 4Le
vel 5
Leve
l 1Le
vel 2
Leve
l 3Le
vel 4
Leve
l 5To
tal
9,46
0 0.
168
0.39
00.
457
0.35
30.
074
0.11
10.
357
0.44
3 0.
414
0.15
00.
122
0.22
00.
300
0.23
90.
122
Sex
Fem
ale
4,79
0 0.
169
0.39
70.
457
0.33
60.
052
0.10
90.
365
0.44
7 0.
401
0.11
90.
118
0.21
90.
295
0.23
30.
100
Mal
e 4,
670
0.16
80.
381
0.45
60.
368
0.09
10.
114
0.34
90.
438
0.42
50.
176
0.12
60.
221
0.30
60.
246
0.14
2R
ace/
ethn
icity
Whi
te
5,80
0 0.
125
0.33
10.
438
0.37
10.
076
0.08
20.
299
0.40
4 0.
421
0.16
30.
093
0.19
00.
297
0.25
20.
134
Bla
ck
1,06
0 0.
242
0.43
00.
374
0.17
40.
028
0.15
60.
428
0.43
4 0.
256
0.04
20.
181
0.24
90.
287
0.16
50.
048
His
pani
c 1,
200
0.22
40.
440
0.41
90.
258
0.03
90.
159
0.42
30.
455
0.33
90.
084
0.15
60.
291
0.31
80.
206
0.07
3A
sian
90
0 0.
132
0.33
10.
425
0.40
90.
157
0.09
50.
309
0.39
7 0.
435
0.25
50.
112
0.23
20.
279
0.26
10.
179
Am
eric
an In
dian
60
0.
157
0.45
00.
435
0.15
0†
0.15
00.
439
0.44
6 0.
291
0.09
00.
187
0.26
70.
338
0.21
70.
090
Mor
e th
an o
ne ra
ce
420
0.19
80.
392
0.45
30.
325
0.08
50.
123
0.36
20.
451
0.40
50.
107
0.13
60.
248
0.33
80.
245
0.11
1S
ocio
econ
omic
sta
tus
Q
uarti
le 1
(low
) 1,
900
0.22
70.
440
0.42
30.
235
0.02
70.
152
0.42
40.
453
0.31
40.
057
0.16
00.
267
0.30
70.
198
0.04
9Q
uarti
le 2
2,
180
0.17
80.
409
0.44
90.
291
0.02
80.
127
0.38
70.
461
0.37
00.
086
0.13
30.
248
0.31
40.
221
0.07
6Q
uarti
le 3
2,
400
0.15
00.
354
0.45
00.
349
0.06
10.
087
0.32
00.
418
0.41
20.
132
0.11
60.
200
0.30
70.
237
0.11
6Q
uarti
le 4
(hig
h)
2,98
0 0.
095
0.27
30.
396
0.40
10.
118
0.06
40.
228
0.33
8 0.
413
0.22
20.
070
0.16
50.
276
0.27
30.
177
Sch
ool s
ecto
r
Pub
lic
7,16
0 0.
174
0.39
60.
458
0.34
80.
115
0.11
50.
365
0.44
8 0.
410
0.14
40.
126
0.22
40.
301
0.23
50.
118
Cat
holic
1,
400
0.07
70.
276
0.40
90.
374
0.03
50.
035
0.21
80.
338
0.41
20.
171
0.05
60.
174
0.29
30.
271
0.13
7O
ther
priv
ate
90
0 0.
089
0.27
80.
401
0.39
40.
064
0.06
40.
223
0.33
2 0.
415
0.23
60.
060
0.19
00.
286
0.27
10.
185
Fam
ily c
ompo
sitio
n
Mot
her a
nd fa
ther
6,
070
0.15
00.
363
0.45
00.
369
0.09
70.
097
0.32
70.
423
0.42
30.
164
0.10
20.
212
0.29
80.
247
0.13
3M
othe
r or f
athe
r and
gua
rdia
n 1,
300
0.17
60.
393
0.45
40.
324
0.11
70.
117
0.36
80.
452
0.39
20.
123
0.13
60.
226
0.30
30.
226
0.10
1S
ingl
e pa
rent
1,
800
0.19
70.
431
0.45
40.
316
0.12
90.
129
0.40
20.
463
0.38
70.
123
0.15
10.
234
0.30
60.
227
0.10
6O
ther
29
0 0.
236
0.43
90.
432
0.23
20.
182
0.18
20.
428
0.45
5 0.
289
0.09
30.
178
0.25
80.
301
0.19
20.
081
Stu
dent
's e
duca
tiona
l ex
pect
atio
ns1
Hig
h sc
hool
or l
ess
430
0.28
70.
417
0.31
80.
159
0.21
20.
212
0.43
80.
389
0.22
70.
036
0.20
30.
288
0.31
90.
164
0.02
6S
ome
colle
ge
760
0.24
20.
435
0.40
10.
197
0.15
70.
157
0.42
10.
443
0.27
00.
034
0.18
70.
278
0.34
00.
186
0.03
2B
ache
lor's
deg
ree
or m
ore
7,44
0 0.
133
0.35
10.
446
0.36
70.
087
0.08
70.
314
0.41
5 0.
421
0.16
30.
098
0.20
20.
295
0.24
70.
134
Don
’t kn
ow
830
0.19
50.
425
0.44
60.
319
0.06
80.
125
0.40
30.
464
0.38
40.
133
0.14
80.
253
0.29
50.
231
0.10
1†
Not
app
licab
le.
1 Edu
catio
nal e
xpec
tatio
ns o
f 10t
h-gr
ade
stud
ents
. N
OTE
: Bla
ck in
clud
es A
frica
n Am
eric
an, H
ispa
nic
incl
udes
Lat
ino,
Asi
an in
clud
es N
ativ
e H
awai
ian
or O
ther
Pac
ific
Isla
nder
, and
Am
eric
an In
dian
incl
udes
Ala
ska
Nat
ive.
Pr
ofic
ienc
y Le
vels
are
: Lev
el 1
—si
mpl
e ar
ithm
etic
al o
pera
tions
on
who
le n
umbe
rs, s
uch
as s
impl
e ar
ithm
etic
exp
ress
ions
invo
lvin
g m
ultip
licat
ion
or d
ivis
ion
of in
tege
rs; L
evel
2—
sim
ple
oper
atio
ns
with
dec
imal
s, fr
actio
ns, p
ower
s, a
nd ro
ots,
suc
h as
com
parin
g ex
pres
sion
s, g
iven
info
rmat
ion
abou
t exp
onen
ts; L
evel
3—
sim
ple
prob
lem
sol
ving
, req
uirin
g th
e un
ders
tand
ing
of lo
w-le
vel
mat
hem
atic
al c
once
pts,
suc
h as
sim
plify
ing
an a
lgeb
raic
exp
ress
ion
or c
ompa
ring
the
leng
th o
f lin
e se
gmen
ts il
lust
rate
d in
a d
iagr
am; L
evel
4—
unde
rsta
ndin
g of
inte
rmed
iate
-leve
l mat
hem
atic
al
conc
epts
and
/or m
ultis
tep
solu
tions
to w
ord
prob
lem
s su
ch a
s dr
awin
g an
infe
renc
e ba
sed
on a
n al
gebr
aic
expr
essi
on o
r ine
qual
ity; a
nd L
evel
5—
com
plex
mul
tiste
p w
ord
prob
lem
s an
d/or
ad
vanc
ed m
athe
mat
ics
mat
eria
l suc
h as
a tw
o-st
ep p
robl
em re
quiri
ng e
valu
atio
n of
func
tions
. SO
UR
CE:
U.S
. Dep
artm
ent o
f Edu
catio
n, N
atio
nal C
ente
r for
Edu
catio
n St
atis
tics,
Edu
catio
n Lo
ngitu
dina
l Stu
dy o
f 200
2 (E
LS:2
002)
, “Ba
se Y
ear,
2002
” and
“Firs
t Fol
low
-up,
200
4.”
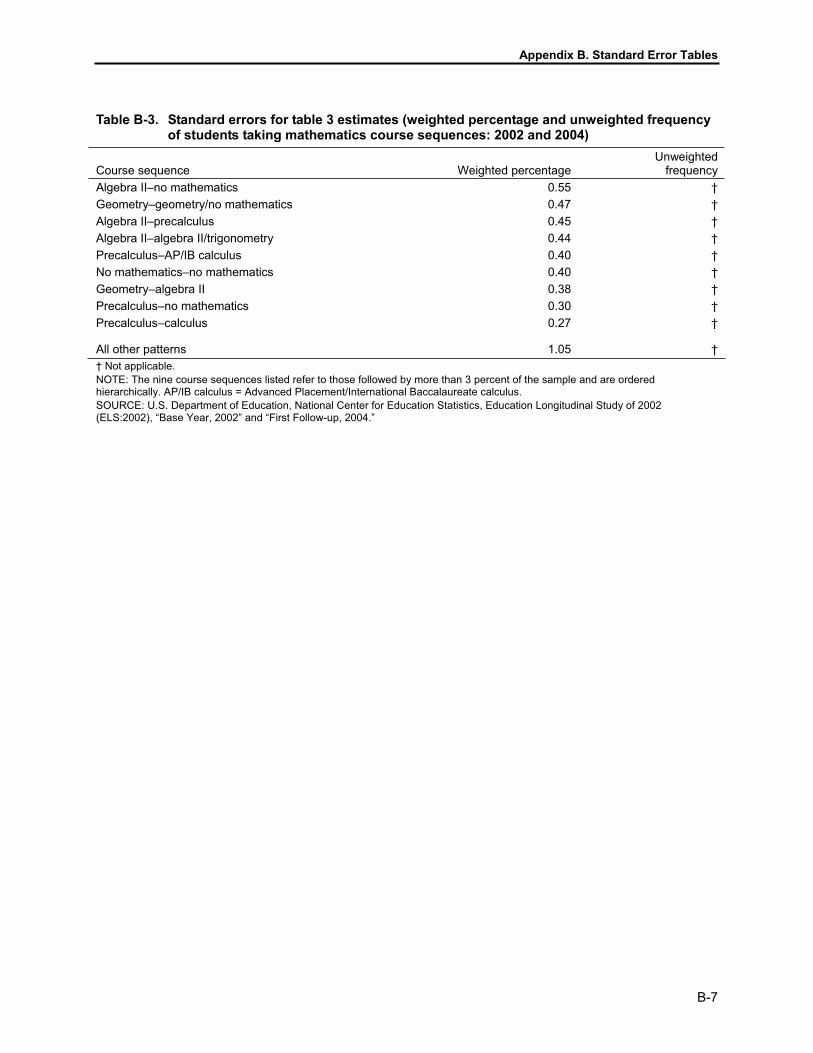
Appendix B. Standard Error Tables
B-7
Table B-3. Standard errors for table 3 estimates (weighted percentage and unweighted frequency of students taking mathematics course sequences: 2002 and 2004)
Course sequence Weighted percentage Unweighted
frequency Algebra II–no mathematics 0.55 † Geometry–geometry/no mathematics 0.47 † Algebra II–precalculus 0.45 † Algebra II–algebra II/trigonometry 0.44 † Precalculus–AP/IB calculus 0.40 † No mathematics–no mathematics 0.40 † Geometry–algebra II 0.38 † Precalculus–no mathematics 0.30 † Precalculus–calculus 0.27 †
All other patterns 1.05 † † Not applicable. NOTE: The nine course sequences listed refer to those followed by more than 3 percent of the sample and are ordered hierarchically. AP/IB calculus = Advanced Placement/International Baccalaureate calculus. SOURCE: U.S. Department of Education, National Center for Education Statistics, Education Longitudinal Study of 2002 (ELS:2002), “Base Year, 2002” and “First Follow-up, 2004.”

Appendix B. Standard Error Tables
B-8
Tabl
e B
-4.
Stan
dard
err
ors
for t
able
4 e
stim
ates
(per
cent
age
of s
tude
nts
taki
ng m
athe
mat
ics
cour
se s
eque
nces
, by
sele
cted
stu
dent
char
acte
ristic
s: 2
002
and
2004
) C
ours
e se
quen
ce
Stu
dent
cha
ract
eris
tic
No
mat
hem
atic
s–no
mat
hem
atic
s
Geo
met
ry–
geom
etry
/no
mat
hem
atic
sG
eom
etry
–alg
ebra
II
Alg
ebra
II– no
mat
hem
atic
s
Alg
ebra
II–
alge
bra
II/
trigo
nom
etry
Alg
ebra
II–
pre-
calc
ulus
Pre
-ca
lcul
us–n
om
athe
mat
ics
Pre
-ca
lcul
us–
calc
ulus
Pre
-ca
lcul
us–
AP
/IBca
lcul
usA
ll ot
her
patte
rns
Tota
l 0.
40
0.47
0.
38
0.55
0.
44
0.45
0.
30
0.27
0.
40
1.05
Sex
Fe
mal
e 0.
44
0.52
0.
49
0.67
0.
59
0.56
0.
42
0.29
0.
48
1.25
M
ale
0.53
0.
58
0.46
0.
71
0.47
0.
52
0.37
0.
36
0.52
1.
20
Rac
e/et
hnic
ity
Whi
te
0.49
0.
53
0.38
0.
66
0.52
0.
53
0.39
0.
37
0.54
1.
25
Bla
ck
0.87
1.
08
1.42
1.
65
1.34
1.
06
0.56
0.
22
0.57
2.
59
His
pani
c 0.
81
1.29
1.
21
1.32
0.
68
0.93
0.
79
0.22
0.
73
2.12
A
sian
0.
71
1.38
0.
75
1.95
0.
77
1.28
0.
41
0.52
2.
17
3.02
A
mer
ican
Indi
an
6.77
3.
23
2.79
3.
04
1.30
3.
39
† †
2.66
6.
92
Mor
e th
an o
ne ra
ce
1.50
1.
82
1.28
2.
02
1.50
1.
23
1.60
0.
71
1.09
3.
12
Soc
ioec
onom
ic s
tatu
s
Q
uarti
le 1
(low
) 0.
86
1.09
0.
72
0.99
0.
69
0.65
0.
38
0.16
0.
56
1.58
Q
uarti
le 2
0.
70
0.89
0.
60
0.96
0.
67
0.60
0.
47
0.26
0.
44
1.58
Q
uarti
le 3
0.
69
0.75
0.
63
0.99
0.
63
0.70
0.
52
0.45
0.
59
1.66
Q
uarti
le 4
(hig
h)
0.38
0.
47
0.53
0.
79
0.71
0.
84
0.57
0.
52
0.82
1.
58
Sch
ool s
ecto
r
P
ublic
0.
44
0.51
0.
41
0.59
0.
45
0.47
0.
33
0.28
0.
42
1.12
C
atho
lic
0.38
0.
50
0.98
1.
59
2.04
1.
86
0.77
1.
26
1.36
3.
77
Oth
er p
rivat
e
0.55
0.
79
0.77
1.
55
3.06
2.
41
1.42
2.
09
1.73
4.
65
Fam
ily c
ompo
sitio
n
M
othe
r and
fath
er
0.47
0.
55
0.40
0.
71
0.47
0.
53
0.41
0.
34
0.51
1.
24
Mot
her o
r fat
her a
nd g
uard
ian
0.81
0.
86
0.75
1.
26
0.83
0.
98
0.55
0.
27
0.56
1.
89
Sin
gle
pare
nt
0.71
0.
91
0.84
1.
07
0.80
0.
69
0.46
0.
41
0.58
1.
65
Oth
er
1.81
2.
05
1.37
2.
15
1.72
1.
44
1.09
0.
53
1.41
3.
77
See
note
s at
end
of t
able
.

Appendix B. Standard Error Tables
B-9
Tabl
e B
-4.
Stan
dard
err
ors
for t
able
4 e
stim
ates
(per
cent
age
of s
tude
nts
taki
ng m
athe
mat
ics
cour
se s
eque
nces
, by
sele
cted
stu
dent
char
acte
ristic
s: 2
002–
2004
)—C
ontin
ued
Cou
rse
sequ
ence
Stu
dent
cha
ract
eris
tic
No
mat
hem
atic
s–no
mat
hem
atic
s
Geo
met
ry–
geom
etry
/no
mat
hem
atic
sG
eom
etry
–alg
ebra
II
Alg
ebra
II– no
mat
hem
atic
s
Alg
ebra
II–
alge
bra
II/
trigo
nom
etry
Alg
ebra
II–
pre-
calc
ulus
Pre
-ca
lcul
us–n
om
athe
mat
ics
Pre
-ca
lcul
us–
calc
ulus
Pre
-ca
lcul
us–
AP
/IBca
lcul
usA
ll ot
her
patte
rns
Stu
dent
's e
duca
tiona
l ex
pect
atio
ns1
Hig
h sc
hool
or l
ess
2.38
2.
02
1.44
1.
65
0.99
0.
40
0.59
0.
27
0.08
2.
88
Som
e co
llege
1.
83
1.78
1.
02
1.58
0.
67
0.55
0.
43
0.10
0.
34
2.53
B
ache
lor's
deg
ree
or m
ore
0.33
0.
47
0.41
0.
58
0.52
0.
55
0.38
0.
33
0.48
1.
15
Don
’t kn
ow
1.22
1.
11
1.01
1.
49
0.56
0.
74
0.56
0.
46
1.08
2.
13
† N
ot a
pplic
able
. 1 E
duca
tiona
l exp
ecta
tions
of 1
0th-
grad
e st
uden
ts.
NO
TE: B
lack
incl
udes
Afri
can
Amer
ican
, His
pani
c in
clud
es L
atin
o, A
sian
incl
udes
Nat
ive
Haw
aiia
n or
Oth
er P
acifi
c Is
land
er, a
nd A
mer
ican
Indi
an in
clud
es A
lask
a N
ativ
e. A
P/IB
cal
culu
s =
Adva
nced
Pla
cem
ent/I
nter
natio
nal B
acca
laur
eate
cal
culu
s. T
he n
ine
cour
se s
eque
nces
list
ed re
fer t
o th
ose
follo
wed
by
mor
e th
an 3
per
cent
of t
he s
ampl
e an
d ar
e or
dere
d hi
erar
chic
ally
. SO
UR
CE:
U.S
. Dep
artm
ent o
f Edu
catio
n, N
atio
nal C
ente
r for
Edu
catio
n St
atis
tics,
Edu
catio
n Lo
ngitu
dina
l Stu
dy o
f 200
2 (E
LS:2
002)
, “Ba
se Y
ear,
2002
” and
“Firs
t Fol
low
-up,
200
4.”
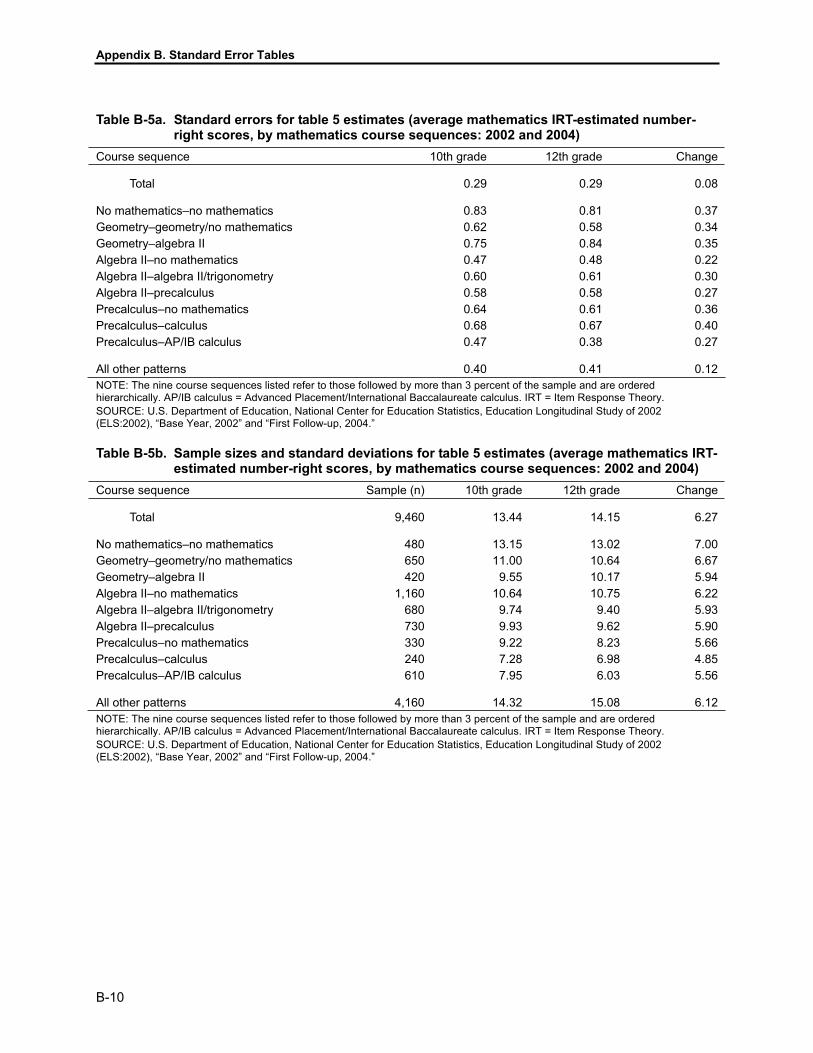
Appendix B. Standard Error Tables
B-10
Table B-5a. Standard errors for table 5 estimates (average mathematics IRT-estimated number-right scores, by mathematics course sequences: 2002 and 2004)
Course sequence 10th grade 12th grade Change
Total 0.29 0.29 0.08
No mathematics–no mathematics 0.83 0.81 0.37 Geometry–geometry/no mathematics 0.62 0.58 0.34 Geometry–algebra II 0.75 0.84 0.35 Algebra II–no mathematics 0.47 0.48 0.22 Algebra II–algebra II/trigonometry 0.60 0.61 0.30 Algebra II–precalculus 0.58 0.58 0.27 Precalculus–no mathematics 0.64 0.61 0.36 Precalculus–calculus 0.68 0.67 0.40 Precalculus–AP/IB calculus 0.47 0.38 0.27
All other patterns 0.40 0.41 0.12 NOTE: The nine course sequences listed refer to those followed by more than 3 percent of the sample and are ordered hierarchically. AP/IB calculus = Advanced Placement/International Baccalaureate calculus. IRT = Item Response Theory. SOURCE: U.S. Department of Education, National Center for Education Statistics, Education Longitudinal Study of 2002 (ELS:2002), “Base Year, 2002” and “First Follow-up, 2004.”
Table B-5b. Sample sizes and standard deviations for table 5 estimates (average mathematics IRT-estimated number-right scores, by mathematics course sequences: 2002 and 2004)
Course sequence Sample (n) 10th grade 12th grade Change
Total 9,460 13.44 14.15 6.27
No mathematics–no mathematics 480 13.15 13.02 7.00 Geometry–geometry/no mathematics 650 11.00 10.64 6.67 Geometry–algebra II 420 9.55 10.17 5.94 Algebra II–no mathematics 1,160 10.64 10.75 6.22 Algebra II–algebra II/trigonometry 680 9.74 9.40 5.93 Algebra II–precalculus 730 9.93 9.62 5.90 Precalculus–no mathematics 330 9.22 8.23 5.66 Precalculus–calculus 240 7.28 6.98 4.85 Precalculus–AP/IB calculus 610 7.95 6.03 5.56
All other patterns 4,160 14.32 15.08 6.12 NOTE: The nine course sequences listed refer to those followed by more than 3 percent of the sample and are ordered hierarchically. AP/IB calculus = Advanced Placement/International Baccalaureate calculus. IRT = Item Response Theory. SOURCE: U.S. Department of Education, National Center for Education Statistics, Education Longitudinal Study of 2002 (ELS:2002), “Base Year, 2002” and “First Follow-up, 2004.”
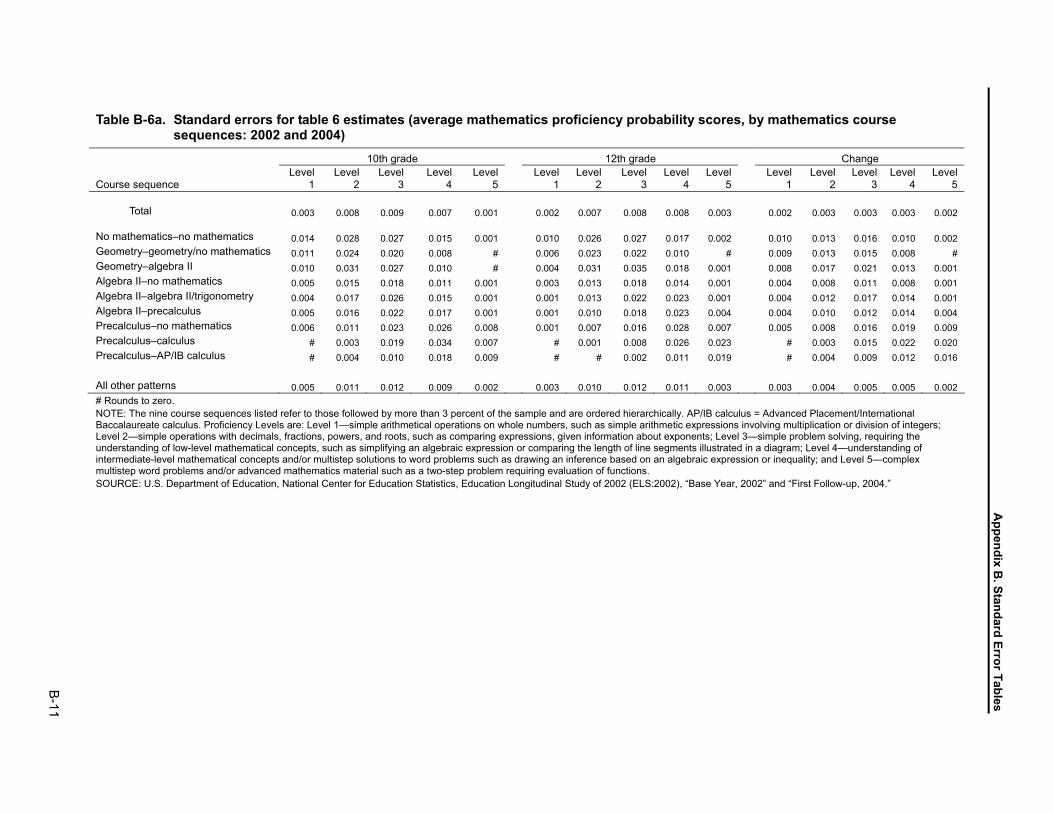
Appendix B
. Standard Error Tables
B-11
Table B-6a. Standard errors for table 6 estimates (average mathematics proficiency probability scores, by mathematics course sequences: 2002 and 2004)
10th grade 12th grade Change
Course sequence Level
1 Level
2 Level
3 Level
4 Level
5 Level
1 Level
2 Level
3 Level
4 Level
5 Level
1 Level
2 Level
3 Level
4 Level
5
Total 0.003 0.008 0.009 0.007 0.001 0.002 0.007 0.008 0.008 0.003 0.002 0.003 0.003 0.003 0.002
No mathematics–no mathematics 0.014 0.028 0.027 0.015 0.001 0.010 0.026 0.027 0.017 0.002 0.010 0.013 0.016 0.010 0.002 Geometry–geometry/no mathematics 0.011 0.024 0.020 0.008 # 0.006 0.023 0.022 0.010 # 0.009 0.013 0.015 0.008 # Geometry–algebra II 0.010 0.031 0.027 0.010 # 0.004 0.031 0.035 0.018 0.001 0.008 0.017 0.021 0.013 0.001 Algebra II–no mathematics 0.005 0.015 0.018 0.011 0.001 0.003 0.013 0.018 0.014 0.001 0.004 0.008 0.011 0.008 0.001 Algebra II–algebra II/trigonometry 0.004 0.017 0.026 0.015 0.001 0.001 0.013 0.022 0.023 0.001 0.004 0.012 0.017 0.014 0.001 Algebra II–precalculus 0.005 0.016 0.022 0.017 0.001 0.001 0.010 0.018 0.023 0.004 0.004 0.010 0.012 0.014 0.004 Precalculus–no mathematics 0.006 0.011 0.023 0.026 0.008 0.001 0.007 0.016 0.028 0.007 0.005 0.008 0.016 0.019 0.009 Precalculus–calculus # 0.003 0.019 0.034 0.007 # 0.001 0.008 0.026 0.023 # 0.003 0.015 0.022 0.020 Precalculus–AP/IB calculus # 0.004 0.010 0.018 0.009 # # 0.002 0.011 0.019 # 0.004 0.009 0.012 0.016 All other patterns 0.005 0.011 0.012 0.009 0.002 0.003 0.010 0.012 0.011 0.003 0.003 0.004 0.005 0.005 0.002 # Rounds to zero. NOTE: The nine course sequences listed refer to those followed by more than 3 percent of the sample and are ordered hierarchically. AP/IB calculus = Advanced Placement/International Baccalaureate calculus. Proficiency Levels are: Level 1—simple arithmetical operations on whole numbers, such as simple arithmetic expressions involving multiplication or division of integers; Level 2—simple operations with decimals, fractions, powers, and roots, such as comparing expressions, given information about exponents; Level 3—simple problem solving, requiring the understanding of low-level mathematical concepts, such as simplifying an algebraic expression or comparing the length of line segments illustrated in a diagram; Level 4—understanding of intermediate-level mathematical concepts and/or multistep solutions to word problems such as drawing an inference based on an algebraic expression or inequality; and Level 5—complex multistep word problems and/or advanced mathematics material such as a two-step problem requiring evaluation of functions. SOURCE: U.S. Department of Education, National Center for Education Statistics, Education Longitudinal Study of 2002 (ELS:2002), “Base Year, 2002” and “First Follow-up, 2004.”
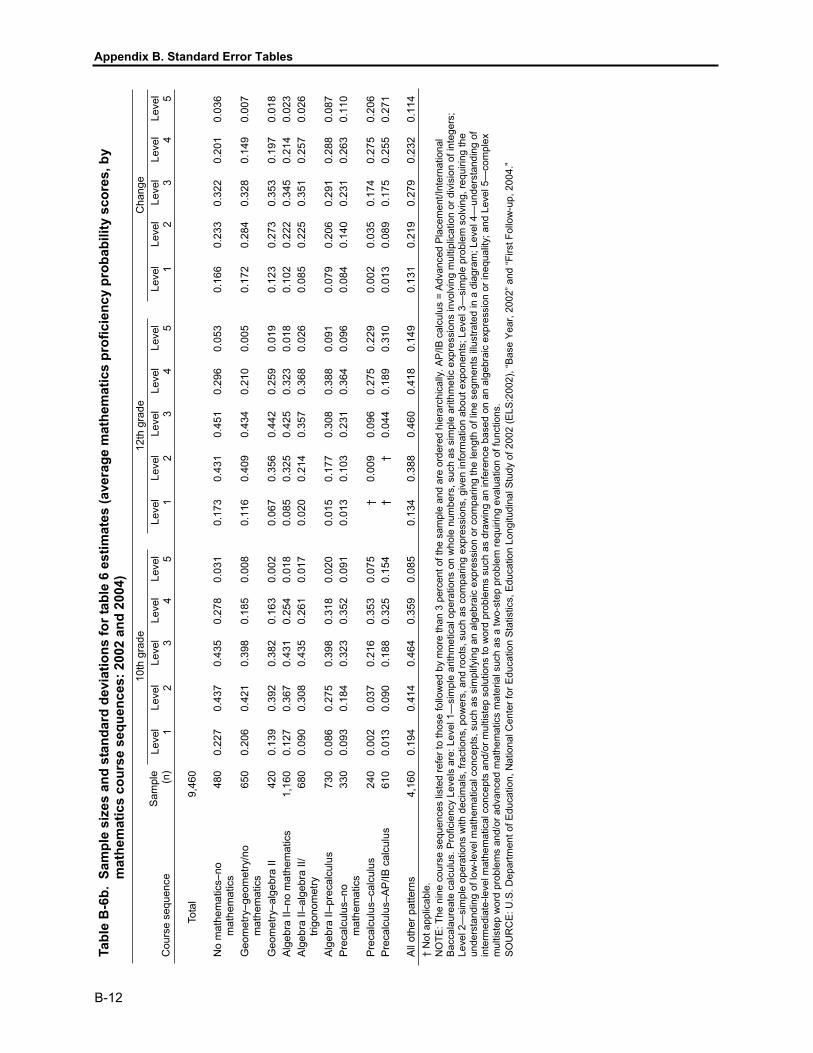
Appendix B. Standard Error Tables
B-12
Tabl
e B
-6b.
Sam
ple
size
s an
d st
anda
rd d
evia
tions
for t
able
6 e
stim
ates
(ave
rage
mat
hem
atic
s pr
ofic
ienc
y pr
obab
ility
sco
res,
by
mat
hem
atic
s co
urse
seq
uenc
es: 2
002
and
2004
) 10
th g
rade
12
th g
rade
C
hang
e
Cou
rse
sequ
ence
S
ampl
e (n)
Leve
l 1Le
vel 2
Leve
l 3Le
vel 4
Leve
l 5Le
vel 1
Leve
l 2Le
vel 3
Leve
l 4Le
vel 5
Leve
l 1Le
vel 2
Leve
l 3Le
vel 4
Leve
l 5
Tota
l 9,
460
No
mat
hem
atic
s–no
m
athe
mat
ics
480
0.22
7 0.
437
0.43
5 0.
278
0.03
1
0.17
3 0.
431
0.45
1 0.
296
0.05
3
0.16
6 0.
233
0.32
2 0.
201
0.03
6
Geo
met
ry–g
eom
etry
/no
mat
hem
atic
s65
0 0.
206
0.42
1 0.
398
0.18
5 0.
008
0.
116
0.40
9 0.
434
0.21
0 0.
005
0.
172
0.28
4 0.
328
0.14
9 0.
007
Geo
met
ry–a
lgeb
ra II
42
0 0.
139
0.39
2 0.
382
0.16
3 0.
002
0.
067
0.35
6 0.
442
0.25
9 0.
019
0.
123
0.27
3 0.
353
0.19
7 0.
018
Alg
ebra
II–n
o m
athe
mat
ics
1,16
0 0.
127
0.36
7 0.
431
0.25
4 0.
018
0.
085
0.32
5 0.
425
0.32
3 0.
018
0.
102
0.22
2 0.
345
0.21
4 0.
023
Alg
ebra
II–a
lgeb
ra II
/ tri
gono
met
ry
680
0.09
0 0.
308
0.43
5 0.
261
0.01
7
0.02
0 0.
214
0.35
7 0.
368
0.02
6
0.08
5 0.
225
0.35
1 0.
257
0.02
6
Alg
ebra
II–p
reca
lcul
us
730
0.08
6 0.
275
0.39
8 0.
318
0.02
0
0.01
5 0.
177
0.30
8 0.
388
0.09
1
0.07
9 0.
206
0.29
1 0.
288
0.08
7 P
reca
lcul
us–n
om
athe
mat
ics
330
0.09
3 0.
184
0.32
3 0.
352
0.09
1
0.01
3 0.
103
0.23
1 0.
364
0.09
6
0.08
4 0.
140
0.23
1 0.
263
0.11
0
Pre
calc
ulus
–cal
culu
s 24
0 0.
002
0.03
7 0.
216
0.35
3 0.
075
†
0.00
9 0.
096
0.27
5 0.
229
0.
002
0.03
5 0.
174
0.27
5 0.
206
Pre
calc
ulus
–AP
/IB c
alcu
lus
610
0.01
3 0.
090
0.18
8 0.
325
0.15
4
† †
0.04
4 0.
189
0.31
0
0.01
3 0.
089
0.17
5 0.
255
0.27
1
All
othe
r pat
tern
s 4,
160
0.19
4 0.
414
0.46
4 0.
359
0.08
5
0.13
4 0.
388
0.46
0 0.
418
0.14
9
0.13
1 0.
219
0.27
9 0.
232
0.11
4 †
Not
app
licab
le.
NO
TE: T
he n
ine
cour
se s
eque
nces
list
ed re
fer t
o th
ose
follo
wed
by
mor
e th
an 3
per
cent
of t
he s
ampl
e an
d ar
e or
dere
d hi
erar
chic
ally
. AP/
IB c
alcu
lus
= Ad
vanc
ed P
lace
men
t/Int
erna
tiona
l Ba
ccal
aure
ate
calc
ulus
. Pro
ficie
ncy
Leve
ls a
re: L
evel
1—
sim
ple
arith
met
ical
ope
ratio
ns o
n w
hole
num
bers
, suc
h as
sim
ple
arith
met
ic e
xpre
ssio
ns in
volv
ing
mul
tiplic
atio
n or
div
isio
n of
inte
gers
; Le
vel 2
—si
mpl
e op
erat
ions
with
dec
imal
s, fr
actio
ns, p
ower
s, a
nd ro
ots,
suc
h as
com
parin
g ex
pres
sion
s, g
iven
info
rmat
ion
abou
t exp
onen
ts; L
evel
3—
sim
ple
prob
lem
sol
ving
, req
uirin
g th
e un
ders
tand
ing
of lo
w-le
vel m
athe
mat
ical
con
cept
s, s
uch
as s
impl
ifyin
g an
alg
ebra
ic e
xpre
ssio
n or
com
parin
g th
e le
ngth
of l
ine
segm
ents
illu
stra
ted
in a
dia
gram
; Lev
el 4
—un
ders
tand
ing
of
inte
rmed
iate
-leve
l mat
hem
atic
al c
once
pts
and/
or m
ultis
tep
solu
tions
to w
ord
prob
lem
s su
ch a
s dr
awin
g an
infe
renc
e ba
sed
on a
n al
gebr
aic
expr
essi
on o
r ine
qual
ity; a
nd L
evel
5—
com
plex
m
ultis
tep
wor
d pr
oble
ms
and/
or a
dvan
ced
mat
hem
atic
s m
ater
ial s
uch
as a
two-
step
pro
blem
requ
iring
eva
luat
ion
of fu
nctio
ns.
SOU
RC
E: U
.S. D
epar
tmen
t of E
duca
tion,
Nat
iona
l Cen
ter f
or E
duca
tion
Stat
istic
s, E
duca
tion
Long
itudi
nal S
tudy
of 2
002
(ELS
:200
2), “
Base
Yea
r, 20
02” a
nd “F
irst F
ollo
w-u
p, 2
004.
”