High School Coursetaking
40
- U.S. Department of Education NCES 2007 065 High School Coursetaking Findings from The Condition of Education 2007
Transcript of High School Coursetaking

-U.S. Department of Education NCES 2007 065
High School Coursetaking Findings from The Condition of Education 2007

This page intentionally left blank.

High School Coursetaking Findings from The Condition of Education 2007
U.S. Department of Education NCES 2007-065
June 2007
Michael Planty Stephen Provasnik National Center for Education Statistics
Bruce Daniel KForce

U.S. Department of Education Margaret Spellings Secretary
Institute of Education Sciences Grover J. Whitehurst Director
National Center for Education Statistics Mark Schneider Commissioner
The National Center for Education Statistics (NCES) is the primary federal entity for collecting,analyzing, and reporting data related to education in the United States and other nations. It fulfills a congressional mandatetocollect,collate,analyze,andreportfullandcompletestatisticsontheconditionofeducation in the United States; conduct and publish reports and specialized analyses of the meaning and significance of such statistics; assist state and local education agencies in improving their statistical systems; and review and report on education activities in other countries.
NCES activities are designed to address high-priority education data needs; provide consistent, reliable, complete, and accurate indicators of education status and trends; and report timely, useful, and high-quality data to the U.S. Department of Education, the Congress, the states, other education policymakers, practitioners, data users, and the general public. Unless specifically noted, all information contained herein is in the public domain.
We strive to make our products available in a variety of formats and in language that is appropriate to a variety of audiences. You, as our customer, are the best judge of our success in communicating information effectively. If you have any comments or suggestions about this or any other U.S. Department of Education, National Center for Education Statistics product or report, we would like to hear from you. Please direct your comments to
National Center for Education Statistics Institute of Education Sciences U.S. Department of Education 1990 K Street, NW Washington, DC 20006–5651
June 2007
The NCES World Wide Web Home Page is http://nces.ed.gov. The NCES World Wide Web Electronic Catalog is http://nces.ed.gov/pubsearch.
Suggested Citation
Planty, M., Provasnik, S., and Daniel, B. (2007). High School Coursetaking: Findings from The Condition of Education 2007 (NCES 2007-065). U.S. Department of Education. Washington, DC: National Center for Education Statistics.
For ordering information on this report, write to
U.S. Department of Education ED Pubs P.O. Box 1398 Jessup, MD 20794–1398
call toll free 1–877–4ED–PUBS; or order online at http://www.edpubs.org.
Content Contact Michael Planty (202) 502–7312 [email protected]

High School
Preface
The Condition of Education summarizes im-portant developments and trends in education using the latest available data. The report, which is required by law, is an indicator report intended for a general audience of readers who are interested in education. The indicators represent a consensus of professional judgment on the most significant national measures of the condition and progress of education for which accurate data are available. The 2007 print edition includes 48 indicators in five main areas: (1) enrollment trends and student characteristics at all levels of the education system from early childhood education to graduate and first-professional programs; (2) student achievement and the longer term, en-during effects of education; (3) student effort and rates of progress through the educational system among different population groups;
education in terms of courses taken, teacher characteristics, and other factors; and (5) the contexts of postsecondary education.
The 2007 edition also includes a special analysis that examines changes in student coursetaking in high school using national transcript data from 1982 to 2005. To make the special analysis available to audiences interested in the course-taking patterns and trends of U.S. high school students, the special analysis is reprinted here as a separate volume. Technical notes about the data sources, methodology, and standard errors are included at the end of this booklet.
Special analyses included in the 2000–07 editions of The Condition of Education are available both as booklets and in the full print volumes. They are also available on the NCES Condition of Education website (http://nces. ed.gov/programs/coe).
Findings from The Condition of Education 2007 | Page 1

High School
High School
INTRODUCTION
Using the national data from high school tran-script studies conducted from 1982 to 2005, this special analysis addresses the following questions related to students’ coursetaking patterns and trends during this period:
What do states require and what do schools offer for coursework?
How many course credits do students earn by high school graduation, on average, and how has the number of credits changed, overall and by subject, since the
What percentage of high school graduates complete advanced courses in science, in mathematics, in English, and in foreign languages?
Do these percentages vary across student characteristics, including sex, race/ethnicity, and school control?
What is the coursetaking pattern in 9th and 10th grades for students who drop out compared with students who graduate?
Whatpercentageofhighschoolstudentstake Advanced Placement (AP) examinations, and how well do they do?
The first section of this special analysis describes state-levelstandardsrelatedtocourseworkand high school exit examinations in all 50 states and the District of Columbia, which is treated as a state in this analysis. This is followed by a discussion of the availability of advanced course offerings in public schools.1 Both re-quirements and offerings provide a context for examining the patterns of student coursetak-ing as they relate to minimum standards and expectations. The second section describes the number and types of credits that public and
Page 2 | Findings from The Condition of Education 2007
private high school graduates earned. It then examines the percentages and characteristics of public and private high school graduates who took advanced courses in science, math-ematics, English, and foreign languages. The special analysis concludes with a summary of key findings.
REQUIREMENTS AND OFFERINGS
State Standards for Coursetaking
Many states have enacted minimum require-ments for graduation that focus on the number and types of courses that students take in high school and the passing of standardized state tests of proficiency or competency in specific subjects. Starting in the early 1980s, many states adopted or added requirements patterned after the New Basics coursetaking standards recommended by the National Commission on Excellence in Education (NCEE) for high school graduation (Alexander and Pallas 1984; Chaney, Burgdorf, and Atash 1997). First ar- ticulated in A Nation at Risk (NCEE 1983), the New Basics recommendations called for all high school students to complete 4 years of English; 3 years each of mathematics, science, and social studies; and a half-year of computer science. For college-bound students, the New Basics also called for the completion of 2 years of a foreign language.
Currently, 37 states now require public high school students to take at least 20 credits (in Carnegie units2) of coursework; 8 states require fewer than 20 credits; and other states’ course graduation requirements are determined locally (see table 1).3 Of those states with coursetak- ing requirements, 37 require 4 or more years of English, 31 require 3 or more years of social studies, 27 require 3 or more years of mathematics, and

High School
Table1. Statecourseworkrequirements for highschoolgraduation inCarnegieunits: 2005
English/ Health/ All language Social Math- physical Arts/ Foreign
State courses arts studies ematics Science education vocation language
Alabama 24 4 4 4 4 1.5 0.5 0 Alaska 21 4 3 2 2 1 0 0 Arizona 20 4 2.5 2 2 0 1 0 Arkansas 21 4 3 3 3 1 0.5 0 California 13 3 3 2 2 2 1 12
Colorado (1) † † † † † † † Connecticut 20 4 3 3 2 1 1 0 Delaware 22 4 3 3 3 1.5 0 0 District of Columbia 23.5 4 3.5 3 3 1.5 1 2 Florida 24 4 3 3 3 1 1 0 Georgia 22 4 3 4 3 1 0 2 Hawaii 22 4 4 3 3 1.5 0 0 Idaho 21 4.5 2.5 2 2 0.5 1 12
Illinois 16 3 2 2 1 0.5 1 12
Indiana 20 4 2 2 2 1 0 0 Iowa (1) † 1.5 † † † † † Kansas 21 4 3 2 2 1 0 0 Kentucky 22 4 3 3 3 1 1 0 Louisiana 23 4 3 3 3 2 0 0 Maine 16 4 2 2 2 1.5 1 0 Maryland 21 4 3 3 3 1 1 2 Massachusetts (1) † † † † † † † Michigan (1) † 0.5 † † † † † Minnesota 21.53 † † † † 0 † 0 Mississippi 20 4 3 3 3 0.5 1 0 Missouri 22 3 2 2 2 1 1 0 Montana 20 4 2 2 2 1 1 0 Nebraska (1) † † † † † † † Nevada 22.5 4 2 3 2 2.5 1 0 NewHampshire 19.75 4 2.5 2 2 1.25 0.5 0 NewJersey 22 4 3 3 3 3 2 0 NewMexico 23 4 3 3 2 1 0 0 NewYork 22 4 4 3 3 2.5 1 1 North Carolina 20 4 3 4 3 1 0 2 North Dakota 21 † † † † † † † Ohio 20 4 3 3 3 1 0 0 Oklahoma 23 4 3 3 3 0 2 0 Oregon 22 3 3 2 2 2 1 1 Pennsylvania4 † † † † † † † † RhodeIsland 18 4 2 3 2 1.5 0.5 2 SouthCarolina 24 4 3 4 3 1 0 1 SouthDakota 22 4 3 2 2 0 1 0 Tennessee 20 4 3 3 3 1 1 2 See notes at end of table.
Findings from The Condition of Education 2007 | Page 3

High School
Table1. Statecourseworkrequirements forhighschool graduation inCarnegieunits: 2005—Continued
English/ Health/ All language Social Math- physical Arts/ Foreign
State courses arts studies ematics Science education vocation language Texas 24 4 4 3 3 2 1 2 Utah 15 3 2.5 2 2 2 1.5 0 Vermont 20 4 3 3 3 1.5 1 0 Virginia 22 4 3 3 3 2 1 0 Washington 19 3 2.5 2 2 2 0 0 WestVirginia 24 4 3 3 3 2 1 0 Wisconsin 21.5 4 3 2 2 2 0 0 Wyoming 13 4 3 3 3 0 0 0 † Not applicable. 1 Graduation requirements are determined locally. 2 1.0 credit required in Foreign language or Arts, not both. 3 Effective class of 2008. 4 State minimum credit requirements have been phased out in Pennsylvania. Each school district (including charter schools) shall specify requirements for graduation in a strategic plan requiring state approval.To graduate, students must demonstrate profciency in reading, writing, and mathematics on either state or local assessments aligned with state guidelines. NOTE:Local school districts frequently have other graduation requirements in addition to state requirements.English/language arts can include English, reading, literature, creative writing, etc. Mathematics can include basic math, algebra I and II, geometry, precalculus, calculus, statistics, etc.Social studies can include world history, U.S. his-tory, geography, economics, government, etc. Science can include biology, chemistry, physics, anatomy, earth science, etc. Arts/vocation can include fne arts, practical arts, vocational, or career preparatory credits.Technology can include computer literacy, computer technology, technology competency, etc.The Carnegie unit is a standard of measurement that represents 1.0 credit for the completion of a 1-year course. SOURCE: Education Commission of the States (ECS). (2006). Standard High School Graduation Requirements (50-state).
State Standards for Exit Exams
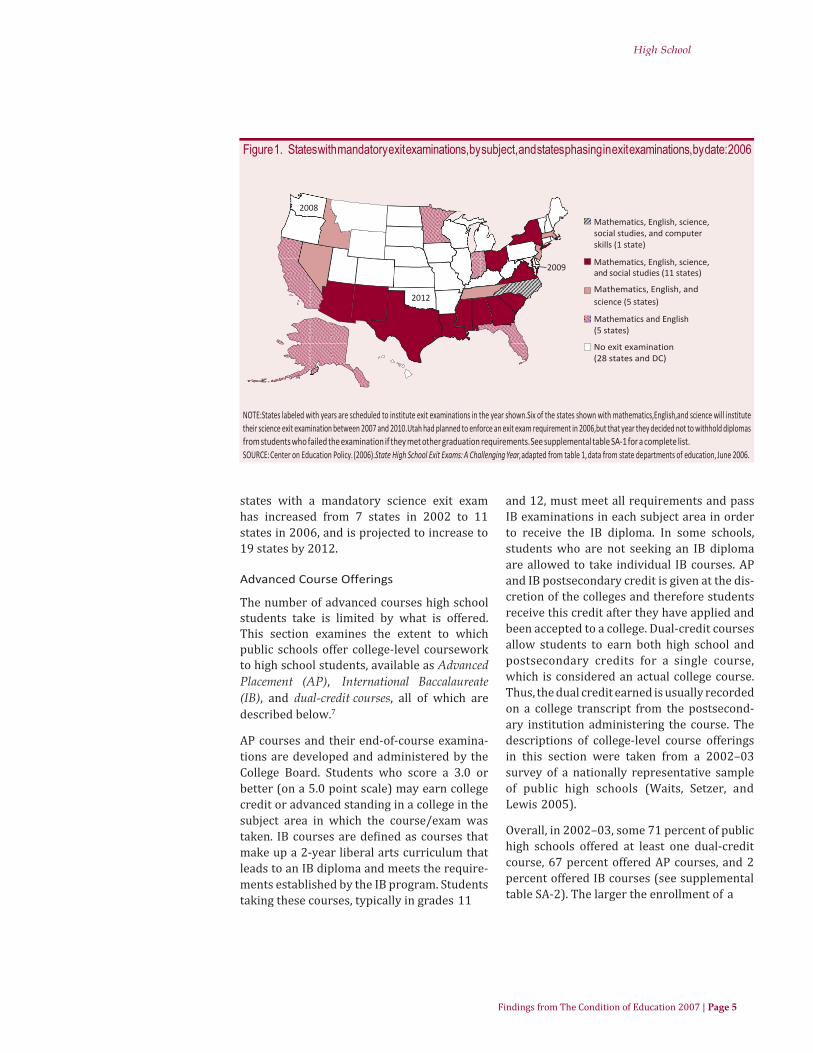
Along with course requirements, in 2006, some 22 states required public school students (and, in a few states, private school students4) to pass high school exit examinations to receive a high school diploma (see figure 1) (Center on Education Policy [CEP] 2006). Three more states will adopt such “exit exams” between 2008 and 2012: Washington in 2008, Mary-land in 2009,5 and Oklahoma in 2012. Most of these 25 states’ exit exams are aligned with 10th-grade proficiency standards or higher, but some are aligned with 8th- and 9th-grade proficiency standards.
In 2006, some 65 percent of the nation’s public high school students were enrolled in a school with an exit exam requirement (CEP 2006). High school exit exam requirements are most prevalent in the southern and western states. The few exceptions are in Indiana, Massa- chusetts, Minnesota, New Jersey, New York, and Ohio.
Given this geographic distribution, minority public school students are the group most affected by state exit exam requirements: 76 percent of minority public high school students were required to pass an exit exam for gradu- ation in 2006, compared with 58 percent of all White public high school students (CEP 2006, table 2).
The number of examinations required for graduation and the subjects in which they are required vary by state (see supplemental table SA-1). In the 22 states with exit exams in effect and in the 3 states with exit exams that will go into effect between 2008 and 2012, students must pass both an English/language arts and a mathematics exit exam. In addition, 19 of these 25 states will require an exam in science by 2012, and 13 states will require a U.S. his- tory/social studies exam.6
Since 2002, all states with an exit exam have required both an English/language arts and a mathematics exam. The total number of
Page 4 | Findings from The Condition of Education 2007
High School
Figure1. Stateswithmandatoryexitexaminations,bysubject,andstatesphasinginexitexaminations,bydate:2006
2008 Mathematics, English, science, social studies, and computer skills (1 state)
2009 Mathematics, English, science, and social studies (11 states)
Mathematics, English, and 2012 science (5 states)
Mathematics and English (5 states)
No exit examination (28 states and DC)
NOTE:States labeled with years are scheduled to institute exit examinations in the year shown.Six of the states shown with mathematics,English,and science will institute their science exit examination between 2007 and 2010.Utah had planned to enforce an exit exam requirement in 2006,but that year they decided not to withhold diplomas from students who failed the examination if they met other graduation requirements.See supplemental table SA-1 for a complete list. SOURCE: Center on Education Policy. (2006).State High School Exit Exams: A Challenging Year,adapted from table 1,data from state departments of education, June 2006.
states with a mandatory science exit exam has increased from 7 states in 2002 to 11 states in 2006, and is projected to increase to 19 states by 2012.
Advanced Course Offerings
The number of advanced courses high school students take is limited by what is offered. This section examines the extent to which public schools offer college-level coursework to high school students, available as Advanced Placement (AP), International Baccalaureate (IB), and dual-credit courses, all of which are described below.7
AP courses and their end-of-course examina-tions are developed and administered by the College Board. Students who score a 3.0 or better (on a 5.0 point scale) may earn college credit or advanced standing in a college in the subject area in which the course/exam was taken. IB courses are defined as courses that make up a 2-year liberal arts curriculum that leads to an IB diploma and meets the require-ments established by the IB program. Students taking these courses, typically in grades 11
and 12, must meet all requirements and pass IB examinations in each subject area in order to receive the IB diploma. In some schools, students who are not seeking an IB diploma are allowed to take individual IB courses. AP and IB postsecondary credit is given at the dis-cretion of the colleges and therefore students receive this credit after they have applied and been accepted to a college. Dual-credit courses allow students to earn both high school and postsecondary credits for a single course, which is considered an actual college course. Thus, the dual credit earned is usually recorded on a college transcript from the postsecond-ary institution administering the course. The descriptions of college-level course offerings in this section were taken from a 2002–03 survey of a nationally representative sample of public high schools (Waits, Setzer, and Lewis 2005).
Overall, in 2002–03, some 71 percent of public high schools offered at least one dual-credit course, 67 percent offered AP courses, and 2 percent offered IB courses (see supplemental table SA-2). The larger the enrollment of a
Findings from The Condition of Education 2007 | Page 5

High School
school, the more likely that school was to of-fer AP and/or dual-credit courses: 40 percent of small schools (those with an enrollment of less than 500) offered AP courses, compared with 82 percent of medium-sized schools (those with an enrollment of 500 to 1,199) and 97 percent of large schools (those with an enrollment of 1,200 or more) (see figure 2). Similarly, 63 percent of small schools of-fered courses for dual credit, compared with 75 percent of medium-sized schools and 82 percent of large schools.
Public schools located in rural areas were less likely to report offering AP courses (50 percent) than public schools in cities (77 percent), urban fringe areas (87 percent), and towns (72 per- cent) (see supplemental table SA-2). Dual-credit courses, in contrast, were less likely to be of- fered in public schools located in cities than in public schools located
areas (65 vs. 79 and 74 percent, respectively). Seventy percent of rural schools offered courses for dual credit.
Public schools with the lowest minority en-rollment (those in which minority students made up less than 6 percent of the enrollment) were the least likely to offer AP courses when compared with schools with higher minority enrollments. Among public schools that offered dual credits, however, schools with the highest minority enrollment were the least likely to of- fer these courses when compared with schools with lower minority enrollments.
State standards and advanced course offerings provide a context for understanding student coursetaking patterns. The next section pres-ents trends in the coursetaking patterns of high school graduates over more than two decades,
Figure 2. Percentage of public high schools that offered dual-credit courses,Advanced Placement (AP),and Interna-tional Baccalaureate (IB),by school enrollment: 2002–03
63
Dual-credit 75
82
40 Enrollment size
Advanced 82 Less than500
Placement 500–1,199 97 1,200 or more
# International 2
Baccalaureate 7
0 20 40 60 80 100
Percent
# Rounds to zero. NOTE: Dual-credit courses allow students to earn both high school and postsecondary credits for a single course. AP courses and their end-of-course examinations are developed and administered by The College Board and allow students to earn postsecondary credit. IB courses are defned as courses that make up a 2-year liberal arts curriculum that leads to an IB diploma. SOURCE:U.S.Department of Education,National Center for Education Statistics,Fast Response Survey System (FRSS),“Dual Credit and Exam-based Courses,”FRSS 85,2003.
Page 6 | Findings from The Condition of Education 2007

High School
COURSETAKING PATTERNS
National data on public and private high school student coursetaking and educational attain-ment come from two sets of surveys sponsored by the U.S. Department of Education’s National Center for Education Statistics (NCES): the high school longitudinal transcript studies—includ- ing the High School and Beyond Longitudinal Study of 1980 Sophomores, “First Follow-up” (HS&B-So:80/82); the National Education Longitudinal Study of 1988 (NELS:88/92), “Second Follow-up, High School Transcript Survey, 1992”; and the Education Longitudinal Study of 2002 (ELS:2002/04), “High School Transcript Study”—and the National Assess-ment of Educational Progress (NAEP) High School Transcript Studies (HSTS), selected years, 1987–2005.
The high school longitudinal transcript studies provide information on graduates of public and private high schools in 1982, 1992, and 2004. The NAEP High School Transcript Studies (HSTS) cover the experiences of public and private high school graduates in 1987, 1990, 1994, 1998, 2000, and 2005. The HSTS gath-ers information from the transcripts of students in public and private schools nationwide. Both survey systems are part of larger studies that track students’ performance in high school.
Credits on a student’s transcript quantify the amount of coursework that a student has com-pleted. Credits can be organized by subject and placed in taxonomies, each of which includes courses either of similar academic challenge and difficulty or at the same stage in the progres-sion of learning in a subject.8 However, because credits cannot measure the breadth or depth of the course content, they cannot be used to measure how the curriculum may have changed over time or how much high school courses with similar transcript titles vary
Transcript data recording the number of credits that students earned in all their high school classes were collected from nationally representative samples of high school students beginning with the longitudinal study in 1982. Drawing upon these data, the next section of this analysis presents trends in the coursetak- ing patterns of public and private high school graduates between 1982
Credits Earned
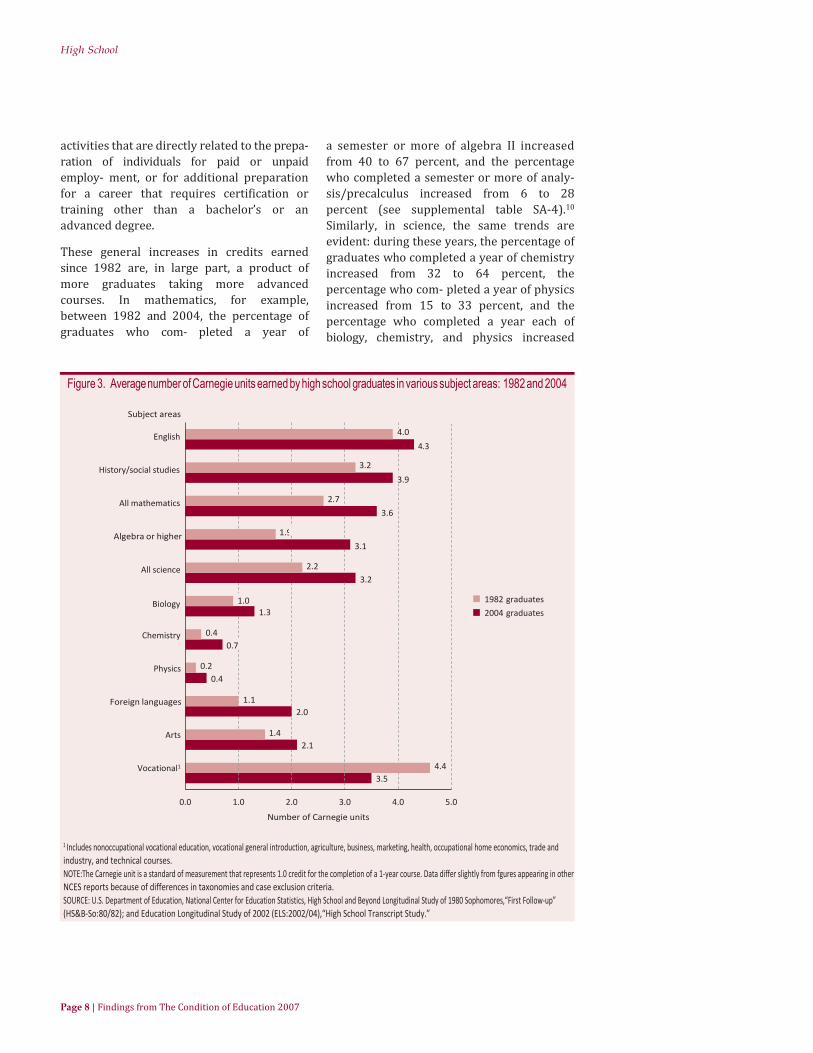
From the early 1980s, when states began to increase the number of courses required to receive a high school diploma, the average number of credits earned by high school gradu-ates increased from 21.7 credits in 1982 to 25.8 credits in 2004 (see supplemental table SA-3). When looking at the number of credits earned by subject in 2004 versus 1982, graduates earned an average of 4.3 versus 4.0 credits in English, 3.6 versus 2.7 credits in mathemat-ics, and 3.2 versus 2.2 credits in science. The amount of college-preparatory coursetaking in mathematics and science also increased mark- edly between 1982 and 2004. For example, the average number of credits that graduates earned in algebra and more advanced math- ematics courses increased from 1.9 to 3.1; in chemistry, it increased from 0.4 to 0.7; and in physics, it increased from 0.2 to 0.4.
These increases in credits earned in mathemat- ics, English, and science have not coincided with a decline in other coursework. In fact, credits earned in other subjects have increased. For example, comparing 1982 and 2004, grad- uates earned an average of 3.2 versus 3.9 credits in history/social studies, 1.4 versus 2.1 in arts, and 1.1 versus 2.0 credits in foreign languages (see figure 3). The only subject area in which the number of credits earned has decreased over this time period is vocational coursetak- ing. Vocational coursetaking decreased, from an average of 4.4 credits earned in 1982 to 3.5 credits
Findings from The Condition of Education 2007 | Page 7
High School
activities that are directly related to the prepa-ration of individuals for paid or unpaid employ- ment, or for additional preparation for a career that requires certification or training other than a bachelor’s or an advanced degree.
These general increases in credits earned since 1982 are, in large part, a product of more graduates taking more advanced courses. In mathematics, for example, between 1982 and 2004, the percentage of graduates who com- pleted a year of
a semester or more of algebra II increased from 40 to 67 percent, and the percentage who completed a semester or more of analy-sis/precalculus increased from 6 to 28 percent (see supplemental table SA-4).10
Similarly, in science, the same trends are evident: during these years, the percentage of graduates who completed a year of chemistry increased from 32 to 64 percent, the percentage who com- pleted a year of physics increased from 15 to 33 percent, and the percentage who completed a year each of biology, chemistry, and physics increased
Figure 3. Average number of Carnegie units earned by high school graduates in various subject areas: 1982 and 2004
Subject areas
4.0 English 4.3
3.2 History/social studies
2.7 All mathematics 3.6
1.9 Algebra or higher 3.1
2.2 All science 3.2
3.9
1982 graduates 1.0 Biology 1.3 2004 graduates
0.4 0.7
Chemistry
0.2 0.4
Physics
1.1 2.0
Foreign languages
1.4 2.1
Arts
4.4 3.5
Vocational1
0.0 1.0 2.0 3.0 4.0 5.0
Number of Carnegie units
1 Includes nonoccupational vocational education, vocational general introduction, agriculture, business, marketing, health, occupational home economics, trade and industry, and technical courses. NOTE:The Carnegie unit is a standard of measurement that represents 1.0 credit for the completion of a 1-year course. Data differ slightly from fgures appearing in other NCES reports because of differences in taxonomies and case exclusion criteria. SOURCE: U.S. Department of Education, National Center for Education Statistics, High School and Beyond Longitudinal Study of 1980 Sophomores,“First Follow-up” (HS&B-So:80/82); and Education Longitudinal Study of 2002 (ELS:2002/04),“High School Transcript Study.”
Page 8 | Findings from The Condition of Education 2007

High School
Coursetaking varied by students’ sex and race/ethnicity over time and within each year. In 1982, on average, females earned 0.35 more total credits than males (see supplemental table SA-3). However, by 2004, no measurable differ- ences were detected. In 1982, males earned 0.14 more credits in both mathematics and science than did females, but by 2004, no measurable differences were detected.
In 1982, on average, Asian/Pacific Islander graduates earned more total credits than gradu- ates of any other race/ethnicity. By 2004, these differences were no longer evident. However, in both 1982 and 2004, Asian/Pacific Islander graduates earned more credits in both math- ematics and science than did graduates of any other
ASpecialLook:DropoutsandCourseCreditAccrual This special analysis so far has focused on course- Thompson et al. 2007). Some students drop out taking for high school graduates, or more pre- before 10th grade; their counts are not refected cisely,students who graduate high school within here, nor are those of students who attain an 4yearsofstarting.Althoughsomestudentsare alternativecredential(e.g.,GED),orwhoarestill still enrolled inhighschoolafter theirclassmates in school after 2004. have graduated, others have dropped out. It is important to understand how the coursetaking Students who eventually dropped out were
patterns of students who eventually drop out behind their peers who graduated on time in
compare with those of students who receive a the total number of credits they accrued in the high school diploma.A lack of credit accrual— 2000–01 and2001–02academicyears (9th and
credits earned per year—early in high school 10thgrades,respectively, foron-time graduates) has been shown to be one of the better predic- as well as the amount they accrued in their Eng-tors for subsequent dropping out (Allensworth lish, mathematics, and science courses in both and Easton 2005). Students may not accrue the academic years. In the 2000–01 academic year, expected number of credits because they earn students who would eventually drop out after
the 10th grade earned an average of 5.1 credits, a failing grade or attempt too few credits. while those who graduated on time in 2004 This special look considers the extent to which earned an average of 6.6 credits. Year-to-year there are differences by 10th grade in the credit change shows that credit accrual declined for accrual for students who eventually drop out dropouts,putting them further behind.While on-compared with students who graduate on time graduates accrued 6.6 and 6.7 credits in the time.11Table 2 shows the credit accrual (in Carn- 2000–01 and 2001–02 academic years, dropouts egie units) by 2002, their sophomore year, for earned even fewer credits in 2001–02 (4.6) than dropouts and “on-time graduates” (Hampden- they did in the previous academic year (5.1).
Table2. Averagecoursecreditaccrualofspring200210th-graders,byacademicyear,subject,andhighschoolstatus: 2004
Academic year (AY) Subject (AY 2000–02) Status in 2004 2000–01 2001–02 Total English Mathematics Science Dropouts 5.1 4.6 9.7 1.7 1.3 On-timegraduates1 6.6 6.7 13.3 2.1 2.0 1“On-timegraduates”arestudentswhograduatedhighschoolwithin4yearsbetweenthefallof2003andthesummerof2004. NOTE:Thebasicunitofcourseworkmeasurementis thecourse credit.Course creditsrefer tostandardized Carnegie units. SOURCE: Hampden-Thompson, G., Kienzl, G., Daniel, B., and Kinukawa, A. (2007). Course Credit Accrual and Dropping Out of High School (NCES 2007-018), tables 1 and
Findings from The Condition of Education 2007 | Page 9
1.2 1.8
High School
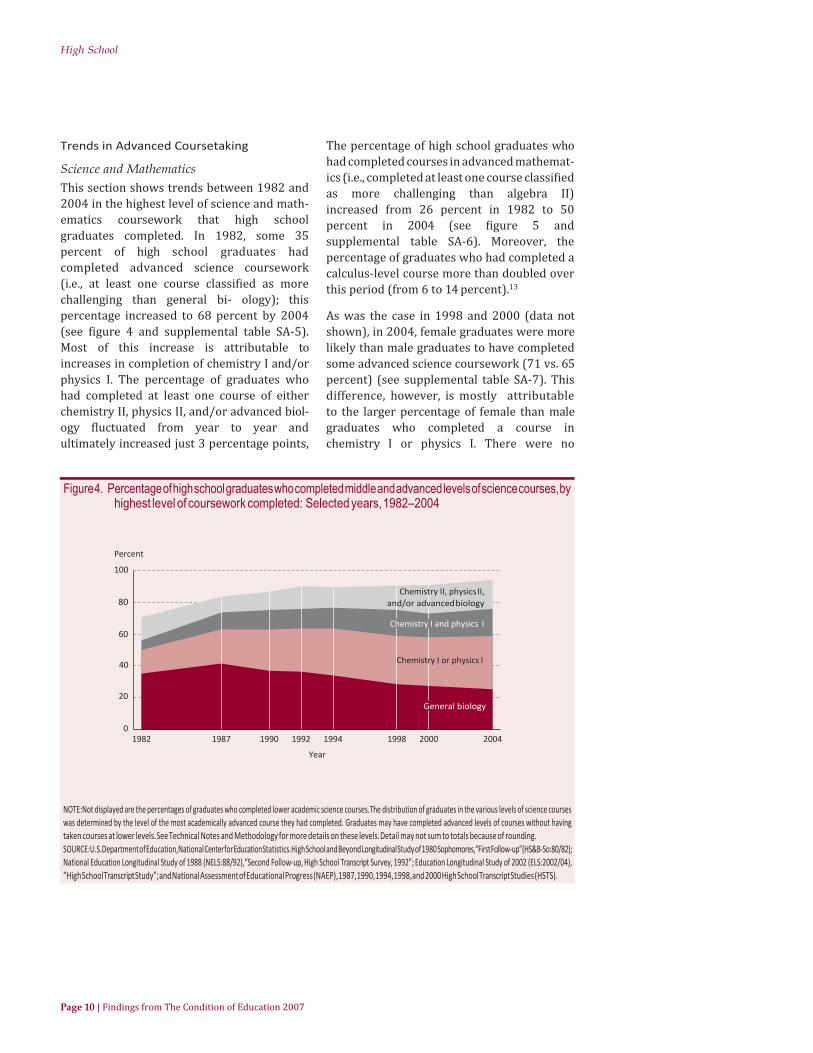
Trends in Advanced Coursetaking
Science and Mathematics This section shows trends between 1982 and 2004 in the highest level of science and math-ematics coursework that high school graduates completed. In 1982, some 35 percent of high school graduates had completed advanced science coursework (i.e., at least one course classified as more challenging than general bi- ology); this percentage increased to 68 percent by 2004 (see figure 4 and supplemental table SA-5). Most of this increase is attributable to increases in completion of chemistry I and/or physics I. The percentage of graduates who had completed at least one course of either chemistry II, physics II, and/or advanced biol-ogy fluctuated from year to year and ultimately increased just 3 percentage points,
The percentage of high school graduates who had completed courses in advanced mathemat-ics (i.e., completed at least one course classified as more challenging than algebra II) increased from 26 percent in 1982 to 50 percent in 2004 (see figure 5 and supplemental table SA-6). Moreover, the percentage of graduates who had completed a calculus-level course more than doubled over this period (from 6 to 14 percent).13
As was the case in 1998 and 2000 (data not shown), in 2004, female graduates were more likely than male graduates to have completed some advanced science coursework (71 vs. 65 percent) (see supplemental table SA-7). This difference, however, is mostly attributable to the larger percentage of female than male graduates who completed a course in chemistry I or physics I. There were no
Figure4. Percentageofhighschoolgraduateswhocompletedmiddleandadvancedlevelsofsciencecourses,byhighest level of coursework completed: Selected years,1982–2004
Percent
100
80
60
40
20
0 1982 1987 1990 1992 1994 1998 2000 2004
Year
Chemistry II, physics II, and/or advancedbiology
Chemistry I and physics I
Chemistry I or physics I
General biology
NOTE:Not displayed are the percentages of graduates who completed lower academic science courses.The distribution of graduates in the various levels of science courses was determined by the level of the most academically advanced course they had completed. Graduates may have completed advanced levels of courses without having taken courses at lower levels.SeeTechnical Notes and Methodology for more details on these levels.Detail may not sum to totals because of rounding. SOURCE:U.S.DepartmentofEducation,NationalCenterforEducationStatistics.HighSchoolandBeyondLongitudinalStudyof1980Sophomores,“FirstFollow-up”(HS&B-So:80/82); National Education Longitudinal Study of 1988 (NELS:88/92),“Second Follow-up, High School Transcript Survey, 1992”; Education Longitudinal Study of 2002 (ELS:2002/04), “HighSchoolTranscriptStudy”;andNationalAssessmentofEducationalProgress(NAEP),1987,1990,1994,1998,and2000HighSchoolTranscriptStudies(HSTS).
Page 10 | Findings from The Condition of Education 2007

High School
ferences between the percentage of female and male graduates who completed coursework in chemistry I and physics I or in the percentage who completed a course in chemistry II, phys- ics II, and/or advanced biology. Unlike in 1998 and 2000 (data not shown), in 2004, female graduates were more likely than male graduates to have completed some advanced mathemat- ics courses (e.g., trigonometry, precalculus, or calculus); however, as in 1998 and 2000, there was no measurable difference between the percentage of female and male graduates who completed calculus-level coursework (see supplemental table SA-8).
Asian/Pacific Islander graduates were more likely than graduates of any other race/ethnic- ity in 1998, 2000, and 2004 to have completed advanced science and
mental tables SA-7 and SA-8). For example, 33 percent of Asians/Pacific Islanders completed a calculus-level course, compared with 16 percent of Whites, 7 percent of Hispanics, 6 percent of American Indians, and 5 percent of Blacks. Following Asians/Pacific Islanders, Whites were more likely than Blacks, Hispan- ics, and American Indians to have completed advanced science and mathematics courses in each of these 3 years.
In 1998, 2000, and 2004, private school gradu-ates were also more likely than public school graduates to have completed advanced courses in science and mathematics. For example, in 2004, a greater percentage of private school graduates than public school graduates com-pleted at least one advanced course in science (85 vs. 67 percent) and a calculus-level course (25 vs. 13 percent).
Figure 5. Percentage of high school graduates who completed middle and advanced levels of mathematics courses, by highest level of coursework completed: Selected years, 1982–2004
Percent
100
80
60
40
20
0 1982 1987 1990 1992 1994
Year
1998 2000 2004
Calculus
Precalculus
T rigonom e
try/algebra III
Algebra II
NOTE:Notdisplayedare thepercentages ofgraduateswho completed loweracademicmathematics courses.Thedistributionof graduates inthe various levelsofmathematics courses was determined by the level of the most academically advanced course they had completed. Graduates may have completed advanced levels of courses without having taken courses at lower levels.SeeTechnical Notes and Methodology for more details on these levels.Detail may not sum to totals because of rounding. SOURCE:U.S.DepartmentofEducation,NationalCenterforEducationStatistics,HighSchoolandBeyondLongitudinalStudyof1980Sophomores,“FirstFollow-up”(HS&B-So:80/82); National Education Longitudinal Study of 1988 (NELS:88/92),“Second Follow-up, High School Transcript Survey, 1992”; Education Longitudinal Study of 2002 (ELS:2002/04), “HighSchoolTranscriptStudy”;andNationalAssessmentofEducationalProgress(NAEP),1987,1990,1994,1998,and2000HighSchoolTranscriptStudies(HSTS).
Findings from The Condition of Education 2007 | Page 11

–
High School
English and Foreign Language Since the early 1980s, the percentage of high school graduates completing honors English and advanced foreign language courses has also increased (see figures 6 and 7 and supplemental tables SA-9 and SA-10). In 1982, about 13 percent of high school graduates had completed some advanced English coursework classified as “honors”; by 2004, this percentage had risen to 33 percent. Moreover, during this period, the percentage who had completed 75–100 percent of their English courses at the honors level increased from 4
The percentage of high school graduates who had completed advanced foreign language study (i.e., year 3 or higher of a foreign language) was greater in 2004 than in 1982. In 1982, about 15 percent of graduates had completed some advanced foreign language study; by 2004, this percentage had more than doubled to 35 percent. In addition, over this period, the per-centage of graduates who had not completed any foreign language study decreased markedly (from 46 to 15 percent).
Figure6. PercentageofhighschoolgraduateswhocompletedregularandadvancedlevelsofEnglish,byhighest course completed: Selected years,1982–2004
Percent
100
80
60
40
20
0 1982 1987 1990 1992 1994 1998 2000 2004
Year
75–100 percent honors courses
50 74 percent honors courses
Less than 50 percent honors courses
All regular (no low or honors) courses
NOTE: For each graduate, the percentages of completed English courses classifed as “below level,”“at grade level,” and “honors” were calculated. Graduates may have completed advanced levels of courses without having taken courses at lower levels. See Technical Notes and Methodology for more details on these levels. Detail may not sum to totals because of rounding. SOURCE: U.S. Department of Education, National Center for Education Statistics, High School and Beyond Longitudinal Study of 1980 Sophomores,“First Follow-up” (HS&B:80/82); National Education Longitudinal Study of 1988,“High School Transcript Study” (NELS:88/92); Education Longitudinal Study of 2002 (ELS:2002/04),“High School Transcript Study”; and National Assessment of Educational Progress (NAEP), 1987, 1990, 1994, 1998, and 2000 High School Transcript Studies (HSTS).
Page 12 | Findings from The Condition of Education 2007

High School
As was the case in 1998 and 2000 (data not shown), in 2004, female graduates were more likely than male graduates to have completed advanced English and foreign language study (see supplemental tables SA-11 and SA-12). In 1998 and 2000 (data not shown), no racial/ ethnic group of graduates completed advanced courses in English or foreign language study at higher rates than those for all other racial/eth- nic groups. However, in 2004, Asian/Pacific Islanders completed advanced courses in Eng- lish and in advanced foreign language study at higher rates than those for all
groups. In all 3 years, Black graduates were less likely than Asian/Pacific Islander, Hispanic, and White graduates to have completed advanced foreign language courses.
In 1998, 2000, and 2004, private school gradu-ates were also more likely than public school graduates to have completed advanced courses in foreign language study; however, apparent differencesintheratesat whichthey completed advanced English courses were not significant (1998 and 2000 data not shown).
Figure 7. Percentage ofhigh schoolgraduateswhocompletedlowandadvancedforeignlanguagecourses,byhighest course completed: Selected years,1982–2004
Percent
100
80
60
40
20
0 1982 1987 1990 1992 1994 1998 2000 2004
Year
Advanced Placement (AP)
Year 4
Year 3
Year 2 or lower
NOTE:The distribution of graduates among the various levels of foreign language courses was determined by the level of the most academically advanced course they completed. Graduates who had completed courses in different languages were counted according to the highest level course completed. Graduates may have completed advanced levels of courses without having taken courses at lower levels. See Technical Notes and Methodology for more details on these levels. Detail may not sum to totals because of rounding. SOURCE: U.S. Department of Education, National Center for Education Statistics, High School and Beyond Longitudinal Study of 1980 Sophomores,“First Follow-up” (HS&B:80/82); National Education Longitudinal Study of 1988,“High School Transcript Study” (NELS:88/92); Education Longitudinal Study of 2002 (ELS:2002/04),“High School Transcript Study”; and National Assessment of Educational Progress (NAEP), 1987, 1990, 1994, 1998, and 2000 High School Transcript Studies (HSTS).
Findings from The Condition of Education 2007 | Page 13

High School
A Special Look: Advanced Placement (AP) Examinations Advanced Placement (AP) courses provide While thenumberofstudentsandthe percentage students with the opportunity to take col- of minorities participating in AP examinations lege-level courses while in high school.The AP have increased each year, the annual average programoffers37coursesin20subjectsthatare scoreshaveremainedabout3.0,outofapossible developed by The College Board. A qualifying 5.0 (see supplemental table SA-13). The exami- score of 3.0 or better (using a 5.0 point scale) nation scores of White and Asian students have on a course examination may enable a student remained relatively constant across all subjects, to earn college credit or advanced standing in averaging about 3.0 and 3.1,respectively,while the the subject area in which the course/exam was scores of students in other racial/ethnic groups taken. Between 1997 and 2005, the number of have declined. For example, the average scores of students taking AP examinations increased 111 Hispanic students declined across all examination percent (from 566,720 to 1,197,439) (see table subjects, from 3.1 in 1997 to2.5 in 2005. 3).14 Over this period, the participation of White students increased 105 percent, compared with The percentage of examinations resulting in
213 percent for Hispanic students, 177 percent a qualifying score of 3.0 or better decreased
for Black students, 124 percent for American from a high of 65 percent in 1997 to a low of 59
Indianstudents,and114percentforAsianstu- percentin2005(seesupplementaltableSA-14). dents. As a result, the participation of minority At the same time, the number of examinations
groupsincreasedfrom27percentofallstudents withascoreofat leasta3.0 increased111per-cent (from 579,865 to 1,225,845) (see fgure 8). taking AP examinations in 1997 to 33 percent
in 2005. Conversely, the percentage of White However, the number of examinations with a
students takingAPexaminationsdeclined from score of 1.0 or 2.0 increased 163 percent (from 319,598 to839,200). 66 percent in 1997 to 64 percent in 2005.
Table3. Number and percent change of students taking Advanced Placement (AP) examinations,by race/ethnicity: 1997–2005
Percen t change 1997 to
Total1 566,720 618,257 685,981 747,922 820,880 913,251 998,329 1,081,102 1,197,439 111 White 371,606 403,553 445,880 504,600 549,065 607,816 660,225 702,489 762,548 105 Total minority1 154,046 170,054 194,557 225,825 250,230 280,276 315,046 350,425 398,243 159
Black 24,469 27,054 31,023 36,158 40,078 45,271 51,160 57,001 67,702 177 Hispanic 47,626 53,627 62,853 74,852 86,018 98,495 114,246 130,042 148,960 213 Asian/Asian
American 63,528 68,109 75,875 85,756 92,762 102,653 111,704 121,038 135,815 114 American Indian/
AlaskaNative 2,520 2,761 3,136 3,584 3,472 3,896 4,530 4,974 5,654 124 Missing 41,068 44,650 45,544 17,497 21,585 25,159 23,058 28,188 36,648 -11 1 Total includes other race/ethnicity categories not separately shown. NOTE:Data reported are for all students who completed an AP exam.The College Board collects racial/ethnic information based on the categories American Indian/Alaska Native;Asian/Asian American;Black/Afro-American;Latino:Chicano/Mexican,Puerto Rican,Other Latino;White;and Other.Hispanic refers to the sum of all Latino subgroups. Race categories exclude persons of Hispanic ethnicity. SOURCE:The College Board, Advanced Placement Program. (1997–2005). National Summary Reports.
Page 14 | Findings from The Condition of Education 2007

High School
Figure 8. PercentchangeinstudentscoresonAdvancedPlacement(AP)examinations,by testscorecategories: 1997 to 2005
Percentchange
200
163
150 130 111
100
50
0 Total 1.0 or 2.0 3.0 or greater
Score
SOURCE:The College Board, Advanced Placement Program. (1997–2005). National Summary Reports.
SUMMARY
With requirements for earning a high school diploma becoming more rigorous over the past 20 years, there have been increases in the rates at which students accrue course credits. For example, between 1982 and 2004, the average number of course credits accrued by high school graduates increased from 21.7 to 25.8 credits.
This growth in the number of credits earned has been accompanied by an increase in the ad- vanced coursework completed by high school students. More students are now taking ad- vanced courses in mathematics and science—in particular calculus, chemistry I, and physics I—and in English and foreign languages. Fur- ther evidence of the prevalence of advanced coursetaking is an increase in the percentage of students who take AP examinations: between 1997 and 2005, the total number of students taking AP examinations more than doubled. As the
has increased, average scores have remained relatively stable; however, there has been a decrease in the percentage of examinations resulting in a qualifying score of 3.0 or more, from 65 to 59 percent. At the same time that academic coursetaking has been rising, there has not been an improvement in 12th-grade NAEP scores (Shettle et al. 2007).
Gaps in advanced coursetaking by sex and race/ethnicity are evident in mathematics, sci- ence, English, and foreign language study. Most notably, since 1998, females have been more likely than males to complete some advanced science coursework, though no differences by sex were detected in the proportions of stu- dents who took the highest levels of science or mathematics coursework. In addition, in 2004, Asian/Pacific Islander graduates were more likely than graduates of any other race/ethnicity to complete advanced courses
Findings from The Condition of Education 2007 | Page 15

High School
NOTES 1 The most recent data available for this special analysis did not collect data on advanced course offerings from private schools. 2 The basic unit of coursework measurement is the course credit or standardized“Carnegie unit.”A Carnegie unit is a standard of measurement used for secondary education that isequivalent to thecompletion of a course that meets one period perday for one school year,where a period is typically at least 40minutes. 3 Many local school districts and schools impose their own standards for graduation that exceed these state requirements. 4 In 2006, nine states had exit examination requirements for some private school students. In several states, these requirements applied to all students in state-accredited private schools; however, in other states, these requirements applied only to specifc categories of private school students (e.g., students placed in private schools by school districts or other public agencies) (CEP 2006,table 22). 5 Maryland’s exit examination process was revised in 2004. 6 North Carolina also has a mandatory test in civics and economics and in computer skills. 7Informationonthecontentofthedual-creditcoursework,andtheextenttowhichitqualifesasadvanced,wasnotcollectedaspartoftheFastResponseSurvey(FRSS). 8 All high school courses recorded in student transcripts are coded in accordance with the Classifcation Scheme of Secondary School Courses (CSSC). Courses in the CSSC taxonomycanthen begroupedaccordingtotheiracademiclevel toclassifya student’shighest levelof coursetaking withinaparticular subject.TheCSSC isdesignedto describe course offerings in secondary education and to provide a coherent means for classifying these courses in this way.Each CSSC code has six digits, with an associated course title,alternate titles,and a course description. 9Thedefnition of ahigh schoolgraduate and what wasconsidered a completetranscriptrecorddiffers slightly betweensurveycollections and otherNCESreports.See Technical Notes and Methodology for moredetail. 10 These data report only the percentage of students who earned credit in each course while in high school and do not include a count of those courses taken prior to entering high school.In 2004,approximately 95 percent of graduates had taken algebra I before or during high school. 11 “On-time” graduates are students who graduated between the fall of 2003 and the summer of 2004. 12 Academic levels are labeled according to the mostcommonly known course at that level;courses with differentnames or on topics of different but similar academic diffculty may be included under these rubrics.See Technical Notes and Methodology for a complete listing of all the courses classifed at each academic level. 13 Calculus-level courses include AP calculus, calculus, and calculus/analytical geometry. 14 The focus in the section is on students and examinations.Individuals may take multiple examinations.Furthermore, the data for this section’s analysis count all test takers and are not limited to high school graduates.
REFERENCES Alexander, K.L., and Pallas, A.M. (1984). Curriculum Reform and School Performance: An Evaluation of the “New Basics.” American Journal of Education, 92(4): 391–420.
Allensworth, E.M., and Easton, J.Q. (2005). The On-Track Indicator as a Predictor of High School Graduation. Chicago: Con-sortium on Chicago School Research.
Burkam, D.T., and Lee, V. (2003). Mathematics, Foreign Language, and Science Coursetaking and the NELS:88 Transcript Data (NCES 2003-01). U.S. Department of Education. Washington, DC: National Center for Education Statistics Working Paper.
Center on Education Policy. (2006). State High School Exit Exams: A Challenging Year. Washington, DC: Author.
Chaney, B., Burgdorf, K., and Atash, N. (1997, Fall). Influencing Achievement Through High School Graduation Requirements. Educational Evaluation and Policy Analysis, 19(3): 229–244.
Gamoran, A. (1987). The Stratification of High School Learning Opportunities. Sociology of Education, 60(3): 135–155.
Hampden-Thompson, G., Kienzl, G., Daniel, B., and Kinukawa, A. (2007). Course Credit Accrual and Dropping Out of High School (NCES 2007-018). U.S. Department of Education. Washington, DC: National Center for Education Statistics.
National Commission on Excellence in Education. (1983). A Nation at Risk: The Imperative for Educational Reform. Washington, DC: Author.
Shettle, C., Roey, S., Mordica, J., Perkins, R., Nord, C., Teodorovic, J., Brown, J., Lyons, M., Averett, C., Kastberg, D. (2007). The Nation’s Report Card: America’s High School Graduates (NCES 2007-467). U.S. Department of Education. Washington, DC: National Center for Education Statistics.
Waits, T., Setzer, J.C., and Lewis, L. (2005). Dual Credit and Exam-Based Courses in U.S. Public High Schools: 2002–03 (NCES 2005-009). U.S. Department of Education. Washington, DC: National Center for Education Statistics.
Page 16 | Findings from The Condition of Education 2007

High School
Supplemental Tables
Table SA- States with mandatory exit examinations, by subject, and states phasing in exit examinations, by date: 2006
English/ U.S. history/ Computer State language arts Mathematics Science social studies skills
Total 25 25 19 13 1 Alabama ✓ ✓ ✓ ✓ Alaska1 ✓ ✓ Arizona1 ✓ ✓ California ✓ ✓ Florida ✓ ✓ Georgia1 ✓ ✓ ✓ ✓ Idaho ✓ ✓ ✓ Indiana ✓ ✓ Louisiana ✓ ✓ ✓ ✓ Maryland 2009 2009 2009 2009 Massachusetts ✓ ✓ 2010 Minnesota1 ✓ ✓ Mississippi1 ✓ ✓ ✓ ✓ Nevada1 ✓ ✓ 2008 New Jersey ✓ ✓ 2007 New Mexico1 ✓ ✓ ✓ ✓ New York ✓ ✓ ✓ ✓ North Carolina2 ✓ ✓ 2010 2010 ✓ Ohio1 ✓ ✓ ✓ ✓ Oklahoma 2012 2012 2012 2012 SouthCarolina ✓ ✓ 2010 2010 Tennessee ✓ ✓ ✓ Texas1 ✓ ✓ ✓ ✓ Virginia1 ✓ ✓ ✓ ✓ Washington1 2008 2008 2010 1 A writing test is required in addition to the English/language arts examination or as a component of it. 2 A civics and economics test is required in addition to a U.S. history examination. NOTE:Year in table indicates when the state is scheduled to institute an exit examination in that subject. Utah had planned to enforce an exit exam requirement in 2006, but that year decided not to withhold diplomas from students who failed the examination if they met other graduation requirements. SOURCE: Center on Education Policy. (2006).State High School Exit Exams: A Challenging Year, adapted from table 1, data from state departments of education, June 2006.
Findings from The Condition of Education 2007 | Page 17

High School
Table SA- Numberandpercentageofpublichighschoolsthatoffereddual-credit,AdvancedPlacement(AP),andInternationalBaccalaureate(IB)courses, by selected school characteristics: 2002–03
Offered dual-credit Offered Advanced Offered International Total number of courses Placement courses Baccalaureate courses
School characteristic high schools Number Percent Number Percent Number Percent
All public high schools 16,500 11,700 71 11,000 67 390 2 Enrollment size
Lessthan500 7,400 4,700 63 3,000 40 ‡ ‡ 500 to 1,199 5,000 3,700 75 4,100 82 70 2 1,200 or more 4,100 3,300 82 3,900 97 290 7
School locale City 2,700 1,800 65 2,100 77 150 6 Urban fringe 4,100 3,100 74 3,600 87 180 4 Town 2,400 1,900 79 1,700 72 20! 1! Rural 7,200 5,000 70 3,600 50 ‡ ‡
Region Northeast 2,800 1,600 58 2,300 84 30 1 Southeast 3,500 2,400 69 2,400 69 170 5 Central 5,200 4,100 80 2,800 54 50 1 West 5,100 3,600 71 3,500 69 150 3
Percent minority enrollment Lessthan6percent 5,600 4,300 76 3,300 58 # # 6 to20 percent 3,800 3,000 78 2,600 70 90 2 21 to49 percent 3,200 2,300 72 2,400 75 150 5 50 percent or more 3,600 2,100 58 2,500 69 150 4
# Rounds to zero. ! Interpret data with caution (estimates are unstable). ‡ Reporting standards not met (too few cases). NOTE: Dual-credit courses allow students to earn both high school and postsecondary credits for a single course. AP courses and their end-of-course examinations are developed and administered by The College Board and allowstudentstoearnpostsecondarycredit.IBcoursesaredefnedascoursesthatmakeupa2-yearliberalartscurriculumthatleadstoanIBdiploma.Percentagesarebasedonunroundednumbers.Detailmaynotsumto totals because of rounding or missing data. For the FRSS study sample, there were 29 cases for which the percent minority enrollment in the school was missing.Those cases were included in the totals and in analyses by other school characteristics. SOURCE: U.S. Department of Education, National Center for Education Statistics, Fast Response Survey System (FRSS),“Dual Credit and Exam-Based Courses,” FRSS 85, 2003.
Page 18 | Findings from The Condition of Education 2007

High School
Table SA- Average number of Carnegie units earned by high school graduates in various subject areas,by selected characteristics:1982 and 2004
History/ Mathematics Graduation year social Less than Algebra and characteristic Total English studies Total algebra or
1982 graduates 21.7 4.0 3.2 2.7 0.9 1.9 Sex
Male 21.5 3.9 3.2 2.8 0.9 1.9 Female 21.9 4.0 3.2 2.6 0.8 1.8
Race/ethnicity White 21.8 3.9 3.2 2.8 0.7 2.0 Black 21.2 4.1 3.1 2.6 1.3 1.3 Hispanic 21.4 4.0 3.1 2.4 1.2 1.2 Asian/Pacifc Islander 22.4 4.0 3.1 3.2 0.7 2.6 American Indian/Alaska Native 21.5 4.0 3.3 2.4 1.2 1.1
Control of school Public 21.6 3.9 3.2 2.6 0.9 1.7 Private 22.8 4.2 3.6 3.3 0.5 2.8
2004 graduates 25.8 4.3 3.9 3.6 0.5 3.1 Sex
Male 25.8 4.3 3.9 3.6 0.5 3.0 Female 25.9 4.4 4.0 3.6 0.5 3.1
Race/ethnicity White 26.0 4.2 4.0 3.6 0.4 3.2 BlackorAfricanAmerican 25.7 4.4 3.9 3.7 0.7 3.0 Hispanic 25.2 4.5 3.8 3.4 0.7 2.8 Asian/Pacifc Islander 25.8 4.4 3.9 3.8 0.3 3.5 American Indian/Alaska Native 25.5 4.4 4.0 3.3 0.9 2.3
Control of school Public 25.8 4.3 3.9 3.6 0.5 3.0 Private 26.5 4.4 4.0 3.8 0.2 3.7
See notes at end of table.
Findings from The Condition of Education 2007 | Page 19

4.4
High School
Table SA- Average number of Carnegie units earned by high school graduates in various subject areas, by selected characteristics: 1982 and 2004— Continued
Science Graduation year General Foreign Vocational and characteristic Total science Biology Chemistry Physics languages Arts education1
1982 graduates 2.2 0.7 1.0 0.4 0.2 1.1 1.4 Sex
Male 2.3 0.8 0.9 0.4 0.2 0.9 1.3 4.3 Female 2.2 0.7 1.0 0.4 0.1 1.3 1.6 4.4
Race/ethnicity White 2.3 0.7 1.0 0.4 0.2 1.2 1.5 4.2 Black 2.1 0.8 0.9 0.3 0.1 0.8 1.3 4.6 Hispanic 1.8 0.8 0.8 0.2 0.1 0.9 1.3 5.0 Asian/Pacifc Islander 2.7 0.5 1.1 0.6 0.4 1.8 1.3 3.2 American Indian/Alaska Native 2.1 0.7 0.8 0.4 0.1 0.5 1.7 4.7
Control of school Public 2.2 0.7 0.9 0.3 0.2 1.0 1.5 4.6 Private 2.6 0.7 1.1 0.5 0.3 2.0 1.2 2.3
2004 graduates 3.2 0.8 1.3 0.7 0.4 2.0 2.1 Sex
Male 3.2 0.9 1.2 0.7 0.4 1.8 1.8 3.8 Female 3.3 0.8 1.3 0.8 0.3 2.2 2.4 3.2
Race/ethnicity White 3.3 0.8 1.3 0.8 0.4 2.1 2.3 3.5 BlackorAfricanAmerican 3.2 1.0 1.3 0.7 0.3 1.7 1.7 3.8 Hispanic 2.9 0.9 1.1 0.6 0.3 1.9 1.9 3.3 Asian/Pacifc Islander 3.6 0.7 1.4 0.9 0.6 2.4 1.9 2.5 American Indian/Alaska Native 3.0 0.9 1.2 0.5 0.3 1.3 1.6 4.4
Control of school Public 3.2 0.8 1.3 0.7 0.4 1.9 2.1 3.7 Private 3.5 0.6 1.4 1.0 0.6 2.7 1.9 1.5
1 Includes nonoccupational vocational education, vocational general introduction, agriculture, business, marketing, health, occupational home economics, trade and industry, and technical courses. NOTE:The Carnegie unit is a standard of measurement that represents 1.0 credit for the completion of a 1-year course. Data differ slightly from fgures appearing in other NCES reports because of differences in taxonomies and case exclusion criteria.Race categories exclude persons of Hispanic ethnicity.Detail may not sum to totals because of rounding. SOURCE: U.S. Department of Education, National Center for Education Statistics, High School and Beyond Longitudinal Study of 1980 Sophomores,“First Follow-up” (HS&B-So:80/82); National Education Longitudinal Study of 1988 (NELS:88/92),“Second Follow-up, High School Transcript Survey, 1992”; Education Longitudinal Study of 2002 (ELS:2002/04),“High School Transcript Study”; and National Assessment of Educational Progress (NAEP), 1987, 1990, 1994, 1998, and 2000 High School Transcript Studies (HSTS).
Page 20 | Findings from The Condition of Education 2007
3.5
High School
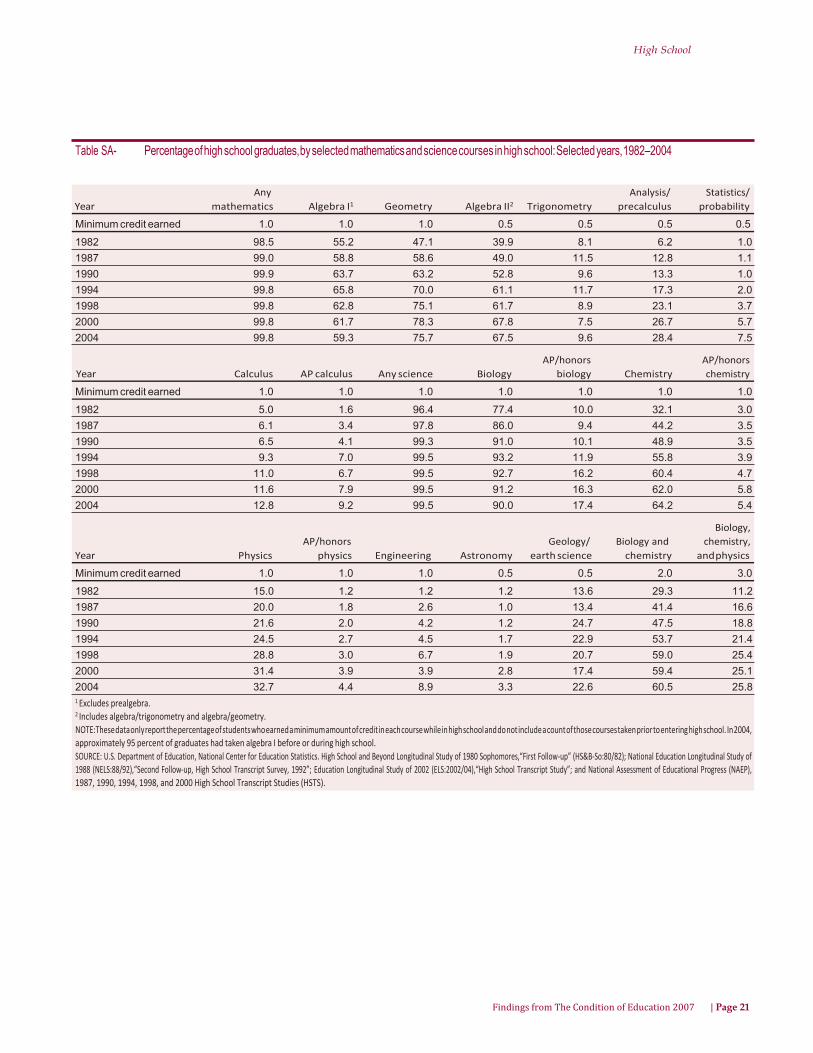
Table SA- Percentageofhighschool graduates,byselectedmathematicsand sciencecourses inhighschool:Selected years,1982–2004
Any Analysis/ Statistics/ Year mathematics Algebra I1 Geometry Algebra II2 Trigonometry precalculus probability
Minimum credit earned 1.0 1.0 1.0 0.5 0.5 0.5 0.5 1982 98.5 55.2 47.1 39.9 8.1 6.2 1.0 1987 99.0 58.8 58.6 49.0 11.5 12.8 1.1 1990 99.9 63.7 63.2 52.8 9.6 13.3 1.0 1994 99.8 65.8 70.0 61.1 11.7 17.3 2.0 1998 99.8 62.8 75.1 61.7 8.9 23.1 3.7 2000 99.8 61.7 78.3 67.8 7.5 26.7 5.7 2004 99.8 59.3 75.7 67.5 9.6 28.4 7.5
AP/honors AP/honors Year Calculus AP calculus Any science Biology biology Chemistry chemistry
Minimum credit earned 1.0 1.0 1.0 1.0 1.0 1.0 1.0 1982 5.0 1.6 96.4 77.4 10.0 32.1 3.0 1987 6.1 3.4 97.8 86.0 9.4 44.2 3.5 1990 6.5 4.1 99.3 91.0 10.1 48.9 3.5 1994 9.3 7.0 99.5 93.2 11.9 55.8 3.9 1998 11.0 6.7 99.5 92.7 16.2 60.4 4.7 2000 11.6 7.9 99.5 91.2 16.3 62.0 5.8 2004 12.8 9.2 99.5 90.0 17.4 64.2 5.4
Biology, AP/honors Geology/ Biology and chemistry,
Year Physics physics Engineering Astronomy earth science chemistry andphysics
Minimum credit earned 1.0 1.0 1.0 0.5 0.5 2.0 3.0 1982 15.0 1.2 1.2 1.2 13.6 29.3 11.2 1987 20.0 1.8 2.6 1.0 13.4 41.4 16.6 1990 21.6 2.0 4.2 1.2 24.7 47.5 18.8 1994 24.5 2.7 4.5 1.7 22.9 53.7 21.4 1998 28.8 3.0 6.7 1.9 20.7 59.0 25.4 2000 31.4 3.9 3.9 2.8 17.4 59.4 25.1 2004 32.7 4.4 8.9 3.3 22.6 60.5 25.8 1 Excludes prealgebra. 2 Includes algebra/trigonometry and algebra/geometry. NOTE:Thesedataonlyreportthepercentageofstudentswhoearnedaminimumamountofcreditineachcoursewhileinhighschoolanddonot includeacountofthosecoursestakenpriortoenteringhighschool. In2004, approximately 95 percent of graduates had taken algebra I before or during high school. SOURCE: U.S. Department of Education, National Center for Education Statistics. High School and Beyond Longitudinal Study of 1980 Sophomores,“First Follow-up” (HS&B-So:80/82); National Education Longitudinal Study of 1988 (NELS:88/92),“Second Follow-up, High School Transcript Survey, 1992”; Education Longitudinal Study of 2002 (ELS:2002/04),“High School Transcript Study”; and National Assessment of Educational Progress (NAEP), 1987, 1990, 1994, 1998, and 2000 High School Transcript Studies (HSTS).
Findings from The Condition of Education 2007 | Page 21

High School
Table SA- Percentage distribution of high school graduates,by highest level of science course completed:Selected years,1982–2004
Advanced academic level Chemistry II,
Low physics II, and/ academic General Chemistry I Chemistry I or
Year No science1 level biology advanced Total or physics I and physics 1982 2.2 27.2 35.2 35.4 14.9 5.9 14.6 1987 0.8 15.8 41.5 41.9 21.4 10.6 9.9 1990 0.7! 12.8 37.0 49.5 25.8 12.3 11.4 1992 0.3! 9.7 36.4 53.5 27.1 12.2 14.3 1994 0.6 10.0 34.1 55.3 29.4 13.0 12.9 1998 0.6 9.3 28.6 61.5 30.2 16.3 15.1 2000 0.7 8.7 27.5 63.1 30.5 14.8 17.9 2004 0.6 5.6 25.4 68.4 33.3 17.1 18.1 ! Interpret data with caution (estimates are unstable). 1 Graduates in this category may have taken some science courses, but these courses are not defned as science courses according to the classifcation used in this analysis. NOTE:The distribution of graduates in the various levels of science courses was determined by the level of the most academically advanced course they had completed.Graduates may have completed advanced levels of courses without having taken courses at lower levels.SeeTechnical Notes and Methodology for more details on these levels.Detail may not sum to totals because of rounding. SOURCE: U.S. Department of Education, National Center for Education Statistics, High School and Beyond Longitudinal Study of 1980 Sophomores,“First Follow-up” (HS&B-So:80/82); National Education Longitudinal Study of 1988 (NELS:88/92),“Second Follow-up, High School Transcript Survey, 1992”; Education Longitudinal Study of 2002 (ELS:2002/04),“High School Transcript Study”; and National Assessment of Educational Progress (NAEP), 1987, 1990, 1994, 1998, and 2000 High School Transcript Studies (HSTS).
Table SA- Percentage distribution of high school graduates,by highest level of mathematics course completed:Selected years, 1982–2004
Middle academic Advanced academic Trigo-
No math- Non- Low Algebra I/ nometry/ Year ematics1 academic academic Total geometry Algebra II Total algebra III Precalculus Calculus 1982 0.8 16.7 7.4 48.8 30.6 18.2 26.3 15.6 4.8 5.9 1987 0.9 12.0 7.6 50.1 27.0 23.1 29.5 12.9 9.0 7.6 1990 0.6 9.0 8.2 51.6 25.4 26.2 30.6 12.9 10.4 7.2 1992 0.4! 6.2 6.3 49.0 22.7 26.4 38.1 16.4 10.9 10.7 1994 0.7 5.7 6.2 49.4 22.5 26.9 38.1 16.3 11.6 10.2 1998 0.8 3.6 5.3 48.9 21.2 27.7 41.4 14.4 15.2 11.8 2000 0.8 2.5 4.1 48.0 18.6 29.4 44.6 14.1 18.0 12.5 2004 0.6 1.8 3.0 44.6 18.7 25.9 50.0 17.6 18.5 13.9 ! Interpret data with caution (estimates are unstable). 1 Indicates that student transcript records did not list any recognized mathematics courses; however, these graduates may have studied some mathematics. NOTE:The distribution of graduates among the various levels of mathematics courses was determined by the level of the most academically advanced course they had completed. Graduates may have completed advanced levels of courses without having taken courses at lower levels.Academic levels are labeled according to the most commonly known course at that level; courses with different names or on topics of different but similar academic diffculty may be included under these rubrics.SeeTechnical Notes and Methodology for a complete listing of all the courses classifed at each academic level.Detail may not sum to totals because of rounding. SOURCE: U.S. Department of Education, National Center for Education Statistics, High School and Beyond Longitudinal Study of 1980 Sophomores,“First Follow-up” (HS&B-So:80/82); National Education Longitudinal Study of 1988 (NELS:88/92),“Second Follow-up, High School Transcript Survey, 1992”; Education Longitudinal Study of 2002 (ELS:2002/04),“High School Transcript Study”; and National Assessment of Educational Progress (NAEP), 1987, 1990, 1994, 1998, and 2000 High School Transcript Studies (HSTS).
Page 22 | Findings from The Condition of Education 2007

High School
Table SA- Percentage distribution of high school graduates,by highest level of science course completed and selected characteristics:2004
Advanced academic level Chemistry II,
Low physics II, and/ academic General Chemistry I Chemistry I or
Characteristic No science1 level biology advanced Total or physics I and physics
Total 0.6 5.6 25.4 68.4 33.3 17.1 18.1 Sex
Male 0.8 6.7 27.0 65.5 29.8 17.9 17.8 Female 0.3 4.6 23.8 71.3 36.6 16.3 18.4
Race/ethnicity White 0.5 5.0 23.9 70.7 32.1 18.2 20.3 Black 0.9 5.0 31.2 63.0 39.8 12.4 10.8 Hispanic 0.7 8.3 30.9 60.2 35.9 15.5 8.8 Asian/Pacifc Islander 0.5 3.0 12.8 83.7 25.9 19.1 38.8 American Indian # 10.3 41.9 47.8 28.2 12.3 7.3
Control of school Public 0.6 6.0 26.5 66.9 33.4 16.0 17.6 Private 0.1! 1.4 13.2 85.4 32.1 29.2 24.1
# Rounds to zero. ! Interpret data with caution (estimates are unstable). 1 Graduates in this category may have taken some science courses, but these courses are not defned as science courses according to the classifcation used in this analysis. NOTE: The distribution of graduates in the various levels of science courses was determined by the level of the most academically advanced course they had completed.Graduates may have completed advanced levels of courses without having taken courses at lower levels. See Technical Notes and Methodology for more details on these levels. Race categories exclude persons of Hispanic ethnicity. Detail may not sum to totals because of rounding. SOURCE: U.S.Department of Education,National Center for Education Statistics,Education Longitudinal Study of 2002 (ELS:2002/04),“High School Transcript Study.”
Findings from The Condition of Education 2007 | Page 23

High School
Table SA- Percentage distribution of high school graduates,by highest level of mathematics course completed and selected characteristics: 2004
Middle academic Advanced academic Trigo-
No math- Non- Low Algebra I/ nometry/ Characteristic ematics1 academic academic Total geometry/ Algebra II Total algebra III Precalculus Calculus
Total 0.6 1.8 3.0 44.6 18.7 25.9 50.0 17.6 18.5 13.9 Sex
Male 0.7 2.2 3.7 45.2 20.0 25.2 48.2 16.3 17.4 14.5 Female 0.4 1.4 2.4 44.0 17.5 26.6 51.7 18.8 19.7 13.2
Race/ethnicity White 0.5 1.6 2.6 41.0 16.9 24.0 54.3 18.2 20.1 16.0 Black 1.3 1.8 3.8 51.3 19.8 31.5 41.7 22.9 14.0 4.7 Hispanic 0.3 2.5 4.2 58.6 27.0 31.6 34.3 13.0 14.5 6.8 Asian/Pacifc Islander 0.4 0.3 1.5 28.7 11.3 17.5 69.1 12.5 23.1 33.4 American Indian 2.4! 8.5 4.5 62.9 22.8 40.1 21.8 8.9 7.2 5.6
Control of school Public 0.6 1.9 3.3 46.4 19.9 26.5 47.7 17.2 17.7 12.8 Private 0.2 # 0.2 24.6 5.7 18.9 75.0 21.9 27.6 25.5
# Rounds to zero. ! Interpret data with caution (estimates are unstable). 1 Students in this category may have taken some mathematics courses, but these courses are not defned as mathematics courses according to the classifcation used in this analysis. NOTE:The distribution of graduates among the various levels of mathematics courses was determined by the level of the most academically advanced course they had completed. Graduates may have completed advanced levels of courses without having taken courses at lower levels.Academic levels are labeled according to the most commonly known course at that level; courses with different names or on topics of different but similar academic diffculty may be included under these rubrics. See Technical Notes and Methodology for a complete listing of all the courses classifed at each academic level. Race categories exclude persons of Hispanic ethnicity. Detail may not sum to totals because of rounding. SOURCE: U.S. Department of Education, National Center for Education Statistics, Education Longitudinal Study of 2002 (ELS:2002/04),“High School Transcript Study.”
Page 24 | Findings from The Condition of Education 2007

High School
Table SA- Percentage distribution of high school graduates,by type of English course completed:Selected years,1982–2004
Advanced academic level1
Low Regular English Less than 50–74 75–100 academic (no low 50 percent percent of percent
or of Total of courses courses courses 1982 0.1 10.0 76.7 13.3 6.1 3.3 3.8 1987 0.7 22.1 55.6 21.5 7.9 5.0 8.7 1990 0.6 19.6 60.2 19.6 7.0 3.6 9.1 1992 0.2 18.0 57.3 24.4 7.6 5.8 11.1 1994 0.8 17.6 56.5 25.1 7.7 5.4 12.0 1998 0.9 13.7 56.1 29.3 9.1 7.7 12.4 2000 0.7 10.7 54.7 33.9 11.6 7.2 15.1 2004 0.7 10.8 55.9 32.7 9.2 7.6 15.9 1 Includes graduates who completed a general English course classifed as“below grade level” if they completed a greater percentage of “honors” courses than“below grade level” courses. 2 Indicates that student transcript records did not list any recognized English courses; however, these graduates may have studied some English. If graduates took only English as a second language (ESL) courses for credit, they would be listed in this category. 3 Low academic level courses include all general English courses classifed as“below grade level.” Graduates may have taken a general English course classifed as regular or“honors” and be classifed in the low academic level if the percentage of“below grade level”courses completed was the plurality of courses completed. NOTE:For each graduate,the percentages of completed courses classifed as“below level,”“at grade level,”and“honors”were calculated.(Not all graduates completed 4 years of English.) After the percentage of graduates at each level had been calculated, the percentage of graduates who ft the category requirement for each level was determined, as explained in Technical Notes and Methodology. Detail may not sum to totals because of rounding. SOURCE:U.S.Department of Education, National Center for Education Statistics, High School and Beyond Longitudinal Study of 1980 Sophomores,“First Follow-up”(HS&B:80/82); National Education Longitudinal Study of 1988, “High School Transcript Study” (NELS:88/92); Education Longitudinal Study of 2002 (ELS:2002/04),“High School Transcript Study”; and National Assessment of Educational Progress (NAEP), 1987, 1990, 1994, 1998, and 2000 High School Transcript Studies(HSTS).
Findings from The Condition of Education 2007 | Page 25
High School
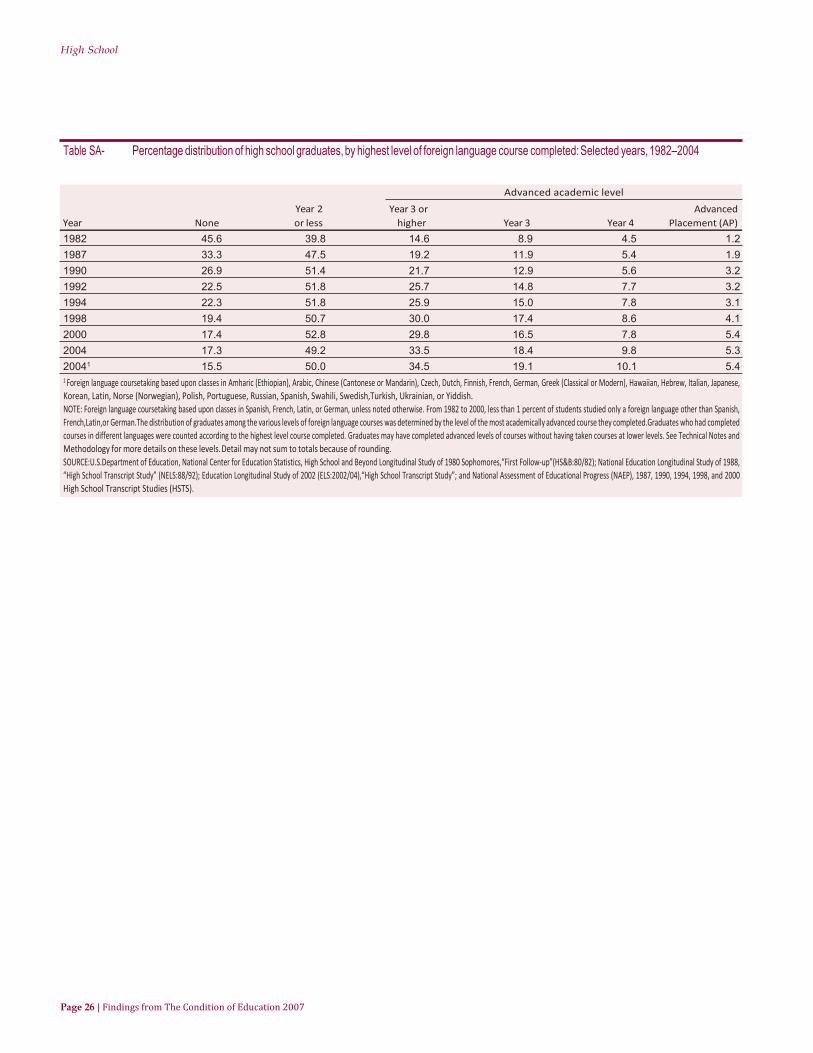
Table SA- Percentage distribution of high school graduates,by highest level of foreign language course completed: Selected years,1982–2004
Advanced academic level Year 2 Year 3 or Advanced
Year None or less higher Year 3 Year 4 Placement (AP) 1982 45.6 39.8 14.6 8.9 4.5 1.2 1987 33.3 47.5 19.2 11.9 5.4 1.9 1990 26.9 51.4 21.7 12.9 5.6 3.2 1992 22.5 51.8 25.7 14.8 7.7 3.2 1994 22.3 51.8 25.9 15.0 7.8 3.1 1998 19.4 50.7 30.0 17.4 8.6 4.1 2000 17.4 52.8 29.8 16.5 7.8 5.4 2004 17.3 49.2 33.5 18.4 9.8 5.3 20041 15.5 50.0 34.5 19.1 10.1 5.4 1 Foreign language coursetaking based upon classes in Amharic (Ethiopian), Arabic, Chinese (Cantonese or Mandarin), Czech, Dutch, Finnish, French, German, Greek (Classical or Modern), Hawaiian, Hebrew, Italian, Japanese, Korean, Latin, Norse (Norwegian), Polish, Portuguese, Russian, Spanish, Swahili, Swedish,Turkish, Ukrainian, or Yiddish. NOTE: Foreign language coursetaking based upon classes in Spanish, French, Latin, or German, unless noted otherwise. From 1982 to 2000, less than 1 percent of students studied only a foreign language other than Spanish, French,Latin,or German.The distribution of graduates among the various levels of foreign language courses was determined by the level of the most academically advanced course they completed.Graduates who had completed courses in different languages were counted according to the highest level course completed. Graduates may have completed advanced levels of courses without having taken courses at lower levels. See Technical Notes and Methodology for more details on these levels.Detail may not sum to totals because of rounding. SOURCE:U.S.Department of Education, National Center for Education Statistics, High School and Beyond Longitudinal Study of 1980 Sophomores,“First Follow-up”(HS&B:80/82); National Education Longitudinal Study of 1988, “High School Transcript Study” (NELS:88/92); Education Longitudinal Study of 2002 (ELS:2002/04),“High School Transcript Study”; and National Assessment of Educational Progress (NAEP), 1987, 1990, 1994, 1998, and 2000 High School Transcript Studies (HSTS).
Page 26 | Findings from The Condition of Education 2007

High School
Table SA- Percentage distribution of high school graduates,by type of English course taken and selected characteristics: 2004
Advanced academic level1
Low Regular English Less than 50–74 75–100 academic (no low 50 percent percent of percent
or of Total of courses courses courses
Total 0.7 10.8 55.9 32.7 9.2 7.6 15.9 Sex
Male 0.6 12.3 60.5 26.6 8.4 6.1 12.0 Female 0.7 9.3 51.5 38.5 9.9 9.0 19.6
Race/ethnicity White 0.6 7.5 56.5 35.4 9.5 8.3 17.6 Black 0.5 15.4 60.2 23.9 8.3 6.2 9.4 Hispanic 1.3 21.1 52.8 24.9 8.5 5.3 11.1 Asian/Pacifc Islander 0.1 13.2 43.6 43.1 9.0 8.1 26.0 American Indian 1.0! 16.1 61.7 21.2 2.9 1.6 16.8
Control of school Public 0.7 11.3 55.1 32.9 9.3 7.4 16.1 Private 0.2 4.3 64.9 30.7 7.4 9.6 13.7
! Interpret data with caution (estimates are unstable). 1 Includes graduates who completed a general English course classifed as“below grade level” if they completed a greater percentage of “honors” courses than“below grade level” courses. 2 Indicates that student transcript records did not list any recognized English courses; however, these graduates may have studied some English. If graduates took only English as a second language (ESL) courses for credit, they would be listed in this category. 3 Low academic level courses include all general English courses classifed as“below grade level.” Graduates may have taken a general English course classifed as regular or“honors” and be classifed in the low academic level if the percentage of“below grade level”courses completed was the plurality of courses completed. NOTE: For each graduate, the percentages of completed courses classifed as “below level,”“at grade level,” and “honors” were calculated. (Not all graduates completed 4 years of English.) After the percentage of graduates at each level had been calculated, the percentage of graduates who ft the category requirement for each level was determined, as explained in Technical Notes and Methodology. Race categories exclude persons of Hispanic ethnicity.Detail may not sum to totals because of rounding. SOURCE:U.S.Department of Education, National Center for Education Statistics, High School and Beyond Longitudinal Study of 1980 Sophomores,“First Follow-up”(HS&B:80/82); National Education Longitudinal Study of 1988, “High School Transcript Study” (NELS:88/92); Education Longitudinal Study of 2002 (ELS:2002/04),“High School Transcript Study”; and National Assessment of Educational Progress (NAEP), 1987, 1990, 1994, 1998, and 2000 High School Transcript Studies (HSTS).
Findings from The Condition of Education 2007 | Page 27

High School
Table SA- Percentage distribution of high school graduates,by highest levelof foreign language course completed and selected characteristics:2004
Advanced academic level Year 1 Year 3 or Advanced
Characteristic None or less Year 2 higher Year 3 Year 4 Placement (AP)
Total 15.5 16.1 33.9 34.5 19.1 10.1 5.4 Sex
Male 19.2 17.7 33.6 29.4 17.3 8.0 4.2 Female 11.9 14.6 34.1 39.4 20.8 12.1 6.5
Race/ethnicity White 14.1 15.6 33.0 37.2 20.6 11.4 5.3 Black 15.9 22.5 42.0 19.6 13.3 5.5 0.8 Hispanic 20.4 14.6 32.3 32.8 15.1 7.8 10.0 Asian/Pacifc Islander 10.8 12.3 26.4 50.5 27.2 14.2 9.1 American Indian 41.6 19.4 23.9 15.1 9.3 5.3 0.5
Control of school Public 16.5 16.8 34.1 32.6 18.1 9.3 5.2 Private 4.3 9.0 30.6 56.1 30.2 18.2 7.7
NOTE:Foreign language coursetaking based upon classes in Amharic (Ethiopian), Arabic, Chinese (Cantonese or Mandarin), Czech,Dutch, Finnish, French, German, Greek (Classical or Modern), Hawaiian, Hebrew, Italian, Japanese, Korean, Latin, Norse (Norwegian), Polish, Portuguese, Russian, Spanish, Swahili, Swedish,Turkish, Ukrainian, or Yiddish. Some graduates in each category also studied more than one foreign language.The distribution of gradu-ates among the various levels of foreign language courses was determined by the level of the most academically advanced course they completed. Graduates who had completed courses in different languages were counted according to the highest level course completed. Graduates may have completed advanced levels of courses without having taken courses at lower levels. See Technical Notes and Methodology for more details on these levels. Race categories exclude persons of Hispanic ethnicity.Detail may not sum to totals because of rounding. SOURCE: U.S. Department of Education, National Center for Education Statistics, Education Longitudinal Study of 2002 (ELS:2002/04),“High School Transcript Study.”
Page 28 | Findings from The Condition of Education 2007

High School
Table SA- Meanscore onAdvanced Placement (AP) exams,byselected subjectsandrace/ethnicity:1997–2005
Subject and race/ethnicity 1997 1998 1999 2000 2001 2002 2003 2004 2005
Allexams 3.0 3.0 3.0 3.0 3.0 3.0 3.0 3.0 2.9 White 3.0 3.0 3.1 3.1 3.0 3.1 3.0 3.0 3.0 Black 2.2 2.2 2.2 2.2 2.1 2.1 2.1 2.1 2.0 Hispanic 3.1 3.0 2.8 2.9 2.8 2.8 2.7 2.7 2.5 Asian/Asian American 3.1 3.1 3.1 3.1 3.0 3.1 3.1 3.1 3.1 American Indian/Alaska Native 2.6 2.6 2.6 2.6 2.5 2.5 2.5 2.5 2.4
Biology 3.2 3.0 3.1 3.1 3.0 3.1 3.0 3.0 3.0 White 3.2 3.1 3.2 3.2 3.1 3.2 3.1 3.1 3.1 Black 2.2 2.1 2.2 2.1 2.0 2.1 2.0 2.1 2.1 Hispanic 2.5 2.3 2.4 2.3 2.3 2.3 2.2 2.3 2.2 Asian/Asian American 3.4 3.2 3.3 3.3 3.1 3.3 3.2 3.3 3.3 American Indian/Alaska Native 2.8 2.7 2.7 2.7 2.5 2.6 2.5 2.4 2.5
Calculus AB 2.8 3.0 3.0 3.0 3.0 3.1 3.1 3.0 2.9 White 2.9 3.1 3.1 3.1 3.1 3.2 3.2 3.1 3.0 Black 2.0 2.1 2.1 2.1 2.1 2.2 2.2 2.0 1.9 Hispanic 2.3 2.5 2.4 2.4 2.3 2.4 2.4 2.2 2.2 Asian/Asian American 3.0 3.2 3.1 3.1 3.1 3.2 3.2 3.1 3.1 American Indian/Alaska Native 2.5 2.7 2.6 2.5 2.5 2.7 2.5 2.4 2.4
Chemistry 2.9 2.8 2.8 2.8 2.8 2.8 2.8 2.8 2.8 White 2.9 2.9 2.9 2.9 2.8 2.8 2.9 2.9 2.8 Black 2.0 1.9 2.0 2.0 1.9 1.9 1.8 1.9 1.8 Hispanic 2.2 2.2 2.2 2.1 2.0 2.0 2.0 2.0 2.0 Asian/Asian American 3.1 3.0 3.0 3.1 3.1 3.1 3.0 3.1 3.1 American Indian/Alaska Native 2.2 2.1 2.2 2.2 2.2 2.2 2.1 2.4 2.1
English literature andcomposition 3.1 3.1 3.1 3.1 3.0 3.0 2.9 3.0 2.9 White 3.2 3.1 3.2 3.2 3.1 3.1 3.1 3.1 3.1 Black 2.3 2.3 2.3 2.2 2.2 2.1 2.2 2.1 2.0 Hispanic 2.5 2.5 2.5 2.4 2.4 2.4 2.4 2.3 2.3 Asian/Asian American 3.1 3.1 3.1 3.1 3.0 3.0 3.0 3.0 3.0 American Indian/Alaska Native 2.7 2.6 2.7 2.7 2.5 2.5 2.5 2.6 2.4
PhysicsB 2.8 3.0 2.9 2.7 2.7 2.7 2.8 2.7 2.8 White 2.8 3.0 2.9 2.8 2.9 2.8 2.9 2.8 2.9 Black 2.0 2.1 1.8 1.8 1.7 1.8 1.8 1.7 1.7 Hispanic 2.2 2.2 2.1 2.0 1.9 1.9 2.1 1.9 2.0 Asian/Asian American 2.8 2.9 2.9 2.8 2.8 2.8 2.9 2.7 2.9 American Indian/Alaska Native 2.4 2.8 2.2 2.4 2.3 2.4 2.3 2.3 2.3
U.S.history 2.8 2.8 2.8 2.8 2.8 2.8 2.7 2.8 2.7 White 2.9 2.9 2.8 2.9 2.9 2.9 2.9 2.9 2.8 Black 2.1 2.2 2.0 2.1 2.1 2.1 2.0 2.0 1.9 Hispanic 2.3 2.4 2.2 2.3 2.1 2.1 2.1 2.1 2.0 Asian/Asian American 3.0 2.9 2.8 2.9 2.8 2.9 2.9 3.0 2.8 American Indian/Alaska Native 2.4 2.5 2.4 2.5 2.4 2.4 2.4 2.4 2.3
NOTE:Total averages for all examinations and by subject area include other race/ethnicity categories not separately shown. Biology, calculus AB, chemistry, English literature and composition, physics B, and U.S.history are some of the most frequently taken AP exams.The grades for all AP exams range from 1.0 to 5.0, with 5.0 being the highest score. Data reported are for all students who completed an AP exam.The College Board collects racial/ethnic information based on the categories American Indian/Alaska Native; Asian/Asian American; Black/Afro-American; Latino: Chicano/Mexican, Puerto Rican, Other Latino;White; and Other. Hispanic refers to the sum of all Latino subgroups.Race categories exclude persons of Hispanic ethnicity. SOURCE:The College Board, Advanced Placement Program. (1997–2005). National Summary Reports.
Findings from The Condition of Education 2007 | Page 29

High School
Table SA- Percentage of Advanced Placement (AP) examinations with a score of 3.0 or greater,by subject and race/ethnicity: 1997–2005
Subject and race/ethnicity 1997 1998 1999 2000 2001 2002 2003 2004 2005 Allexams 64.5 64.1 63.5 63.7 61.3 63.1 61.5 61.5 59.4
White 65.5 65.5 65.4 66.2 64.1 66.4 64.9 65.1 63.4 Black 35.9 35.1 34.6 33.8 31.2 33.2 31.8 31.6 28.6 Hispanic 61.1 59.5 57.4 55.9 52.5 52.5 50.5 50.1 46.7 Asian/Asian American 67.0 66.3 65.0 65.0 63.2 65.0 64.1 64.2 63.5 American Indian/Alaska Native 51.0 50.9 49.6 50.5 44.4 46.0 45.2 46.3 44.2
Biology 67.3 60.1 65.0 64.2 58.0 64.3 58.6 60.8 61.0 White 68.9 62.5 67.0 67.0 61.7 68.2 62.1 64.5 64.5 Black 35.9 32.3 35.9 33.1 26.9 32.1 28.6 29.6 30.2 Hispanic 46.5 38.0 42.1 39.3 33.9 38.2 33.7 35.9 35.6 Asian/Asian American 72.3 66.7 70.7 70.1 63.7 69.3 64.3 66.9 68.7 American Indian/Alaska Native 58.0 51.7 54.9 52.1 42.6 48.2 41.5 40.6 43.3
Calculus AB 59.3 65.8 63.4 63.2 63.6 67.0 65.6 59.0 57.6 White 60.5 67.9 65.7 66.2 66.7 70.3 68.9 62.3 61.1 Black 31.7 36.1 33.7 34.4 33.6 37.3 36.6 30.1 28.4 Hispanic 42.2 46.4 45.5 43.2 42.4 45.3 43.9 36.8 35.4 Asian/Asian American 64.3 68.9 66.3 64.8 66.0 69.1 69.0 62.9 62.4 American Indian/Alaska Native 50.1 54.7 49.6 48.3 47.1 52.1 47.5 42.4 42.1
Chemistry 58.1 57.8 56.9 58.0 57.4 56.9 56.2 56.4 55.4 White 58.7 58.5 57.9 58.9 58.8 58.3 58.7 58.1 57.0 Black 29.1 27.1 28.0 30.8 28.3 27.3 25.6 27.7 25.1 Hispanic 35.3 36.7 30.0 32.7 31.8 31.9 29.9 31.0 31.1 Asian/Asian American 63.9 63.9 62.1 64.9 65.1 64.7 62.4 64.5 64.8 American Indian/Alaska Native 38.5 36.1 38.6 35.7 38.9 38.2 34.9 42.3 34.4
English literatureandcomposition 68.9 68.1 68.2 68.1 63.1 66.0 62.6 64.9 61.9 White 72.1 71.6 72.4 73.5 68.1 71.6 68.0 71.4 68.7 Black 36.0 35.0 35.1 33.1 30.2 31.3 30.5 30.2 26.2 Hispanic 46.8 46.5 44.6 42.9 37.5 39.6 38.3 38.5 36.3 Asian/Asian American 70.0 69.8 67.6 69.7 63.3 65.9 63.4 64.4 63.2 American Indian/Alaska Native 55.1 51.9 52.2 56.3 42.9 47.7 45.1 49.0 42.9
PhysicsB 59.8 65.9 61.8 58.2 58.7 59.4 59.8 57.0 59.2 White 61.1 68.7 64.9 61.8 62.4 63.4 63.2 61.4 63.3 Black 33.1 35.5 28.2 25.1 24.0 25.9 26.9 23.1 22.6 Hispanic 41.8 41.2 35.3 32.6 33.4 32.7 35.3 30.7 31.7 Asian/Asian American 61.1 65.3 62.5 57.9 59.4 59.8 61.6 57.1 63.2 American Indian/Alaska Native 46.7 56.9 41.1 49.5 43.0 47.7 42.1 44.9 45.3
U.S.history 54.7 53.7 50.8 53.9 50.9 53.7 51.6 56.7 50.4 White 56.2 55.1 52.9 57.2 54.6 57.6 55.8 61.3 55.1 Black 29.3 29.1 25.5 28.3 25.1 28.3 25.2 29.6 23.8 Hispanic 38.0 35.8 31.3 32.0 27.6 30.1 27.7 31.7 27.4 Asian/Asian American 58.4 57.6 53.6 55.6 53.5 57.2 54.9 61.2 56.4 American Indian/Alaska Native 37.9 42.3 38.0 42.7 38.9 37.6 37.8 42.1 36.7
NOTE:Total averages for all examinations and by subject area include other race/ethnicity categories not separately shown. Biology, calculus AB, chemistry, English literature and composition, physics B, and U.S.history are some of the most frequently taken AP exams.The grades for all AP exams range from 1.0 to 5.0, with 5.0 being the highest score. Data reported are for all students who completed an AP exam.The College Board collects racial/ethnic information based on the categories American Indian/Alaska Native; Asian/Asian American; Black/Afro-American; Latino: Chicano/Mexican, Puerto Rican, Other Latino;White; and Other. Hispanic refers to the sum of all Latino subgroups.Race categories exclude persons of Hispanic ethnicity. SOURCE:The College Board, Advanced Placement Program. (1997–2005). National Summary Reports.
Page 30 | Findings from The Condition of Education 2007

High School
Technical Notes and Methodology
DATA SOURCE AND ESTIMATES
The transcript data in this special analysis were obtained from a statistical sample of the entire population of students or schools. Estimating the size of the total population or subpopula- tions from a data source based on a sample of the entire population requires consideration of several factors before the estimates become meaningful. However conscientious an organi- zation may be in collecting data from a sample of a population, there will always be some mar- gin of error in estimating the size of the actual total population or subpopulation because the data are available from only a portion of the total population. Consequently, data from sam- ples can provide only an estimate of the true or actual value. The margin of error or the range of the estimate depends on several factors, such as the amount of variation in the responses, the size and representativeness of the sample, and the size of the subgroup for which the estimate is computed. The magnitude of this margin of error is measured by what
STANDARD ERRORS
The standard error for each estimate in this special analysis was calculated in order to determine the “margin of error” for these esti-mates. The standard errors for all the estimated means and percentages reported in the figures and tables of the special analysis can be found on The Condition of Education homepage at http://nces.ed.gov/programs/coe.
An estimate with a smaller standard error pro- vides a more reliable estimate of the true value than an estimate with a higher standard error. Standard errors tend to diminish in size as the size of the sample (or subsample) increases. Consequently, for the same data, such as the percentage of students who scored in the top 25 percent on the NAEP
for students who took calculus as their highest mathematics course completed than for students who took algebra I as their highest mathematics course completed because the latter represent a larger proportion of the population.
DATA ANALYSIS AND INTERPRETATION
Due to standard errors, caution is warranted when drawing conclusions about the size of one population estimate in comparison to another or whether a time series of population estimates is increasing, decreasing, or staying about the same. Although one estimate of the population size may be larger than another, a statistical test may reveal that there is no measurable difference between the two estimates due to their uncertainty. Whether differences in means or percentages are statistically significant can be determined by using the standard errors of the estimates. When differences are statistically significant, the probability that the difference occurred by chance is usually small; for ex- ample, it might be about 5 times out of 100. For this special analysis, differences between means or percentages (including increases or decreases) are stated only when they are statistically significant. To determine whether differences reported are statistically significant, two-tailed t tests, at the .05 level, were used. The t test formula for determining statistical significance was adjusted when the
ROUNDING AND OTHER CONSIDERATIONS
Although values reported in the supplemental tables are rounded to one decimal place (e.g., 76.5 percent), values reported in this special analysis are rounded to whole numbers (with any value of 0.5 or above rounded to the next highest whole number). Due to rounding, total percentages sometimes differ from the sum of the reported parts, which may, for example, equal 99 or 101 percent, rather than the per-centage distribution’s total of 100 percent.
Findings from The Condition of Education 2007 | Page 31

High School
MEASURING HIGH SCHOOL COURSETAKING
There are various ways to measure the aca-demic coursework that students complete. For example, one can measure the number of courses a student has completed in different subjects (e.g., whether a student completed two, three, or four courses in mathematics). If one is interested in how common it is for students to complete certain courses, one can measure the percentage of high school students who have completed those courses. Yet another method is to measure the highest level of coursework completed in different subjects (e.g., whether a student’s most academically challenging math- ematics course was algebra I, trigonometry, or calculus). Based on these three methods, analysts have created different measures to categorize high school coursetaking. This supplemental note describes the coursetaking taxonomies used in the Special Analysis of The Condition of Education 2007.
All of the coursetaking data used in the Special Analysis come from transcripts of graduates of public and private high schools, which were collected as part of the U.S. Department of Education’s National Assessment of Education- al Progress (NAEP), Education Longitudinal Study of 2002 (ELS:2002), National Education Longitudinal Study of 1988 (NELS:88), and the High School & Beyond study (HS&B). It is important to note that comparability cannot be perfect because (1) the Secondary School Taxonomy (SST), was revised in 1998, (2) these data come from different transcript collections, thus introducing the possibility of minor variations in the coding methodology even though steps were taken to replicate the data collection and coding methodology in each study, and (3) these data used slightly different sample selection criteria when determining high school graduation status.
The high school courses taken by students are organized according to the Classification of Secondary School Courses (CSSC) and the Secondary School Taxonomy (SST). All courses in a student’s transcript are coded with a CSSC value after checking course titles on the stu-dent’s transcripts with course catalogs from
the academic levels in each subject area, using the Secondary School Taxonomy (SST).
Course credits are expressed in Carnegie units. A Carnegie unit is a standard of measurement used for secondary education that is equivalent to the completion of a course that meets one period per day for one school year, where a period is typically at least 40 minutes.
Transcript studies are a reliable source of in-formation but they do have limitations. One limitationisthat transcriptstudiescandescribe the intended—but not the actual—curriculum. The content and instructional methods of one course taught in one school by a certain teacher may be different from the content and instruc- tional methods of another course classified as having the same CSSC code taught in another school, or even the same school, by a different teacher. Nevertheless, validation studies and academic research have shown significant dif- ferences between the highest level of academic courses completed by students and their scores on
ACADEMIC PIPELINES
Academic “pipelines” organize transcript data in English, science, mathematics, and foreign language into levels based on the normal pro-gression and difficulty of courses within these subject areas. Each level includes courses either of similar academic challenge and difficulty or at the same stage in the progression of learn- ing in that subject area. In the mathematics pipeline, for example, algebra I is placed at a level lower in the pipeline continuum than is algebra II because algebra I is traditionally completed before algebra II and is generally less academically difficult or complex.
Classifying transcript data into these levels allows one to infer that high school graduates who have completed courses at the higher levels of a pipeline have completed more advanced coursework than graduates whose courses fall at the lower levels of the pipeline. Tallying the percentage of graduates who completed courses at each level permits comparisons of the per- centage of high school graduates in a given year who reach each of the
Page 32 | Findings from The Condition of Education 2007

High School
In classifying students’ courses from their tran-scripts according to a pipeline, only the courses completed with a passing grade in a subject area are included and not courses attempted. The inability to identify the number and types of courses attempted is due to inconsistent school reporting procedures. For example, many stu- dents retake courses they fail. In these instances, some schools report all courses attempted, while others report only the last course taken, substituting the passing grade. The pipeline also does not provide information on how many courses graduates completed in a particular subject area. Graduates are placed at a par- ticular level in the pipeline based on the level of their highest completed course, regardless of whether they completed courses that would fall lower in the pipeline. Thus, graduates who completed year 3 of (or 11th-grade) French did
MATHEMATICS PIPELINE
Originally developed by Burkam and Lee (NCES 2003-01), the mathematics pipeline progresses from no mathematics courses or nonacademic courses to low, middle, and ad-vanced academic coursework. Each level in the pipeline represents the highest level of math-ematics coursework that a graduate completed in high school. Thus, a graduate whose highest course is at the low academic level progressed no further in the mathematics pipeline and did not complete a traditional algebra I course, a prerequisite for higher level mathematics in high school. The mathematics pipeline has eight levels; however, two of these levels can be combined to create a “middle academic level,” and the top three levels can be combined to create an
No Mathematics
Includes graduates who completed either no coursework in mathematics or only basic or remedial-level mathematics. It is thus possible for a graduate to have taken one or more courses in mathematics, but to be placed in the no mathematics level.
Nonacademic Level
Highest completed courses are ingeneral math-ematics or basic skills mathematics, such as
general mathematics I or II; basic mathematics I, II, or III; consumer mathematics; technical or vocational mathematics; and mathematics review.
Low Academic Level
Highest completed courses are preliminary courses (e.g., prealgebra) or mathematics courses of reduced rigor or pace (e.g., algebra I taught over the course of 2 academic years). Considered to be more academically challeng-ing than nonacademic courses, courses at this level include prealgebra; algebra I, part I; alge- bra I, part II; and geometry (informal).
Middle Academic Level
The middle academic level is divided into two sublevels, each of which is considered to be more academically challenging than the non-academic and low academic levels, though the first level is not considered as challenging as the second level.
Algebra I/Geometry Level Highest completed courses include algebra I; plane geometry; plane and solid geom-etry; unified mathematics I and II; and pure mathematics.
Algebra II Level Highest completed course is algebra II or unified mathematics III.
Advanced Academic Level
The advanced academic level is divided into three sublevels, each of which is considered more academically challenging than the non-academic, low academic, and middle academic levels, though the first level is not considered as challenging as the second level, nor the second level as challenging as the third.
Trigonometry/Algebra III Level Highest completed course is algebra III; algebra/trigonometry; algebra/analytical geometry; trigonometry; trigonometry/ solid geometry; analytical geometry; linear algebra; probability; probability/statistics; statistics; statistics (other); or an indepen-
Findings from The Condition of Education 2007 | Page 33

High School
Precalculus Level Highest completed course is precalculus or an introduction to analysis.
Calculus Level Highest completed course is Advanced Placement (AP) calculus; calculus; or cal-culus/analytical geometry.
SCIENCE PIPELINE
Unlike mathematics and other subjects, such as foreign languages, coursework in science does not follow a common or easily defined sequence. Depending on a school’s curriculum, students can choose from several courses with minimal sequencing requirements.Consequent-ly, the method used to construct the science pipeline differs from that used to construct the mathematics pipeline. First, all science courses were placed in one of four groups based on subject matter: (1) life science (e.g., biology, ecology, zoology); (2) chemistry; (3) physics; and (4) all other physical sciences (e.g., geol-ogy, earth science, physical science). Second, a pipeline was constructed for each of these four groups. Third, the pipelines for chemistry, physics, and all other physical sciences were combined into a single pipeline (a physical sci-ence pipeline). Finally, the physical science and life science pipelines were combined to create a single science pipeline. The final pipeline has seven levels; however, for the Special Analysis, two of these levels were combined into one category (low academic level).
No Science
Includes graduates who did not complete any courses in science or who completed only basic or remedial-level science. It is possible for a graduate to have taken one or more courses in science but to be placed in the no science level.
Low Academic Level
The low academic level is composed of two levels, each of which is considered to be more academically challenging than no science.
Primary Physical Science Highest completed course is in basic physi-cal sciences: applied physical science; earth
Page 34 | Findings from The Condition of Education 2007
science; college preparatory earth science; or unified science.
Secondary Physical Science and Basic Biology Highest completed course is astronomy; geology; environmental science; oceanog-raphy; general physics; basic biology I; or consumer or introductory chemistry.
General Biology
Highest completed course is general biology I; secondary life sciences (includingecology, zool-ogy, marine biology, and human physiology); or general or honors biology II.
Chemistry I or Physics I
Highest completed course is introductory chemistry, chemistry I, organic chemistry, physical chemistry, consumer chemistry, gen-eral physics, or physics I.
Chemistry I and Physics I
Highest completed courses include one level I chemistry course (see above) and one level I physics course (see above).
Chemistry II or Physics II or Advanced Biology
Highest completed course is advanced biology, International Baccalaureate (IB) biology II, IB biology III, AP biology, field biology, genetics, biopsychology, biology seminar, biochemistry and biophysics, biochemistry, botany, cell and molecular biology, cell biology, microbiology, anatomy, and miscellaneous specialized areas of life sciences, chemistry II, IB chemistry II, IB chemistry III, AP chemistry, physics II, IB phys- ics, AP physics B, AP physics C: mechanics, AP physics C: electricity/magnetism, or physics II without
ENGLISH PIPELINE
English language and literature courses do not fit neatly into an ordered hierarchical framework. Instead of building on previously studied content, the English curriculum is stratified by the level of academic challenge and intensity of work re- quired within a specific content area rather than among different courses. For example, within the general English curriculum, most schools

High School
challenge: below-grade- level or low academic- level courses, at-grade or regular courses, and above-grade or honors courses. Thus, unlike the mathematics and science pipelines that are based on progress within a content continuum (e.g., algebra I, geometry, algebra II, trigonometry, and calculus), the English pipeline is constructed to reflect the proportion of coursework completed by graduates in each track. It reflects the qual-ity of a graduate’s English coursetaking rather than the progression from low-level to more challenging coursework. The English pipeline has seven categories; however, for the Special Analysis, two of these levels were combined
No English
No courses classified as English were ever completed by the graduate. It is possible for a graduate to have taken one or more unclas-sified English courses and be placed in the no English level. For the most part, these unclas-sified courses were English coursework for blind and deaf students or English as a Second Language courses.
Low Academic Level
The low academic level is divided into two sub-levels, the second of which is considered to be more academically challenging than the first.
50 Percent or More Low Academic-Level English The number of completed courses classified as low academic level, when divided by the total number of completed low academic-, regular-, and honors-level courses, yields a percentage between 50 and 100.
Some, but Less than 50 Percent Low Aca- demic-Level Courses The number of completed courses classified as low academic level, when divided by the total number of completed low academic-, regular-, and honors-level courses, yields a percentage less than 50. It is possible for a graduate to have also completed less than 50 percent honors-level courses and be classi- fied under this category if the percentage of low academic-level courses completed was equal to or greater than the percentage of honors-level courses
Regular
All completed English courses classified at grade level; no low academic-level or honors-level courses.
Advanced Academic Level
The advanced academic level is divided into three sublevels.
Some, but Less than 50 Percent Honors-Level Courses The number of completed courses classi-fied as honors level, when divided by the total number of completed low academic-, regular-, and honors-level courses, yields a percentage less than 50. It is possible for a graduate to have also completed less than 50 percent low academic-level courses and be classified under this category if the percent- age of low academic-level courses completed was less than the percentage of honors-level courses completed.
50 Percent or More, but Less than 75 Per-cent Honors-Level Courses The number of completed courses classified as honors level, when divided by the total number of completed low academic-, regu-lar-, and honors-level courses, yields a per-centage of 50 or greater and less than 75.
75 Percent or More Honors-Level Courses The number of completed courses classi-fied as honors level, when divided by the total number of completed low academic-, regular-, and honors-level courses, yields a percentage between 75 and 100.
FOREIGN LANGUAGE PIPELINE
Coursework in a foreign language follows an ordered, sequential path. Most high school studentswhostudyaforeignlanguage progress along such a path, which is typically a sequence of four year-long courses in the language. Not all students do this, however. Some students begin their studies in the middle of a sequence because they have prior knowledge of the language. Some repeat the same year of study. And a few (about 7 percent of 1988 graduates) study more than one language. The highest level of completed
Findings from The Condition of Education 2007 | Page 35

High School
language pipeline thus may not indicate the total number of years a graduate has studied a foreign language or languages. The distribution of graduates among the various levels of foreign language courses was determined by the level of the most academically advanced course those graduates completed.
The foreign language pipeline originally did not classify all foreign language study: before 2004, only courses in French, German, Latin, and Spanish were counted because these were the most commonly offered foreign languages. The next four most commonly offered foreign languages (Italian, Japanese, Hebrew, and Rus- sian) each accounted for less than 1 percent of 1988 graduates who studied foreign languages in the unweighted NELS:88 sample that was used to create the pipeline. Adding these four languages to the four most common languages in the pipeline originally made less than 0.1 percent difference in the percentage of gradu- ates who studied a single language, though it made more difference (yet less than 1 percent difference) in the percentage of graduates who never studied a language and who studied more than one language.
Beginning with 2004 transcript data, the foreign language pipeline expanded its definition of foreign language coursetaking to include any classes in Amharic (Ethiopian), Arabic, Chi-nese (Cantonese or Mandarin), Czech, Dutch, Finnish, French, German, Greek (Classical or Modern), Hawaiian, Hebrew, Italian, Japanese, Korean, Latin, Norse (Norwegian), Polish, Portuguese, Russian, Spanish, Swahili, Swedish, Turkish, Ukrainian, or Yiddish. Compared with the pre-2004 definition, this expanded definition increased the percentage of students who had completed a foreign language course at year 3 or higher by 1 percent. It decreased the percentage of students classified as having completed no foreign language study by 1.8 percent
Analysis, however, two of these levels were combined into one category (year 2 or less).
None
No courses classified as foreign language study were ever completed by graduate. Only courses included in the foreign language pipeline defini- tion are counted as foreign language study (see above), so it is possible for a graduate to have taken one or more courses of some other for- eign language and be
Year 1 (1 year of 9th-grade instruction) or less
Graduate completed no more than either a full Carnegie unit (1 academic year of coursework) of 9th-grade (year 1) foreign language instruc- tion or half a Carnegie unit of 10th-grade (year
Year 2 (1 year of 10th-grade instruction)
Graduate completed either a full Carnegie unit (1 academic year of coursework) of 10th-grade (year 2) foreign language instruction or half a Carnegie unit of 11th-grade (year 3) foreign language instruction.
Year 3 (1 year of 11th-grade instruction)
Graduate completed either a full Carnegie unit (1 academic year of coursework) of 11th-grade (year 3) foreign language instruction or half a Carnegie unit of 12th-grade (year 4) foreign language instruction.
Year 4 (1 year of 12th-grade instruction)
Graduate completed either a full Carnegie unit (1 academic year of coursework) of 12th-grade (year 1) foreign language instruction or half a Carnegie unit of 13th-grade (year 5) foreign language instruction.
AP Instruction
Graduate completed an AP foreign language course.
Page 36 | Findings from The Condition of Education 2007