Mathematics and Science Partnership (MSP) Program ... · Web viewMathematics and Science...
38
Mathematics and Science Partnership (MSP) Program Descriptive Analysis of Winning Proposals Preliminary Report February, 2005 DRAFT
Transcript of Mathematics and Science Partnership (MSP) Program ... · Web viewMathematics and Science...

Mathematics and Science Partnership (MSP) ProgramDescriptive Analysis of Winning Proposals
Preliminary ReportFebruary, 2005
DRAFT
Tom Loveless, Brookings InstitutionAlice Henriques, Brookings Institution
Andrew Kelly, American Enterprise Institute

Math Science Partnership ProgramAnalysis of Winning Proposals
Introduction
Beginning in the fiscal year 2003-2004, the Mathematics and Science Partnerships (Title
II, Part B) became a formula grant to be administered by the states. Money flowed from
Washington to the states, and after issuing Requests for Proposals (RFPs), the states
awarded grants in open competitions in early to mid-2004.
The following analysis is based on a review of 266 winning MSP proposals from forty-
one states. The study was conducted by a team consisting of Tom Loveless and Alice
Henriques of the Brookings Institution and Andrew Kelly of the American Enterprise
Institute. The MSPs were first read and scored by Henriques and Kelly, then reviewed in
depth by Loveless and the original scorer and re-coded when necessary. The team held
meetings during the review process to ensure that scoring remained consistent both
between reviewers and from the same reviewer over time.
The analysis began in September 2004 and was completed in February 2005. This report
was written by Tom Loveless. The views expressed in this report are solely those of the
author and do not reflect upon the institutions, governmental agencies, or other
individuals associated with him or this project.
2

After reviewing summary data on the RFPs, the report will focus on five themes.
1. Needs Assessments2. Activities of MSP Projects3. Content Emphasized in MSP Projects4. Pedagogy Emphasized by MSP Projects5. Evaluation of MSP Projects
Summary Data
Analytical Sample
A total of 266 winning MSP projects from 41 states were analyzed.
Subjects
The winning MSP projects focus primarily on mathematics. About half, 50.8%,
exclusively target mathematics, 22.9% address both math and science, and 26.3%
exclusively target science (See Table 1). In other words at least half and potentially as
many as three quarters of MSPs are in mathematics.
Table 1 Subjects Targeted by MSPs.
Math 266 50.8% 1Science 266 26.3% 0Math and Science 266 22.9% 0
Grades
The winning MSPs favor the middle grades. Projects typically cover several grades (e.g.,
K-6, 5-8, 6-12). Because there are no common grade clusters that allow for easy
categorization and analysis, we tallied data for each grade, K-12, and report the frequency
that each grade is included in an MSP. Sixth grade is the most prevalent grade level in
MSPs, included in 72.3% of projects (see Figure 1). Seventh and eighth grades are the
3

next most prevalent, included in 71.5% and 69.5%, respectively, of MSPs. Kindergarten
through fourth grades are included in 23% to 40% of projects. Ninth through twelfth
grades are included in 24% to 31%.
Number of Teachers
The median MSP project serves 46.5 teachers. Nearly one-third (30.0%) of the MSPs are
quite small, with fewer than 25 teachers (see Table 2). About one-fourth of the projects
(26.0%) are large, serving more than 100 teachers.
Table 2Number of Teachers Served in MSPs
No. of Teachers PercentLess than or equal to 25 30.026 – 50 23.651-100 20.4101-150 9.2
4

151-200 3.6201-250 4.4Greater than 250 8.8
Duration of Project
Most MSPs will last about two years, with the median project scheduled to last 21
months. Almost forty percent are funded for at least three years. Differences in time
length mostly arise from the fact that states varied as to when they were able to issue
Requests For Proposals, evaluate proposals, and initiate funding.
Table 3Duration of MSPs
Duration (in months) PercentLess than 24 months 50.924 months 7.125-35 months 2.236 months 38.9More than 36 months 0.9
Academic Partners from Higher Education
The MSP program is intended to involve non-education scholars, that is, college
professors from academic departments, in K-12 teacher training. An overwhelming
number of MSP projects (92.2%) meet this objective by explicitly including professors
from math or science departments in key planning or oversight roles (see Table 4). The
remaining projects may have mentioned mathematicians and scientists as participants, but
it was unclear that they had important roles.
5

Table 4Academic Partners of MSPs
Academic Dept Professor Included 92.1% 1
Needs Assessments of MSPs
Most of the winning MSPs ran needs assessments to document the educational needs of
the community that will be served by projects. Approximately five out of six proposals
(83.1%) reported and analyzed achievement test data. Two-thirds (68.0%) reported
demographic characteristics of participating districts, with most disaggregating
achievement data to report trends among students from different socioeconomic groups.
Nearly two-thirds of the winning MSPs (62.0%) conducted needs assessment surveys of
teachers and other educators, asking those who would be served by the projects for their
opinion of districts' most pressing needs.
Table 5Components of Needs Assessments
Component MeanTest Data 83.1%Demographics 68.0%Survey 62.0%
Three MSPs from Texas deserve special mention. One from Houston uses multiple
measures to evaluate local needs. Measures include:
(1) District-wide administration of Texas Assessment of Knowledge and Skills
(TAKS) and district profiles of schools, teachers, and students.
6

(2) District-wide administration of the SAT-9.
(3) Survey of high school educators.
(4) Number of teachers failing to meet “highly qualified” status and number of novice
teachers due to high teacher mobility rate.
(5) Focus groups of teachers and administrators.
In addition, Texas requires that at least 20% of students served by MSPs are on
free/reduced lunch or that at least 10,000 children are on FRL. This proposal also
meets that requirement.
In a second Texas MSP, the needs assessment included a teacher survey, student
demographics, student standardized test scores, and the percentage of teachers teaching
out of field at each school involved in the project. The teacher survey received 129
responses: “The 129 educator responses included 91 middle school teachers, 36 high
school teachers, and two science specialists; all but 12 of the respondents were from
public schools.” Data are reported from select questions on the survey: “Survey
responses addressed several areas. Chemistry Content—28 of the respondents had never
taken any chemistry courses; 58 had only a chemistry course in high school; just 31 had
taken a chemistry course as an undergraduate; 12 had taken a chemistry course in high
school.”
The teacher data also include turnover rate and district retirement projections:
“The teacher turnover rate is 18.5% and there is a young teaching staff with 41% having
fewer than 5 years experience.”
7

“Retirement projections predict 46% of the science teachers in these districts will retire
within 4-6 years.”
A third Texas MSP, rather than conducting a teacher survey, used TIMSS release items in
science to test teacher content knowledge. “In both 2002 and 2003, we assessed AISD
elementary and intermediate teachers’ science content knowledge by giving science
teachers release questions from the [TIMSS]. In 2002, we tested 87 elementary and
intermediate teachers to determine which areas of science were most misunderstood. We
then repeated the TIMSS questions in 2003 for 49 fifth grade teachers and found that 18
of 49 (37%) of these teachers scored 70% or less on this test which is designed for eighth
grade students.”
Activities of MSPs
The primary purpose of the MSP program is to support professional development. All
but two of the winning MSPs do just that—provide professional development. An
overwhelming number of MSPs offer summer institutes with follow-up inservice during
the academic year (91.7%). The median summer institute offers 64 hours of instruction
and 48 hours of follow-up. Almost one in five, 18.4%, utilize undergraduate or graduate
students in professional development activities. About one in four MSPs (23.%) involve
teachers in lab work and a similar number stress the use of manipulatives in solving math
problems. About one in six (15.7%) explicitly state that calculators receive attention in
instruction.
8

Table 6Activities of MSPs
Activities Mean MedianProfessional Development 99.2% 1Summer Institute 91.7% 1Summer Institute Hours 72.7 64Follow-up During Year 92.5% 1Follow-up Hours 58.1 48Undergrads/Grads 18.4% 0Labs 23.3% 0Calculators 15.7% 0Manipulatives 24.1% 0
One of the two projects not offering professional development, an MSP in Connecticut,
sets up a partnership to design a professional development program for K-3 teachers,
although it also sounds as if curriculum development will be involved. Curriculum
development was an activity solicited by the state's Request for Proposals. In a very
broad statement, the MSP proposal declares, "The goal of the proposed partnership is to
identify, secure, and guide the work of a facilitator who will collaborate with the State
Department of Education, Division of Teaching and Learning, in the continued
development of the K-3 Mathematics Blueprint for K-3 teachers to define current
research in the effective teaching of mathematics in the early grades, as well as the
creation of a professional development plan for teachers to attain the competencies
needed for success.”
The second MSP, from Nebraska, funds curriculum development in high school science.
"Proposed use of funds: Developing/redesigning a two-year sequence of rigorous science
courses. These courses will be in the natural sciences, for grades 9-12, and “be aligned
9

with state science standards and [meet] the entrance requirements of post-secondary
institutions”. “… the development of assessment instruments that are alighted with the
new course of study, the state science standards and STARS requirements”.
“Features of the curriculum will include: themes to integrate the science standards in
Biology, Chemistry, Earth Science and Physics; the use of scientists in the classroom; the
use of outdoor learning laboratories; and assessments to meet the STARS requirements
and aligned with state standards.” Again, the project is consistent with the state's RFP.
Table 7Summer Institutes—Number of Hours
Hours PercentLess than or equal to 40 10.341-80 68.6More than 80 21.1
Table 8Follow-up Hours
Hours PercentLess than or equal to 30 29.531-60 51.3More than 60 19.2
Weaknesses in MSP Activities
As already pointed out, most of the MSPs are offering summer institutes that will train
teachers in math and science. Some of the MSPs appear to be offering sound
professional development in mathematics and science. Many, however, are vague in
describing what teachers will learn. An MSP in Ohio, for example, provides no
10

information about the professional development provided other than it will entail
implementing two science instruction modules. “This project encompasses the
coordination of Trainers and Coaches, logistics and all materials necessary to conduct
two Institutes and related follow-up sessions for each OSCI Module – one Institute to be
held in central Ohio and another in the Mansfield area.”
Other MSPs' professional development activities tip decisively towards pedagogy. A
proposal in Michigan focuses on the Japanese “lesson study” technique of professional
development, in which students spend weeks at a time planning one single lesson. The
main outcome (as defined by the proposal) is a library of video clips of “best practices”
for the classroom. Projects utilizing the “lesson study” model should be closely
scrutinized. The approach is less about content knowledge and more about refining one
lesson for an extended period of time. It is not unique among MSPs. In addition to three
MSPs in Michigan, projects in Illinois, Oklahoma, and Minnesota also are based on the
lesson study model.
Another problem arises with MSPs attempting to do too much. A proposal from
Alabama focuses on science and math in grades K-12. The project offers professional
development to improve teacher content knowledge but also lists “revision of secondary
education certification” as one of its priorities. The proposal asserts that it will “decrease
out of field teachers in science and mathematics, especially at the high school level by
increasing the supply of qualified personnel through [methods] such as alternative,
11

innovative routes to teacher certification.” It is not clear how the project will achieve
these certification goals.
The Alabama proposal is unclear as to how much of this project existed already, under
the state's AMSTI initiative, and how much is new for the MSP. The same problem is
apparent in other MSPs from Alabama. It appears local officials might be using federal
money to extend a state initiative, a concern raised in our earlier analysis of Alabama's
RFP. A progressive orientation towards mathematics instruction pervades the MSP: “In
addition to supplying needed materials such as manipulatives, graphing calculators, and
measuring devices, selected pull-out units, often referred to as curriculum replacements,
will be included in each kit. Each pull-out unit was developed with the support of the
National Science Foundation and incorporates the strategies supported by the latest
research on math instruction. The units strongly support the national standards advocated
by the National Council of Teachers of Mathematics.”
Content of MSP Programs
More than 90% of the winning MSPs link content to state standards. Algebra, geometry,
and problem solving are the top three math topics addressed by MSPs professional
development activities. Algebra is covered by about one-third, (33.8%), geometry by
about one-fourth (25.9%), and problem solving by almost one-fourth (23.7%) of MSPs.
Physical science is the most popular topic in science, addressed by 21.1% of MSPs.
Table 9
12

Content of MSP Professional Development
Math--All GradesTopic MeanAlgebra 33.8%Geometry 25.9%Problem Solving 23.7%Probability & Statistics 19.5%Arithmetic 14.7%Technology-Students 10.5%
Science—Secondary GradesTopic MeanMS Physical Science 21.1%MS Life Science 17.7%HS Physics 7.9%HS Chemistry 7.1%HS Biology 6.4%HS Environmental Science 3.3%
Unique Elements in MSPs
A number of MSPs contain unique elements. Among the most interesting are:
1. From TX: Each participant in this project is given a digital camera. “The teachers
will be expected to demonstrate mastery in the use of each piece of technology:
digital camera, graphing calculator, probes, online resources, and web page and
newsletter construction.”
2. From TX: each participant receives a laptop and a graphing calculator (emphasis
on data collection and analysis).
3. From WV: preservice teachers included in the professional development cohort.
Not just practicing teachers.
4. From IL: one component of program is to host “math and science nights” that will
include parents and will discuss possible careers in math and science.
13

5. OK-2: Teachers live at college in dorms during summer institute; also given an
afternoon of physical activity a week that emphasizes the development of self-
esteem
6. A number of MSPs from Kansas include administrators in the summer institute
cohort.
7. Also from KS: MSP trains principals to recognize and evaluate good teaching.
(Training of principals was written into the grant).
8. From TX: This proposal’s objectives include concrete content objectives; for
example, teachers in professional development will learn the “structure of the
atom and the law of conservation of mass.” More specific than simply saying
“improving the content knowledge of teachers.”
9. From MN: explicitly states that its partners are charter schools.
10. From MN: designed to certify teachers on variance or waiver.
11. From KY: bridge between research science and teaching; master teachers in wide
range of science topics, with lots of detail provided, participate in research;
“Our goal is to increase the knowledge base of Middle School mathematics and
science teachers by involving them in field research under the guidance of
experienced research scientists.” “Partnering mentors will join research scientists
at MSU, using a directed research model, to become intimately involved in
research projects in biology, geoscience, astrophysics, mathematics, computer
science, and chemistry.”
14

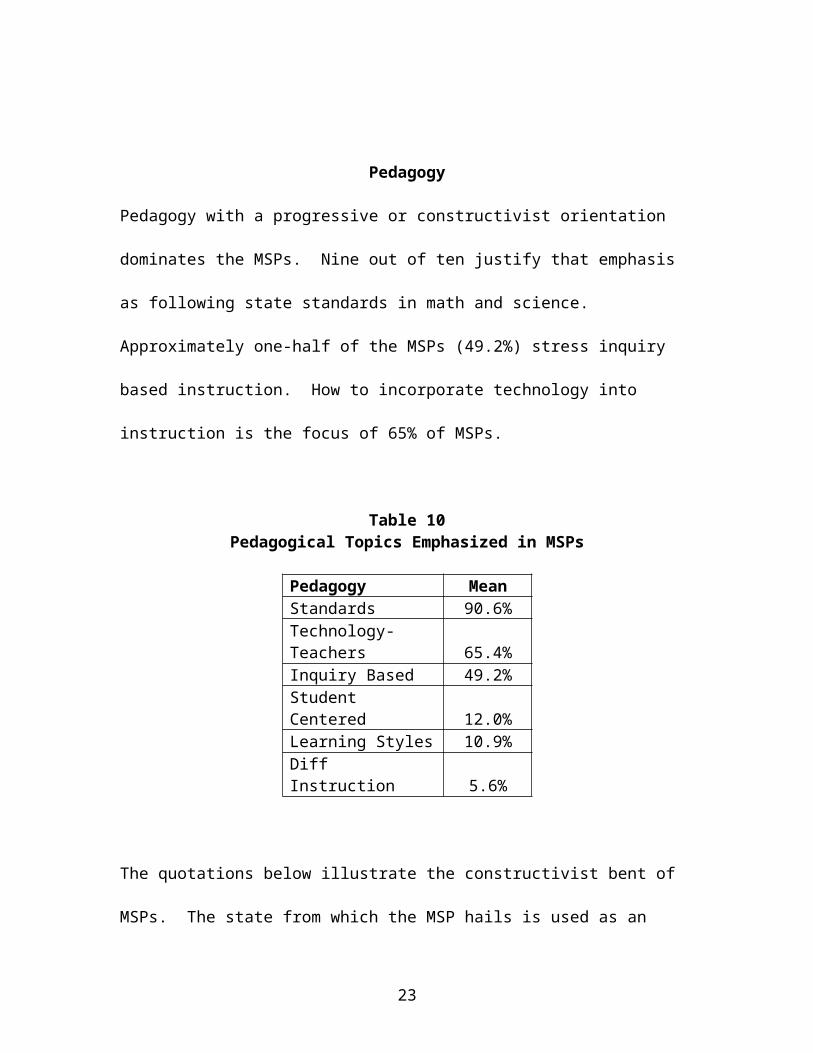
Pedagogy
Pedagogy with a progressive or constructivist orientation dominates the MSPs. Nine out
of ten justify that emphasis as following state standards in math and science.
Approximately one-half of the MSPs (49.2%) stress inquiry based instruction. How to
incorporate technology into instruction is the focus of 65% of MSPs.
Table 10Pedagogical Topics Emphasized in MSPs
Pedagogy MeanStandards 90.6%Technology-Teachers 65.4%Inquiry Based 49.2%Student Centered 12.0%Learning Styles 10.9%Diff Instruction 5.6%
The quotations below illustrate the constructivist bent of MSPs. The state from which the
MSP hails is used as an identifier only. It is not to imply that the constructivist
philosophy is statewide, although the prominence of such an orientation in Kansas is
obvious.
1. MN: In the section describing program personnel (whom they recruited to
teach at the summer institute): “Maximum credence will be placed on
those who apply current constructivist, student-centered curriculum
techniques in their classroom as recommended by the National Research
Council.” Pg. 9
15

Also: “Efforts will be made to reduce what Haberman calls “the pedagogy
of poverty,” where urban pedagogy has been found in a majority of urban
classrooms to be based on giving information, tests, directions, seat work,
settling disputes and grades.” Pg. 6
2. KS: “The philosophical foundation is based on a view of mathematics as a
humanistic, socially constructed discipline and way of thinking that
implies the learning and teaching of mathematics through inquiry. It also
supports both integration of mathematics across the curriculum and
integration of language arts within mathematics. Inquiry-based learning
provides natural points of integration in problem solving across the
curriculum between mathematics, language arts, science and other areas.”
Pg. 6-7.
3. KS: “The project design will be to move mathematics instruction away
from traditional instructions in the following ways: …
a. Toward logic and mathematical evidence as verification and away
from teacher as the sole authority for right answers.
b. Toward conjecturing, inventing and problem solving and away
from an emphasis on the mechanics of finding answers, and
c. Toward connecting mathematics, its ideas and its applications to
the real world and away from treating mathematics as a body of
isolated concepts and procedures.” Pg. 13
4. TN: “The summer workshop will focus on subject matter content as
guided and informed by the state science curriculum standards and the
16

National Staff Development Council’s Professional Development
Standards. The workshop will focus on active involvement of the learner
and a constructivist approach to learning.” (p.17)
5. 5. MS: “MSP will be intrinsically constructivist and based on developing
a dialog between students and teachers that promotes critical thinking in
an atmosphere of mutual questioning, analysis, and discussion.” (p.12).
“The Academy will continue and further enhance the Partnership’s vision
of improving the teaching and learning of science in the State of
Mississippi. They will address the very well-established need for teachers
to be trained, mainly in content, to teach physical science, earth and space
science and technology specially in grades 6-8.” (p.8)
6. HI: Targets subgroups (English language learners, special education,
economically disadvantaged), seeks to connect math and science to real
life situations;
“Program participants will use constructivist strategies that are researched
-based for improved learning.” (p. 9)
“Through collaborative and partnership efforts… propose a three-year
professional development framework in order to expedite standards-based
learning and teaching in the core subjects of mathematics and science for
Kauai K-12 teachers… program will provide graduate level instruction
and training through summer institutes…” (p.6)
17

Evaluation
How will the MSPs evaluate gains in teacher and student knowledge? Two-thirds of the
winning projects administer content knowledge tests to teachers, conduct observations,
make pre-and post test comparisons. About 60% will survey teachers on the
effectiveness of training. Slightly more than half of the MSPs (54.9%) are developing
their own tests for teachers, 41.4% are using portfolios, and 12.8% are videotaping
teachers for assessment purposes.
Most MSPs are relying on state tests of academic achievement to measure student
knowledge. About half of the MSPs (51.9%) will analyze student gains as part of the
evaluation of MSPs. With student scores on state tests readily available, only 13.9% of
MSPs are going to develop homegrown tests.
Table 11Evaluation of MSPs
Teacher Evaluation MeanContent Knowledge Test 66.2%Observation 65.7%Pre/Post Content Knowledge Test 64.3%Survey 60.5%Home Grown Test 54.9%Portfolio 41.4%Videotaping 12.8%
Student Evaluation MeanContent Knowledge Test 66.9%Test Gains 51.1%Home Grown Test 13.9%Evaluator PercentInternal/NA 42.1Semi-Independent 11.6
18

Independent 46.3
We also attempted to record the independence of MSP evaluators. Almost half (46.3%)
are independent, meaning that they are not part of the team sponsoring the project nor
affiliated with the lead school district or institution of higher learning proposing the
project. About one in ten (11.6%) are semi-independent—not a MSP developer but
associated with one of the developers through institutional affiliation. And about 42%
were either indeterminable or the evaluator appeared to be involved with the development
of the MSP project.
Randomized Design in Evaluation
A small number of MSPs employ randomized designs to evaluate program effects.
Randomization is always hard to implement in educational setting, and these MSPs offer
creative strategies for solving the puzzle.
1. OR: “Dr. Fielding and Ms. DeLoach of the WESD will have primary
responsibility for recruiting and orienting 40 middle school science teachers
who have not yet attained the “highly qualified teacher” status (Dr. Joe
Hansen, the third-party evaluator, will randomly assign 20 of the teachers to
the treatment group and 20 to the control group).” Pg. 9
“From a pool of approximately 40 teacher participants, one half will be
randomly assigned to the treatment group. The remaining half will serve as
the control group for the first year and will be cycled into the T group the
second year, if funded. Mid-way through year one a second cohort will be
19

recruited for year two and will be randomly divided into T and C groups,
resulting in comparable groups for year two. Even without a year 3 C group
this design will yield two years of comparison data, sufficient to detect the
presence of a treatment effect.” Pg. 16
2. OR: “Schools will be randomly assigned to experimental and control
groups with a total of two middle schools and one or two elementary being
assigned to the experimental group. The teachers in the control schools will
not receive the professional development treatment. In the event that funding
is available for a multi-year effort in this project, we will recruit a second
group of schools and teachers throughout the district and region for the second
year of the grant. These teachers will serve as the control group so that the
first year’s control group might receive the professional development
treatment.” Pg. 10
3. CO: Project offers four summer institutes (each a different content topic)
and one research summer institute. Lead teachers mentor others in high needs
schools using Japanese model of lesson study. “Four middle schools will be
randomly selected to serve as the experimental group (middle schools whose
teachers have participated in MSP training), and four middle schools will be
randomly selected to serve as the control group (middle schools whose
teachers have not participated in MSP training). To determine if student
achievement in mathematics and science improves as a result of their teachers
20

participating in project-sponsored professional development, a Pre/Post test
Control Group Design will be developed to study the effectiveness of the
project on improving student achievement in mathematics and science.” (p.11)
4. CO: Project randomly assigns unqualified teachers to cohorts, designates
(internal and external) control groups; offers online courses in addition to
regular courses; master's degree option for teachers:
"For the randomized design, we will identify all teachers that are “not highly
qualified” and “qualified” within the partnership. Of those not highly
qualified that choose to take part in the program, we will randomly assign
them to one of three annual cohorts… All cohorts of teachers will be tested
with ETS exams prior to initiating the PD… In the second year, all cohorts
will be tested with ETS and Cohort 2 will participate in PD. The quasi-
experimental comparison group for all three years will be teachers from
similar Front Range schools as matched by cluster analysis."
5. FL: Targets early career teachers; uses comparison group of teachers
(random assignment of schools); three week science internships at
museum; incorporates reading into math/science curriculum; conducts
media and community relations campaign; assesses with both state and
homegrown tests:
21

“From a group of 41 Title I schools, 21 school will be randomly assigned to
the program group and 20 to the control group. New teachers… in the
program group schools will be given the opportunity to participate in the
Florida BEST program. Depending on the number of new teachers in each
school, 50-60 new teachers will participate in the program. An equal number
of teachers will be selected from [the] control group schools to serve as a
comparison group.” (p.7)
Assessment
Professional development seeks to increase teachers' knowledge and skills. In addition to
a good randomized design, the key to evaluating the effectiveness of MSPs rests on how
such gains are measured. These effects manifest in teachers' knowledge and behaviors
and are fairly immediate. Ultimately, however, gains in teachers' skills are assumed to
lead to gains in student learning. Thus, MSPs are interested in assessing two kinds of
outcomes; the first being the proximal changes evidenced by teachers from participating
in MSPs, and the second being subsequent gains in student learning.
A few MSPs employ a blend of standardized and non-standardized (homegrown)
assessments. Standardized assessments bolster the legitimacy of any gains produced by
MSPs, in the sense that growth claimed by the project's sponsors cannot be an artifact of
a test that they wrote. Homegrown tests, on the other hand, allow projects to measure
progress made on very specific knowledge and skills that MSPs deem valuable, even if
22
those knowledge and skills are not a concern of mainstream tests. Using both forms of
assessment allows the two to complement each other. Two MSPs deserve mention.
1. TX: This proposal’s evaluation uses two pre/post tests of teacher content knowledge.
The first is a home-grown set of open-ended items based on the TEKS. The second is
“the released 10th grade TAKS test [which] will also be administered as a post-test.”
2. OR: Students in treatment in control and treatment groups will take homegrown pre
and post-tests. In addition, “Students in 5th and 8th grades will also take the OSAT
assessments in the spring of 2005. The state assessments will help establish the validity
of the GO Math program for specifically addressing state education goals, as well as
providing external validity for the Cadre-developed tests.” Pg. 4.
Poor Evaluation
Many MSPs contain poor evaluation plans. Vague measures, a reliance on surveys of
teachers' impressions, and failing to measure gains in knowledge are the primary
problems. The projects below stand out as unlikely to be able to determine whether the
MSPs have been successful or unsuccessful in fulfilling the program's objectives.
1. IL: MSP never refers to a teacher content assessment or student achievement
measurement. Instead, “Area 1 alliance partners will collect data as needed for
evaluation (comparative program information, outcome statistics, cooperative and
collaborative efforts generated, meeting agendas, etc.)” Pg. 26
2. IL: Teachers will take part in a “self-evaluation.” No content test is listed.
23

3. WY: Everyday Math and other math curriculum. Proposal does not explain how
teacher knowledge will be evaluated. Presents plan for community dissemination
and informational meetings for parents. Evaluation tools are a questionnaire,
records of articulation meetings, and interviews of teachers and principals. The
questionnaire covers curriculum knowledge and content benchmark.
4. AL: Evaluation is incomprehensible: “based on the realization that
comprehensive math education encompasses a set of interventions with short-term
impacts that cumulatively impact the context in which mathematics is learned and
experienced over the long term. [Illegible] the interventions can not be attributed
to a linear cause-effect approach, but must [illegible] the context of cumulative
strengthening of math education by increasing formal (universities) and informal
(family, community) education capacity.”
24