Maternal Mortality in 2005 Using the 2005 maternal mortality estimates 19 6.2 Generating better...
48
Maternal Mortality in 2005 Estimates developed by WHO, UNICEF, UNFPA and The World Bank
Transcript of Maternal Mortality in 2005 Using the 2005 maternal mortality estimates 19 6.2 Generating better...

Maternal Mortality in 2005Estimates developed by WHO, UNICEF, UNFPA and The World Bank

Maternal Mortality in 2005Estimates developed by WHO, UNICEF, UNFPA, and The World Bank

WHO Library Cataloguing-in-Publication Data
Maternal mortality in 2005 : estimates developed by WHO, UNICEF, UNFPA, and the World Bank.
1.Maternal mortality - trends. 2.Maternal welfare. 3.Data collection - methods. 4.Models, Statistical. 5.Millennium Development Goals. I.World Health Organization. II.World Bank. III.UNICEF. IV.United Nations Population Fund.
ISBN 978 92 4 159621 3 (NLM classification: WQ 16)
© World Health Organization 2007
All rights reserved. Publications of the World Health Organization can be obtained from WHO Press, World Health Organization, 20 Avenue Appia, 1211 Geneva 27, Switzerland (tel.: +41 22 791 3264; fax: +41 22 791 4857; e-mail: [email protected]). Requests for permission to reproduce or translate WHO publications – whether for sale or for noncommercial distribution – should be addressed to WHO Press, at the above address (fax: +41 22 791 4806; e-mail: [email protected]).
The designations employed and the presentation of the material in this publication do not imply the expression of any opinion whatsoever on the part of the World Health Organization concerning the legal status of any country, ter-ritory, city or area or of its authorities, or concerning the delimitation of its frontiers or boundaries. Dotted lines on maps represent approximate border lines for which there may not yet be full agreement.
The mention of specific companies or of certain manufacturers’ products does not imply that they are endorsed or recommended by the World Health Organization in preference to others of a similar nature that are not mentioned. Errors and omissions excepted, the names of proprietary products are distinguished by initial capital letters.
All reasonable precautions have been taken by the World Health Organization to verify the information contained in this publication. However, the published material is being distributed without warranty of any kind, either expressed or implied. The responsibility for the interpretation and use of the material lies with the reader. In no event shall the World Health Organization be liable for damages arising from its use.
Printed in

3
Acknowledgements i
Acronyms and abbreviations ii
EXECUTIVE SUMMARY 1
1. INTRODUCTION 3
2. MEASURING MATERNAL MORTALITY 4
2.1 Concepts and definitions 4
2.2 Measures of maternal mortality 4
2.3 Approaches for measuring maternal mortality 5
3. THE DEVELOPMENT OF 2005 ESTIMATES OF MATERNAL MORTALITY 9
3.1 Sources of country data used for the 2005 estimates 9
3.2 Methods used to estimate MMR in 2005 according to data source 10
3.3 Calculation of adult lifetime risk of maternal mortality 13
3.4 Global and regional estimates 14
3.5 Differences between the 2005 methodology compared with 2000 14
4. ANALYSIS AND INTERPRETATION OF 2005 ESTIMATES 15
4.1 Maternal mortality estimates for 2005 15
4.2 Estimates of MMR trends 15
5. IS THE FIFTH MDG ACHIEVABLE? 18
6. NEXT STEPS 19
6.1 Using the 2005 maternal mortality estimates 19
6.2 Generating better information for estimating maternal mortality 19
ANNEXES: 21
Annex 1. List of socioeconomic and programmatic indicators with percentage of missing values 21
Annex 2. Correlation matrix showing the associations between all possible indicators 22
Annex 3. Estimates of number of maternal deaths, lifetime risk, MMR, and range of uncertainty (2005) 23
Annex 4. Countries with large MMR differences between 2000 and 2005 28
APPENDICES: 29
Appendix 1. Maternal mortality data derived from civil registration: countries and territories with good death registration and good attribution of cause of death (Group A) 29
Appendix 2. Maternal mortality data derived from civil registration: countries and territories with good death registration but uncertain attribution of cause of death (Group B) 30
Appendix 3. Maternal mortality data derived from the direct sisterhood method: reported and adjusted estimates (Group C) 31
Appendix 4. Maternal mortality data derived from studies in Groups D–G 32
Appendix 5. Maternal mortality data derived from model (Group H) 32
CONTENTS

Appendix 6. Estimates of MMR, number of maternal deaths, lifetime risk, and range of uncertainty by WHO regions, 2005 34
Appendix 7. Comparison of 1990 and 2005 maternal mortality by WHO regions 34
Appendix 8. Estimates of MMR, number of maternal deaths, lifetime risk, and range of uncertainty by UNICEF regions, 2005 35
Appendix 9. Comparison of 1990 and 2005 maternal mortality by UNICEF regions 35
Appendix 10. Estimates of MMR, number of maternal deaths, lifetime risk, and range of uncertainty by UNFPA regions, 2005 36
Appendix 11. Comparison of 1990 and 2005 maternal mortality by UNFPA regions 36
Appendix 12. Estimates of MMR, number of maternal deaths, lifetime risk, and range of uncertainty by the World Bank regions and income groups, 2005 37
Appendix 13. Comparison of 1990 and 2005 maternal mortality by the World Bank regions and income groups 37
Appendix 14. Estimates of MMR, number of maternal deaths, lifetime risk, and range of uncertainty by United Nations Population Division regions, 2005 38
Appendix 15. Comparison of 1990 and 2005 maternal mortality by United Nations Population Division regions 38
TABLES:
Table 1. Sources of maternal mortality data used in developing the 2005 estimates 9
Table 2. Estimates of MMR, number of maternal deaths, lifetime risk, and range of uncertainty by United Nations MDG regions, 2005 16
Table 3. Comparison of 1990 and 2005 maternal mortality by United Nations MDG regions 17
FIGURES:
Figure 1. Comparison of DHS sisterhood estimates and WHO estimates of female adult mortality 11
BOXES:
Box 1. Alternative definitions of maternal death in ICD-10 5
Box 2. Statistical measures of maternal mortality 5
Box 3. Approaches to measuring maternal mortality 6
Box 4. PMDF statistical model for countries with no appropriate estimates of maternal mortality 13
Box 5. Formula for estimating adult lifetime risk 13
REFERENCES 39
i
i
Maternal Mortality in 2005
ACKNOWLEDGEMENTS
This report was prepared by Lale Say and Mie Inoue of The World Health Organization (WHO), and Samuel
Mills and Emi Suzuki of The World Bank. Design and layout by Janet Petitpierre. Cover illustration was pro-
vided by UNDP Regional Service Centre for Eastern and Southern Africa.
The following individuals, listed in alphabetical order, have contributed to the preparation of these estimates:
Carla Abou-Zahr of Health Metrics Network, Stan Bernstein of the United Nations Population Fund (UNFPA),
Eduard Bos of The World Bank, Kenneth Hill of Harvard University, Mie Inoue of WHO, Samuel Mills of The
World Bank, Kourtoum Nacro of UNFPA, Lale Say of WHO, Kenji Shibuya of WHO, Emi Suzuki of The World
Bank, Kevin Thomas of Harvard University, Tessa Wardlaw of the United Nations Children’s Fund (UNICEF),
Neff Walker of Johns Hopkins University, and John Wilmoth of the United Nations Population Division. Thanks
are due to Paul Van Look for reviewing and commenting on the report. Financial support from the World Bank
Netherlands Partnership Program is acknowledged.
Contact person: Lale Say, Department of Reproductive Health and Research, WHO.
e-mail: [email protected]
AIDS Acquired immunodeficiency syndrome
CEMD Confidential Enquiry into Maternal Deaths
CIS Commonwealth of Independent States
DHS Demographic and Health Survey
EUR dummy variable identifying observations from Europe
GDP gross domestic product per capita based on purchasing power parity conversion
GFR general fertility rate
ICD-10 International Statistical Classification of Diseases and Related Health Problems (10th Revision)
MDG Millennium Development Goal
MENA dummy variable identifying observations from North Africa and the Middle East
MMR maternal mortality ratio
MMRate maternal mortality rate
OECD Organisation for Economic Co-operation and Development
PMDF proportion maternal among deaths of females of reproductive age
RAMOS reproductive-age mortality studies
SKA proportion of births with skilled attendants
TFR total fertility rate
UNFPA United Nations Population Fund
UNICEF United Nations Children’s Fund
UNPD United Nations Population Division
VRcomplete dummy variable equal to 1 if registration of deaths is 90% or more complete
WHO World Health Organization
WP dummy variable identifying observations from Western Pacific
ACRONYMS AND ABBREVIATIONS
ii

1
1
Maternal Mortality in 2005
EXECUTIVE SUMMARY
Improving maternal health and reducing mater-
nal mortality have been key concerns of several
international summits and conferences since the
late 1980s, including the Millennium Summit in
2000. One of the eight Millennium Development
Goals (MDGs) adopted at the Millennium Summit is
improving maternal health (MDG5). Within the MDG
monitoring framework, the international community
committed itself to reducing the maternal mortality
ratio (MMR) by three quarters between 1990 and
2015.
In this context, country estimates of maternal mor-
tality over time are crucial to inform planning of
sexual and reproductive health programmes and to
guide advocacy efforts and research at the national
level. These estimates are also needed at the inter-
national level, to inform decision-making concerning
resource allocation by development partners and
donors. However, assessing the extent of progress
towards the MDG5 target has been challenging, due
to the lack of reliable maternal mortality data – par-
ticularly in developing-country settings where mater-
nal mortality is high.
The World Health Organization (WHO), the United
Nations Children’s Fund (UNICEF), and the United
Nations Population Fund (UNFPA) have made
three previous attempts to develop internation-
ally comparable estimates of maternal mortality
(for the years 1990, 1995, and 2000) by using an
approach that encompasses different sources of
data. However, the exact methodology used by
each exercise differed. The development of country,
regional, and global estimates for 2005 followed a
similar approach, but used improved methodologi-
cal techniques. Development of this round of esti-
mates involved The World Bank in addition to WHO,
UNICEF and UNFPA. A separate analysis of trends
was also performed, to assess the likely change in
MMR from 1990 to 2005 at the regional and global
levels.
Of the estimated total of 536 000 maternal deaths
worldwide in 2005, developing countries accounted
for 99% (533 000) of these deaths. Slightly more
than half of the maternal deaths (270 000) occurred
in the sub-Saharan Africa region alone, followed by
South Asia (188 000). Thus, sub-Saharan Africa and
South Asia accounted for 86% of global maternal
deaths.
By the broad MDG regions, MMR in 2005 was
highest in developing regions (at 450 maternal
deaths per 100 000 live births), in stark contrast to
developed regions (at 9) and countries of the com-
monwealth of independent states (at 51). Among
the developing regions, sub-Saharan Africa had the
highest MMR (at 900) in 2005, followed by South
Asia (490), Oceania (430), South-Eastern Asia (300),
Western Asia (160), Northern Africa (160), Latin
America and the Caribbean (130), and Eastern Asia
(50).
A total of 14 countries had MMRs of at least 1000,
of which 13 (excluding Afghanistan) were in the sub-
Saharan African region. These countries are (listed
in descending order): Sierra Leone (2100), Niger
(1800), Afghanistan (1800), Chad (1500), Somalia
(1400), Angola (1400), Rwanda (1300), Liberia
(1200), Guinea Bissau (1100), Burundi (1100), the
Democratic Republic of the Congo (1100), Nigeria
(1100), Malawi (1100), and Cameroon (1000). By
contrast, Ireland had an MMR of 1.
The adult lifetime risk of maternal death (the prob-
ability that a 15-year-old female will die eventually
from a maternal cause) is highest in Africa (at 1 in
26), followed by Oceania (1 in 62) and Asia (1 in
120), while the developed regions had the smallest
lifetime risk (1 in 7300). Of all 171 countries and ter-
ritories for which estimates were made, Niger had
the highest estimated lifetime risk of 1 in 7, in stark
contrast to Ireland, which had the lowest lifetime risk
of 1 in 48 000.
These estimates provide an up-to-date indication
of the extent of the maternal mortality problem
globally. They strongly indicate a need for both
improved action for maternal mortality reduction and
increased efforts for the generation of robust data to
provide better estimates in the future.

Maternal Mortality in 2005
2 The separate analysis of trends shows that, at the
global level, maternal mortality has decreased at an
average of less than 1% annually between 1990 and
2005 – far below the 5.5% annual decline, which
is necessary to achieve the fifth MDG, concerning
maternal mortality reduction. To achieve that goal,
MMRs will need to decrease at a much faster rate in
the future – especially in sub-Saharan Africa, where
the annual decline has so far been approximately
0.1%. Achieving this goal requires increased atten-
tion to improved health care for women, including
high-quality emergency obstetric care.

3
3
Maternal Mortality in 2005
1. INTRODUCTION
Since the late 1980s, improving maternal health and
reducing maternal mortality have been key concerns
of several international summits and conferences,
including the Millennium Summit in 2000 (1). One
of the eight Millennium Development Goals (MDG)
adopted following the Millennium Summit involves
improving maternal health (MDG5). Within the MDG
monitoring framework, the international community
committed itself to reducing the maternal mortality
ratio (MMR), and set a target of a decline of three
quarters between 1990 and 2015. Thus, the MMR is
a key indicator for monitoring progress towards the
achievement of MDG5.
Country estimates of maternal mortality are needed
to inform planning of sexual and reproductive health
programmes and to guide advocacy efforts and
research at the national level, particularly within
the context of the MDGs. These estimates are
also needed at the international level, to inform
decision-making concerning funding support for
the achievement of MDG5. To be useful for the
latter purpose, the country estimates must be
internationally comparable.
It has, however, been a challenge to assess the
extent of progress towards the MDG5 target,
due to the lack of reliable maternal mortality data
– particularly in developing-country settings where
maternal mortality is high (2). WHO, UNICEF, and
UNFPA have made three previous attempts to
develop internationally comparable global estimates
of maternal mortality (for the years 1990, 1995, and
2000) by using an approach that encompasses
different sources of data. However, the exact
methodology used by each exercise differed (2–4).
In 2006, a new maternal mortality working group
– which included WHO, UNICEF, UNFPA, The World
Bank, and the United Nations Population Division
(UNPD), as well as several outside technical experts
– was established to work on the new round of
estimates of maternal mortality for 2005. Initially,
the working group reviewed a set of suggested
improvements to the methodologies of previous
exercises that had been prepared as part of an
external review commissioned by WHO.
Responding to these suggestions and to questions
posed by countries following the 2000 round of
estimates, the working group revised and improved
the previous methods to estimate maternal mortality
in 2005. A new set of estimates was then developed,
and was based on the improved methodology and
new data. The working group also estimated trends
of maternal mortality, which had not been possible
previously due to the changes in data availability
and methodologies used in each previous exercise.
This document reports the global, regional, and
country estimates of maternal mortality in 2005,
and the findings of the separate assessments of
trends of maternal mortality levels since 1990. It
summarizes the challenges involved in measuring
maternal mortality and the main approaches to
measurement, and explains the development of
the 2005 maternal mortality estimates and the
interpretation of the results. The final section
discusses the use and limitations of the estimates,
with an emphasis on the importance of improved
data quality for maternal mortality estimation. The
appendices present data tables of country estimates
according to data source and different regional
groupings for WHO, UNICEF, UNFPA, The World
Bank, and UNPD.

Maternal Mortality in 2005
4 2.1 Concepts and definitions
In the International Statistical Classification of
Diseases and Related Health Problems, Tenth
Revision, 1992 (ICD-10), WHO defines maternal
death as:
A concept of pregnancy-related death included in
ICD-10 incorporates maternal deaths due to any
cause. According to this concept, any death during
pregnancy, childbirth, or the postpartum period is
defined as a “pregnancy-related death” even if it is
due to accidental or incidental causes (Box 1). This
alternative definition allows measurement of deaths
that are related to pregnancy, even though they do
not strictly conform with the standard “maternal
death” concept in settings where accurate infor-
mation about causes of deaths based on medical
certificates are unavailable. For instance, in maternal
mortality surveys (such as the sisterhood methods),
relatives of a reproductive-aged woman who has
died are asked about her pregnancy status at the
time of death without eliciting any further informa-
tion on cause of death. These surveys usually mea-
sure pregnancy-related deaths rather than maternal
deaths.
Complications of pregnancy or childbirth can also
lead to death beyond the six weeks postpartum
period. In addition, increasingly available modern
life-sustaining procedures and technologies enable
more women to survive adverse outcomes of preg-
nancy and delivery, and to delay death beyond 42
days postpartum. Despite being caused by preg-
nancy-related events, these deaths do not count
as maternal deaths in routine civil registration sys-
tems. An alternative concept of late maternal death
was included in ICD-10, in order to capture these
delayed deaths that occur between six weeks and
one year postpartum (Box 1). Some countries, par-
ticularly those with more developed vital registration
systems, use this definition.
2.2 Measures of maternal mortality
The number of maternal deaths in a population is
essentially the product of two factors: the risk of
mortality associated with a single pregnancy or a
single live birth, and the number of pregnancies or
births that are experienced by women of reproduc-
tive age. The MMR is defined as the number of
maternal deaths in a population divided by the num-
ber of live births; thus, it depicts the risk of maternal
death relative to the number of live births.
2. MEASURING MATERNAL MORTALITY
The death of a woman while pregnant or within 42 days of termination of pregnancy, irrespective of the duration and site of the pregnancy, from any cause related to or aggravated by the pregnancy or its management but not from accidental or incidental causes.
This definition allows identification of maternal deaths,
based on their causes as either direct or indirect.
Direct obstetric deaths are those resulting from
obstetric complications of the pregnant state (preg-
nancy, delivery, and postpartum), from interventions,
omissions, incorrect treatment, or from a chain of
events resulting from any of the above. Deaths due
to, for example, haemorrhage, pre-eclampsia/eclamp-
sia or those due to complications of anaesthesia or
caesarean section are classified as direct obstetric
deaths. Indirect obstetric deaths are those resulting
from previous existing disease, or diseases that devel-
oped during pregnancy, and which were not due to
direct obstetric causes but aggravated by physiologi-
cal effects of pregnancy. For example, deaths due to
aggravation of an existing cardiac or renal disease are
indirect obstetric deaths.
Accurate identification of the causes of maternal
deaths by differentiating the extent to which they are
due to direct or indirect obstetric causes, or due to
accidental or incidental events, is not always possible
– particularly in settings where deliveries occur mostly
at home, and/or where civil registration systems with
correct attribution of causes of death are inadequate.
In these instances, the standard ICD-10 definition of
maternal death may not be applicable (5).

5
5
Maternal Mortality in 2005
By contrast, the maternal mortality rate (MMRate) is
defined as the number of maternal deaths in a popu-
lation divided by the number of women of reproduc-
tive age; thus, it reflects not only the risk of maternal
death per pregnancy or per birth (live birth or still-
birth), but also the level of fertility in the population.
In addition to the MMR and the MMRate, it is pos-
sible to calculate the adult lifetime risk of maternal
mortality for women in the population (Box 2).
2.3 Approaches for measuring maternal mortality
Although widely-used standardized definitions of
maternal mortality exist, it is difficult to measure
accurately the levels of maternal mortality in a popu-
lation – for several reasons. First, it is challenging
to identify maternal deaths precisely – particularly
in settings where routine recording of deaths is not
complete within civil registration systems, and the
death of a woman of reproductive age might not
Box 1. Alternative definitions of maternal death in ICD-10
Pregnancy-related death The death of a woman while pregnant or within 42 days of termination of pregnancy, irrespective of the cause of death.
Late maternal death The death of a woman from direct or indirect obstetric causes, more than 42 days but less than one year after termination of pregnancy.
be recorded. Second, even if such a death were
recorded, the woman’s pregnancy status may not
have been known and the death would therefore not
have been reported as a maternal death even if the
woman had been pregnant. Third, in most develop-
ing-country settings where medical certification of
cause of death does not exist, accurate attribution
of female deaths as maternal death is difficult.
Even in developed countries where routine registra-
tion of deaths is in place, maternal deaths may be
underreported, and identification of the true num-
bers of maternal deaths may require additional spe-
cial investigations into the causes of deaths (6–10).
A specific example of such an investigation is the
Confidential Enquiry into Maternal Deaths (CEMD),
which was established in the United Kingdom in
1928 (11). The most recent report of CEMD (for
2000–2002) identified 44% more maternal deaths
than was reported in the routine civil registration
system (11). Other studies on the accuracy of the
Maternal mortality ratio Number of maternal deaths during a given time period per 100 000 livebirths during the same time-period.
Maternal mortality rate Number of maternal deaths in a given period per 100 000 women of reproductive age during the same time-period.
Adult lifetime risk of maternal death The probability of dying from a maternal cause during a woman’s repro-ductive lifespan.
Box 2. Statistical measures of maternal mortality

Maternal Mortality in 2005
6 number of maternal deaths reported in civil registra-
tion systems have shown that the true number of
maternal deaths could be up to almost 200% higher
than routine reports (9).
In the absence of complete and accurate civil regis-
tration systems, MMR estimates are based upon a
variety of methods – including household surveys,
sisterhood methods, reproductive-age mortality
studies (RAMOS), verbal autopsies, and censuses.
Each of these methods has limitations in estimating
the true levels of maternal mortality. Brief descrip-
tions of the methods together with their limitations
are shown in Box 3.
Civil registration systems This approach involves routine registration of births and deaths. Ideally, maternal mortality statistics should be obtained through civil registration data. However, even where coverage is complete and the causes of all deaths are identified based on standard medical certificates, in the absence of active case-finding, maternal deaths may be missed or misclassified; and therefore confidential enquiries are used to identify the extent of misclassification
and underreporting (11).
Household surveys Where civil registration data are not available, household surveys provide an alternative. Limitations of household surveys include the following:
the survey identifies pregnancy-related deaths (not maternal deaths); because maternal deaths are rare events in epidemiological terms, surveys to measure their levels require large sample sizes to provide statistically reliable estimates and therefore they are expensive; even with large sample sizes, the obtained estimates are still subject to uncertainty (wide confidence intervals), making it difficult to monitor changes over time.
Sisterhood methods (12,13) Sisterhood methods obtain information by interviewing a representative sample of respondents about the survival of all their adult sisters (to deter-mine the number of ever-married sisters, how many are alive, how many are dead, and how many died during pregnancy, delivery, or within six weeks of pregnancy). This approach reduces the sample size, but: it identifies pregnancy-related deaths, rather than maternal deaths; the problem of wide confidence intervals remains, thereby precluding trend analysis; the originally developed version (indirect sisterhood method) is not appropriate for use in settings where fertility levels are low (i.e. total fertility rate <4) or where there has been substantial migration or other causes of social dislocation; it provides a retrospective rather than a current maternal mortality estimate (over 10 years prior to the survey);
Box 3. Approaches to measuring maternal mortality

7
7
Maternal Mortality in 2005
Box 3. continued
Continued
Sisterhood methods (12, 13)
the Demographic and Health Surveys (DHS) use a variant of the sisterhood approach (direct sisterhood method) – this approach relies on fewer assumptions than the original method and collects more information than the indirect method (i.e. the age of all siblings, age at death and year of death of those dead, in addition to the information obtained by the indirect method), but requires larger sample sizes and the analysis is more complicated; the estimates refer to a period approximately five years prior to the survey; and as in the indirect method, the problem of wide confidence intervals remains (hence, the monitoring of trends is limited) and this approach also provides information concerning pregnancy-related deaths rather than maternal deaths.
Reproductive-age mortality
studies (RAMOS) (12–14)
This approach involves identifying and investigating the causes of all deaths of women of reproductive age in a defined area/population by using multiple sources of data (e.g. interviews of family members, vital registrations, health facility records, burial records, traditional birth attendants) and has the following characteristics. Multiple and varied sources of information must be used to identify deaths of women of reproductive age; no single source identifies all the deaths. Inadequate identification of all deaths of reproductive-aged women results in underestimation of maternal mortality levels. Interviews with household members and health-care providers and reviews of facility records are used to classify the deaths as maternal or otherwise. If properly conducted, this approach provides a fairly complete estimation of maternal mortality (in the absence of reliable routine registration systems) and could provide subnational MMRs. This approach can be complicated, time-consuming, and expensive to undertake – particularly on a large scale. The number of live births used in the computation may not be accurate, especially in settings where most women deliver at home.
Verbal autopsy (2,15,16) This approach is used to assign cause of death through interviews with family or community members, where medical certification of cause of death is not available. Records of births and deaths are collected periodically among small populations (typically in a district) under demographic surveillance systems maintained by research institutions in developing countries. The following limita-tions characterize this approach.
Misclassification of causes of reproductive-aged female deaths with this technique is not uncommon.This approach may fail to identify correctly a group of maternal deaths, particularly those occurring early in pregnancy (e.g. ectopic, abortion-related) and indirect causes of maternal death (e.g. malaria).The accuracy of the estimates depends on the extent of family members’ knowledge of the events leading to the death, the skill of the interviewers, and the competence of physicians who do the diagnosis and coding.Demographic surveillance systems are expensive to maintain, and the findings cannot be extrapolated to obtain national MMRs.
continued on next page

Maternal Mortality in 2005
8
Census (17) A national census, with the addition of a limited number of questions, could produce estimates of maternal mortality; this approach eliminates sampling errors (because all women are covered) and hence allows trend analysis.
This approach allows identification of deaths in the household in a relatively short reference period (1–2 years), thereby providing recent maternal mortality estimates, but is conducted at 10-year intervals and therefore limits monitoring of maternal mortality. The training of enumerators is crucial, since census activities collect information on a range of other topics which are unrelated to maternal deaths.Results must be adjusted for such characteristics as completeness of death and birth statistics and population structures, in order to arrive at reliable estimates.
Box 3. continued

9
9
Maternal Mortality in 2005
The most recent data on maternal mortality and
other relevant variables were obtained through data-
bases maintained by WHO, UNPD, UNICEF, and The
World Bank (18–21). National estimates of the num-
ber of births in 2005 were obtained from the UNPD
database (21). A total of 171 countries and territories
3. THE DEVELOPMENT OF 2005 ESTIMATES OF MATERNAL MORTALITY
were covered in this exercise; countries and territo-
ries with populations under 250 000 were excluded.
Data available from countries varied in terms of
the source and methods. Countries were classified
into eight groups, based on the source and type of
maternal mortality data (Table 1).
Table 1. Sources of maternal mortality data used in developing the 2005 estimates
Group Source of maternal mortality data Number of countries/territories
% of countries/ territories in
each category
% of global births covered
A Civil registration characterized as complete, with good attribution of cause of death
59 35 13.1
B Civil registration characterized as complete, with uncertain or poor attribution of cause of death
6 4 1.0
C Direct sisterhood estimates 28 16 15.7
D RAMOS 4 2 5.5
E Disease surveillance or sample registration 2 1 32.4
F Census 5 3 2.2
G Special studies 6 4 5.4
H No national data on maternal mortality 61 36 24.5
Total 171 100 99.8
Group A. Countries with generally complete civil reg-istration system (with at least 90% of deaths estimated to be registered) and good attribution of cause of death (less than 20% of deaths lack accurate cause-identifi-
cation) (22).
Group B. Countries with generally complete civil reg-istration system (with at least 90% of deaths estimated to be registered) but uncertain attribution of cause of death (between 20% and 30% of deaths lack accurate
cause-identification) (22).
Group C. Countries that lack complete registration of deaths, but have estimates based on direct sisterhood methods.Group D. Countries with estimates based on RAMOS.
Group E. Countries with estimates from sample regis-tration and disease surveillance systems.
Group F. Countries with estimates from census.
Group G. Countries with estimates from special mater-nal mortality studies.
Group H. Countries with no appropriate maternal mor-tality data for the period 1995–2005.
Of the total of 171 countries/territories, Group A had the highest number of countries/territories (at 59) while Group E had the lowest (at 2). Group E consisted of only two countries (China and India), but accounted for 32% of global births (since both countries have popula-tions of more than 1 billion).
3.1 Sources of country data used for the 2005 estimates

Maternal Mortality in 2005
10 3.2 Methods used to estimate MMR in 2005 according to data source
Given the variability of the sources of data, different
methods were used for each of the eight groups in order
to arrive at country estimates that are comparable and
permit regional and global aggregation. Therefore, the
estimation process described below resulted in the
WHO/UNICEF/UNFPA/World Bank country estimates
of maternal mortality in 2005 being different from
nationally reported estimates. A detailed description
of the methodology is reported in a forthcoming
publication (23).
Group A – complete civil registration and good
attribution of cause of death
The MMRs for countries in this group were com-
puted by dividing the average number of maternal
deaths for the three most recent years available (or
six most recent for countries with population size
below 500 000) (19) by the estimates of the number
of births in 2005 developed by UNPD (21). Literature
that assesses the completeness of maternal deaths
in countries with complete civil registration systems
has shown that the number of deaths related to
pregnancy might increase up to almost 200% of the
reported numbers with active surveillance (6–10).
Therefore, the calculated estimates were used both
as the lower country-specific uncertainty limit and
as the point estimate. The upper limit of uncertainty
was obtained by multiplying the calculated MMR
by two, in order to account for such underreporting.
The 2005 maternal mortality estimates for countries
in this group are shown in Appendix 1.
Group B – complete civil registration but uncertain
attribution of cause of death
For this group of countries, additional analysis of
civil registration data indicated that the poor ascer-
tainment of causes of deaths was mainly due to the
widespread use of mistaken codes for causes from
the ICD-10 codes (5). In order to estimate maternal
mortality for these countries, reproductive-aged
female deaths attributed to ill-defined causes were
proportionately redistributed among known causes
of female deaths. The adjusted estimates of the
number of maternal deaths averaged over the three
most recent years available and UNPD estimates of
the number of births in 2005 were used to compute
the lower limits of uncertainty of MMR. To account
for the additional uncertainty, the computed lower
limit of uncertainty of MMR was multiplied by two, in
order to obtain the upper limit. The midpoint of the
two (lower and upper) uncertainty limits was taken
as the point estimate for the 2005 MMR. The 2005
maternal mortality estimates for countries in this
group are shown in Appendix 2.
Group C – direct sisterhood methods
This group consists of countries for which direct sis-
terhood estimates (from DHS) are the best available
sources of maternal mortality, since these countries
lack complete registration of deaths. In computing
the MMR for this group, the direct sisterhood esti-
mates were not used as our best estimates, because
sisterhood studies systematically underestimate the
true levels of mortality (12,24). This disparity is illus-
trated in Figure 1, which compares the 2005 WHO
estimates of the female probability of dying between
ages 15 and 50 years (19) with the corresponding
sisterhood estimates for all countries in group C.
This evidence suggests the need for upward adjust-
ing of the sisterhood data.
Previous studies have shown that the direct sister-
hood method may lead to biased estimates of levels
of maternal mortality, but not necessarily to biased
values of the proportion maternal among deaths
of females of reproductive age (PMDF) (24). For
each country in this group, therefore, the sisterhood
estimate of the PMDF was used to derive the 2005
MMR (25). The calculated PMDF was adjusted by
the age distribution of women in the sample popula-
tion of the respective countries.
It is known that PMDF is sensitive not only to mater-
nal mortality, but to all other causes as well. Thus,
the obtained values will likely be lower than the true
values when there are increases in adult mortal-
ity due to conflicts and epidemics. To account for
the likely inflation of overall female deaths due to

11
11
Maternal Mortality in 2005
AIDS, the age-standardized PMDFs were adjusted
to reflect the proportion of maternal deaths among
non-AIDS deaths. The age-standardized HIV-
adjusted PMDF was then applied to the 2005 WHO
estimate of number of non-AIDS reproductive-aged
female deaths (19), to obtain the total number of
maternal deaths in 2005. The latter was divided by
the 2005 UNPD estimates of the number of births
to obtain the 2005 MMR. As was done for the 2000
exercise, lower and upper uncertainty limits were
calculated from a model relating published standard
errors on seven-year sisterhood estimates to the
square root of the number of sister-years of obser-
vation (24). The 2005 maternal mortality estimates
for countries in this group are shown in Appendix 3.
0
100
200
300
400
500
600
700
0 100 200 300 400 500 600 700
DHS
45q1
5 (p
er 1
,000
)
Group D – RAMOS
This group comprises countries (Brazil, Egypt,
Jordan, and Turkey) that have conducted national
RAMOS studies (or have conducted RAMOS stud-
ies in selected regions of a country that have
been nationally adjusted). The reported MMR was
accepted as the lower limit of uncertainty, while the
upper limit of uncertainty was the RAMOS estimate
multiplied by two. The midpoint of the uncertainty
limits was taken as the point estimate of MMR. The
2005 maternal mortality estimates for countries in
group D are shown in Appendix 4.
Group E – disease surveillance or sample
registration
The two countries in this group had data from a
disease surveillance system (China) or a sample
registration system (India), with limited evidence
of the completeness of the coverage of maternal
deaths. It was assumed that these estimates had
the same biases as countries with complete records
of deaths but with weak ascertainment of cause
of death (group B countries). As with the RAMOS
estimates, the reported MMR was accepted as the
lower uncertainty limit, twice the observed value
was taken as the upper uncertainty limit, and the
Legend:
35q15 is the female probability of dying between ages 15 and 50
Female adult mortality estimates
The diagonal line sloping downwards from the right represents the line of equality on which all points will lie if estimates from both
sources are the same.
35(p
er 1
000)
0
100
200
300
400
500
600
700
0 100 200 300 400 500 600 700
DH
S 3
5q15
(per
100
0)
WHO 35q15 (per 1000)
Figure 1. Comparison of DHS sisterhood estimates and WHO estimates of female adult mortality

Maternal Mortality in 2005
12 midpoint of the uncertainty range was taken as
the point estimate. The 2005 maternal mortality
estimates for countries in group E are shown in
Appendix 4.
Group F – census
For countries (Honduras, the Islamic Republic of
Iran, Nicaragua, Paraguay, and South Africa) with
census estimates, the reported PMDF was applied
to the WHO estimates of reproductive-aged female
deaths for the respective year to obtain the total
number of maternal deaths. The estimated number
of maternal deaths was divided by the 2005 WHO
estimate of non-AIDS reproductive-aged female
deaths to obtain the non-HIV/AIDS PMDF. The
latter was then multiplied by the 2005 WHO esti-
mate of non-HIV reproductive-aged female deaths
to obtain the total maternal deaths for 2005. The
2005 MMR lower limit of uncertainty was the total
number of maternal deaths divided by the 2005
UNPD estimates of the number of births. The upper
limit of uncertainty was twice the estimate for the
lower limit, and the 2005 MMR was the midpoint of
the uncertainty limits. The 2005 maternal mortal-
ity estimates for countries in group F are shown in
Appendix 4.
Group G – special studies
This group comprises countries (Bangladesh,
Malaysia, Myanmar, Saudi Arabia, Sri Lanka, and
Thailand) that have conducted special studies on
maternal mortality, but these studies do not fit into
any of the groups noted earlier. The estimates from
these studies were taken as the lower limit of uncer-
tainty. The upper limit of uncertainty was twice the
estimate for the lower limit, and the 2005 MMR was
the midpoint of the uncertainty limits. The 2005
maternal mortality estimates for countries in group G
are shown in Appendix 4.
Group H – no appropriate national maternal
mortality data
This group of countries consists of those where
available national estimates are not produced
according to established methodologies that are
comparable with other data sources within the
global maternal mortality database, or those where
no reliable nationally representative estimates exists.
A four-stage procedure was employed to predict the
MMR for countries in this group in the absence of
empirical data.
1. A statistical model was developed based on data
from countries with reliable data concerning the
variables described below.
2. The model was then used to estimate the PMDF
for each country in the group.
3. The estimated PMDF was applied to the 2005
WHO figures for non-HIV/AIDS reproductive-aged
female deaths, to obtain the estimated total num-
ber of maternal deaths.
4. The number of maternal deaths divided by the
2005 UNPD estimates of the number of live births
gave the point estimate for MMR in 2005. The
uncertainty limits were derived from model esti-
mates of the standard error of the forecast. The
2005 maternal mortality estimates for countries in
this group are shown in Appendix 5.
The statistical model
The statistical model aimed to obtain out-of-sample
PMDF predictions by relating the compiled PMDF
from countries with reliable data to socioeconomic
and programmatic variables for the appropriate time
period. A range of variables shown to be related to
maternal deaths was identified as possible predic-
tors (26–32) (see Annex 1). The logit functional form
of the PMDF was used as the dependent variable to
account for the fact that values for this proportion
fall between zero and one. Country estimates for
these potential predictors were obtained from vari-
ous published sources (18,20). Where variables for
2005 were not available, the most recent estimate
for the period 2000–2005 was used. Multiple impu-
tations were employed to predict the missing values
for each variable (Annex 1).

13
13
Maternal Mortality in 2005
Next, the correlation patterns among the variables
were examined (Annex 2). Indicators that were highly
correlated (such as proportion of births with skilled
attendants (SKA) and institutional delivery) were not
used in the same model. The results of bivariate
regression analysis (between country observations
of PMDF and each predictor) and the correlation
matrix guided the selection of independent variables
for the model. The independent variables used in
the final model were SKA; gross domestic product
per capita, based on purchasing power parity con-
version (GDP); general fertility rate (GFR); dummy
variable for the completeness of registration of adult
deaths (VRcomplete); and regional dummy variables.
Box 5. Formula for estimating adult lifetime risk
Box 4. PMDF statistical model for countries with no appropriate estimates of maternal mortality
PMDF = proportion maternal among deaths of females of reproductive age
GDP = gross domestic product per capita based on purchasing power parity conversion
GFR = general fertility rate (births per 1000 women aged 15–49)
SKA = proportion of births with skilled attendants
EUR = dummy variable identifying observations from Europe
MENA = dummy variable identifying observations from North Africa and the Middle East
WP = dummy variable identifying observations from Western Pacific
VRcomplete = dummy variable equal to 1 if registration of deaths is 90% or more complete
This final model was fitted to a sample of 71 non-OECD (Organisation for Economic Co-operation and Development) coun-
tries using robust regressions with Huber and biweight iterations.
Adult lifetime risk of maternal mortality =T15 – T50
l15
× MMRate
where l15 , T15 and T50 are quantities from a life table for the female population during the period in
question ( l15 equals the probability of survival from birth until age 15, and (T15 – T50) /l15 equals the
average number of years lived between ages 15 and 50 – up to a maximum of 35 years – among
survivors to age 15).
3.3 Calculation of adult lifetime risk of maternal mortality
In countries where there is a high risk of maternal
death, mortality risk among children is also high.
Therefore, estimates of the adult lifetime risk of
maternal mortality (which equals the probability
that a 15-year-old female will die eventually from a
maternal cause) was calculated. These assumed
current levels of fertility and mortality (including
maternal mortality) do not change in the future.
The adult lifetime risk of maternal mortality can be
derived using either the MMR or maternal mortality
rate (MMRate). However, a precise estimate of
Maternal Mortality in 2005
14 lifetime risk requires knowledge of how the MMR
or the MMRate changes within the reproductive
lifespan of women. Since such information is not
generally available, it can be assumed that neither
the MMR nor the MMRate is constant over the
reproductive lifespan. Because this assumption is
much closer to reality for the MMRate than for the
MMR, the adult lifetime risk was calculated using
the MMRate as shown in Box 5. This formula yields
an estimate of the adult lifetime risk that takes into
account competing causes of death. The 2005
country estimates of lifetime risk of maternal mor-
tality are shown in Annex 3, while the regional esti-
mates are presented in Table 2 and in Appendices 6,
8, 10, 12, and 14.
3.4 Global and regional estimates
Global and regional maternal mortality aggregates
(according to the MDG, WHO, UNICEF, UNFPA, The
World Bank and UNPD regional groupings) were also
estimated. The MMR in a given region was com-
puted as the number of maternal deaths divided by
the number of live births in the region. Additionally,
the adult lifetime risk of maternal mortality was
based on the weighted average of (T15 – T50 )/l15
in a given region multiplied by the MMRate of the
region.
3.5 Differences between the 2005 methodology compared with 2000
There were some differences in the methods used
for the 2005 maternal mortality estimates compared
to those for 2000 (2).
For the 2005 estimates, countries were grouped
into eight instead of six groups in the 2000 esti-
mates. In 2005, Group E in the 2000 estimates
was divided into Groups E (sample registration/
disease surveillance systems), F (census), and G
(special studies), plus Group H for countries with
no reliable estimates.
Slightly different variables were included in the
2000 and 2005 models. In the 2005 model, there
were three dummy variables identifying countries
of three regions (Europe, North Africa and the
Middle East, and West Pacific) while in the 2000
model, there was only one dummy variable (com-
bining countries of Latin America, sub-Saharan
Africa, and the Middle East/North Africa).
In the 2005 model, missing values for predictor
variables were replaced using multiple imputation
methods.
The definition and approach for estimating the
2005 lifetime risk of maternal death are in sharp
contrast to those for 2000. The lifetime risk
of maternal death for the 2005 estimates was
defined as the probability of maternal death during
a woman’s reproductive period (15–50 years), tak-
ing into account other causes of death in women
of reproductive age. On the other hand, the 2000
lifetime risk was defined as 1.2 times the prob-
ability of a newborn female experiencing maternal
death, assuming she is not at risk of death from
other causes. The factor 1.2 in the latter defini-
tion was to account for non-live births but this
appeared to be unnecessary since only live births
are appropriate for the consideration of lifetime
risk. Additionally, the 2000 lifetime risk definition
ignores other causes of female deaths during the
reproductive period. Thus, the lifetime risk esti-
mates in 2000 are higher than the 2005 estimates.
However, both estimates assume that the current
rates of fertility and mortality will remain the same
throughout the lifetime of the woman and that the
risk of maternal death is independent of parity.

15
15
Maternal Mortality in 2005
4.1 Maternal mortality estimates for 2005
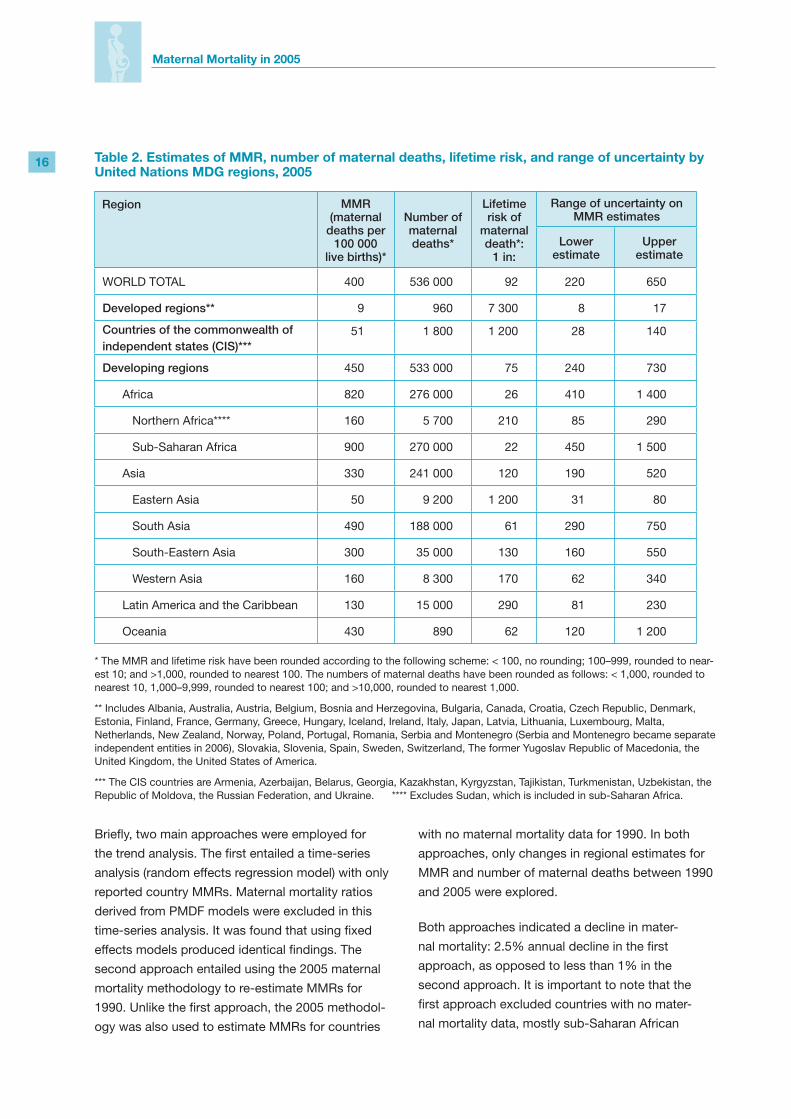
Table 2 and Annex 3 present the estimates of MMR,
the range of uncertainty of MMR estimates, the
number of maternal deaths, and the lifetime risk by
region (MDG regional groupings) or by country. The
range of uncertainty suggests that although a point
estimate is presented, the true MMR could be some-
where between the lower- and upper uncertainty
limits shown in the graphics. Therefore, individual
country estimates should not be used for cross-
country comparisons.
Of the estimated total of 536 000 maternal deaths
worldwide, developing countries accounted for 99%
(533 000) of the deaths (Table 2). Slightly more than
half of the maternal deaths (270 000) occurred in the
sub-Saharan Africa region alone, followed by South
Asia (188 000). Thus, sub-Saharan Africa and South
Asia accounted for 86% of global maternal deaths.
By the broad MDG regions, the MMR in 2005 was
highest in developing regions (450), in stark contrast
to developed regions (9) and countries of the com-
monwealth of independent states (51). Among the
developing regions, sub-Saharan Africa had the
highest MMR at 900 maternal deaths per 100 000
live births in 2005, followed by South Asia (490),
Oceania (430), South-Eastern Asia (300), Western
Asia (160), Northern Africa (160), Latin America and
the Caribbean (130), and Eastern Asia (50).
By country (Annex 3), India had the largest number
of maternal deaths (117 000), followed by Nigeria
(59 000), the Democratic Republic of the Congo
(32 000), Afghanistan (26 000), Ethiopia (22 000)
Bangladesh (21 000), Indonesia (19 000), Pakistan
(15 000), Niger (14 000), the United Republic of
Tanzania (13 000), and Angola (11 000). These 11
countries comprised 65% of the global maternal
deaths in 2005.
A total of 14 countries had MMRs of at least 1000,
of which 13 (excluding Afghanistan) were in the sub-
Saharan African region (Annex 3). These countries
in descending order are: Sierra Leone (2100), Niger
(1800), Afghanistan (1800), Chad (1500), Somalia
(1400), Angola (1400), Rwanda (1300), Liberia
(1200), Guinea Bissau (1100), Burundi (1100), the
Democratic Republic of the Congo (1100), Nigeria
(1100), Malawi (1100), and Cameroon (1000). By
contrast, the MMR in Ireland was 1.
The adult lifetime risk of maternal death (the prob-
ability that a 15-year-old female will die eventually
from a maternal cause) is highest in Africa (at 1 in
26), followed by Oceania (1 in 62) and Asia (1 in
120), while the developed regions had the smallest
lifetime risk (1 in 7300). Of all 171 countries and ter-
ritories for which estimates were made, Niger had
the highest estimated lifetime risk of 1 in 7, in stark
contrast to Ireland, which had the lowest lifetime risk
of 1 in 48 000.
Appendices 6, 8, 10, 12, and 14 present the MMR,
number of maternal deaths, adult lifetime risk, and
range of uncertainty for WHO, UNICEF, UNFPA, The
World Bank, and UNPD regions, respectively.
Although the methods for the 2000 and 2005 esti-
mates were not the same – and estimates should
not therefore be compared for assessing time trends
for individual countries – large disparities appeared
in the estimates for 11 countries in the new round of
estimates. Methodological reasons for these large
differences have been provided in Annex 4.
4.2 Estimates of MMR trends
The 2005 maternal mortality estimates are not com-
parable to the previous estimates for 1990, 1995,
and 2000, because of the differences in the methods
that were used in each of the exercises (2–4). The
2000 report of MMR estimates strongly cautioned
against comparing time trends by using the findings
of each estimation exercise. This applies to the 2005
estimates as well.
In developing the 2005 estimates, however, attempts
were made to analyse changes in global and
regional maternal mortality to provide information
concerning progress towards achieving the MDG5
target. The methodological details of the trend anal-
ysis are described in a forthcoming publication (23).
4. ANALYSIS AND INTERPRETATION OF 2005 ESTIMATES
Maternal Mortality in 2005
16
Region MMR(maternal
deaths per 100 000
live births)*
Number of maternal deaths*
Lifetimerisk of
maternal death*:
1 in:
Range of uncertainty on MMR estimates
Lowerestimate
Upperestimate
WORLD TOTAL 400 536 000 92 220 650
Developed regions** 9 960 7 300 8 17
Countries of the commonwealth of independent states (CIS)***
51 1 800 1 200 28 140
Developing regions 450 533 000 75 240 730
Africa 820 276 000 26 410 1 400
Northern Africa**** 160 5 700 210 85 290
Sub-Saharan Africa 900 270 000 22 450 1 500
Asia 330 241 000 120 190 520
Eastern Asia 50 9 200 1 200 31 80
South Asia 490 188 000 61 290 750
South-Eastern Asia 300 35 000 130 160 550
Western Asia 160 8 300 170 62 340
Latin America and the Caribbean 130 15 000 290 81 230
Oceania 430 890 62 120 1 200
Table 2. Estimates of MMR, number of maternal deaths, lifetime risk, and range of uncertainty by United Nations MDG regions, 2005
* The MMR and lifetime risk have been rounded according to the following scheme: < 100, no rounding; 100–999, rounded to near-est 10; and >1,000, rounded to nearest 100. The numbers of maternal deaths have been rounded as follows: < 1,000, rounded to nearest 10, 1,000–9,999, rounded to nearest 100; and >10,000, rounded to nearest 1,000.
** Includes Albania, Australia, Austria, Belgium, Bosnia and Herzegovina, Bulgaria, Canada, Croatia, Czech Republic, Denmark, Estonia, Finland, France, Germany, Greece, Hungary, Iceland, Ireland, Italy, Japan, Latvia, Lithuania, Luxembourg, Malta, Netherlands, New Zealand, Norway, Poland, Portugal, Romania, Serbia and Montenegro (Serbia and Montenegro became separate independent entities in 2006), Slovakia, Slovenia, Spain, Sweden, Switzerland, The former Yugoslav Republic of Macedonia, the United Kingdom, the United States of America.
*** The CIS countries are Armenia, Azerbaijan, Belarus, Georgia, Kazakhstan, Kyrgyzstan, Tajikistan, Turkmenistan, Uzbekistan, the Republic of Moldova, the Russian Federation, and Ukraine. **** Excludes Sudan, which is included in sub-Saharan Africa.
Briefly, two main approaches were employed for
the trend analysis. The first entailed a time-series
analysis (random effects regression model) with only
reported country MMRs. Maternal mortality ratios
derived from PMDF models were excluded in this
time-series analysis. It was found that using fixed
effects models produced identical findings. The
second approach entailed using the 2005 maternal
mortality methodology to re-estimate MMRs for
1990. Unlike the first approach, the 2005 methodol-
ogy was also used to estimate MMRs for countries
with no maternal mortality data for 1990. In both
approaches, only changes in regional estimates for
MMR and number of maternal deaths between 1990
and 2005 were explored.
Both approaches indicated a decline in mater-
nal mortality: 2.5% annual decline in the first
approach, as opposed to less than 1% in the
second approach. It is important to note that the
first approach excluded countries with no mater-
nal mortality data, mostly sub-Saharan African

17
17
Maternal Mortality in 2005
Table 3. Comparison of 1990 and 2005 maternal mortality by United Nations MDG regions
Region1990* 2005*
% changein MMR between1990 and
2005
Annual % changein MMR between1990 and
2005
MMR Maternal deaths
MMR Maternal deaths
WORLD TOTAL 430 576 000 400 536 000 -5.4 -0.4
Developed regions** 11 1 300 9 960 -23.6 -1.8
Countries of the commonwealth of independent states (CIS)***
58 2 800 51 1 800 -12.5 -0.9
Developing regions 480 572 000 450 533 000 -6.6 -0.5
Africa 830 221 000 820 276 000 -0.6 0.0
Northern Africa**** 250 8 900 160 5 700 -36.3 -3.0
Sub-Saharan Africa 920 212 000 900 270 000 -1.8 -0.1
Asia 410 329 000 330 241 000 -19.7 -1.5
Eastern Asia 95 24 000 50 9 200 -47.1 -4.2
South Asia 620 241 000 490 188 000 -21.1 -1.6
South-Eastern Asia 450 56 000 300 35 000 -32.8 -2.6
Western Asia 190 8 500 160 8 300 -16.2 -1.2
Latin America and the Caribbean 180 21 000 130 15 000 -26.3 -2.0
Oceania 550 1 000 430 890 -22.2 -1.7
* The 1990 estimates have been revised using the same methodology used for 2005, which makes them comparable. The MMRs have been rounded according to the following scheme: < 100, no rounding; 100–999, rounded to nearest 10; and >1,000, rounded to nearest 100. The numbers of maternal deaths have been rounded as follows: < 1,000, rounded to nearest 10, 1,000–9,999, rounded to nearest 100; and >10,000, rounded to nearest 1,000. ** Includes Albania, Australia, Austria, Belgium, Bosnia and Herzegovina, Bulgaria, Canada, Croatia, Czech Republic, Denmark, Estonia, Finland, France, Germany, Greece, Hungary, Iceland, Ireland, Italy, Japan, Latvia, Lithuania, Luxembourg, Malta, Netherlands, New Zealand, Norway, Poland, Portugal, Romania, Serbia and Montenegro (Serbia and Montenegro became separate independent entities in 2006), Slovakia, Slovenia, Spain, Sweden, Switzerland, The former Yugoslav Republic of Macedonia, United Kingdom, United States of America.*** The CIS countries are Armenia, Azerbaijan, Belarus, Georgia, Kazakhstan, Kyrgyzstan, Tajikistan, Turkmenistan, Uzbekistan, the Republic of Moldova, the Russian Federation, and Ukraine. **** Excludes Sudan, which is included in sub-Saharan Africa.
countries. Table 3 presents the global and regional
maternal mortality estimates for 1990 (revised with
2005 methodology) and 2005 (similar tables for
the different regional groupings for WHO, UNICEF,
UNFPA, The World Bank, and UNPD are shown in
Appendices 7, 9, 11, 13, and 15).
Additionally, the global and regional percentage
change in MMR between 1990 and 2005, as well
as the annual percentage change in MMR (based
on the second approach), are also shown in Table
3. Worldwide, there was a 5.4% decline in MMR
between 1990 and 2005. Eastern Asia had the
largest decline of 47.1%, as opposed to 1.8% in
sub-Saharan Africa. Unlike the other MDG regions,
sub-Saharan Africa experienced an increase in the
number of maternal deaths (from 212 000 in 1990 to
270 000 in 2005) with a concomitant increase in the
number of live births (from 23 million in 1990 to 30
million in 2005) resulting in the negligible change in
MMR from 1990 to 2005.

Maternal Mortality in 2005
18 The fifth MDG aims to improve maternal health and
targets reducing MMR by 75% between 1990 and
2015 – that is, it seeks to achieve an expected 5.5%
annual decline in MMR from 1990. However, as
shown in Table 3, maternal mortality (as measured
by MMR) has decreased at the global level at an
average of less than 1% annually between 1990 and
2005 (using the second approach described earlier).
Moreover, on the regional basis, none of the MDG
regions achieved 5.5% between 1990 and 2005,
although Eastern Asia came close to that goal with a
4.2% annual decline.
To make the achievement of the fifth MDG a reality,
MMR will have to decrease at a much faster rate
– especially in sub-Saharan Africa, where the annual
decline has so far been about 0.1%. The realiza-
tion of this goal will require increased attention to
improved health care for women, including preven-
tion of unplanned pregnancies and unsafe abortions
and provision of high-quality pregnancy and delivery
care, including emergency obstetric care (33).
Data on the second indicator identified for moni-
toring progress towards achievement of maternal
mortality reduction – that is, the proportion of births
attended by skilled health personnel (doctor, mid-
wife, or nurse) (1) – indicate that the receipt of such
care is limited where maternal deaths also constitute
a major problem. In Africa, less than 50% of births
are attended by a skilled health worker, accord-
ing to most recent available data (34) – despite an
increase from 43% to 57% between 1990 and 2005
in all developing regions, as indicated by the 2007
Millennium Development Goals Report (35). These
figures are far lower than the global target for this
indicator, which was set at a special session of the
United Nations in 1999. This global target aims
to assure that at least 90% of births worldwide be
attended by skilled health personnel by 2015 (36).
The figures for both indicators identified for measuring
maternal mortality suggest that much needs to be
done to accelerate progress towards the achievement
of MDG5.
5. IS THE FIFTH MDG ACHIEVABLE?

19
19
Maternal Mortality in 2005
6. NEXT STEPS
6.1 Using the 2005 maternal mortality estimates
The estimates of maternal mortality for 2005 pro-
vided in this report are the fourth in a series of
attempts which have sought to examine the likely
global dimensions of the problem of maternal mor-
tality. Several issues should be considered in using
these estimates.
First, it should be noted that these findings represent
an update of existing information with recent data
and methodologies, which have improved since the
development of the previous estimates. Therefore
and as mentioned above, the figures should not be
compared with those from the previous exercises to
assess changes in time.
Second, depending on the type of the data source
used, primary data for individual countries had to be
adjusted for specific characteristics. These charac-
teristics included the extent of potential underreport-
ing of maternal deaths (which is an issue even in
highly developed civil registration systems) to obtain
MMR estimates that are comparable across study
designs. Such adjustment allows the calculation of
regional and global aggregates. For this reason, the
presented point estimates are usually different from
the country-reported figures. Accordingly, country-
reported figures are included in the appendices,
together with the findings of this exercise.
Third, because of the reasons mentioned within the
sections describing the development of the esti-
mates, the calculated point estimates are subject
to high levels of uncertainty and not intended to
serve as precise estimates. Each point estimate is
presented with estimated lower and upper margins.
Therefore, the point estimates must be interpreted
together with these margins, because the true value
of MMR is likely to lie between them. It should also
be noted that the estimated uncertainty margins
are not confidence intervals in the epidemiological
and statistical sense. Because these margins are
extremely wide, one must be wary of interpreting
small numerical differences in countries as repre-
senting real differences in maternal mortality.
However, the estimates are indicative of the extent
of the maternal mortality problem, and should draw
attention to the need for both improved action for
maternal mortality reduction and increased efforts
for the generation of robust data for estimating
maternal mortality levels.
6.2 Generating better information for esti-mating maternal mortality
The methodological steps described above, which
are used to obtain global maternal mortality esti-
mates, highlight once again the complexities of
generating robust data on maternal mortality. The
variety of methods used in different settings, and
the necessity for reconciling them within one global
database, present conceptual and methodological
challenges. These challenges must be overcome, in
order to enable a better understanding of the prog-
ress in achieving MDG5.
The 2005 estimates did not require any adjustment
for countries with generally complete civil registra-
tion systems and good attribution of cause of death
(Group A). However, only one third of all countries/
territories fell into this group. For another third of
countries/territories, country-reported estimates of
maternal mortality had to be adjusted for the pur-
poses of comparability of the methodologies. For
the final third of countries/territories, a statistical
model was employed to predict maternal mortality
levels. Despite being based on established demo-
graphic techniques and empirical data from other
countries, there is no guarantee that the country-
specific point estimates obtained through the sta-
tistical model represent the true levels of maternal
mortality. The wide lower and upper margins around
the estimated figures reflect such uncertainty.
The ability to generate country, regional, and global
estimates with higher precision and accuracy would
be greatly facilitated if country civil registration
systems were further improved. This improvement
would obviate the need to conduct special mater-
nal mortality studies (which are time-consuming,
expensive, and of limited use in monitoring trends)

Maternal Mortality in 2005
20 or to employ statistical models (that have their own
weaknesses). Indeed, countries such as Sweden,
the Netherlands, England and Wales, and the USA,
which have documented reduction in maternal mor-
tality over several decades, have relied mainly on
adequate civil registration systems (37,38).

21
21
Maternal Mortality in 2005
ANNEXES
Annex 1. List of socioeconomic and programmatic indicators with percentage of missing values
Indicator (acronym or abbreviation, see Annex 2) % missing
GDP purchasing power parity per capita (GDP) 13
Health expenditure per capita (Health exp) 3
Institutional delivery (Inst delivery) 33
Female labour force participation (FLP) 3
Antenatal care quintile 1 (ANC-Q1) 65
Antenatal care quintile 5 (ANC-Q5) 65
Antenatal care – All (ANC-ALL) 16
Skilled birth attendants quintile 1 (SKA-Q1) 66
Skilled birth attendants quintile 5 (SKA-Q5) 66
Skilled birth attendants – All (SKA-ALL) 4
Maternal and Neonatal Program Effort Index (MNPI) 65
Delivery by doctors quintile 1 (DOC-Q1) 67
Delivery by doctors quintile 5 (DOC-Q5) 67
Delivery by doctors – All (DOC-ALL) 67
Percentage of population living in urban areas (Urban) 0
Contraceptive use (Contraceptive use) 22
General fertility rate (GFR) 0

Maternal Mortality in 2005
22
An
nex
2. C
orr
elat
ion
mat
rix
sho
win
g t
he
asso
ciat
ion
s b
etw
een
all p
oss
ible
ind
icat
ors
(c
olu
mn
hea
din
gs
as d
efin
ed in
An
nex
1)
Ind
icat
or
GD
PH
ealth
exp
Inst
del
iver
yF
LPA
NC
-Q
1A
NC
-Q
5A
NC
-A
LLS
KA
-Q1
SK
A-Q
5S
KA
-A
LLM
NP
ID
OC
-Q
1D
OC
-Q
5D
OC
-A
LLU
rban
Co
ntra
cep
tive
use
GD
P1.
00
Hea
lth e
xp0.
861.
00
Inst
del
iver
y 0.
480.
241.
00
FLP
-0.2
0-0
.09
-0.3
21.
00
AN
C-
Q1
0.19
0.10
0.55
0.06
1.00
AN
C-
Q5
0.22
0.26
0.50
-0.1
70.
661.
00
AN
C-A
LL0.
370.
230.
65-0
.06
0.76
0.63
1.00
SK
A -
Q1
0.40
0.08
0.85
-0.3
50.
580.
350.
591.
00
SK
A -
Q5
-0.1
4-0
.37
0.58
-0.3
10.
330.
520.
440.
471.
00
SK
A -
ALL
0.59
0.47
0.88
-0.3
10.
590.
610.
690.
720.
491.
00
MN
PI
0.38
0.26
0.51
-0.0
60.
270.
250.
420.
490.
400.
611.
00
DO
C-Q
10.
140.
060.
34-0
.07
0.38
0.07
0.25
0.55
-0.0
10.
340.
141.
00
DO
C-Q
50.
330.
440.
14-0
.10
0.05
0.07
0.18
0.10
-0.1
60.
270.
110.
571.
00
DO
C-A
LL0.
210.
220.
24-0
.09
0.21
0.06
0.23
0.33
-0.0
60.
300.
110.
860.
891.
00
Urb
an0.
610.
500.
61-0
.40
0.24
0.45
0.46
0.40
0.34
0.69
0.25
0.23
0.39
0.37
1.00
Con
trac
eptiv
e us
e0.
390.
330.
60-0
.25
0.42
0.31
0.47
0.47
0.34
0.72
0.61
0.34
0.46
0.41
0.50
1.00
23
23
Maternal Mortality in 2005
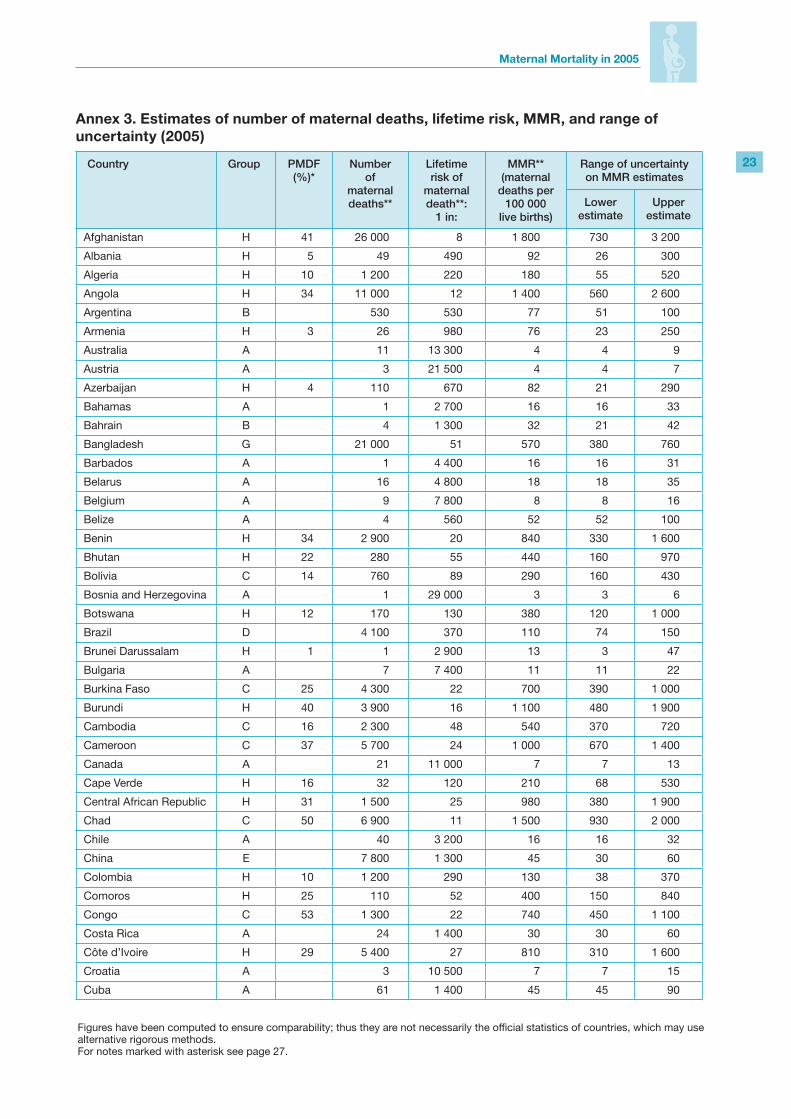
Annex 3. Estimates of number of maternal deaths, lifetime risk, MMR, and range of uncertainty (2005)
Country Group PMDF(%)*
Numberof
maternal deaths**
Lifetimerisk of
maternal death**:
1 in:
MMR**(maternal
deaths per 100 000
live births)
Range of uncertainty on MMR estimates
Lowerestimate
Upperestimate
Afghanistan H 41 26 000 8 1 800 730 3 200
Albania H 5 49 490 92 26 300
Algeria H 10 1 200 220 180 55 520
Angola H 34 11 000 12 1 400 560 2 600
Argentina B 530 530 77 51 100
Armenia H 3 26 980 76 23 250
Australia A 11 13 300 4 4 9
Austria A 3 21 500 4 4 7
Azerbaijan H 4 110 670 82 21 290
Bahamas A 1 2 700 16 16 33
Bahrain B 4 1 300 32 21 42
Bangladesh G 21 000 51 570 380 760
Barbados A 1 4 400 16 16 31
Belarus A 16 4 800 18 18 35
Belgium A 9 7 800 8 8 16
Belize A 4 560 52 52 100
Benin H 34 2 900 20 840 330 1 600
Bhutan H 22 280 55 440 160 970
Bolivia C 14 760 89 290 160 430
Bosnia and Herzegovina A 1 29 000 3 3 6
Botswana H 12 170 130 380 120 1 000
Brazil D 4 100 370 110 74 150
Brunei Darussalam H 1 1 2 900 13 3 47
Bulgaria A 7 7 400 11 11 22
Burkina Faso C 25 4 300 22 700 390 1 000
Burundi H 40 3 900 16 1 100 480 1 900
Cambodia C 16 2 300 48 540 370 720
Cameroon C 37 5 700 24 1 000 670 1 400
Canada A 21 11 000 7 7 13
Cape Verde H 16 32 120 210 68 530
Central African Republic H 31 1 500 25 980 380 1 900
Chad C 50 6 900 11 1 500 930 2 000
Chile A 40 3 200 16 16 32
China E 7 800 1 300 45 30 60
Colombia H 10 1 200 290 130 38 370
Comoros H 25 110 52 400 150 840
Congo C 53 1 300 22 740 450 1 100
Costa Rica A 24 1 400 30 30 60
Côte d’Ivoire H 29 5 400 27 810 310 1 600
Croatia A 3 10 500 7 7 15
Cuba A 61 1 400 45 45 90
Figures have been computed to ensure comparability; thus they are not necessarily the official statistics of countries, which may use alternative rigorous methods.For notes marked with asterisk see page 27.
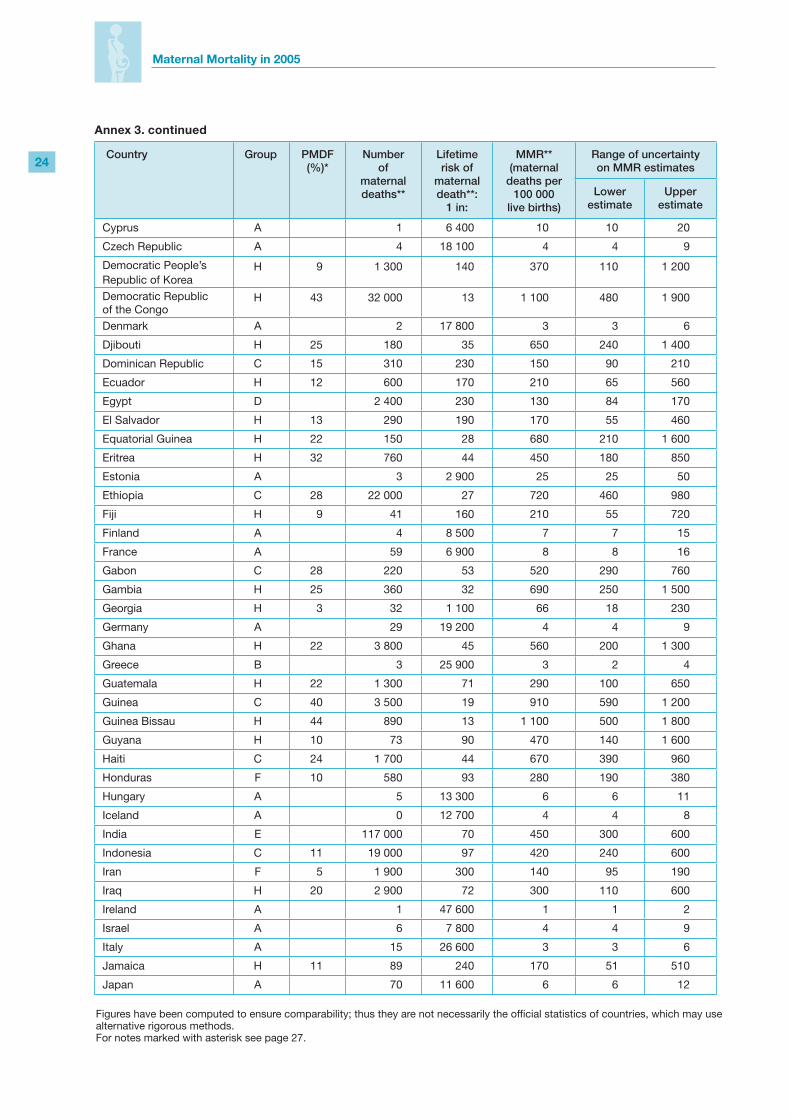
Maternal Mortality in 2005
24Country Group PMDF
(%)*Number
ofmaternal deaths**
Lifetimerisk of
maternal death**:
1 in:
MMR**(maternal
deaths per 100 000
live births)
Range of uncertainty on MMR estimates
Lowerestimate
Upperestimate
Cyprus A 1 6 400 10 10 20
Czech Republic A 4 18 100 4 4 9
Democratic People’s Republic of Korea
H 9 1 300 140 370 110 1 200
Democratic Republic of the Congo
H 43 32 000 13 1 100 480 1 900
Denmark A 2 17 800 3 3 6
Djibouti H 25 180 35 650 240 1 400
Dominican Republic C 15 310 230 150 90 210
Ecuador H 12 600 170 210 65 560
Egypt D 2 400 230 130 84 170
El Salvador H 13 290 190 170 55 460
Equatorial Guinea H 22 150 28 680 210 1 600
Eritrea H 32 760 44 450 180 850
Estonia A 3 2 900 25 25 50
Ethiopia C 28 22 000 27 720 460 980
Fiji H 9 41 160 210 55 720
Finland A 4 8 500 7 7 15
France A 59 6 900 8 8 16
Gabon C 28 220 53 520 290 760
Gambia H 25 360 32 690 250 1 500
Georgia H 3 32 1 100 66 18 230
Germany A 29 19 200 4 4 9
Ghana H 22 3 800 45 560 200 1 300
Greece B 3 25 900 3 2 4
Guatemala H 22 1 300 71 290 100 650
Guinea C 40 3 500 19 910 590 1 200
Guinea Bissau H 44 890 13 1 100 500 1 800
Guyana H 10 73 90 470 140 1 600
Haiti C 24 1 700 44 670 390 960
Honduras F 10 580 93 280 190 380
Hungary A 5 13 300 6 6 11
Iceland A 0 12 700 4 4 8
India E 117 000 70 450 300 600
Indonesia C 11 19 000 97 420 240 600
Iran F 5 1 900 300 140 95 190
Iraq H 20 2 900 72 300 110 600
Ireland A 1 47 600 1 1 2
Israel A 6 7 800 4 4 9
Italy A 15 26 600 3 3 6
Jamaica H 11 89 240 170 51 510
Japan A 70 11 600 6 6 12
Annex 3. continued
Figures have been computed to ensure comparability; thus they are not necessarily the official statistics of countries, which may use alternative rigorous methods.For notes marked with asterisk see page 27.

25
25
Maternal Mortality in 2005
Country Group PMDF(%)*
Numberof
maternal deaths**
Lifetimerisk of
maternal death**:
1 in:
MMR**(maternal
deaths per 100 000
live births)
Range of uncertainty on MMR estimates
Lowerestimate
Upperestimate
Jordan D 92 450 62 41 82
Kazakhstan H 3 340 360 140 40 500
Kenya C 32 7 700 39 560 340 800
Kuwait A 2 9 600 4 4 8
Kyrgyzstan H 8 170 240 150 43 460
Lao People’s Democratic Republic
H 20 1 300 33 6601 190 1 600
Latvia A 2 8 500 10 10 19
Lebanon H 6 99 290 150 41 500
Lesotho C 39 480 45 960 570 1 400
Liberia H 39 2 100 12 1 200 520 2 100
Libyan Arab Jamahiriya H 7 130 350 97 28 300
Lithuania A 3 7 800 11 11 22
Luxembourg A 1 5 000 12 12 23
Madagascar C 24 3 600 38 510 290 740
Malawi C 68 6 000 18 1 100 720 1 500
Malaysia G 340 560 62 41 82
Maldives H 20 12 200 120 42 260
Mali C 33 6 400 15 970 620 1 300
Malta A 0 8 300 8 8 17
Mauritania C 41 1 000 22 820 480 1 200
Mauritius A 3 3 300 15 15 30
Mexico A 1 300 670 60 60 120
Mongolia A 27 840 46 46 93
Morocco C 18 1 700 150 240 140 350
Mozambique C 25 4 000 45 520 360 680
Myanmar G 3 700 110 380 260 510
Namibia C 22 110 170 210 110 300
Nepal H 22 6 500 31 830 290 1 900
Netherlands A 11 10 200 6 6 12
New Zealand A 5 5 900 9 9 18
Nicaragua F 9 270 150 170 120 230
Niger H 47 14 000 7 1 800 840 2 900
Nigeria H 34 59 000 18 1 100 440 2 000
Norway A 4 7 700 7 7 15
Oman H 8 41 420 64 18 200
Pakistan H 15 15 000 74 320 99 810
Panama H 11 91 270 130 39 410
Papua New Guinea H 16 820 55 470 130 1 300
Annex 3. continued
1 Officially reported unadjusted direct estimate of MMR from the 2005 population census is 405 per 100 000 live births
Figures have been computed to ensure comparability; thus they are not necessarily the official statistics of countries, which may use alternative rigorous methods.For notes marked with asterisk see page 27.

Maternal Mortality in 2005
26 Country Group PMDF(%)*
Number of maternal deaths**
Lifetimerisk of
maternal death**:
1 in:
MMR**(maternal
deaths per 100 000 live
births)
Range of uncertainty on MMR estimates
Lowerestimate
Upperestimate
Paraguay F 11 260 170 150 99 200
Peru C 14 1 500 140 240 170 310
Philippines H 11 4 600 140 230 60 700
Poland B 27 10 600 8 5 10
Portugal B 12 6 400 11 7 14
Puerto Rico A 10 2 900 18 18 36
Qatar B 2 2 700 12 8 16
Republic of Korea A 63 6 100 14 14 27
Republic of Moldova
A 9 3 700 22 22 44
Romania A 51 3 200 24 24 49
Russian Federation A 430 2 700 28 28 55
Rwanda C 35 4 700 16 1 300 770 1 800
Saudi Arabia G 120 1 400 18 12 24
Senegal C 38 4 100 21 980 590 1 400
Serbia and Montenegro 2
A 16 4 500 14 14 27
Sierra Leone H 39 5 400 8 2 100 880 3 700
Singapore A 5 6 200 14 14 27
Slovakia A 3 13 800 6 6 12
Slovenia A 1 14 200 6 6 12
Solomon Islands H 18 34 100 220 65 580
Somalia H 33 5 200 12 1 400 550 2 700
South Africa F 6 4 300 110 400 270 530
Spain A 20 16 400 4 4 9
Sri Lanka G 190 850 58 39 77
Sudan H 23 5 300 53 450 160 1 000
Suriname A 7 530 72 72 140
Swaziland H 16 120 120 390 130 980
Sweden A 3 17 400 3 3 7
Switzerland A 4 13 800 5 5 11
Syrian Arab Republic
H 11 700 210 130 40 370
Tajikistan H 12 320 160 170 53 460
Thailand G 1 100 500 110 70 140
The former Yugoslav Republic of Macedonia
A 2 6 500 10 10 20
Timor-Leste H 42 190 35 380 150 700
Togo C 23 1 200 38 510 290 750
Trinidad and Tobago A 8 1 400 45 45 89
Tunisia H 5 170 500 100 27 380
Annex 3. continued
2 Serbia and Montenegro became separate independent entities in 2006.
Figures have been computed to ensure comparability; thus they are not necessarily the official statistics of countries, which may use alternative rigorous methods.For notes marked with asterisk see page 27.

27
27
Maternal Mortality in 2005
Country Group PMDF(%)*
Number of maternal deaths**
Lifetimerisk of
maternal death**:
1 in:
MMR**(maternal
deaths per 100 000 live
births)
Range of uncertainty on MMR estimates
Lowerestimate
Upperestimate
Turkey D 650 880 44 29 58
Turkmenistan H 6 140 290 130 37 400
Uganda C 40 8 100 25 550 350 770
Ukraine A 71 5 200 18 18 36
United Arab Emirates
H 5 25 1 000 37 10 130
United Kingdom A 51 8 200 8 8 15
United Republic of Tanzania
C 28 13 000 24 950 620 1 300
United States of America
A 440 4 800 11 11 21
Uruguay A 11 2 100 20 20 40
Uzbekistan A 150 1 400 24 24 49
Venezuela A 340 610 57 57 110
Viet Nam H 8 2 500 280 150 40 510
Yemen H 26 3 600 39 430 150 900
Zambia C 37 3 900 27 830 520 1 200
Zimbabwe H 21 3 400 43 880 300 2 000
Annex 3. continued
* The proportion maternal among deaths of females of reproductive age (PMDF).
** The MMR and lifetime risk have been rounded according to the following scheme: < 100, no rounding; 100–999, rounded to nearest 10; and >1,000, rounded to nearest 100. The numbers of maternal deaths have been rounded as follows: <100, no round-ing, 100-999 rounded to nearest 10; 1,000–9,999, rounded to nearest 100; and >10,000, rounded to nearest 1,000.
Figures have been computed to ensure comparability; thus they are not necessarily the official statistics of countries, which may use alternative rigorous methods.

Maternal Mortality in 2005
28 Annex 4. Countries with large MMR differences between 2000 and 2005
Albania
The higher MMR in 2005 (92), as compared to 2000
(55), is the result of several factors. The first factor
is that the estimated number of births decreased by
about 13% between 2000 and 2005. The second is
that the PMDF predicted from the model increased
from 3% to 5% as a result of a slightly lower SKA
value for 2005. In addition, there was also a slight
increase (about 3%) in the estimated reproductive-
aged female mortality for 2005 as compared to 2000.
Botswana
The MMR estimate for 2005 (370) is much higher than
the 2000 (100) estimate because WHO estimates a
higher number of female deaths from non-HIV/AIDS
causes in 2005 compared to 2000. The WHO estimate
of the number of reproductive-aged female mortality
increased by approximately 155% between the two
periods. In addition, estimates of the number of births
declined by about 7%.
Democratic People’s Republic of Korea
The MMR estimate for 2005 (370) was higher than the
2000 MMR (67). The predicted PMDF in 2005 was
higher than in 2000, because the GDP estimate (in
purchasing power parity) used in the 2005 model was
approximately 75% lower than the estimate of US$ 14
996 used in the 2000 model.
Fiji
Several factors accounted for the disparity between
the 2000 (75) and 2005 (210) MMR estimates. First,
the estimated reproductive-aged female mortality
for 2005 is 11% higher than for 2000. Second, the
number of births was lower in 2005 by approximately
7%. Third, there was a slight decrease (approximately
1%) in the estimated SKA in 2000. This decrease was
associated with a higher predicted PMDF in 2005
compared to 2000.
Georgia
The MMR estimate in the 2000 report was not based
on the complete form of the model estimate for 2000.
Based on the model parameters estimated in 2000,
the correct 2000 MMR estimate was 73 – not 32 as
was reported. The MMR estimate for 2005 (66) is
therefore approximately 8% lower than the revised
estimate for 2000.
Guyana
The WHO estimate of reproductive-aged female mor-
tality in 2005 was 53% higher than the correspond-
ing estimate for 2000. In addition, the SKA estimate
used in the 2005 model was approximately 9% lower
than the corresponding estimate in the 2000 model
– resulting in a higher predicted PMDF in 2005. The
2005 MMR was 470, while the 2000 MMR was 170.
Liberia
The most important factor affecting the change in
the MMR between 2000 (760) and 2005 (1200) was
an increase of about 50% in the reproductive-aged
female mortality between the two periods.
Papua New Guinea
The MMR in 2005 (470) was higher than the MMR in
2000 (300). The predicted PMDF was higher in 2005
than the PMDF for 2000. The World Bank GDP esti-
mate used in the 2005 model is approximately 31%
lower than the estimate used in the 2000 model.
Solomon Islands
The disparity between the 2000 (130) and 2005 (220)
MMR estimates was attributed to two factors. First,
compared to the GDP estimates used in the 2000
model, the GDP value in the 2005 model was approxi-
mately 27% lower. Second, there was a 5% increase
in the WHO estimate of reproductive-aged female
mortality in 2005, compared to that in 2000.
Tajikistan
The MMR estimate in the 2000 report was not based
on the complete form of the model estimates for
2000. Based on the parameters estimated from the
2000 model, the MMR estimate for 2000 was 255 and
not 100. The MMR estimate for 2005 (170) is therefore
approximately 30% lower than the revised estimate
for 2000.
Turkmenistan
The MMR estimate in the 2000 report was not based
on the complete form of the model estimates for 2000.
Based on the model parameters estimated in that
year, the 2000 MMR should have been 128 – and not
31 as was reported. Thus, the MMR estimate for 2005
(130) indicates that there was no change in the MMR
estimates for 2000 and 2005.
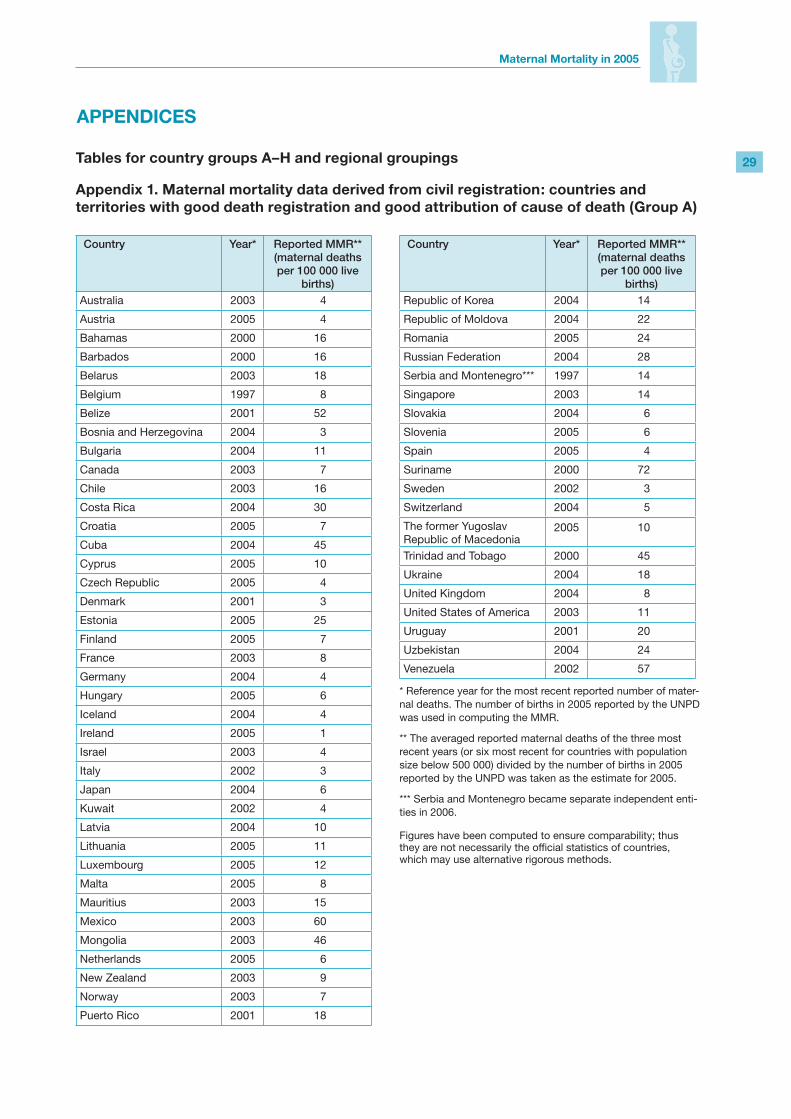
29
29
Maternal Mortality in 2005
APPENDICES
Tables for country groups A–H and regional groupings
Appendix 1. Maternal mortality data derived from civil registration: countries and territories with good death registration and good attribution of cause of death (Group A)
Country Year* Reported MMR** (maternal deaths per 100 000 live
births)Australia 2003 4
Austria 2005 4
Bahamas 2000 16
Barbados 2000 16
Belarus 2003 18
Belgium 1997 8
Belize 2001 52
Bosnia and Herzegovina 2004 3
Bulgaria 2004 11
Canada 2003 7
Chile 2003 16
Costa Rica 2004 30
Croatia 2005 7
Cuba 2004 45
Cyprus 2005 10
Czech Republic 2005 4
Denmark 2001 3
Estonia 2005 25
Finland 2005 7
France 2003 8
Germany 2004 4
Hungary 2005 6
Iceland 2004 4
Ireland 2005 1
Israel 2003 4
Italy 2002 3
Japan 2004 6
Kuwait 2002 4
Latvia 2004 10
Lithuania 2005 11
Luxembourg 2005 12
Malta 2005 8
Mauritius 2003 15
Mexico 2003 60
Mongolia 2003 46
Netherlands 2005 6
New Zealand 2003 9
Norway 2003 7
Puerto Rico 2001 18
Country Year* Reported MMR** (maternal deaths per 100 000 live
births)Republic of Korea 2004 14
Republic of Moldova 2004 22
Romania 2005 24
Russian Federation 2004 28
Serbia and Montenegro*** 1997 14
Singapore 2003 14
Slovakia 2004 6
Slovenia 2005 6
Spain 2005 4
Suriname 2000 72
Sweden 2002 3
Switzerland 2004 5
The former Yugoslav Republic of Macedonia
2005 10
Trinidad and Tobago 2000 45
Ukraine 2004 18
United Kingdom 2004 8
United States of America 2003 11
Uruguay 2001 20
Uzbekistan 2004 24
Venezuela 2002 57
* Reference year for the most recent reported number of mater-nal deaths. The number of births in 2005 reported by the UNPD was used in computing the MMR.
** The averaged reported maternal deaths of the three most recent years (or six most recent for countries with population size below 500 000) divided by the number of births in 2005 reported by the UNPD was taken as the estimate for 2005.
*** Serbia and Montenegro became separate independent enti-ties in 2006.
Figures have been computed to ensure comparability; thus they are not necessarily the official statistics of countries, which may use alternative rigorous methods.
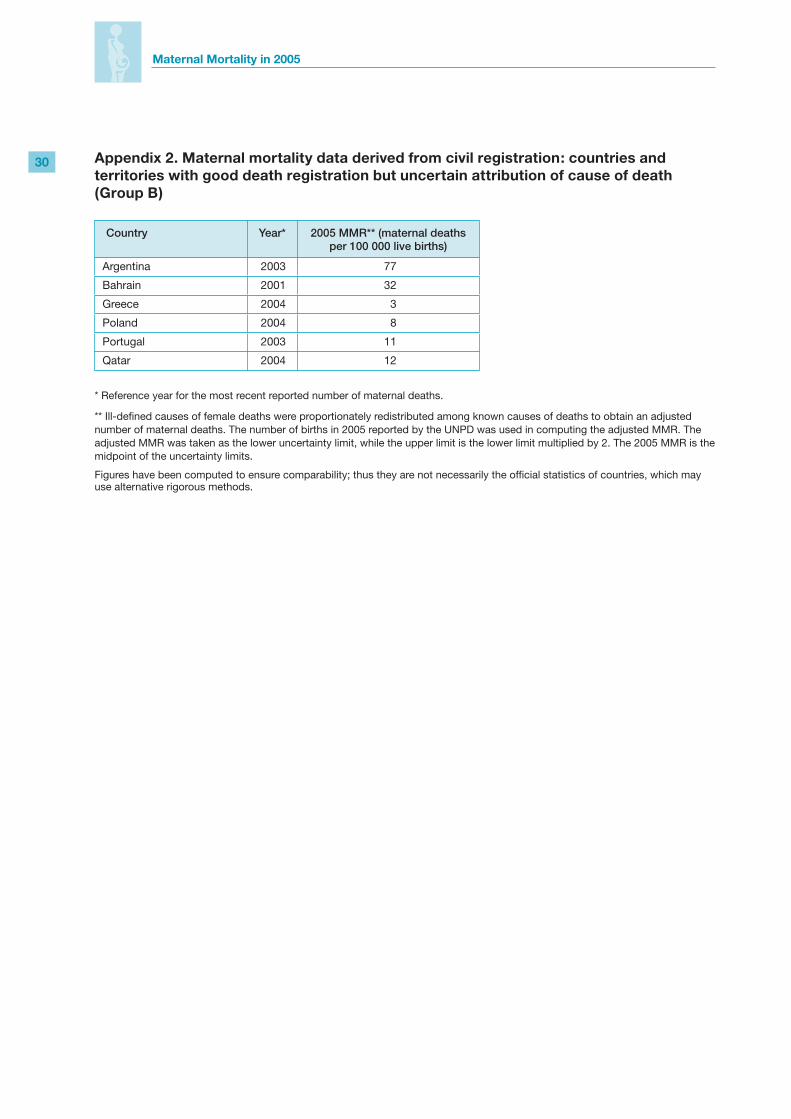
Maternal Mortality in 2005
30 Appendix 2. Maternal mortality data derived from civil registration: countries and territories with good death registration but uncertain attribution of cause of death (Group B)
Country Year* 2005 MMR** (maternal deaths per 100 000 live births)
Argentina 2003 77
Bahrain 2001 32
Greece 2004 3
Poland 2004 8
Portugal 2003 11
Qatar 2004 12
* Reference year for the most recent reported number of maternal deaths.
** Ill-defined causes of female deaths were proportionately redistributed among known causes of deaths to obtain an adjusted number of maternal deaths. The number of births in 2005 reported by the UNPD was used in computing the adjusted MMR. The adjusted MMR was taken as the lower uncertainty limit, while the upper limit is the lower limit multiplied by 2. The 2005 MMR is the midpoint of the uncertainty limits.
Figures have been computed to ensure comparability; thus they are not necessarily the official statistics of countries, which may use alternative rigorous methods.
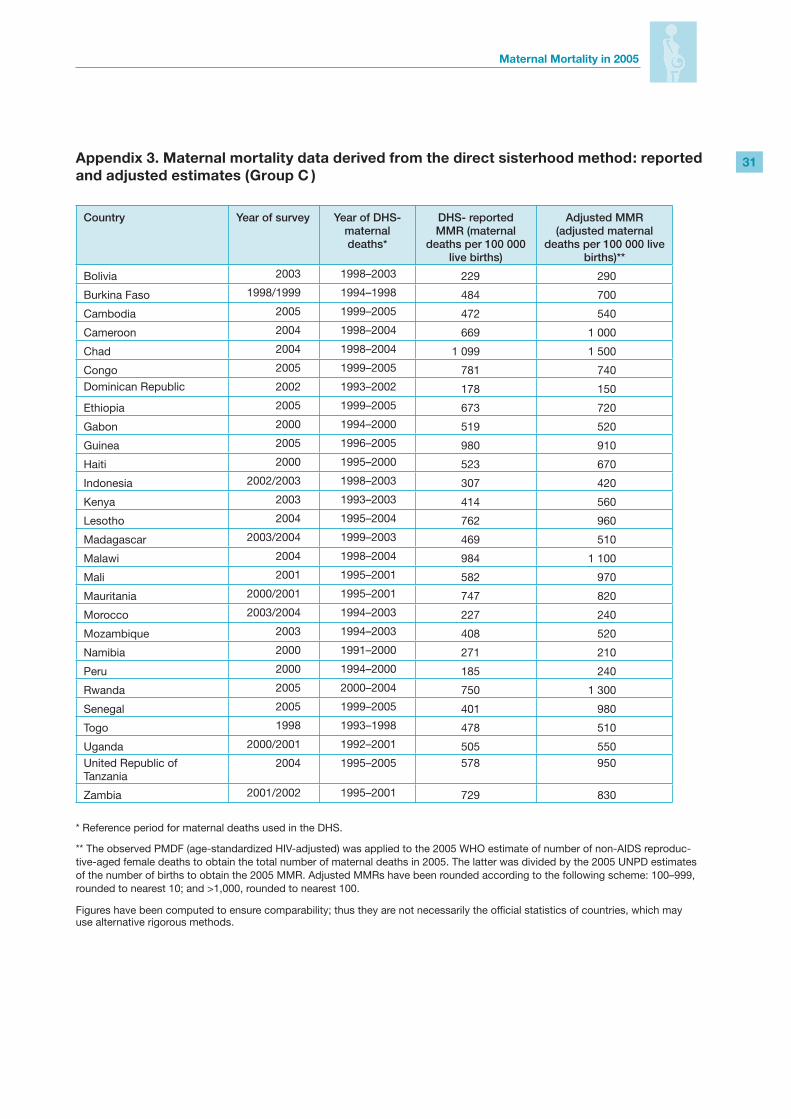
31
31
Maternal Mortality in 2005
Appendix 3. Maternal mortality data derived from the direct sisterhood method: reported and adjusted estimates (Group C )
Country Year of survey Year of DHS-maternal deaths*
DHS- reported MMR (maternal
deaths per 100 000 live births)
Adjusted MMR (adjusted maternal
deaths per 100 000 live births)**
Bolivia 2003 1998–2003 229 290
Burkina Faso 1998/1999 1994–1998 484 700
Cambodia 2005 1999–2005 472 540
Cameroon 2004 1998–2004 669 1 000
Chad 2004 1998–2004 1 099 1 500
Congo 2005 1999–2005 781 740Dominican Republic 2002 1993–2002 178 150
Ethiopia 2005 1999–2005 673 720
Gabon 2000 1994–2000 519 520
Guinea 2005 1996–2005 980 910
Haiti 2000 1995–2000 523 670
Indonesia 2002/2003 1998–2003 307 420
Kenya 2003 1993–2003 414 560
Lesotho 2004 1995–2004 762 960
Madagascar 2003/2004 1999–2003 469 510
Malawi 2004 1998–2004 984 1 100
Mali 2001 1995–2001 582 970
Mauritania 2000/2001 1995–2001 747 820
Morocco 2003/2004 1994–2003 227 240
Mozambique 2003 1994–2003 408 520
Namibia 2000 1991–2000 271 210
Peru 2000 1994–2000 185 240
Rwanda 2005 2000–2004 750 1 300
Senegal 2005 1999–2005 401 980
Togo 1998 1993–1998 478 510
Uganda 2000/2001 1992–2001 505 550United Republic of Tanzania
2004 1995–2005 578 950
Zambia 2001/2002 1995–2001 729 830
* Reference period for maternal deaths used in the DHS.
** The observed PMDF (age-standardized HIV-adjusted) was applied to the 2005 WHO estimate of number of non-AIDS reproduc-tive-aged female deaths to obtain the total number of maternal deaths in 2005. The latter was divided by the 2005 UNPD estimates of the number of births to obtain the 2005 MMR. Adjusted MMRs have been rounded according to the following scheme: 100–999, rounded to nearest 10; and >1,000, rounded to nearest 100.
Figures have been computed to ensure comparability; thus they are not necessarily the official statistics of countries, which may use alternative rigorous methods.

Maternal Mortality in 2005
32 Appendix 4. Maternal mortality data derived from studies in Groups D–G
Country Group Source Year of study
ReportedMMR
(maternal deaths per 100 000 live
births)
Adjusted MMR (maternal
deaths per 100 000 live
births)*
Bangladesh G Special study 2000 380 570
Brazil D RAMOS 2005 74 110
China E Disease surveillance system
2005 30 45
Egypt D RAMOS 2000 84 130
Honduras F Census 2001 ** 280
India E Sample registration system
2001–2003 301 450
Iran F Census 1995–1996 ** 140
Jordan D RAMOS 1996 41 62
Malaysia G Special study 1996 41 62
Myanmar G Special study 1999 255 380
Nicaragua F Census 2005 ** 170
Paraguay F Census 2002 ** 150
Saudi Arabia G Special study 2000 12 18
South Africa F Census 2001 575 400
Sri Lanka G Special study 2004 39 58
Thailand G Special study 2005 ** 110
Turkey D RAMOS 2005 29 44
* Adjusted MMRs have been rounded as follows: < 100, no rounding; and 100–999, rounded to nearest 10.
** MMR was not available in these studies.
Appendix 5. Maternal mortality data derived from model (Group H)
Country Year Model-based MMR (maternal deaths per 100 000 live births)*
Afghanistan 2005 1 800
Albania 2005 92
Algeria 2005 180
Angola 2005 1 400
Armenia 2003 76
Azerbaijan 2005 82
Benin 2005 840
Bhutan 2005 440
Botswana 2005 380
Brunei Darussalam 2000 13
Burundi 2005 1 100
Cape Verde 2005 210
Central African Republic 2005 980
* MMRs have been rounded according to the following scheme: < 100, no rounding; 100–999, rounded to nearest 10; and >1000, rounded to nearest 100.
Figures have been computed to ensure comparability; thus they are not necessarily the official statistics of countries, which may use alternative rigorous methods.
Figures have been computed to ensure comparability; thus they are not necessarily the official statistics of countries, which may use alternative rigorous methods.

33
33
Maternal Mortality in 2005
Country Year Model-based MMR (maternal deaths per 100 000 live births)*
Colombia 2005 130
Comoros 2005 400
Côte d’Ivoire 2005 810
Democratic People’s Republic of Korea 2005 370
Democratic Republic of the Congo 2005 1 100
Djibouti 2005 650
Ecuador 2005 210
El Salvador 2005 170
Equatorial Guinea 2005 680
Eritrea 2005 450
Fiji 2005 210
Gambia 2005 690
Georgia 2005 66
Ghana 2005 560
Guatemala 2005 290
Guinea Bissau 2005 1 100
Guyana 2005 470
Iraq 2005 300
Jamaica 2005 170
Kazakhstan 2005 140
Kyrgyzstan 2005 150
Lao People’s Democratic Republic 2005 6601
Lebanon 2005 150
Liberia 2005 1 200
Libyan Arab Jamahiriya 2005 97
Maldives 2005 120
Nepal 2005 830
Niger 2005 1 800
Nigeria 2005 1 100
Oman 2005 64
Pakistan 2005 320
Panama 2005 130
Papua New Guinea 2005 470
Philippines 2005 230
Sierra Leone 2005 2 100
* MMRs have been rounded according to the following scheme: < 100, no rounding; 100–999, rounded to nearest 10; and >1000, rounded to nearest 100.
1 Officially reported unadjusted direct estimate of MMR from the 2005 population census is 405 per 100 000 live births.
Appendix 5. continued
Figures have been computed to ensure comparability; thus they are not necessarily the official statistics of countries, which may use alternative rigorous methods.

Maternal Mortality in 2005
34
Appendix 6. Estimates of MMR, number of maternal deaths, lifetime risk, and range of uncertainty by WHO regions, 2005
Region MMR (maternal deaths per 100 000 live
births)
Number of maternal deaths
Lifetime risk of maternal
death:1 in:
Range of uncertainty on MMR estimates
Lowerestimate
Upperestimate
Africa 900 261 000 23 450 1 500
Americas 99 16 000 420 62 170
South-East Asia 450 170 000 74 290 630
Europe 27 2 900 2 300 17 64
Eastern Mediterranean 420 66 000 61 170 850
Western Pacific 82 20 000 680 40 170
World 400 536 000 92 220 650
Appendix 7. Comparison of 1990 and 2005 maternal mortality by WHO regionsRegion 1990* 2005 % change in
MMR between 1990 and 2005
Annual % change in MMR between 1990 and 2005
MMR Maternal deaths
MMR Maternal deaths
Africa 910 205 000 900 261 000 -1.5 -0.1
Americas 130 21 000 99 16 000 -25.4 -2.0
South-East Asia 650 253 000 450 170 000 -30.6 -2.4
Europe 39 4 800 27 2 900 -30.2 -2.4
Eastern Mediterranean 380 55 000 420 66 000 10.8 0.7**
Western Pacific 120 37 000 82 20 000 -30.1 -2.4
World 430 576 000 400 536 000 -5.4 -0.4
* The 1990 estimates have been revised using the same methodology used for 2005, which makes them comparable.** The unexpected increase in the region could be attributed to increases in countries affected by conflicts (e.g., Afghanistan)
Country Year Model-based MMR (maternal deaths per 100 000 live births)*
Solomon Islands 2005 220
Somalia 2005 1 400
Sudan 2005 450
Swaziland 2005 390
Syrian Arab Republic 2005 130
Tajikistan 2005 170
Timor-Leste 2005 380
Tunisia 2005 100
Turkmenistan 2005 130
United Arab Emirates 2005 37
Viet Nam 2005 150
Yemen 2005 430
Zimbabwe 2005 880
Appendix 5. continued
* MMRs have been rounded according to the following scheme: < 100, no rounding; 100–999, rounded to nearest 10; and >1000, rounded to nearest 100.
Figures have been computed to ensure comparability; thus they are not necessarily the official statistics of countries, which may use alternative rigorous methods.

35
35
Maternal Mortality in 2005
Appendix 8. Estimates of MMR, number of maternal deaths, lifetime risk, and range of un-certainty by UNICEF regions, 2005
Region MMR(maternal
deaths per 100 000 live
births)
Number of maternal deaths
Lifetime risk of maternal
death:1 in:
Range of uncertainty on MMR estimates
Lowerestimate
Upperestimate
Sub-Saharan Africa 920 265 000 22 470 1 500
Eastern and Southern Africa 760 103 000 29 440 1 100
Western and Central Africa 1 100 162 000 17 490 1 800
Middle East and North Africa 210 21 000 140 93 430
South Asia 500 187 000 59 300 770
East Asia and Pacific 150 45 000 350 80 270
Latin America and Caribbean 130 15 000 280 81 230
Central and Eastern Europe and the Commonwealth of Independent States
46 2 600 1 300 27 110
Industrialized countries 8 830 8 000 8 15
Developing countries 450 534 000 76 240 720
Least developed countries 870 247 000 24 460 1 400
World 400 536 000 92 220 650
Appendix 9. Comparison of 1990 and 2005 maternal mortality by UNICEF regions
Region 1990* 2005 % change in MMR between1990 and
2005
Annual % changein MMR between1990 and
2005
MMR Maternal deaths
MMR Maternal deaths
Sub-Saharan Africa 940 206,000 920 265 000 -1.5 -0.1
Eastern and Southern Africa 790 85,000 760 103 000 -3.9 -0.3
Western and Central Africa 1 100 121 000 1 100 162 000 -0.7 0.0
Middle East and North Africa 270 26 000 210 21 000 -21.1 -1.6
South Asia 650 238 000 500 187 000 -22.0 -1.7
East Asia and Pacific 220 80 000 150 45 000 -30.3 -2.4
Latin America and Caribbean 180 21 000 130 15 000 -26.0 -2.0
Central and Eastern Europe and the Commonwealth of Independent States
63 4 400 46 2 600 -27.5 -2.1
Industrialized countries 8 960 8 830 -8.3 -0.6
Developing countries 480 574 000 450 534 000 -6.3 -0.4
Least developed countries 900 201 000 870 247 000 -2.5 -0.2
World 430 576 000 400 536 000 -5.4 -0.4
*The 1990 estimates have been revised using the same methodology used for 2005, which makes them comparable.

Maternal Mortality in 2005
36 Appendix 10. Estimates of MMR, number of maternal deaths, lifetime risk, and range of uncertainty by UNFPA regions, 2005
Appendix 11. Comparison of 1990 and 2005 maternal mortality by UNFPA regions
Region 1990* 2005 % change in MMR between1990 and
2005
Annual % changein MMR between1990 and
2005
MMR Maternal deaths
MMR Maternal deaths
Arab states (Middle East & North Africa)
320 24 000 280 24 000 -11.6 -0.8
Asia and the Pacific 430 322 000 340 233 000 -19.4 -1.4Europe and the Commonwealth of Independent States
64 4 300 47 2 600 -27.6 -2.2
Latin America and the Caribbean 180 21 000 130 15 000 -26.0 -2.0Sub-Saharan Africa 940 204 000 920 260 000 -2.5 -0.2All in UNFPA list (131 countries) 470 575 000 440 535 000 -5.9 -0.4Non-UNFPA list (40 countries) 10 1 300 9 1 000 -11.2 -0.8World 430 576 000 400 536 000 -5.4 -0.4
* The 1990 estimates have been revised using the same methodology used for 2005, which makes them comparable.
Region MMR (maternal deaths per 100 000 live
births)
Number of maternal deaths
Lifetime risk of maternal
death:1 in:
Range of uncertainty on MMR estimates
Lowerestimate
Upperestimate
Arab states (Middle East & North Africa)
280 24 000 97 110 570
Asia and the Pacific 340 233 000 110 200 540Europe and the Commonwealth of Independent States
47 2 600 1 200 27 110
Latin America and the Caribbean 130 15 000 280 81 230Sub-Saharan Africa 920 260 000 22 460 1 500All in UNFPA list (131 countries) 440 535 000 79 240 710Non-UNFPA list (40 countries) 9 1 000 6 900 8 19World 400 536 000 92 220 650

37
37
Maternal Mortality in 2005
Appendix 12. Estimates of MMR, number of maternal deaths, lifetime risk, and range of uncertainty by The World Bank regions and income groups, 2005
Appendix 13. Comparison of 1990 and 2005 maternal mortality by The World Bank re-gions and income groups
Region and income group MMR (maternal deaths per 100 000 live
births)
Number of maternal deaths
Lifetime risk of maternal
death:1 in:
Range of uncertainty on MMR estimates
Lowerestimate
Upperestimate
Region*
East Asia and Pacific 150 45 000 340 82 270Europe and Central Asia 42 2 600 1 400 25 99Latin America and the Caribbean 130 15 000 280 81 230Middle East and North Africa 200 15 000 160 92 380South Asia 500 187 000 59 300 770Sub-Saharan Africa 900 270 000 22 450 1 500Income group**
High income 9 1 000 6 700 8 17
Upper middle income 91 9 000 540 65 150
Lower middle income 180 74 000 270 94 300
Low income 650 451 000 40 350 1 000
World 400 536 000 92 220 650
* The regions exclude high income countries. ** Income groups were based on 2005 gross national income per capita estimates: low income, US$ 875 or less; lower middle
US$ 876 – US$ 3,465; upper middle US$ 3,466 – US$ 10,725; and high US$ 10,726 or more.
Region and income group 1990* 2005 % change in MMR between1990 and
2005
Annual % change in
MMR between 1990 and 2005
MMR Maternal deaths
MMR Maternal deaths
Region**
East Asia and Pacific 220 80 000 150 45 000 -30.6 -2.4
Europe and Central Asia 57 4 500 42 2 600 -26.7 -2.1
Latin America and the Caribbean 180 21 000 130 15 000 -26.0 -2.0
Middle East and North Africa 250 20 000 200 15 000 -21.4 -1.6
South Asia 650 238 000 500 187 000 -22.0 -1.7
Sub-Saharan Africa 920 212 000 900 270 000 -1.8 -0.1
Income group***
High income 11 1 300 9 1 000 -18.8 -1.4
Upper middle income 58 6 400 91 9 000 57.1 3.0
Lower middle income 210 104 000 180 74 000 -17.0 -1.2
Low income 730 464 000 650 451 000 -11.4 -0.8
World 430 576 000 400 536 000 -5.4 -0.4
* The 1990 estimates have been revised using the same methodology used for 2005, which makes them comparable.
** The regions exclude high income countries.*** Income groups were based on 2005 gross national income per capita estimates: low income, US$ 875 or less; lower middle US$ 876 – US$ 3,465; upper middle US$ 3,466 – US$ 10,725; and high US$ 10,726 or more.

Maternal Mortality in 2005
38 Appendix 14. Estimates of MMR, number of maternal deaths, lifetime risk, and range of uncertainty by United Nations Population Division regions, 2005
Appendix 15. Comparison of 1990 and 2005 maternal mortality by United Nations Population Division regions
Region MMR (mater-nal deaths per 100 000 live
births)
Number of maternal deaths
Lifetime risk of maternal
death:1 in:
Range of uncertainty on MMR estimates
Lowerestimate
Upperestimate
Africa 820 276 000 26 410 1 400
Asia 320 242 000 120 180 510
Europe 13 930 5 700 12 26
Latin America and the Caribbean 130 15 000 290 81 230
Northern America 10 460 5 100 10 21
Oceania 180 910 250 52 480
More developed regions 11 1 500 5 900 11 23
Less developed regions 450 534 000 76 240 720
Least developed countries 870 247 000 24 460 1 400World 400 536 000 92 220 650
Region 1990* 2005 % change in MMR between1990 and
2005
Annual % change in
MMR between 1990 and 2005
MMR Maternal deaths
MMR Maternal deaths
Africa 830 221 000 820 276 000 -0.6 0.0
Asia 400 331 000 320 242 000 -19.5 -1.4
Europe 23 2 100 13 930 -46.1 -4.1
Latin America and the Caribbean 180 21 000 130 15 000 -26.3 -2.0
Northern America 8 350 10 460 31.0 1.8
Oceania 210 1 100 180 910 -16.9 -1.2
More developed regions 17 2 500 11 1 500 -35.3 -2.9
Less developed regions 480 574 000 450 534 000 -6.3 -0.4
Least developed countries 900 201 000 870 247 000 -2.5 -0.2World 430 576 000 400 536 000 -5.4 -0.4
* The 1990 estimates have been revised using the same methodology used for 2005, which makes them comparable.

39
39
Maternal Mortality in 2005
1. United Nations Millennium Declaration. Fifty-fifth Session of the United Nations General Assembly. New York: United Nations; 18 September 2000 (General Assembly document, No. A/RES/55/2).
2. AbouZahr C, Wardlaw T. Maternal mortality in 2000: estimates developed by WHO, UNICEF and UNFPA.Geneva: WHO; 2004 (ISBA 92 4 156270 6).
3. WHO, UNICEF. Revised 1990 estimates of maternal mortality:a new approach by WHO and UNICEF.Geneva: WHO; 1996.
4. AbouZahr C, Wardlaw T, Hill K. Maternal mortality in 1995: estimates developed by WHO, UNICEF, UNFPA. Geneva: WHO; 2001 (WHO/RHR/01.9).
5. International Statistical Classification of Diseases and Related Health Problems. Tenth Revision. Vol. 1: Tabular list. Vol. 2: Instruction manual. Geneva: WHO; 1992.
6. Karimian-Teherani D, Haidinger G, Waldhoer T, Beck A, Vutuc C. Under-reporting of direct and indirect obstetrical deaths in Austria, 1980-98. Acta Obstet Gynecol Scand 2002;81:323-327.
7. Horon IL. Underreporting of maternal deaths on death certificates and the magnitude of the problem of maternal mortality. Am J Public Health2005;95:478-482.
8. Kao S, Chen LM, Shi L, Weinrich MC. Underreporting and misclassification of maternal mortality in Taiwan. Acta Obstet Gynecol Scand 1997;76:629-636.
9. Deneux-Tharaux C, Berg C, Bouvier-Colle MH, Gissler M, Harper M, Nannini A, et al. Underreporting of pregnancy-related mortality in the United States and Europe. Obstet Gynecol 2005;106:684-692.
10. Chang J, Elam-Evans LD, Berg CJ, Herndon J, Flowers L, Seed KA, Syverson CJ. Pregnancy-related mortality surveillance – United States, 1991–1999. MMWR Surveill Summ 2003;52:1-8.
11. Lewis G, ed. Why mothers die 2000–2002: the confidential enquiries into maternal deaths in the United Kingdom. London: RCOG Press; 2004.
12. Hill K, El Arifeen S, Koenig M, Al Sabir A, Jamil K, Raggers H. How should we measure maternal mortality in the developing world? A comparison of household deaths and sibling history approaches. Bull World Health Organ 2006;84:173-180.
13. Stanton C, Abderrahim N, Hill K. DHS maternal mortality indicators: an assessment of data quality and implications for data use. Calverton, Maryland USA: Macro International Inc.; 1997 (DHS Analytical Report No. 4).
14. Atrash HK, Alexander S, Berg CJ. Maternal mortality in developed countries: not just a concern of the past. Obstet Gynecol 1995;86:700-705.
15. Chandramohan D, Stetel P, Quigley M. Misclassification error in verbal autopsy: can it be adjusted? Int J Epidemiol 2001;30:509-514.
16. Chandramohan D, Rodrigues LC, Maude GH, Hayes RJ. The validity of verbal autopsies for assessing the causes of institutional maternal death. Stud Fam Plann 1998;29:414-422.
17. Stanton C, Hobcraft J, Hill K, Kodjogbe N, Mapeta WT, Munene F, et al. Every death counts: measurement of maternal mortality via a census. BullWorld Health Organ 2001;79:657-664.
18. World Development Indicators 2006. Washington, DC: The World Bank; 2006.
19. WHO mortality database: tables. Geneva: WHO; 2007 (http://who.int/healthinfo/morttables).
20. UNICEF maternal health database (http://www.childinfo.org/eddb/maternal.htm).
21. UNPD World Population Prospects, 2004 Revision. New York: United Nations Population Division; 2005.
22. Mathers CD, Ma Fat D, Inoue M, Rao C, Lopez AD. Counting the dead and what they died from: an assessment of the global status of cause of death data. Bull World Health Organ 2005;83:171-177.
23. Hill K, Thomas K, AbouZahr C, Walker N, Say L, Inoue M, Suzuki E on behalf of the Maternal Mortality Working Group. Estimates of maternal mortality worldwide 1990 to 2005: an assessment of available data. Lancet (in press).
24. Stanton C, Abderrahim N, Hill K. An assessment of DHS maternal mortality indicators. Stud Fam Plann2000; 31:111-123.
25. Hill K, AbouZahr C, Wardlaw T. Estimates of maternal mortality for 1995. Bull World Health Organ2001;79:182-193.
26. Bulatao RA, Ross JA. Which health services reduce maternal mortality? Evidence from ratings of maternal health services. Trop Med Int Health2003;8:710-721.
27. Matthews Z. Maternal mortality and poverty. London: DFID Resource Centre for Sexual and Reproductive Health; 2002.
28. Cook CT. The effects of skilled health attendants on reducing maternal deaths in developing countries: testing the medical model. Eval Program Plann2002;25:107-116.
REFERENCES

Maternal Mortality in 2005
40 29. Betrán AP, Wojdyla D, Posner SF, Gülmezoglu AM. National estimates for maternal mortality: an analysis based on the WHO systematic review of maternal mortality and morbidity. BMC Public Health 2005;5:131.
30. Shen C, Williamson JB. Maternal mortality, women’s status, and economic dependency in less developed countries: a cross-national analysis. Soc Sci Med1999;49:197-214.
31. Anand S, Barnighausen T. Human resources and health outcomes: cross-country econometric study. Lancet 2004;364:1603-1609.
32. Sloan NL, Winikoff B, Fikree FF. An ecologic analysis of maternal mortality ratios. Stud Fam Plann2001;32:352-355.
33. Paxton A, Maine D, Freedman L, Fry D, Lobis S. The evidence for emergency obstetric care. Int J Gynaecol Obstet 2005;88:181-193.
34. WHO. Skilled attendant at birth 2006 updates.Geneva: WHO; 2006 (Department of Reproductive Health and Research).
35. The Millennium Development Goals Report 2007.New York: United Nations; 2007.
36. Key actions for the further implementation of the Programme of Action of the International Conference on Population and Development. Adopted by the Twenty-first Special Session of the United Nations General Assembly. New York: United Nations; 1999. UNFPA; 1999 (para. 64).
37. Hogberg U, Wall S, Brostrom G. The impact of early medical technology on maternal mortality in late 19th century Sweden. Int J Gynaecol Obstet 1986;24:251-261.
38. Loudon I. Death in childbirth. An international study of maternal care and maternal mortality 1800-1950.London: Oxford University Press, 1992.

For more information, please contact:
Department of Reproductive Health and ResearchWorld Health OrganizationAvenue Appia 20, CH-1211 Geneva 27SwitzerlandFax: +41 22 791 4171E-mail: [email protected]/reproductive-health