MASTER’S THESIS - Chalmers Publication Library...
51
Transcript of MASTER’S THESIS - Chalmers Publication Library...


MASTER’S THESIS 2006:54
Sorting of Seeds by Hydrochory
SIMON CHAMBERT
Department of Civil and Environmental Engineering Division of Water Environment Technology
CHALMERS UNIVERSITY OF TECHNOLOGY Göteborg, Sweden 2006
Sorting of Seeds by Hydrochory
SIMON CHAMBERT © SIMON CHAMBERT, 2006 Master’s Thesis 2006:54 Department of Civil and Environmental Engineering Division of Water Environment Technology
CHALMERS UNIVERSITY OF TECHNOLOGY SE – 41296 Göteborg Sweden Telephone: +46(0)31-772 1000 Web: www.wet.chalmers.se Cover: Trapping of African Daisy seeds by modelled vegetation in a laboratory Chalmers Reproservice / Department of Civil and Environmental Engineering Göteborg, Sweden 2006

Department of Civil and Environmental Engineering Division of Water Environment Technology – Chalmers University of Technology
Sorting of seeds by hydrochory
- i –
Sorting of Seeds by Hydrochory SIMON CHAMBERT Department of Civil and Environmental Engineering Division of Water Environment Technology Chalmers University of Technology
ABSTRACT
Vegetation along rivers is an important feature affecting the functioning of the entire riverine ecosystem. The structure of riparian vegetation is shaped to a considerable degree by the dispersal of seeds by water, also known as hydrochory. Mostly buoyant seeds are transported by hydrochory, but non-buoyant seeds are also transported. A series of laboratory experiments were conducted on 8 different types of non-buoyant seeds to see if the theory used for sediment could apply to seeds. This study suggests that in water, seeds respond in a similar way to sediment and the tools used for sediment can be extended to seeds also. The key factor in the sorting of buoyant seeds by hydrochory (leading to spatial species differentiation) is usually considered to be the effect of potential duration of buoyancy, which has received much interest. The way seeds are distributed in rivers is strongly influenced, however, by their hydrodynamic properties, such as size, shape and density. A series of laboratory experiments were conducted to investigate qualitatively how 5 different types of buoyant seeds with different morphologies react to different hydraulic conditions. Opportunities for sorting during hydrochory occur during the processes of transport and deposition. Sorting of seeds during transport was investigated by observing the destinations of the different seed types in a laboratory channel containing different morphological features. These experiments showed that little significant sorting of the seeds resulted from the flow patterns associated with channel form. The influence of wind during transport was shown to be important, however, with lower density seeds drifting more than higher denser ones. The sorting of seeds during deposition within artificial emergent vegetation and on sloping channel banks was also investigated. Low density seeds moving through vegetation were more easily trapped by the stems than higher density ones. The seed shape, particularly their flatness and sharpness, was also shown to be an important factor influencing trapping. The amount of deposition on sloping banks during flow recession was shown to be greater for the heavier and bigger seeds, with the lightest and smallest ones being maintained in the flow. The investigations suggest sorting of seeds by size, shape and density is more significant during deposition than during transport.
Keywords: seed dispersal, buoyant seed, non-buoyant seeds, sorting of seeds, riparian vegetation

Department of Civil and Environmental Engineering Division of Water Environment Technology – Chalmers University of Technology
Sorting of seeds by hydrochory
- ii –
ACKNOWLEDGMENTS
I would like to express my sincere gratitude to my supervisor, Professor Chris James for his support, teachings and patience throughout the duration of this project. I also would like to thanks my co-supervisor Lars Bergdahl for his helpful advice.
The work communicated in this report was partly funded by the Centre for Water in the Environment of Johannesburg (South Africa) and by the Association des Ingénieurs de l’N7 de Toulouse (France). I wish to acknowledge my appreciation for the received assistance.
Grateful acknowledgment is manifested to the researchers of the Centre for Water in the Environment for their advices and to the technicians of the Department of Civil Engineering for their assistance in setting up the experiments.
Finally my deepest gratitude goes to my parents and sisters for their support during my graduate studies.

Department of Civil and Environmental Engineering Division of Water Environment Technology – Chalmers University of Technology
Sorting of seeds by hydrochory
- iii –
Table of Contents
1. INTRODUCTION ................................................................................................................1
2. LITERATURE SURVEY ....................................................................................................1
2.1. Introduction...................................................................................................................................1
2.1. Riparian vegetation .......................................................................................................................1
2.2. Dispersal of plants ........................................................................................................................2
2.3. Hydrochory in river systems.........................................................................................................3
2.3.1. Introduction ...........................................................................................................................3 2.3.2. Impact of flotation characteristics .........................................................................................4 2.3.3. Impact of shape and size characteristics................................................................................4 2.3.4. Impact of hydrologic regime .................................................................................................5 2.3.5. Impact of geomorphology and hydraulics .............................................................................5 2.3.6. Impact of density of vegetation and wood debris..................................................................6
2.4. Objectives .....................................................................................................................................6
3. CONCEPTUAL MODEL....................................................................................................7
3.1. Introduction...................................................................................................................................7
3.2. Life of a water-dispersed seed ......................................................................................................7
3.3. Conceptual model .........................................................................................................................8
4. HYDRAULIC PROPERTIES OF SEEDS.........................................................................9
4.1. Introduction...................................................................................................................................9
4.2. Seeds characteristics .....................................................................................................................9
4.2.1. Seed size ................................................................................................................................9 4.2.2. Seed mass and density ...........................................................................................................9 4.2.3. Seed shape ...........................................................................................................................11
4.3. Results and discussion ................................................................................................................11
5. HYDROCHORY OF NON-BUOYANT SEEDS.............................................................12
5.1. Introduction.................................................................................................................................12
5.2. Settling velocity of seeds ............................................................................................................12
5.2.1. Introduction .........................................................................................................................12 5.2.2. Modelling settling velocity of seeds....................................................................................13 5.2.3. Experimental procedure.......................................................................................................14 5.2.4. Results and discussion.........................................................................................................14
5.3. Entrainment of seeds...................................................................................................................15
5.3.1. Introduction .........................................................................................................................15
Department of Civil and Environmental Engineering Division of Water Environment Technology – Chalmers University of Technology
Sorting of seeds by hydrochory
- iv –
5.3.2. Modelling entrainment conditions of seeds.........................................................................16 5.3.3. Experimental procedure.......................................................................................................16 5.3.4. Calibration of the Preston tube ............................................................................................17 5.3.5. Results and discussion.........................................................................................................18
5.4. Discussion...................................................................................................................................20
6. SORTING OF BUOYANT SEEDS BY HYDROCHORY .............................................20
6.1. Introduction.................................................................................................................................20
6.2. Sorting of buoyant seeds during transport ..................................................................................20
6.2.1. Geomorphology...................................................................................................................20 6.2.1.1. Introduction ..................................................................................................................20 6.2.1.2. Experimental procedure ...............................................................................................21 6.2.1.3. Results and discussion..................................................................................................21
6.2.2 Vegetation.............................................................................................................................22 6.2.2.1. Introduction ..................................................................................................................22 6.2.2.2. Experimental procedure ...............................................................................................22 6.2.2.3. Results and discussion..................................................................................................23
6.2.3 Wind .....................................................................................................................................23 6.2.3.1. Introduction ..................................................................................................................23 6.2.3.2. Experimental procedure ...............................................................................................23 6.2.3.3. Results and discussion..................................................................................................24
6.3. Sorting of buoyant seeds during deposition................................................................................24
6.3.1. Vegetation............................................................................................................................24 6.3.1.1. Introduction ..................................................................................................................24 6.3.1.2. Experimental procedure ...............................................................................................24 6.3.1.3. Results and discussion..................................................................................................25
6.3.2. Slope....................................................................................................................................26 6.3.2.1. Introduction ..................................................................................................................26 6.3.2.2. Experimental procedure ...............................................................................................26 6.3.2.3. Results and discussion..................................................................................................27
6.4. Discussion...................................................................................................................................27
7. CONCLUSIONS AND RECOMMENDATIONS ...........................................................28
BIBLIOGRAPHY...................................................................................................................29
APPENDIX A: DESCRIPTION OF THE FLUMES................................................................ I
APPENDIX B: RESULTS .......................................................................................................II
APPENDIX C: PRESTON TUBE CALIBRATION ............................................................. VI

Department of Civil and Environmental Engineering Division of Water Environment Technology – Chalmers University of Technology
Sorting of seeds by hydrochory
- v –
List of Figures Figure Page
Figure 1: Scheme of different dispersal characteristics 4 Figure 2: Release of seeds 7 Figure 3: Secondary arrival to water 7 Figure 4: Transport by water 8 Figure 5: Deposition of seeds 8 Figure 6: Conceptual model 8 Figure 7: Example of seed size measurement 9 Figure 8: Pictures of the seeds used in this study 10 Figure 9: Dimensionless size effect on Dietrich’s formula accuracy 14 Figure 10: Schematic diagram of experimental setup for entrainment characteristics 16 Figure 11: Preston tube measurements versus micropropeller meter measurements 18 Figure 12: Preston calibration chart 18 Figure 13: Results of the different type of seeds plotted in a Shields diagram 19 Figure 14: u*x/u*sversus dn/d50 19 Figure 15: Schematic diagram of experimental setup for geomorphology type 1 21 Figure 16: Schematic diagram of experimental setup for geomorphology type 2 21 Figure 17: Results geomorphology type 1 21 Figure 18: Results geomorphology type 2 21 Figure 19: Layout of artificial reed stems 22 Figure 20: Schematic diagram of experimental setup for partially vegetated channel 22 Figure 21: Results for partially vegetated channel 23 Figure 22: Layout of the experiment for wind 23 Figure 23: Seeds drifted by wind 23 Figure 24: Schematic diagram of experimental setup for fully vegetated channel 24 Figure 25: Percentage of seed trapped versus stem density of model vegetation 24 Figure 26: Schematic of a seed close to the rod 25 Figure 27: Picture of African Daisy seeds trapped 25 Figure 28: Picture of Marigold seeds trapped 25 Figure 29: Schematic diagram of experimental 26 Figure 30: Hydrograph of descending flow regime 26 Figure 31: Percentage of seeds deposited during water level recession 26

Department of Civil and Environmental Engineering Division of Water Environment Technology – Chalmers University of Technology
Sorting of seeds by hydrochory
- vi –
List of Tables Table Page
Table 1: List of the seeds used in the study 10 Table 2: Numerical values for different Powers’ roundness classes 11 Table 3: Summary of the seed characteristics of the different type of seeds used 12 Table 4: Comparison in terms of error between predicted settling velocities against data measured 15 Table 5: Roundness sensitivity analysis 15 Table 6: Type of roughness 15 Table 7: Preston tube calibration equations 17

Department of Civil and Environmental Engineering Division of Water Environment Technology – Chalmers University of Technology
Sorting of seeds by hydrochory
- vii –
List of Symbols
a Inner radius of Pitot tube A Cross-sectional area of seed Cd Drag coefficient of seed CSF Corey Shape Factor dn Nominal diameter of seed d50 Median grain size of bed material D*
Dimensionless seed diameter Fd Drag force exerted by water Fe Total erosive force Fg Gravitational force Fg Downward force weight component g Gravitational acceleration h Height of the centre of the Preston tube above theoretical bed ks Bed roughness K1 Proportionality factor for the magnitude of the downward force weight K2 Proportionality factor K3 Constant for the Karman-Prandtl equation li Intermediate seed’s size ll Orthogonal long seed’s size ls Short seed’s size ms+w Mass of the pyctometer containing seeds and filled with water mw Mass of the pyctometer filled with water ns Number of seeds r2 Correlation coefficient Re
* Erosive Reynolds number u Local velocity u* Shear velocity u*x Experimental critical shear stress
u*s Critical shear stress equivalent obtained from Shields diagram reading
V Volume of seed wex Experimental settling velocity of seed ws Settling velocity of seed wth Dietrich’s settling velocity prediction W* Dimensionless settling velocity y Height above theoretical bed
eθ Dimensionless shear stress
∆P Dynamic pressure
1ε Error between experimental and theoretical settling velocities
Θs Average volume of a seed ρw Density of water ρs Density of seed υ Kinematic viscosity τ0 Bed shear stress
Department of Civil and Environmental Engineering Division of Water Environment Technology – Chalmers University of Technology
Sorting of seeds by hydrochory
- 1 –
1. Introduction Rivers have ecological, economical, social and cultural significance. Currently there is increasing competition for use of surface waters, within and between consumptive and environmental uses. At the same time, there is also abundant evidence that many rivers are in poor condition, and their condition continues to deteriorate. This situation has led to an increasing level of interest and high community aspiration in river management. However, action is limited by major knowledge gaps, and by a lack of tried and tested methods for river protection and restoration. Understandably, these knowledge gaps hinder community capacity and confidence to act. The vegetation along rivers is very fragile and performs a vital link between land and water ecosystems, so it is very important to manage this zone. Vegetation along rivers is of great importance for the entire aquatic ecosystem. Vegetation is directly related to the hydrological, geomorphological, chemical and biological processes that occur along the river. Thus it seems important to define and quantify the different processes by which vegetation colonizes and establishes along the river. Wind dispersal, animal dispersal and water dispersal of seeds and vegetative portions of the plant are the different processes necessary for the vegetation colonization along rivers. The dispersal of seeds is one of the important processes that shape vegetation communities along rivers. The interaction of processes underlying seed dispersal in river systems is poorly understood at present, and little directly applicable information is available in the literature. However, many of the relevant vegetation dynamics and sedimentary transport processes have been studied in great detail in different contexts and in isolation. This study proposes to identify and study the different processes that occur during the dispersal of seeds. The output could have applications for river flow and habitat management as well as biodiversity and vegetation development.
2. Literature Survey
2.1. Introduction
Numerous studies have been done linking riparian vegetation types to fluvial geomorphology. Some biologists have been studying the distribution of some species along rivers. So far, few experimental studies were done regarding the dispersal of seeds. This literature review was undertaken to identify and review the different topics that might be appropriately integrated to develop understanding of the interaction between seed dispersal and river characteristics such as hydraulics, hydrology and geomorphology. The survey begins with an overview of the importance of riparian vegetation for an aquatic ecosystem. Attention is then focussed on the different types of dispersal that can occur in the colonization of vegetation along river and particularly on the dispersal of seeds by water.
2.1. Riparian vegetation
The riparian zone is commonly defined as the narrow strip of land forming a transition between the aquatic and the terrestrial ecosystem (van Coller and Rogers, 1995). Plants that grow in this zone are called riparian vegetation.

Department of Civil and Environmental Engineering Division of Water Environment Technology – Chalmers University of Technology
Sorting of seeds by hydrochory
- 2 –
Riparian vegetation is of particular concern because it has considerable environmental benefits to an aquatic ecosystem. Vegetation cover is known to increase bank stability. Thorne (1990) found that the roots of riparian trees and shrubs help to hold streambanks in place. By anchoring into the soil, the roots reinforce the soil matrix by transferring the stress from the roots to the soil and eventually increase the overall shear strength of the matrix. The above ground part of the vegetation also prevents erosion (Smith, 1976; Andrews, 1984). Indeed, some of the roots jut out from the river bank. This has the effect of increasing the roughness of the bank and hence decreasing the shear stress on the bank and hence erosion. Sediments and pollutants are trapped, reducing the turbidity and keeping the water clean (Lawrance et al., 1988; Tsujimoto & Kitamura, 1999). Riparian vegetation also has an important impact on the hydraulics of the river. Directly, vegetation offers local resistance to flow. This is attributed mainly to three causes, viz. reduction of the flow area, increase in roughness of the bed and the generation of turbulence by oscillatory movements (Starosolsky, 1983). Indirectly, the trunks and branches of dying or uprooted trees fallen into the river slow the flow of water. During high stream flows, riparian vegetation slows and dissipates floodwaters. This prevents erosion that damages fish spawning areas and aquatic insect habitats. Finally, the riparian vegetation also has an important place for providing habitats for aquatic and terrestrial wildlife. Large snags create fish and invertebrate habitat by forming pools and riffles in the stream (Large and Prach, 1999). Riparian vegetation provides food, nesting, and hiding places for these animals. Riparian vegetation is thus of great importance for the aquatic ecosystem. It is important to understand its dynamics in order to improve the management of the riparian zone. Riparian vegetation dynamics is complex since hydrological, hydraulics, geomorphological, chemical and biological processes all interact in a complex matrix. The interactions of the hydrological processes of the river with the topography appear to be the most influential among the factors that could affect riparian vegetation dynamics (Hupp and Ostrekamp, 1985). The different resultant hydrogeological processes include flood disturbance, erosion and sediment deposition, all of which vary in magnitude, frequency, and duration according to the seasonal and historical fluctuations in river flow. It is not always practically feasible however to measure how these processes individually affect patterns of spatial distribution of the different species, as each process is often complex and difficult to control in the field. Riparian vegetation structure and dynamics not only depend on seed and propagule dispersal. Indeed, dispersal of seed is only one step of the chain which encompasses the reaching of the water body by the seeds, the transport of the seeds, the deposition at a suitable site, and finally the germination and the establishment.
2.2. Dispersal of plants
Till the last decade, most of the studies were focused on the sessile stage of the life cycle of plants. Thus, the zonation of riparian vegetation according to bank elevation and hydrologic effects has been studied in great detail (Simon & Collison 2002). However the definition and quantification of the processes by which vegetation reaches, colonizes and establishes within the riparian zones is a subject that has, until recently, largely been ignored. The dispersal of plants, whether by seeds or by vegetative portions, is one of very great importance in its bearing on the distribution of plants throughout the world (Ridley, 1930). Plants are mobile only during their juvenile phase. During this phase, they can be dispersed under many forms and by many mechanisms. These different forms can be seeds directly but also spores, bulbs, rhizomes, fruits and other fragments of the vegetative parts of plants such as uprooted plant. These forms are called

Department of Civil and Environmental Engineering Division of Water Environment Technology – Chalmers University of Technology
Sorting of seeds by hydrochory
- 3 –
propagules. Propagules may be dispersed by many mechanisms; they can be deposited just close to the parents or dispersed over short or long distances by wind, animal or water. Plants vary widely in their ability to reproduce themselves. Some can produce large numbers of seeds, but most will perish, through not reaching a suitable spot for germination and development or dying before reaching the suitable spot (Ridley, 1930; Karrenberg et al, 2002). On the contrary, a plant producing few seeds can be more successful in establishing itself. Thus the effectiveness of vegetation propagation depends not only on the number of seeds produced but also on the vacant space suitable for its growth and its facilities for dispersal. One degree of complexity in the dispersal of plants is that some plants can be dispersed by more than one mechanism. Ridley (1930) observed that seeds of such plants as the Foxglove are blown by the wind to some distance. When they fall they are then further dispersed from the plant by rain-wash or by water. Thébaud and Debussche (1991) show that samara bearing species, adapted for wind dispersal, is successful at dispersing by water during flood events. Naiman and Décamps (1997) however, note that animal dispersal (zoochory) and wind dispersal (anemochory) may some times be more important than water dispersal (hydrochory) in riparian corridors, but that little empirical data exist for comparison.
2.3. Hydrochory in river systems
2.3.1. Introduction
The definition of “hydrochory” given by Van Der Pjil (1969) is the “transport of organic matter by water”. The fact that plants are only mobile during the juvenile phase of their life history constrains the species richness of a riparian zone by dispersal. It is now recognized that dispersal of seeds represents the primary means by which riparian zone is colonized by new species (Skoglund, 1990; Nilsson et al., 1994, Hugues and Cass, 1997). Since wind dispersal may occur over relatively short distance and in all directions, hydrochory may have an important role in structuring the riparian plant communities. Indeed dispersal by water is directional and downstream, thus, rivers function as corridors for plant dispersal (Johansson et al. 1996). Moreover, hydrochory can provide a supply of seeds and propagules from a long distance upstream playing its important role in the maintenance of high diversity in riparian plant communities (Andersson et al. 2000a , Johansson et al. 1996, Nilsson et al. 1994). Goodson et al. (2002) found in the seed bank of the River Dove, UK, two species which are characteristic species of mountain rocks which confirm the long-distance potential transport. Nilsson et al. (1994) have shown that species richness of water dispersed seeds increases as a function of stream order and discharge. The complexity of hydrochory is that not only seeds are dispersed but other propagule as well such as spore, bulbs, rhizomes, fruits and other fragments of the vegetative parts of plants. Propagules are usually much bigger than seeds and may behave differently in water. For example they may be trapped more easily by vegetation than seeds and they are more likely to establish successfully in water (Cook 1985). Thus for example, fruits can be dispersed by water initially and then release seeds which will be in turn be dispersed by water. The sorting of seeds by flowing water is a consequence of different seeds morphological characteristics and how they react to different stressors. Many factors can affect the sorting of water-dispersed seeds along riparian zones and their final location such as the channel geomorphology of the river, the surface substrate, the presence of vegetation, the hydrologic regime, the hydraulic characteristics, and the quantity of seed released.

Department of Civil and Environmental Engineering Division of Water Environment Technology – Chalmers University of Technology
Sorting of seeds by hydrochory
- 4 –
2.3.2. Impact of flotation characteristics
One feature of seed dispersal compared with the well-studied sediment dispersal is buoyancy. Seeds can be subdivided into two classes (Fig. 1), non-buoyant seeds and buoyant seeds. Seeds are organic matter and will absorb water; hence non-buoyant seeds which are dispersed in the water will absorb a certain amount of water that will change their density. Among the buoyant class the phenomena of absorbance is the same; some are wettable and will sink after being water-logged and some are unwettable and will remain buoyant. The scheme shown in Figure 1 presents the different classes which have different dispersal characteristics. The potential duration of buoyancy relative to the actual time spent in water might be critical for successful dispersal for several reasons. First, seeds can absorb so much water that they can become water-logged and sink or their germinating power is destroyed by the infiltration of water (Ridley 1930). Thus, the viability of seeds is directly linked with the time spent in water and the time spent will have an influence on the probability of active growth and establishment after transport and deposition. Second, the patterns of transport and deposition between buoyant seeds and non-buoyant seeds will be considerably different. The floating characteristic is usually due to a low specific weight of the seed. This is achieved by two mechanisms which are a low tissue density and some air trapped between the cotyledons (van der Pjil, 1969). Nevertheless, another possibility for floating is that small seeds take advantage of surface tension to remain buoyant. The potential duration of buoyancy is correlated with the permeability and the thickness of the seed coat (Nobel, 1991). Seeds which are too heavy to float in water and sink soon after they fall in can be dispersed as well. To date, the importance of floating ability in the dispersal of seeds has not been assessed in great detail. Indeed it would be easy to expect long-floating seeds to be dispersed over a longer distance than short-floating seeds. Van den Broek et al. (2005) collected seeds of 55 freshwater wetland species and related degree of buoyancy to distribution of species. Their results showed that seed buoyancy enhances aquatic seed dispersal. Nilsson and Danvind (1997) also addressed this hypothesis. In studies of Swedish rivers, distribution of downstream plants and floating capacity of seed were measured. No relationship appeared in their data between floating ability and distribution of species along the river. This result can be explained by the fact that floating ability is only one aspect of seed dispersal.
2.3.3. Impact of shape and size characteristics
To our knowledge, the influence of shape of seeds on dispersal has never been investigated in detail. Schneider and Sharitz (1988) observed that the frequency of small angular cypress seeds trapped by protruding roots was higher than for the larger ellipsoid tupelo fruits. The shape, in a way analogous to the sediment transport, can have an effect in all the stages of seed dispersal: entrainment, transport, and deposition. The shape and size of the seeds is expected to play an
Figure 1: Scheme of different dispersal characteristics
Department of Civil and Environmental Engineering Division of Water Environment Technology – Chalmers University of Technology
Sorting of seeds by hydrochory
- 5 –
important role in entrainment and deposition since some shapes may be entrained more easily on some substrates than others. The shape and size can play a role as well in the transport of seeds. Indeed, the non-buoyant seeds and the water-logged seeds are transported in the water in suspension or by bed-load transport. The settling velocity of the particles is a critical variable influencing the mode, rate and distance of transport (Dietritch, 1982). Size and shape influence the settling velocity.
2.3.4. Impact of hydrologic regime
Seeds and propagules may be deposited close to the parent plant or dispersed over short distances by wind or rain wash. During the flow season, when the level of the water rises, a high number of seeds and propagules accumulated in the floodplain may be entrained (Cellot et al., 1998). Moreover, the riparian corridor where seeds are deposited is frequently disturbed by floods and debris flows. Thus, a high number of seeds and propagules should be remobilised during flood events. Cellot et al. (1998) measured ascending and descending limb concentrations of hydrochores (seeds/m3) over the course of a hydrograph peak on the Rhone River in France and found pre-peak levels to be six times those measured following peak flow. The timing of such events is very important. For instance, in tropical forests, seeds are dispersed during the rainy season by flooding but this is generally followed by a drier period. Such alternating wet and dry conditions pose severe constraints on the timing of seed dispersal for establishing seedlings (Rand 2000; Lopez 2001). Many species produce their seeds during a specific season which should synchronize with the timing of hydrological events in order to be dispersed successfully (Kubitzki and Ziburski, 1994).
2.3.5. Impact of geomorphology and hydraulics
Geomorphology is an important aspect of river systems. Directly, the geomorphology of a river may affect the deposition of seeds. Vegetation patterns have been found to be associated with the morphological units of channel bars, channel shelves, the floodplain and terrace (Hupp & Osterkamp, 1985). Flow patterns may influence where seeds are deposited along rivers. Andersson et al. (2000a) observed that wooden cubes used to mimic seeds were deposited in greater numbers in “eddies downstream from rapids and along some outer curves of slow glides” following their release on the Sävar River in Sweden. Johansson and Nilsson (1993) observed that vegetative diasporas of Ranunculus lingua were mainly dispersed to river curves and obstacles. Hydraulics is of major importance, and it can be expected that areas of reduced flow velocity should correspond more to deposition area whereas area of high velocity should correspond to entrainment and transport. Work by Goodson et al. (2002) showed that there was an increasing influence of hydrochory on the species composition of the seed bank with decreasing elevation. They did this by dividing the bank profile between three levels, low, mid and top. Sediment sampling in different section of the river revealed that there were more seeds deposited by hydrochory in the lower part than in the top part. This phenomenon is due to the fact that top part is less frequently inundated than the lower part. Indirectly, geomorphology may affect the dispersal of buoyant seeds. Along tranquil reaches of river, and particularly on wide rivers, seed deposition may be influenced by wind and wind generated waves, which wash seeds ashore (Nilsson et al., 1994).
Department of Civil and Environmental Engineering Division of Water Environment Technology – Chalmers University of Technology
Sorting of seeds by hydrochory
- 6 –
2.3.6. Impact of density of vegetation and wood debris
Vegetation is an integral feature of many rivers and has a strong interaction with local hydraulics and sediment dynamics (James et al., 2002). There has been no investigation into seed deposition in and surrounding vegetation. Nevertheless, the stem density of vegetation may affect the dispersal of seeds in two ways. First, the vegetation offers a resistance to the flow and entails a decrease in the bed shear stress. This decrease leads to deposition inside and behind the vegetation zone. Tsujimoto and Kitamura (1999) observed accumulation of sediment around vegetation zones in rivers. This phenomenon for sediment also might apply to seeds. Second, the vegetation could trap non-buoyant seeds and buoyant seeds. This phenomenon has already been observed for sediment. Elliot (2000) observed that a significant amount of fine sediments were trapped by leaves and stems of the vegetation. Indirectly, debris of wood can also accumulate along the river forming a permeable obstruction. Logs and debris may provide storage site for seeds. Schneider and Scharitz (1988) observed that seeds of Taxodium distichum (bald cypress) and Nyssa aquatica (water tupelo) were concentrated after transport by water non randomly against logs and other emergent substrates. Kollmann et al. (1999) observed that the fine sediment which accumulates around large woody debris in the alpine river Tagliamento contained a considerable number of seeds.
2.4. Objectives
The literature survey has shown that dispersal of seeds is an important factor in shaping the structure of riparian plant communities. It is recognized to be the main factor by which vegetation reaches, colonizes and establishes within riparian zones. Dispersal limitation may constrain the (re)establishment of target species in fragmented landscapes, especially in restored or newly created habitats lacking a viable propagule bank (Bischoff 2002, Middleton 2002). Understanding which factors control the complexity of riparian communities is a high priority if we are to slowdown the impoverishment of the natural variety. Knowledge of dispersal of seeds by water may increase our understanding of the dispersal capabilities and sorting by hydrochory, although it does not address adequately plant dispersal patterns at broader scale. Nevertheless defining and quantifying the processes of hydrochory, as one of the processes among the colonization of species along rivers, may help to understand why different species colonize different areas. Three important processes were highlighted in the patterns of seed dispersal: Entrainment, transport and deposition. Little is currently known about these processes and how they control riparian vegetation distribution. Geomorphologic factors, hydraulic characteristics and vegetation cover are important factors influencing those processes. The characteristics of seed deposition patterns may be sorted by size, shape, density, and settling velocity. Hydrochory plays a central role in the structuring of the riparian community. Despite the difficulty of studying dispersal of seeds in-situ, few studies have experimentally addressed hydrochory. Hydrochory has usually been analysed by direct sampling of the water body or by examining the seed content of drift litter material or river bank sediment floods. The current study examines experimentally the individual effects of hydraulics, geomorphology, vegetation and wind on seed sorting.
Department of Civil and Environmental Engineering Division of Water Environment Technology – Chalmers University of Technology
Sorting of seeds by hydrochory
- 7 –
3. Conceptual model
3.1. Introduction
Chapter 1 has outlined the aims of the project, namely to develop a framework to study the dispersal of seeds along rivers through examining the interaction of the different processes and their effect on sorting of seeds. Without understanding of the processes, which are responsible for dispersal patterns, it is not possible to understand the dispersal of seeds.
In order to summarize and clarify the different processes and their place of occurrence, a conceptual model is defined. A conceptual model is a “written description and visual representation of predicted relationships between ecological entities and the stressors to which they may be exposed” (Environmental Protection Agency, 1998). The conceptual model highlights what is known and not known and provides a framework for prediction.
3.2. Life of a water-dispersed seed Water-dispersed seeds can take a lot of different pathways from the release from their parent plants to their final deposition. The combination of the different disturbances addressed in Part 1 will affect the pattern of dispersal. It is important to see when these disturbances occur and how they would affect the sorting of seeds by hydrochory.
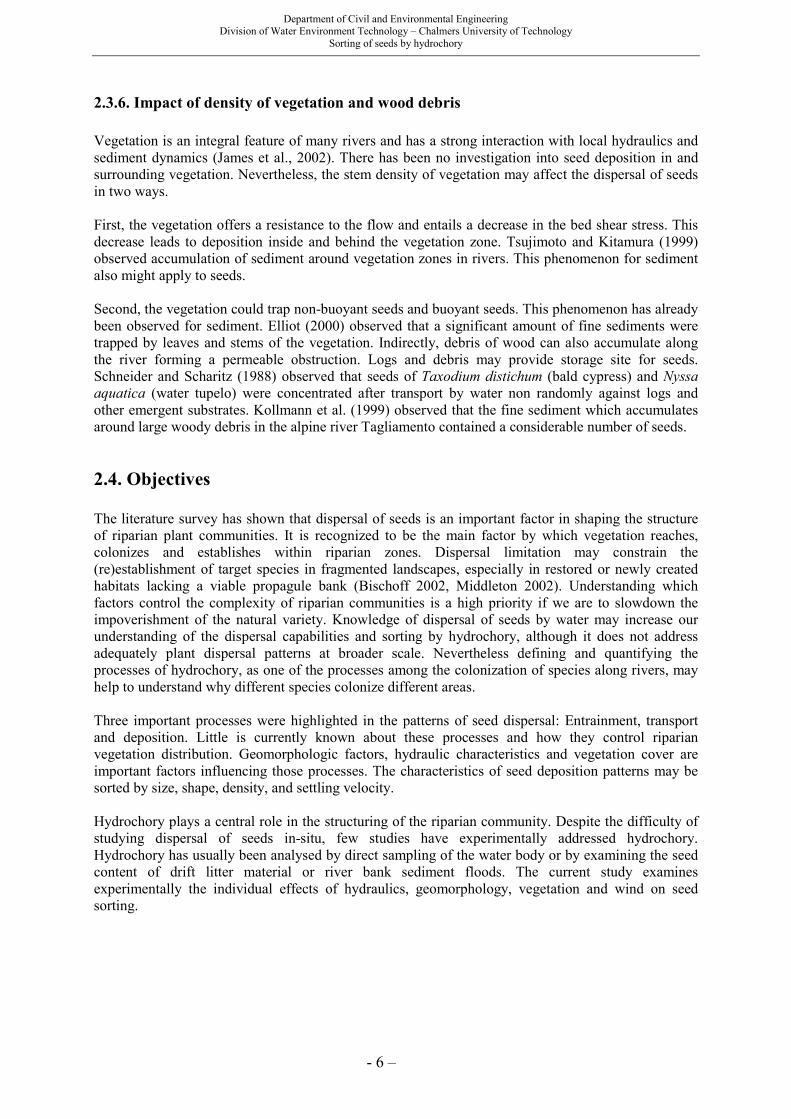
The first stage in the dispersal of seeds is the release of seeds by the parent plant. Seeds fall by gravity in the surroundings of the plant. They can be deposited directly in the water, ready to be dispersed, or they can be deposited on the ground (Fig. 2).
Figure 2: Release of seeds
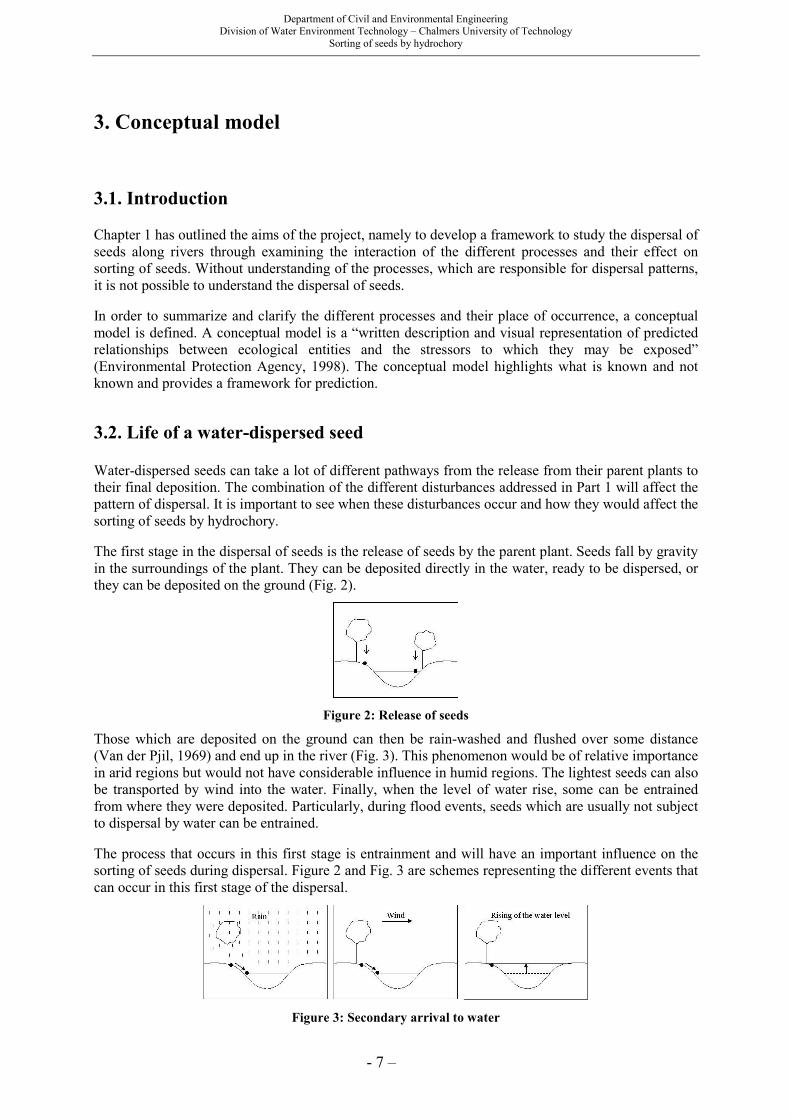
Those which are deposited on the ground can then be rain-washed and flushed over some distance (Van der Pjil, 1969) and end up in the river (Fig. 3). This phenomenon would be of relative importance in arid regions but would not have considerable influence in humid regions. The lightest seeds can also be transported by wind into the water. Finally, when the level of water rise, some can be entrained from where they were deposited. Particularly, during flood events, seeds which are usually not subject to dispersal by water can be entrained.
The process that occurs in this first stage is entrainment and will have an important influence on the sorting of seeds during dispersal. Figure 2 and Fig. 3 are schemes representing the different events that can occur in this first stage of the dispersal.
Figure 3: Secondary arrival to water
Department of Civil and Environmental Engineering Division of Water Environment Technology – Chalmers University of Technology
Sorting of seeds by hydrochory
- 8 –
Once the seeds are ready to be dispersed they are transported by currents (Fig. 4). The process that occurs for floating seeds is mainly transport but it can also be entrainment by waves or wind. The processes that occur for non-floating seeds are transport and entrainment.
Figure 4: Transport by water
After a while, the seeds can lose their momentum and be deposited directly on the river bank after having been floating or drifting (Fig. 5). They can be trapped by vegetation or be deposited with the decrease of the level of water. The process that occurs is deposition.
Figure 5: Deposition of seeds
3.3. Conceptual model
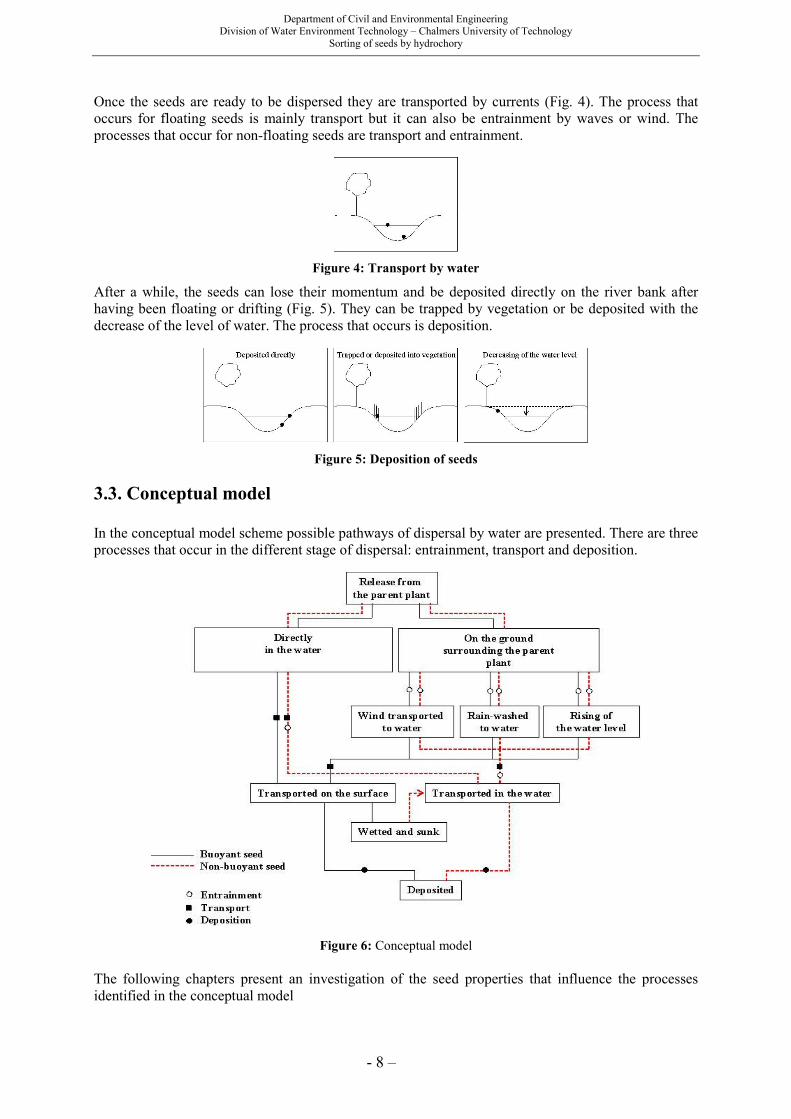
In the conceptual model scheme possible pathways of dispersal by water are presented. There are three processes that occur in the different stage of dispersal: entrainment, transport and deposition.
Figure 6: Conceptual model
The following chapters present an investigation of the seed properties that influence the processes identified in the conceptual model
Department of Civil and Environmental Engineering Division of Water Environment Technology – Chalmers University of Technology
Sorting of seeds by hydrochory
- 9 -
4. Hydraulic properties of seeds
4.1. Introduction
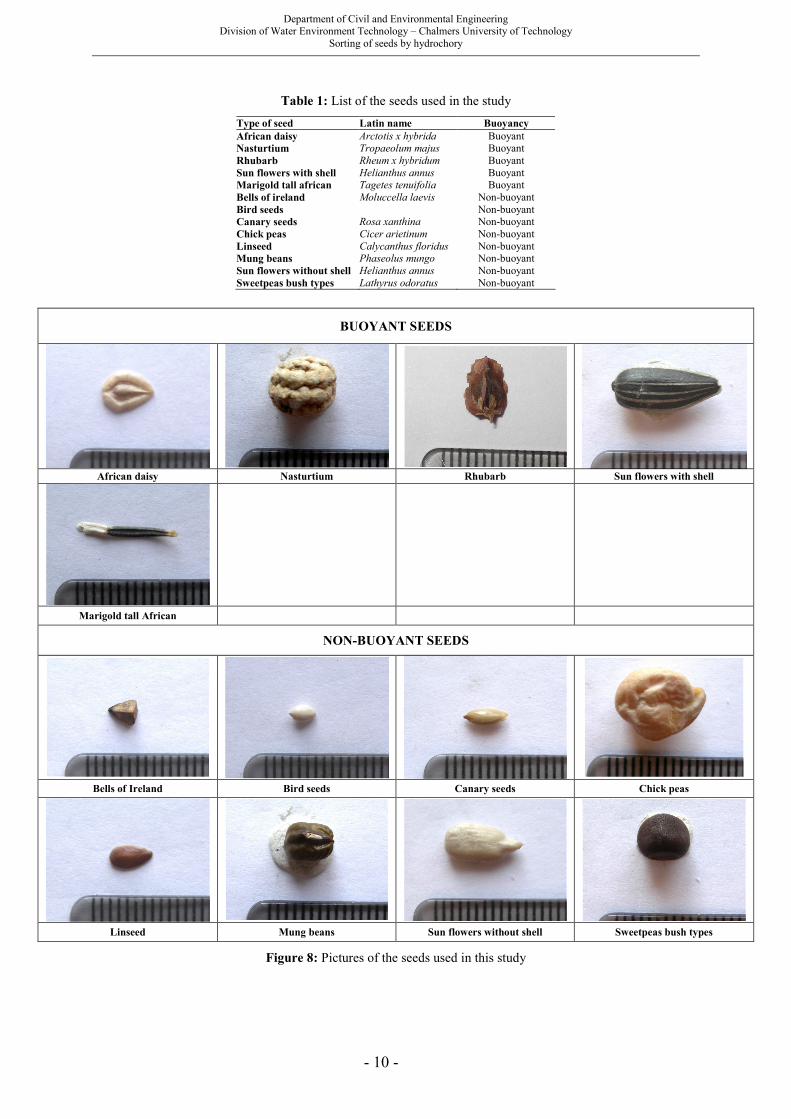
The entrainment, transport and deposition of seeds by water are controlled partly by the physical properties of seeds themselves and partly by those of the water. Entrainment of seeds from the bank or the bed where it rests is controlled not only by the seeds but also by the bulk seed properties which include seed orientation and porosity. During transport, seeds are sorted according to size, shape and density. Analysis of the seed size, shape and compositional characteristics may therefore provide important clues to the differences in seeds behaviour in water. In order to study these different characteristics and their influence on sorting seeds, 13 types of natural seeds were used for the experiments, 5 buoyant and 8 non-buoyant as shown in Table 1 and Figure 8 (next page). Given the fact that the experiment needed a large number of seeds, common seeds were used. The author is aware that the seeds chosen are not seeds that would necessarily be naturally dispersed by water but given the fact that the goal is to study the hydraulic characteristics of the seeds, it is unlikely that the use of these seeds would have resulted in conflicting outcomes. Moreover, Johannsson et al. (1996) observed that it was not necessary for a species to have well-developed morphological adaptations for water dispersal to have good dispersal abilities in water.
4.2. Seeds characteristics
4.2.1. Seed size
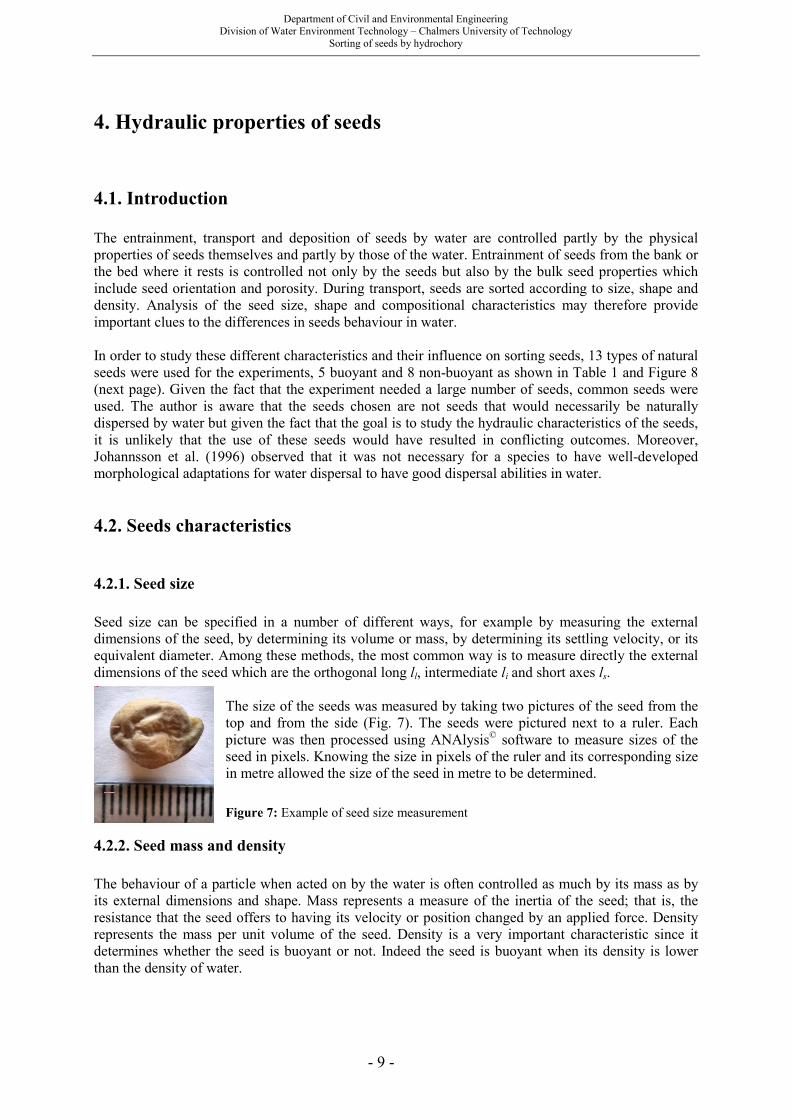
Seed size can be specified in a number of different ways, for example by measuring the external dimensions of the seed, by determining its volume or mass, by determining its settling velocity, or its equivalent diameter. Among these methods, the most common way is to measure directly the external dimensions of the seed which are the orthogonal long ll, intermediate li and short axes ls.
The size of the seeds was measured by taking two pictures of the seed from the top and from the side (Fig. 7). The seeds were pictured next to a ruler. Each picture was then processed using ANAlysis© software to measure sizes of the seed in pixels. Knowing the size in pixels of the ruler and its corresponding size in metre allowed the size of the seed in metre to be determined.
Figure 7: Example of seed size measurement
4.2.2. Seed mass and density
The behaviour of a particle when acted on by the water is often controlled as much by its mass as by its external dimensions and shape. Mass represents a measure of the inertia of the seed; that is, the resistance that the seed offers to having its velocity or position changed by an applied force. Density represents the mass per unit volume of the seed. Density is a very important characteristic since it determines whether the seed is buoyant or not. Indeed the seed is buoyant when its density is lower than the density of water.
Department of Civil and Environmental Engineering Division of Water Environment Technology – Chalmers University of Technology
Sorting of seeds by hydrochory
- 10 -
Table 1: List of the seeds used in the study
Type of seed Latin name Buoyancy
African daisy Arctotis x hybrida Buoyant Nasturtium Tropaeolum majus Buoyant Rhubarb Rheum x hybridum Buoyant Sun flowers with shell Helianthus annus Buoyant Marigold tall african Tagetes tenuifolia Buoyant Bells of ireland Moluccella laevis Non-buoyant Bird seeds Non-buoyant Canary seeds Rosa xanthina Non-buoyant Chick peas Cicer arietinum Non-buoyant Linseed Calycanthus floridus Non-buoyant Mung beans Phaseolus mungo Non-buoyant Sun flowers without shell Helianthus annus Non-buoyant Sweetpeas bush types Lathyrus odoratus Non-buoyant
BUOYANT SEEDS
African daisy Nasturtium Rhubarb Sun flowers with shell
Marigold tall African
NON-BUOYANT SEEDS
Bells of Ireland Bird seeds Canary seeds Chick peas
Linseed Mung beans Sun flowers without shell Sweetpeas bush types
Figure 8: Pictures of the seeds used in this study

Department of Civil and Environmental Engineering Division of Water Environment Technology – Chalmers University of Technology
Sorting of seeds by hydrochory
- 11 -
Table 2: Numerical values for different Powers’ roundness classes
Powers’ roundness class name Corresponding values
Very angular 0-1 Angular 1-2 Sub-angular 2-3 Sub-rounded 3-4 Rounded 4-5 Well rounded 5-6
The mass of each type of seed was determined by measuring the average mass of 100 seeds. The average volume Θs of a seed has been measured by putting ns seeds into a pyctometer and measuring the equivalent weight of water:
( ) 1.
m m mw s w s
s ns w
ρ
− −+Θ =
in which mw is the mass of the pyctometer filled by water, ms+w is the mass of the pyctometer with the ns seeds and filled with water, ms is the mass of the ns seeds and ρw is the volumic mass of water. Knowing the mass and the volume of the seed, it was then possible to determine the density of the seed.
4.2.3. Seed shape
Seed shape is defined here as all aspects of the external morphology of the seed, including the gross form, the roundness, and the surface texture. Some seed shapes can be described qualitatively in terms of resemblance to readily recognizable geometric shapes, such as spheres, spheroids, ellipsoids. However, such descriptive terms are subjective and do not give a quantitative description. In order to quantify the gross seed form, the Corey Shape Factor (CSF) will be used. Corey (1949) proposed a shape factor for grains, which is widely used in experimental studies, and which reflects the particle flatness:
s
l i
lCSF
l l=
in which ll is the orthogonal long size, li is the intermediate size and ls is the short size. Numerical values of the formula range from CSF=0 for a perfectly flat seed to CSF=1 for a perfect sphere. It is usually difficult to quantify it. Nevertheless, Powers (1953) (Table 2) proposed different roundness classes. Numerical values can be assigned to each Powers roundness class using the rho-scale conversion of Folk (1955) and which are widely used in sediment studies. The surface texture of the seed can be regarded as the degree of surface roughness or smoothness. It is hard to define and quantify it. Surface texture will not be addressed in this study since it is unlikely to have significant effect on hydrochory process.
4.3. Results and discussion
The morphological characteristics of the different seeds studied are listed in Table 3. The mass of the seeds chosen ranges from 0.0017 g/seed to 0.3859 g/seed. Their Corey Shape Factors range from 0.19 to 0.93. The non-buoyant seeds’ volumes range from 4.0 mm3 to 285.2 mm3 and their densities from 1018 kg.m-3 to 1468 kg.m-3. It should be noted that even though the chosen seeds do not cover the entire range of possible seed densities, sediments (which are non-organic) are usually much denser than seeds. Indeed the densities of the common minerals found in sediments range from 2000 kg.m-3 to 5000 kg.m-3 (Pye, 1994). Thus,

Department of Civil and Environmental Engineering Division of Water Environment Technology – Chalmers University of Technology
Sorting of seeds by hydrochory
- 12 -
Table 3: Summary of the seed characteristics of the different type of seeds used
Seed Type Buoyancy Mass Average
Diameter
Nominal
Diameter Volume
Corey
Factor ρ
(g/seed) (mm) (mm) (mm3) (kg m-3)
African daisy Buoyant 0.0017 3.9 1.9 10.4 0.19 167 Nasturtium Buoyant 0.1320 7.0 4.4 133.9 0.87 986 Rhubarb Buoyant 0.0169 5.0 2.5 23.7 0.54 713 Sun flowers with shell Buoyant 0.0576 7.1 3.8 85.2 0.43 676 Marigold tall African Buoyant 0.0034 4.6 1.4 4.2 0.15 807 Bells of Ireland Non-buoyant 0.0064 2.9 1.6 6.0 0.60 1072 Bird seeds Non-buoyant 0.0049 2.2 1.4 4.0 0.58 1228 Canary seeds Non-buoyant 0.0077 3.0 1.6 6.2 0.52 1240 Chick peas Non-buoyant 0.3859 9.6 5.7 285.2 0.78 1353 Linseed Non-buoyant 0.0071 2.9 1.5 5.7 0.22 1257 Mung beans Non-buoyant 0.0808 4.7 3.3 58.8 0.88 1374 Sun flowers without shell Non-buoyant 0.0478 5.3 3.1 46.9 0.37 1018 Sweetpeas bush types Non-buoyant 0.0897 5.8 3.4 61.1 0.93 1468 Sweetpeas bush types Non-buoyant 0.0897 5.8 3.4 61.1 0.93 1468
in general, non-buoyant seeds may be more easily transported than sediment for a given water flow rate. Measuring the size of the seeds illustrated the problem of defining a characterizing size for seeds. Indeed, because of the irregular shape of such particles, it is almost impossible to determine a characteristic diameter. Therefore the nominal diameter dn, defined as the diameter of a sphere with the same volume, was calculated. Table 3 also shows as well the average diameter which was calculated as the average of the three lengths measured (ll, li, ls). It can be seen how different the values of average diameter are from the values of nominal diameter. Nevertheless, it has been chosen that the nominal diameter would be used as the characteristic diameter throughout this study.
5. Hydrochory of non-buoyant seeds
5.1. Introduction Ridley (1930) noticed that only a few number of riparian species had non-buoyant seeds. Nevertheless, non-buoyant seeds may also be transported along streams, and particularly during flood events, non-buoyant seeds that are normally not dispersed by water are dispersed by hydrochory. Moreover as it has been noted in the previous chapter, some seeds have densities which are very close to the density of water. This implies that these seeds have an important transport potential. The distribution of non-buoyant seeds transported by water is governed by hydrologic factors. The transport of sediments by water is a very well studied subject. Thus, this chapter relates the transport of seeds in water to the hydraulic parameters describing fluid motion, by showing experimental evidence that the empirical relationships developed for uniform inorganic sediments are also appropriate for seeds.
5.2. Settling velocity of seeds
5.2.1. Introduction
The settling velocity of non-buoyant seeds is one of the key parameters in the study of seed transport since it influences the mode, rate and scale of suspended load transport and bed-load transport.
Department of Civil and Environmental Engineering Division of Water Environment Technology – Chalmers University of Technology
Sorting of seeds by hydrochory
- 13 -
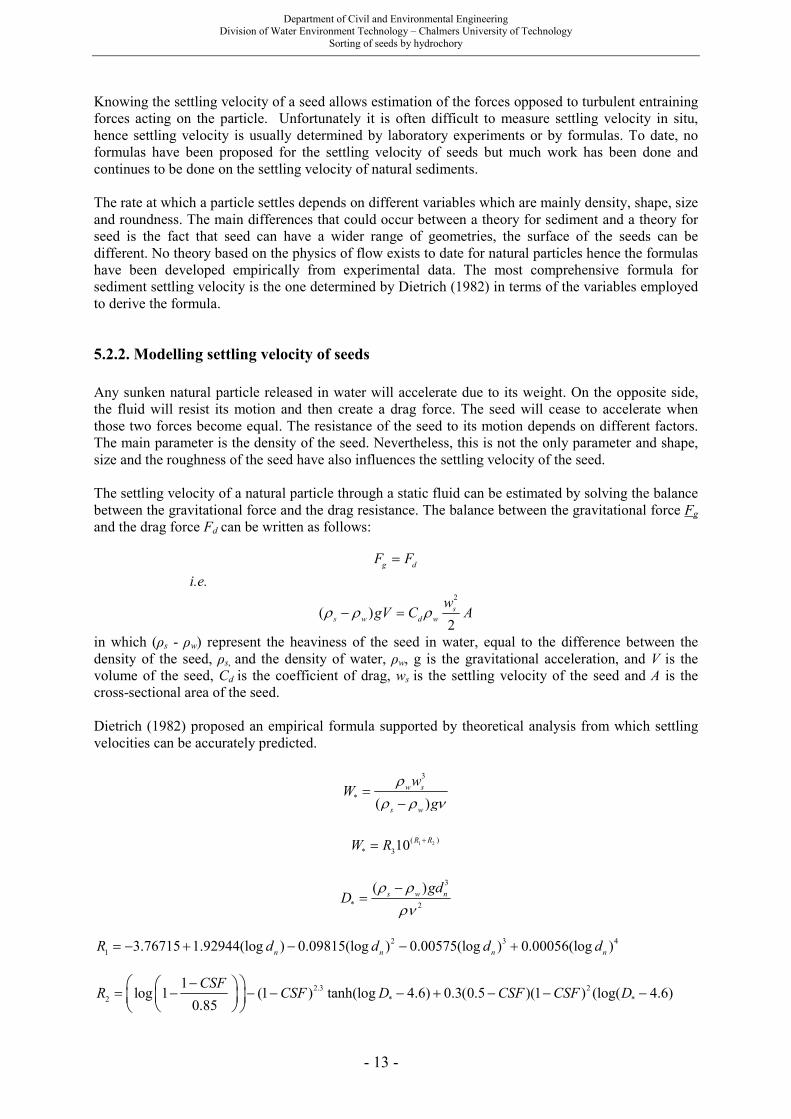
Knowing the settling velocity of a seed allows estimation of the forces opposed to turbulent entraining forces acting on the particle. Unfortunately it is often difficult to measure settling velocity in situ, hence settling velocity is usually determined by laboratory experiments or by formulas. To date, no formulas have been proposed for the settling velocity of seeds but much work has been done and continues to be done on the settling velocity of natural sediments. The rate at which a particle settles depends on different variables which are mainly density, shape, size and roundness. The main differences that could occur between a theory for sediment and a theory for seed is the fact that seed can have a wider range of geometries, the surface of the seeds can be different. No theory based on the physics of flow exists to date for natural particles hence the formulas have been developed empirically from experimental data. The most comprehensive formula for sediment settling velocity is the one determined by Dietrich (1982) in terms of the variables employed to derive the formula.
5.2.2. Modelling settling velocity of seeds
Any sunken natural particle released in water will accelerate due to its weight. On the opposite side, the fluid will resist its motion and then create a drag force. The seed will cease to accelerate when those two forces become equal. The resistance of the seed to its motion depends on different factors. The main parameter is the density of the seed. Nevertheless, this is not the only parameter and shape, size and the roughness of the seed have also influences the settling velocity of the seed. The settling velocity of a natural particle through a static fluid can be estimated by solving the balance between the gravitational force and the drag resistance. The balance between the gravitational force Fg and the drag force Fd can be written as follows:
g dF F=
i.e. 2
( )2s
s w d w
wgV C Aρ ρ ρ− =
in which (ρs - ρw) represent the heaviness of the seed in water, equal to the difference between the density of the seed, ρs, and the density of water, ρw, g is the gravitational acceleration, and V is the volume of the seed, Cd is the coefficient of drag, ws is the settling velocity of the seed and A is the cross-sectional area of the seed. Dietrich (1982) proposed an empirical formula supported by theoretical analysis from which settling velocities can be accurately predicted.
3
*( )
w s
s w
wW
g
ρ
ρ ρ ν=
−
1 2( )
* 310R R
W R+=
3
* 2
( )s w n
gdD
ρ ρ
ρν
−=
2 3 4
1 3.76715 1.92944(log ) 0.09815(log ) 0.00575(log ) 0.00056(log )n n n n
R d d d d= − + − − +
2.3 2
2 * *
1log 1 (1 ) tanh(log 4.6) 0.3(0.5 )(1 ) (log( 4.6)
0.85
CSFR CSF D CSF CSF D
−= − − − − + − − −
Department of Civil and Environmental Engineering Division of Water Environment Technology – Chalmers University of Technology
Sorting of seeds by hydrochory
- 14 -
(1 (3.5 ) / 2.5)
3 *0.65 ( tanh(log 4.6)2.83
PCSF
R D
+ −
= − −
in which ws is the settling velocity of the seed, g is the gravitational acceleration, υ is the kinematic viscosity, W* is the dimensionless settling velocity, D* is the dimensionless seed size. The formula is rather complex but it is important to see that it accounts for size (dn, D*) shape (P, CSF) and density (ρs). In order to assess if the theory used for sediment is suitable for seeds, experimental results were compared with Dietrich’s prediction. To quantify the degree to which the experimental results fit Dietrich’s formula, the “error” is defined as
1 100.( 1)ex
th
w
wε = −
in which wex is the experimental value and wth is the prediction offered by Dietrich’s formula.
5.2.3. Experimental procedure
The experiments of settling velocity measurements were performed in a 0.15 m diameter, 1.5 m height column of water. For each experiment one seed was released 1 cm below the surface of the water to avoid the effects of surface tension. The time of settlement was measured. Twenty measures were taken for each type of seeds in order to obtain an averaged value.
5.2.4. Results and discussion
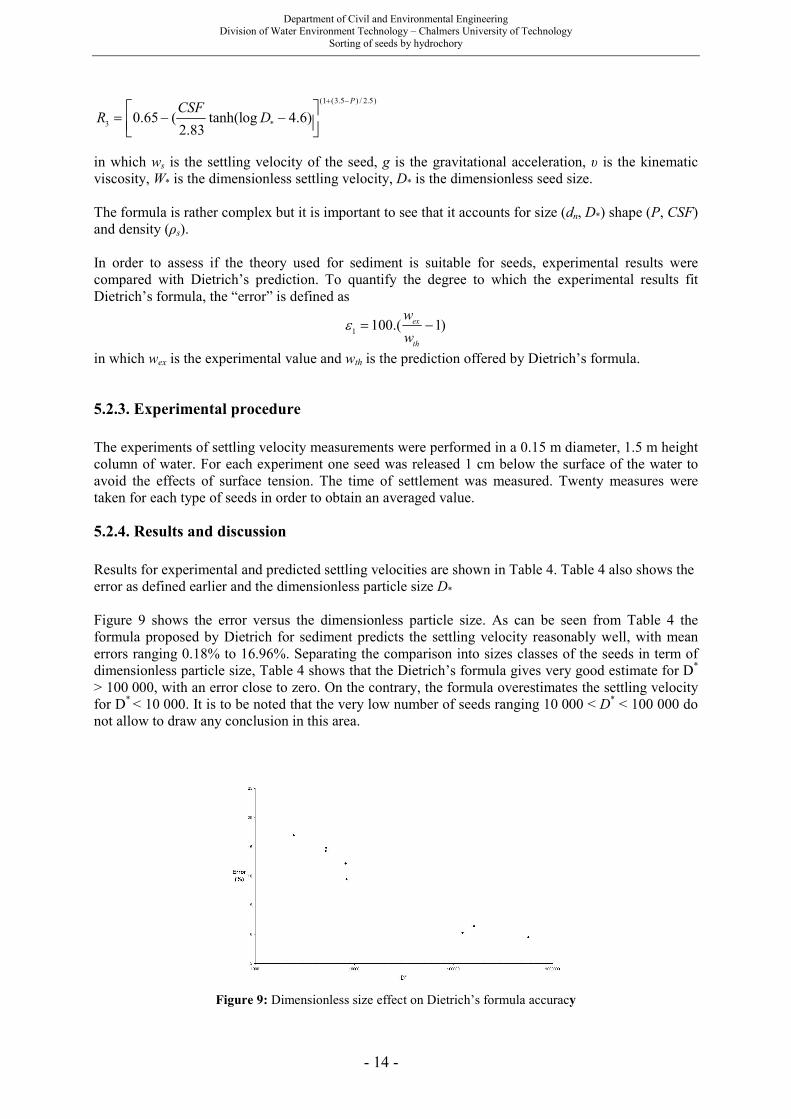
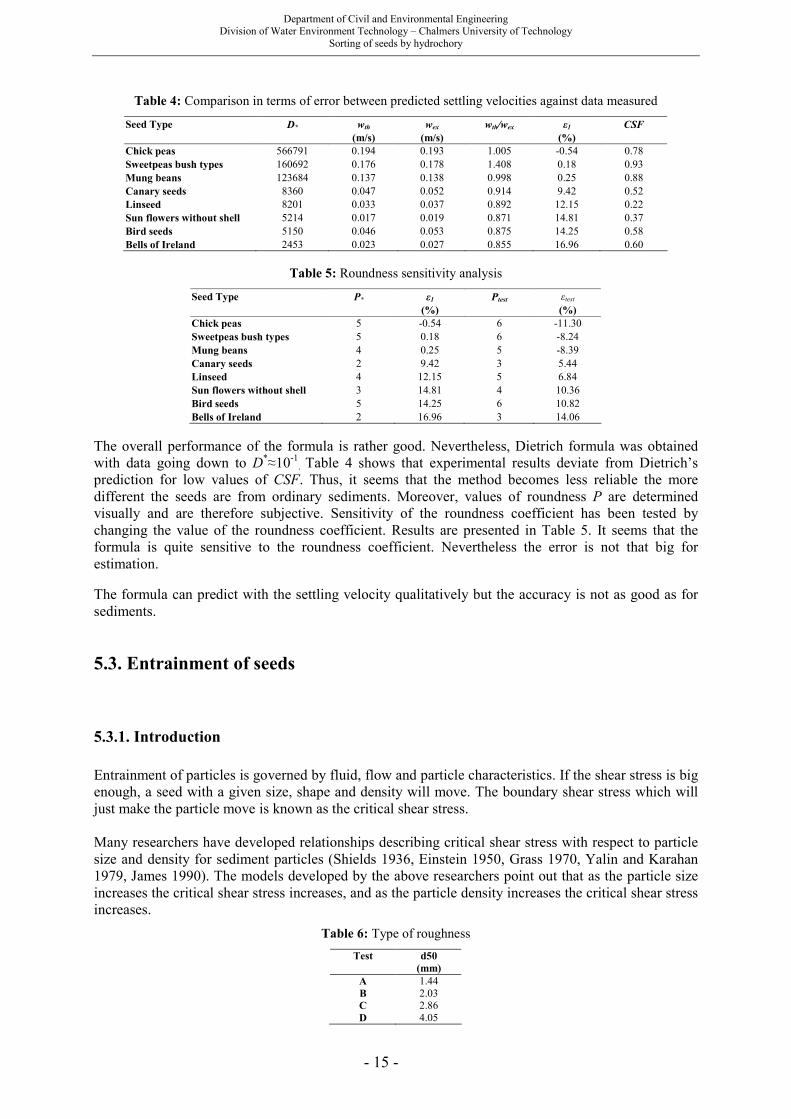
Results for experimental and predicted settling velocities are shown in Table 4. Table 4 also shows the error as defined earlier and the dimensionless particle size D* Figure 9 shows the error versus the dimensionless particle size. As can be seen from Table 4 the formula proposed by Dietrich for sediment predicts the settling velocity reasonably well, with mean errors ranging 0.18% to 16.96%. Separating the comparison into sizes classes of the seeds in term of dimensionless particle size, Table 4 shows that the Dietrich’s formula gives very good estimate for D*
> 100 000, with an error close to zero. On the contrary, the formula overestimates the settling velocity for D* < 10 000. It is to be noted that the very low number of seeds ranging 10 000 < D* < 100 000 do not allow to draw any conclusion in this area.
Figure 9: Dimensionless size effect on Dietrich’s formula accuracy
Department of Civil and Environmental Engineering Division of Water Environment Technology – Chalmers University of Technology
Sorting of seeds by hydrochory
- 15 -
Table 4: Comparison in terms of error between predicted settling velocities against data measured
Seed Type D* wth wex wth/wex ε1 CSF
(m/s) (m/s) (%)
Chick peas 566791 0.194 0.193 1.005 -0.54 0.78 Sweetpeas bush types 160692 0.176 0.178 1.408 0.18 0.93 Mung beans 123684 0.137 0.138 0.998 0.25 0.88 Canary seeds 8360 0.047 0.052 0.914 9.42 0.52 Linseed 8201 0.033 0.037 0.892 12.15 0.22 Sun flowers without shell 5214 0.017 0.019 0.871 14.81 0.37 Bird seeds 5150 0.046 0.053 0.875 14.25 0.58 Bells of Ireland 2453 0.023 0.027 0.855 16.96 0.60
Table 5: Roundness sensitivity analysis
Seed Type P* ε1 Ptest εtest
(%) (%)
Chick peas 5 -0.54 6 -11.30 Sweetpeas bush types 5 0.18 6 -8.24 Mung beans 4 0.25 5 -8.39 Canary seeds 2 9.42 3 5.44 Linseed 4 12.15 5 6.84 Sun flowers without shell 3 14.81 4 10.36 Bird seeds 5 14.25 6 10.82 Bells of Ireland 2 16.96 3 14.06
The overall performance of the formula is rather good. Nevertheless, Dietrich formula was obtained with data going down to D*≈10-1. Table 4 shows that experimental results deviate from Dietrich’s prediction for low values of CSF. Thus, it seems that the method becomes less reliable the more different the seeds are from ordinary sediments. Moreover, values of roundness P are determined visually and are therefore subjective. Sensitivity of the roundness coefficient has been tested by changing the value of the roundness coefficient. Results are presented in Table 5. It seems that the formula is quite sensitive to the roundness coefficient. Nevertheless the error is not that big for estimation.
The formula can predict with the settling velocity qualitatively but the accuracy is not as good as for sediments.
5.3. Entrainment of seeds
5.3.1. Introduction
Entrainment of particles is governed by fluid, flow and particle characteristics. If the shear stress is big enough, a seed with a given size, shape and density will move. The boundary shear stress which will just make the particle move is known as the critical shear stress. Many researchers have developed relationships describing critical shear stress with respect to particle size and density for sediment particles (Shields 1936, Einstein 1950, Grass 1970, Yalin and Karahan 1979, James 1990). The models developed by the above researchers point out that as the particle size increases the critical shear stress increases, and as the particle density increases the critical shear stress increases.
Table 6: Type of roughness
Test d50
(mm)
A 1.44 B 2.03 C 2.86 D 4.05
Department of Civil and Environmental Engineering Division of Water Environment Technology – Chalmers University of Technology
Sorting of seeds by hydrochory
- 16 -
5.3.2. Modelling entrainment conditions of seeds
Each seed is subject to three principal forces: the submerged weight of the seed itself, acting vertically downward; a downstream-directed drag force due to the skin friction of the grain and to a difference in pressure between its upstream and downstream sides, caused by induced eddies; and an upward-directed lift force due to induced deviations from hydrostatic pressure on top and sides of the grain. The possible cohesion of seed will not be addressed in this study. Indeed, cohesion forces apply to very small particles. In sediment transport for instance, they apply most commonly to clay minerals where the tiny clay mineral are mutually attracted by electrolytic forces which may be large compared to gravitational forces. Thus, seeds being much larger than particles of clay, it is unlikely that cohesion between seeds would affect the entrainment of seeds. The magnitude of the downward force weight component Fg is:
3
1( )g s wF K gdρ ρ= −
in which K1 is a proportionality factor. The drag and lift forces are proportional to ρwu*2d2/2 (Pye,
1994), so the total erosive force Fe is equal to the vector sum of the lift and drag forces:
2
2
2*( )
2w
e
uF K d
ρ=
Reasoning that movement of the particle will depend on the relative magnitudes of Fg and Fe, we can the define the dimensionless ratio θe :
2
0
3
2*
( ) ( )w
e
s w s w
u d
gd gd
ρ τθ
ρ ρ ρ ρ= =
− −
θe is usually called as a dimensionless shear stress. Yalin and Karahan (1979) developed empirical curves relating the critical dimensionless shear stress θec and the erosive Reynolds number Re
* defined as:
* *eR
su d
ν=
5.3.3. Experimental procedure
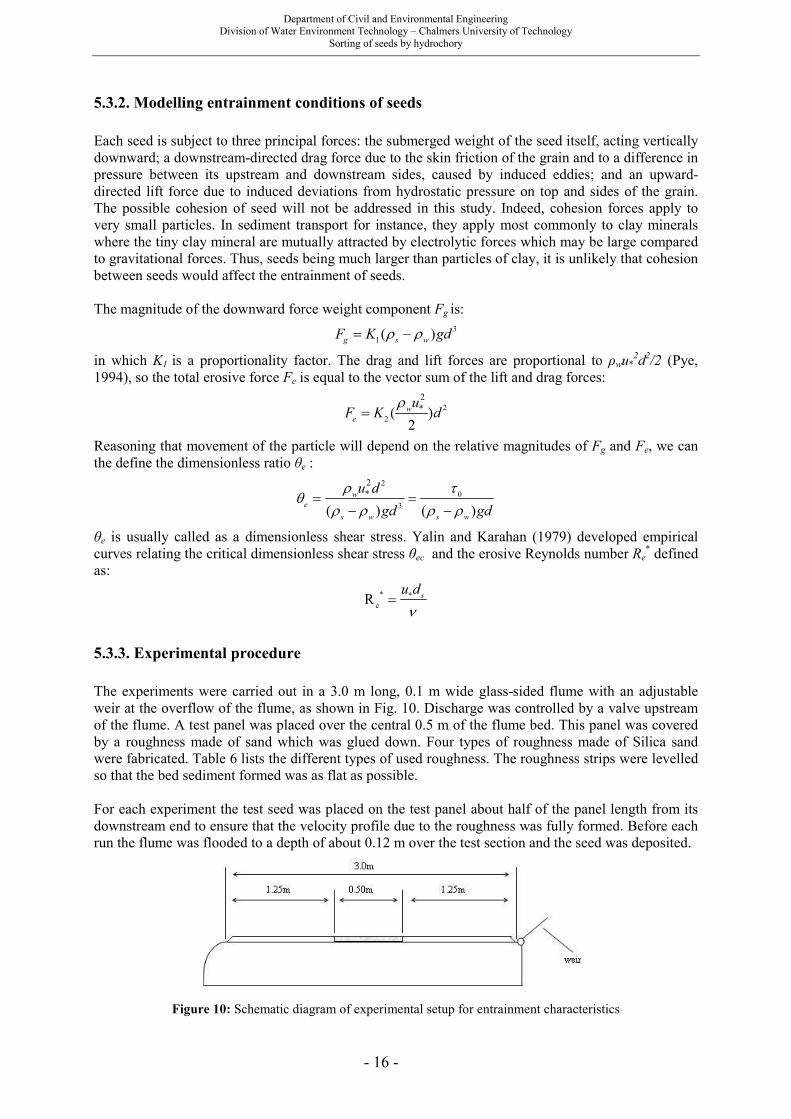
The experiments were carried out in a 3.0 m long, 0.1 m wide glass-sided flume with an adjustable weir at the overflow of the flume, as shown in Fig. 10. Discharge was controlled by a valve upstream of the flume. A test panel was placed over the central 0.5 m of the flume bed. This panel was covered by a roughness made of sand which was glued down. Four types of roughness made of Silica sand were fabricated. Table 6 lists the different types of used roughness. The roughness strips were levelled so that the bed sediment formed was as flat as possible. For each experiment the test seed was placed on the test panel about half of the panel length from its downstream end to ensure that the velocity profile due to the roughness was fully formed. Before each run the flume was flooded to a depth of about 0.12 m over the test section and the seed was deposited.
Figure 10: Schematic diagram of experimental setup for entrainment characteristics

Department of Civil and Environmental Engineering Division of Water Environment Technology – Chalmers University of Technology
Sorting of seeds by hydrochory
- 17 -
The flow was approximately uniform. For each test, the flow discharge was gradually increased using the gate valve and the weir, until the test seed moved from its original position. As the discharge was increased, and therefore the shear stress was increased, the seeds vibrated and moved until they found a stable position. Thus, the criterion for inception of motion was defined as the critical flow conditions to move the seed till the end of the roughness test panel. The boundary shear stress was then measured. A total of 20 experiments per type of seed were performed. The boundary shear stress was measured using a 1.0 mm internal diameter Pitot-static tube as a Preston tube, linked to a pressure transducer and analogue display unit. The Preston tube technique has been generally recognized as a convenient and reliable method for measuring the boundary shear stress (Head and Rechenberg 1962, Hwang and Laursen 1963, Hollingshead and Rajaratnam 1980). The Preston tube is a Pitot-static tube which is placed on the boundary facing the flow. The dynamic pressure ∆P, obtained from this tube is correlated to the boundary shear stress: this correlation is based on the law of the wall. Hwang and Laursen (1963) obtained an expression relating the dynamic pressure and grain shear stress which suggested that:
0
( , , )s
Pf a h k
τ
∆=
in which τ0 is the bed shear stress, a is the inner radius of the Preston tube, h is the height of the centre of the tube above the theoretical bed (the reference level for the logarithmic velocity profile) and ks is the bed roughness (assumed to be d50).
5.3.4. Calibration of the Preston tube
The Preston tube was calibrated for the different used roughnesses. Velocity profiles were measured
using the Pitot-static tube and the corresponding ratio 0/P τ∆ was then determined.
The shear velocities were determined by the Karman-Prandtl equation:
* 35.75 log( / )u u y K=
in which u is the velocity at height y above the theoretical bed and K3 is a constant and u* the shear velocity. The shear stress is defined as
2
0 *wuτ ρ=
Independent tests were carried out using a micropropeller meter to ensure that the Pitot-static tube and the flow transmitter were working properly. Velocity measurements were taken in the flume using simultaneously the flow transmitter and the micropropeller meter, the latter acting as the common reference. Figure 11 shows the velocity measurement obtained using the Pitot-static tube and the flow transmitter for the two different settings is a straight line with a correlation coefficient r2 of 0.9994 confirming that the instrumentation was working correctly. It is to be noted that for low velocities, the micropropeller tend to underestimate a little bit the velocity of the flow compared to the Preston Tube readings.
Table 7: Preston tube calibration equations
D50 ∆P/τ0
(mm)
1.44 35.2 2.03 28.1 2.86 23.1 4.05 16.6

Department of Civil and Environmental Engineering Division of Water Environment Technology – Chalmers University of Technology
Sorting of seeds by hydrochory
- 18 -
Figure 11: Preston tube measurements versus
micropropeller meter measurements
Figure 12: Preston calibration chart
For each roughness, 7 velocity profiles were measured and the shear stress calculated using the Karman-Prandtl equation (Appendix B). A linear fit to the curve of ∆P versus τ0 give the Preston tube calibration equation. The Preston tube calibration equations are listed in Table 7 and Fig. 12 shows the Preston calibration chart.
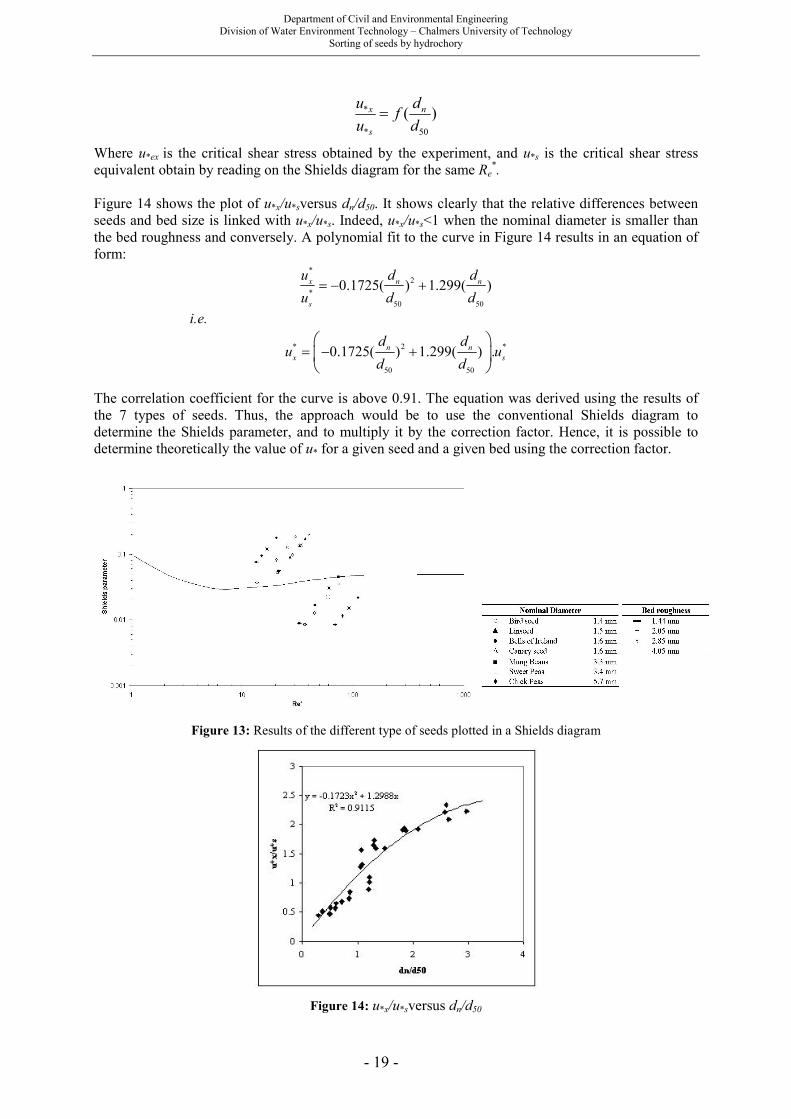
5.3.5. Results and discussion
Entrainment conditions were determined for 7 types of non-buoyant seeds. The entrainment conditions for Sunflower seeds were below the detection limit of the Preston tube and were therefore not determined. The entrainment conditions of seeds were compared with those for natural sediment particle model. Comparisons were made with the Shields diagram for natural sediment. The results plotted on the Shields diagram are shown on Fig. 13. The solid line represents the critical condition for entrainment of sediment according to Shields (1936). The results for the seeds which are finer than the bed size are higher than the Shields criteria. This could be explained by the fact that the seeds tend to be sheltered in the coarser bed. Conversely, when the seeds are larger than the bed size, then the entrainment function is reduced below the Shields criteria. This phenomenon can be explained by the experimental procedure used by Shields to obtain his diagram. In his experiment (Shields, 1936) different fluid stresses were applied to a uniform bed and the corresponding bed-load discharge measured by collecting the grains removed by entrainment. Then, by extrapolation to zero transport or by arbitrary definition of a small constant transport rate as corresponding to incipient motion, θe was calculated. Thus the Shields criterion works for a uniform bed but do not work for a seed with a different size to the bed. This procedure is appropriate to a physical situation in which large quantities vary in time and space. Nevertheless concentrations of seeds in river are not large enough to apply such a procedure. This suggests that if the transport of non-buoyant seeds is to be modelled, then a modified Shields entrainment function is needed to account for the protrusion of the seed. This study proposes to introduce a correction factor to the Shields criterion so that the criteria could apply to seeds. Figure 13 shows that the results deviate from the Shields curve when the ratio dn/d50 is different from 1. Thus the correction function is related to this ratio. It was hypothesized that the correction factor is dependent only on the relative differences between seed size and bed size. Thus:
Department of Civil and Environmental Engineering Division of Water Environment Technology – Chalmers University of Technology
Sorting of seeds by hydrochory
- 19 -
*
* 50
( )x n
s
u df
u d=
Where u*ex is the critical shear stress obtained by the experiment, and u*s is the critical shear stress equivalent obtain by reading on the Shields diagram for the same Re
*.
Figure 14 shows the plot of u*x/u*sversus dn/d50. It shows clearly that the relative differences between seeds and bed size is linked with u*x/u*s. Indeed, u*x/u*s<1 when the nominal diameter is smaller than the bed roughness and conversely. A polynomial fit to the curve in Figure 14 results in an equation of form:
*2
*
50 50
0.1725( ) 1.299( )x n n
s
u d d
u d d= − +
i.e.
* 2 *
50 50
0.1725( ) 1.299( ) .n n
x s
d du u
d d= − +
The correlation coefficient for the curve is above 0.91. The equation was derived using the results of the 7 types of seeds. Thus, the approach would be to use the conventional Shields diagram to determine the Shields parameter, and to multiply it by the correction factor. Hence, it is possible to determine theoretically the value of u* for a given seed and a given bed using the correction factor.
Figure 13: Results of the different type of seeds plotted in a Shields diagram
Figure 14: u*x/u*sversus dn/d50
Department of Civil and Environmental Engineering Division of Water Environment Technology – Chalmers University of Technology
Sorting of seeds by hydrochory
- 20 -
5.4. Discussion
The primary objective of the tests was to find out if non-buoyant seeds respond in a manner similar to sediments. Being organic, seeds have generally a lower density than sediment. This implies that on a large scale, seeds can be transported further away than sediments. This study suggests that in water, seeds respond in a similar way to sediment and some of the tools used for sediment can be extended to seeds. Nevertheless, the conventional settling model becomes progressively less accurate as the seed characteristics deviate more and more from sediment characteristics. Thus, it is important to see that beyond a certain range of conditions, conventional sediment theory does not apply to seeds. A theoretical understanding of settling velocity and entrainment conditions could be incorporated into a predictive model. Indeed, it is important to know those parameters theoretically since by absorbing water, density of seeds change over time. Knowing how this density changes would allow incorporating these elements into model of transport of sediment to predict non-buoyant seed transport.
6. Sorting of buoyant seeds by hydrochory
6.1. Introduction
Very little is known about the transport of buoyant seeds. The key factor in the sorting of seeds by hydrochory (leading to spatial species differentiation) is usually considered to be the effect of the potential duration of buoyancy, which has received much interest. However the way seeds are distributed in rivers is strongly influenced by their hydrodynamic properties, such as size, shape and density. This chapter presents a series of laboratory experiments conducted to investigate qualitatively how 5 different types of buoyant seeds (Fig. 8) with different morphologies react to different hydraulic conditions. As seen in chapter 3, opportunities for the sorting of buoyant seeds during hydrochory occurs during the processes of transport and deposition. The general method in these studies was to test the seeds in particular laboratory conditions and to see how they reacted to different factors during transport and deposition. The laboratory conditions are ideal, and ignore many parameters found in the natural environment, but they help to isolate specific variables to see how they affect the sorting of seeds.
6.2. Sorting of buoyant seeds during transport
6.2.1. Geomorphology
6.2.1.1. Introduction The sorting of seeds during transport was investigated by observing the destinations of seeds in a flume containing different morphological features. The experiments were divided into two sets in which the destination of the seeds was analysed for two different geomorphologies which are characteristic of natural rivers. Together these studies will help us to observe if different seed types react differently to different morphological features.

Department of Civil and Environmental Engineering Division of Water Environment Technology – Chalmers University of Technology
Sorting of seeds by hydrochory
- 21 -
Figure 15: Schematic diagram of experimental setup
for geomorphology type 1
Figure 16: Schematic diagram of experimental setup for geomorphology type 2
Figure 17: Results geomorphology type 1
Figure 18: Results geomorphology type 2
6.2.1.2. Experimental procedure The experiments were conducted in a 12m long and 2m wide flume (C). Flow passed from a header tank and into the flume through a control valve and diffuser. In the first set of experiments, some bricks were placed on the side of the flume over 30 cm of the width of the flume (Fig. 15). This set-up is not directly applicable to natural conditions, but can be considered to correspond to the fluvial features of a point bar or an expansion. Seeds were released 30 cm from the wall and 2 m upstream of the bricks. In the second set of experiments, bricks were then placed in the middle of the flume (Fig. 16). This set-up would correspond to fluvial features such as island or braided rivers. Seeds were this time released in the middle of the flume. The destination of the seeds was analysed by dividing the outflow of the flume into 20 compartments to collect the seeds (Fig. 15 & Fig. 16). The compartments were numbered from 1 to 20. A total of 300 seeds were released for each type, and their final destination was noted. The discharge was measured using a calibrated v-notch weir downstream of the flume. Experimental conditions are listed in Appendix B. 6.2.1.3. Results and discussion Results are presented in Fig. 17 and Fig. 18. The behaviour of the different seed types is very similar. It is to be noted that during the experiments very few seeds were entrained into eddies created by the geomorphologies (max=5) but were re-entrained into the main current quickly. It seems that as seeds were very light, they just followed the water surface current without being drifted away. Andersson (2000b) used 22mm long cubes as diaspore mimics and observed also that the stranding pattern of them was significantly associated with water current. These experiments showed that little significant sorting of the seeds resulted from the flow patterns associated with channel form.

Department of Civil and Environmental Engineering Division of Water Environment Technology – Chalmers University of Technology
Sorting of seeds by hydrochory
- 22 -
6.2.2 Vegetation
6.2.2.1. Introduction James and Sharpe (2006) have experimentally studied the influence of vegetation along rivers on sediment transport and deposition. They concluded that the shear zone along the interface between longitudinal vegetation strips and unvegetated flow promotes ingress of sediment into the vegetation by locally enhancing transverse sediment diffusivity. Nothing is known about the diffusivity of seeds floating on the surface of water. Nevertheless, it was hypothesized that the effect of ingress of matter due to vegetation along the river could apply to buoyant seeds. The introduction of artificial reeds on the side of the flume affects the hydraulics and diffusion coefficient. The effect of reeds on the hydraulics is a reduction in flow velocity due to increased drag, creating a lateral gradient of velocity. The purpose of this experiment is to see if some seeds were more drifted than other due to the presence of vegetation on the side of the river. 6.2.2.2. Experimental procedure The experiments were conducted in a flume (B) with emergent vegetation extending through the water surface. Model vegetation such as vertical cylinders in a grid pattern was used on a strip adjacent to an unvegetated channel. This set-up corresponds to the situation where the river bank is covered by vegetation. The experiments were carried out in a 20 m long and 0.38 m wide flume with a hinged weir at the overflow of the flume (Fig. 20). Flow passed from a header tank and into the flume through a control valve and diffuser. The final 10 m of the flume had an adjustable slope, and it is this section that was used for the experiments. A sediment feeder was used to feed the flume with seeds at a constant rate. The sediment feeder was introduced in such a way that seeds were introduced at the beginning of the tilting section. The discharge was measured using a calibrated v-notch weir downstream of the flume. Model vegetation was installed in the upstream half of the section. The model vegetation was placed on the side of the flume (Fig. 20), forming a 0.12m wide and 4.70m long lateral strip of model vegetation. Vegetation was modelled by using vertical cylindrical rods made of 6.1 mm diameter steel rods fixed by a wooden plate. The cylindrical rods were intended to represent reed stems or the stems of cylindrical vegetation such as reed-like vegetation (e.g. Spartina alterniflora, Phragmites australis). Three configurations were used, resulting in three stem densities (Fig. 19). Three sets of experiments were carried out with the three different stem densities. The flume was fed with 300 seeds during 4 min, and the flow was stopped after a total duration of 8 min. The number of retained seeds was then counted visually. The conditions of the experimental tests are summarized in Appendix B.
Figure 19: Layout of artificial reed stems
Figure 20: Schematic diagram of experimental
setup for partially vegetated channel

Department of Civil and Environmental Engineering Division of Water Environment Technology – Chalmers University of Technology
Sorting of seeds by hydrochory
- 23 -
Figure 21: Results for partially vegetated channel
6.2.2.3. Results and discussion Results are presented in Fig. 21. Sunflower seeds were more deposited inside the vegetation than any other type of seeds. It is clear that distinctive seed types behaved differently. Nevertheless, it is hard to define which seed characteristic is responsible for different behaviour, since at least two processes occurred during the experiment: the drifting of the seeds due to the presence of the vegetation and the trapping of the seeds once they were inside the vegetation. Nevertheless, the presence of vegetation on the side of the river is very likely to enhance the sorting of seeds during their transport.
6.2.3 Wind
6.2.3.1. Introduction Wind is a vector of dispersal for light seeds in nature. Moreover, seeds that are transported on the surface of water can also be affected by wind. An experimental investigation was carried out to see qualitatively if wind could influence the sorting of buoyant seeds by hydrochory. 6.2.3.2. Experimental procedure The experiments were conducted in a 12m long and 2m wide flume (C). Flow passed from a header tank and into the flume through a control valve and diffuser. Three fans were placed along 3 metres on the side of the flume (Fig. 22). Experimental trials using three or two fans were initially conducted in the flume, but were terminated because nearly all the seeds were pushed along the opposite wall of the flume. Only one fan was used, placed 4 metres before the end of the flume. Seeds were released in the middle of the flume, 4 metres upstream of the fan. The outflow of the flume was divided into 20 compartments to collect the seeds and to measure how much they drifted in the wind. The compartments were numbered from 1 to 20, 1 being the side opposite to the fan, 20 being the side of the fan. A total of 200 experiments per type of seed were performed. .
Figure 22: Layout of the experiment for wind
Figure 23: Seeds drifted by wind
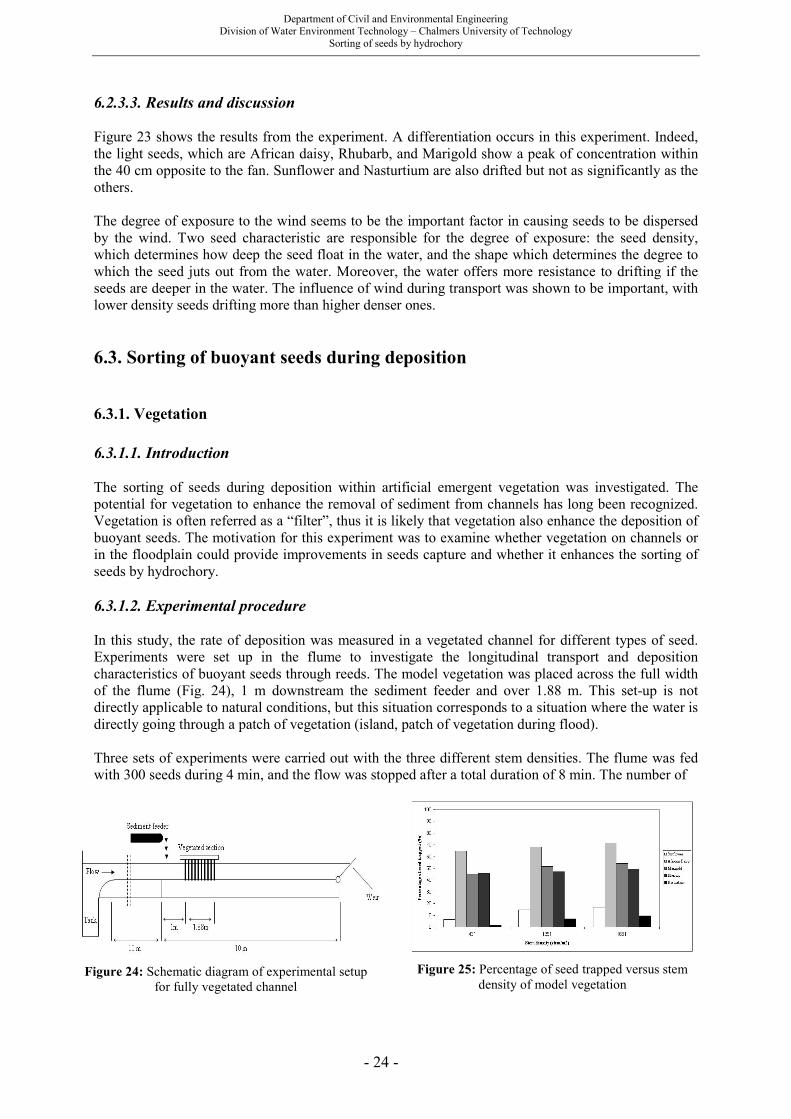
Department of Civil and Environmental Engineering Division of Water Environment Technology – Chalmers University of Technology
Sorting of seeds by hydrochory
- 24 -
6.2.3.3. Results and discussion Figure 23 shows the results from the experiment. A differentiation occurs in this experiment. Indeed, the light seeds, which are African daisy, Rhubarb, and Marigold show a peak of concentration within the 40 cm opposite to the fan. Sunflower and Nasturtium are also drifted but not as significantly as the others. The degree of exposure to the wind seems to be the important factor in causing seeds to be dispersed by the wind. Two seed characteristic are responsible for the degree of exposure: the seed density, which determines how deep the seed float in the water, and the shape which determines the degree to which the seed juts out from the water. Moreover, the water offers more resistance to drifting if the seeds are deeper in the water. The influence of wind during transport was shown to be important, with lower density seeds drifting more than higher denser ones.
6.3. Sorting of buoyant seeds during deposition
6.3.1. Vegetation
6.3.1.1. Introduction The sorting of seeds during deposition within artificial emergent vegetation was investigated. The potential for vegetation to enhance the removal of sediment from channels has long been recognized. Vegetation is often referred as a “filter”, thus it is likely that vegetation also enhance the deposition of buoyant seeds. The motivation for this experiment was to examine whether vegetation on channels or in the floodplain could provide improvements in seeds capture and whether it enhances the sorting of seeds by hydrochory. 6.3.1.2. Experimental procedure
In this study, the rate of deposition was measured in a vegetated channel for different types of seed. Experiments were set up in the flume to investigate the longitudinal transport and deposition characteristics of buoyant seeds through reeds. The model vegetation was placed across the full width of the flume (Fig. 24), 1 m downstream the sediment feeder and over 1.88 m. This set-up is not directly applicable to natural conditions, but this situation corresponds to a situation where the water is directly going through a patch of vegetation (island, patch of vegetation during flood). Three sets of experiments were carried out with the three different stem densities. The flume was fed with 300 seeds during 4 min, and the flow was stopped after a total duration of 8 min. The number of
Figure 24: Schematic diagram of experimental setup
for fully vegetated channel
Figure 25: Percentage of seed trapped versus stem
density of model vegetation
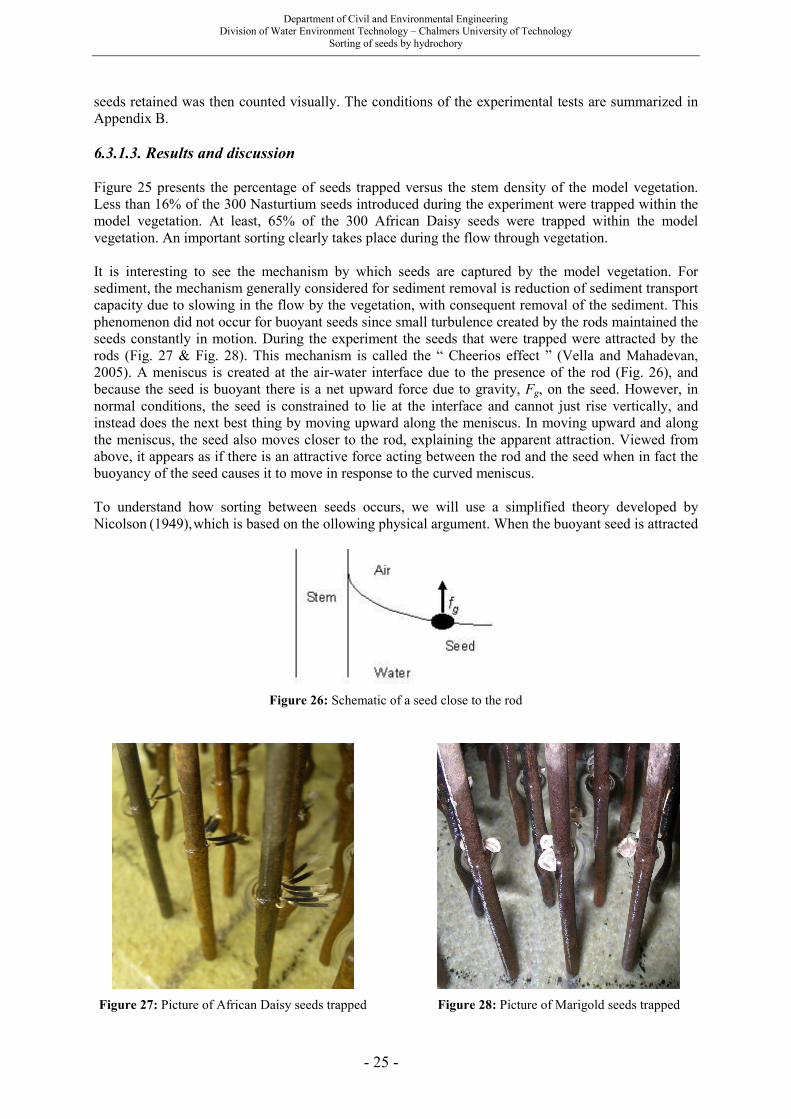
Department of Civil and Environmental Engineering Division of Water Environment Technology – Chalmers University of Technology
Sorting of seeds by hydrochory
- 25 -
seeds retained was then counted visually. The conditions of the experimental tests are summarized in Appendix B. 6.3.1.3. Results and discussion Figure 25 presents the percentage of seeds trapped versus the stem density of the model vegetation. Less than 16% of the 300 Nasturtium seeds introduced during the experiment were trapped within the model vegetation. At least, 65% of the 300 African Daisy seeds were trapped within the model vegetation. An important sorting clearly takes place during the flow through vegetation. It is interesting to see the mechanism by which seeds are captured by the model vegetation. For sediment, the mechanism generally considered for sediment removal is reduction of sediment transport capacity due to slowing in the flow by the vegetation, with consequent removal of the sediment. This phenomenon did not occur for buoyant seeds since small turbulence created by the rods maintained the seeds constantly in motion. During the experiment the seeds that were trapped were attracted by the rods (Fig. 27 & Fig. 28). This mechanism is called the “ Cheerios effect ” (Vella and Mahadevan, 2005). A meniscus is created at the air-water interface due to the presence of the rod (Fig. 26), and because the seed is buoyant there is a net upward force due to gravity, Fg, on the seed. However, in normal conditions, the seed is constrained to lie at the interface and cannot just rise vertically, and instead does the next best thing by moving upward along the meniscus. In moving upward and along the meniscus, the seed also moves closer to the rod, explaining the apparent attraction. Viewed from above, it appears as if there is an attractive force acting between the rod and the seed when in fact the buoyancy of the seed causes it to move in response to the curved meniscus. To understand how sorting between seeds occurs, we will use a simplified theory developed by Nicolson (1949), which is based on the ollowing physical argument. When the buoyant seed is attracted
Figure 26: Schematic of a seed close to the rod
Figure 27: Picture of African Daisy seeds trapped
Figure 28: Picture of Marigold seeds trapped
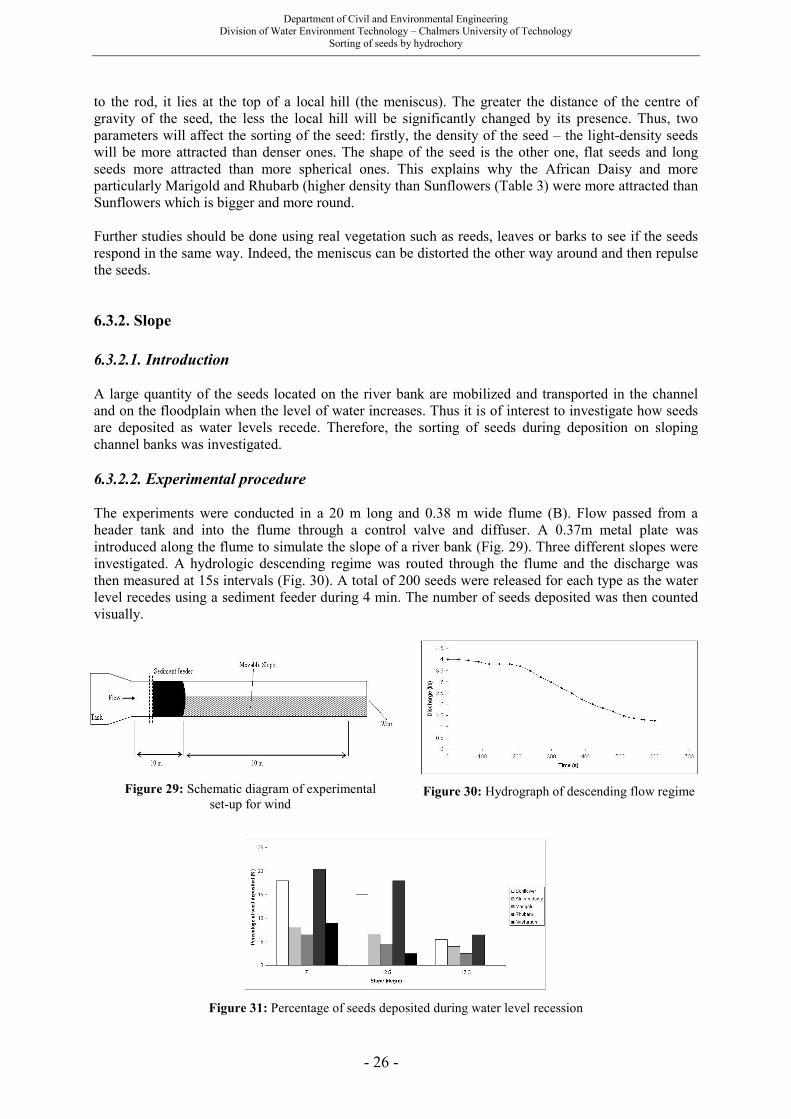
Department of Civil and Environmental Engineering Division of Water Environment Technology – Chalmers University of Technology
Sorting of seeds by hydrochory
- 26 -
to the rod, it lies at the top of a local hill (the meniscus). The greater the distance of the centre of gravity of the seed, the less the local hill will be significantly changed by its presence. Thus, two parameters will affect the sorting of the seed: firstly, the density of the seed – the light-density seeds will be more attracted than denser ones. The shape of the seed is the other one, flat seeds and long seeds more attracted than more spherical ones. This explains why the African Daisy and more particularly Marigold and Rhubarb (higher density than Sunflowers (Table 3) were more attracted than Sunflowers which is bigger and more round. Further studies should be done using real vegetation such as reeds, leaves or barks to see if the seeds respond in the same way. Indeed, the meniscus can be distorted the other way around and then repulse the seeds.
6.3.2. Slope
6.3.2.1. Introduction A large quantity of the seeds located on the river bank are mobilized and transported in the channel and on the floodplain when the level of water increases. Thus it is of interest to investigate how seeds are deposited as water levels recede. Therefore, the sorting of seeds during deposition on sloping channel banks was investigated. 6.3.2.2. Experimental procedure The experiments were conducted in a 20 m long and 0.38 m wide flume (B). Flow passed from a header tank and into the flume through a control valve and diffuser. A 0.37m metal plate was introduced along the flume to simulate the slope of a river bank (Fig. 29). Three different slopes were investigated. A hydrologic descending regime was routed through the flume and the discharge was then measured at 15s intervals (Fig. 30). A total of 200 seeds were released for each type as the water level recedes using a sediment feeder during 4 min. The number of seeds deposited was then counted visually.
Figure 29: Schematic diagram of experimental set-up for wind
Figure 30: Hydrograph of descending flow regime
Figure 31: Percentage of seeds deposited during water level recession
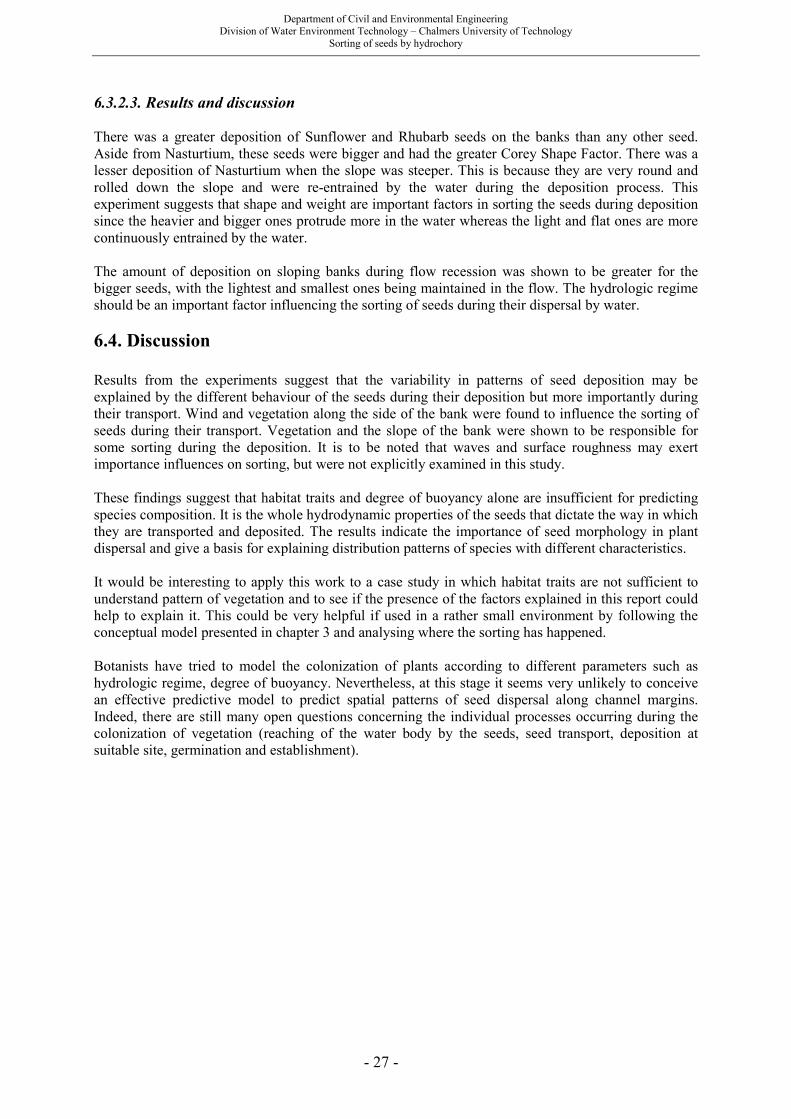
Department of Civil and Environmental Engineering Division of Water Environment Technology – Chalmers University of Technology
Sorting of seeds by hydrochory
- 27 -
6.3.2.3. Results and discussion There was a greater deposition of Sunflower and Rhubarb seeds on the banks than any other seed. Aside from Nasturtium, these seeds were bigger and had the greater Corey Shape Factor. There was a lesser deposition of Nasturtium when the slope was steeper. This is because they are very round and rolled down the slope and were re-entrained by the water during the deposition process. This experiment suggests that shape and weight are important factors in sorting the seeds during deposition since the heavier and bigger ones protrude more in the water whereas the light and flat ones are more continuously entrained by the water. The amount of deposition on sloping banks during flow recession was shown to be greater for the bigger seeds, with the lightest and smallest ones being maintained in the flow. The hydrologic regime should be an important factor influencing the sorting of seeds during their dispersal by water.
6.4. Discussion
Results from the experiments suggest that the variability in patterns of seed deposition may be explained by the different behaviour of the seeds during their deposition but more importantly during their transport. Wind and vegetation along the side of the bank were found to influence the sorting of seeds during their transport. Vegetation and the slope of the bank were shown to be responsible for some sorting during the deposition. It is to be noted that waves and surface roughness may exert importance influences on sorting, but were not explicitly examined in this study. These findings suggest that habitat traits and degree of buoyancy alone are insufficient for predicting species composition. It is the whole hydrodynamic properties of the seeds that dictate the way in which they are transported and deposited. The results indicate the importance of seed morphology in plant dispersal and give a basis for explaining distribution patterns of species with different characteristics. It would be interesting to apply this work to a case study in which habitat traits are not sufficient to understand pattern of vegetation and to see if the presence of the factors explained in this report could help to explain it. This could be very helpful if used in a rather small environment by following the conceptual model presented in chapter 3 and analysing where the sorting has happened. Botanists have tried to model the colonization of plants according to different parameters such as hydrologic regime, degree of buoyancy. Nevertheless, at this stage it seems very unlikely to conceive an effective predictive model to predict spatial patterns of seed dispersal along channel margins. Indeed, there are still many open questions concerning the individual processes occurring during the colonization of vegetation (reaching of the water body by the seeds, seed transport, deposition at suitable site, germination and establishment).
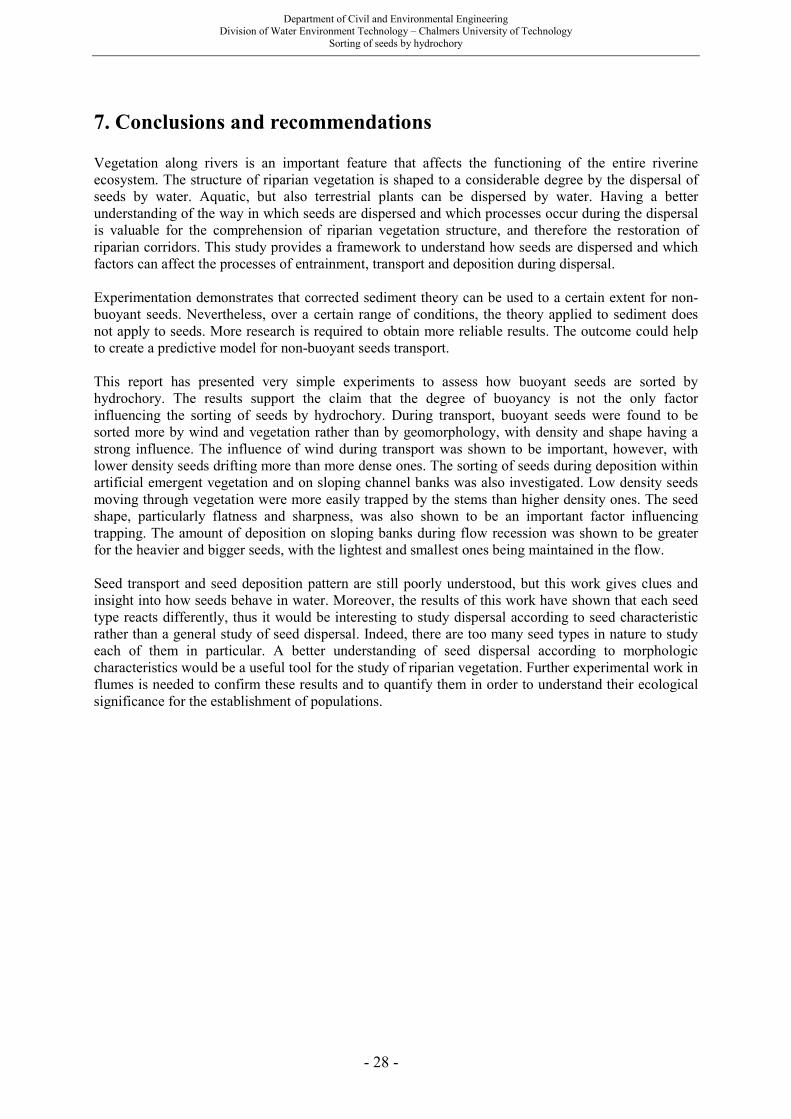
Department of Civil and Environmental Engineering Division of Water Environment Technology – Chalmers University of Technology
Sorting of seeds by hydrochory
- 28 -
7. Conclusions and recommendations Vegetation along rivers is an important feature that affects the functioning of the entire riverine ecosystem. The structure of riparian vegetation is shaped to a considerable degree by the dispersal of seeds by water. Aquatic, but also terrestrial plants can be dispersed by water. Having a better understanding of the way in which seeds are dispersed and which processes occur during the dispersal is valuable for the comprehension of riparian vegetation structure, and therefore the restoration of riparian corridors. This study provides a framework to understand how seeds are dispersed and which factors can affect the processes of entrainment, transport and deposition during dispersal. Experimentation demonstrates that corrected sediment theory can be used to a certain extent for non-buoyant seeds. Nevertheless, over a certain range of conditions, the theory applied to sediment does not apply to seeds. More research is required to obtain more reliable results. The outcome could help to create a predictive model for non-buoyant seeds transport. This report has presented very simple experiments to assess how buoyant seeds are sorted by hydrochory. The results support the claim that the degree of buoyancy is not the only factor influencing the sorting of seeds by hydrochory. During transport, buoyant seeds were found to be sorted more by wind and vegetation rather than by geomorphology, with density and shape having a strong influence. The influence of wind during transport was shown to be important, however, with lower density seeds drifting more than more dense ones. The sorting of seeds during deposition within artificial emergent vegetation and on sloping channel banks was also investigated. Low density seeds moving through vegetation were more easily trapped by the stems than higher density ones. The seed shape, particularly flatness and sharpness, was also shown to be an important factor influencing trapping. The amount of deposition on sloping banks during flow recession was shown to be greater for the heavier and bigger seeds, with the lightest and smallest ones being maintained in the flow. Seed transport and seed deposition pattern are still poorly understood, but this work gives clues and insight into how seeds behave in water. Moreover, the results of this work have shown that each seed type reacts differently, thus it would be interesting to study dispersal according to seed characteristic rather than a general study of seed dispersal. Indeed, there are too many seed types in nature to study each of them in particular. A better understanding of seed dispersal according to morphologic characteristics would be a useful tool for the study of riparian vegetation. Further experimental work in flumes is needed to confirm these results and to quantify them in order to understand their ecological significance for the establishment of populations.

Department of Civil and Environmental Engineering Division of Water Environment Technology – Chalmers University of Technology
Sorting of seeds by hydrochory
- 29 -
Bibliography
Andersson E., Nilsson C., Johansson M.E., 2000a. Effects of river fragmentation on plant dispersal and riparian flora. Regulated rivers: Research and Management 16:83-89.
Andersson E., Nilsson C., Johansson M.E., 2000b. Plant dispersal in boreal rivers and its relation to the diversity of the riparian flora. Journal of Biogeography, 27: 1095-1106.
Andrews E.D., 1984. Bed-material entrainment and hydraulic geometry of gravel-bed rivers in Colorado. Geological Society of America
Bulletin. 95: 371-378.
Bischoff A., 2002. Dispersal and establishment of floodplain grassland species as limiting factors in restoration. Biological Conservation, 104. 25-33.
Cellot B., Mouillot F., Henry C.P., 1998. Flood drift and propagule bank of aquatic macrophytes in a riverine wetland. Journal of Vegetation Science. 5: 631-640.
Cook R.E., 1985. Growth and reproduction in clonal plant populations. Population Biology and Evolution of Clonal Organisms. Edited by J.B.C. Jackson & R.E. Cook, pp259-296, Yale University Press, New Haven, Connecticut.
Corey A.T., 1949. Influence of shape on the fall velocity of sand grains. Unpublished MS Thesis, A&M College, Colorado.
Dietrich W.E., 1982. Settling velocity of natural particles. Water Resources Research. 18(6) : 1615-1626.
Einstein H.A., 1950. The bed-load function for sediment transportation in open channel flows. Technical Bulletin No. 1026, U.S. Department of Agriculture. Soil Conservation Service, Washington.
Elliot A.H., 2000. Settling of fine sediment in a channel with emergent vegetation. Journal of Hydraulic Engineering. 136(8):570-577.
Environmental Protection Agency, 1998. U.S. Guideline for Ecological Risk Assessment, EPA/630/R-95/002F
Folk R.L., 1955. Student operator error in determination of roundness, sphericity and grain size. Journal of Sedimentary Petrology, 25:297-301.
Goodson J.M., Gurnell A.M., Angold P.G., Morissey I..P., 2002. Riparian seed banks along lower River Dove, UK: their structure and ecological applications. Geomorphology, 47:45-60.
Grass A.J., 1970. Initial instability of fine bed sand. Journal of the hydraulics Division ASCE, 96:619-632.
Head M.R., Rechenberg I., 1962. The Preston tube as a means of measuring skin friction. Journal of Fluid Mechanics, 14:1-17.
Hollingshead A.B., Rajaratnam N., 1980. A calibration chart for the preston tube. Journal of Hydraulic Research. 18:313-325.
Hugues J.W. and Cass W.B., 1997. Pattern and processes of a floodplain forest, Vermont USA: predicted response of vegetation to perturbation. Journal of Applied Ecology 34:594-612.
Hupp C.R., Osterkamp W.R., 1985. Bottomland vegetation distribution along Passage Creek gorge, Virginia, in relation to fluvial landforms. Ecology 66:670-681.
Hwang L.S., Laursen E.M., 1963. Shear measurement technique for rough surfaces. Journal of the Hydraulics Division, ASCE, 89:19-37.
James C.S., Birkhead A.L., Jordanova A.A., Kotschy K.A., Nicolson C.R., Makoa M.J., 2002. Interaction of reeds, hydraulics and river morphology. WRC Report No. 856/1/01, Water Research Comission, Pretoria, South Africa.
James C.S., Sharpe R.G. 2006. Deposition of sediment from suspension in emergent vegetation. Water SA, 23(2):211-218
Johansson, M.E., Nilsson, Christer & Nilsson, E., 1996. Do rivers function as corridors for plant dispersal ?. Journal of Vegetation Science 7: 593-598.
Johansson M.E., Nilsson C., 1993. Hydrochory, population dynamics and distribution of the clonal aquatic plant Ranunculus lingua. Journal of Ecology 81:81-91.
Karrenberg S., Edwards P.J., Kollman J., 2002. The life history of Salicae living in the active zone of flood plains, Freshwater Biology, 47:733-748.
Kollmann J., Vieli M., Edwards P.J., Tockner K., Ward J.V., 1999. Interactions between vegetation development and island formation in the Alpine river Tagliamento. Applied Vegetation Science 2:25-36.
Kubitski K., Ziburski A., 1994. Seed dispersal in flood-plain forests of Amazonia. Biotropica. 26:30-43.
Large A.R.G. and Prach K., 1999. Ecohydrology. Ed. A.J.Baird and R.L.Wilby. Routledge, London, UK
Department of Civil and Environmental Engineering Division of Water Environment Technology – Chalmers University of Technology
Sorting of seeds by hydrochory
- 30 -
Lawrance, R.R., McIntyre C., Lance C., 1988. Erosion and deposition in a field/forest system estimated using Cesium 137 activity. Journal of Soil and Water Conservation, 43 :195-199.
Lopez O.R., 2001. Seed flotation and postflooding germination in tropical terra firme and seasonally flooded forest species. Functional Ecology 15:763-771.
Middleton B.A., 2002. Flood pulsing in the regeneration and maintenance of species in riverine forested wetlands of the southeastern United States. Flood Pulsing and Wetlands: Restoring the Natural Balance, pp.223-294. John Wiley & Sons, New Yorl.
Naiman, R.J., Décamps H. 1997. The ecology of interfaces: riparian zones. Annual Review of Ecology and Systematics, 28; 621-658.
Nicolson M..M., 1949 The interaction between floating particles. Proc. Camb. Phil. Soc. 45, 288–295.
Nilsson C., Ekblad A., Dynesius M., Backe S., Gardfjell M., Carlberg B., Hellqvist S., Jansson R., 1994. A comparison of species richness and traits of riparian plants between a main river channel and its tributaries. Journal of Ecology 82:281-295.
Nilsson C., Danvind M., 1997. Seed floating ability and distribution of alpine plants along a northern Swedish river. Journal of Vegetation Science 8:271-276.
Nobel P.S., 1991. Physicochemical and Environmental Plant Physiology. Academic Press, San Diego,CA.
Powers M.C., 1953. A new roundness scale for sedimentary particles. Journal of Sedimentary Petrology, 27:117-119
Pye K., 1994. Sediment transport and depositional processes. Great Britain, Blackwell Scientific Publications
Rand T.A., 2000. Seed dispersal, habitat suitability and the distribution of halophytes across a salt marsh tidal gradient. Journal of Ecology 88;608-621.
Ridley, H.N. 1930. The dispersal of plants throughout the world. L. Reeve & Co, Ashford, Kent , England.
Schneider R.L., Scharitz R.R., 1988. Hydrochory and regeneration in a bald cypress-water tupelo swamp forest. Ecology, 69(4):1055-1063.
Shields A., 1936. Application of similarity principles and turbulence research to bed-load movement. Mitteil, Preuss, Versuchtsanst. Wasser, Erd. Schiffsban. In: Ott, W.P. and Uchelen, J.C. (Translators) California Ins. Of Technology, Report No. 167.
Simon A., Collison A.J.C., 2002. Quantifying the mechanical and hydrogeological effects of riparian vegetation on streambank stability. Earth Surface Processes and Landforms. 27(5):527-546
Skoglund S.J., 1990. Seed dispersing agents in two regularly flooded river sites. Canadian Journal of Botany 68:754-760.
Smith D.G., 1976. Effect of vegetation on lateral migration of a glacial meltwater river. Geological Society of America Bulletin, 87: 857-860.
Starosolsky Ö., 1983. The role of reeds in the shaping of currents. Proceedings, 20th congress, International Association for Hydraulic Research, Moscow. 498-509.
Thébaud C. and Debussche M., 1991. Rapid invasion of Fraximus ornus L. along the Hérault River system in southern France: the importance of seed dispersal by water. Journal of
Biogeography, 18:7-12.
Thorne C.R., 1990. Effects of vegetation on riverbank erosion and stability, in Vegetation and Erosion : Processes and Environments, edited by J.B. Thornes, pp. 125-143, John Wiley and Sons, Chichester.
Tsujimoto T., Kitamura T., 1999. Fluvial processes in streams with vegetation. Journal of Hydraulic Research, 37 :789-803.
Van Coller A.L., Rogers K.H., 1995. Riparian vegetation of the Sabie River : Relating spatial distribution patterns to characteristics of the physical environment. Centre for Water in the Environment. Report No :1/95
Van Der Pjil L., 1969. Principles of dispersal in higher plants. Springer-Verlag, Berlin, Heidelberg, Germany.
Van den Broek T., Van Diggelen R., Bobbink R., 2005. Variation in seed buoyancy of species in wetland ecosystems with different flooding dynamics. Journal of Vegetation Science 16 (5): 579-586.
Vella D., Mahadevan L., 2005. The “Cheerios effect”. Am. J. Phys. 73 (9) 817-825.
Yalin M.S., Karahan E., 1979. Inception of sediment transport. Journal of the hydraulics division ASCE, 105:1433-1443.
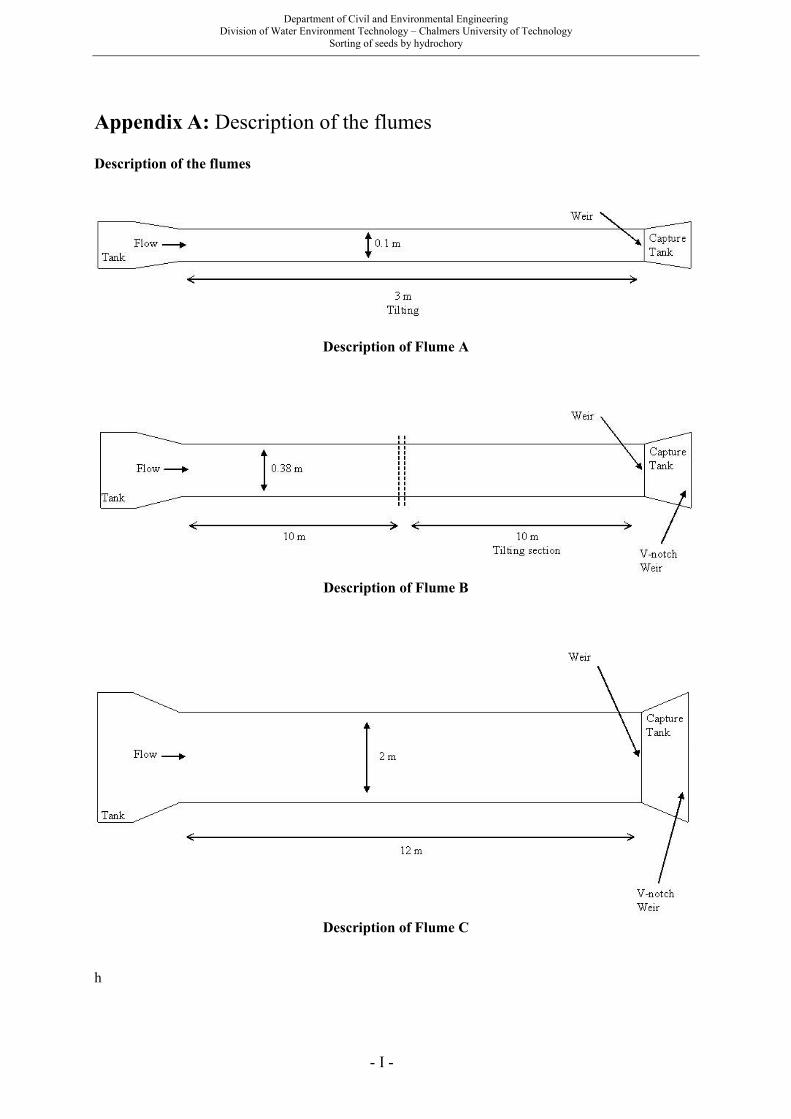
Department of Civil and Environmental Engineering Division of Water Environment Technology – Chalmers University of Technology
Sorting of seeds by hydrochory
- I -
Appendix A: Description of the flumes
Description of the flumes
Description of Flume A
Description of Flume B
Description of Flume C
h

Department of Civil and Environmental Engineering Division of Water Environment Technology – Chalmers University of Technology
Sorting of seeds by hydrochory
- II -
Appendix B: Results Mass of the seeds
Seed Type ns Mass
measured (g) M/seed (g)
African daisy 100 0.174 0.00174 Nasturtium 100 13.202 0.13202 Rhubarb 100 1.693 0.01693 Sun flowers with shell 100 5.763 0.05763 Marigold tall african 100 0.339 0.00339 Bells of Ireland 100 0.638 0.00638 Bird seeds 100 0.492 0.00492 Canary seeds 100 0.766 0.00766 Chick peas 100 38.589 0.38589 Linseed 100 0.712 0.00712 Mung beans 100 8.078 0.08078 Sun flowers without shell 100 4.780 0.0478 Sweetpeas bush types 100 8.968 0.08968
Size of the seeds
ll and li were measure from one picture and ls from another and compared to the ruler size (ref)
Seed Type Ref (pix) ll (pix) li (pix) ref 2 (pix) ls (pix) ll (mm) li (mm) ls (mm) CSF
African daisy 209 126 95 208 21 6.0 4.5 1.0 0.19 Nasturtium 210 162 134 214 149 7.7 7.0 6.4 0.87 Rhubarb 206 153 90 205 63 7.4 4.4 3.1 0.54 Sun flowers with shell 201 248 110 218 77 12.3 5.5 3.5 0.43 Marigold tall African 210 250 28 219 13 11.9 1.3 0.6 0.15 Bells of Ireland 211 74 69 205 41.9 3.5 3.3 2.0 0.60 Bird seeds 832 273 165 803 119 3.3 2.0 1.5 0.58 Canary seeds 752 404 148 767 128.58 5.4 2.0 1.7 0.52 Chick peas 820 931 761 787 632 11.4 9.3 8.0 0.78 Linseed 206 102 58 224 18 5.0 2.8 0.8 0.22 Mung beans 213 114 91.55 209 94 5.4 4.5 4.3 0.88 Sun flowers without shell 220 203 97 224 53.46 9.2 4.4 2.4 0.37 Sweetpeas bush types 210 126 122 208 114 6.0 5.8 5.5 0.93
Volume of the seeds
( ) 1.
m m mw s w s
s ns w
ρ
− −+Θ =
Seed Type ns ms ms+w mw Θs ρs
(g) (g) (g) (mm3) (kg.m-3
African daisy 50 0.087 48.640 49.072 10.40 167 Nasturtium 10 1.320 49.056 49.072 133.86 986 Rhubarb 50 0.846 48.734 49.072 23.73 713 Sun flowers with shell 20 1.153 48.523 49.072 85.23 676 Marigold tall african 20 0.068 49.056 49.072 4.20 808 Bells of Ireland 50 0.306 50.383 50.374 5.95 1072 Bird seeds 48 0.221 50.403 50.374 4.01 1228 Canary seeds 36 0.257 49.928 49.893 6.18 1240 Chick peas 10 3.883 50.108 49.072 285.21 1353 Linseed 29 0.184 49.913 49.893 5.67 1257 Mung beans 10 0.826 49.311 49.072 58.81 1374 Sun flowers without shell 20 0.952 49.908 49.893 46.93 1018 Sweetpeas bush types 10 0.948 49.386 49.048 61.11 1468

Department of Civil and Environmental Engineering Division of Water Environment Technology – Chalmers University of Technology
Sorting of seeds by hydrochory
- III -
Settling velocity of the seeds
ts is the time for the seed to settle in a 1.49m column of water Type of Seed ts ws
(s) (cm/s)
Bells of Ireland 55.5 2.68 Bird seeds 28.1 5.29 Canary seeds 28.7 5.19 Chick peas 7.7 19.27 Linseed 40.0 3.71 Mung beans 10.8 13.76 Sun flowers without shell 77.5 1.92 Sweetpeas bush types 8.3 17.82
Entrainment conditions of the seeds
Seed Type Nominal
Diameter Density Test number d50 u*
Shields
Parameter
(mm) (kg/m3) (mm) (m/s)
Bells of Ireland 1.56 1072 1 - 20 1.44 0.0091 0.0756 21 - 40 2.03 0.0102 0.0935 41 - 60 2.86 0.0115 0.1189 61 - 80 4.05 0.0139 0.1752 Bird seeds 1.37 1228 81 - 100 1.44 0.0106 0.0370 101 - 120 2.03 0.0158 0.0817 121 - 140 2.86 0.0198 0.1279 141 - 160 4.05 0.0237 0.1834 Canary seeds 1.58 1240 161 - 180 1.44 0.0141 0.0533 181 - 200 2.03 0.0191 0.0980 201 - 220 2.86 0.0227 0.1389 221 - 240 4.05 0.0270 0.1968 Chick peas 5.66 1353 241 - 260 1.44 0.0130 0.0086 261 - 280 2.03 0.0150 0.0114 281 - 300 2.86 0.0173 0.0152 301 - 320 4.05 0.0207 0.0219 Linseed 1.53 1257 321 - 340 1.44 0.0148 0.0566 341 - 360 2.03 0.0187 0.0902 361 - 380 2.86 0.0229 0.1358 381 - 400 4.05 0.0257 0.1707 Mung beans 3.35 1374 401 - 420 1.44 0.0104 0.0089 421 - 440 2.03 0.0144 0.0168 441 - 460 2.86 0.0193 0.0304 461 - 480 4.05 0.0235 0.0450 Sweetpeas bush types 3.39 1468 561 - 580 1.44 0.0115 0.0086 581 - 600 2.03 0.0141 0.0127 601 - 620 2.86 0.0186 0.0223 621 - 640 4.05 0.0233 0.0349

Department of Civil and Environmental Engineering Division of Water Environment Technology – Chalmers University of Technology
Sorting of seeds by hydrochory
- IV -
Geomorphology experiments
Results for bricks on the side of the flume 300 seeds released Discharge = 20.4 l.s-1 Depth = 21.4 cm Seed type Compartment number
1 2 3 4 5 6 7 8 9 10 11 12 13 14 15 16 17 18 19 20
Number of seeds trapped
Sunflower seeds 0 1 2 2 4 3 7 6 10 14 15 19 20 25 28 36 43 38 20 7
African Daisy 0 0 1 3 1 2 4 8 7 10 12 17 24 22 30 39 44 41 23 12
Marigold 0 1 2 1 3 5 2 3 14 11 16 19 19 26 32 41 44 37 18 6
Rhubarb 0 0 1 1 3 4 7 8 11 14 13 16 21 23 31 39 43 40 16 9
Nasturtium 0 0 1 1 4 6 10 12 13 14 16 17 24 27 31 34 36 36 14 4
Results for bricks in the middle of the flume 300 seeds released Discharge = 20.4 l.s-1 Depth = 21.4 cm Seed type Compartment number
1 2 3 4 5 6 7 8 9 10 11 12 13 14 15 16 17 18 19 20
Number of seeds trapped
Sunflower seeds 4 16 25 31 21 15 11 12 5 6 8 7 8 10 16 23 31 25 19 7
African Daisy 7 13 26 26 22 13 7 10 7 4 6 7 12 12 21 25 31 24 19 8
Marigold 3 17 21 30 22 17 8 7 3 7 5 8 7 19 24 27 32 19 17 7
Rhubarb 5 21 22 21 25 14 9 11 6 5 11 11 9 13 27 22 22 23 18 5
Nasturtium 2 19 23 24 20 19 12 5 8 3 6 8 6 15 21 32 28 25 21 3
Partially vegetated channel experiments
Experimental conditions Stem density Flow Depth Slope Stem Density Duration
(stem/m2) (m3/s) (mm) (mm/m) (stems/m2) (mn)
431 9.15 .10-06 131 1.21 431 8 1251 9.15 .10-06 131 1.21 1251 8 1681 9.15 .10-06 131 1.21 1681 8
Results 300 seeds released Seed Type Stem density (stem/m2)
431 1251 1681
Number of seeds trapped
Sunflower seeds 12 36 41 African Daisy 7 15 14 Marigold 5 13 16 Rhubarb 8 18 19 Nasturtium 2 3 3

Department of Civil and Environmental Engineering Division of Water Environment Technology – Chalmers University of Technology
Sorting of seeds by hydrochory
- V -
Wind experiments
200 seeds released Discharge = 21.8 l.s-1 Depth = 22.1 cm Seed type Compartment number
1 2 3 4 5 6 7 8 9 10 11 12 13 14 15 16 17 18 19 20
Number of seeds trapped
Sunflower seeds 14 38 54 50 20 6 2 4 4 4 0 2 2 0 0 0 0 0 0 0
African Daisy 12 30 24 28 26 22 12 14 10 8 4 2 4 2 2 0 0 0 0 0
Marigold 40 52 42 32 18 8 4 2 2 0 0 0 0 0 0 0 0 0 0 0
Rhubarb 18 68 38 22 16 10 4 10 4 4 2 2 2 0 0 0 0 0 0 0
Nasturtium 2 4 2 14 18 32 42 22 18 14 14 10 4 2 2 0 0 0 0 0
Fully vegetated channel experiments
Experimental conditions Test Flow Depth Slope Stem Density Duration
(m3/s) (mm) (mm/m) (stems/m2) (min)
A 7.56 .10-06 123 1.21 431 8 B 7.56 .10-06 123 1.21 1251 8 C 7.56 .10-06 123 1.21 1681 8
Results 300 seeds released Seed Type Stem density (stem/m2)
431 1251 1681
Number of seeds trapped
Sunflower seeds 20 44 51 African Daisy 194 204 215 Marigold 134 155 162 Rhubarb 137 141 149 Nasturtium 5 21 29
Sloping channel bank experiments
200 seeds released Seed Type Slope (degrees)
7 12.5 17.3
Number of seeds trapped
Sunflower seeds 36 30 11 African Daisy 16 13 8 Marigold 13 9 5 Rhubarb 41 36 13 Nasturtium 18 5 0
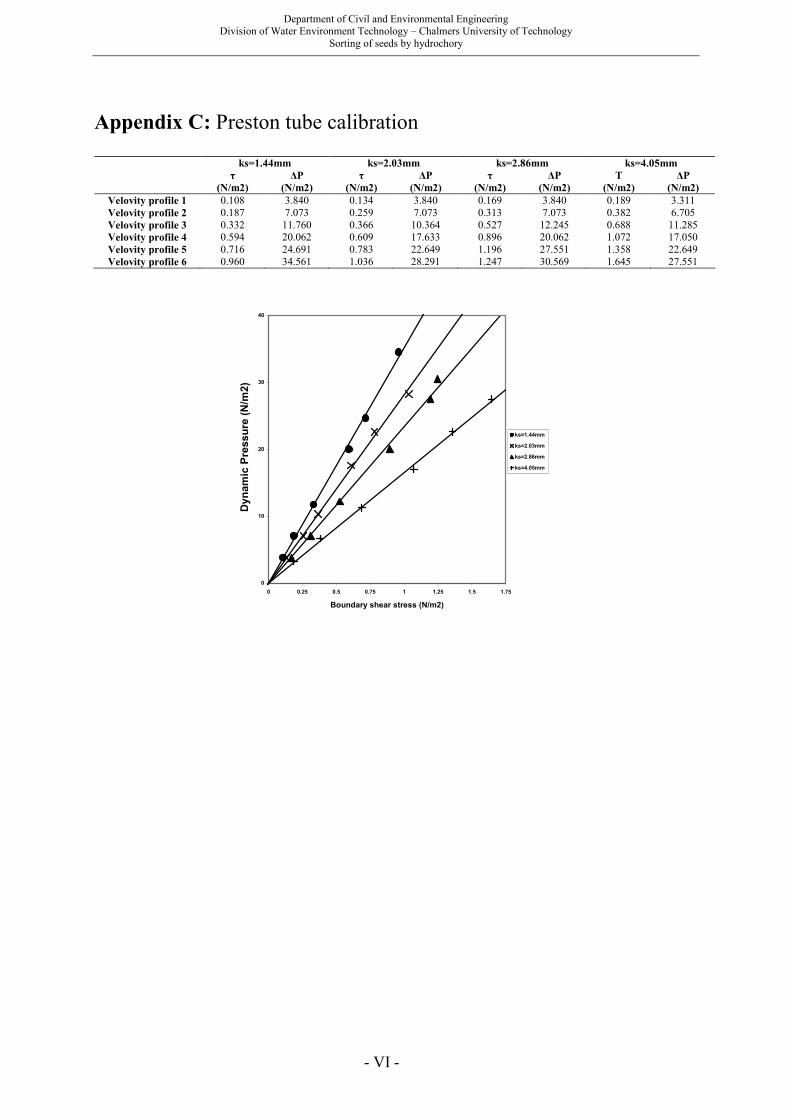
Department of Civil and Environmental Engineering Division of Water Environment Technology – Chalmers University of Technology
Sorting of seeds by hydrochory
- VI -
Appendix C: Preston tube calibration
ks=1.44mm ks=2.03mm ks=2.86mm ks=4.05mm
τ ∆P τ ∆P τ ∆P Τ ∆P
(N/m2) (N/m2) (N/m2) (N/m2) (N/m2) (N/m2) (N/m2) (N/m2)
Velovity profile 1 0.108 3.840 0.134 3.840 0.169 3.840 0.189 3.311 Velovity profile 2 0.187 7.073 0.259 7.073 0.313 7.073 0.382 6.705 Velovity profile 3 0.332 11.760 0.366 10.364 0.527 12.245 0.688 11.285 Velovity profile 4 0.594 20.062 0.609 17.633 0.896 20.062 1.072 17.050 Velovity profile 5 0.716 24.691 0.783 22.649 1.196 27.551 1.358 22.649 Velovity profile 6 0.960 34.561 1.036 28.291 1.247 30.569 1.645 27.551
0
10
20
30
40
0 0.25 0.5 0.75 1 1.25 1.5 1.75
Boundary shear stress (N/m2)
Dynamic Pressure (N/m
2)
ks=1.44mm
ks=2.03mm
ks=2.86mm
ks=4.05mm
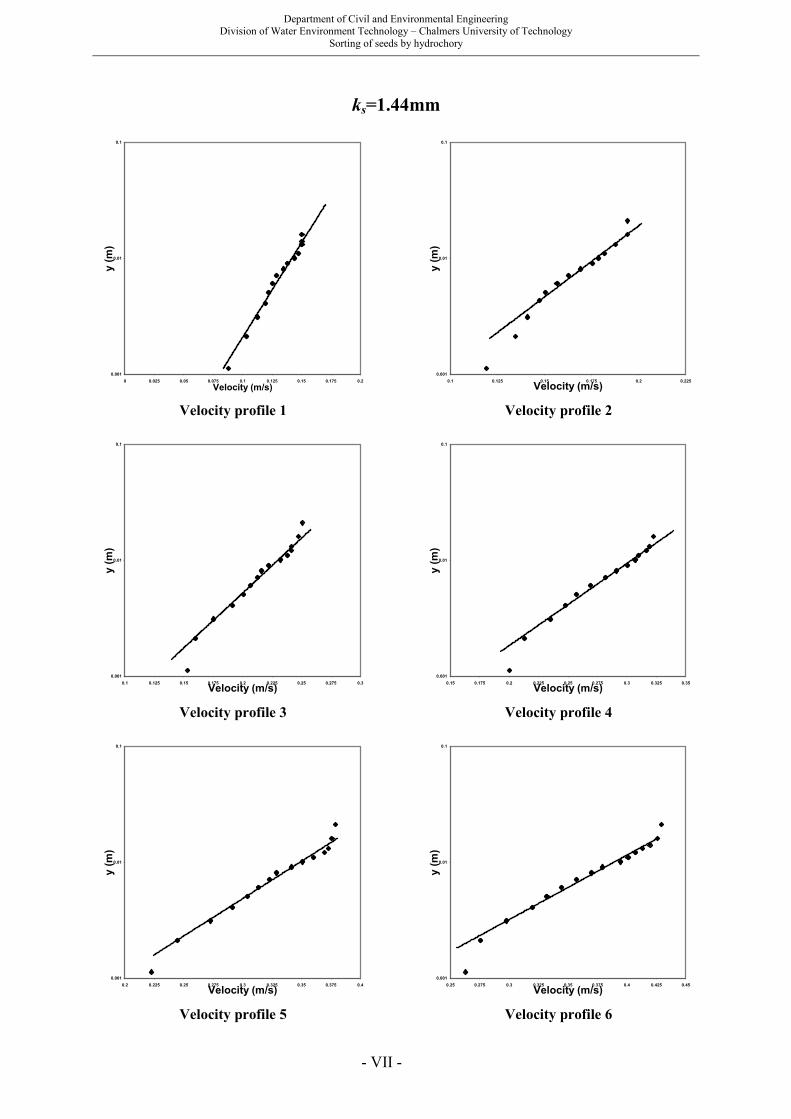
Department of Civil and Environmental Engineering Division of Water Environment Technology – Chalmers University of Technology
Sorting of seeds by hydrochory
- VII -
ks=1.44mm
0.001
0.01
0.1
0 0.025 0.05 0.075 0.1 0.125 0.15 0.175 0.2
Velocity (m/s)
y (m)
Velocity profile 1
0.001
0.01
0.1
0.1 0.125 0.15 0.175 0.2 0.225 0.25 0.275 0.3
Velocity (m/s)
y (m)
Velocity profile 3
0.001
0.01
0.1
0.2 0.225 0.25 0.275 0.3 0.325 0.35 0.375 0.4
Velocity (m/s)
y (m)
Velocity profile 5
0.001
0.01
0.1
0.1 0.125 0.15 0.175 0.2 0.225
Velocity (m/s)
y (m)
Velocity profile 2
0.001
0.01
0.1
0.15 0.175 0.2 0.225 0.25 0.275 0.3 0.325 0.35
Velocity (m/s)
y (m)
Velocity profile 4
0.001
0.01
0.1
0.25 0.275 0.3 0.325 0.35 0.375 0.4 0.425 0.45
Velocity (m/s)
y (m)
Velocity profile 6

Department of Civil and Environmental Engineering Division of Water Environment Technology – Chalmers University of Technology
Sorting of seeds by hydrochory
- VIII -
ks=2.05mm
0.001
0.01
0.1
0 0.025 0.05 0.075 0.1 0.125 0.15 0.175 0.2
Velocity (m/s)
y (m)
Velocity profile 1
0.001
0.01
0.1
0.1 0.125 0.15 0.175 0.2 0.225 0.25 0.275 0.3
Velocity (m/s)
y (m)
Velocity profile 3
0.001
0.01
0.1
0.2 0.225 0.25 0.275 0.3 0.325 0.35 0.375 0.4
Velocity (m/s)
y (m)
Velocity profile 5
0.001
0.01
0.1
0.1 0.125 0.15 0.175 0.2 0.225 0.25 0.275 0.3
Velocity (m/s)
y (m)
Velocity profile 2
0.001
0.01
0.1
0.15 0.175 0.2 0.225 0.25 0.275 0.3 0.325 0.35
Velocity (m/s)
y (m)
Velocity profile 4
0.001
0.01
0.1
0.225 0.25 0.275 0.3 0.325 0.35 0.375 0.4 0.425
Velocity (m/s)
y (m)
Velocity profile 6
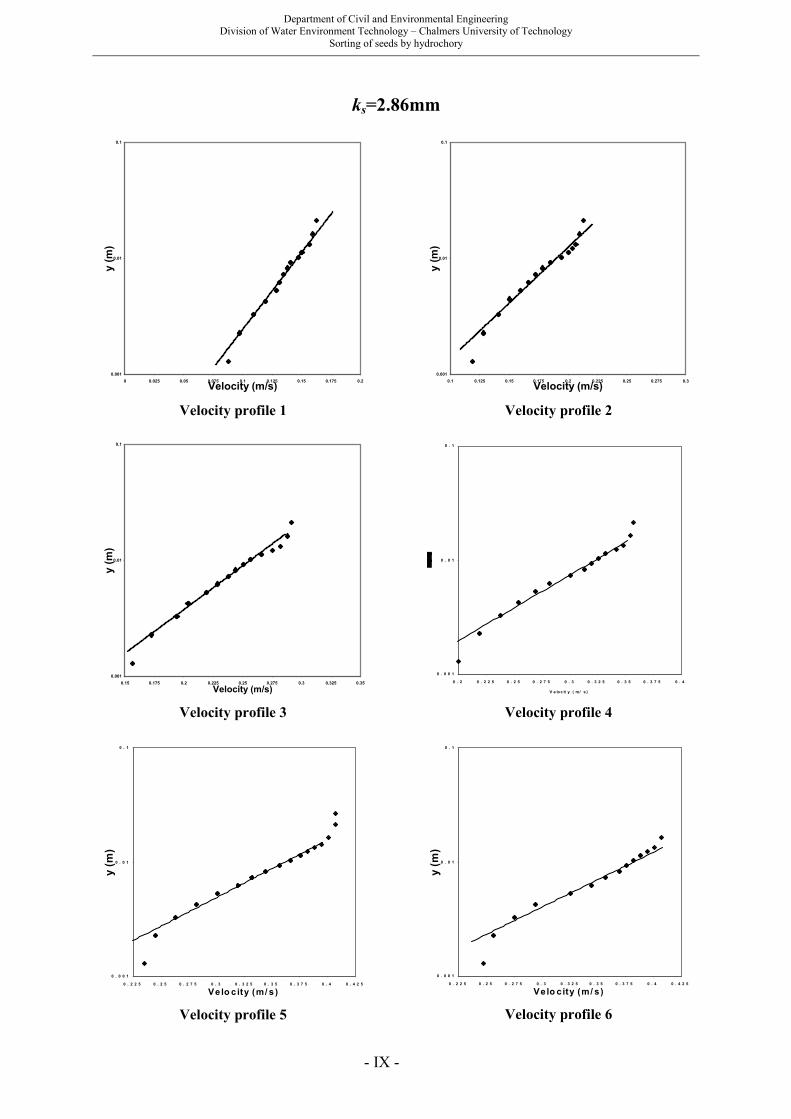
Department of Civil and Environmental Engineering Division of Water Environment Technology – Chalmers University of Technology
Sorting of seeds by hydrochory
- IX -
ks=2.86mm
0.001
0.01
0.1
0 0.025 0.05 0.075 0.1 0.125 0.15 0.175 0.2
Velocity (m/s)
y (m)
Velocity profile 1
0.001
0.01
0.1
0.15 0.175 0.2 0.225 0.25 0.275 0.3 0.325 0.35
Velocity (m/s)
y (m)
Velocity profile 3
0 . 0 0 1
0 . 0 1
0 . 1
0 . 2 2 5 0 . 2 5 0 . 2 7 5 0 . 3 0 . 3 2 5 0 . 3 5 0 . 3 7 5 0 . 4 0 . 4 2 5
Velo city (m/ s)
y (m)
Velocity profile 5
0.001
0.01
0.1
0.1 0.125 0.15 0.175 0.2 0.225 0.25 0.275 0.3
Velocity (m/s)
y (m)
Velocity profile 2
0 . 0 0 1
0 . 0 1
0 . 1
0 . 2 0 . 2 2 5 0 . 2 5 0 . 2 7 5 0 . 3 0 . 3 2 5 0 . 3 5 0 . 3 7 5 0 . 4
V e loc it y ( m/ s )
Velocity profile 4
0 . 0 0 1
0 . 0 1
0 . 1
0 . 2 2 5 0 . 2 5 0 . 2 7 5 0 . 3 0 . 3 2 5 0 . 3 5 0 . 3 7 5 0 . 4 0 . 4 2 5
Velo city (m/ s)
y (m)
Velocity profile 6

Department of Civil and Environmental Engineering Division of Water Environment Technology – Chalmers University of Technology
Sorting of seeds by hydrochory
- X -
ks=4.05mm
0 . 0 0 1
0 . 0 1
0 . 1
0 0 . 0 2 5 0 . 0 5 0 . 0 7 5 0 . 1 0 . 1 2 5 0 . 1 5 0 . 1 7 5 0 . 2
Velocity (m/s)
y (m)
Velocity profile 1
0 . 0 0 1
0 . 0 1
0 . 1
0 . 1 2 2 5 0 . 1 4 7 5 0 . 1 7 2 5 0 . 1 9 7 5 0 . 2 2 2 5 0 . 2 4 7 5 0 . 2 7 2 5 0 . 2 9 7 5 0 . 3 2 2 5
Velocity (m/s)
y (m)
Velocity profile 3
0 . 0 0 1
0 . 0 1
0 . 1
0 . 2 0 . 2 2 5 0 . 2 5 0 . 2 7 5 0 . 3 0 . 3 2 5 0 . 3 5 0 . 3 7 5 0 . 4 0 . 4 2 5 0 . 4 5
Velocity (m/s)
y (m)
Velocity profile 5
0 . 0 0 1
0 . 0 1
0 . 1
0 . 1 0 . 1 2 5 0 . 1 5 0 . 1 7 5 0 . 2 0 . 2 2 5 0 . 2 5 0 . 2 7 5 0 . 3
V e loc it y ( m/ s )
y (m)
Velocity profile 2
0 . 0 0 1
0 . 0 1
0 . 1
0 . 1 7 5 0 . 2 0 . 2 2 5 0 . 2 5 0 . 2 7 5 0 . 3 0 . 3 2 5 0 . 3 5 0 . 3 7 5 0 . 4
Velocity (m/s)
y (m)
Velocity profile 4
0.001
0.01
0.1
0.2 0.225 0.25 0.275 0.3 0.325 0.35 0.375 0.4 0.425 0.45
Velocity (m/s)
y (m)
Velocity profile 6