
Massachusetts Administrator & Director of Nurses Wage & Benefit Update
19
©2011 LarsonAllen LLP 1 1 1 ©2011 LarsonAllen LLP Massachusetts Administrator & Director of Nurses Wage & Benefit Update For The Massachusetts Chapter of the American College of Health Care Administrators Notre Dame Healthcare Center Worcester, Massachusetts June 23 rd, , 2011
-
Upload
rooney-holmes -
Category
Documents
-
view
14 -
download
0
description
Massachusetts Administrator & Director of Nurses Wage & Benefit Update. For The Massachusetts Chapter of the American College of Health Care Administrators Notre Dame Healthcare Center Worcester, Massachusetts June 23 rd, , 2011. Footnotes. - PowerPoint PPT Presentation
Transcript of Massachusetts Administrator & Director of Nurses Wage & Benefit Update
©20
11 L
arso
nAlle
n L
LP
111
©20
11 L
arso
nAlle
n L
LP
Massachusetts Administrator & Director of NursesWage & Benefit Update
For
The Massachusetts Chapter of the American College of Health Care Administrators
Notre Dame Healthcare Center
Worcester, Massachusetts
June 23rd,, 2011
©20
11 L
arso
nAlle
n L
LP
2
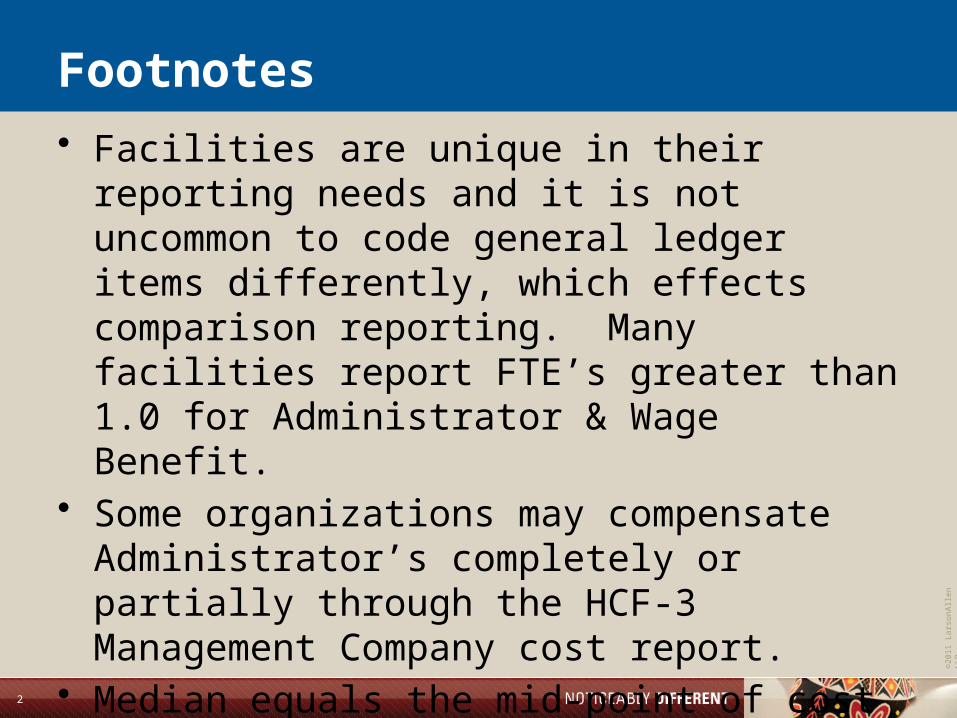
Footnotes
• Facilities are unique in their reporting needs and it is not uncommon to code general ledger items differently, which effects comparison reporting. Many facilities report FTE’s greater than 1.0 for Administrator & Wage Benefit.
• Some organizations may compensate Administrator’s completely or partially through the HCF-3 Management Company cost report.
• Median equals the mid-point of cost reported.
©20
11 L
arso
nAlle
n L
LP
3
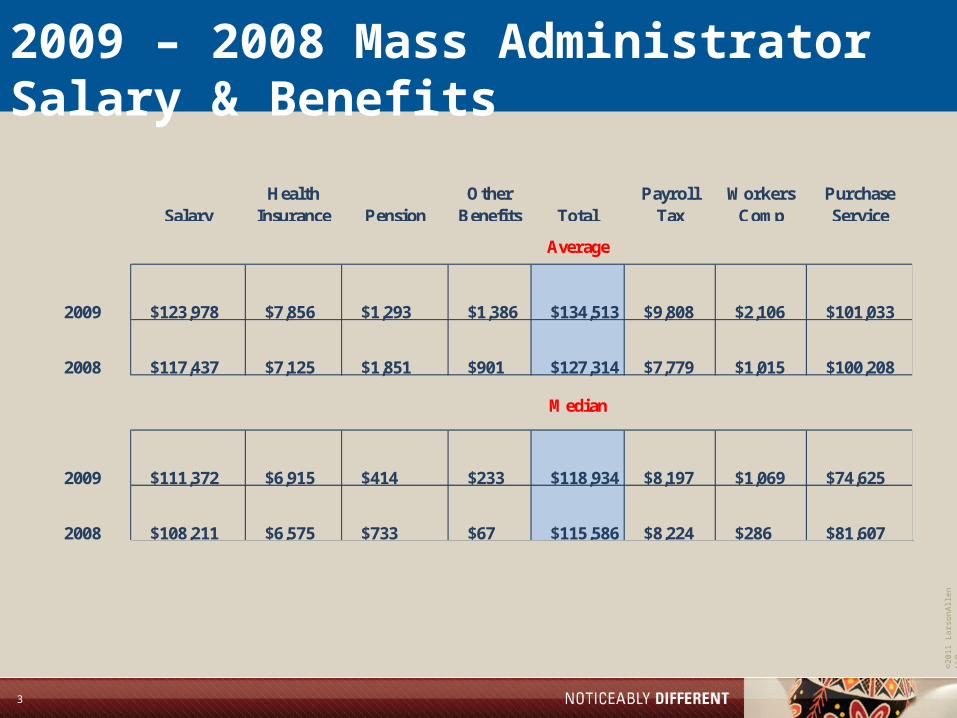
2009 – 2008 Mass Administrator Salary & Benefits
SalaryHealth
Insurance PensionOther
Benefits TotalPayroll
TaxWorkers
CompPurchase Service
Average
2009 $123,978 $7,856 $1,293 $1,386 $134,513 $9,808 $2,106 $101,033
2008 $117,437 $7,125 $1,851 $901 $127,314 $7,779 $1,015 $100,208
Median
2009 $111,372 $6,915 $414 $233 $118,934 $8,197 $1,069 $74,625
2008 $108,211 $6,575 $733 $67 $115,586 $8,224 $286 $81,607
©20
11 L
arso
nAlle
n L
LP
4
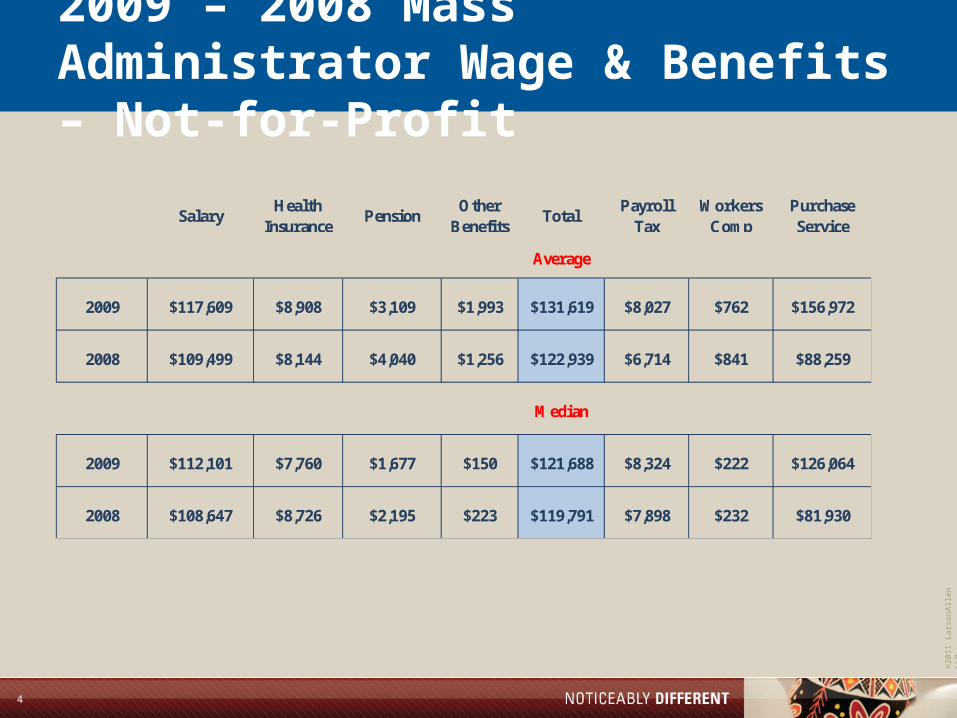
2009 – 2008 Mass Administrator Wage & Benefits – Not-for-Profit
SalaryHealth
InsurancePension
Other Benefits
TotalPayroll
TaxWorkers
CompPurchase Service
Average
2009 $117,609 $8,908 $3,109 $1,993 $131,619 $8,027 $762 $156,972
2008 $109,499 $8,144 $4,040 $1,256 $122,939 $6,714 $841 $88,259
Median
2009 $112,101 $7,760 $1,677 $150 $121,688 $8,324 $222 $126,064
2008 $108,647 $8,726 $2,195 $223 $119,791 $7,898 $232 $81,930
©20
11 L
arso
nAlle
n L
LP
5
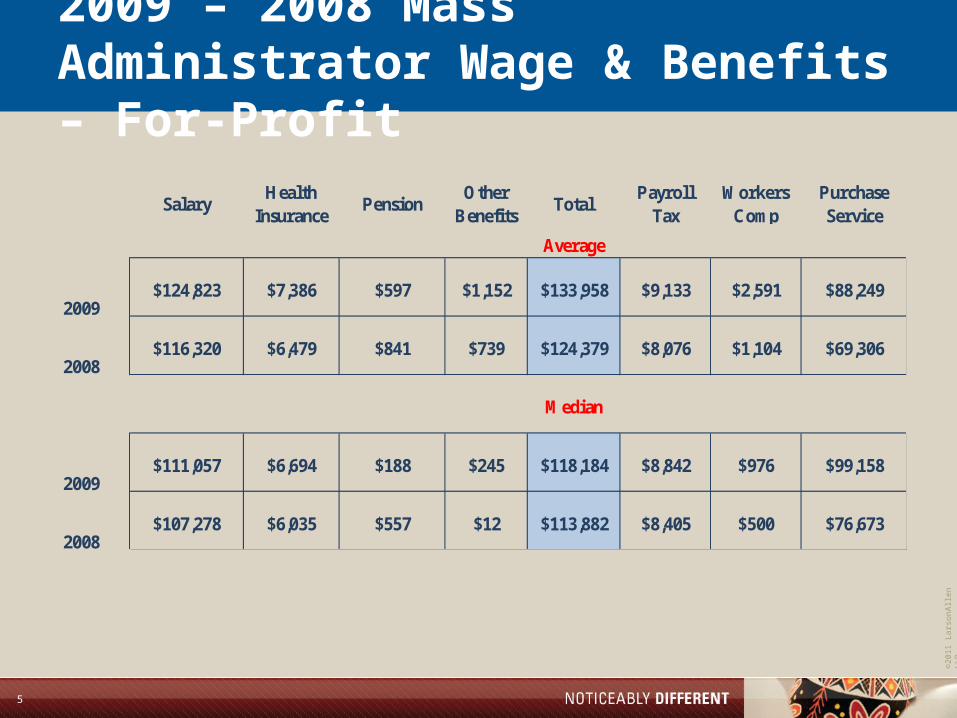
2009 – 2008 Mass Administrator Wage & Benefits – For-Profit
SalaryHealth
InsurancePension
Other Benefits
TotalPayroll
TaxWorkers
CompPurchase Service
Average
2009$124,823 $7,386 $597 $1,152 $133,958 $9,133 $2,591 $88,249
2008$116,320 $6,479 $841 $739 $124,379 $8,076 $1,104 $69,306
Median
2009$111,057 $6,694 $188 $245 $118,184 $8,842 $976 $99,158
2008$107,278 $6,035 $557 $12 $113,882 $8,405 $500 $76,673
©20
11 L
arso
nAlle
n L
LP
6
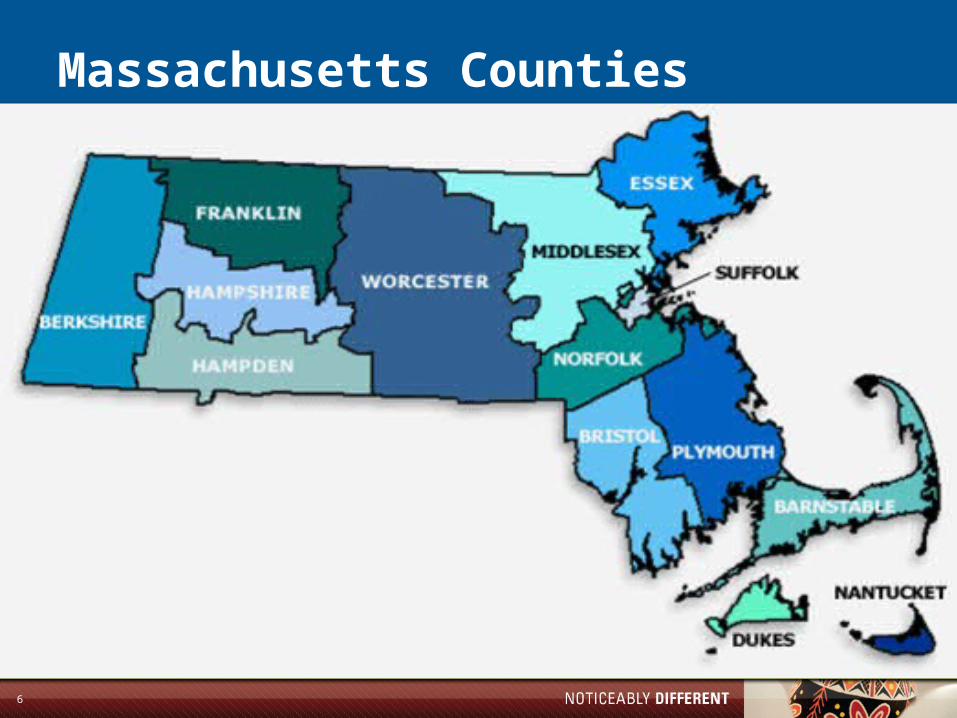
Massachusetts Counties
©20
11 L
arso
nAlle
n L
LP
7
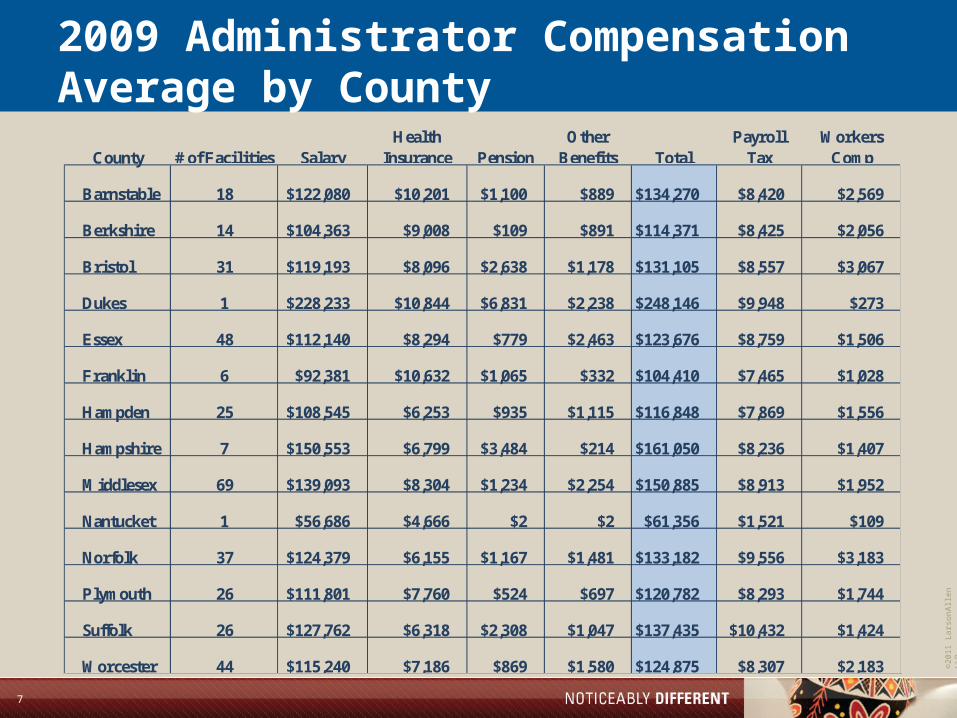
2009 Administrator Compensation Average by County
County # of Facilities SalaryHealth
Insurance PensionOther
Benefits TotalPayroll
TaxWorkers
Comp
Barnstable 18 $122,080 $10,201 $1,100 $889 $134,270 $8,420 $2,569
Berkshire 14 $104,363 $9,008 $109 $891 $114,371 $8,425 $2,056
Bristol 31 $119,193 $8,096 $2,638 $1,178 $131,105 $8,557 $3,067
Dukes 1 $228,233 $10,844 $6,831 $2,238 $248,146 $9,948 $273
Essex 48 $112,140 $8,294 $779 $2,463 $123,676 $8,759 $1,506
Franklin 6 $92,381 $10,632 $1,065 $332 $104,410 $7,465 $1,028
Hampden 25 $108,545 $6,253 $935 $1,115 $116,848 $7,869 $1,556
Hampshire 7 $150,553 $6,799 $3,484 $214 $161,050 $8,236 $1,407
Middlesex 69 $139,093 $8,304 $1,234 $2,254 $150,885 $8,913 $1,952
Nantucket 1 $56,686 $4,666 $2 $2 $61,356 $1,521 $109
Norfolk 37 $124,379 $6,155 $1,167 $1,481 $133,182 $9,556 $3,183
Plymouth 26 $111,801 $7,760 $524 $697 $120,782 $8,293 $1,744
Suffolk 26 $127,762 $6,318 $2,308 $1,047 $137,435 $10,432 $1,424
Worcester 44 $115,240 $7,186 $869 $1,580 $124,875 $8,307 $2,183
©20
11 L
arso
nAlle
n L
LP
8
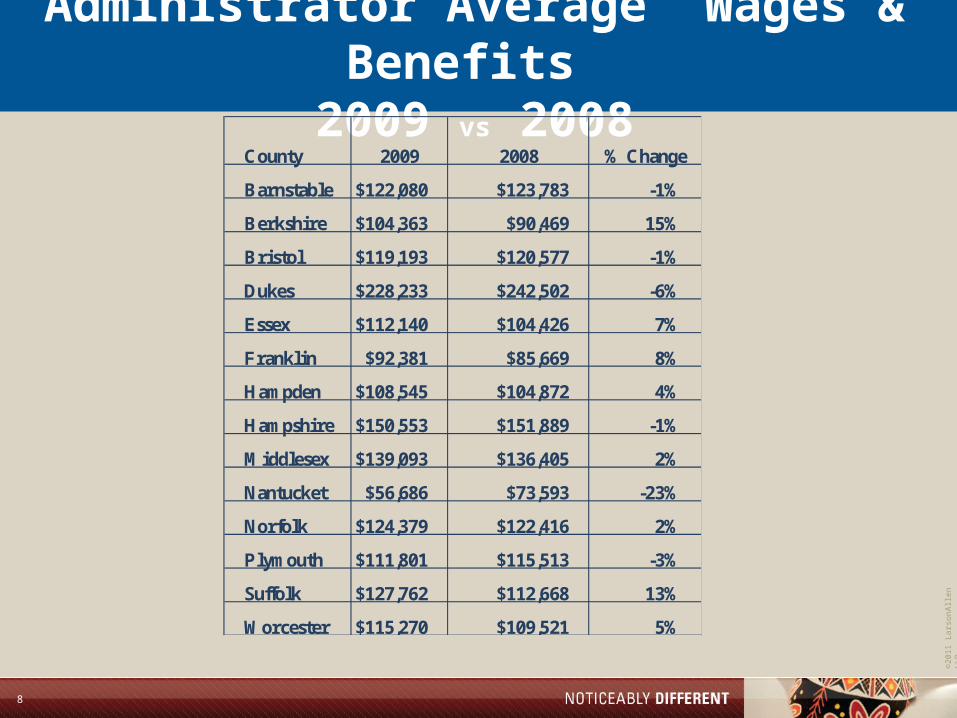
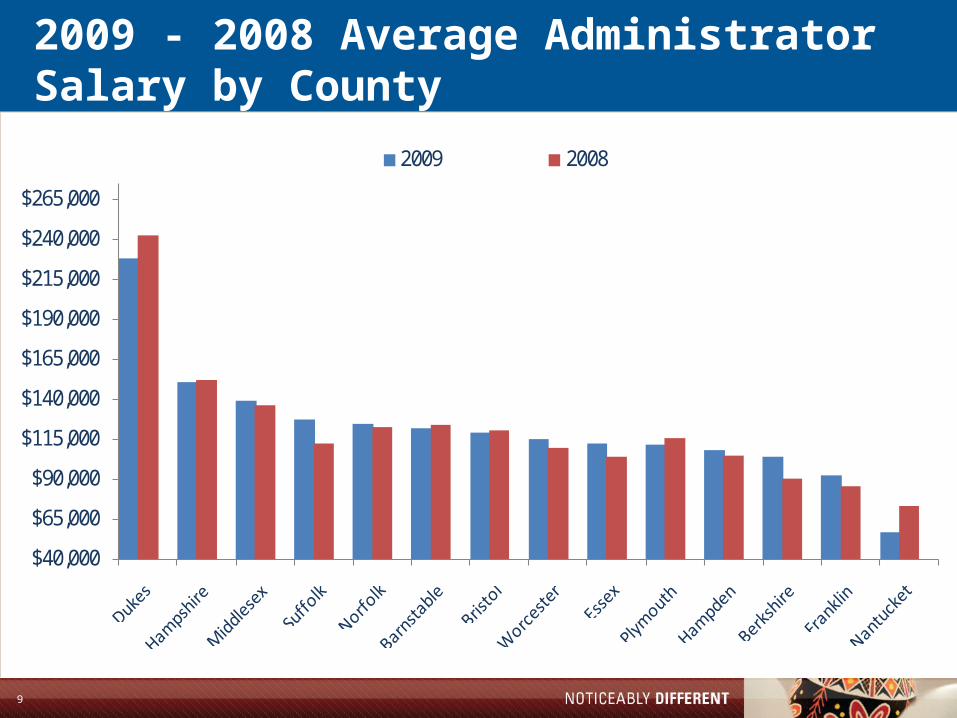
Administrator Average Wages & Benefits 2009 vs 2008
County 2009 2008 % Change
Barnstable $122,080 $123,783 -1%
Berkshire $104,363 $90,469 15%
Bristol $119,193 $120,577 -1%
Dukes $228,233 $242,502 -6%
Essex $112,140 $104,426 7%
Franklin $92,381 $85,669 8%
Hampden $108,545 $104,872 4%
Hampshire $150,553 $151,889 -1%
Middlesex $139,093 $136,405 2%
Nantucket $56,686 $73,593 -23%
Norfolk $124,379 $122,416 2%
Plymouth $111,801 $115,513 -3%
Suffolk $127,762 $112,668 13%
Worcester $115,270 $109,521 5%
©20
11 L
arso
nAlle
n L
LP
9
2009 - 2008 Average Administrator Salary by County(Salary , Health Ins, Pensions, Other Benefits)
$40,000
$65,000
$90,000
$115,000
$140,000
$165,000
$190,000
$215,000
$240,000
$265,000
2009 2008
©20
11 L
arso
nAlle
n L
LP
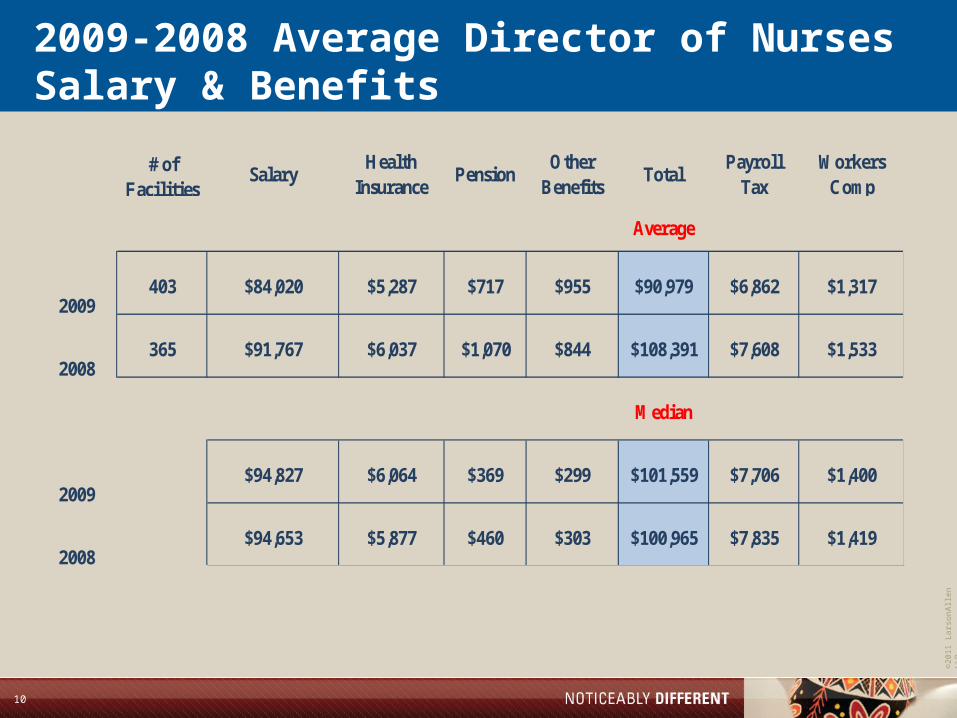
10
2009-2008 Average Director of Nurses Salary & Benefits
# of Facilities
SalaryHealth
InsurancePension
Other Benefits
TotalPayroll
TaxWorkers
Comp
Average
2009403 $84,020 $5,287 $717 $955 $90,979 $6,862 $1,317
2008365 $91,767 $6,037 $1,070 $844 $108,391 $7,608 $1,533
Median
2009$94,827 $6,064 $369 $299 $101,559 $7,706 $1,400
2008$94,653 $5,877 $460 $303 $100,965 $7,835 $1,419
©20
11 L
arso
nAlle
n L
LP
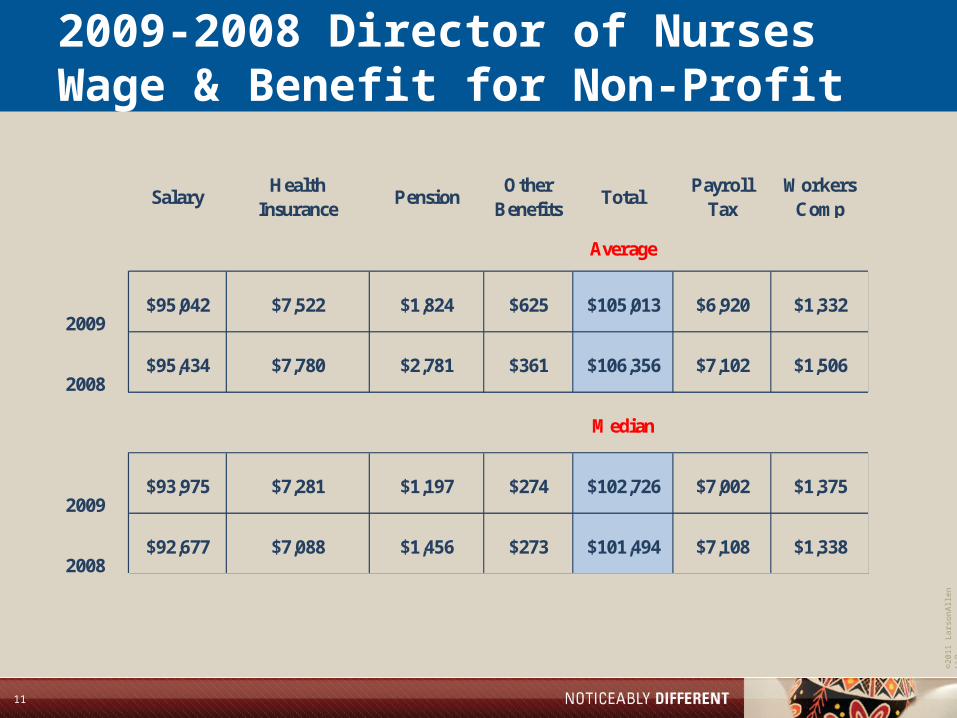
11
2009-2008 Director of Nurses Wage & Benefit for Non-Profit
SalaryHealth
InsurancePension
Other Benefits
TotalPayroll
TaxWorkers
Comp
Average
2009$95,042 $7,522 $1,824 $625 $105,013 $6,920 $1,332
2008$95,434 $7,780 $2,781 $361 $106,356 $7,102 $1,506
Median
2009$93,975 $7,281 $1,197 $274 $102,726 $7,002 $1,375
2008$92,677 $7,088 $1,456 $273 $101,494 $7,108 $1,338
©20
11 L
arso
nAlle
n L
LP
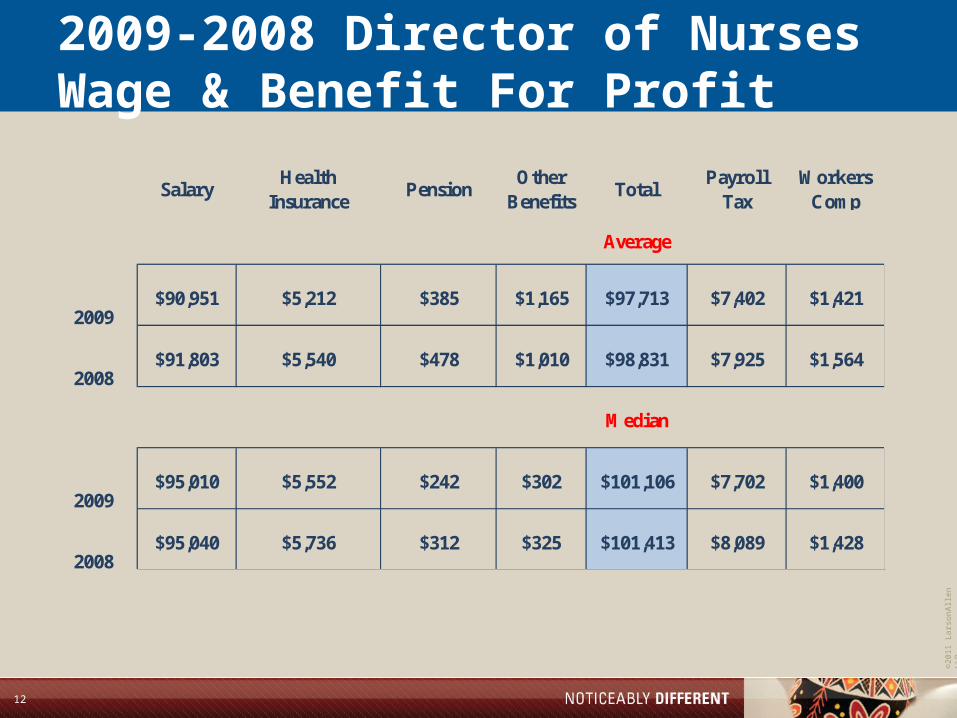
12
2009-2008 Director of Nurses Wage & Benefit For Profit
SalaryHealth
InsurancePension
Other Benefits
TotalPayroll
TaxWorkers
Comp
Average
2009$90,951 $5,212 $385 $1,165 $97,713 $7,402 $1,421
2008$91,803 $5,540 $478 $1,010 $98,831 $7,925 $1,564
Median
2009$95,010 $5,552 $242 $302 $101,106 $7,702 $1,400
2008$95,040 $5,736 $312 $325 $101,413 $8,089 $1,428
©20
11 L
arso
nAlle
n L
LP
13
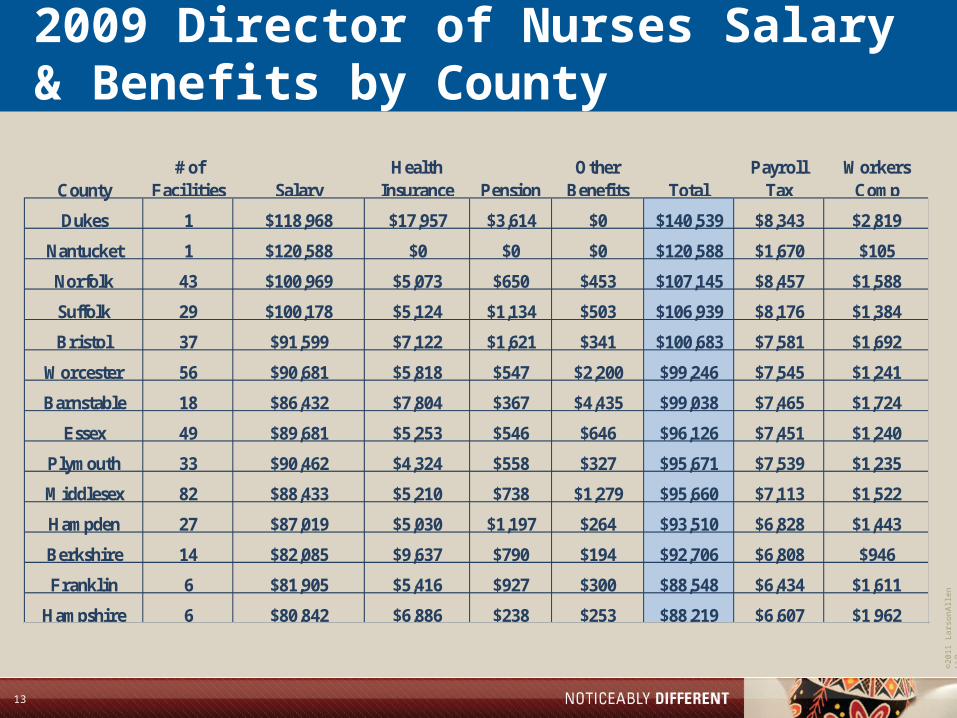
2009 Director of Nurses Salary & Benefits by County
County# of
Facilities SalaryHealth
Insurance PensionOther
Benefits TotalPayroll
TaxWorkers
Comp
Dukes 1 $118,968 $17,957 $3,614 $0 $140,539 $8,343 $2,819
Nantucket 1 $120,588 $0 $0 $0 $120,588 $1,670 $105
Norfolk 43 $100,969 $5,073 $650 $453 $107,145 $8,457 $1,588
Suffolk 29 $100,178 $5,124 $1,134 $503 $106,939 $8,176 $1,384
Bristol 37 $91,599 $7,122 $1,621 $341 $100,683 $7,581 $1,692
Worcester 56 $90,681 $5,818 $547 $2,200 $99,246 $7,545 $1,241
Barnstable 18 $86,432 $7,804 $367 $4,435 $99,038 $7,465 $1,724
Essex 49 $89,681 $5,253 $546 $646 $96,126 $7,451 $1,240
Plymouth 33 $90,462 $4,324 $558 $327 $95,671 $7,539 $1,235
Middlesex 82 $88,433 $5,210 $738 $1,279 $95,660 $7,113 $1,522
Hampden 27 $87,019 $5,030 $1,197 $264 $93,510 $6,828 $1,443
Berkshire 14 $82,085 $9,637 $790 $194 $92,706 $6,808 $946
Franklin 6 $81,905 $5,416 $927 $300 $88,548 $6,434 $1,611
Hampshire 6 $80,842 $6,886 $238 $253 $88,219 $6,607 $1,962
©20
11 L
arso
nAlle
n L
LP
14
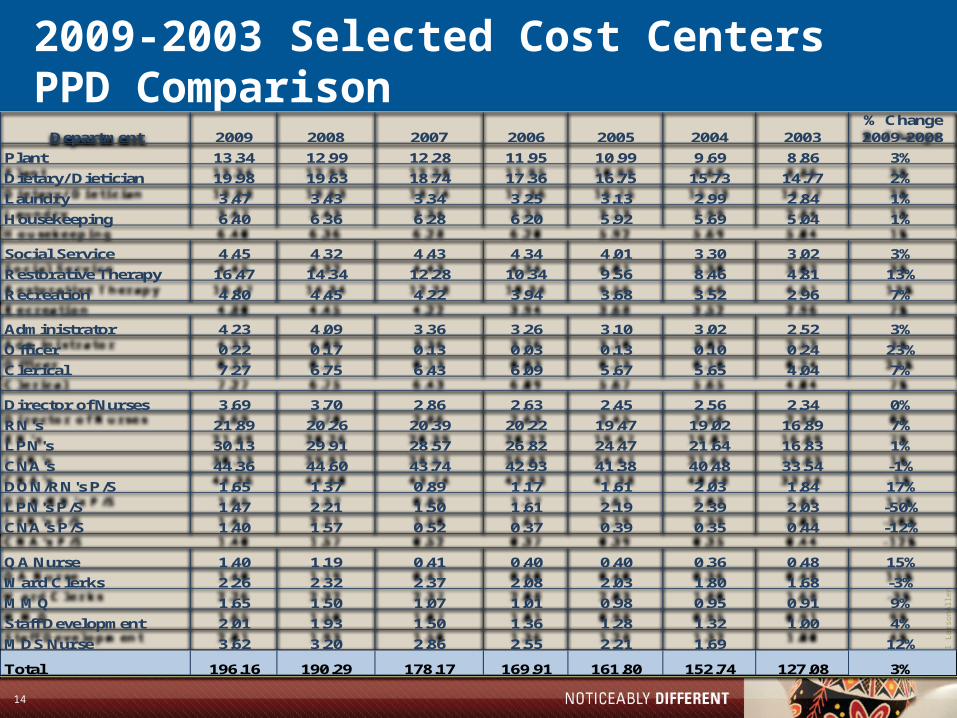
2009-2003 Selected Cost Centers PPD Comparison
Department 2009 2008 2007 2006 2005 2004 2003% Change 2009-2008
Plant 13.34 12.99 12.28 11.95 10.99 9.69 8.86 3%
Dietary/ Dietician 19.98 19.63 18.74 17.36 16.75 15.73 14.77 2%
Laundry 3.47 3.43 3.34 3.25 3.13 2.99 2.84 1%
Housekeeping 6.40 6.36 6.28 6.20 5.92 5.69 5.04 1%
Social Service 4.45 4.32 4.43 4.34 4.01 3.30 3.02 3%
Restorative Therapy 16.47 14.34 12.28 10.34 9.56 8.46 4.81 13%
Recreation 4.80 4.45 4.22 3.94 3.68 3.52 2.96 7%
Administrator 4.23 4.09 3.36 3.26 3.10 3.02 2.52 3%
Officer 0.22 0.17 0.13 0.03 0.13 0.10 0.24 23%
Clerical 7.27 6.75 6.43 6.09 5.67 5.65 4.04 7%
Director of Nurses 3.69 3.70 2.86 2.63 2.45 2.56 2.34 0%
RN's 21.89 20.26 20.39 20.22 19.47 19.02 16.89 7%
LPN's 30.13 29.91 28.57 26.82 24.47 21.64 16.83 1%
CNA's 44.36 44.60 43.74 42.93 41.38 40.48 33.54 -1%
DON/RN's P/S 1.65 1.37 0.89 1.17 1.61 2.03 1.84 17%
LPN's P/S 1.47 2.21 1.50 1.61 2.19 2.39 2.03 -50%
CNA's P/S 1.40 1.57 0.52 0.37 0.39 0.35 0.44 -12%
QA Nurse 1.40 1.19 0.41 0.40 0.40 0.36 0.48 15%
Ward Clerks 2.26 2.32 2.37 2.08 2.03 1.80 1.68 -3%
MMQ 1.65 1.50 1.07 1.01 0.98 0.95 0.91 9%
Staff Development 2.01 1.93 1.50 1.36 1.28 1.32 1.00 4%
MDS Nurse 3.62 3.20 2.86 2.55 2.21 1.69 12%
Total 196.16 190.29 178.17 169.91 161.80 152.74 127.08 3%
©20
11 L
arso
nAlle
n L
LP
15
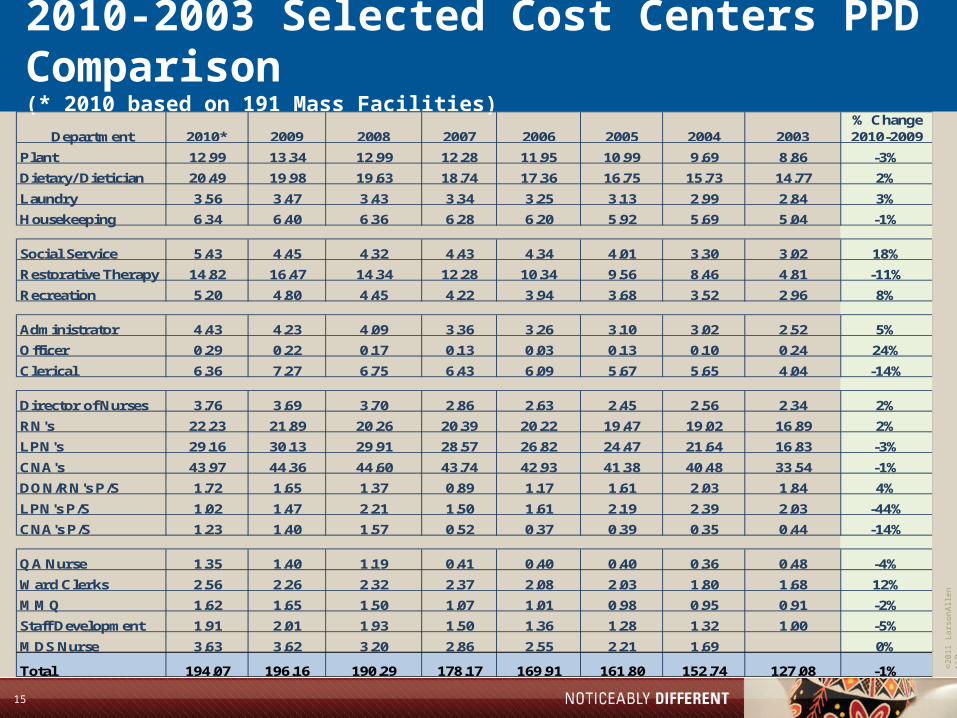
2010-2003 Selected Cost Centers PPD Comparison(* 2010 based on 191 Mass Facilities)
Department 2010* 2009 2008 2007 2006 2005 2004 2003% Change 2010-2009
Plant 12.99 13.34 12.99 12.28 11.95 10.99 9.69 8.86 -3%
Dietary/ Dietician 20.49 19.98 19.63 18.74 17.36 16.75 15.73 14.77 2%
Laundry 3.56 3.47 3.43 3.34 3.25 3.13 2.99 2.84 3%
Housekeeping 6.34 6.40 6.36 6.28 6.20 5.92 5.69 5.04 -1%
Social Service 5.43 4.45 4.32 4.43 4.34 4.01 3.30 3.02 18%
Restorative Therapy 14.82 16.47 14.34 12.28 10.34 9.56 8.46 4.81 -11%
Recreation 5.20 4.80 4.45 4.22 3.94 3.68 3.52 2.96 8%
Administrator 4.43 4.23 4.09 3.36 3.26 3.10 3.02 2.52 5%
Officer 0.29 0.22 0.17 0.13 0.03 0.13 0.10 0.24 24%
Clerical 6.36 7.27 6.75 6.43 6.09 5.67 5.65 4.04 -14%
Director of Nurses 3.76 3.69 3.70 2.86 2.63 2.45 2.56 2.34 2%
RN's 22.23 21.89 20.26 20.39 20.22 19.47 19.02 16.89 2%
LPN's 29.16 30.13 29.91 28.57 26.82 24.47 21.64 16.83 -3%
CNA's 43.97 44.36 44.60 43.74 42.93 41.38 40.48 33.54 -1%
DON/RN's P/S 1.72 1.65 1.37 0.89 1.17 1.61 2.03 1.84 4%
LPN's P/S 1.02 1.47 2.21 1.50 1.61 2.19 2.39 2.03 -44%
CNA's P/S 1.23 1.40 1.57 0.52 0.37 0.39 0.35 0.44 -14%
QA Nurse 1.35 1.40 1.19 0.41 0.40 0.40 0.36 0.48 -4%
Ward Clerks 2.56 2.26 2.32 2.37 2.08 2.03 1.80 1.68 12%
MMQ 1.62 1.65 1.50 1.07 1.01 0.98 0.95 0.91 -2%
Staff Development 1.91 2.01 1.93 1.50 1.36 1.28 1.32 1.00 -5%
MDS Nurse 3.63 3.62 3.20 2.86 2.55 2.21 1.69 0%
Total 194.07 196.16 190.29 178.17 169.91 161.80 152.74 127.08 -1%

©20
11 L
arso
nAlle
n L
LP
16
LarsonAllen LLP – BackgroundCPAs, Consultants & Advisors
History and experience
LarsonAllen is one of the top 20 accounting firms in the nation, according to Accounting Today. We provide assurance, accounting, tax consulting, and advisory services to organizations and individuals managing business ventures and finance. Founded in 1953, LarsonAllen is dedicated to creating a noticeably different experience for our clients.
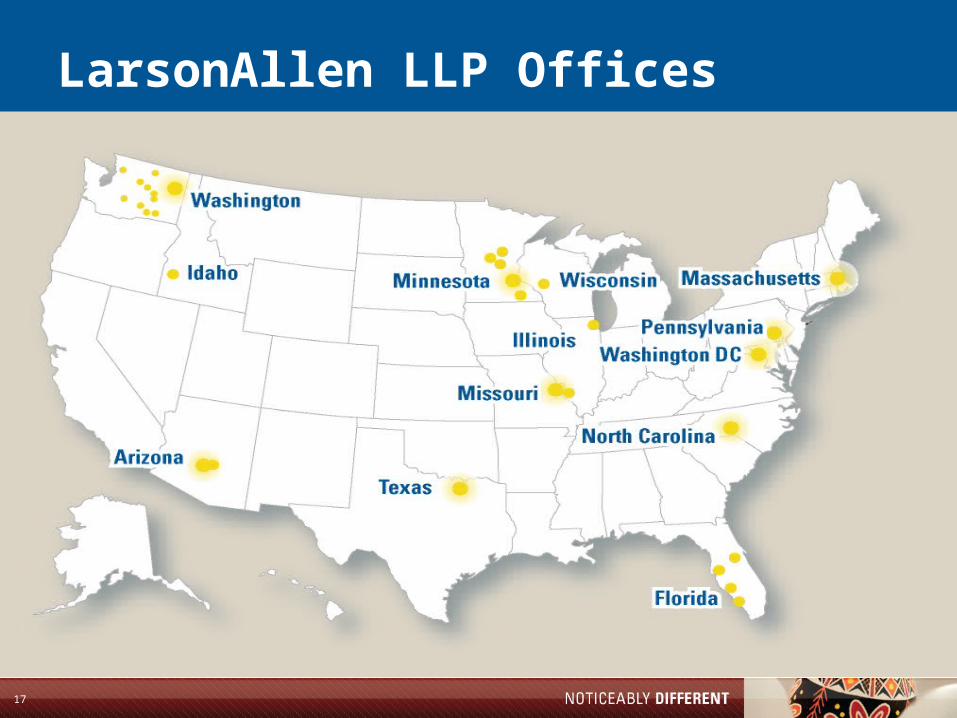
We provide our clients with industry specialists and high quality business resources. With approximately 1,800 people and more than 40 locations, we have significant depth and talent, experience, and national perspective. LarsonAllen is an independent member of Nexia International, a top 10 worldwide organization providing global connections.
Our mission – Create a noticeable different client experience.
We serve our clients with quality and integrity and meet their needs through a primary advisor relationship. We stress open communication, efficiency, and a relationship grounded in fairness and trust as your accountants, consultants, and advisors.
©20
11 L
arso
nAlle
n L
LP
17
LarsonAllen LLP Offices
©20
11 L
arso
nAlle
n L
LP
18
Profile ---- Richard Hamilton, CNHA, R.Ph., MBA Principal
• Rick has extensive experience in entitlement, clinical coverage, documentation, billing, audit triggers, and managed care contracting. His specialties include operational strategies maximizing reimbursement and implementing compliance programs.
• Experience in serving clients• Rick has over 25 years of health care experience including long term care operations, administration,
planning and organizing new senior care programs in housing, assisted living, adult day health care, medical model clinics and long term care pharmacy services.
• Technical expertise• Rick’s focus in on regulatory compliance and maximizing operational reimbursement for long term care
organizations. His SNF consulting expertise frequently focuses on benchmark comparisons, operational reviews, survey preparation and assistance, third party reimbursement issues, litigation support, clinical reimbursement appeals, pharmacy pricing analyses and rehabilitation services.
• Educational / professional involvement• Rick holds a Master in Business Administration from Suffolk University, Boston, MA, a Bachelor of
Science Degree in Pharmacy from the Massachusetts College of Pharmacy, Boston, MA, and an Associate Degree in Nursing Home Administration from Northern Essex Community College in Haverhill, MA. He is a Certified Nursing Home Administrator, Fellow of the American College of Health Care Administrators (ACHCA), past Massachusetts Chapter President and a Registered Pharmacist. His professional affiliations include Board Member of the Massachusetts Long Term Care Finance Association (LTCFA) and memberships in the American Society of Consultant Pharmacists (ASCP) and Massachusetts Chapter of the American Medical Directors Association (MAMDA). A frequent speaker, Rick actively participates and supports state and regional associations and presents from a unique perspective integrating his clinical, operational and fiscal backgrounds.
©20
11 L
arso
nAlle
n L
LP
19
Follow our blog for current
discussions on health care.
www.larsonallen.com/blog
www.twitter.com/larsonallen
www.twitter.com/larsonallenhc
www.facebook.com/larsonallen
www.linkedin.com/companies/
larsonallen
Contact Us
Richard Hamilton, CNHA, R.Ph., MBA
Principal
Healthcare
617-984-8142
Cell: 617-371-6034
300 Crown Colony Drive, Suite 310
Quincy, MA 02169
Main: 617-984-8100, Fax: 617-984-8150
www.larsonallen.com


![ADMINISTRATIVE REVIEW BOARD UNITED STATES … · 5/19/2020 · Wage and Hour Administrator,” such as “rulings with respect to application of the [SCA], or the regulations . .](https://static.fdocuments.us/doc/165x107/5f3b31978074fa3494694807/administrative-review-board-united-states-5192020-wage-and-hour-administratora.jpg)

