MASS SPECTROMETRY IN CLINICAL PROTEIN BIOMARKER …
67
Transplantation Laboratory Haartman Institute, Faculty of Medicine University of Helsinki MASS SPECTROMETRY IN CLINICAL PROTEIN BIOMARKER DISCOVERY Ville Parviainen ACEDEMIC DISSERTATION To be publicly discussed with the permission of the Faculty of Medicine, University of Helsinki, in Lecture Hall 2 of Haartman Institute (Haartmaninkatu 3), on Friday February 14 th , 2014, at 12 noon. HELSINKI 2014
Transcript of MASS SPECTROMETRY IN CLINICAL PROTEIN BIOMARKER …
Transplantation Laboratory
Haartman Institute, Faculty of Medicine
University of Helsinki
MASS SPECTROMETRY IN CLINICAL PROTEIN
BIOMARKER DISCOVERY
Ville Parviainen
ACEDEMIC DISSERTATION
To be publicly discussed with the permission of the Faculty of Medicine,
University of Helsinki, in Lecture Hall 2 of Haartman Institute (Haartmaninkatu 3),
on Friday February 14th, 2014, at 12 noon.
HELSINKI 2014

Supervisor: Professor Risto Renkonen
Transplantation Laboratory
Haartman Institute
University of Helsinki
Reviewers: Docent Leena Valmu
R&D Manager ThermoFisher Scientific
Docent, Sakari Kellokumpu
University Research Scientist
Faculty of Biochemistry and Molecular Medicine
University of Oulu
Opponent: Group Leader, Head of Proteomics, Ph.D. Garry Corthals
Translational Proteomics Laboratory
Turku Proteomics Facility
Turku Centre for Biotechnology
University of Turku
Custos: Professor Risto Renkonen
Transplantation Laboratory
Haartman Institute
University of Helsinki
ISBN 978-952-10-9684-6 (paperback) ISBN 978-952-10-9685-3 (PDF) Unigrafia Helsinki 2014

“It´s a magical world, Hobbes,
ol´ buddy…
…Let´s go exploring!”
- Calvin

Contents LIST OF ORIGINAL PUBLICATIONS ...................................................................................................................... 6
ABBREVIATIONS ................................................................................................................................................. 7
ABSTRACT .......................................................................................................................................................... 9
REVIEW OF LITERATURE .................................................................................................................................. 11
Introduction ..................................................................................................................................................... 11
1. Proteomic research ..................................................................................................................................... 11
1.1 Principles of proteomic mass spectrometry .......................................................................................... 12
1.2 Proteomic sample preparation .............................................................................................................. 13
1.2.1 Enzyme digestion ............................................................................................................................ 13
1.2.2 Prefractionation of proteomic samples .......................................................................................... 13
1.2.2.1 SDS-PAGE ................................................................................................................................. 14
1.2.2.2 Liquid chromatography methods ............................................................................................ 14
1.2.3 Enrichment methods ...................................................................................................................... 14
1.2.3.1 Phosphorylation enrichment ................................................................................................... 15
1.2.3.2 Glycosylation enrichment ........................................................................................................ 15
1.2.3.3 Organelle enrichment .............................................................................................................. 16
1.2.4 Protein complex affinity purification .............................................................................................. 16
1.2.5 Plasma depletion ............................................................................................................................ 17
2. Mass spectrometric analysis........................................................................................................................ 18
2.1 Ionization ............................................................................................................................................... 18
2.2 Common mass analyzers ....................................................................................................................... 19
2.3 Ion mobility separation ......................................................................................................................... 20
2.4 Quadrupole tandem mass spectrometry .............................................................................................. 20
2.5 MSE tandem fragmentation ................................................................................................................... 21
2.6 Data analysis of MS data ....................................................................................................................... 22
2.6.1 Protein sequence databases ........................................................................................................... 22
2.6.2 Peptide mass fingerprinting ........................................................................................................... 22
2.6.3 MS/MS identification ...................................................................................................................... 23
2.6.4. De novo identification ................................................................................................................... 23
2.7 MS-based protein quantification ........................................................................................................... 23
2.7.1 Label-based relative quantification methods ................................................................................. 23
2.7.2 Label-free relative quantification ................................................................................................... 26
2.7.3 Absolute MS quantification ............................................................................................................ 28
2.8 From MS data to biological interpretation ............................................................................................ 29
3. Biomarker discovery .................................................................................................................................... 29
3.1 Biomarker categories ............................................................................................................................. 30
3.2 From discovery to validation ................................................................................................................. 30
3.3 Protein biomarkers ................................................................................................................................ 30
3.4 Source of protein biomarkers ................................................................................................................ 31
3.5 Mass spectrometry based proteomics in candidate biomarker discovery ........................................... 31
3.5.1 Label-based MS quantification in clinical protein biomarker research .......................................... 32
3.5.2 Label free methods in MS quantification of clinical protein biomarkers ....................................... 32
3.5.3 MS detection of PTM biomarkers ................................................................................................... 33
3.5.4 MS identification of protein-protein interactions in clinical research ........................................... 34
AIMS OF THE STUDY ........................................................................................................................................ 35
MATERIALS AND METHODS ............................................................................................................................. 36
RESULTS ........................................................................................................................................................... 39
Study I. A combined database related and de novo MS-identification of yeast mannose-1-phosphate
guanyltransferase PSA1 interaction partners at different phases of batch cultivation .............................. 39
Study II. Relative quantification of several plasma proteins during liver transplantation surgery. ............ 41
Study III. Label-free mass spectrometry proteome quantification of human embryonic kidney cells
following 24 hours of sialic acid overproduction ........................................................................................ 42
Study IV. Gremlin-1 associates with fibrillin microfibrils in vivo and regulates mesothelioma cell survival
through transcription factor slug ................................................................................................................ 43
DISCUSSION ..................................................................................................................................................... 45
CONCLUDING REMARKS AND FUTURE PROSPECTS ........................................................................................ 50
ACKNOWLEDGEMENTS.................................................................................................................................... 52
REFERENCES..................................................................................................................................................... 54

6
LIST OF ORIGINAL PUBLICATIONS
This thesis work is based on the following articles. Each article is referred in the text by the respective Roman
numeral:
I Parviainen V, Joenväärä S, Peltoniemi H, Mattila P, Renkonen R
A combined database related and de novo MS-identification of yeast mannose-1-phosphate
guanyltransferase PSA1 interaction partners at different phases of batch cultivation.
International J Mass Spectrom 2009, 281(3):126-133.
- VP participated in the protein complex isolation, prepared the samples for mass
spectrometry (MS), analyzed the data and wrote the manuscript
II Parviainen V, Joenväärä S, Tukiainen E, Ilmakunnas M, Isoniemi H, Renkonen R
Relative quantification of several plasma proteins during liver transplantation surgery. BioMed
Research International 2011, Article ID 248613.
- VP prepared the samples, performed the MS runs and data analysis and wrote the
manuscript
III Parviainen V, Joenväärä S, Tohmola N, Renkonen R
Label-free mass spectrometry proteome quantification of human embryonic kidney cells
following 24 hours of sialic acid overproduction.
Proteome science 2013, 11:38.
- VP prepared the samples for MS, did the MS and data analysis and wrote the manuscript
IV Tamminen J, Parviainen V, Rönty M, Wohl A, Murray L, Joenväärä S, Varjosalo M, Leppäranta
O, Ritvos O, Sengle G, Renkonen R, Myllärniemi M, Koli K
Gremlin-1 associates with fibrillin microfibrils in vivo and regulates mesothelioma cell survival
through transcription factor slug.
Oncogenesis 2, e66 (2013).
- VP prepared the samples for mass spectrometer, performed the MS runs and data
handling, analysis and interpretation. VP also wrote parts of the manuscripts related to
MS data.

7
ABBREVIATIONS
1D One dimensional
2-DE Two-dimensional gel electrophoresis
AMRT Accurate mass and retention time
AP-MS Affinity purification mass spectrometry
AQUA Absolute quantification using stable isotope labeled synthetic peptides
AUC Area under the curve
BCA Bicinchoninic acid assay for proteins concentration measurements
BLAST Basic local alignment search tool
CID Collision induced dissociation
CML Chronic myeloid leukemia
CMP Cytidine 5-monophosphate
Co-IP Co-immunoprecipitation
CSF Cerebrospinal fluid
DDA Data directed acquisition
DIA Data independent acquisition
emPAI Exponentially modified PAI
ESCC Esophageal squamous cell carcinoma
ESI Electrospray ionization
ETD Electron transfer dissociation
FT-ICR Fourier Transform – ion Cyclotron Resonance
GDP Guanosine diphosphate
GO Gene ontology
HCC Hepatocellular carcinoma
HCl Hydrogen chloride
HIV Human immunodeficiency virus
ICAT Isotope coded affinity tags
IMAC Immobilized metal affinity chromatography
IMS Ion mobility separation
IPA Ingenuity Pathway Analysis
iTRAQ Isobaric tags for relative and absolute quantification
KCl Potassium chloride
KEGG Kyoto Encyclopedia of Genes and Genomes
LC Liquid chromatography
LC-MS Liquid chromatography mass spectrometry
m/z mass / charge- ratio
MALDI Matrix Assisted Laser Desorption/Ionization
ManNAc N-Acetylmannosamine
MCP Micro-channel Plate
MRM Multiple reaction monitoring
MS Mass spectrometry
MSE Data independent mass spectrometry acquisition method
MS/MS Tandem mass spectrometry
8
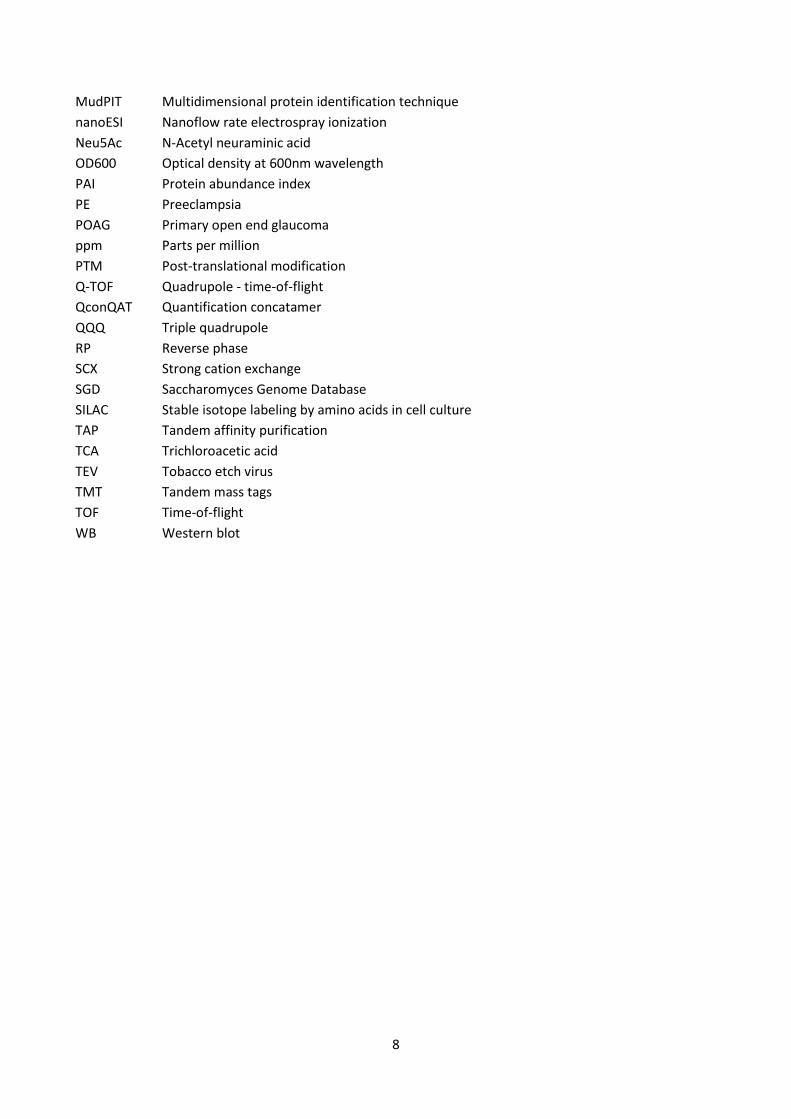
MudPIT Multidimensional protein identification technique
nanoESI Nanoflow rate electrospray ionization
Neu5Ac N-Acetyl neuraminic acid
OD600 Optical density at 600nm wavelength
PAI Protein abundance index
PE Preeclampsia
POAG Primary open end glaucoma
ppm Parts per million
PTM Post-translational modification
Q-TOF Quadrupole - time-of-flight
QconQAT Quantification concatamer
QQQ Triple quadrupole
RP Reverse phase
SCX Strong cation exchange
SGD Saccharomyces Genome Database
SILAC Stable isotope labeling by amino acids in cell culture
TAP Tandem affinity purification
TCA Trichloroacetic acid
TEV Tobacco etch virus
TMT Tandem mass tags
TOF Time-of-flight
WB Western blot
9
ABSTRACT
The field of biological sciences has expanded enormously within the last few decades. Developments in
techniques and instrumentation have allowed biologist to explore biological mechanisms in an
unprecedented detail. One of the most evolved disciplines is the field of proteomics. In general, proteins
function in many different biological roles. They serve as structural molecules, in signaling routes mediating
information in the cell, in intra- and extracellular transport and trafficking as well as in numerous other
cellular functions. The area of protein research entails the study of all things relating to proteins and their
functions. These include cellular protein composition, expression changes, protein structure, post-
translational modifications and protein-protein interactions.
Mass spectrometry (MS) has become one of the key technologies in proteomic research. The relative ease of
sample handling and automated MS machinery has made proteomic analysis relatively straightforward. Mass
spectrometers work by measuring the weight of intact proteins or protein-derived peptides. Proteomic MS
identification is usually done by fragmenting the proteins or peptides in the mass spectrometer and using
the resulting mass spectral information in identification of peptide sequence. There are two main strategies
of peptide sequence identification: database dependent and de novo identification. Database dependent
algorithms utilize known sequence information stored in databases to decipher the peptide amino acid
sequence of the MS-observed spectra and use that information to predict the protein from which the peptide
is derived from. On the other hand de novo methods try to construct the peptide sequence solely based on
the fragmentation patterns of the peptide. The completeness of sequence databases of many species and
the speed and efficiency of the search engines have made the database dependent search as the main
method in peptide and protein identification.
The modern high resolution mass spectrometers along with ultra-performance liquid chromatography have
enabled the detection of thousands of protein in one single MS run. This, together with advances in MS-
based protein quantification has extended the use of mass spectrometers in discovery type biomarker search.
Mass spectrometers are able to produce a large amount of data on numerous proteins that can be used to
detect and quantify differences in patient and control samples. This in turn can be used as starting point for
more focused validation studies on the acquired data and ultimately lead to useful clinical biomarkers.
The focus of this study was to utilize and learn mass spectrometric methodologies and to analyze different
proteomic processes in sample types. We analyzed the protein-protein interactions in Baker´s yeast PSA1
protein in various points of batch cultivation using database dependent and de novo protein identification
methods. We showed that the interactome of PSA1 is very dynamic depending on the phase of the
cultivation. We also showed the limitations and benefits of de novo identification and the combined use of
both search strategies in improving the confidence of the identifications. In another study using affinity
purification and mass spectrometry we identified Fibrillin-2 as the binding partner of lung cancer associated
Gremlin-1 protein. This finding elucidates functions and mechanisms of Gremlin-1 and Fibrillin-2 in malignant
tissues. In two mass spectrometry-based protein quantification studies we characterized the protein
concentration changes in human plasma during liver transplantation surgery as well as the effect of excess
sialic acid production in HEK293 model cell line. In the liver transplantation plasma project we identified
protein concentration changes in liver in response to the trauma caused by the surgery using label-based
iTRAQ method. We showed consumption and secretion of several coagulation related proteins within the
liver suggesting activation of coagulation cascade in the very early phases of the craft reperfusion. In the

10
study of excess sialic acid production we first verified the amounts of sialic acid using mass spectrometry-
based multiple reaction monitoring method. We were able to induce the production of sialic acid to almost
70-fold compared to control cells. We also monitored the protein abundance changes in sialic acid producing
cells using label free proteins quantification method identifying 105 changed proteins. We analyzed those
proteins with several functional enrichment tools revealing modifications in cellular protein transport,
metabolic and signaling pathways and in remodeling of cellular adherens junctions. Such large scale MS-
analyses using ontology-based tools can significantly aid in deciphering the effect of perturbations to complex
systems but also reveal novel functional targets for biomarker discovery.
The results obtained from targeted interaction experiments as well as large scale quantification studies can
be used as basis for more rigorous investigations on the various subjects in search for potential biomarkers
for clinical use. The techniques and methods used in the studies also demonstrate the many uses of mass
spectrometric techniques in several fields of proteomic and biological research.
11
REVIEW OF LITERATURE
Introduction In the past two decades mass spectrometry (MS) has become a major workhorse in biological research.
Especially the field of proteomics, or the characterization of entire protein content of biological samples, has
benefitted from the increasing sensitivity and resolution of rapidly evolving mass spectrometers1,2. The
capability of modern mass spectrometers to identify and characterize hundreds of proteins in a single MS
run has widely expanded our knowledge of the functional organization of the cellular proteomes3. The
concurrent developments in liquid chromatography (LC) and mass spectrometer technology combined with
highly sophisticated bioinformatics methods have also increased the use of MS machinery in proteomic
quantification. This has led to an increase in the usability of mass spectrometers in proteomic biomarker
discovery and in clinical proteomics4,5. In this Ph.D. project modern mass spectrometric methods were
utilized in examination of general proteomic events in biological systems and in research for potential
biomarkers for clinical samples.
1. Proteomic research The term proteome was first coined by Wasinger et al.6 in their study of protein content of Mycoplasma
genitalium. Thereafter the term proteomics has expanded to include a multitude of protein-related subjects
such as post-translational modifications (PTM), protein-protein- interactions and cellular protein quantities
(Figure 1.). The importance of proteomic research has been emphasized by the increasing knowledge of the
complexity of biological systems and the emergence of system biology view of biological events7,8. The
classical view of Genes-to-RNA-to-Protein-to-Function has been replaced by an intricate network of space
and time dependent interactions and regulation of different parts of cellular systems9.
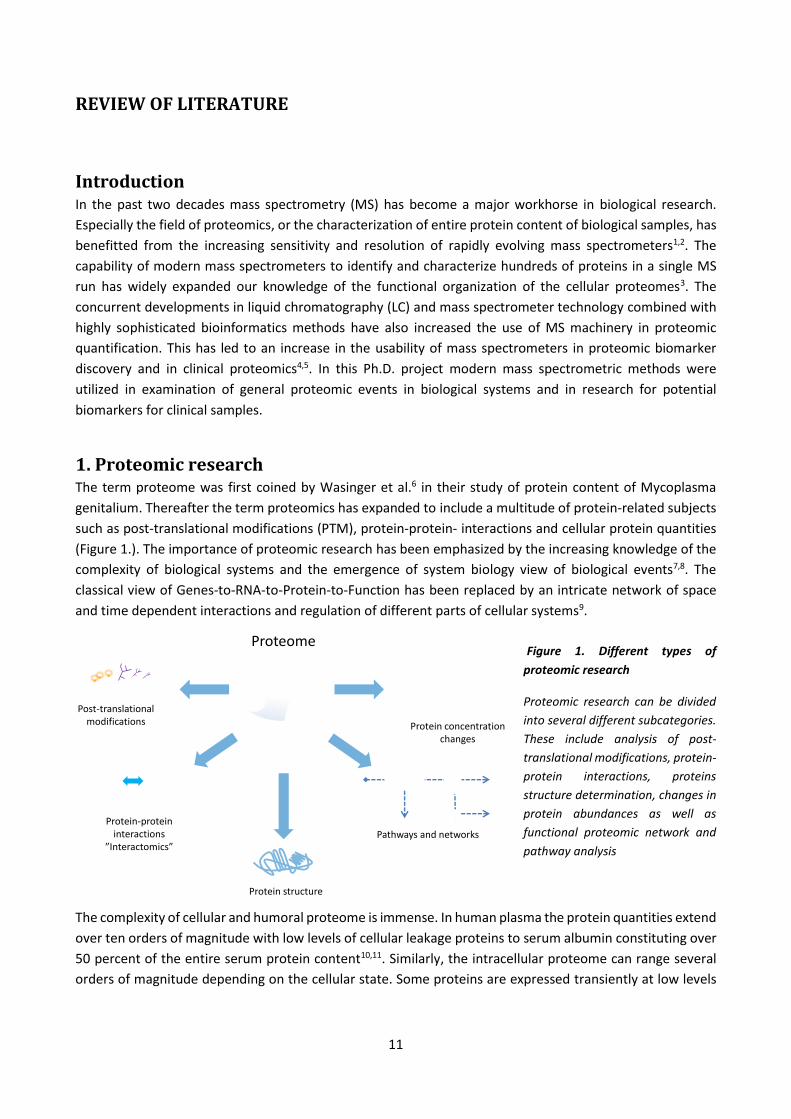
Figure 1. Different types of
proteomic research
Proteomic research can be divided
into several different subcategories.
These include analysis of post-
translational modifications, protein-
protein interactions, proteins
structure determination, changes in
protein abundances as well as
functional proteomic network and
pathway analysis
The complexity of cellular and humoral proteome is immense. In human plasma the protein quantities extend
over ten orders of magnitude with low levels of cellular leakage proteins to serum albumin constituting over
50 percent of the entire serum protein content10,11. Similarly, the intracellular proteome can range several
orders of magnitude depending on the cellular state. Some proteins are expressed transiently at low levels
Proteome
Post-translationalmodifications Protein concentration
changes
Pathways and networks
Protein structure
Protein-proteininteractions
”Interactomics”

12
in response to perturbations or at distinct points during cell cycle as others, mainly housekeeping proteins,
are constantly expressed at high abundance12.
Post-translational modifications of proteins (PTM) create an additional layer of complexity to biological
systems. So far more than 160 different mammalian post-translational protein modifications have been
characterized in over 45000 different sites (24.4.2013)13. Most common of these include phosphorylation of
serine and threonine, N-glycosylation of asparagine and acetylation of lysine. PTMs modulate cellular
processes such as signaling cascades, protein-protein interactions, subcellular localization and protein
degradation14. The PTM status of individual proteins depends on the cellular state. For example, external
stimuli may activate specific and local signaling routes by phosphorylation a subset of proteins and
consequent response to the stimuli. After response the phosphoryl groups are removed by phosphatases and
the signaling route deactivated15. The dynamic nature of different PTMs creates subproteomes of
differentially modified proteins that further complicate proteomic analysis.
Proteomic research entails also the study of protein-protein interactions. Similarly to PTMs, physical
interactions modulate the functions of most proteins. Some proteins are direct constituents of larger
proteomic machines, such as ribosomal, spliceosome and proteasome proteins, while others exhibit transient
interactions that briefly regulate the activity of the interacting proteins16,17. The study of interactomics tries
to elucidate the networks of the interacting proteins and characterize the systemic changes occurring in
response to perturbations or in diseased states.
1.1 Principles of proteomic mass spectrometry Mass spectrometric analysis of proteins means the characterization of proteins or peptides based on their
respective masses. There are two main types of analysis in proteomic MS research: top-down and bottom-
up MS analysis. In top-down MS analysis18 intact proteins can used to identify the proteins19, examine the
post-translational modifications20 of individual proteins or to characterize intact protein complexes21.
However, the most classical type of analysis is still the analysis of protein derived peptides, or bottom-up
proteomics22 (Figure 2.). In shotgun protein characterization the proteins are digested to short fragments of
few kilodalton using proteolytic enzymes. Combined with prefractionation and liquid chromatography
analysis, shotgun proteomics can identify thousands of proteins from very complex mixtures. The
applicability of shotgun proteomics has been demonstrated in a wide array of complex proteomic
experiments including identification and quantification of proteins23 but also in verification of novel genes
and splice forms24.
Figure 2. Bottom-up proteomic MS workflow
The protein sample is first digested with proteolytic enzyme, usually trypsin. Then the sample is fractionated using online
reverse phase chromatography before analysis with mass spectrometer. The resulting MS spectrum is processed and the
proteins are identified with search engines.
1
2
3
Proteinsample
Digestion Fractionation Massspectrometry
Identification
13
In shotgun LC-MS proteomics the peptides are introduced to mass spectrometer by direct coupling of liquid
chromatography system to the mass spectrometer. The LC system is on-line with MS so that eluting peptides
are directly injected to MS using electrospray ionization (ESI)25. In the LC-ESI interface the peptides are ionized
and transferred from liquid to gas phase. After ionization they are transferred through the mass spectrometer
with ion optics that uses magnetic fields and radiofrequency lenses to guide and select molecules in the mass
spectrometer. Peptide can also be fragmented in the mass analyzer. The MS fragmentation produces a series
of short peptides that contain the sequence information needed for identification of the peptide. At the end
of the mass spectrometer the ions are detected by mass detectors that scan and record the mass spectra of
the peptides. The result is a peak list of all the detected masses represented as a ratio of the ion mass and its
accompanying ionization charge (mass/charge = m/z). This peak list of m/z-values can then be imported to
different bioinformatics search tools that compare the detected peptide masses to computer generated list
of all possible masses derived from predefined protein database. By matching the detected peptide mass to
theoretical mass the search programs can reliably and efficiently identify the proteins that are present in the
analyzed sample.
1.2 Proteomic sample preparation
1.2.1 Enzyme digestion
The modern high end mass spectrometers are able to reliably identify very large peptides or intact proteins,
but in general the limitations in resolution of most mass spectrometers require that the analyzed molecule
is not too large and contains adequate number of charges. Therefore prior to shotgun MS analysis the
proteins must be digested with proteolytic enzymes to yield shorter peptides. This can be done directly to
sample proteins (in-solution digestion) or after separation steps (one- or two-dimensional gels). Most of the
commonly used digestion enzymes produce peptides with suitable m/z range and charge for MS analysis.
There are several different enzymes available for protein digestion for mass spectrometry that have different
specificities on the digestion site of the protein26. These include Asp-N that cleaves from amino sides of
asparagine and cysteine, Glu-C cleaving carboxyl side of glutamine and asparagine, and Lys-C and Arg-C that
cleave from carboxyl sides of lysine and arginine respectively. In order to allow the identification of peptides
participating in sulfur bridges, the sulfur bonds are usually reduced after digestion and the resulting free
cysteines alkylated. The most common digestion enzyme used in proteomic research is trypsin. Trypsin
cleaves proteins after lysine or arginine provided that there are no prolines adjacent to the site27. At acidic
pH the peptides normally retain one positive charge at the amino group of N-terminus. The addition of
potential secondary ionization site at the C-terminus by trypsin increases the coverage of mass spectrometric
fragmentation in MS and subsequent identification of peptides. Trypsin also has the advantage of tolerating
quite high salt or detergent conditions and is able to penetrate SDS-PAGE matrix in in-gel digestion.
Additionally there are few commercial trypsins that have been modified to resist autodigestion thus
simplifying the MS data-analysis.
1.2.2 Prefractionation of proteomic samples
Due to the complexity of biological samples the characterization of complex proteomes often requires
sample fractionation. Even though modern mass spectrometers have a high sensitivity with detection limits
up to low femto- or even attomolar range, the dynamic range of the MS machinery is limited by ion
suppression and other matrix effects caused by different physicochemical properties of molecules28. MS
dynamic range refers to the range of lowest and highest analyte that can be detected by mass spectrometer.
Current MS instrumentation has a dynamic range approximately 3-4 orders of magnitude depending on the
used technology29. Another bottleneck in MS analysis of complex mixtures is the duty cycle of MS

14
instrumentation. Due to the inherent constraints of the MS machinery, a large proportion of eluting peptides
may go undetected by the mass detector30. In order to avoid the constraints in the MS duty cycle and ion
suppression and to enhance the dynamic range of MS acquisitions, several methods have been developed
for prefractionate the sample prior to MS analysis.
1.2.2.1 SDS-PAGE
Protein separation with SDS-polyacrylamide gels has been one of the main tools in biological research for
over four decades31. One dimensional gel (1D SDS-PAGE) separates proteins based solely on the respective
size of the protein. Two dimensional (2-DE) gels separate the proteins first by their isoelectric point and then
orthogonally by their size32. In MS analysis the gel-separated proteins are excised from the gel, digested
enzymatically and analyzed with LC-MS. In spite of being one of the most popular preparation methods in
proteomics, there are some drawbacks using gel-based system in mass spectrometric analysis. These include
sample loss from processing steps, issues with dynamic range of the sample and compatibility of SDS-PAGE
protein detection methods with MS analysis33.
1.2.2.2 Liquid chromatography methods
Liquid chromatography fractionation is generally used in conjunction with mass spectrometers. LC systems
offer an unparalleled separation dimension to mass spectrometers by reducing the complexity of the sample
and by concentrating the individual peptides during elution. Current ultra-pressure LC instrumentation34,35
with nanoliter flow rates and modern chromatography materials have made it possible to identify several
hundreds of proteins in one single LC-MS run36.
Reverse phase (RP) column chromatography is currently the main method of on-line separation of peptides
in LC-MS analysis. In RP separation the peptides are separated based on their interactions with hydrophilic
stationary phase of the column. Elution is done by gradients of increasing concentration of non-polar, MS
compatible solvents in the mobile phase37. Another widely used technology is ion exchange chromatography
such as strong cation (SCX) and anion (AEX) chromatography. Ion exchange separates molecules by
interaction between charged side chains of peptides and charged stationary phase. Elution can be done using
increasing amounts of salts or modifying the pH of the mobile phase. However large concentrations of salts
interfere with mass spectrometry analysis so SCX is used either off-line or in two dimensional on-line
separations38,39.
Similarly to 2-DE gels, LC methods can be used on-line in two dimensions as orthogonal technologies in order
increase sample fractionation efficiency and separation40. Most commonly used 2D-LC method is
multidimensional protein identification technique (MudPIT)41. In MudPIT chromatography the peptides are
first fractionated stepwise with SCX. Eluted peptides are then introduced to RP column where they are
retained while the salt-containing eluent is washed away. Normal RP separation is then applied to the
peptides on-line with HPLC. 2D-LC separation can significantly improve the identification efficiency and the
amount if identified peptides from complex matrices42. Several other methods can be used instead of SCX-
RP43. For example, tandem RP-RP with different pH in both steps has been shown to be a comparable method
to SCX-RP44.
1.2.3 Enrichment methods
RP and SCX are used in global separation of peptides based on the general properties of the amino acid side
chains. However, there are methods that can be used to enrich a specific subproteomes of complex samples.
These include post-translational modifications such as phosphorylation and glycans as well as enrichment of
different organelles.

15
1.2.3.1 Phosphorylation enrichment
The most common post-translational modification is protein phosphorylation13. A variety of protein functions
are modulated by addition of phosphate group to serine, threonine or tyrosine side chains. Phosphorylation
is used in many signaling routes and other processes that are dynamically activated and deactivated and may
be found in low stoichiometric amounts. For his reason the MS identification requires that the low abundance
phosphopeptides are enriched and purified from the non-phosphorylated material. The phosphate group
possesses a high negative charge which can be utilized to enrich the phosphoproteome of samples (Figure
3.). Currently the most common and sensitive phosphopeptide enrichment material is immobilized titanium
dioxide (TiO2). Along with modifiers that inhibit binding of nonphosphorylated and acidic peptides, TiO2 can
be used to enrich phosphopeptides to high degree45. Additionally, TiO2 can be used in on-line 2D-LC-MS
where phosphopeptides are first enriched with TiO2 column and then fractionated with RP that is directly
coupled to ESI-MS46. Alternative methods in phosphoproteome enrichment include immobilized metal
affinity chromatography (IMAC) that captures phosphopeptides by binding of the negatively charged
phosphates to ferric iron47 or immunopurification of phosphopeptides with antibodies recognizing
phosphorylated amino acids.
1.2.3.2 Glycosylation enrichment
Glycosylation involves addition of distinct glycan structures to mostly cell surface and secreted proteins48.
The glycosylation pattern is highly versatile with thousands of different glycan structures. Carbohydrate
binding proteins called lectins recognize and bind specific glycan structures49,50. By attaching the lectin to
immobilized support the specific glycan containing proteins or peptides can selectively be isolated from non-
glycosylated or uninteresting material (Figure 3.). Additional glycopeptide and glycoprotein enrichment
methods include size exclusion that separates larger glycan containing peptides from smaller non-
glycosylated material51 and chemical derivatization of glycopeptides52
Figure 3. Phosphoprotein and glycoprotein enrichment methods
Proteins or peptides can be enriched using specific material that binds and
retains the desired proteins in the support material while the unwanted
proteins are washed away. Phosphoproteins can be enriched using ferric
iron (IMAC) or titanium dioxide (TiO2). Specific proteins called lectins that
bind certain glycan moieties are used in glycoprotein enrichment.
Phosphoproteinenrichment
Glycoproteinenrichment
Phosphorylgroup
Glycan
TiO2 / Fe3+
Lectin

16
1.2.3.3 Organelle enrichment
In some cases the interesting biological phenomena occur in organelles and other subcellular structures53.
When analyzing tissues or other cell samples the material is usually lysed by mechanical or chemical means
to free the contents of the cells. This mixes the contents of the organelles to cytosolic and other proteins
making the analysis of the organelle impossible54. In order to examine the different subproteomes of these
structures, they can be enriched prior to analysis. For example, several organelles can be fractionated after
gentle disruption of plasma membrane and by centrifugation of the lysate in gradients mediums that
separate the organelles by their density55. Additional enrichment methods such as affinity purification and
electrophoretic and mechanistic sorting have also been successfully employed in organelle enrichment56.
1.2.4 Protein complex affinity purification
The field of interactomics or protein-protein- interaction research has emerged as an important aspect of
proteomic research57. In order to study the interactions of individual proteins with mass spectrometry, the
interacting proteins must be purified with their interacting proteins. The strength of physical interactions
between proteins vary from transient and low affinity to extremely stable. For this reason the optimization
of the isolation protocol is extremely important58. Inadequate or weak handling may result in extremely high
unspecific binding masking the true interactors. On the other hand too harsh conditions can remove the low
affinity partners reducing sensitivity of the protocol.
The main method in interactomics has been co-immunoprecipitation of proteins (Co-IP) (Figure 4.1). In Co-IP
the proteins, along with their interacting partners are purified using antibodies against the protein of interest
coupled to a solid support. The main benefit of Co-IP is that it can be used on all biological material and
proteins with suitable antibodies. However, some antibodies have a tendency for to bind unspecific proteins
creating a high background of false positives in Co-IP59.
An alternative method for Co-IP is affinity-purification mass spectrometry (AP-MS)60. AP-MS uses biochemical
tags that are genetically inserted to the protein of interest. The tag is chosen so that the tag has a high affinity
binding partner. By immobilization of the tags binding partner to solid matrix and the introduction of sample
to the bound matrix, the tagged protein along with its bound interactions partners can be isolated and
purified61. After elution from the matrix the purified complexes can be easily digested in solution and
analyzed with MS. Several methods have been developed which use two different affinity tags62,63 (Figure
4.2). These tandem affinity purification tags (TAP) enable two-staged purification with different washing
steps removing most of the contaminating unspecific interactions from the sample64. The downside of using
two washing steps is the potential loss of low affinity and transient binding partners that may be removed by
the extra sample handling steps62. The power of tandem affinity tags and AP-MS has been proven by thorough
investigation of the interactomes of yeast65, E. coli66 and fruit fly67. The main drawback of AP-MS purifications
is that it often requires genetic manipulation of the organism under investigation. Even though it has been
successfully used in interactomic studies of genetically modified fruit fly68 and mouse69 the applicability of
genetically engineered AP-MS cannot be extended to human studies due to obvious ethical reasons.
17
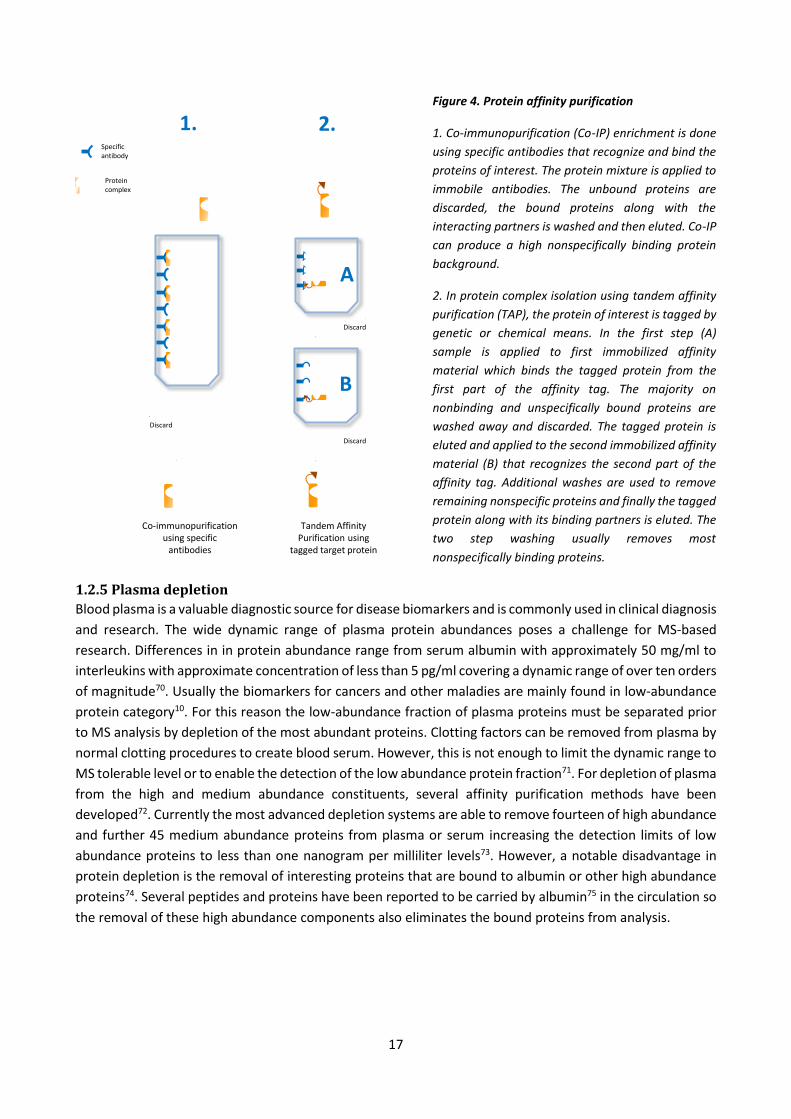
Figure 4. Protein affinity purification
1. Co-immunopurification (Co-IP) enrichment is done
using specific antibodies that recognize and bind the
proteins of interest. The protein mixture is applied to
immobile antibodies. The unbound proteins are
discarded, the bound proteins along with the
interacting partners is washed and then eluted. Co-IP
can produce a high nonspecifically binding protein
background.
2. In protein complex isolation using tandem affinity
purification (TAP), the protein of interest is tagged by
genetic or chemical means. In the first step (A)
sample is applied to first immobilized affinity
material which binds the tagged protein from the
first part of the affinity tag. The majority on
nonbinding and unspecifically bound proteins are
washed away and discarded. The tagged protein is
eluted and applied to the second immobilized affinity
material (B) that recognizes the second part of the
affinity tag. Additional washes are used to remove
remaining nonspecific proteins and finally the tagged
protein along with its binding partners is eluted. The
two step washing usually removes most
nonspecifically binding proteins.
1.2.5 Plasma depletion
Blood plasma is a valuable diagnostic source for disease biomarkers and is commonly used in clinical diagnosis
and research. The wide dynamic range of plasma protein abundances poses a challenge for MS-based
research. Differences in in protein abundance range from serum albumin with approximately 50 mg/ml to
interleukins with approximate concentration of less than 5 pg/ml covering a dynamic range of over ten orders
of magnitude70. Usually the biomarkers for cancers and other maladies are mainly found in low-abundance
protein category10. For this reason the low-abundance fraction of plasma proteins must be separated prior
to MS analysis by depletion of the most abundant proteins. Clotting factors can be removed from plasma by
normal clotting procedures to create blood serum. However, this is not enough to limit the dynamic range to
MS tolerable level or to enable the detection of the low abundance protein fraction71. For depletion of plasma
from the high and medium abundance constituents, several affinity purification methods have been
developed72. Currently the most advanced depletion systems are able to remove fourteen of high abundance
and further 45 medium abundance proteins from plasma or serum increasing the detection limits of low
abundance proteins to less than one nanogram per milliliter levels73. However, a notable disadvantage in
protein depletion is the removal of interesting proteins that are bound to albumin or other high abundance
proteins74. Several peptides and proteins have been reported to be carried by albumin75 in the circulation so
the removal of these high abundance components also eliminates the bound proteins from analysis.
A
B
Co-immunopurificationusing specific
antibodies
Specificantibody
Tandem AffinityPurification using
tagged target protein
1. 2.
Discard
Discard
Discard
Proteincomplex

18
2. Mass spectrometric analysis
2.1 Ionization The mass spectrometers utilize electric fields to guide the molecules within the MS instrument (Figure 5.). In
order for the molecules respond to electric fields, they must be charged. Several different methods are used
to ionize the analytes such as chemical or thermal techniques; however, in proteomic MS the peptides are
most commonly ionized by soft ionization methods MALDI (Matrix Assisted Laser Desorption/Ionization)76 or
ESI25. Soft ionization method means that the ionization procedure is gentle enough so that it doesn’t
fragment the peptides upon ionization. In MALDI the analyzed material, such as peptides or proteins, are
deposited to solid surface along with matrix in water-solvent mixture and then allowed to dry. This causes
the matrix and the analytes to co-crystallize to the surface. A short laser burst is then applied to the spot
resulting in ablation of the matrix and the analyte to the gas phase. This leads to ionization of the analytes
and entry to the mass spectrometer for analysis.
Along with MALDI, electrospray ionization or ESI, is another widely used soft ionization technique. In ESI the
solution with eluting peptides is pushed through an orifice with applied voltage. Due to the high pressure
and the voltage, the eluting solution is dispersed into small droplets. These droplets undergo solvent
evaporation with the aide of high temperature and gas flow on the ESI source. The evaporation concentrates
the molecules and the charges in the droplets until the charge repulsion causes the droplets to fragment into
smaller and smaller pieces in a series of Coulomb fissions. The pH of the ESI solvent also results in the charging
of the analytes in the liquid phase. After several rounds of Coulomb fission and solvent evaporation, only the
charged peptides are left in the gas phase and can then enter the mass spectrometer77.
Figure 5. Overview of ESI ionization and hybrid quadrupole-time-of-flight (Q-TOF) mass analysis
The peptides are first ionized by electrospray ionization. The charged peptides are guided by quadrupole mass selectors
before entering time-of-flight (TOF) mass analyzer. Based on the flight time in the TOF analyzer the mass spectrometer
is able to calculate the masses of each peptide.
Using nanoliter flow rates in the nanoESI ionization the sensitivity and the ionization efficiency can be
significantly improved allowing the detection of very low peptide quantities78. ESI is usually used with liquid
chromatography separation due to the compatibility of the LC-solvents with ESI and MS. The LC-ESI interface
is usually used on-line with MS machinery to inject the eluting analytes straight to the MS. This allows the
automation of the analysis but also the characterization of the retention times of the analytes. One of the
main benefits of ESI ionization is that it is capable of producing multiply charged peptides. This is a key factor
in the analysis of large molecules but also aides in the fragmentation of peptides in MS/MS analysis79. The
++ +++
++++++
++++ ++
+
Electrosprayionization
Quadrupole massselection / recording
Time-of-flightanalyzer
Elutingpeptides
+ + ++ ++ + ++
+
++
+

19
propensity of ESI to generate multiply charged peptides can also be a disadvantage. The same peptide species
can be present in few different charge states that complicate the data analysis.
2.2 Common mass analyzers Mass analyzers are the core of mass spectrometers. They are used to concentrate, store, guide and separate
the ion travelling within the mass spectrometer. Different types of mass analyzers have been developed with
different benefits and drawbacks (Table 1.). Quadrupole mass analyzers use radiofrequency fields and
electric currents to alter the flight paths of charged particles within the electric field. In the simplest case the
quadrupoles pass all ions that enter the mass analyzer producing MS spectra. MS spectra contain all the ions
that are detected at a given time and can be used to characterize the entire m/z range of the sample. By
modulation of the electric fields, quadrupoles are also able to select molecules with specific m/z values to
pass to the mass detector while discarding the rest80. Ion trap analyzers operate as quadrupoles but can trap
and concentrate the ions for a brief period of time. This allows for higher sensitivity as the ion scan be
concentrated prior to ejecting to detector. As with quadrupoles, the ion trap can be used to pass and detect
all ions that are present or just a single ion with specified m/z.
Table 1. Common mass analyzers and respective advantages and disadvantages
Analyzer Advantage Disadvantage
Quadrupole (single and triple) Relatively cheap, MRM capabilities (triple quadrupoles) Limited mass resolution and range
Ion trap Good mass range, sensitivity, fast scan rate, low cost Limited mass resolution and dynamic range
Time-of-flight High mass range, fast scan speed, good resolution and accuracy Limited dynamic range
Orbitrap High resolution and mass accuracy Moderate scan speed
FT-Ion cyclotron resonance Very high resolution and mass accuracy Very expensive, limited dynamic range
The Fourier Transform – ion Cyclotron Resonance (FT-ICR) uses strong magnetic fields to trap ions. This is
followed by frequency excitation causes the ions to move in a circular path to the detector which records an
image current of the ions movement. This is transformed to mass spectrum using Fourier transformation
algorithms. The FT-ICR mass spectrometers are highly accurate and have very high resolution but also come
with a very high prize and size. Another mass analyzer that uses Fourier transformation algorithms to
determine ion mass is the Orbitrap analyzer. Orbitrap captures ions around central spindle of the trap using
electrostatic forces rather than magnets. The ions begin to orbit the central spindle but also begin to oscillate
axially based on the m/z value. The image current of this m/z-dependent oscillation is detected and
transformed to mass spectra81. Within the last decade, the high resolution and mass accuracy in combination
with moderate price of Orbitraps have made them one of the most important MS tools in proteomics.
In addition to Orbitraps Time-of-flight or (TOF) analyzers82 are frequently used in proteomic MS. TOF
detectors work by measuring the time of ions travelling in the analyzer. When a group of ions arrive to the
TOF mass analyzer they are first injected to the detector by small electric pulse by the pusher in to the
constant electric field of the TOF analyzer where they are accelerated by constant electric field. The velocity
of each individual ion depends on the m/z of the ion so that smaller m/z ions arrive to the ion detector faster.
By measuring the time of arrival after the initial pulse, the exact m/z of each ion can be recorded and
calculated83. The differences in the original kinetic energies of the ions with same m/z cause reduced of
resolution in linear TOF analyzers. This can be corrected using reflectors in the TOF flight tube. Instead of
linear flight path, the reflector curves the path of ions back towards the source in U-shaped trajectory. The
depth that the ions enter the reflector depends on the velocity of the ion. Higher velocity ions penetrate
20
deeper and stay in the reflector a longer time while the slower ions take a shorter path and less time. This
balances the initial differences in the velocity and allows the ions to arrive to the detector. The ions are finally
detected using micro-channel plate (MCP) detectors that detect and multiply the signals which are then
converted to mass spectra.
The most efficient MS analysis is usually achieved using hybrid mass spectrometers. Hybrid MS equipment
utilize several different types of mass analyzers. The use of various analyzers in conjunction can be used to
bypass the inherent drawback of the analyzers thus increasing the resolution, sensitivity and mass accuracy
of the MS analysis. Examples of hybrid MS instruments include Linear ion trap-Orbitrap, Quadrupole-ion trap
as well as Quadrupole-TOF.
2.3 Ion mobility separation In some cases the second fragmentation quadrupole can be replaced by ion tunnels that are used to trap and
further separate the peptides. In one example the second quadrupole is replaced by the TriWave device that
composes of ion trap, ion mobility separation (IMS) and transfer regions84. In IMS the ions travel through the
IMS cell filled with gas. Instead of fragmenting the peptide, the IMS gas slows the velocities of the ions
depending on their shape85. As a result the ions arrive to the detector at different times freeing the detector
to scan the arriving ions with more precision and sensitivity. By separating the ion by their shapes, IMS creates
and additional separation dimension for peptides with similar elution times in the liquid chromatography
step prior to MS. The use of IMS separation step can increase the detection efficiency and sensitivity of
peptides by almost 60% compared to normal separation allowing a much greater number of proteins to be
identified in one single MS run86. IMS can also be used in separation of intact protein complexes87 and
peptides with similar mass but with different shapes. These include glycan isoforms88 as well as analysis of
structural variants of proteins85.
2.4 Quadrupole tandem mass spectrometry In tandem mass spectrometry the ions are fragmented to produce smaller fragments which are then analyzed
and used in sequence or structure elucidation of the original ion. Tandem mass spectrometry can be done in
ion trap, TOF-TOF as well as quadrupole analyzers. In quadrupole tandem mass spectrometry two
quadrupoles are used back-to-back (Figure 6.). In data dependent acquisition (DDA) the mass analyzers
selects and passes only one single species of ions (or m/z values), called precursor ion, for collision induced
fragmentation (CID) in the second quadrupole89. Quadrupole also records the mass of the precursor so that
that the product ions can be traced back to this precursor for peptide identification. After passing the first
quadrupole the precursor ions enter the second quadrupole where a curtain of inert collision gas, such as
argon or helium, is applied. The ions that enter the gas filled chamber collide with the gas molecules causing
the peptides to fragment. In CID the peptide fragments mainly from the amide bonds of the peptide
backbone but in different positions of the peptide sequence90. This semi-random dissociation produces two
species of product ions: one derived from the N-terminus (denoted as the b-ion) and one from the C-terminus
(the y-ion) of the peptide. During the fragmentation the charge of the precursor peptide is either divided
between the fragments or stays on one fragment while the other fragment acquires a neutral charge. Since
charge is prerequisite for mass characterization of the ion, the ability to create multiply charged ion species
is an advantage. The benefit of using trypsin as digestion reagent is that it creates a positively charged C-
terminus to the peptide as it cleaves after lysine or arginine. This enables one charge to remain in the y-ion
after fragmentation as others may locate to the N-terminal b-fragments of the precursor. CID of large number
of peptides with same sequence results in a series of product ions that differ in mass based on the site of the
fragmentation. The mass differences between the product ions represent the differences in masses of

21
individual amino acids of the peptide sequence. In ideal case the fragmentation would produce a series of
product ion have been fragmented after each amino acid generating a full series of b- and y-ions. However,
this is rarely the case as some amino acids are more prone to fragmentation than others so the ion series
pattern is generally dependent on the peptide sequence90.
Figure 6. Overview of Q-TOF type mass selection and fragmentation
The ionized peptides enter the first quadrupole which passes only one peptide for fragmentation and discards the rest.
The second quadrupole fragments the selected peptide. The fragments enter the TOF detector that uses the fragment
flight times to calculate the fragment masses. The fragmentation pattern of b- and y-ions of hypothetical peptide
“PEPTIDE” is also shown.
2.5 MSE tandem fragmentation MS/MS identification is limited by the possibility of fragmenting only few precursor ions during one duty
cycle. It is estimated that a full tryptic digest of all yeast approximately 5000-6000 proteins can produce up
to 300 000 different types of peptides91. Even though quadrupole-TOF mass spectrometers can fragment up
to eight precursor peptides in one duty cycle of one second or less, the majority of the 300 000 are not
analyzed and the sequence information is lost92. To overcome this limitation a data independent acquisition
(DIA) method called MSE has been developed where all peptides enter the MS analyzer at the same time92
(Figure 7.). The first pass of MSE analysis scans only the precursor ions that are eluted from the LC at a given
time. In the second pass the same set of precursor ions is fragmented to produce a complex set of product
ions. By repeating this cycle of precursor/product scans through the entire LC gradient, the mass
spectrometer generates a chromatogram of eluting precursors and also of their fragmentation products. In
order to combine the fragmentation information to correct precursor ions, the chromatogram and the
fragmentation spectra is processed with bioinformatics tools. In processing of MSE data the program looks
for the similar elution patterns of both the precursor and the fragment ions. When a perfect alignment is
found between the retention times of precursor and product fragments the program links these product
fragments to distinct precursors. Utilization of DIA methods such as MSE has the potential to improve the
identification efficiency of proteins dramatically. For example, MSE study of tomato leaf proteome achieved
over 350% increase in protein and almost 500% increase in peptide identifications compared to DDA
method93.
C
CN
N
1st quadrupole –mass selection / recording
Time-of-flightm/z analyzer
2nd quadrupole –fragmentation
P E P T I D E
P E P T I D E
P E P T I D E
P E P T I D E
PEPTIDE
P E P T I D E
N-terminal fragments, b-ions
C-terminal fragments, y-ions
Full fragmentationspectra,b- and y- ion series

22
Figure 7. Principle of Q-TOF type MSE identification
In MSE identification the quadrupoles pass all peptides to second quadrupole. The second quadrupole cycles between
low energy mode that keeps the peptides intact and high energy mode when all peptides are fragmented. The TOF
records the masses of non-fragmented precursor ions as well as the fragment masses. The retention time for all masses
is also saved. In the data processing step the algorithm matches the retention times so that the correct precursor-
fragment pairs can be linked. This enables the detection of significantly larger number of peptides than in normal DDA
method.
2.6 Data analysis of MS data The mass detector produces a raw file of the detected m/z values. Before analysis and peptide identification
this file must be processed. Several different algorithms have been developed to clear the data from noise
and to extract the detected ions from the raw files94-95. The resulting list of detected ions, their charge,
retention time and the intensity of the ions is finally compiled in to one peak list. This peak list is the basis of
mass spectrometric identification.
2.6.1 Protein sequence databases
Database-related protein identification is one of the main methods in proteomic research. The sequencing
of the genomes of several species has produced a library of genetic information that can be computationally
translated in to protein sequence information96,97. Several different public databases have emerged that offer
the sequence information of different proteins from different species to be downloaded and used in MS data-
analysis98. One of the most notable proteomic databases is the UniProt/SwissProt database99. It contains
protein sequences of almost 13 000 species and bacterial strains but also a reviewed database of manually
validated protein sequences.
2.6.2 Peptide mass fingerprinting
The simplest way for peptide identification is peptide mass fingerprinting (PMF)100. In PMF the peptide
masses are compared to a database of in silico calculated peptide masses of known protein sequences. If a
match is found, the protein where the peptide ion originated can be identified with certain confidence. The
problem with PMF is that there can be several different proteins that produce peptides with similar mass.
This becomes an issue when the sample is complex or with low resolution mass spectrometers are used for
PMF. For this reason PMF is used mainly in analysis pure protein solutions or of spots excised from 2-DE
gels101.
LC chromatogramprecursor masses-Retention time
TIME / sec
LC chromatogramMSMS fragmentmasses-Retention time
TIME / sec
1st quadrupole -Mass selection
2nd quadrupole -High energy fragmentation
2nd quadrupole -Low energy, no fragmentation
Match precursor-fragment pair retentiontimes
23
2.6.3 MS/MS identification
PMF identification relies just on the comparison of non-fragmented peptide masses to in silico digested
masses but in complex samples additional round of search is needed101. In MS/MS search the second pass
computationally fragments the in silico generated peptides to their respective fragment ions. When a match
is found between the acquired precursor and computer generated ions, the fragmentation pattern on both
are compared. If the patterns match, the program can statistically identify the peptide that has been
fragmented and the protein where the peptide is derived from. The database-related search fails when an
unknown or modified sequence is obtained. Mutations such as insertions, deletions or change of amino acids
cause shifts in the precursor and fragment masses which cannot be identified when matching the observed
spectra to the in silico generated mass list. Different search strategies102-103 have been developed to address
this issue however, they suffer from sensitivity issues and high false positive rates104.
MS analysis of post-translational modifications can be done using optional search parameters in the MS/MS
identification. When performing the in silico digestion and fragmentation, the program adds the mass of the
modification to the precursor ion and on all the fragments. This can then be compared to the observed mass
spectra of the peptide and if a match is found, the peptide and the modification can be identified. The MS
identification of PTMs requires that the exact mass of the modification is known and that the amino acid
where the identification is attached is specified105.
2.6.4. De novo identification
De novo identification is a complementary method of peptide identification that can be used to bypass the
constraints posed by database-related searching106. In de novo identification, the peptide sequence is built
from the fragmentation pattern of the precursor peptide. Instead of comparing the obtained fragmentation
pattern to the database generated spectra, the sequence is deduced from the mass differences between the
fragment peaks. Even if the spectra does not produce a full peptide sequence, short stretches of the deduced
sequence can be used in BLAST searches to identify the original protein107. The problem with de novo
sequencing is that it is computationally labor-intensive and it requires good quality spectra for correct
identification108.
2.7 MS-based protein quantification One of the main improvements in the past few years in MS technology has been the extension of MS
quantification capabilities. 2-DE gels have been the main method when comparing the expression differences
of two samples but the limitations of the 2-DE system and in both detection and separation capabilities109
have prompted researches to develop several MS-based solutions for global protein quantification110. These
MS methods can be divided in to relative or absolute protein quantification. Relative methods are also further
divided into labeled or label-free quantification. Absolute methods use added standard compounds to report
the actual amount of peptides or proteins that are present in the sample while relative methods are used to
compare two or more samples and to report the relative differences in quantities between them.
2.7.1 Label-based relative quantification methods
The labeling methods rely on the introduction of stable isotopes to the peptides to use in relative
quantification. SILAC111 (Stable isotope labeling by amino acids in cell culture) is a widely utilized method in
proteomic quantification. In SILAC the quantification is done metabolically by feeding normal, or “light”
amino acids to the control cell culture (Figure 8.). In contrast, the experimental sample is supplemented only
with isotopically labeled “heavy” amino acid, usually arginine or lysine, which is incorporated to the
proteome of the cell line. When performing SILAC experiments lysates from the light and heavy samples are

24
pooled and analyzed with LC-MS. The incorporation of the heavy amino acids does not significantly alter the
elution or other properties of the peptides. The only difference is the mass shift on the sample with heavy
peptides caused by the isotope labeling and this mass difference can be used to separate the control from
the experiment sample. The SILAC quantification is done by comparing the signal intensities of the precursor
ions between the light and heavy labeled samples while the identification of the peptides is done from the
fragmentation spectra of the respective precursor peptides. SILAC has been primarily used by labeling cell
lines; however, the introduction of fully heavy labeled SILAC mouse112 and recently developed super-SILAC
method113 have extended the use of SILAC to animal models and tissue samples.
Figure 8. SILAC and ICAT labeling protocol
SILAC quantification is performed by feeding
isotope labeled, “heavy” amino acids to
experiment cells. Control cells are fed with
normal “light” amino acids. Both samples are
prepared and then pooled and digested. In
the MS analysis the light and heavy labeled
peptides can be distinguished by the mass
shift due to the heavy labeling. The SILAC
quantification is made from the relative
intensities of precursor ions and the
identification from fragmentation spectra. In
the ICAT method the samples are normally
processed before being labeled. The control
sample is labeled with “light” ICAT label
while the experiment sample is labeled with
“heavy” ICAT label. Similarly to the SILAC
method, ICAT quantification is done using
precursor intensities and identification from
MS/MS spectra.
Similarly to SILAC, the ICAT114 (Isotope Coded Affinity Tags) method uses two different isotope labels to
distinguish between samples (Figure 8.). In contrast To SILAC the ICAT tags are attached to the proteins after
lysis of the cells. The ICAT tag contains also a biotin component that is used in purification and enrichment
of the tag containing peptides. The labeling is done by chemical attachment of the tags to cysteine. As with
SILAC, the differentially labeled samples are pooled after digestion and the relative quantification is done
based on the signal intensity differences of the two differentially labeled samples and identification from the
product ion spectra.
MS analysis
Quantification fromprecursor spectra
Identification fromMSMS spectra
Feed ”light” amino acids
to control cells
Feed ”heavy” amino acids
to experiment cells
Lyse cells
Pool light and heavy samples
Lyse cells
SILAC
Control samples
Experiment samples
Lyse cells and label with light ICAT label
Lyse cells and label with heavy ICAT label
Pool light and Heavy labeled samples
Digest and enrichlabeled samples
1
2
3
2:1
1:1
1:3
ICAT
Digestion
MS1
MS2 MS2 MS2

25
The SILAC and ICAT methods use precursor spectra to quantify the peptides. Some methods employ the
fragmentation spectra for both identification and quantification of the samples. As with ICAT, the iTRAQ115
(Isobaric Tags for Relative and Absolute Quantification) and TMT116 (Tandem Mass Tag) tags are chemically
attached to amino acids of peptides before the samples are pooled (Figure 9.). However, the tagging is usually
done to peptides after digestion instead of intact proteins. The TMT and iTRAQ tags consist of three separate
regions: the reactive group for attachment to free amine groups of the lysines and amino termini of the
peptides, a mass balancer region and the actual reporter region from which the quantification is made. The
design of the tags is such that each reporter ion has a mass difference of one Dalton. This mass difference is
compensated by the balancer region so that the overall masses and other properties of the tags are identical.
After labeling, the samples are analyzed with LC-MS. In the MS/MS the peptide is normally fragmented to
produce the spectra for peptide identification. At the same time the isobaric tag is also fragmented to free
up the reporter and the mass balancer regions. The balancer is discarded but the reporter ions are detected
by the mass spectrometer. The relative quantification between samples is then done from the ratios of the
reporter ion intensities. The benefit of the isobaric labeling strategy is that the mass of the precursors derived
from different samples is the same due to the balancer region. Compared to SILAC and ICAT, this simplifies
the MS data analysis and does not reduce the precursor ion intensity. It also enhances the sensitivity of the
identification as the pooling of the samples adds to the amount of each tagged peptide thus increasing the
precursor peptide intensity. Additionally the incorporation of the cleavable isobaric tags enables multiplexing
of samples117. Multiplexing allows the analysis of up to eight samples simultaneously thus reducing the time
and costs of the analysis118.

26
Figure 9. iTRAQ labeling protocol
In the iTRAQ quantification samples can be
multiplexed using iTRAQ labels with different
reporter masses. The Samples are processed
individually and labeled using different iTRAQ labels.
After labeling the samples are pooled and analyzed
with MS. Since the iTRAQ labels have isobaric
masses the precursor scan shows only one m/z for
peptides compared to two same precursors (light
and heavy labeled) in ICAT and SILAC. The
identification of peptides is made from MS/MS
fragmentation spectra. Quantification in iTRAQ is
made by comparing the dissociated reporter ion
intensities in the low part if MS/MS spectra. Each
reporter ion of certain mass represents one sample
and can be compared to rest of samples to produce
relative quantification of peptides and proteins.
The problem with isotope labeling of peptides is that the labeling efficiency must be almost complete.
Insufficient metabolic labeling of the heavy sample will show as an increase in the intensity of the light sample
thus skewing the quantification. ICAT, iTRAQ and TMT may suffer from problems in the digestion and labeling
efficiency of some samples that render the quantification unreliable. Additionally, iTRAQ and TMT can be
contaminated by fragmentation of co-eluting peptides119. The mass window that passes the selected
precursor to fragmentation for MS/MS may also pass other precursor ions with similar m/z. If two or more
precursors are fragmented simultaneously, which may be the case with complex samples, the reliable
quantification and identification is impossible.
2.7.2 Label-free relative quantification
Label-free quantification methods do not require derivatization of the samples prior to MS-analysis. Instead
the quantification is done based on the amount of spectral matches to each protein or by the intensity of the
eluting precursors120 (Figure 10.). Spectral counting (SC) utilizes the principle that the more abundant the
protein, the more spectral matches it has on the MS/MS121. Methods for SC include protein abundance index
Control samples
Experiment-1 samples
Lyse cells and digest
Pool iTRAQ labeled samples
Lyse cells and digest
Label with iTRAQ label-1
Label with iTRAQ label-2
Experiment-2 samples
Label with iTRAQ label-3
iTRAQ
MS analysis
Quantification from MSMS reporter spectra
Identification fromMSMS fragmentation spectra
1
2
3
1:2:2
1:1:1
3:2:1
MS2 MS2 MS2
MS1
Lyse cells and digest

27
(PAI)122 and EmPAI123 (exponentially modified PAI). In PAI the approximate quantities of proteins in the
sample are calculated by simply dividing the number of observed spectra with the number of calculated
observable spectra. emPAI quantification modifies the PAI score by using only unique peptides and refining
the quantification algorithm.
Figure 10. Principles of spectral counting
and area under the curve methods
In spectral counting the quantification is
made by counting the number of MS/MS
spectra for each peptide. In area under the
curve methods the area of precursor
chromatogram is integrated and
quantification performed based on the
total area under the chromatogram curve.
In both methods the identification is made
from the MS/MS fragmentation spectra.
The PAI method has some inherent problems that may distort the quantification. Different physicochemical
properties of peptides cause differences in peptide ionization which result in skewed quantification124. Also,
low spectral counts from low abundance proteins or the saturation of detector by high abundance proteins
and undersampling resulting from complex mixtures interfere with quantification125,121. In order to overcome
these issues other spectral counting software and algorithms have been developed126,127 that have expanded
the detection limits and accuracy of spectral counting quantification.
Alternative way for SC is the quantification based on integrating the ion areas of eluting peptides or AUC
(Area Under the Curve) methods128,129. AUC relies on the discovery that in ESI the signal intensity is
proportional to the molar concentration of the analyte in the sample128. In AUC methods the peptide
quantification is made by integrating the peak area of each eluting m/z and the identification is made
simultaneously from the MS/MS fragmentation of the precursor. Quantification using AUC methods has been
shown to be linear within the range of 10-1000 pmol and with dynamic range of four orders of magnitude129.
The requirement of both quantification of precursor ions and identification from the MS/MS fragments poses
difficulties in DDA-based AUC quantification130 in Q-TOF type MS instruments. An adequate number of
precursor level data points must be gathered for reliable quantification but also the fragmentation spectra
of the precursor must be good enough for identification of the peptide. Due to the limits in mass
spectrometer duty cycle, the DDA methods often undersample complex data131. DIA methods can be used to
circumvent the undersampling issues of DDA. As the precursor and product spectra are recorded
simultaneously in DIA, enough data is collected for reliable quantification and identification. For example,
MSE-based quantification using accurate mass and retention time pairs (AMRT) was shown to identify and
quantify serum spiked proteins to 100 fmol level with an average quantitative variation below 15%130.
Spectral counting
Area Under the Curve
Identification from MS2.Quantification fromnumber of MS2 spectra
Count:6
Count:3
Identification from MS2.Quantification from areaunder MS1 precursorchromatogram
Area:6
Area:3

28
A drawback of the label-free methods is that multiplexing is not possible and the LC-MS analysis must be
done one sample at a time. Quantification based on the comparison of different LC runs require also reliable
chromatographic system that is able to deliver repeatable consecutive LC runs132. Current UPLC-level
instrumentation can to produce good quality chromatographic separation in terms of separation, peak width
and retention time stability to enable label-free quantification133. In addition to good quality
chromatography, the bioinformatics tools must be able to process the data efficiently and with good
precision. Adequate normalization of the data must be performed to account for the variations in injected
sample amount or ionization. Also, the algorithms should include the different charge states of the same
peptides for correct quantification132.
Multiple reaction monitoring or MRM has been generally used in the quantification of metabolites but the
developments in instrumentation and bioinformatics tools have allowed the method to be used also in the
quantification of proteins134. MRM instrument is usually a triple quadrupole MS system (QQQ). Similarly to
Q-TOF tandem mass spectrometer, two quadrupoles are placed back-to-back. The first selects the precursor
ions which are then fragmented in the second quadrupole. In QQQ this is followed by a third quadrupole
which is used to select certain fragments, known as transitions, which pass to the detector. The quantification
is done by integrating the elution chromatogram for each selected precursor-transition pair. The main benefit
of the MRM methods is its specificity and sensitivity135. As the precursor-transition masses are set beforehand
with additional information of retention time and charge, the MS does not have to scan the entire mass range
but only a small subset of the range. This frees up the duty cycle and allows the acquisition of more spectra
per analyte. Also the requirement of identification of both precursor and transition masses allows for
excellent specificity by eliminating majority of the unspecific precursors and fragmentation. The
disadvantage of the MRM method is that the precursor-transition pairs must be known and set beforehand.
In proteomics this requires the knowledge of the precursor peptide masses and the masses of the
fragmentation products so analysis of unknown proteins that is not possible with MRM. The requirement of
knowledge of precursor-product pairs before MRM analysis has been addressed by construction of
proteotypic peptide libraries that contain the information of precursor masses of a variety of peptides and
calculated fragmentation products136.
2.7.3 Absolute MS quantification
MS-based quantification can be used also for quantification of the absolute amount of proteins in the sample.
The AQUA method137 relies on isotopically labeled synthetic peptides that correspond to the protein
sequence that is quantified. A known amount of AQUA peptide is added to the digested sample and LC-MS
is performed. The properties of the isotope labeled AQUA peptide and the normal peptide are the same, only
difference is the mass shift from the labeling. Absolute quantification is done by comparing the ion area of
the known amount of the AQUA peptide to the normal peptide. The problem with AQUA quantification is
that it requires the synthesis of specific peptides so the quantification is feasible only to one or few proteins
of interest. QconCAT138 is an extension of AQUA strategy. QconCAT is made using an artificial gene that
contains the sequence of a number of peptides from different proteins that are under investigation. By
adding a known amount of the isotopically labeled QconCAT protein to the sample prior to digestion and
analysis, the absolute amount of proteins with corresponding sequences in QconCAT can be deduced.
Label free methods can also be utilized in absolute quantification. Hi3 method is based on the observation
that the top three most intense peptides per proteins reflect the absolute amount of each protein to a high
degree139. Addition of a set of known internal standard peptides can be used to create a universal signal
response factor which can be set as a reference which to compare the rest of the peptide intensities. This
29
method has been successfully used to quantify proteins in complex mixtures with a sensitivity of less than 5
pmol/ml139.
2.8 From MS data to biological interpretation Mass spectrometers are able to produce a wealth of information in terms of identification and quantification.
Ultimately this experimental data must be put to context and translated to biological information. For this
reason several ontologies describing biological processes and connections have been developed140. Most
notable of these is the Gene Ontology (GO)141. GO is used to annotate each protein to a set of descriptions
that best characterize the properties of the protein. The GO uses a preset terms as descriptions so that the
same term can be annotated to several proteins that share a common property. In addition, the terms are
hierarchically ordered so they can be classified in the terms of their more general parent terms. This general
annotation and the hierarchical structure can be used in enriching a set of interesting proteins. If
experientially acquired set of proteins enriches statistically to a certain GO term, a more general view of the
biological phenomena can be acquired than just examining the proteins individually. Many ontologies have
been developed that use different terms based on the context of the ontology142. For example disease
ontologies are used to specify that set of proteins that have been experimentally linked to certain
diseases143,144. On the other hand phenotypic ontologies can be used to associate genes and proteins to
different phenotypic and anatomical traits145,146.
To help the researcher to utilize the ontologies and to combine data from different disciplines in biology,
several bioinformatics tools have been devised for enrichment and analysis. Simple gene enrichments to
Gene Ontology can be done using Amigo tool147. For more in-depth analysis researchers can use DAVID
Functional annotation tool148 or Ingenuity Pathway Analysis149 platform for functional enrichment and
analysis of proteins in several different categories and ontologies. In addition to analysis, visualization of large
amounts of data has proven to be invaluable for the interpretation of the data150 and programs like
Cytoscape151can be used in construction, analysis and visualization of large networks of multifaceted
biological data.
3. Biomarker discovery One of the main goals of medical research is to transfer the acquired knowledge into clinical applications and
biomarkers for known diseases. The term biomarker refers to measurable indicator of risk, existence, stage
or response to treatment of specific diseases152,153. Biomarker can be almost any biological material that is
found in the human body. Numerous genetic panels that test DNA sequences of known genes associated
with diseases are commonly used in clinical diagnosis to evaluate the likelihood of acquiring the disease154.
Metabolites and their intermediates are used in standard blood tests but also in diagnosis of cancers155 and
congenital disorders156.
In recent years the promise of new clinical protein markers for diseases has been great. Numerous early
findings are characterized as “potential biomarkers”, however this promise has not been fully realized in
terms of clinical practise157. Even though several protein biomarkers have been introduced to be used to test
for diseases such as prostate158 and ovarian cancer159 the general amount of new clinical protein biomarkers
has been low within the recent years157. The reasons for this may be due to lack of access to clinical patient
material or the costs and effort required to transform initial discovery to validated clinical solutions153.

30
3.1 Biomarker categories Biomarkers can be divided into different categories based on the use of the biomarker152,160. Diagnostic
biomarkers are used in screening and assessment of predisposition to certain diseases. The knowledge
obtained from diagnostic biomarkers can be used in preventative medication or counseling in life style or
nutrition. In most diseases and especially in cancer, the early diagnosis is of utmost importance161. Stage
specific biomarkers that signal the early phases of cancer development before it has metastasized or matured
into more malignant species can significantly improve the life expectancy of patients as therapy can be
started in time. Additionally, progression of the disease can be assessed by analysis of stage specific
biomarkers162 and the treatment adjusted accordingly. Special biomarkers related to drug response can be
used to follow the effect of the treatment. Due to individual variations in drug metabolism same drug may
not be suitable for all patients. In addition, heterogeneity of some diseases, such as cancer, may render drugs
inefficient or cause adverse responses163 so the identification of biomarkers signaling drug resistance could
be used to rectify the medication and improve prognosis. Finally, outcome biomarkers can be used to
evaluate the result of the treatments but also to monitor the long term recurrence of the disease.
3.2 From discovery to validation In biomarker research there are several different phases that need to be passed before marker can be
declared clinically relevant and useful153. The search for biomarkers starts from discovery phase where
control samples are compared to diseased samples. The discovery phase can be done in model systems such
as cell lines and model organisms. From this comparison of control and diseased samples a list of differentially
expressed candidate markers is obtained. However, this list still contains a large portion of false positives
which must be distinguished from the true positive markers. The verification step narrows and confirms the
list of candidates by more comprehensive analysis of markers by orthogonal verification of the findings.
Verification is conducted using methods and material more resembling the final analysis and with more
samples derived from a larger population to account for individual variation. After discovery and verification
the biomarker enters the validation phase. In validation the found biomarkers and the developed
methodology undergo a rigorous testing for sensitivity, specificity, repeatability, reproducibility, costs and a
large variety of other parameters that must be passed for biomarker and method to qualify for clinical use164.
3.3 Protein biomarkers Finding proteomic biomarkers for cancers and other diseases has been the goal of numerous experiments
and studies152. The use of proteins as biomarkers is based on the idea that as the major workhorses of
biological systems, diseases and other biological malfunctions may be reflected the proteomic level. For
example, mutations in DNA can cause impairments in protein function or amount leading to cancer and other
malignancies. Additionally, biological responses to diseases or injuries manifest often on the proteomic level
so the discovery of biomarkers that signal these specific events would be extremely valuable (Figure 11.).
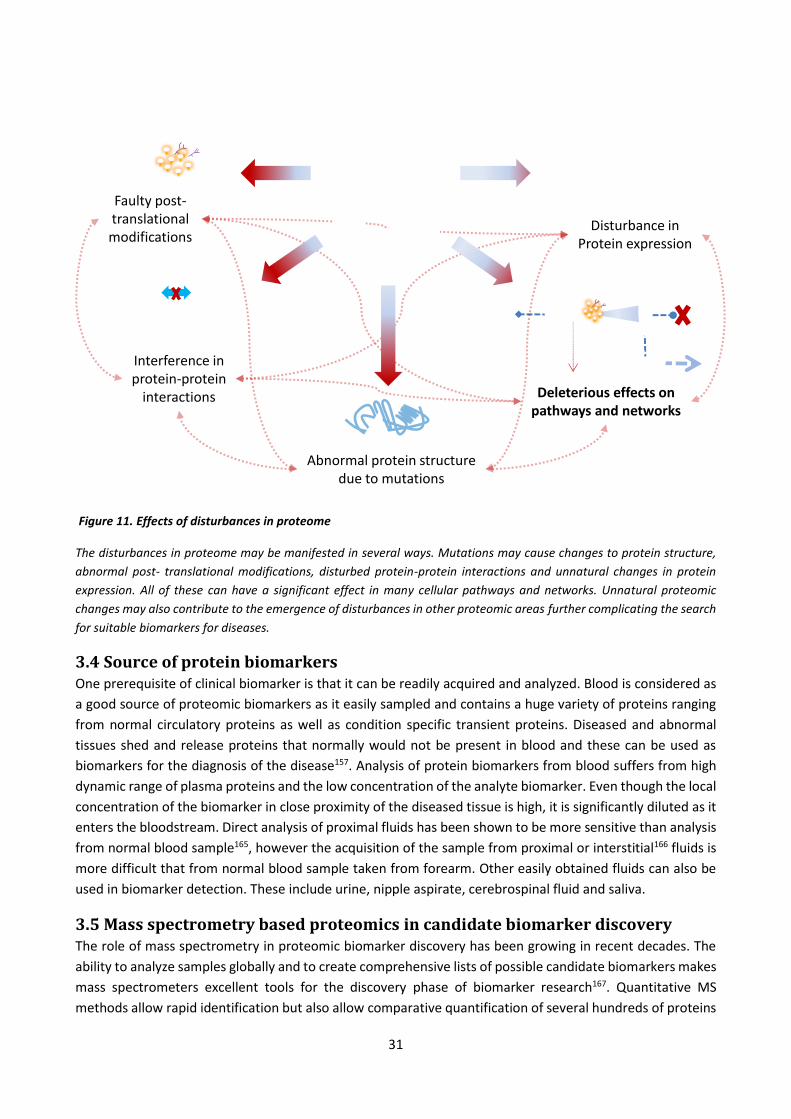
31
Figure 11. Effects of disturbances in proteome
The disturbances in proteome may be manifested in several ways. Mutations may cause changes to protein structure,
abnormal post- translational modifications, disturbed protein-protein interactions and unnatural changes in protein
expression. All of these can have a significant effect in many cellular pathways and networks. Unnatural proteomic
changes may also contribute to the emergence of disturbances in other proteomic areas further complicating the search
for suitable biomarkers for diseases.
3.4 Source of protein biomarkers One prerequisite of clinical biomarker is that it can be readily acquired and analyzed. Blood is considered as
a good source of proteomic biomarkers as it easily sampled and contains a huge variety of proteins ranging
from normal circulatory proteins as well as condition specific transient proteins. Diseased and abnormal
tissues shed and release proteins that normally would not be present in blood and these can be used as
biomarkers for the diagnosis of the disease157. Analysis of protein biomarkers from blood suffers from high
dynamic range of plasma proteins and the low concentration of the analyte biomarker. Even though the local
concentration of the biomarker in close proximity of the diseased tissue is high, it is significantly diluted as it
enters the bloodstream. Direct analysis of proximal fluids has been shown to be more sensitive than analysis
from normal blood sample165, however the acquisition of the sample from proximal or interstitial166 fluids is
more difficult that from normal blood sample taken from forearm. Other easily obtained fluids can also be
used in biomarker detection. These include urine, nipple aspirate, cerebrospinal fluid and saliva.
3.5 Mass spectrometry based proteomics in candidate biomarker discovery The role of mass spectrometry in proteomic biomarker discovery has been growing in recent decades. The
ability to analyze samples globally and to create comprehensive lists of possible candidate biomarkers makes
mass spectrometers excellent tools for the discovery phase of biomarker research167. Quantitative MS
methods allow rapid identification but also allow comparative quantification of several hundreds of proteins
Abnormal protein structuredue to mutations
Disturbance inProtein expression
Interference inprotein-protein
interactions
Faulty post-translationalmodifications
Deleterious effects onpathways and networks

32
simultaneously. Multiplexing methods also allow the analysis of several different samples during a single MS
run reducing the time, costs and inter-analysis variability110.
3.5.1 Label-based MS quantification in clinical protein biomarker research
Several studies on discovery-based proteomics have been conducted using protein labeling and MS-based
quantification. SILAC method has been employed in studies of cancerous cell lines that have identified several
potential biomarkers to distinguish cancerous tissue from healthy. Everley et al.168 compared the microsomal
proteomes of two human prostate cancer cell lines with different metastatic potential using SILAC. Of the
nearly 1000 identified proteins, 444 were quantified and of those 82 were shown to be significantly different
between the cell lines. Another study by Kashyap et al.169 examined the differences between the secreted
proteins of esophageal squamous cell carcinoma (ESCC) cell line and normal esophageal squamous epithelial
cells with SILAC-based quantification and found 120 up- or downregulated proteins including several
previously identified proteins with elevated abundance in ESCC cells. SILAC methodology can be applied to
tissue samples by the recently introduced super-SILAC system113. In a study of cell cultures done from
different phases of breast cancer tumor Geiger et al.170 used super-SILAC quantification to identify candidate
biomarkers. These were then confirmed using super-SILAC on breast cancer tissue samples and based on the
finding the team proposed six new candidate biomarkers for advanced breast cancer.
The SILAC method requires direct labeling of living cells and cannot be applied to human subjects. However,
labeling methods such as ICAT and iTRAQ are compatible for human studies and have been used to
characterize the biomarkers in human serum. Kang et al. used ICAT to search for biomarkers of hepatocellular
carcinoma (HCC) from the serum of liver cirrhosis patients171. They identified and showed the discriminatory
power of alpha-1 acid glycoprotein as a marker for HCC in cirrhosis patients. A similar study was conducted
from the urine of bladder cancer patients by Chen et al.172 identifying 55 differentially regulated proteins in
cancer samples using iTRAQ. The accuracy of iTRAQ was further validated by analyzing Apolipoprotein A-1
(APOA1) on ELISA demonstrating specificity and sensitivity of over 90%. The use of iTRAQ in tissue samples
was exemplified by the analysis by Ralhan et al.173. They examined differences in tissue samples from head
and neck carcinomas and healthy control tissues taken from a same patient. Several distinguishing proteins
were identified and a panel of three proteins was shown to be able to separate the carcinoma from healthy
samples with good sensitivity. Cerebrospinal fluid (CSF) is a rich source of biomarkers of diseases affecting
the neurological system. In a study conducted by Lehnert et al.174 two proteins signaling the risk of Parkinson
related dementia were identified with iTRAQ from CSF and then verified with MRM. Similarly, Kolla et al.175
used plasma from pregnant women to search for candidate biomarkers for preeclampsia (PE). iTRAQ analysis
was done from plasma taken from women with normal and plasma from women who developed PE.
Quantification analysis revealed a list of altered proteins, including several known protein markers, which
could serve as potential biomarkers for early stage PE.
3.5.2 Label free methods in MS quantification of clinical protein biomarkers
Even though the MS-based labeling methods have been proven useful in biomarker discovery the label free
methods offer an alternative method of quantitative MS-analysis. Type-2 diabetes has been one of the most
rapidly increasing metabolic diseases in the western world. Early diagnosis has the potential to reduce the
costs and mortality of diabetes; however, an efficient and easy diagnosis method is still lacking. Saliva is an
attractive source of biomarkers due to the availability and ease of procurement. To this end, Paturi et al.176
used spectral counting to differentiate the proteomes of type-2 diabetic patients from healthy individuals.
65 proteins were identified to be differentially regulated in diabetic patients. Category enrichment revealed
several metabolism and immune response related proteins among the regulated proteins. These categories
33
have been previously reported to be associated with diabetes. In addition to identifying and verifying
differentially regulated proteins, Paturi also demonstrated the increasing abundance of several identified
proteins during the progression of diabetes highlighting the usefulness of saliva derived biomarkers in
diabetes diagnosis and monitoring.
The advent of high definition UPLC-MSE quantification has emerged as a promising technology in proteomic
biomarker research. In an exemplary study of the Fabry disease Manwaring et al.177 identified urine
Prosaposin (PSAP) as a candidate marker for Fabry disease using MSE-based quantification. The group also
showed that the amount of PSAP decreased after 12 months of enzyme replacement therapy used to treat
Fabry demonstrating the validity of PSAP in treatment monitoring. The added sensitivity and larger scale of
shotgun type MS analysis has made it possible to characterize pathway-wide changes occurring in diseases
and to assess the utility of different pathways as biomarkers. In a study conducted by Pizzatti et al. on chronic
myeloid leukemia (CML)178 the proteomes of plasma from treatment responsive and resistant patients was
quantified using MSE-based quantification. Ingenuity Pathway Analysis revealed altered lipid metabolism and
Wnt pathway in the resistant patients. The identification of two interconnected pathways in treatment
resistant CML can aide in the development of novel biomarker panels to stratify CML patients and to target
the treatment more efficiently. Analogous study on primary open end glaucoma (POAG) was done by
Pieragostine et al.179. They identified 27 differentially expressed proteins in tear fluid of POAG patients that
could be used as predictive biomarkers. Pathway enrichment of these proteins indicated several
inflammation- related proteins in the set of differentially expressed proteins confirming the earlier reports
of the role of inflammation in glaucoma.
3.5.3 MS detection of PTM biomarkers
Differential post-translational modifications are also tempting targets in biomarker research. Some diseases
may manifest in altered abundances of modified proteins that may be used as biomarkers. Potential disease
PTM´s include phosphorylation, glycosylation, methylation180 as wells as acetylation181.
Protein phosphorylation is the most common PTM in mammalian cells and controls several signaling cascades
within the cell. As the cell signaling processes are often altered in cancer, the identification of abnormal
phosphorylation in cancerous patients could be highly valuable biomarkers in diagnosis and treatment. The
role of phosphorylation as biomarker is limited mainly to tissue samples or other cellular samples as it not
generally found in secreted fluids such as plasma. In a study of the phosphoproteome of breast cancer cells
using SILAC, Oyama et al.182 characterized the differentially modified proteins in control and resistant cells
after stimulation. In addition, using a combined analysis of the phosphoproteomic and gene expression data
the team identified a candidate phosphorylated biomarker that could be used to predict the relapse and
survival of breast cancer patients. MS analysis of phosphoproteomics has been utilized also to search for
biomarkers in early stages of Anthrax infection183. Manes et al. isolated the phosphopeptides from the spleen
of mice in order to examine the early effects of Bacillus anthrax infection. 26 phosphopeptides were shown
to be differentially regulated after 24 hours of anthrax exposure. If released in the circulation these
phosphopeptides could serve as an early marker of anthrax exposure and subsequently as a sign for pre-
emptive medication.
Studies have shown that cancer can have a major impact on the glycosylation pattern of several proteins184.
Characterization of the altered glycoproteome has the potential to be a rich source of biomarkers in cancer
diagnosis and treatment185. Glycosylation of Kallikrein 6 (KLK6) is altered in ovarian cancer and the can be
used as biomarker for prognosis. However, the cancer produced KLK6 is masked by the normal production in
34
the central nervous system. In order to distinguish the normally found KLK6 from cancer derived protein,
Kuzmanov et al.186 used mass spectrometry to identify differentially sialylated KLK6 that is exclusively derived
from cancerous tissue. The differential glycosylation can be used to distinguish the cancer-related KLK6 from
normally expressed protein and utilized as a prognostic biomarker of ovarian cancer. Characterization of
global glycosylation patterns can also be used identify biomarkers. In a large study of eleven different breast
cancer cell lines Boersema et al.187 identified 1398 unique glycosylation sites from the secretome of the cells.
The team used lectin affinity enrichment and MS-based super-SILAC method to compare five different stages
of breast cancer progression represented by the different cells lines. The team demonstrated that the
amount of differentially glycosylated proteins changes during cancer development. They also demonstrated
the usability of super-SILAC in human studies by comparing the cell line derived super-SILAC mixture to
plasma from human subjects resulting in identification of several common peptides.
3.5.4 MS identification of protein-protein interactions in clinical research
Abnormal changes in protein-protein interactions are usually a symptom of a disease. For example viral
infections can take over the cellular machinery for their own replicative purposes. Gene mutations may lead
to alterations in physical interaction sites of proteins resulting in abnormal protein activity and harmful
phenotypes188. Elucidation of these altered interactions may provide new insights into the mechanism of the
disease but also in the search for candidate biomarkers and targets for drug intervention.
HIV is one of the most devastating viral epidemics that have affected the world in the past decades. Even
though HIV has been studied extensively, a cure to the disease is yet to be found. To expand the information
of HIV in general and to identify candidate drug targets, several MS studies on the interactions of HIV proteins
on host proteome have been conducted. Gautier et al.189 used immobilized HIV nuclear regulatory protein
Tat as bait to capture the interacting proteins from T-cell nuclear protein fraction. They identified 129
different Tat- interacting proteins that can be organized into different functional modules pertaining
transcription activator and suppressors, chromosome organization factors and nuclear structure
components. In a similar large scale experiment Jäger et al.190 utilized AP-MS to characterize the entire virus-
host interactome of HIV protein in Jurkat and HEK293 cells. In total 497 interactions were identified in several
biological processes and cellular compartments. Of the 497 identified interactions only 19 had been
previously characterized demonstrating the need for further characterization of HIV interactome.
Oncogenes are a set of proteins that have the propensity to induce cancer191. Usually oncogenes are a
product of gene mutation or alteration in the gene expression regulating mechanisms. The oncogene
expression may manifest in altered protein-protein interactions resulting in rampant cell growth and cancer
progression. Identification of these altered interactions can lead to potential drug targets and cancer
treatment. To this end AP-MS experiments have been conducted using oncogenes as interaction baits. In
order to characterize the interaction of cancer associated histone deacetylase HDAC1 in hepatocellular
carcinoma cell line, Farooq et al.192 tagged HDAC1 with double affinity tag. 41 binding partners were identified
of which 27 were novel interactors of HDAC1. Among the identified proteins were several members of cellular
TCP1 and prefoldin chaperonin complexes. Similarly, Song et al.193 probed the binding partners of colorectal
cancer oncogene APC using FLAG-affinity tagged APC. The team expressed tagged protein at endogenous
levels identifying several known and novel interacting proteins.

35
AIMS OF THE STUDY
Mass spectrometric methods and instrumentation have evolved significantly within the last decade. Novel
techniques have been developed to tackle several different proteomic challenges. The goal of this work was
to learn new MS methodologies and to use them to elucidate biological and clinical phenomena. The specific
aims of were:
- To use different mass spectrometric identification and quantification methods to elucidate the
changes in biological processes after perturbation
- To analyze different types of mass spectrometry generated proteomic data using various functional
analysis tools and to generate meaningful biological and medical interpretations from the derived
data and analysis results
- To use the acquired knowledge of mass spectrometric methods and biological data analysis in order
to search for novel biomarkers in clinical cases

36
MATERIALS AND METHODS
The materials and methods are briefly displayed below. Full methodology and materials, including
manufacturers and exact MS parameters can be found in the original publication or the accompanying
supplementary information.
Cell lines and strains
The yeast cell line used in study I. was C-terminally TAP-tagged PSA1 (YDL055C) in W303 host strain. The
HEK293 cell line for studies III. and IV. was FlipIn-293 that was transfected either with GREM1 expression
vector (study IV.) or empty expression vector (study III.).
Cell cultivations
The yeast batch cultivation (study I.) was done in 30 l Braun Bioreactor at +30°C, agitation speed 800 rpm,
airflow 1 l/min, and pH at 5.0. Verduyn (2X) was used as cultivation medium. Five liter samples were taken
at 4, 8, 12 and 24 hours after beginning of cultivation. The cell density was calculated using OD600
measurements. The mammalian cell lines (studies III. and IV.) were done on cell cultivation plates. In study
III. the cells were treated by adding 30 mM N-acetylmannosamine to induce the production of sialic acid.
Control cells were treated with similar volume of PBS. Induction was performed for 24 hour before sample
processing. The GREM1 expression in study IV. was induced by adding 25 ng/ml of tetracycline to cells and
then incubated for 24 hours.
Plasma sampling
Three patient plasma were sampled for study II. All patients were undergoing liver transplantation surgery
for primary sclerosing cholangitis. 10 ml samples were drawn simultaneously during surgery from hepatic
vein (hepatic sample) immediately after flush with portal blood before connecting the craft to the normal
circulation, from portal vein (portal sample) and radial artery (arterial sample). Plasma was then separated
from samples and then stored at -70°C.
Protein preparation techniques
The cells in study I. were lysed using mechanically by disruption of cells in bead beater in lysis buffer. Cell
suspension was cleared using ultracentrifugation. The cells for protein quantification in study III. were lysed
by adding cold lysis buffer to cells, incubating for 30 min on ice and snap frozen in liquid nitrogen. The cell
samples for MRM-MS were lysed by incubation in 50% acetonitrile with added internal standard for ten
minutes on ice followed by centrifugation to remove debris and then dried in Speedvac concentrator. Affinity
purification samples for study IV. were lysed by incubation in lysis buffer.
Protein concentration measurements were done using BCA method using Bovine albumin as standard.
Plasma depletion for study II. was done using Agilent Multiple Affinity Removal column. The samples were
injected to column and the flowthru collected. Three injections were made from each patient.

37
Affinity purification for study I. was done by applying the cleared lysate to IgG sepharose. The sepharose was
washed and the protein complexes eluted by incubation with TEV protease at +16°C overnight. The flowthru
was then applied to Calmodulin agarose for one hour at +4°C. The complexes were eluted using EDTA
containing buffer. The purification for study IV. was done by passing the lysate through Strep-Tactin column,
washing of the column and elution with biotin. The eluted GREM1 complexes were then applied to anti-HA
agarose, washed and eluted using 0.2 M glycine.
The proteins in studies I. II. and III were precipitated with TCA precipitation. The TCA concentration was
adjusted to 25% and proteins were precipitated for 30 min on ice. Proteins were pelleted by centrifugation
at +4°C for 30 minutes before washing with ice cold 0.1 M HCl in acetone using centrifugation. The washing
step was repeated with ice cold acetone and similar centrifugation. The samples were briefly air dried and
stored in freezer until analysis. The samples for proteomic quantification in study III. were done using
commercial detergent removal resin. The samples were incubated in the resin for two minutes and eluted
with brief centrifugation.
The Western Blot validation in study III. was done using equal amount of samples in SDS-PAGE. Three control
and three induced biological replicates were used. The proteins were first separated with SDS-PAGE and then
transferred to PVDF membrane using semi-dry blotting. The membranes were blocked overnight with 2%
BSA in PBS + 1% Tween20 at +4°C. Primary antibodies were anti ATIC (dilution 1:500), anti-NME2 (1:500) and
anti-RAB5 (1:1000). Anti-beta Actin antibody (dilution 1:2000) was used as loading control. All antibody
dilutions were done on PBS + 1% Tween20. Membranes were incubated in primary antibodies for 90 minutes
at room temperature and then washed briefly three time with PBS + 1% Tween20 followed by three 10
minute washes in same buffer. Polyclonal secondary antibodies were HRP-conjugated goat anti-rabbit (RAB5
and beta Actin) and rabbit anti-mouse (ATIC and NME2). Washes for secondary antibodies were similar to
first antibodies. The detection was performed using ECL Plus system and fluorescence detector.
Quantification of proteins was done using ImageQuant TL and Excel software.
Sample processing for MS
Trypsin digestion in studies (II. III. and IV.) was performed by reducing the samples followed by alkylation of
the free cysteines. The reducing and alkylation step was omitted in study I. Trypsin digestion was performed
by digesting all samples overnight at +37°C.
In study II. the peptides were labeled with iTRAQ 8plex kit according to manufacturer’s protocol. Labeling
was performed for two hours followed by quenching with 10 µM ammonium bicarbonate for 30 minute at
room temperature. The samples were then pooled and purified with SCX fractionation using cation-exchange
cartridge. The bound peptides were washed and eluted using increasing KCl concentrations (5mM, 10mM,
15mM, 25mM, 35mM, 50mM, 75 mM, 100 mM, 150 mM, 200 mM, and 350mM). The samples were dried in
SpeedVac concentrator and stored in -20°C.
The digested samples for studies III. and IV. were purified using C18 spin columns. The samples were applied
to conditioned columns and washed. Elution was done using acetonitrile. The samples were then dried using
Speedvac.

38
LC-MS
The peptides in study I. were analyzed with Waters Micromass nanoLC CapLC on-line with QTOF Ultima
Global mass spectrometer. The used trapping column was Waters Symmetry 300 (C18, 5 µm, 300Å, i.d.
0.18mm × 23mm) and analytical column LC Packings PepMap100 (C18, 5 µm, 100Å, 75 µm i.d. × 25 cm). The
gradient was done using 0.1% formic acid in acetonitrile as mobile phase A and .1% formic acid in 95%
acetonitrile as mobile phase B. The gradient was from 95% mobile phase A to 5% in 600 minutes using
variable flow technique at positive ion mode and data dependent acquisition. The LC-MS analysis for study
II. was done using same LC set-up as study I. The gradient in study II was 95% of mobile phase A to 5% in 90
minutes. The data was acquired at positive mode using data dependent acquisition. The LC-MS analysis in
study III. was performed using Waters nanoACQUITY UPLC coupled to Synapt G2-S HDMS mass spectrometer.
LC gradient was run from 3% phase B (0.1% formic acid in acetonitrile) to 30% over 140 minutes. 0.1 % Formic
acid in H2O was used as mobile phase A. The used trap column was nanoACQUITY UPLC Symmetry C18 (180
μm × 20mm, 5 μm) and nanoACQUITY UPLC BEH130 C18 (75 μm × 150 mm, 1.7 μm) as analytical column.
Gradient was run at +30°C. Data was collected at data independent MSE acquisition method with positive
polarity using IMS separation at 900 m/s. The LC-MS analysis in study IV. was done with nanoAcquity UPLC
on-line with a Waters Synapt G2 mass spectrometer. Columns were identical to study III. and the gradient
was from 3% to 40% mobile phase B in 90 minutes. Data was collected at data-dependent acquisition manner
fragmenting eight peptides simultaneously using positive polarity.
The LC-MS in the MRM-MS analysis in study III. was done using Waters 626 LC system on-line with Quattro
Micro mass spectrometer. The used column was Synergi Fusion-RP 80A (250 mm × 2 mm, 4 μm) with flow
rate 170 µl/min. The mobile phases were 0.1 % formic acid in H2O as phase A and 0.1 % formic acid in
methanol as phase B. Gradient was run on stepwise manner for six minutes. Neu5Ac, ManNAc and labeled
fructose were analyzed using negative mode. The MRM transitions for analytes were m/z 308.0 → 86.9 for
Neu5Ac using collision energy 17 V; m/z 220.0 → 58.8 for ManNAc with collision energy 16 V and m/z 185.0
→ 92.0 for labeled fructose with collision energy 9 V.
MS Data analysis
The raw data in studies I. II. and IV. was processed using Mascot Distiller software. In study II. the proteins
were identified using X!Tandem and Lutefisk search engines. The identifications in study II. was done using
Mascot search engine. The reliably identified peptide m/z-values were exported and used in MS runs of the
same sample as exclusion lists to increase the number of peptide identifications. Mascot was also used to
identify proteins in study IV. along with X!Tandem search engine. The protein identifications in study III. was
done using Waters ProteinLynx Global Server search engine and protein quantification using Expression-E
software. MRM quantification in study III. was performed with QuanLynx software and Excel.
Functional analysis
Gene ontology and KEGG analysis were used in study I. DAVID Functional tool was used in study III. using
KEGG, Reactome, and Panther as limiting ontologies. Ingenuity Pathway Analysis was also used in study III.
to characterize the functional changes.

39
RESULTS
Study I. A combined database related and de novo MS-identification of yeast
mannose-1-phosphate guanyltransferase PSA1 interaction partners at different
phases of batch cultivation
Model organisms are generally used as a starting point in many biological experiments. The ease of
cultivation and manipulation enable a wide array of experiments that would not be possible using live animals
or human subjects. In order to examine the interactomic changes as well as effects of enzyme limitation in
database related MS identification and compare that to de novo identification, we analyzed the interactome
of popular model organism Baker´s yeast Saccharomyces cerevisiae PSA1 protein during batch cultivation.
PSA1 participates in yeast cell wall synthesis by catalyzing the conversion from mannose-1-phosphate to
GDP-mannose. We chose to examine the effects of different cultivation conditions on the PSA1 interactome
by tandem affinity purification from different points in batch cultivation. Time points (Figure 12.) were chosen
to represent the end of initial lag phase and beginning of logarithmic growth (4h), mid-logarithmic growth
(8h), end of logarithmic phase and beginning of nutrient limited growth (12h) and final time point
representing starvation and very low growth (24h).
The growth rate was monitored by measuring the optical density (OD600) during cultivation and calculating
the growth rate (µ). The observed growth followed the expected sigmoidal curve of batch cultivated yeast
population (Figure 12.). The growth curve also confirmed that the chosen time points represented the
expected characteristics of population growth.
Figure 12. Yeast batch cultivation growth curve
The growth curve showed predictable characteristics
of batch cultivation. At four hour sampling point the
cell are beginning the rapid growth phase. At eight
hours the cell are rapidly dividing and the growth rate
is high. After 12 hours the lack of nutrient begins to
limit the growth and the cell must adapt to new
situation. After 24 hours the nutrients are scarce and
the cell have adapted to starving conditions.
The protein identifications were made using database-related X!Tandem search engine194,195 with trypsin and
no-enzyme as search restrictions and Lutefisk de novo search algorithm combined with BLAST sequence
0
2
4
6
8
10
12
0 4 8 12 16 20 24 28 32
Time / hoursOD600
Sampling 4h, beginning of growth
Sampling 8h, rapid growth
Sampling 12h,end of rapid growth
Sampling 24h, starvation
Yeast cell
Budding yeast cell

40
alignment. Using all three methods and time points we identified 235 distinct proteins with at least one
peptide. All three identification methods performed similarly as X!Tandem-trypsin limited identified 106,
X!Tandem with no enzyme 108 and Lutefisk-BLAST 112 different proteins (Table 2.). Out of the 235 distinct
proteins 31 were identified with all methods. We then limited the search based on the amount of detected
peptides. Using two peptides as detection limit, the overall number of all detected proteins fell to 74 with 58
identified with X!Tandem-trypsin, 35 with X!Tandem no-enzyme and 24 with Lutefisk-BLAST. Three peptide
limit further reduced the overall number of detected proteins to 43 with 38 found with X!Tandem-trypsin,
29 with X!tandem no-enzyme and only seven with Lutefisk-BLAST.
We then analyzed the proteins that were identified with at least two peptides with Gene Ontology, KEGG
Pathways and Intact Protein Complex database. Largest detected category was ribosomal proteins. Of the 92
identified proteins 62 were ribosomal. Non-ribosomal proteins contained proteins involved in energy
producing pathways, amino acid and lipid biosynthesis, cell signaling and cell wall morphology. Even though
PSA1 is a cytoplasmic enzyme, several mitochondrial and nuclear proteins were also identified.
Comparison of identifications between time points revealed that 21 unique ribosomal proteins were
identified in the four and eight hour time points. At 12 and 24 hour time points the number of ribosomal
interaction partners for PSA1 fell to 11 (12h) and 10 (24 hours). In non-ribosomal proteins most interaction
partners were found at eight hour time point with 21 identifications. Non-ribosomal PSA1 interacting
proteins for 4 hour, 12 hour and 24 hour time points were 12, 12 and 16 proteins respectively.
We finally assessed the sensitivity of our study by comparing our data with known interaction partners for
PSA1 obtained from Saccharomyces Genome Database (SGD) (Table 2.). Out of all 74 known PSA1 interaction
partners we were able to identify 18 in our set of one peptide limit protein hits. Out of these nine were found
with all methods, 16 with X!Tandem trypsin, 15 with X!Tandem no-enzyme and 11 with Lutefisk-BLAST. When
the peptide limit was set to two, X!Tandem-trypsin identified 13, X!Tandem no-enzyme nine and Lutefisk-
BLAST six SGD reference proteins. In the most stringent analysis of three or more proteins the number of
Lutefisk-BLAST reference identification fell to only three proteins, while the X!Tandem no-enzyme identified
seven and X!Tandem trypsin ten proteins.
Table 2. Number of protein identifications of PSA1 binding partners in peptide limited sets by different search methods
and comparison to reference set of known 74 PSA1 protein interactions.
Identifications X!Tandem-
trypsin X!Tandem-no
enzyme Lutefisk Total number of
identifications
One peptide limit 106 108 112 236
Two peptide limit 58 35 24 74
Three peptide limit 38 29 7 43
Number of known
interactions X!Tandem-
trypsin X!Tandem-no
enzyme Lutefisk
One peptide limit 16/74 15/74 11/74
Two peptide limit 13/74 9/74 6/74
Three peptide limit 10/74 7/74 2/74
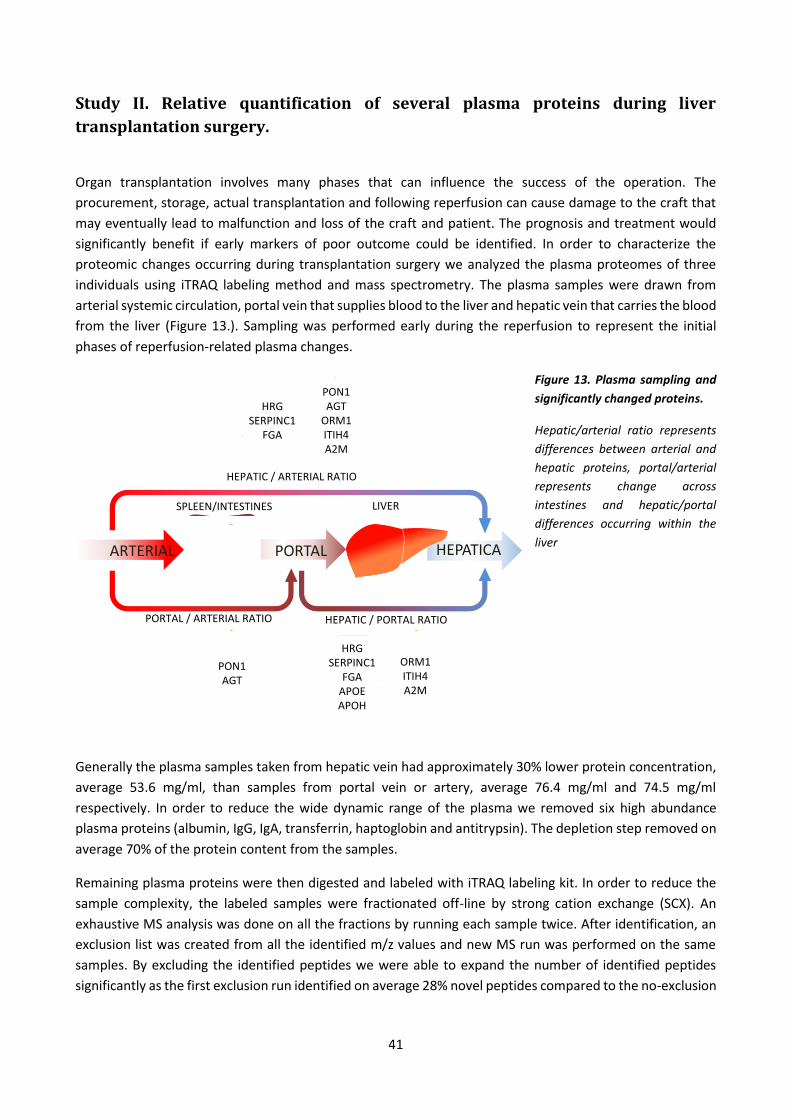
41
Study II. Relative quantification of several plasma proteins during liver
transplantation surgery.
Organ transplantation involves many phases that can influence the success of the operation. The
procurement, storage, actual transplantation and following reperfusion can cause damage to the craft that
may eventually lead to malfunction and loss of the craft and patient. The prognosis and treatment would
significantly benefit if early markers of poor outcome could be identified. In order to characterize the
proteomic changes occurring during transplantation surgery we analyzed the plasma proteomes of three
individuals using iTRAQ labeling method and mass spectrometry. The plasma samples were drawn from
arterial systemic circulation, portal vein that supplies blood to the liver and hepatic vein that carries the blood
from the liver (Figure 13.). Sampling was performed early during the reperfusion to represent the initial
phases of reperfusion-related plasma changes.
Figure 13. Plasma sampling and
significantly changed proteins.
Hepatic/arterial ratio represents
differences between arterial and
hepatic proteins, portal/arterial
represents change across
intestines and hepatic/portal
differences occurring within the
liver
Generally the plasma samples taken from hepatic vein had approximately 30% lower protein concentration,
average 53.6 mg/ml, than samples from portal vein or artery, average 76.4 mg/ml and 74.5 mg/ml
respectively. In order to reduce the wide dynamic range of the plasma we removed six high abundance
plasma proteins (albumin, IgG, IgA, transferrin, haptoglobin and antitrypsin). The depletion step removed on
average 70% of the protein content from the samples.
Remaining plasma proteins were then digested and labeled with iTRAQ labeling kit. In order to reduce the
sample complexity, the labeled samples were fractionated off-line by strong cation exchange (SCX). An
exhaustive MS analysis was done on all the fractions by running each sample twice. After identification, an
exclusion list was created from all the identified m/z values and new MS run was performed on the same
samples. By excluding the identified peptides we were able to expand the number of identified peptides
significantly as the first exclusion run identified on average 28% novel peptides compared to the no-exclusion
ARTERIAL PORTAL HEPATICA
LIVERSPLEEN/INTESTINES
HEPATIC / ARTERIAL RATIO
PORTAL / ARTERIAL RATIO HEPATIC / PORTAL RATIO
HRGSERPINC1
FGAAPOEAPOH
ORM1ITIH4A2M
HRGSERPINC1
FGA
PON1AGT
ORM1ITIH4A2M
PON1AGT
42
run. The second exclusion produced an additional 10% increase in peptide identification results proving the
benefit of sample mining through repeated exclusion runs.
The total number of identified proteins in all patient samples and repeat MS runs was 72. 53 of the identified
proteins are found in the list of top 150 of most abundant plasma proteins196 highlighting the limitations in
sensitivity of the used methods and MS machinery. Of the 72 identified proteins 31 could be also quantified.
The overall change in abundance was generally rather low as only ten proteins passed the 10% significance
limit.
The examination of the over ten percent changed proteins in the portal to hepatic comparison revealed five
proteins that had reduced in abundance within the liver (Figure 13). These included Histidine-rich
glycoprotein (HRG), Antithrombin-III (SERPINC1), Fibrinogen alpha chain (FGA), Apolipoprotein E (APOE) and
Beta-2-glycoprotein 1 (APOH). The largest reduction was observed with HRG as the amount decreased by
almost 30% within the liver. Three proteins were found to increase over ten percent. Alpha-1-acid
glycoprotein 1 (ORM1) was increased by 15%, Inter-alpha-trypsin inhibitor heavy chain H4 (ITIH4) increased
by 20% and Alpha-2-macroglobulin by almost 25%. The comparison of hepatic plasma to arterial plasma
showed very similar changes to the hepatic to portal sample. Eight out of ten significantly increased proteins
were common to both, only APOE and APOH displayed smaller than ten percent change (approximately -4%
in APOE and ~-8% APOH). The changes observed in portal to arterial plasma was less pronounced as only two
proteins, Serum paraoxonase/arylesterase 1 (PON1, +16%) and Angiotensinogen (AGT, +12%) were found to
change more than ten percent.
Study III. Label-free mass spectrometry proteome quantification of human
embryonic kidney cells following 24 hours of sialic acid overproduction
The main benefit of label-free quantification is that it does not require sample derivatization prior to MS runs.
This eliminates the inevitable loss of sample during processing steps. In order to view the functional changes
caused by extensive sialic acid, N-Acetylneuraminic acid (Neu5Ac), production in mammalian cells, we utilized
high resolution mass spectrometry and label-free protein quantification in proteome analysis of in embryonic
kidney cells. The peptides were analyzed using ion mobility separation, MSE fragmentation and then
quantified with Expression-E label-free quantification method. We also monitored the levels of Neu5Ac and
ManNAc by multiple reaction monitoring MS (MRM-MS).
We induced the production of Neu5Ac by adding a 30mM ManNAc to the cell culture media. The ManNAc
and Neu5Ac levels were measured prior to induction, 15 and 30 minutes after and hourly for the first six
hours. Final measurement was done 24 hours after ManNAc addition. We saw no change in the levels of
Neu5Ac or ManNAc in the non-induced control samples. However, the ManNAc level began to rise 15
minutes after induction. Intracellular ManNAc stabilized after one hour to approximately 2.7 times that of
the zero-hour sample. After 24 hours the ManNAc level had increased to approximately 4.8 times higher than
the original zero-hour sample. The Neu5Ac level did not show significant increase in the first 30 minutes but
began to rise after one hour. The levels continued to rise almost linearly and were had risen approximately
70-fold after 24 hours in induction.
The proteomic changes occurring after 24 hours of induction were examined using label-free MS
quantification. All samples were done using three biological replicates and all samples were run three times
to ensure good technical reproducibility. Prior to quantification the quality of MS-data was assessed. The

43
mass accuracy of runs was approximately 1 ppm. The retention time and intensity errors in detected ions
between runs were on average 5.1% and 0.8% respectively. The number of identified peptides that were
found in three technical replicates was on average 58% and 72% on at least two replicates. Overall the quality
of data was judged good enough for label-free quantification.
In all the biological and technical replicates we were able to identify altogether 1802 distinct peptides with
at least one good quality peptide. Out of these we were able to quantify 1193 in at least two biological
replicates. 105 proteins were shown to be significantly up- or down-regulated (>1.3 fold regulation). Out of
these only seven were up- and 98 were down-regulated. The MS quantification results were verified with
Western Blot analysis of three representative proteins.
We then performed functional analysis of the set of 105 changed proteins using Gene Ontology enrichment,
DAVID functional analysis and Ingenuity Pathway Analysis tool (IPA). Several categories were identified in the
set of changed proteins. These included Protein transport, Plasma membrane, Signal transduction, Small
GTPase, Golgi apparatus, Metabolic pathways of S-adenosylmethionine as well as Purine and Pyrimidine
biosynthesis pathways and Remodeling of cellular adherens junctions. IPA analysis also revealed two
interconnecting pathway clusters among the significantly changed proteins. One network contained several
signaling pathways related to cytoskeletal organization, cell-cell contact and Remodeling of adherens
junctions. Other interconnected network contained cell cycle, apoptosis and protein synthesis- associated
categories.
In order to characterize the protein-protein interactions among the changed proteins, we downloaded all the
interactions of all the 105 significantly changed proteins from PINA database197,198. This resulted in a list of
2421 interacting proteins and 4539 interactions. This list was filtered to include only those interactions
occurring between the changed set. This resulted in 40 proteins and 47 interactions including proteins sharing
functional similarities such as ribosomal, proteasome and spliceosome proteins.
Study IV. Gremlin-1 associates with fibrillin microfibrils in vivo and regulates
mesothelioma cell survival through transcription factor slug
Analysis of model organisms is usually one of the first steps in biomarker discovery. Cell lines derived from
diseased tissues can be examined to elucidate the mechanism behind the disease. Normal cell lines can also
be manipulated in order to investigate the effects in cellular functions. In affinity purification the interaction
partners of specific proteins are studied by expressing the affinity tagged protein in cell lines. The acquired
interactomes of proteins can reveal interesting new biological functions but also the role of the proteins in
diseases and other abnormal states. In a study of Gremlin-1 (GREM1), a cytokine inhibiting the functions of
bone morphogenic factors, the interactome of GREM1 was investigated using affinity purification mass
spectrometry. The findings were then validated in primary cell cultures from aggressive mesothelioma cell
line and patient derived tumor tissue samples.
The interactome of GREM1 was purified using tandem affinity purification method and analyzed with high-
resolution mass spectrometer. The interacting proteins were identified using Mascot and X!Tandem search
engines. The use of two search strategies improves the reliability of the identifications as the algorithms are
different and can be considered as orthogonal methods. The final list of GREM1 interactions composed of
twelve proteins that were found in all three biological replicates and using both search engines.

44
The tagged GREM1 was transfected to the FlipIn HEK293 cell line using stable insertion to genome with an
inducible tetracycline promoter. However, even with small induction, the amount of tagged GREM1 may be
considerably higher than the native form resulting in unspecific interactions. Additionally, the tag itself or
purification material may bind some proteins that will produce false positives in the results. For this reason
we filtered the list of acquired interactions with those proteins that were identified from mock purification
done using the cell line that was transfected with the tag-containing expression vector. 377 distinct proteins
were found to bind the tag or purification material. These were removed from the identified GREM1
interactions resulting in a list of four different interacting proteins. These included Cytokeratin-9 (KTR9),
Cytokeratin 2a (KRT2), APOBEC1-binding protein 2 (DNAJB11) and Fibrillin-2 (FBN2). Fibrillin-2 was identified
in all three replicate experiments and at least with two peptides in two replicates.
The interaction between GREM1 and FBN2 was further investigated with surface plasmon resonance
technology suggesting a strong interaction between the proteins. Additional colocalization and -expression
assays in primary mesothelioma cell lines and tumor tissues also confirmed association with GREM1 and
FBN2.

45
DISCUSSION
Database dependent search engines have become the default protein identification methods in proteomic
mass spectrometry199. Several different algorithms have been developed to identify the peptides and their
respective proteins from complex mixtures. In this work we utilized several database dependent search
strategies, including Mascot94, X!Tandem194,195 and Waters ProteinLynx Global Server (PLGS) to identify
proteins from mammalian and yeast cells as well as human plasma. In general the database dependent
methods are quite straightforward. The proteins are purified, digested with trypsin and then analyzed with
MS2. However, some samples require extensive sample handling prior to MS analysis. The dynamic range of
plasma proteins and the especially the overrepresentation of albumin in plasma can significantly reduce the
number of identification by charge competition and other ion suppression effects28. In a study of proteomic
changes in plasma during liver transplantation surgery we depleted six high abundance proteins from plasma
samples removing approximately 70% of the proteins content. In order to further reduce the complexity of
the samples prior to the MS we fractionated the digested peptides using strong cation exchange to eleven
fractions. Samples were then analyzed with LC-MS/MS and Mascot search engine to identify the proteins.
Overall we were able to identify 72 proteins in all patients, which is a rather low number of identifications
considering the complexity of plasma10. One reason for the lack of proteins identification could be that the
original depletion step was not adequate enough to reduce to number of high abundance proteins that mask
the lower abundance peptides in the MS. Additionally, the limitations in detection sensitivity of the used,
limited performance mass spectrometer has the potential to limit the detection to only the high abundance
fraction of the plasma proteome.
A complementary way of database related identification is de novo peptide sequencing. Deciphering of
peptide sequence from spectra can be used to bypass the dependence of known sequences in database
related protein search106 but also to add confidence to the data if used in conjunction with other identification
methods. We used database–related search engine X!Tandem and Lutefisk de novo sequencing algorithm to
investigate the changes in yeast PSA1 protein during various points of batch cultivation. We tested the effect
of enzyme limitation to protein identifications by setting the search parameters to trypsin digested peptides
and also setting the parameter to all possible peptides with no specified digestion enzyme (Table 2.). The
quality of the PSA1 binding partner identifications was also examined by observing the effects of limiting the
number of detected peptides in protein identification. The identification results when the identification was
limited to only one detected peptide, produced almost equal number of proteins identifications in X!Tandem
trypsin- limited, X!Tandem no-enzyme limitations and Lutefisk searches. However, as the peptide limit was
raised to two or three the number of the quality differences between the methods became more evident.
X!Tandem trypsin identified the highest number of proteins in both sets while the number of Lutefisk
identified proteins fell almost 80% in two peptide limited search and 93% in three peptide limited set.
X!Tandem no-enzyme identified approximately 30% less proteins in both peptide limit sets than X!Tandem
trypsin. Such comparison illustrates that the traditional database-related methods still exceed de novo
identification methods in the identification efficiency. Also, the use of specific enzyme limitation is extremely
beneficial as it limits the search space of the search thus reducing the processing time but also improves the
identification efficiency199. However, the use of de novo method is not without merit. In the one peptide
limited search we could identify 31 proteins with all three methods. Such combined use of two totally
different search algorithms can increase the confidence in the protein identification since it is unlikely that

46
the both algorithms will identify the same random peptide. This becomes valuable especially in the low
abundance proteins that are often found by only one peptide.
The added confidence in identification can be achieved also by using two database-related search engines200.
Even if the basic principle of protein identifications is the same, the algorithms that are used to detect and
score the identified proteins are different so the two search engines can be considered as complementary
methods201. The need for more rigorous filtering criteria and validation is particularly evident in interaction
studies as they have a tendency to contain a number of false positive results arising from nonspecific binding
either to the proteins themselves or the material that is used in the complex isolation58. Therefore the
validation of identifications and removal of false positives is crucial especially in cases where specific
biomarkers for diseases are being examined. In the study of biological functions of lung cancer related202,203
GREM1 in mesothelioma, we examined the interactome of GREM1 using AP-MS in HEK293 model cell line
using two database-related search engines, Mascot and X!Tandem. We used stringent criteria and
background filtering scheme to limit the identification to true positives. The criteria included detection in all
biological replicates with good peptide hits on both search engines. We also performed a background protein
subtraction using a list of proteins that were identified in AP-MS analysis of non-tagged cell line. Four proteins
passed our criteria, including Fibrillin-2 (FBN2). FBN2 is a structural part of extracellular microfibrils that
regulate the bioavailability of several growth and morphogenic factors such as BMP- 2, -4 and -7204,205 which
are also shown to bind and be inhibited by GREM1206,207. Even though we used stringent filtering criteria with
the MS results to limit the results, the interaction between GREM1 and FBN2 was further examined using
surface plasmon resonance technology. The results confirmed the strong physical interaction between
GREM1 and the N-terminal peptide of FBN2. In order to examine the interactions in vivo, the expression and
localization of GREM1 and FBN2 was monitored in cultured primary mesothelioma cells and in tumor tissue.
In mesothelioma tumor biopsies the GREM1 and FBN2 staining patterns were very similar suggesting strong
colocalization. Additionally, gene expression analysis of primary mesothelioma cell line revealed strong
expression of both GREM1 and FBN2 further confirming the association between these two proteins. This
work clearly illustrates the utility of AP-MS in targeted discovery type biomarker research where novel targets
of diseases are being studied. Even though the exact mechanism and functions of GREM1 and FBN2 in
mesothelioma need further elucidation, information obtained from this interaction experiment may greatly
aide in future mesothelioma biomarkers search.
Database-related search engines identify the peptides by comparing the observed spectra to theoretical in
silico digested spectra and calculates the probabilities of the detection95. In high background samples or low
intensity spectra the identifications may be incorrectly assigned producing a false positive identification or
rejection of true positives. In the liver transplantation plasma quantification experiment we used iterative
strategy of excluding detected peptides from subsequent searches to increase the number of detected
peptides. Based on the first MS run we assigned those m/z values with good peptide identification to
exclusion lists. The same sample was then run again with MS/MS exclusion list, this time fragmenting only
those peptides that were not identified in the first run. By using several rounds of this run and exclude-
strategy and combining all of the peak lists in the final Mascot search, we were able to significantly expand
the number of identified peptides and add confidence to our protein identifications.
One of the major goals of this work was to learn and utilize mass spectrometric quantification in biological
samples and to examine that data in biological and clinical context. To this end we used iTRAQ labeling
method115 and label-free quantification130 to assess the proteomic changes in human plasma and cellular
lysate. In an experiment to learn more about the changes occurring in liver during liver transplantation, we

47
labeled depleted plasma samples from three sampling points representing blood flow to and from liver and
gut with iTRAQ (Figure 13.). Even though we used extensive sample fractionation and several MS runs
including exclusion lists, we were able to identify altogether only 72 distinct, mostly high abundance
proteins196 and quantify 31 of those with confidence in all samples. Of the 31 quantified proteins only ten
showed changes larger than 10%. Of the ten proteins that were changed more than ten percent five were
reduced in abundance within liver. Four of these, (Histidine-rich glycoprotein HRG, Antithrombin-III
SERPINC1, Fibrinogen alpha chain FGA, Beta-2-glycoprotein-1 APOH) are related to blood coagulation208-209.
Additionally Beta-2-glycoprotein (APOE) was found to be consumed by the liver. APOE functions as a part of
lipoprotein particles mediating their removal by hepatocytes so the clearance in the liver represents the
normal liver functions210. Three proteins increased in abundance within liver. These included Alpha-1-acid
glycoprotein (ORM1), Alpha-2-macroglobulin (A2M) and Inter-alpha-trypsin inhibitor heavy chain H4 (ITIH4).
ORM1 and ITIH4 are both acute phase, liver produced proteins211,212. ORM1 functions as a general transporter
protein in the plasma but also as a modulator of immune system during acute-phase213. ITIH4 has been linked
to acute phase response in trauma and has been shown to increase during acute ischemic stroke and
surgery214,211. A2M is a high abundance protein that functions as general plasma proteinase inhibitor215. In
general our data suggests that the coagulation cascade is activated within the craft in the very early phases
of reperfusion. Simultaneously acute phase proteins are released from the liver in response to the trauma
from the surgery. The quite small number of changed proteins could be due to the fact that the samples were
taken from the very first rinse of the portal blood in the craft and the full proteomic effects have not had the
time to occur. Alternatively, the reason could be that the levels of high abundance proteins are very unlikely
to show major fold changes. A massive increase or reduction in the levels of several high abundance proteins
could alter the osmotic balance of the blood leading to disruptions in humoral homeostasis and functions.
Conversely, the low abundance proteins could exhibit much larger changes in response to trauma without
affecting the major humoral proteomic status. However, due the sensitivity limitations of the used MS
instrument and possibly insufficient sample fractionation216,119 we were unable to characterize the low
abundance fraction of plasma
One problem with iTRAQ is that the labeling protocol requires several handling and fractionation steps that
may cause sample loss and unreliable quantification. Label-free quantification offers an alternative, more
straightforward way of MS-based protein quantification. We utilized label free protein quantification to
examine the effects of excess sialic acid production in N-Acetylmannosamine (ManNAc) induced HEK293
cells217 (Figure 14.). Exogenous ManNAc has been shown to induce the production of sialic acid in mammalian
cells218, sialic acid in turn is generally used as terminal glycan in many glycoproteins48. The excessive
production of sialic acid was quantified and verified using multiple reaction monitoring mass spectrometry
(MRM-MS). With the added sensitivity of UPLC level separation, MSE-based fragmentation and ion mobility
separation we were able to identify over 1800 distinct proteins from HEK293 cells. We quantified the proteins
using label-free, area under the curve Expression-E method116. Altogether we quantified the relative changes
of 1193 different proteins in at least two biological repeats. The added sensitivity and resolution of the newer
MS instrumentation can be clearly illustrated by comparing the iTRAQ results and Expression-E
quantification. The iTRAQ experiment was performed on a limited resolution and sensitivity LC-MS system
limiting the identification and quantifications to tens of proteins. On the other hand, the Expression-E
experiment was done using state of the art MS instrument with high precision liquid chromatography. The
effect of high pressure liquid chromatography has been shown to significantly increase the peptide
separation and subsequent MS identification efficiency133. Additionally, in Expression-E experiment we
utilized IMS separation84 that further separates the ions within mass spectrometer thus allowing more

48
peptide to be detected and identified. Fragmentation using DDA methods can significantly limit the number
of identifications219 but also bias the identifications to the high abundance proteins of the sample220,3. In the
plasma work where identification was limited to high abundance proteins, the fragmentation was done using
DDA. In contrast, the Expression-E experiment used MSE method to fragment all eluting peptides thus
expanding the dynamic range and number of detected proteins.
The biological data obtained using MS can be divided in to two categories. Global proteomic experiments
characterize the behavior of multitude of proteins in different states as targeted experiments focus more on
the characteristics of individual or a selected group of proteins. A part of the targeted proteomic research is
the study of protein-protein interactions. In the study of the interaction partners of yeast GDP-mannose
producing enzyme PSA1221 in various points of batch cultivation (Figure 12), we identified major changes in
the amount of ribosomal proteins binding to PSA1. The first two sampling points, representing time of high
growth, showed the highest number of ribosomal protein binding totaling of 21 unique proteins. After
reaching the limits of growth due to limitation in nutrients in the final two time points the number of
ribosomal PSA1 binding proteins halved. Non-ribosomal proteins were seen to vary also throughout the
cultivation. We identified proteins of plasma membrane functions, biosynthesis machinery, cellular signaling
and energy production- related categories. Based on our data the interaction landscape of the PSA1 protein
is quite dynamic. During the early phases of cultivation and time of rapid growth, the biosynthesis of PSA1 is
high due to the high demand of proteins of cell wall synthesis of rapidly growing and budding cells. This may
be reflected on the number of ribosomal proteins binding to newly synthesized PSA1. In the latter time points
the growth is slow so the synthesis of PSA1 is diminished leading to reduced number of interacting ribosomal
proteins. Similarly the interactions to non-ribosomal proteins vary based on the cultivation phase. As a key
player in the cell wall synthesis machinery221,222 PSA1 could influence the rate of cell wall synthesis by altering
the direct interactions to other proteins participating in cell wall synthesis. It may also modulate other
systems indirectly by binding and affecting signaling proteins or directly with interactions to proteins of
biosynthetic processes and energy production. The dynamic nature of PSA1 interactome may be the reason
for the rather low sensitivity when comparing to known PSA1 interactors. Only 18 out of 74 known PSA1
binding proteins were identified in the experiment. This low number could be due to false negatives resulting
from missed MS detection of low stoichiometry proteins or loss of binding partners in sample processing
steps. Additionally, the differences may be a result of different cultivation conditions in the reference set as
we showed that the interactions are strongly dependent on the state of the cultivation and possibly other
environmental factors. Even with the limitations in sensitivity, our experiment showed that AP-MS-
identification and interaction analysis of samples can bring new information about the behavior of proteins
in different phases of cultivation.
The global proteomic experiments produce a wealth of data of numerous proteins. Examination of each
individual protein is not enough to create a full systemic picture of cellular events so analysis is often done
using different ontologies140. When examining the effects of sialic acid overproduction in HEK293 cells we
analyzed the data using several different ontologies. In our study we identified 105 proteins that were found
significantly altered after induction of sialic acid production with N-Acetylmannosamine. Interestingly 100 of
those proteins showed down-regulation and only seven up-regulation. The reason for such bias towards
down-regulated proteins may be that cells adapt to the stress resulting from increased sialic acid
concentration by down-regulating certain cellular systems rather than initiating new processes by protein
up-regulation. To view the exact processes that were affected we analyzed the resulting list of 105 changed
proteins using ontologies such as Gene Ontology, DAVID functional analysis tool and Ingenuity Pathway
Analysis. Several enriched categories were identified. One of the main findings was that the protein transport

49
category was clearly enriched as we identified 16 proteins in that category. Among the proteins annotated
to protein transport category were several small GTPase proteins. Small GTPases are used in targeting cellular
transport vesicle and also in organelle identification purposes223-224. A set of these small GTPases are also
associated with Golgi apparatus. Golgi contains the glycosylation machinery and is the ultimate destination
of CMP-activated sialic acid so the proteomic changes relating Golgi apparatus are not unexpected. Another
strongly enriched category was Remodeling of Adherens Junction category. Plasma membrane bound
adherens junctions mediate cellular contacts between adjacent cells using E-cadherin protein225. E-cadherin
has been shown to contain sialic acid226 so excess cellular sialic acid could alter the sialylation state of E-
cadherin resulting in remodeling of the junction to adapt to the new situation. We also identified select
metabolic and cellular proliferation related categories in the changed set of proteins. The physical
interactions between the changed proteins were examined by downloading all known interaction from PINA
database198,197. 47 interactions were identified between 40 of the changed proteins including several
proteasomic, spliceosomic and ribosomal proteins. Taken together our data suggests that overproduction of
sialic acid alters the transport of cellular cargo within the cell (Figure 14.). Increased flux through glycosylation
machinery has been shown to affect the cell surface protein glycosylation pattern227,228 so the changes
observed in the protein transport machinery could be the result of this altered trafficking to the cell surface.
One possible target of the differentially glycosylated proteins is the cellular adherens junction and its resident
E-cadherin. Excess sialic acid in E-cadherin could result in disturbed cellular contacts and subsequent
remodeling of the adherens junction contact points. Simultaneously the cell proliferation and metabolic
processes are regulated to adapt the stress caused by abnormal sialic acid levels. Additional studies are still
warranted to verify and further characterize the results; however, our experiment demonstrates the usability
of global MS protein quantification and ontology-based analysis in deciphering complex cellular processes.
Figure 14. Effect of ManNac induction and sialic acid overproduction.
After induction with 30mM N-Acetylmannosamine the cellular sialic acid levels increased over 70-fold. This may lead to
accumulation of excess sialic acid and subsequent incorporation to glycoproteins. The transport of these proteins to cell
surface leads to changes in cell-cell contacts. The cells then try to adapt to the new situation by changing the cellular
tranport routes and cellular adherens junctions. Additionally select metabolic routes are affected by the increase in sialic
acid content.
Excess sialylated proteinstransported to cell
surface?
ManNAcinduction
MRM-MS:SIA increase
~70-fold
0
2000
4000
6000
8000
10000
12000
14000
16000
0 5 10 15 20 25
Hours
Effect toCell metabolism?
Plasma membrane proteins?Cell-cell contacts?
Adherens junctions?
Adaptation to excessSIA after 24h
Adaptation by:Altered protein transport?
Changes in metabolic processes?Remodeling of cellular adherens junctions?
…?SIA intensity

50
CONCLUDING REMARKS AND FUTURE PROSPECTS
In this project we utilized mass spectrometry methods in proteomic research. We analyzed the global
proteomic patterns of human plasma and model cell line as well as characterized the proteomic changes
occurring after perturbations using two different mass spectrometric quantification methods. We also used
several protein identification algorithms to identify protein-protein interactions from mammalian cells and
Baker´s yeast. In the interaction experiment involving yeast PSA1 proteins we showed that the physical
protein-protein interactions vary considerably depending on the stage of the batch cultivation. We also
demonstrated the applicably of combined use database dependent and de novo protein identification
methods in mass spectrometric proteome research. Similarly, in the study to decipher the interaction
partners of lung cancer related GREM1 protein, we used two database dependent search algorithms to limit
the results to true positives. One of the identified proteins was FBN2. The interaction with GREM1 and FBN2
in vitro was confirmed by surface plasmon resonance. In vivo experiments also showed strong co-localization
and co-expression of GREM1 and FBN2 in primary cell lines and tumor tissue. This type of AP-MS
identification of novel binding partners clearly demonstrates the benefit of targeted MS analysis of disease
related proteins in basic functional characterization of these proteins but also in search for novel disease
biomarkers.
The developments in quantification methodology of mass spectrometers have had a significant effect in large
scale proteomic research. In this work we utilized label-based iTRAQ quantification to elucidate the changes
that occur in human liver during transplantation. We employed rigorous fractionation of samples and
multiple rounds of exclusion MS runs to identify 72 distinct plasma proteins. Ten of these showed abundance
changes of more than ten percent. The results indicate that coagulation cascade is activated within the
transplanted craft immediately upon reperfusion. The liver consumes but also secretes several proteins
related to coagulation and acute phase response. The data obtained could be used as a starting point for
expanded studies to find biomarkers for craft rejection as well as in patient prognosis. In addition to label-
based methods we used high resolution mass spectrometry and label free MS quantification to examine the
proteomic effects of excess sialic acid production in mammalian cells. After 24 hours of sialic acid
overproduction we were able to show significant abundance changes of 105 proteins. Functional ontology
analysis of the changed proteins showed reduction in cellular protein transport, select metabolic and
signaling pathways and in the organization of cellular adherence junctions. The analysis of this type
demonstrates the capabilities of simple, large scale quantitative MS analysis in decoding the larger functional
processes in model biological systems but also the possibilities of such MS-analysis in novel biomarker
discovery in clinical cases. In combination with external data such as interaction databases, gene expression
repositories and other data sources the obtained MS data can significantly improve the analysis of cellular
systems and generate information that could not have been done without the use of these high throughput
methods.
This work was carried out during a time when the developments in mass spectrometric instrumentation and
data processing tools have increased the amount of biological information tremendously. The ever increasing
sensitivity and resolution of mass spectrometers and evolving bioinformatic solutions will surely continue to
add to the already vast amount of data available. At the same time the gene expression, genetic sequence,
metabolic, phenotype and other -omics data has seen a similar increase in abundance creating a wealth of
data for public use. Combining all this data will provide deeper insight in the biological processes under
investigation but also a deeper understanding of the complexity of entire biological systems. The challenge

51
for future biologist is in how to decipher the multitude of data resulting from these systems biology analyses
and in how to translate that in to relevant clinical solutions.

52
ACKNOWLEDGEMENTS
This study was carried out in Transplantation Laboratory in Haartman Institute at the University of Helsinki. I
would like to thank the Transplantation laboratory and Haartman Institute for the financial support during
the many years it took to finalize this study as well as for the excellent working environment and research
infrastructure. I am also grateful to the Glycoscience Graduate School for the financial and educational
support I have received throughout these past years as a student and coordinator of the school.
My warmest gratitude goes to Professor Risto Renkonen for hiring me ten years ago for summer job. That
summer job evolved into graduate thesis four years later and now culminated finally this thesis work. Thank
you for believing in me and in my work as well as for the continuous support through this past ten years.
I am grateful to Leena Valmu and Sakari Kellokumpu for having the courage to review this thesis and for their
helpful comments and suggestions on the contents of the thesis.
I wish to thank my thesis supervisory board members Leena Valmu and Mikael Skurnik for the help and
support during my time as graduate student.
This thesis would not have been possible without the contribution of my colleagues to the manuscripts this
thesis is based on. Particularly I would like thank Sakari Joenväärä, Niina Tohmola, Pirkko Mattila, Hannu
Peltoniemi, Eija Tukiainen, Minna Ilmakunnas, Jenni Tamminen and Katri Koli for the productive and
successful collaboration.
My colleagues at the Transplantation Laboratory and Risto Renkonen Laboratory have also been a major part
of the success of this thesis. A massive amounts of gratitude goes to Pirkko Mattila, Hilkka Kontro, Jutta
Renkonen and Mayank Saraswat for the scientific discussions and for the not-that-scientific coffee table
discussions.
A significant part of the successful completion of this thesis has been the weekly motivational meetings with
Annika Wennerström and Niina Tohmola. Thank you for allowing me to complain and unload the burdens of
writing this thesis. A special thanks goes to Suvi Renkonen for pointing me that sometimes we worry too
much on meaningless issues.
I wish to thank Sakari Joenväärä for taking me under his wings from the very first day I started and for being
my mentor through these years. Thank you for showing me the world of mass spectrometry and proteomics
and for the fun (and sometimes painful) lessons on the workings of the mass spec. It has been a fun ride.
Thank you!
A big shout-out to all of my friends who have been instrumental in keeping my spirits up and for listening my
grievances and problems. I specially would like to thank Niina and Jouni for their support and friendship on
and off work.
My family also deserves my deepest gratitude. My parents, Anja and Simo, thank you for your support,
encouragement and general parenting for the past 34 years. My brother Olli, thank you for the countless
scientific discussions we have had over coffee during TNG, Mythbusters and various other TV-shows.

53
And finally I would like to thank Sami for listening to my worries and urging me to continue at the most
bleakest of times. Thank you for all the support you have given me and for your companionship. This could
not have been possible without you.
Helsinki, January 2014
-Ville
54
REFERENCES
1. Mallick, P. & Kuster, B. Proteomics: a pragmatic perspective. Nat Biotechnol 28, 695-709 (2010).
2. Aebersold, R. & Mann, M. Mass spectrometry-based proteomics. Nature 422, 198-207 (2003).
3. Washburn, M. P., Wolters, D. & Yates, J. R.,3rd. Large-scale analysis of the yeast proteome by multidimensional protein identification technology. Nat Biotechnol 19, 242-247 (2001).
4. Diamandis, E. P. & van der Merwe, D. E. Plasma protein profiling by mass spectrometry for cancer diagnosis: opportunities and limitations. Clin Cancer Res 11, 963-965 (2005).
5. Qian, W., Jacobs, J. M., Liu, T., Camp, D. G. & Smith, R. D. Advances and challenges in liquid chromatography-mass spectrometry-based proteomics profiling for clinical applications. Mol Cell Proteomics 5, 1727-1744 (2006).
6. Wasinger, V. C. et al. Progress with gene‐product mapping of the Mollicutes: Mycoplasma genitalium. Electrophoresis 16, 1090-1094 (1995).
7. Kitano, H. Systems biology: a brief overview. Science 295, 1662-1664 (2002).
8. Ideker, T., Galitski, T. & Hood, L. A new approach to decoding life: systems biology. Annu Rev Genom Hum G 2, 343-372 (2001).
9. Hartwell, L. H., Hopfield, J. J., Leibler, S. & Murray, A. W. From molecular to modular cell biology. Nature 402, C47-C52 (1999).
10. Anderson, N. L. et al. The human plasma proteome. Mol Cell Proteomics 3, 311 (2004).
11. Farrugia, A. Albumin usage in clinical medicine: tradition or therapeutic? Transfus Med Rev 24, 53-63 (2010).
12. Schwanhäusser, B. et al. Global quantification of mammalian gene expression control. Nature 473, 337-342 (2011).
13. Khoury, G. A., Baliban, R. C. & Floudas, C. A. Proteome-wide post-translational modification statistics: frequency analysis and curation of the swiss-prot database. Sci Rep 1 (2011).
14. Deribe, Y. L., Pawson, T. & Dikic, I. Post-translational modifications in signal integration. Nat Struct Mol Biol 17, 666-672 (2010).
15. Olsen, J. V. et al. Quantitative phosphoproteomics reveals widespread full phosphorylation site occupancy during mitosis. Sci Signal 3, ra3 (2010).
16. Han, J. J. et al. Evidence for dynamically organized modularity in the yeast protein-protein interaction network. Nature 430, 88-93 (2004).
17. Nooren, I. M. & Thornton, J. M. Diversity of protein–protein interactions. EMBO J 22, 3486-3492 (2003).

55
18. Reid, G. E. & McLuckey, S. A. ‘Top down’protein characterization via tandem mass spectrometry. J Mass Spectrom 37, 663-675 (2002).
19. Michalski, A. et al. Ultra high resolution linear ion trap Orbitrap mass spectrometer (Orbitrap Elite) facilitates top down LC MSMS and versatile peptide fragmentation modes. Mol Cell Proteomics 11 (2012).
20. Tian, Z. et al. Enhanced top-down characterization of histone post-translational modifications. Genome Biol 13, R86 (2012).
21. Zhang, H., Cui, W., Wen, J., Blankenship, R. E. & Gross, M. L. Native electrospray and electron-capture dissociation in FTICR mass spectrometry provide top-down sequencing of a protein component in an intact protein assembly. J Am Soc Mass Spectrom 21, 1966-1968 (2010).
22. Wu, C. C. & MacCoss, M. J. Shotgun proteomics: tools for the analysis of complex biological systems. Curr Opin Mol Ther 4, 242-250 (2002).
23. Old, W. M. et al. Comparison of label-free methods for quantifying human proteins by shotgun proteomics. Mol Cell Proteomics 4, 1487-1502 (2005).
24. Weiss, M., Schrimpf, S., Hengartner, M. O., Lercher, M. J. & von Mering, C. Shotgun proteomics data from multiple organisms reveals remarkable quantitative conservation of the eukaryotic core proteome. Proteomics 10, 1297-1306 (2010).
25. Fenn, J. B., Mann, M., Meng, C. K., Wong, S. F. & Whitehouse, C. M. Electrospray ionization for mass spectrometry of large biomolecules. Science 246, 64-71 (1989).
26. Swaney, D. L., Wenger, C. D. & Coon, J. J. Value of using multiple proteases for large-scale mass spectrometry-based proteomics. J Proteome Res 9, 1323-1329 (2010).
27. Olsen, J. V., Ong, S. & Mann, M. Trypsin cleaves exclusively C-terminal to arginine and lysine residues. Mol Cell Proteomics 3, 608-614 (2004).
28. Annesley, T. M. Ion suppression in mass spectrometry. Clin Chem 49, 1041-1044 (2003).
29. Tang, K., Page, J. S. & Smith, R. D. Charge competition and the linear dynamic range of detection in electrospray ionization mass spectrometry. J Am Soc Mass Spectrom 15, 1416-1423 (2004).
30. Chernushevich, I. V., Loboda, A. V. & Thomson, B. A. An introduction to quadrupole–time‐of‐flight mass spectrometry. J Mass Spectrom 36, 849-865 (2001).
31. Laemmli, U. K. Cleavage of structural proteins during the assembly of the head of bacteriophage T4. Nature 227, 680-685 (1970).
32. O'Farrell, P. H. High resolution two-dimensional electrophoresis of proteins. J Biol Chem 250, 4007-4021 (1975).
33. Beranova-Giorgianni, S. Proteome analysis by two-dimensional gel electrophoresis and mass spectrometry: strengths and limitations. Trends Anal Chem 22, 273-281 (2003).
34. MacNair, J. E., Lewis, K. C. & Jorgenson, J. W. Ultrahigh-pressure reversed-phase liquid chromatography in packed capillary columns. Anal Chem 69, 983-989 (1997).
56
35. Plumb, R. et al. Ultra‐performance liquid chromatography coupled to quadrupole‐orthogonal time‐of‐flight mass spectrometry. Rapid Commun Mass Sp 18, 2331-2337 (2004).
36. Motoyama, A., Venable, J. D., Ruse, C. I. & Yates, J. R. Automated ultra-high-pressure multidimensional protein identification technology (UHP-MudPIT) for improved peptide identification of proteomic samples. Anal Chem 78, 5109-5118 (2006).
37. Hess, D., Winz, R., Brownsey, R. W., Aebersold, R. & Covey, T. C. Analytical and micropreparative peptide mapping by high performance liquid chromatography/electrospray mass spectrometry of proteins purified by gel electrophoresis. Protein Sci 2, 1342-1351 (1993).
38. Dowell, J. A., Frost, D. C., Zhang, J. & Li, L. Comparison of two-dimensional fractionation techniques for shotgun proteomics. Anal Chem 80, 6715-6723 (2008).
39. Chen, E. I., Hewel, J., Felding-Habermann, B. & Yates, J. R. Large scale protein profiling by combination of protein fractionation and multidimensional protein identification technology (MudPIT). Mol Cell Proteomics 5, 53 (2006).
40. Issaq, H. J., Chan, K. C., Janini, G. M., Conrads, T. P. & Veenstra, T. D. Multidimensional separation of peptides for effective proteomic analysis. J Chromatogr B 817, 35-47 (2005).
41. Link, A. J. et al. Direct analysis of protein complexes using mass spectrometry. Nat Biotechnol 17, 676-682 (1999).
42. Webb, K. J., Xu, T., Park, S. K. & Yates, J. R. A Modified MuDPIT Separation Identified 4,488 Proteins in a System Wide Analysis of Quiescence in Yeast. J Proteome Res (2013).
43. Gilar, M., Olivova, P., Daly, A. E. & Gebler, J. C. Orthogonality of separation in two-dimensional liquid chromatography. Anal Chem 77, 6426-6434 (2005).
44. Gilar, M., Olivova, P., Daly, A. E. & Gebler, J. C. Two‐dimensional separation of peptides using RP‐RP‐HPLC system with different pH in first and second separation dimensions. J Sep Sci 28, 1694-1703 (2005).
45. Larsen, M. R., Thingholm, T. E., Jensen, O. N., Roepstorff, P. & Jørgensen, T. J. Highly selective enrichment of phosphorylated peptides from peptide mixtures using titanium dioxide microcolumns. Mol Cell Proteomics 4, 873-886 (2005).
46. Mohammed, S. et al. Chip-Based Enrichment and NanoLC− MSMS Analysis of Phosphopeptides from Whole Lysates. J Proteome Res 7, 1565-1571 (2008).
47. Andersson, L. & Porath, J. Isolation of phosphoproteins by immobilized metal (Fe< sup> 3 </sup>) affinity chromatography. Anal Biochem 154, 250-254 (1986).
48. Varki, A., Esko, J. D. & Colley, K. J. in Essentials of glycobiology (eds Varki, A. & Schauer, R.) 37-46 (CSHL Press, New York, 2009).
49. Sharon, N. & Lis, H. Lectins: cell-agglutinating and sugar-specific proteins. Science 177, 949-959 (1972).
50. Gabius, H., André, S., Jiménez-Barbero, J., Romero, A. & Solís, D. From lectin structure to functional glycomics: principles of the sugar code. Trends Biochem Sci 36, 298-313 (2011).
57
51. Alvarez-Manilla, G. et al. Tools for glycoproteomic analysis: size exclusion chromatography facilitates identification of tryptic glycopeptides with N-linked glycosylation sites. J Proteome Res 5, 701-708 (2006).
52. Zhang, H., Li, X., Martin, D. B. & Aebersold, R. Identification and quantification of N-linked glycoproteins using hydrazide chemistry, stable isotope labeling and mass spectrometry. Nat Biotechnol 21, 660-666 (2003).
53. Jung, E., Heller, M., Sanchez, J. & Hochstrasser, D. F. Proteomics meets cell biology: the establishment of subcellular proteomes. Electrophoresis 21, 3369-3377 (2000).
54. Brunet, S. et al. Organelle proteomics: looking at less to see more. Trends Cell Biol 13, 629-638 (2003).
55. Paulo, J. A. et al. Subcellular fractionation enhances proteome coverage of pancreatic duct cells. BBA-Proteins Proteom (2013).
56. Satori, C. P., Kostal, V. & Arriaga, E. A. Review on recent advances in the analysis of isolated organelles. Anal Chim Acta (2012).
57. Cusick, M. E., Klitgord, N., Vidal, M. & Hill, D. E. Interactome: gateway into systems biology. Hum Mol Genet 14, R171-R181 (2005).
58. Dunham, W. H., Mullin, M. & Gingras, A. Affinity‐purification coupled to mass spectrometry: Basic principles and strategies. Proteomics 12, 1576-1590 (2012).
59. Bader, J. S., Chaudhuri, A., Rothberg, J. M. & Chant, J. Gaining confidence in high-throughput protein interaction networks. Nat Biotechnol 22, 78-85 (2003).
60. Bauer, A. & Kuster, B. Affinity purification‐mass spectrometry. Eur J Biochem 270, 570-578 (2003).
61. Ho, Y. et al. Systematic identification of protein complexes in Saccharomyces cerevisiae by mass spectrometry. Nature 415, 180-183 (2002).
62. Gavin, A., Maeda, K. & Kühner, S. Recent advances in charting protein–protein interaction: mass spectrometry-based approaches. Curr Opin Biotechnol 22, 42-49 (2011).
63. Bürckstümmer, T. et al. An efficient tandem affinity purification procedure for interaction proteomics in mammalian cells. Nat Methods 3, 1013-1019 (2006).
64. Rigaut, G. et al. A generic protein purification method for protein complex characterization and proteome exploration. Nat Biotechnol 17, 1030-1032 (1999).
65. Gavin, A. C. et al. Proteome survey reveals modularity of the yeast cell machinery. Nature 440, 631-636 (2006).
66. Hu, P. et al. Global functional atlas of Escherichia coli encompassing previously uncharacterized proteins. PLoS Biol 7, e1000096 (2009).
67. Guruharsha, K. et al. A Protein Complex Network of Drosophila melanogaster. Cell 147, 690-703 (2011).
68. Veraksa, A., Bauer, A. & Artavanis‐Tsakonas, S. Analyzing protein complexes in Drosophila with tandem affinity purification–mass spectrometry. Dev Dynam 232, 827-834 (2005).

58
69. Fernández, E. et al. Targeted tandem affinity purification of PSD-95 recovers core postsynaptic complexes and schizophrenia susceptibility proteins. Mol Syst Biol 5 (2009).
70. Anderson, N. L. & Anderson, N. G. The human plasma proteome: history, character, and diagnostic prospects. Mol Cell Proteomics (2002).
71. Adkins, J. N. et al. Toward a Human Blood Serum Proteome: Analysis By Multidimensional Separation Coupled With Mass Spectrometry. Mol Cell Proteomics 1, 947-955 (2002).
72. Polaskova, V., Kapur, A., Khan, A., Molloy, M. P. & Baker, M. S. High‐abundance protein depletion: Comparison of methods for human plasma biomarker discovery. Electrophoresis 31, 471-482 (2010).
73. Qian, W. et al. Enhanced detection of low abundance human plasma proteins using a tandem IgY12-SuperMix immunoaffinity separation strategy. Mol Cell Proteomics 7, 1963-1973 (2008).
74. Zhou, M. et al. An investigation into the human serum “interactome”. Electrophoresis 25, 1289-1298 (2004).
75. Gundry, R. L., Fu, Q., Jelinek, C. A., Van Eyk, J. E. & Cotter, R. J. Investigation of an albumin‐enriched fraction of human serum and its albuminome. Proteom Clin Appl 1, 73-88 (2007).
76. Karas, M. & Hillenkamp, F. Laser desorption ionization of proteins with molecular masses exceeding 10,000 daltons. Anal Chem 60, 2299-2301 (1988).
77. Cole, R. B. Some tenets pertaining to electrospray ionization mass spectrometry. J Mass Spectrom 35, 763-772 (2000).
78. Wilm, M. & Mann, M. Analytical properties of the nanoelectrospray ion source. Anal Chem 68, 1-8 (1996).
79. Lin, D., Tabb, D. L. & Yates III, J. R. Large-scale protein identification using mass spectrometry. BBA- Proteins Proteom. 1646, 1-10 (2003).
80. Ens, W. & Standing, K. G. Hybrid quadrupole/time-of-flight mass spectrometers for analysis of biomolecules. Method Enzymol 402, 49 (2005).
81. Makarov, A. Electrostatic axially harmonic orbital trapping: a high-performance technique of mass analysis. Anal Chem 72, 1156-1162 (2000).
82. Kristensen, D. B., Imamura, K., Miyamoto, Y. & Yoshizato, K. Mass spectrometric approaches for the characterization of proteins on a hybrid quadrupole time‐of‐flight (Q‐TOF) mass spectrometer. Electrophoresis 21, 430-439 (2000).
83. Morris, H. R. et al. High sensitivity collisionally‐activated decomposition tandem mass spectrometry on a novel quadrupole/orthogonal‐acceleration time‐of‐flight mass spectrometer. Rapid Commun Mass Sp 10, 889-896 (1996).
84. Pringle, S. D. et al. An investigation of the mobility separation of some peptide and protein ions using a new hybrid quadrupole/travelling wave IMS/oa-ToF instrument. Int J Mass Spectrom 261, 1-12 (2007).

59
85. Wu, C., Siems, W. F., Klasmeier, J. & Hill, H. H. Separation of isomeric peptides using electrospray ionization/high-resolution ion mobility spectrometry. Anal Chem 72, 391-395 (2000).
86. Shliaha, P. V., Bond, N. J., Gatto, L. & Lilley, K. S. The Effects of Travelling Wave Ion Mobility Separation on Data Independent Acquisition in Proteomics Studies. J Proteome Res (2013).
87. Duijn, E. v., Barendregt, A., Synowsky, S., Versluis, C. & Heck, A. J. Chaperonin complexes monitored by ion mobility mass spectrometry. J Am Chem Soc 131, 1452-1459 (2009).
88. Williams, J. P. et al. Characterization of simple isomeric oligosaccharides and the rapid separation of glycan mixtures by ion mobility mass spectrometry. Int J Mass Spectrom 298, 119-127 (2010).
89. Hunt, D. F., Yates, J. R., Shabanowitz, J., Winston, S. & Hauer, C. R. Protein sequencing by tandem mass spectrometry. P Natl Acad Sci USA83, 6233-6237 (1986).
90. Kapp, E. A. et al. Mining a tandem mass spectrometry database to determine the trends and global factors influencing peptide fragmentation. Anal Chem 75, 6251-6264 (2003).
91. Cagney, G., Amiri, S., Premawaradena, T., Lindo, M. & Emili, A. In silico proteome analysis to facilitate proteomics experiments using mass spectrometry. Proteome Sci 1 (2003).
92. Geromanos, S. J. et al. The detection, correlation, and comparison of peptide precursor and product ions from data independent LC‐MS with data dependant LC‐MSMS. Proteomics 9, 1683-1695 (2009).
93. Blackburn, K., Mbeunkui, F., Mitra, S. K., Mentzel, T. & Goshe, M. B. Improving protein and proteome coverage through data-independent multiplexed peptide fragmentation. J Proteome Res 9, 3621-3637 (2010).
94. Perkins, D. N., Pappin, D. J., Creasy, D. M. & Cottrell, J. S. Probability-based protein identification by searching sequence databases using mass spectrometry data. Electrophoresis 20, 3551-3567 (1999).
95. Eng, J. K., McCormack, A. L. & Yates Iii, J. R. An approach to correlate tandem mass spectral data of peptides with amino acid sequences in a protein database. J Am Soc Mass Spectrom 5, 976-989 (1994).
96. Vizcaíno, J. A. et al. The Proteomics Identifications (PRIDE) database and associated tools: status in 2013. Nucleic Acids Res 41, D1063-D1069 (2013).
97. Pruitt, K. D., Tatusova, T. & Maglott, D. R. NCBI reference sequences (RefSeq): a curated non-redundant sequence database of genomes, transcripts and proteins. Nucleic Acids Res 35, D61-D65 (2007).
98. Apweiler, R., Bairoch, A. & Wu, C. H. Protein sequence databases. Curr Opin Chem Biol 8, 76-80 (2004).
99. Magrane, M. UniProt Knowledgebase: a hub of integrated protein data. Database 2011 (2011).
100. Henzel, W. J. et al. Identifying proteins from two-dimensional gels by molecular mass searching of peptide fragments in protein sequence databases. P Natl Acad Sci USA90, 5011-5015 (1993).
101. Yates, J. R. Database searching using mass spectrometry data. Electrophoresis 19, 893-900 (1998).
102. Pevzner, P. A., Dancik, V. & Tang, C. L. Mutation-tolerant protein identification by mass spectrometry. J Comput Biol 7, 777-787 (2000).
60
103. Dasari, S. et al. TagRecon: high-throughput mutation identification through sequence tagging. J Proteome Res 9, 1716-1726 (2010).
104. Nesvizhskii, A. I. et al. Dynamic spectrum quality assessment and iterative computational analysis of shotgun proteomic data toward more efficient identification of post-translational modifications, sequence polymorphisms, and novel peptides. Mol Cell Proteomics 5, 652-670 (2006).
105. Yates III, J. R., Eng, J. K., McCormack, A. L. & Schieltz, D. Method to correlate tandem mass spectra of modified peptides to amino acid sequences in the protein database. Anal Chem 67, 1426-1436 (1995).
106. Taylor, J. A. & Johnson, R. S. Implementation and uses of automated de novo peptide sequencing by tandem mass spectrometry. Anal Chem 73, 2594-2604 (2001).
107. Taylor, J. A. & Johnson, R. S. Sequence database searches via de novo peptide sequencing by tandem mass spectrometry. Rapid Commun Mass Sp 11, 1067-1075 (1997).
108. Wang, P. & Wilson, S. R. Mass spectrometry-based protein identification by integrating de novo sequencing with database searching. BMC Bioinformatics 14, S24 (2013).
109. Corthals, G. L., Wasinger, V. C., Hochstrasser, D. F. & Sanchez, J. The dynamic range of protein expression: a challenge for proteomic research. Electrophoresis 21, 1104-1115 (2000).
110. Pan, S. et al. Mass spectrometry based targeted protein quantification: methods and applications. J Proteome Res 8, 787-797 (2008).
111. Ong, S. E. et al. Stable isotope labeling by amino acids in cell culture, SILAC, as a simple and accurate approach to expression proteomics. Mol Cell Proteomics 1, 376-386 (2002).
112. Krüger, M. et al. SILAC mouse for quantitative proteomics uncovers kindlin-3 as an essential factor for red blood cell function. Cell 134, 353-364 (2008).
113. Geiger, T., Cox, J., Ostasiewicz, P., Wisniewski, J. R. & Mann, M. Super-SILAC mix for quantitative proteomics of human tumor tissue. Nat Methods 7, 383-385 (2010).
114. Gygi, S. P. et al. Quantitative analysis of complex protein mixtures using isotope-coded affinity tags. Nat Biotechnol 17, 994-999 (1999).
115. Ross, P. L. et al. Multiplexed Protein Quantitation in Saccharomyces cerevisiae Using Amine-reactive Isobaric Tagging Reagents* S. Mol Cell Proteomics 3, 1154-1169 (2004).
116. Silva, J. C. et al. Simultaneous Qualitative and Quantitative Analysis of theEscherichia coli Proteome A Sweet Tale. Mol Cell Proteomics 5, 589-607 (2006).
117. Dephoure, N. & Gygi, S. P. Hyperplexing: a method for higher-order multiplexed quantitative proteomics provides a map of the dynamic response to rapamycin in yeast. Sci Signaling 5, rs2 (2012).
118. Choe, L. et al. 8‐Plex quantitation of changes in cerebrospinal fluid protein expression in subjects undergoing intravenous immunoglobulin treatment for Alzheimer's disease. Proteomics 7, 3651-3660 (2007).

61
119. Ow, S. Y. et al. iTRAQ underestimation in simple and complex mixtures:“the good, the bad and the ugly”. J Proteome Res 8, 5347-5355 (2009).
120. Zhu, W., Smith, J. W. & Huang, C. Mass spectrometry-based label-free quantitative proteomics. J Biomed Biotechnol 2010 (2009).
121. Lundgren, D. H., Hwang, S., Wu, L. & Han, D. K. Role of spectral counting in quantitative proteomics. Expert Rev Proteomic 7, 39-53 (2010).
122. Rappsilber, J., Ryder, U., Lamond, A. I. & Mann, M. Large-scale proteomic analysis of the human spliceosome. Genome Res. 12, 1231-1245 (2002).
123. Ishihama, Y. et al. Exponentially modified protein abundance index (emPAI) for estimation of absolute protein amount in proteomics by the number of sequenced peptides per protein. Mol Cell Proteomics 4, 1265-1272 (2005).
124. Colinge, J., Chiappe, D., Lagache, S., Moniatte, M. & Bougueleret, L. Differential proteomics via probabilistic peptide identification scores. Anal Chem 77, 596-606 (2005).
125. Grossmann, J. et al. Implementation and evaluation of relative and absolute quantification in shotgun proteomics with label-free methods. J Proteomics 73, 1740-1746 (2010).
126. Braisted, J. et al. The APEX Quantitative Proteomics Tool: generating protein quantitation estimates from LC-MSMS proteomics results. BMC Bioinformatics 9, 529 (2008).
127. Griffin, N. M. et al. Label-free, normalized quantification of complex mass spectrometry data for proteomic analysis. Nat Biotechnol 28, 83-89 (2009).
128. Bondarenko, P. V., Chelius, D. & Shaler, T. A. Identification and relative quantitation of protein mixtures by enzymatic digestion followed by capillary reversed-phase liquid chromatography-tandem mass spectrometry. Anal Chem 74, 4741-4749 (2002).
129. Chelius, D. & Bondarenko, P. V. Quantitative profiling of proteins in complex mixtures using liquid chromatography and mass spectrometry. J Proteome Res 1, 317-323 (2002).
130. Silva, J. C. et al. Quantitative proteomic analysis by accurate mass retention time pairs. Anal Chem 77, 2187-2200 (2005).
131. Venable, J. D., Dong, M., Wohlschlegel, J., Dillin, A. & Yates, J. R. Automated approach for quantitative analysis of complex peptide mixtures from tandem mass spectra. Nat Methods 1, 39-45 (2004).
132. Rodríguez‐Suárez, E. & Whetton, A. D. The application of quantification techniques in proteomics for biomedical research. Mass Spectrom Rev 32, 1-26 (2013).
133. Churchwell, M. I., Twaddle, N. C., Meeker, L. R. & Doerge, D. R. Improving LC–MS sensitivity through increases in chromatographic performance: Comparisons of UPLC–ES/MSMS to HPLC–ES/MSMS. J Chromatogr B 825, 134-143 (2005).
134. Kitteringham, N. R., Jenkins, R. E., Lane, C. S., Elliott, V. L. & Park, B. K. Multiple reaction monitoring for quantitative biomarker analysis in proteomics and metabolomics. J Chromatogr B 877, 1229-1239 (2009).

62
135. Kuzyk, M. A. et al. Multiple reaction monitoring-based, multiplexed, absolute quantitation of 45 proteins in human plasma. Mol Cell Proteomics 8, 1860-1877 (2009).
136. Mead, J. A., Bianco, L. & Bessant, C. Recent developments in public proteomic MS repositories and pipelines. Proteomics 9, 861-881 (2009).
137. Gerber, S. A., Rush, J., Stemman, O., Kirschner, M. W. & Gygi, S. P. Absolute quantification of proteins and phosphoproteins from cell lysates by tandem MS. P Natl Acad Sci USA100, 6940-6945 (2003).
138. Pratt, J. M. et al. Multiplexed absolute quantification for proteomics using concatenated signature peptides encoded by QconCAT genes. Nat Protoc 1, 1029-1043 (2006).
139. Silva, J. C., Gorenstein, M. V., Li, G. Z., Vissers, J. P. & Geromanos, S. J. Absolute quantification of proteins by LCMSE: a virtue of parallel MS acquisition. Mol Cell Proteomics 5, 144-156 (2006).
140. Bard, J. B. & Rhee, S. Y. Ontologies in biology: design, applications and future challenges. Nat Rev Genet 5, 213-222 (2004).
141. Ashburner, M. et al. Gene ontology: tool for the unification of biology. The Gene Ontology Consortium. Nat Genet 25, 25-29 (2000).
142. Smith, B. et al. The OBO Foundry: coordinated evolution of ontologies to support biomedical data integration. Nat Biotechnol 25, 1251-1255 (2007).
143. Osborne, J. et al. Annotating the human genome with Disease Ontology. BMC Genomics 10, S6 (2009).
144. Schriml, L. M. et al. Disease Ontology: a backbone for disease semantic integration. Nucleic Acids Res 40, D940-D946 (2012).
145. Smith, C. L., Goldsmith, C. & Eppig, J. T. The Mammalian Phenotype Ontology as a tool for annotating, analyzing and comparing phenotypic information. Genome Biol. 6, R7 (2005).
146. Gkoutos, G., Green, E., Mallon, A., Hancock, J. & Davidson, D. Building mouse phenotype ontologies Proceedings of the 9th Pacific Symposium on Biocomputing (PSB 2004), Hawaii, USA, Jan 6 Ser. 10, 2003.
147. Carbon, S. et al. AmiGO: online access to ontology and annotation data. Bioinformatics 25, 288-289 (2009).
148. Dennis Jr, G. et al. DAVID: database for annotation, visualization, and integrated discovery. Genome Biol 4, P3 (2003).
149. www.ingenuity.com.
150. Gehlenborg, N. et al. Visualization of omics data for systems biology. Nat Methods 7, S56-S68 (2010).
151. Shannon, P. et al. Cytoscape: a software environment for integrated models of biomolecular interaction networks. Genome Res. 13, 2498-2504 (2003).
152. Mischak, H. et al. Implementation of proteomic biomarkers: making it work. Eur J Clin Invest 42, 1027-1036 (2012).
63
153. Rifai, N., Gillette, M. A. & Carr, S. A. Protein biomarker discovery and validation: the long and uncertain path to clinical utility. Nat Biotechnol 24, 971-983 (2006).
154. http://www.ncbi.nlm.nih.gov/gtr/.
155. Denkert, C. et al. Metabolomics of human breast cancer: new approaches for tumor typing and biomarker discovery. Genome Med 4, 37-37 (2012).
156. Clague, A. & Thomas, A. Neonatal biochemical screening for disease. Clin Chim Acta 315, 99-110 (2002).
157. Anderson, N. L. The clinical plasma proteome: a survey of clinical assays for proteins in plasma and serum. Clin Chem 56, 177-185 (2010).
158. Etzioni, R. et al. Overdiagnosis due to prostate-specific antigen screening: lessons from US prostate cancer incidence trends. J Natl Cancer Inst 94, 981-990 (2002).
159. Bell, R., Petticrew, M. & Sheldon, T. The performance of screening tests for ovarian cancer: results of a systematic review. BJOG-Int J Obstet Gyn 105, 1136-1147 (1998).
160. Khleif, S. N., Doroshow, J. H. & Hait, W. N. AACR-FDA-NCI Cancer Biomarkers Collaborative consensus report: advancing the use of biomarkers in cancer drug development. Clin Cancer Res 16, 3299-3318 (2010).
161. Etzioni, R. et al. The case for early detection. Nat Rev Cancer 3, 243-252 (2003).
162. Havrilesky, L. J. et al. Evaluation of biomarker panels for early stage ovarian cancer detection and monitoring for disease recurrence. Gynecol Oncol 110, 374-382 (2008).
163. Maier, S., Dahlstroem, C., Haefliger, C., Plum, A. & Piepenbrock, C. Identifying DNA methylation biomarkers of cancer drug response. Am J Pharmacogenomic 5, 223-232 (2005).
164. Gutman, S. & Kessler, L. G. The US Food and Drug Administration perspective on cancer biomarker development. Nat Rev Cancer 6, 565-571 (2006).
165. Rosty, C. et al. Identification of hepatocarcinoma-intestine-pancreas/pancreatitis-associated protein I as a biomarker for pancreatic ductal adenocarcinoma by protein biochip technology. Cancer Res 62, 1868-1875 (2002).
166. Celis, J. E. et al. Proteomic Characterization of the Interstitial Fluid Perfusing the Breast Tumor Microenvironment A Novel Resource for Biomarker and Therapeutic Target Discovery. Mol Cell Proteomics 3, 327-344 (2004).
167. Hawkridge, A. M. & Muddiman, D. C. mass spectrometry–based biomarker discovery: toward a global proteome index of individuality. Annu Rev Anal Chemistry (Palo Alto, Calif.) 2, 265 (2009).
168. Everley, P. A., Krijgsveld, J., Zetter, B. R. & Gygi, S. P. Quantitative cancer proteomics: stable isotope labeling with amino acids in cell culture (SILAC) as a tool for prostate cancer research. Mol Cell Proteomics 3, 729-735 (2004).
169. Kashyap, M. K. et al. SILAC-based quantitative proteomic approach to identify potential biomarkers from the esophageal squamous cell carcinoma secretome. Cancer Biol Ther 10, 796-810 (2010).
64
170. Geiger, T., Madden, S. F., Gallagher, W. M., Cox, J. & Mann, M. Proteomic portrait of human breast cancer progression identifies novel prognostic markers. Cancer Res 72, 2428-2439 (2012).
171. Kang, X. et al. Serum protein biomarkers screening in HCC patients with liver cirrhosis by ICAT-LC-MSMS. J Cancer Res Clin 136, 1151-1159 (2010).
172. Chen, Y. et al. Discovery of novel bladder cancer biomarkers by comparative urine proteomics using iTRAQ technology. J Proteome Res 9, 5803-5815 (2010).
173. Ralhan, R. et al. Discovery and verification of head-and-neck cancer biomarkers by differential protein expression analysis using iTRAQ labeling, multidimensional liquid chromatography, and tandem mass spectrometry. Mol Cell Proteomics 7, 1162-1173 (2008).
174. Lehnert, S. et al. iTRAQ and multiple reaction monitoring as proteomic tools for biomarker search in cerebrospinal fluid of patients with Parkinson's disease dementia. Exp Neurol 234, 499-505 (2012).
175. Kolla, V. et al. Quantitative Proteomic (iTRAQ) Analysis of 1st Trimester Maternal Plasma Samples in Pregnancies at Risk for Preeclampsia. J Biomed Biotechnol 2012 (2012).
176. Rao, P. V. et al. Proteomic identification of salivary biomarkers of type-2 diabetes. J Proteome Res 8, 239-245 (2009).
177. Manwaring, V. et al. The identification of new biomarkers for identifying and monitoring kidney disease and their translation into a rapid mass spectrometry-based test: Evidence of presymptomatic kidney disease in paediatric Fabry and Type-I diabetic patients. J Proteome Res (2013).
178. Pizzatti, L. et al. Label‐free MSE proteomic analysis of chronic myeloid leukemia bone marrow plasma: disclosing new insights from therapy resistance. Proteomics 12, 2618-2631 (2012).
179. Pieragostino, D. et al. Shotgun proteomics reveals specific modulated protein patterns in tears of patients with primary open angle glaucoma naïve to therapy. Mol BioSyst 9, 1108-1116 (2013).
180. Chen, J., Yan, G., Wang, F., Yin, X. & Jin, H. Quantitative Profiling of Histone H3 Methylation in Human Hepatocellular Carcinoma. J Proteomics Bioinform 2, 2 (2013).
181. Suzuki, J. et al. Protein acetylation and histone deacetylase expression associated with malignant breast cancer progression. Clin Cancer Res 15, 3163-3171 (2009).
182. Oyama, M. et al. Integrated quantitative analysis of the phosphoproteome and transcriptome in tamoxifen-resistant breast cancer. J Biol Chem 286, 818-829 (2011).
183. Manes, N. P. et al. Discovery of mouse spleen signaling responses to anthrax using label-free quantitative phosphoproteomics via mass spectrometry. Mol Cell Proteomics 10 (2011).
184. Reis, C. A., Osorio, H., Silva, L., Gomes, C. & David, L. Alterations in glycosylation as biomarkers for cancer detection. J Clin Pathol 63, 322-329 (2010).
185. Hakomori, S. Glycosylation defining cancer malignancy: new wine in an old bottle. P Natl Acad Sci USA 99, 10231-10233 (2002).

65
186. Kuzmanov, U., Jiang, N., Smith, C. R., Soosaipillai, A. & Diamandis, E. P. Differential N-glycosylation of kallikrein 6 derived from ovarian cancer cells or the central nervous system. Mol Cell Proteomics 8, 791-798 (2009).
187. Boersema, P. J., Geiger, T., Wiśniewski, J. R. & Mann, M. Quantification of the N-glycosylated secretome by super-SILAC during breast cancer progression and in human blood samples. Mol Cell Proteomics 12, 158-171 (2013).
188. Vidal, M., Cusick, M. E. & Barabasi, A. Interactome networks and human disease. Cell 144, 986-998 (2011).
189. Gautier, V. et al. In vitro nuclear interactome of the HIV-1 Tat protein. Retrovirology 6, 47 (2009).
190. Jäger, S. et al. Global landscape of HIV-human protein complexes. Nature 481, 365-370 (2011).
191. Croce, C. M. Oncogenes and cancer. New Engl J Med 358, 502-511 (2008).
192. Farooq, M., Hozzein, W. N., Elsayed, E. A., Taha, N. A. & Wadaan, M. A. Identification of Histone Deacetylase 1 Protein Complexes in Liver Cancer Cells. Asian Pac J Cancer P 14, 915-921 (2013).
193. Song, J., Hao, Y., Du, Z., Wang, Z. & Ewing, R. M. Identifying Novel Protein Complexes in Cancer Cells Using Epitope-Tagging of Endogenous Human Genes and Affinity-Purification Mass Spectrometry. J Proteome Res 11, 5630-5641 (2012).
194. Craig, R. & Beavis, R. C. TANDEM: matching proteins with tandem mass spectra. Bioinformatics 20, 1466-1467 (2004).
195. Craig, R. & Beavis, R. C. A method for reducing the time required to match protein sequences with tandem mass spectra. Rapid Commun Mass Sp 17, 2310-2316 (2003).
196. Omenn, G. S. Overview of the HUPO Plasma Proteome Project: Results from the pilot phase with 35 collaborating laboratories and multiple analytical groups, generating a core dataset of 3020 proteins and a publicly‐available database. Proteomics 5, 3226-3245 (2005).
197. Wu, J. et al. Integrated network analysis platform for protein-protein interactions. Nat Methods 6, 75-77 (2008).
198. Cowley, M. J. et al. PINA v2. 0: mining interactome modules. Nucleic Acids Res 40, D862-D865 (2012).
199. Eng, J. K., Searle, B. C., Clauser, K. R. & Tabb, D. L. A face in the crowd: recognizing peptides through database search. Mol Cell Proteomics 10 (2011).
200. Searle, B. C., Turner, M. & Nesvizhskii, A. I. Improving sensitivity by probabilistically combining results from multiple MSMS search methodologies. J Proteome Res 7, 245-253 (2008).
201. Resing, K. A. et al. Improving reproducibility and sensitivity in identifying human proteins by shotgun proteomics. Anal Chem 76, 3556-3568 (2004).
202. Sneddon, J. B. et al. Bone morphogenetic protein antagonist gremlin 1 is widely expressed by cancer-associated stromal cells and can promote tumor cell proliferation. P Natl Acad Sci USA103, 14842-14847 (2006).
66
203. Namkoong, H. et al. The bone morphogenetic protein antagonist gremlin 1 is overexpressed in human cancers and interacts with YWHAH protein. BMC Cancer 6, 74 (2006).
204. Sengle, G. et al. Targeting of bone morphogenetic protein growth factor complexes to fibrillin. J Biol Chem 283, 13874-13888 (2008).
205. Ramirez, F. & Rifkin, D. B. Extracellular microfibrils: contextual platforms for TGFβ and BMP signaling. Curr Opin Cell Biol 21, 616-622 (2009).
206. Hsu, D. R., Economides, A. N., Wang, X., Eimon, P. M. & Harland, R. M. The Xenopus Dorsalizing Factor Gremlin Identifies a Novel Family of Secreted Proteins that Antagonize BMP Activities. Mol Cell 1, 673-683 (1998).
207. Topol, L. Z. et al. Biosynthesis, post-translation modification, and functional characterization of Drm/Gremlin. J Biol Chem 275, 8785-8793 (2000).
208. Shigekiyo, T. et al. Histidine-rich glycoprotein (HRG) Tokushima 2: novel HRG deficiency, molecular and cellular characterization. Thromb Haemostasis 84, 675-679 (2000).
209. Schwarzenbacher, R. et al. Crystal structure of human β2-glycoprotein I: implications for phospholipid binding and the antiphospholipid syndrome. EMBO J 18, 6228-6239 (1999).
210. Mahley, R. W. Apolipoprotein E: cholesterol transport protein with expanding role in cell biology. Science 240, 622 (1988).
211. Piņeiro, M. et al. ITIH4 serum concentration increases during acute-phase processes in human patients and is up-regulated by interleukin-6 in hepatocarcinoma HepG2 cells. Biochem Bioph. Res Co 263, 224-229 (1999).
212. Hochepied, T., Berger, F. G., Baumann, H. & Libert, C. [alpha] 1-Acid glycoprotein: an acute phase protein with inflammatory and immunomodulating properties. Cytokine Growth F R 14, 25-34 (2003).
213. Fournier, T., Medjoubi-N, N. & Porquet, D. Alpha-1-acid glycoprotein. BBA-Protein Struct M 1482, 157-171 (2000).
214. Kashyap, R. S. et al. Inter-α-trypsin inhibitor heavy chain 4 is a novel marker of acute ischemic stroke. Clin Chim Acta 402, 160-163 (2009).
215. Sottrup-Jensen, L. et al. Primary structure of the 'bait' region for proteinases in alpha 2-macroglobulin. Nature of the complex. FEBS Lett 127, 167-173 (1981).
216. Ow, S. Y., Salim, M., Noirel, J., Evans, C. & Wright, P. C. Minimising iTRAQ ratio compression through understanding LC-MS elution dependence and high-resolution HILIC fractionation. Proteomics 11, 2341-2346 (2011).
217. Wang, Z., Sun, Z., Li, A. V. & Yarema, K. J. Roles for UDP-GlcNAc 2-epimerase/ManNAc 6-kinase outside of sialic acid biosynthesis: modulation of sialyltransferase and BiP expression, GM3 and GD3 biosynthesis, proliferation, and apoptosis, and ERK1/2 phosphorylation. J Biol Chem 281, 27016-27028 (2006).
218. Gu, X. & Wang, D. I. Improvement of interferon-g sialylation in Chinese hamster ovary cell culture by feeding of N-acetylmannosamine. Biotechnol Bioeng 58, 642-648 (1998).
67
219. Michalski, A., Cox, J. & Mann, M. More than 100,000 detectable peptide species elute in single shotgun proteomics runs but the majority is inaccessible to data-dependent LC− MSMS. J Proteome Res 10, 1785-1793 (2011).
220. Liu, H., Sadygov, R. G. & Yates, J. R. A model for random sampling and estimation of relative protein abundance in shotgun proteomics. Anal Chem 76, 4193-4201 (2004).
221. Hashimoto, H., Sakakibara, A., Yamasaki, M. & Yoda, K. Saccharomyces cerevisiae VIG9 encodes GDP-mannose pyrophosphorylase, which is essential for protein glycosylation. J Biol Chem 272, 16308-16314 (1997).
222. Yoda, K. et al. Defect in cell wall integrity of the yeast Saccharomyces cerevisiae caused by a mutation of the GDP-mannose pyrophosphorylase gene VIG9. Biosci Biotechnol Biochem 64, 1937-1941 (2000).
223. Behnia, R. & Munro, S. Organelle identity and the signposts for membrane traffic. Nature 438, 597-604 (2005).
224. Grosshans, B. L., Ortiz, D. & Novick, P. Rabs and their effectors: achieving specificity in membrane traffic. P Natl Acad Sci USA103, 11821-11827 (2006).
225. Liwosz, A., Lei, T. & Kukuruzinska, M. A. N-glycosylation affects the molecular organization and stability of E-cadherin junctions. J Biol Chem 281, 23138-23149 (2006).
226. Vagin, O., Tokhtaeva, E., Yakubov, I., Shevchenko, E. & Sachs, G. Inverse correlation between the extent of N-glycan branching and intercellular adhesion in epithelia. J Biol Chem 283, 2192-2202 (2008).
227. Lau, K. S. et al. Complex N-glycan number and degree of branching cooperate to regulate cell proliferation and differentiation. Cell 129, 123-134 (2007).
228. Almaraz, R. T. et al. Metabolic flux increases glycoprotein sialylation: implications for cell adhesion and cancer metastasis. Mol Cell Proteomics 11, M112.017558 (2012).