Maryland’s GHG Inventory
23
Maryland’s GHG Inventory Methane Maryland Commission on Climate Change Mitigation Working Group February 24, 2017
Transcript of Maryland’s GHG Inventory

Maryland’s GHG Inventory Methane
Maryland Commission on Climate Change
Mitigation Working Group
February 24, 2017
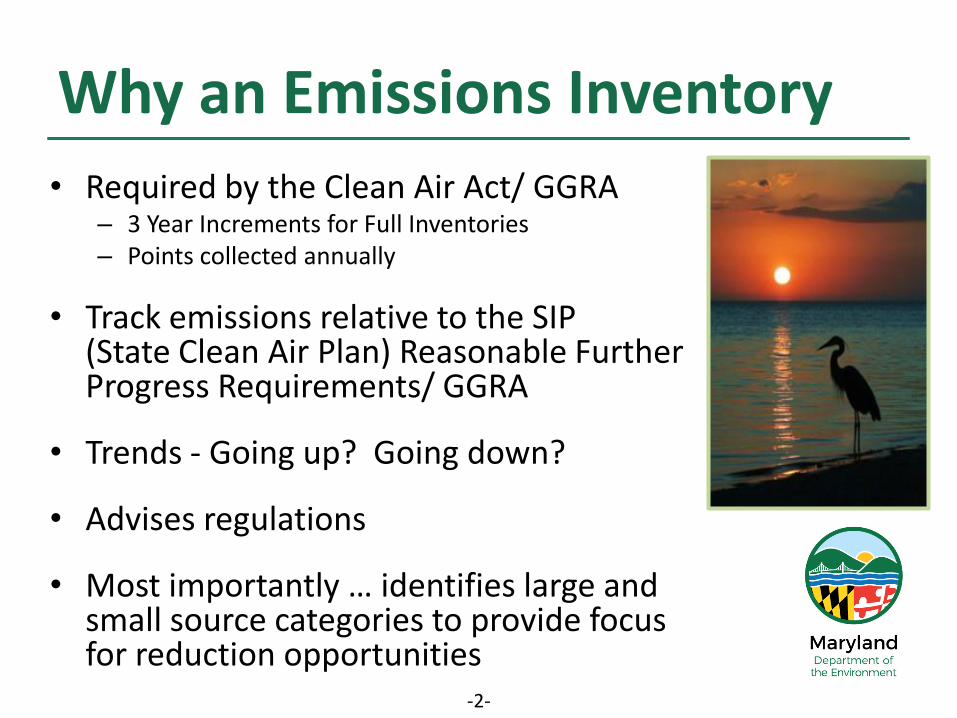
Why an Emissions Inventory
• Required by the Clean Air Act/ GGRA – 3 Year Increments for Full Inventories – Points collected annually
• Track emissions relative to the SIP (State Clean Air Plan) Reasonable Further Progress Requirements/ GGRA
• Trends - Going up? Going down?
• Advises regulations
• Most importantly … identifies large and small source categories to provide focus for reduction opportunities
-2-

• Point (Major) Sources – EGUs, Cement Plants, Incinerators
• Stationary Area Sources – Paint, Consumer Products, Residential Fuel Combustion
• On-road Mobile Sources
• Non-road Mobile Sources – Lawn & Garden, Construction Equipment
• Marine-Air-Rail Sources
• Biogenic Sources
Source Categories Criteria Pollutants
-3-

• Electricity Use (Consumption)
• Residential, Commercial, Industrial Fuel Use
• On-road Mobile Sources
• Non-road Mobile Sources – Lawn & Garden, Construction Equipment, Marine, Air, Rail
• Fossil Fuel Production, Industrial Processes, Agriculture, Waste Management, Etc.
• Sinks
Source Categories GHG Emissions
-4-

How are Criteria Emissions Estimated? Based upon the very best data available
Perfect … No
Very Good … Yes
Estimation/Calculation process varies from one source to another Point Sources – from MDE Registration Files
– Continuous Monitors (CEMs), Stack Tests, Mass Balance, EF
Area – Activity level × an emissions factor
– Surrogates used to estimate emissions
Non-road – M-A-R
– Marine Vessels: Data from Baltimore Maritime Exchange & EPA
– Railroads: Data directly from railways
– Airports: Survey of Airport Data (LTOs)
Non-road Model – EPA’s latest version
On-road – Mobile model called “MOVES”
Biogenic – EPA model (BEIS)
-5-
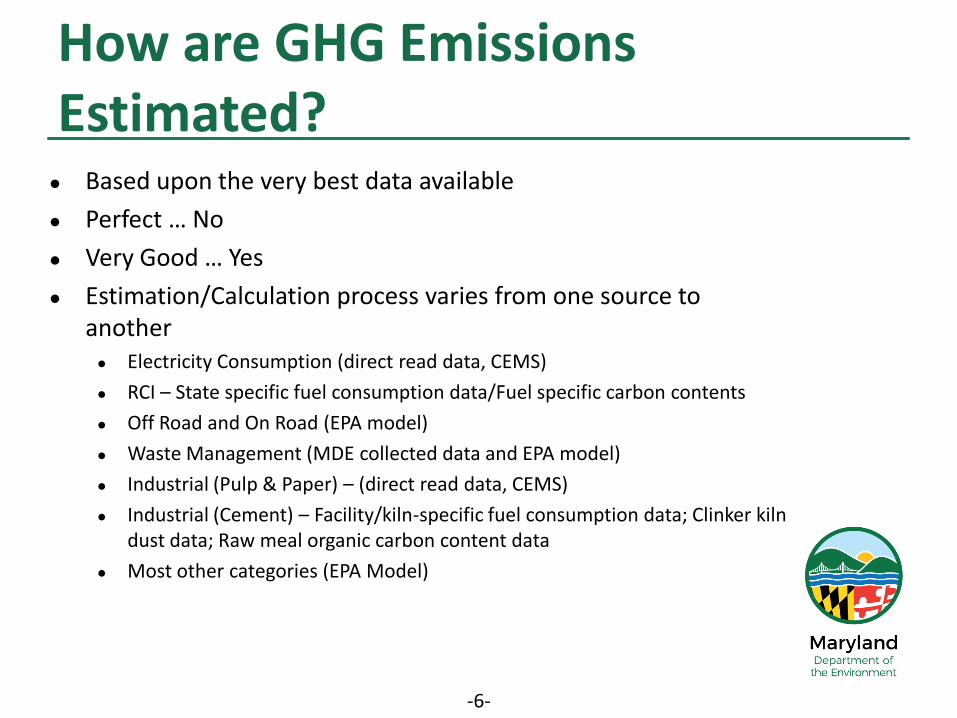
How are GHG Emissions Estimated? Based upon the very best data available
Perfect … No
Very Good … Yes
Estimation/Calculation process varies from one source to another Electricity Consumption (direct read data, CEMS)
RCI – State specific fuel consumption data/Fuel specific carbon contents
Off Road and On Road (EPA model)
Waste Management (MDE collected data and EPA model)
Industrial (Pulp & Paper) – (direct read data, CEMS)
Industrial (Cement) – Facility/kiln-specific fuel consumption data; Clinker kiln dust data; Raw meal organic carbon content data
Most other categories (EPA Model)
-6-

Maryland’s GHG Inventory
• The Greenhouse Gas Reduction Act (GGRA) requires MDE to report on the statewide greenhouse gas inventory every three years – Most recent update released based on 2014 data
– Next update will be based on 2017 data
• 2014 Inventory covers six types of GHGs, including methane
• Emissions were estimated bottom-up using generally accepted principles and guidelines – Maryland specific data to the extent possible
• Equivalent CO2 (CO2e) was calculated using global warming potentials (GWP) from the IPCC 2nd Assessment Report
Overview
-7-
Greenhouse Gas GWP
Carbon Dioxide (CO2) 1
Methane (CH4) 21
Nitrous Oxide (N2O) 310

Maryland’s GHG Inventory Data Sources
-8-
• Mobile source emissions (both on-road and non-road) are generated using a well-accepted EPA model with inputs from data sets maintained by SHA, MDE, MVA and EIA
• Emissions from the majority of point sources are directly measured
• Non-point source calculations utilize state-specific consumption data, fuel-specific carbon content coefficients and EPA established emissions factors and methodology
Alexandra Fries, IAN UMCES (ian.umces.edu/imagelibrary/)

Maryland’s GHG Inventory Results
CO2 91%
HFC, PFC, SF6 4%
CH4 3%
N2O 2% 2014 Emissions (MMtCO2e)
-9-

Maryland’s GHG Inventory
-10-
High level of confidence on over 90% of the inventory
CO2 emissions from MD EGUs were compiled from
CEMS/Emissions Certification Reports and cross-
checked against two other reporting programs 21.5%
PJM provides both the fuel mix information and CO2
emission rates for each fuel type to determine
emissions from imported electricity 17.1%
EPA’s well-accepted MOVES model was used to
estimate on-road mobile emissions as well as most
off-road mobile emissions 34.6%
R/C/I Fuel Use emissions estimates were calculated
using MD specific fuel consumption data and carbon
content coefficients specific to each fuel 17.1%

Methane (CH4)
• Second most prevalent greenhouse gas emitted in the U.S. by human activities
EPA estimated 11% of national emissions in 2014
MDE estimated 3% of state emissions in 2014
• Shorter atmospheric lifetime than carbon dioxide (CO2)
Approximately 12 years
• Higher global warming potential than CO2
– Approximately 28 times more effective than CO2 at trapping heat in the atmosphere over 100 years
– Approximately 84 times more effective over 20 years
Image: EDF
-11-
The Basics

Maryland’s GHG Inventory
• Leakage and venting of CH4 from oil and gas fields, processing facilities, and natural gas pipelines
• Fugitive CH4 emissions released during coal mining
Methane Sources
Jonathan Kellogg, IAN UMCES (ian.umces.edu/imagelibrary/)
• Non-energy CH4 from enteric fermentation, manure management, and agricultural soils
• CH4 emissions from solid waste management in municipal and industrial landfills (including flared, captured for energy, and from municipal solid waste incinerators)
• CH4 emissions from wastewater management
• CH4 released during wildfires and prescribed forest burns -12-

Determination of Methane Emissions
Maryland’s GHG Inventory
Electricity Supply • Data: annual direct emissions from
Emissions Certification Reports submitted to MDE
Residential, Commercial, and Industrial (RCI) Fuel Combustion
• Data: statewide energy consumption • Calculations: default EPA’s SIT emission factors, based on fuel type
On-Road Mobile Energy Use • Local Data:
SHA: VMT, vehicle mixes and seasonal/hourly factors
MVA: vehicle population and age MDE: environmental and fuel data,
control strategies
• Calculations: Mobile 6.2, PPSUITE and MOVES modeling
Adrian Jones, IAN UMCES (ian.umces.edu/imagelibrary/)
Jane Thomas, IAN UMCES (ian.umces.edu/imagelibrary/)

-14-
Maryland’s GHG Inventory
Non-Road Mobile Energy Use • Data:
– Equipment population distributed by age, power, fuel type and application – Average load factor and available
horsepower – Activity in hours of use per year – Emission factors
• Calculations: MOVES-NONROAD modeling
• Data: EIA Maryland fossil fuel consumption information (railroads, aviation, and commercial marine vessels)
• Calculations: EPA standard emission factor by fuel type
Industrial Processes
• No raw material transformation and production processes analyzed emit CH4
Husqvarna
Determination of Methane Emissions

-15-
Maryland’s GHG Inventory
Fossil Fuel Production Industry
• Data:
– U.S. DOT (pipeline information)
– EIA (natural gas production information)
– U.S. DOI (surface mining information)
• Calculations: EPA’s SIT default emission factors and methods provided in the Emission Inventory Improvement Program (EIIP)
Agriculture
• Data: USDA Maryland data on animal populations, fertilizer consumption, crop production and dry matter burned
• Calculations: EPA’s SIT with reference to methods in the EIIP
UMCP dairy farm
Determination of Methane Emissions

-16-
Maryland’s GHG Inventory
Waste Management
• Solid Waste Data:
MSW Landfill-specific data and control device information from MDE programs
Annual waste emplacement data (including type of waste)
• Solid Waste Calculations:
Emissions based on landfill-specific technology efficiencies
EPA default surface oxidation factor
Industrial landfill emissions assumed to be 7% of municipal emissions
• Wastewater Data: state population
• Wastewater Calculations: default biochemical oxygen demand and emissions factors from EPA’s SIT
Alexandra Fries, IAN UMCES (ian.umces.edu/imagelibrary/)
Determination of Methane Emissions

Electricity Use
1.2%
RCI Fuel Use 4.9%
Mobile Sources
1.6%
Fossil Fuel Industry
29%
Agriculture 23%
Waste Management
38%
Forestry and Land Use
1.6%
Methane Breakdown (2014)
Methane Results
Maryland’s GHG Inventory
-17-
Methane 2.6%
Total GHGs 97.4%
All GHGs (2014)

Methane Results
2014 Emissions (MMt CO2e)
Sector Methane Total GHGs
Electricity Use 0.03 33.76
RCI Fuel Use 0.12 15.80
Mobile Sources 0.04 33.45
Industrial Processes 0.00 04.78
Fossil Fuel Industry 0.72 00.72
Agriculture 0.57 01.89
Waste Management 0.96 02.26
Forestry and Land Use 0.04 -11.65
Total Emissions 2.47 92.67
Maryland’s GHG Inventory
-18-
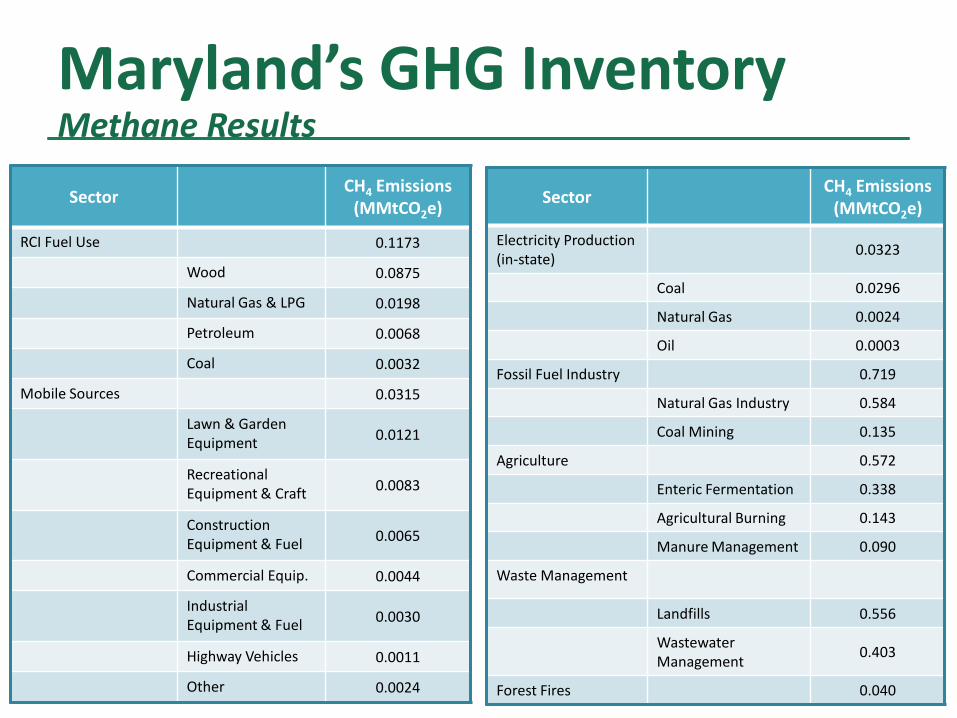
Sector CH4 Emissions
(MMtCO2e)
RCI Fuel Use 0.1173
Wood 0.0875
Natural Gas & LPG 0.0198
Petroleum 0.0068
Coal 0.0032
Mobile Sources 0.0315
Lawn & Garden Equipment
0.0121
Recreational Equipment & Craft
0.0083
Construction Equipment & Fuel
0.0065
Commercial Equip. 0.0044
Industrial Equipment & Fuel
0.0030
Highway Vehicles 0.0011
Other 0.0024
Sector CH4 Emissions
(MMtCO2e)
Electricity Production (in-state)
0.0323
Coal 0.0296
Natural Gas 0.0024
Oil 0.0003
Fossil Fuel Industry 0.719
Natural Gas Industry 0.584
Coal Mining 0.135
Agriculture 0.572
Enteric Fermentation 0.338
Agricultural Burning 0.143
Manure Management 0.090
Waste Management
Landfills 0.556
Wastewater Management
0.403
Forest Fires 0.040
Methane Results
Maryland’s GHG Inventory

Reducing Maryland’s Methane
• MDE conducted research on both current and anticipated future emissions, to prioritize three source categories for initial action: – Landfills
– Compressor Stations
– Wastewater Treatment Plants
• EPA has a number of voluntary programs and regulatory initiatives to reduce methane emissions, including the Landfill Methane Outreach Program – Maryland already has 12 operational LFG energy projects
-20-

• In 2015, Maryland established a 2 year moratorium on fracking which remains in effect until October 2017
• MDE held three public meetings in June last year to solicit comments on draft regulations for oil and gas exploration and production
• Final regulations were proposed in October 2016
Methane leakage-related fracking requirements:
– Top-Down Best Available Control Technology (BACT) required for all emitting equipment and leaks
Includes comprehensive LDAR programs
– Methane offset requirement
– State sponsored air monitoring
– Compliance with State air toxics requirements
-21-
Updated regulations for hydraulic fracturing
Reducing Maryland’s Methane

• Early last year, Pennsylvania’s governor Tom Wolf announced a strategy to reduce methane emissions from the oil and natural gas industries, calling it “one of the essential steps needed to reduce global greenhouse gas emissions and reduce the impacts of climate change”.
• The plan includes four main strategies:
1. Revise the general permit for new pads to include BAT for equipment and processes, better record keeping, and quarterly inspections
2. Revise the general permit to update BAT requirements and apply more stringent LDAR for new compressor stations and processing facilities
3. Develop requirements for existing oil and NG facilities for the consideration of the Environmental Quality Board
4. Establish BMP for pipelines that include leak detection and repair programs
• In November, the governor entered into a partnership with EDF, Google, and Carnegie Mellon University to map methane leaks in Pittsburgh
Neighboring States Pennsylvania’s Initiative

Questions ?