Martins Abolins Economist
15
Baltic economic outlook Martins Abolins Economist September 2020
Transcript of Martins Abolins Economist
Baltic economic outlook
Martins Abolins
Economist
September 2020
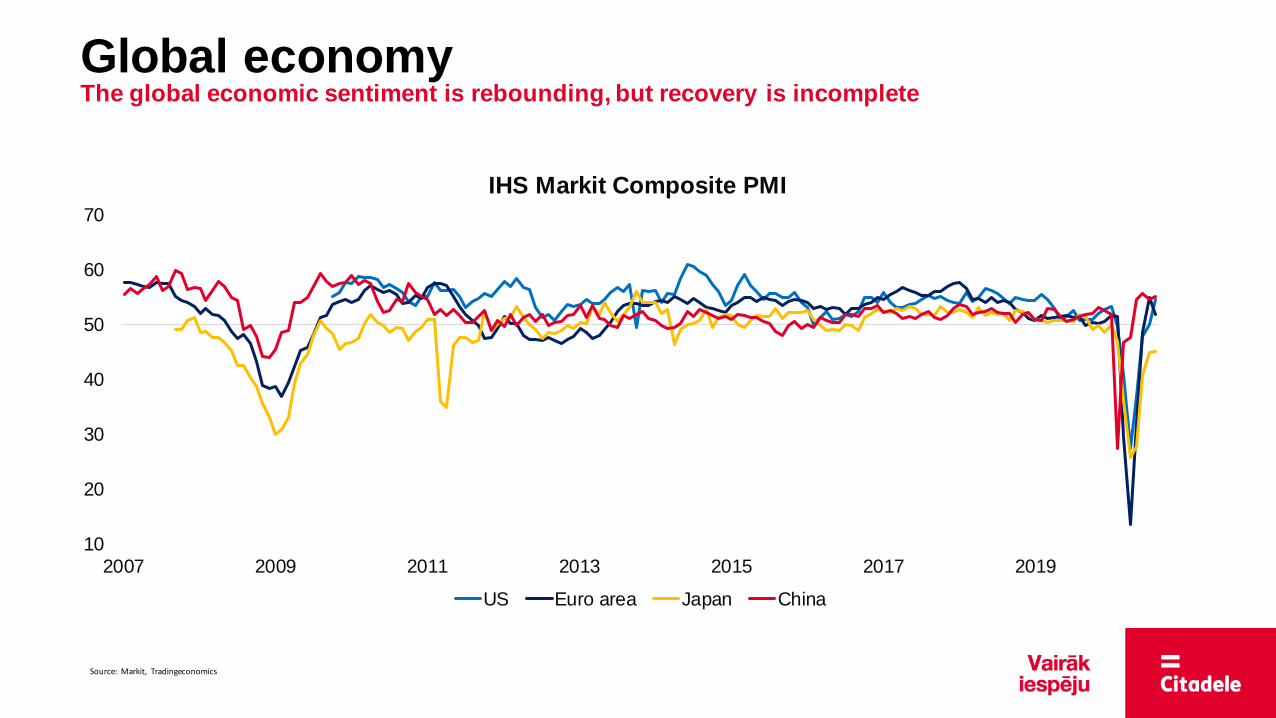
Global economy The global economic sentiment is rebounding, but recovery is incomplete
10
20
30
40
50
60
70
2007 2009 2011 2013 2015 2017 2019
IHS Markit Composite PMI
US Euro area Japan China
Source: Markit, Tradingeconomics
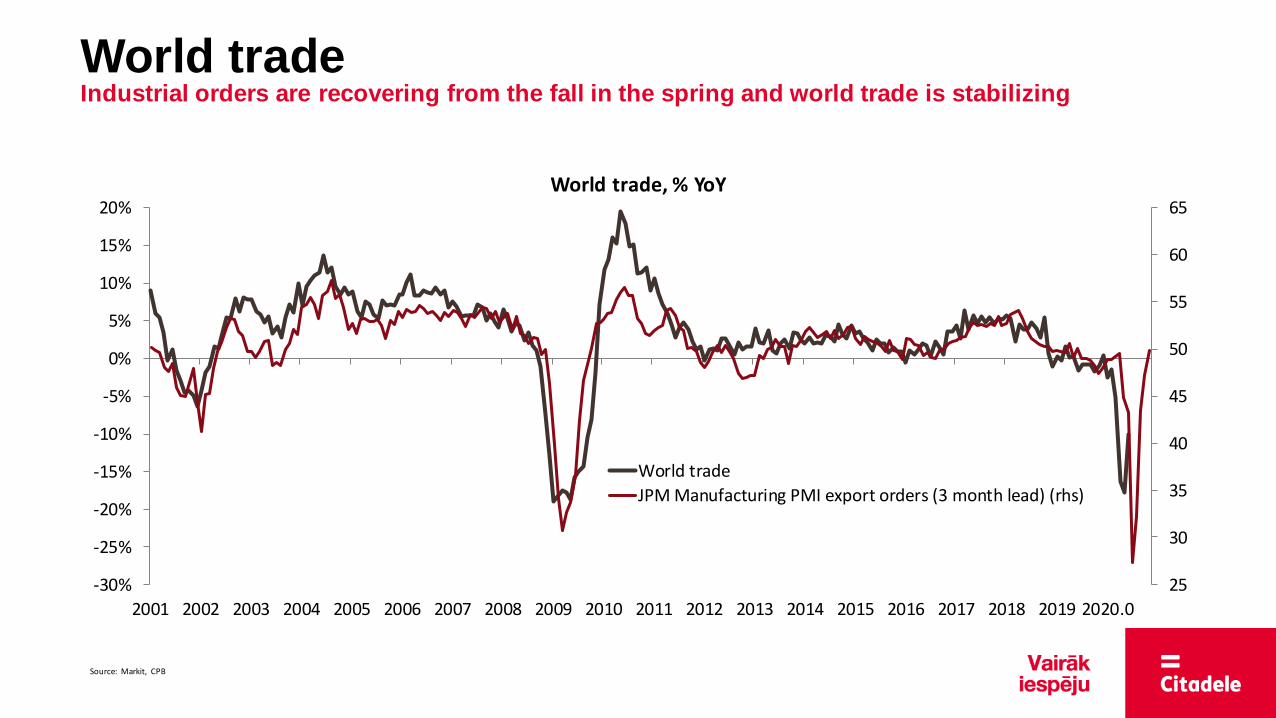
World trade Industrial orders are recovering from the fall in the spring and world trade is stabilizing
25
30
35
40
45
50
55
60
65
-30%
-25%
-20%
-15%
-10%
-5%
0%
5%
10%
15%
20%
2001 2002 2003 2004 2005 2006 2007 2008 2009 2010 2011 2012 2013 2014 2015 2016 2017 2018 2019 2020.0
World trade, % YoY
World trade
JPM Manufacturing PMI export orders (3 month lead) (rhs)
Source: Markit, CPB
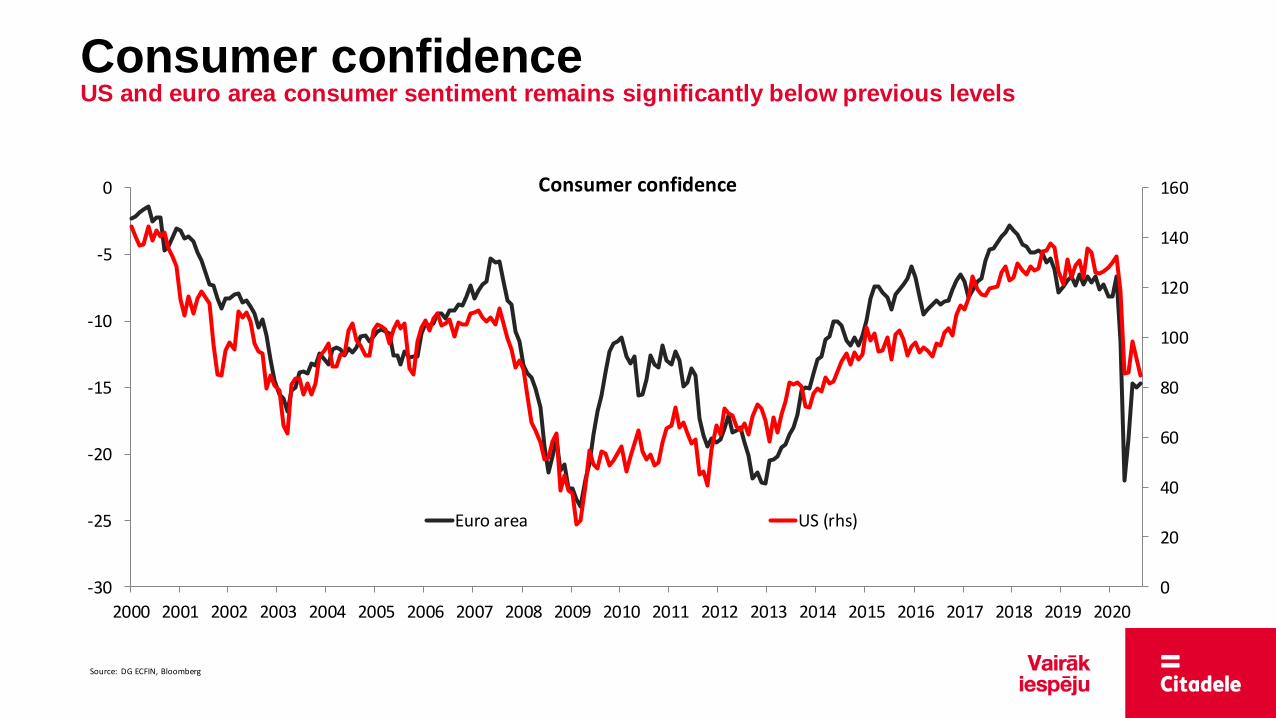
Consumer confidence US and euro area consumer sentiment remains significantly below previous levels
0
20
40
60
80
100
120
140
160
-30
-25
-20
-15
-10
-5
0
2000 2001 2002 2003 2004 2005 2006 2007 2008 2009 2010 2011 2012 2013 2014 2015 2016 2017 2018 2019 2020
Consumer confidence
Euro area US (rhs)
Source: DG ECFIN, Bloomberg
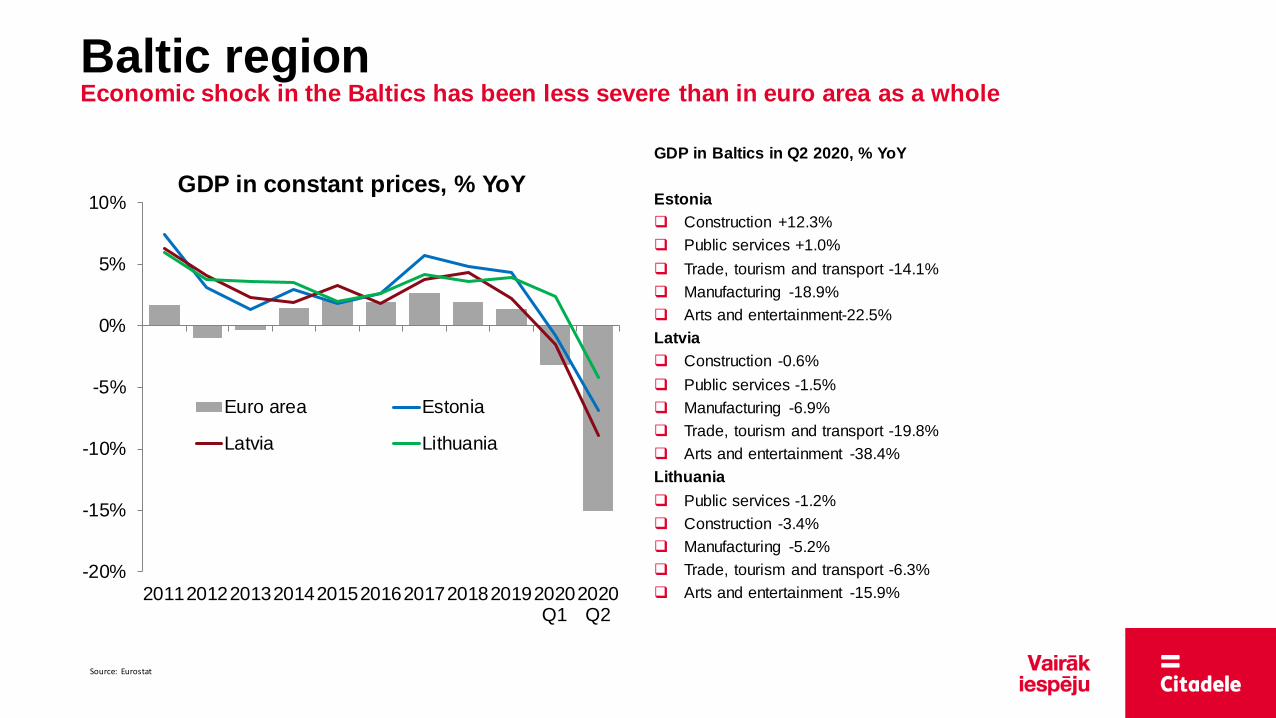
GDP in Baltics in Q2 2020, % YoY
Estonia
Construction +12.3%
Public services +1.0%
Trade, tourism and transport -14.1%
Manufacturing -18.9%
Arts and entertainment-22.5%
Latvia
Construction -0.6%
Public services -1.5%
Manufacturing -6.9%
Trade, tourism and transport -19.8%
Arts and entertainment -38.4%
Lithuania
Public services -1.2%
Construction -3.4%
Manufacturing -5.2%
Trade, tourism and transport -6.3%
Arts and entertainment -15.9%
-20%
-15%
-10%
-5%
0%
5%
10%
2011201220132014201520162017201820192020Q1
2020Q2
GDP in constant prices, % YoY
Euro area Estonia
Latvia Lithuania
Baltic region Economic shock in the Baltics has been less severe than in euro area as a whole
Source: Eurostat
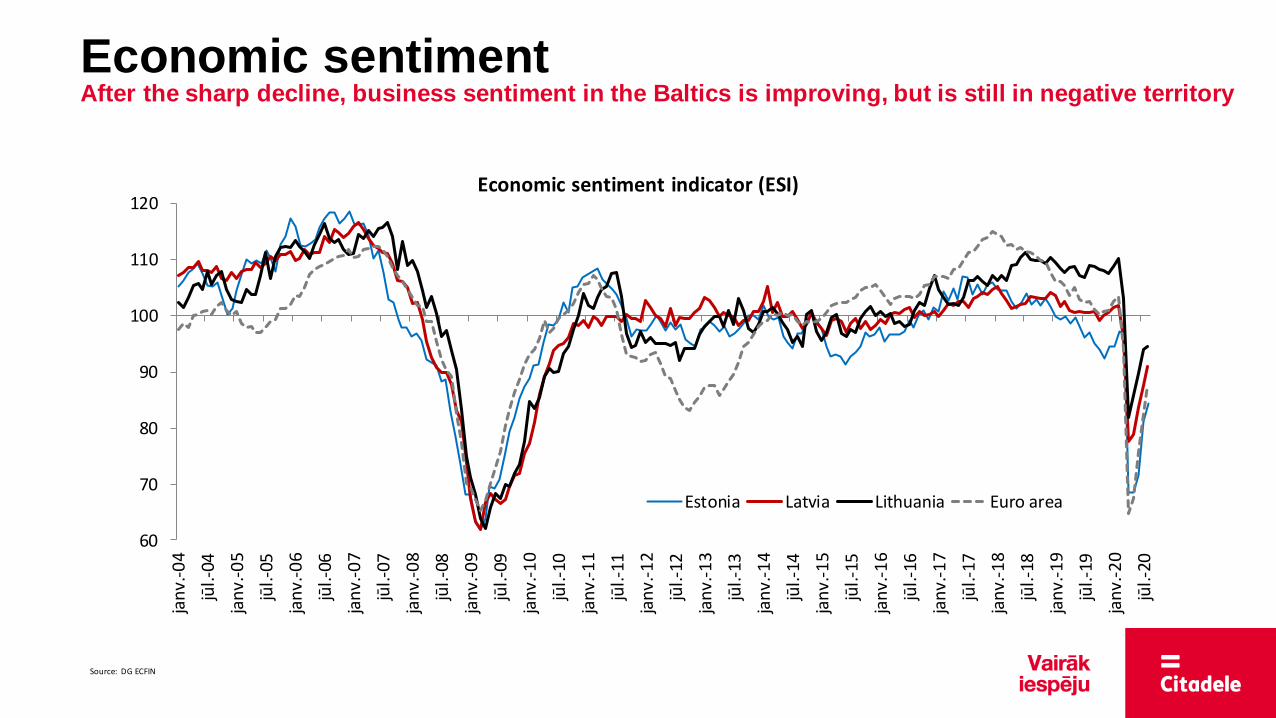
Economic sentiment After the sharp decline, business sentiment in the Baltics is improving, but is still in negative territory
60
70
80
90
100
110
120
jan
v.-0
4
jūl.-04
jan
v.-0
5
jūl.-05
jan
v.-0
6
jūl.-06
jan
v.-0
7
jūl.-07
jan
v.-0
8
jūl.-08
jan
v.-0
9
jūl.-09
jan
v.-1
0
jūl.-10
jan
v.-1
1
jūl.-11
jan
v.-1
2
jūl.-12
jan
v.-1
3
jūl.-13
jan
v.-1
4
jūl.-14
jan
v.-1
5
jūl.-15
jan
v.-1
6
jūl.-16
jan
v.-1
7
jūl.-17
jan
v.-1
8
jūl.-18
jan
v.-1
9
jūl.-19
jan
v.-2
0
jūl.-20
Economic sentiment indicator (ESI)
Estonia Latvia Lithuania Euro area
Source: DG ECFIN
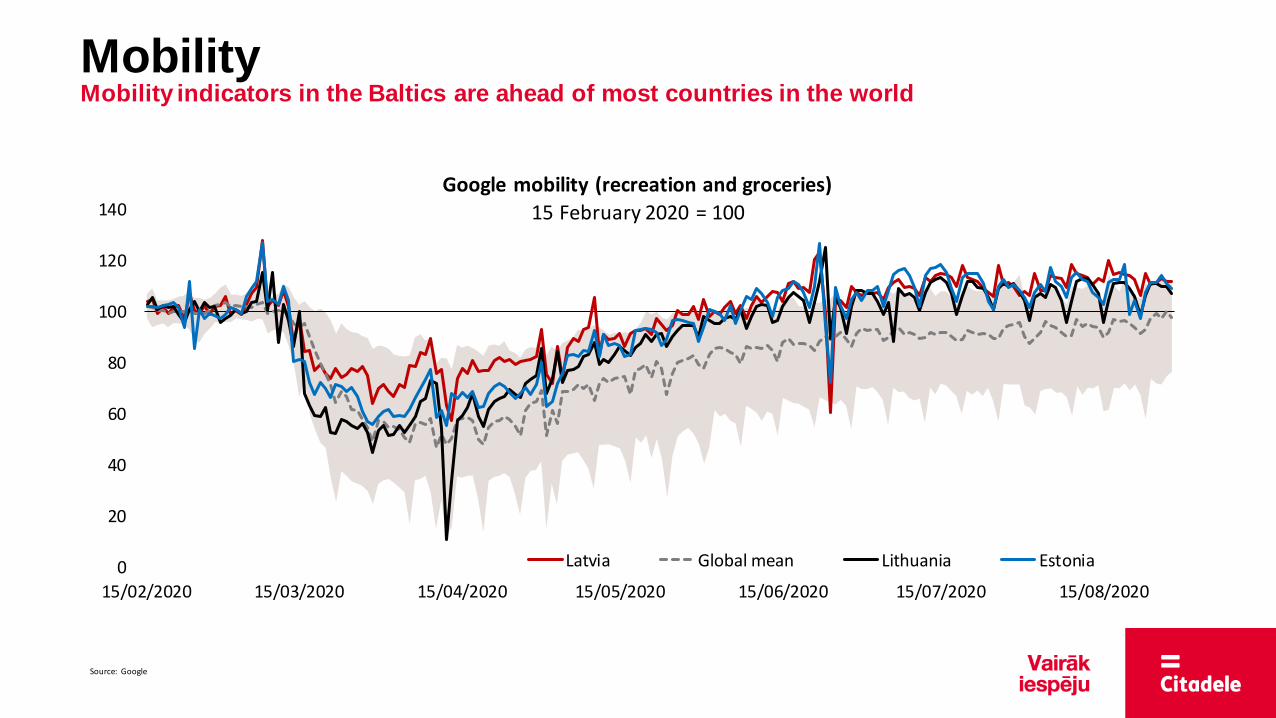
Mobility Mobility indicators in the Baltics are ahead of most countries in the world
0
20
40
60
80
100
120
140
15/02/2020 15/03/2020 15/04/2020 15/05/2020 15/06/2020 15/07/2020 15/08/2020
Google mobility (recreation and groceries)
15 February 2020 = 100
Latvia Global mean Lithuania Estonia
Source: Google
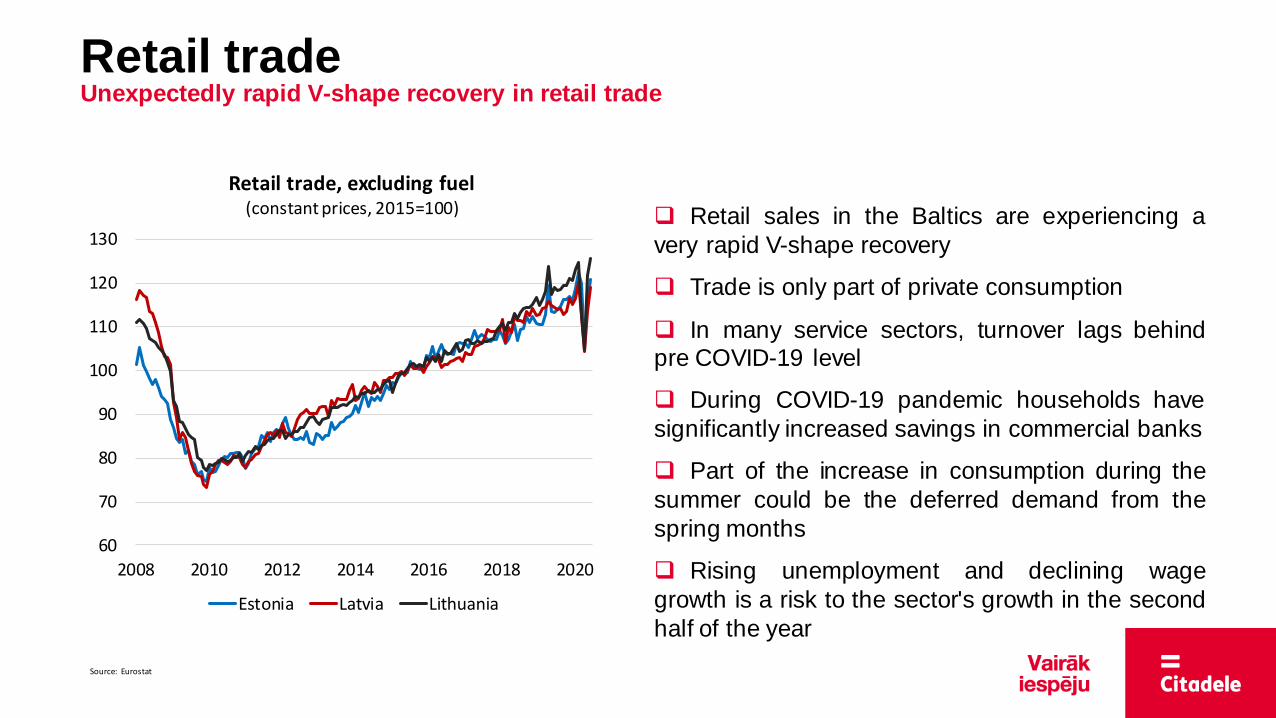
Retail trade Unexpectedly rapid V-shape recovery in retail trade
Retail sales in the Baltics are experiencing a
very rapid V-shape recovery
Trade is only part of private consumption
In many service sectors, turnover lags behind pre COVID-19 level
During COVID-19 pandemic households have
significantly increased savings in commercial banks
Part of the increase in consumption during the
summer could be the deferred demand from the
spring months
Rising unemployment and declining wage
growth is a risk to the sector's growth in the second
half of the year
60
70
80
90
100
110
120
130
2008 2010 2012 2014 2016 2018 2020
Retail trade, excluding fuel (constant prices, 2015=100)
Estonia Latvia Lithuania
Source: Eurostat
-10%
-5%
0%
5%
10%
15%
20%
2004 2006 2008 2010 2012 2014 2016 2018 2020
Inflation, % yoy
Estonia Latvia
Lithuania Euro area-60
-40
-20
0
20
40
60
80
100
2004 2006 2008 2010 2012 2014 2016 2018 2020
Inflation expectations over the next 12
months
Estonia Latvia
Lithuania Euro area
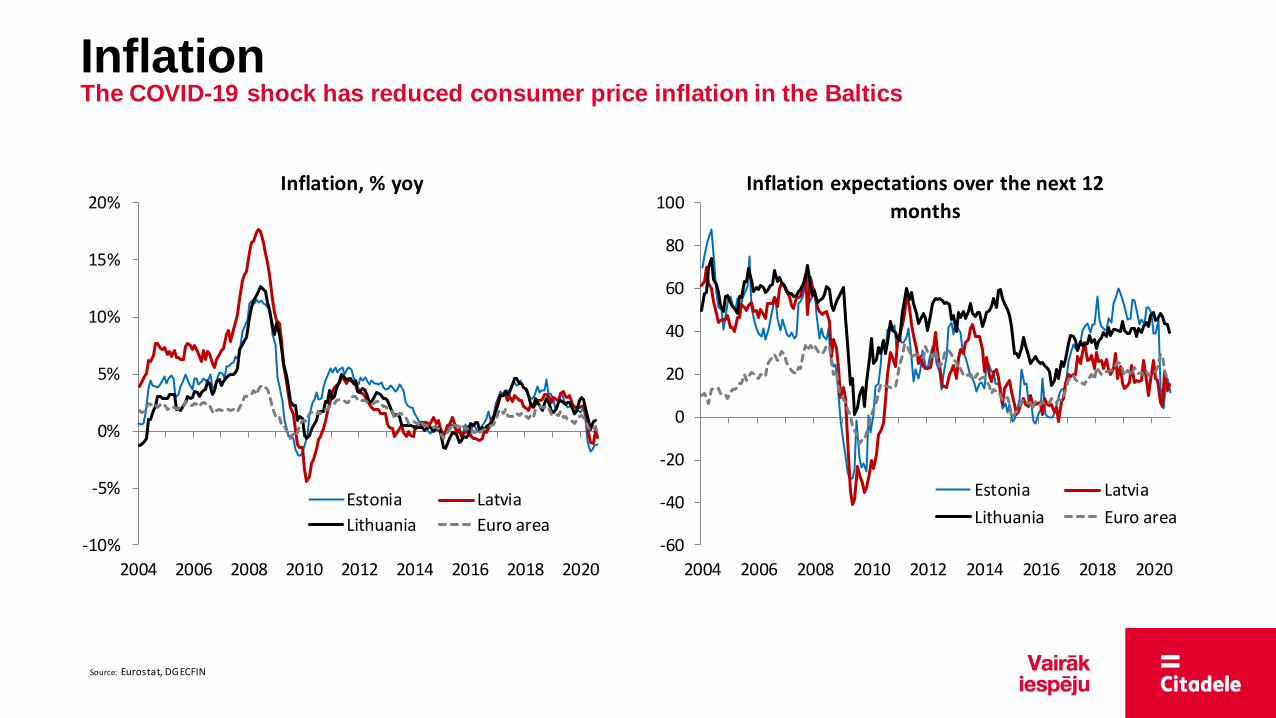
Inflation The COVID-19 shock has reduced consumer price inflation in the Baltics
Source: Eurostat, DG ECFIN
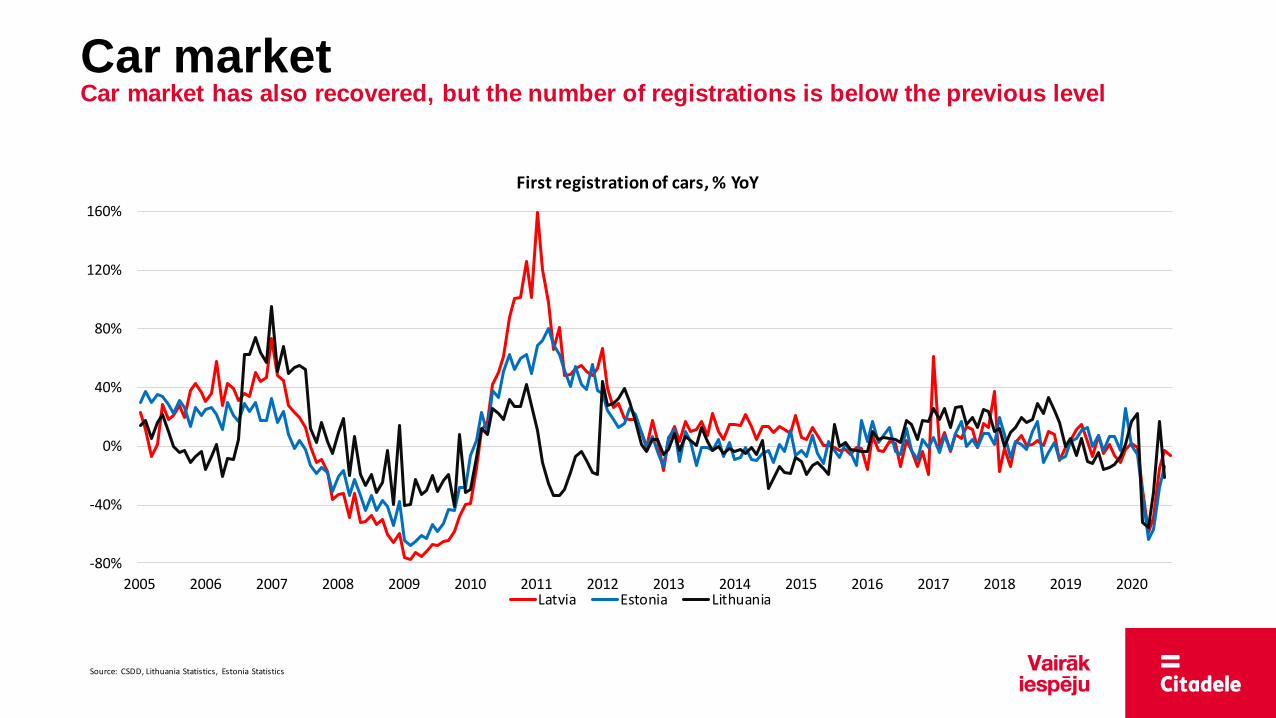
Car market Car market has also recovered, but the number of registrations is below the previous level
-80%
-40%
0%
40%
80%
120%
160%
2005 2006 2007 2008 2009 2010 2011 2012 2013 2014 2015 2016 2017 2018 2019 2020
First registration of cars, % YoY
Latvia Estonia Lithuania
Source: CSDD, Lithuania Statistics, Estonia Statistics
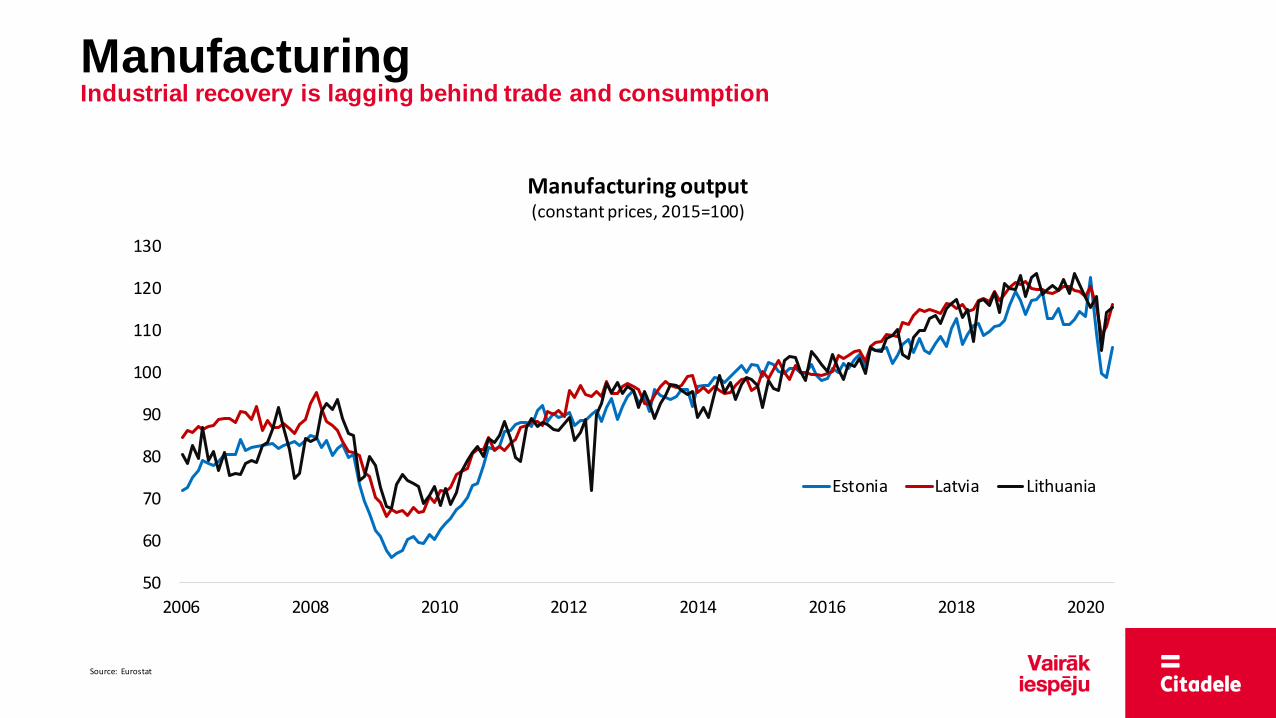
Manufacturing Industrial recovery is lagging behind trade and consumption
50
60
70
80
90
100
110
120
130
2006 2008 2010 2012 2014 2016 2018 2020
Manufacturing output (constant prices, 2015=100)
Estonia Latvia Lithuania
Source: Eurostat
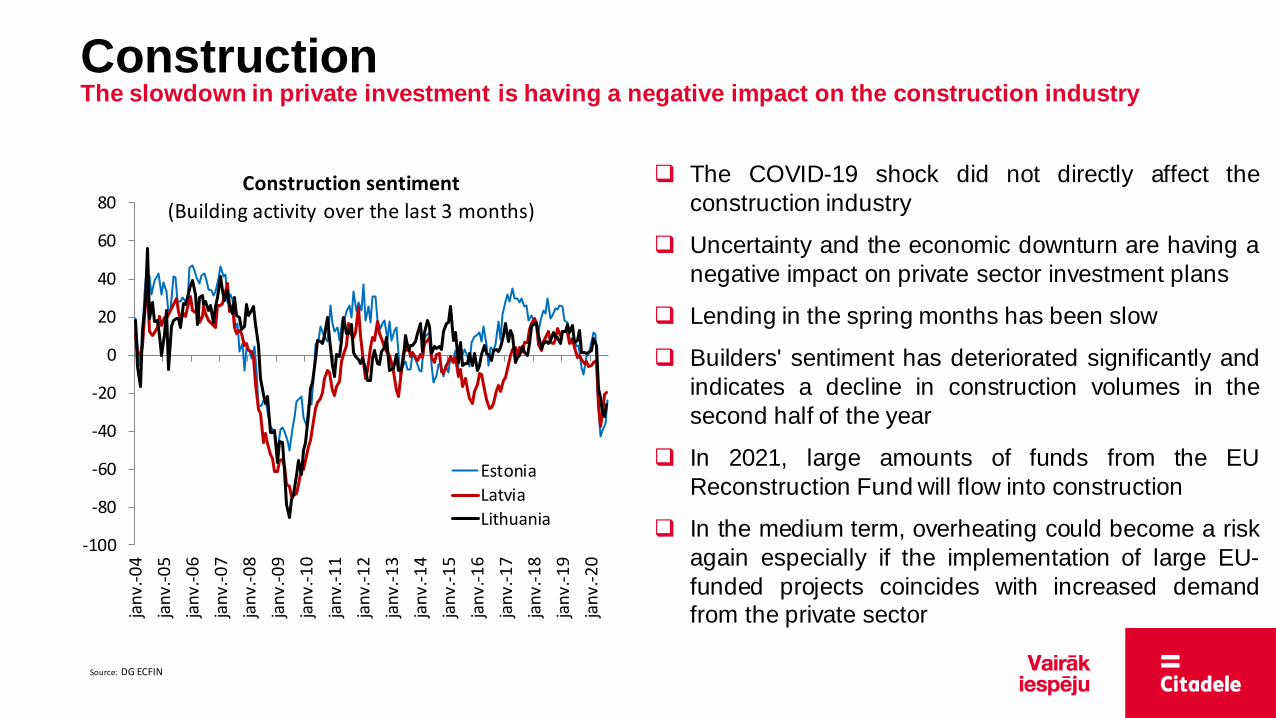
The COVID-19 shock did not directly affect the
construction industry
Uncertainty and the economic downturn are having a
negative impact on private sector investment plans
Lending in the spring months has been slow
Builders' sentiment has deteriorated significantly and
indicates a decline in construction volumes in the
second half of the year
In 2021, large amounts of funds from the EU
Reconstruction Fund will flow into construction
In the medium term, overheating could become a risk
again especially if the implementation of large EU-
funded projects coincides with increased demand from the private sector
-100
-80
-60
-40
-20
0
20
40
60
80
jan
v.-0
4
jan
v.-0
5
jan
v.-0
6
jan
v.-0
7
jan
v.-0
8
jan
v.-0
9
jan
v.-1
0
jan
v.-1
1
jan
v.-1
2
jan
v.-1
3
jan
v.-1
4
jan
v.-1
5
jan
v.-1
6
jan
v.-1
7
jan
v.-1
8
jan
v.-1
9
jan
v.-2
0
Construction sentiment
(Building activity over the last 3 months)
Estonia
Latvia
Lithuania
Construction The slowdown in private investment is having a negative impact on the construction industry
Source: DG ECFIN
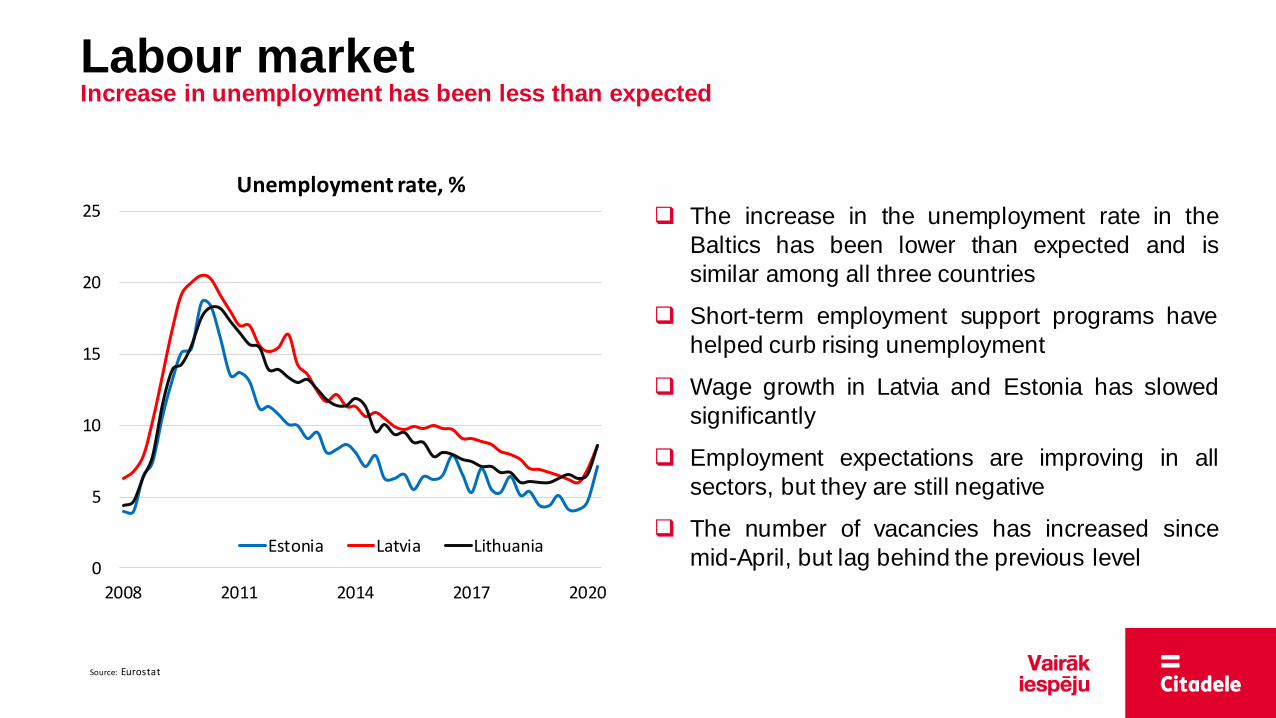
Labour market Increase in unemployment has been less than expected
The increase in the unemployment rate in the
Baltics has been lower than expected and is
similar among all three countries
Short-term employment support programs have
helped curb rising unemployment
Wage growth in Latvia and Estonia has slowed
significantly
Employment expectations are improving in all
sectors, but they are still negative
The number of vacancies has increased since
mid-April, but lag behind the previous level 0
5
10
15
20
25
2008 2011 2014 2017 2020
Unemployment rate, %
Estonia Latvia Lithuania
Source: Eurostat
The Baltic economy reached its lowest point in mid-April.
The economic recovery has so far been much stronger than expected.
Domestic consumption is leading economic recovery.
Retail sales returned to positive growth in June, but the situation in the services sector is less encouraging.
Exports and production lag behind consumption, but the situation in foreign markets is improving.
In the second quarter, the decline in GDP in the Baltics was significantly smaller than in the euro area as a whole.
The key to the Baltic's success was rapid virus containment, strong public finances, timely support for the economy and
balanced economic development in previous years.
The sectors hardest hit, tourism and leisure, will only be able to return to previous levels when a vaccine or effective
treatment for COVID-19 is available.
The decline in GDP in the Baltic region in 2020 will not exceed 5% and economic losses will be lower than in other
countries.
Economic growth in the Baltics in 2021 will be in the range of 3-5%.
The economic recovery both in the world and in the Baltics is still incomplete.
Since June, improvements in short-term economic performance have slowed significantly.
Strong fiscal and monetary stimulus measures continue to support the economy. Financial markets remain optimistic.
The eurozone has slipped into deflation and consumers do not expect inflation to rise in the near future.
The biggest risk to economic recovery is the possible second wave of COVID-19.
Conclusions The Baltic region is recovering from the COVID-19 shock, but uncertainty remains
AS “Citadele banka”
Republikas laukums 2A
Rīga, Latvija


![INDEX [martins-supermarkets.com]](https://static.fdocuments.us/doc/165x107/61d44a57b48a9f17f2484734/index-martins-.jpg)