
Marketing ROI For Lead Generation
40
Not for copy or distribution without written permission from Lenskold Group 1 © 2007 Lenskold Group. All rights reserved. 1 October 1, 2007 October 1, 2007 “One of the top 5 most influential marketing books of 2004” Marketing ROI Marketing ROI For Lead Generation For Lead Generation © 2007 Lenskold Group. All rights reserved. 2 Global Leadership in Marketing ROI Global Leadership in Marketing ROI “Marketing ROI” book published in 2003 – Published in 8 languages – Named 1 of the best 5 marketing books for 2004 Lenskold Group, Inc. – Founded in 1997 • Comprehensive process for marketing profitability management – ROI Framework – Measurement & Analysis – Management Tools – Workshops & Training • Global 1000 and emerging corporate client base • Workshops conducted in 6 countries with 600+ marketers • Constant innovations in marketing ROI
Transcript of Marketing ROI For Lead Generation

Not for copy or distribution without written permission from Lenskold Group 1
© 2007 Lenskold Group. All rights reserved.1
October 1, 2007October 1, 2007
“One of the top 5 most influential marketing
books of 2004”
Marketing ROI Marketing ROI For Lead GenerationFor Lead Generation
© 2007 Lenskold Group. All rights reserved.2
Global Leadership in Marketing ROIGlobal Leadership in Marketing ROI
� “Marketing ROI” book published in 2003
– Published in 8 languages
– Named 1 of the best 5 marketing books for 2004
� Lenskold Group, Inc.– Founded in 1997
• Comprehensive process for marketing profitability management
– ROI Framework
– Measurement & Analysis
– Management Tools
– Workshops & Training
• Global 1000 and emerging corporate client base
• Workshops conducted in 6 countries with 600+ marketers
• Constant innovations in marketing ROI

Not for copy or distribution without written permission from Lenskold Group 2
© 2007 Lenskold Group. All rights reserved.3
Marketing Profitability ManagementMarketing Profitability Management
Σ Profits – InvestmentROI = ------------------------------
Marketing Investment
Unaware Prospects
Profitable Sales
Unaware Prospects
Profitable Sales
1,000
↓
150
↓10
↓2
Base Campaign & Ad Increment Split
0
50
100
150
200
250
300
1 2 3 4 5 6 7 8 9
AdIncrementalImpactBaseCampaignImpactControl
Enhanced Incremental Impact
Base Campaign
Impact
Control
Base Campaign vs. Enhanced Base Campaign & Ad Increment Split
0
50
100
150
200
250
300
1 2 3 4 5 6 7 8 9
AdIncrementalImpactBaseCampaignImpactControl
Enhanced Incremental Impact
Base Campaign
Impact
Control
Base Campaign vs. Enhanced
Baseline
Sal
es $
Sal
es $
-
20,000
40,000
60,000
80,000
100,000
120,000
Jan
MarMay Ju
lSep Nov Ja
nMar
May Jul
Sep Nov
Promotion Periods
-
20,000
40,000
60,000
80,000
100,000
120,000
Jan
MarMay Ju
lSep Nov Ja
nMar
May Jul
Sep Nov
Promotion Periods
Marketing Strategy & Position
Measurements & Metrics Tracking
FinancialAssessment
Decision &Mgmt Tools
Marketing Performance
Customer & SalesAnalytics
© 2007 Lenskold Group. All rights reserved.4
Marketing ROI Overview

Not for copy or distribution without written permission from Lenskold Group 3
© 2007 Lenskold Group. All rights reserved.5
Profitability/ROI Metrics Profitability/ROI Metrics ↔↔↔↔↔↔↔↔ Higher GrowthHigher Growth
• Use of profitability/ROI metrics correlates with “much greater” growth
How would you describe your firm's growth in the up coming
year re lative to your primary competitors?
20%
3%
9%
28%
39%
2%
10%
33%
38%
17%
4%
17%
31%37%
11%
0%
10%
20%
30%
40%
50%
Much greatergrowth
Somewhatgreatergrowth
Same growth Somewhatslower growth
Much slowergrowth
Profitability/ROIMetrics
Some FinancialMetrics
TraditionalMetrics
(n=109,207,248) Source: Lenskold Group / MarketingProfs, 2007
Source: Lenskold Group & MarketingProfs 2007 Marketing ROI and Measurements Trend Study
Full report available at www.lenskold.com
© 2007 Lenskold Group. All rights reserved.6
How would you rate where your company stands with e ach of the following? (Percent with Top 2 ratings on a scale f rom 1 - Very Strong
to 5 - Very Weak)
26%24%30%
15%
34%
44%40%
20%
9%15%
10%
16%
25%
13%
0%5%
10%15%20%25%30%35%40%45%50%
Acquisitionof HighValue
Segments
Retention ofHigh ValueSegments
CustomerProf itability
BasedTargeting
Targeting w /PredictiveModeling
Marketing &Sales
Alignment &Integration
ManagingCustomer
BuyingFunnel
Analysis &Mining of
Customer &Sales Data
GreaterGrow th
Slow erGrow th
Source: Lenskold Group / MarketingProfs, 2007(n=301,89)
Strengths Higher for HigherStrengths Higher for Higher --Growth CompaniesGrowth Companies
• Correlations exist between companies expecting higher growth and key processes related to marketing ROI
– Large difference in strength ratings for managing the customer buying funnel and sales and marketing alignment
Source: Lenskold Group & MarketingProfs 2007 Marketing ROI and Measurements Trend Study
Not for copy or distribution without written permission from Lenskold Group 4
© 2007 Lenskold Group. All rights reserved.7
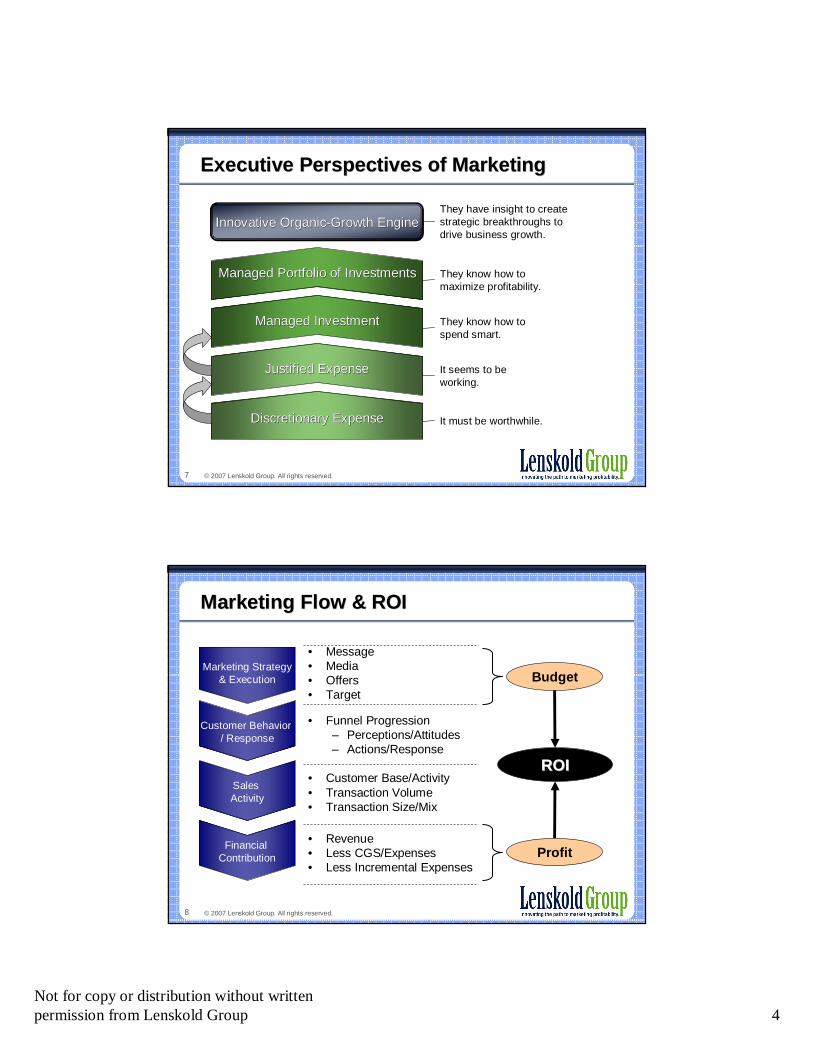
Executive Perspectives of Marketing Executive Perspectives of Marketing
Innovative OrganicInnovative Organic--Growth EngineGrowth Engine
Managed Portfolio of InvestmentsManaged Portfolio of Investments
Justified ExpenseJustified Expense
Managed InvestmentManaged Investment
Discretionary ExpenseDiscretionary Expense It must be worthwhile.
It seems to be working.
They know how to spend smart.
They know how to maximize profitability.
They have insight to create strategic breakthroughs to drive business growth.
© 2007 Lenskold Group. All rights reserved.8
Customer Behavior / Response
Sales Activity
• Funnel Progression– Perceptions/Attitudes– Actions/Response
• Customer Base/Activity• Transaction Volume• Transaction Size/Mix
Marketing Flow & ROIMarketing Flow & ROI
• Message• Media• Offers• Target
• Revenue• Less CGS/Expenses• Less Incremental Expenses
Marketing Strategy& Execution
Financial Contribution
Budget
Profit
ROIROI

Not for copy or distribution without written permission from Lenskold Group 5
© 2007 Lenskold Group. All rights reserved.9
Managing Customer Funnel ProgressionManaging Customer Funnel Progression
Profitable Sales
1,000
↓↓↓↓
150
↓↓↓↓10
↓↓↓↓2
© 2007 Lenskold Group. All rights reserved.
Brand Investments
Demand Generation Marketing
Acquisition Marketing & Sales Generation
Brand Experience InvestmentsRetention & Cross-Sell Marketing
Revenue
Acknowledge a
Problem
Seek Options
Clarify Need
Seek Solutions
Select Preferred
Purchase
Repeat Purchase
Loyalty
Referral
CustomerCompanyUnaware Prospects
© 2007 Lenskold Group. All rights reserved.10
Align Marketing & MeasurementAlign Marketing & Measurement
Profitable Sales
1,000
↓↓↓↓
150
↓↓↓↓10
↓↓↓↓2
© 2007 Lenskold Group. All rights reserved.
Brand Investments
Demand Generation Marketing
Acquisition Marketing & Sales Generation
Brand Experience Investments
Retention & Cross-Sell Marketing
Revenue Incremental Sales Impact
Profit Contribution & ROI
Funnel Progression& Tactics
Strategies
Unaware Prospects

Not for copy or distribution without written permission from Lenskold Group 6
© 2007 Lenskold Group. All rights reserved.11
The Funnel LeaksThe Funnel Leaks
Adapted from “The Leaky Funnel” by Hugh Macfarlane (www.leakyfunnel.com)
Wrong Target
Not Yet Won
Remove Recycle
Profitable Sales
Unaware Prospects1,000
↓↓↓↓
150
↓↓↓↓10
↓↓↓↓2
© 2007 Lenskold Group. All rights reserved.12
Effective Approach to mROI
%

Not for copy or distribution without written permission from Lenskold Group 7
© 2007 Lenskold Group. All rights reserved.13
Building an mROI SolutionBuilding an mROI Solution
1. Marketing ROI Framework – Process, standardization, definitions, tools
2. Measurement Plan– Analytic, research, & measurement methodologies
3. Strategic Application of Insight– Process for putting insight into action
4. CMO Management Capabilities– Management tools and reporting
5. Implementation Roadmap– Cultural transition, capability-building
© 2007 Lenskold Group. All rights reserved.14
1. Accurate Financial Analysis1. Accurate Financial Analysis
(Gross Margin –Marketing Investment)
ROI = --------------------------Marketing Investment
Example
$1.6 M - $1 MROI = ------------------
$1 M
$600,000= --------------- = 60%
$1,000,000
Gross Margin) equals the Discounted Cash Flow (Net Present Value) of incremental profits and costs that result specifically from the corresponding marketing investment
Incremental marketing
budget
Staff & Overhead
Incremental CGS
Lost Margin from
Existing Sales
Total Investment
Gross Margin
from New Sales
Uncollected Revenue
Revenue
Sales
ReferralsReduced CGS
Total
Incremental
Gross Margin
Cost of Goods &
Operating Expenses
Sales-Driven Expenses Incremental CGS
DataAnalytics
PlanningAssumptions
Market Research
MeasuredImpact

Not for copy or distribution without written permission from Lenskold Group 8
© 2007 Lenskold Group. All rights reserved.15
4. Data Mining & Research– Performance
Diagnostics – Tracking– Segment Level
Analysis– Dashboards &
Balanced Scorecards
3. ROI Analysis– Independent ROI– Incremental ROI
– Aggregate ROI
1. Methodologies– Market Test – Modeling– Pre vs. Post Trending– Quantitative Research
2. Use Measurements to Isolate Impact2. Use Measurements to Isolate Impact
2. Funnel & Sales Impact Across Touchpoints
Unaware Prospects
Profitable Sales
1,000
↓
150
↓
10
↓
2
Brand Investments
Demand Generation
Marketing
Acquisition Marketing & Sales Generation
Brand Experience Investments
Retention & Cross-Sell Marketing
Revenue Incremental Sales Impact
Profit Contribution & ROI
Funnel Progression
© 2007 Lenskold Group. All rights reserved.16
3. Apply Insight for Profit Improvement3. Apply Insight for Profit Improvement
Initial Prospects
Closed Sales
Reduce leakage with better integrationAccelerate
leakage of low-potential prospects
Target High – Value /
High – Potential Prospects
Reduce over-spending beyond progression rate
Improve conversion later
in the funnel
Closing sales
Customer retention

Not for copy or distribution without written permission from Lenskold Group 9
© 2007 Lenskold Group. All rights reserved.17
4. Enable CMO Management4. Enable CMO Management
• Determine total spending levels• Guide budget allocation as well as portfolio management• Drive Go-to-Market strategy• Establish dashboards & tracking to guide course correction
– Performance Metrics � align closely with business objectives– Leading Indicator Metrics � predictive of future outcomes– Diagnostic Metrics � what’s working & why
Profits
# of “wins”Average $/ “win” Cost per win
Effectiveness ROI Efficiency
Cost per sale
Cost per lead
Profit per Customer
Lead to Sale Conversion rate
Retention rates
Funnel Progression:
New names
Pain Development
© 2007 Lenskold Group. All rights reserved.18
5. Plan the Implementation Roadmap5. Plan the Implementation Roadmap
• Opportunity prioritization• Data Management• Timing of measurement and analysis• Identification of champions and sponsors• Organizational transition
Establish early stages of success to build momentum
Not for copy or distribution without written permission from Lenskold Group 10
© 2007 Lenskold Group. All rights reserved.19
Marketing ROI Insight
%
© 2007 Lenskold Group. All rights reserved.20
Closing the Alignment GapClosing the Alignment Gap
• The alignment between Sales and Marketing is the number one issue for B2B companies worldwide, and their reasons are clear.
• Businesses with strong alignment are:– Outgrowing their competitors by 5.4% – 38% better at closing proposals– Churning 36% fewer customers each year
Source: MathMarketing alignment benchmark study2004/2005 | 1400 professionals | 84 countries

Not for copy or distribution without written permission from Lenskold Group 11
© 2007 Lenskold Group. All rights reserved.21
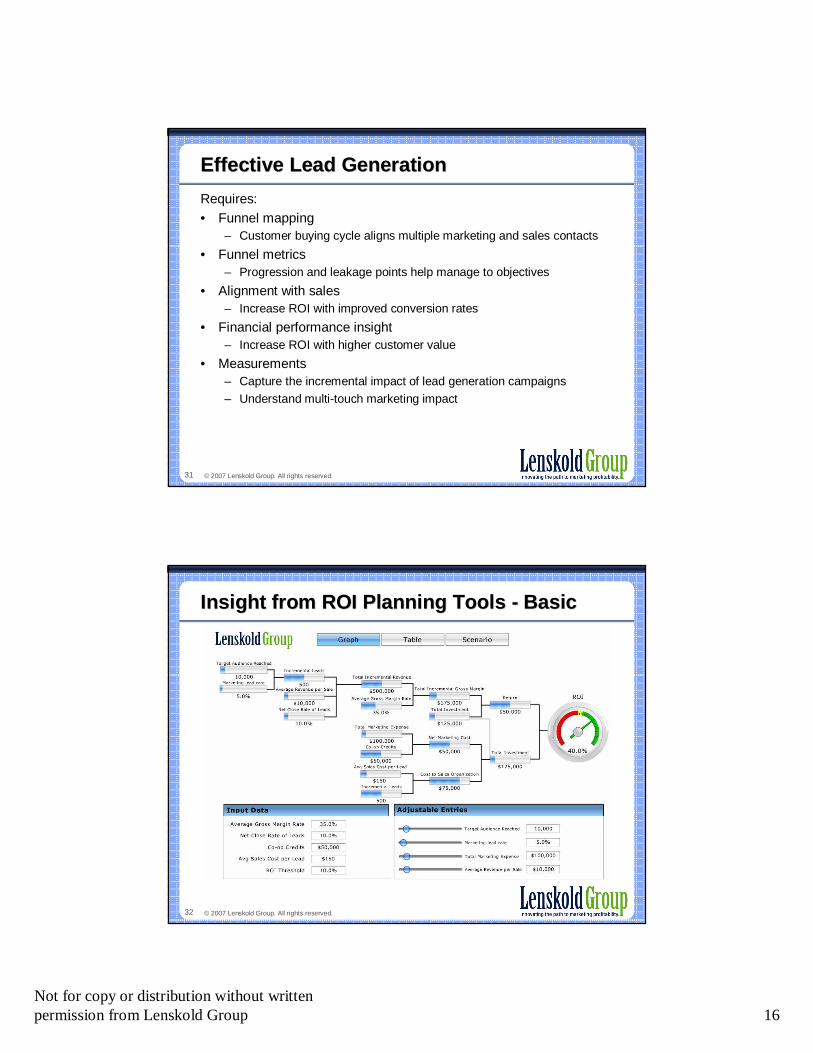
Budget Financial ResultsTotal Marketing Expense $100,000 Avg Sales Mmgt Cost per Lead $150Co-Op Credits -$50,000 Cost to Sales Organization $75,000Net Marketing Cost $50,000 Marketing Expense $50,000
Total Investment $125,000
Marketing Impact Total Incremental Gross Margin $175,000Target Audience Reached 10,000 Total Investment $125,000Marketing lead rate 5% Return $50,000Incremental Leads 500Marketing Cost per Lead $100 Investment $125,000
Return (GM - Invt) $50,000Sales ImpactLeads from Marketing into Sales 500 ROI 40%Net Close Rate of Leads 10.0%Incremental Sales 50
Average Revenue per Sale $10,000Total Incremental Revenue $500,000
Average Gross Margin Rate 35%Average Gross Margin / Sale $3,500Total Incremental Gross Margin $175,000
ROI Formula OverviewROI Formula Overview
Budget Financial ResultsTotal Marketing Expense $100,000 Avg Sales Mmgt Cost per Lead $150Co-Op Credits -$50,000 Cost to Sales Organization $75,000Net Marketing Cost $50,000 Marketing Expense $50,000
Total Investment $125,000
Marketing Impact Total Incremental Gross Margin $175,000Target Audience Reached 10,000 Total Investment $125,000Marketing lead rate 5% Return $50,000Incremental Leads 500Marketing Cost per Lead $100 Investment $125,000
Return (GM - Invt) $50,000Sales ImpactLeads from Marketing into Sales 500 ROI 40%Net Close Rate of Leads 10.0%Incremental Sales 50
Average Revenue per Sale $10,000Total Incremental Revenue $500,000
Average Gross Margin Rate 35%Average Gross Margin / Sale $3,500Total Incremental Gross Margin $175,000
© 2007 Lenskold Group. All rights reserved.22
Lead Generation CampaignLead Generation Campaign
• Integrated marketing– Webinar– Direct mail & e-mail invitations
– Website & inbound call response channels– Outbound lead qualification calls– Handoff to Sales
Marketing
Sales

Not for copy or distribution without written permission from Lenskold Group 12
© 2007 Lenskold Group. All rights reserved.23
BudgetTotal Marketing Expense $100,000Co-Op Credits -$50,000Net Marketing Cost $50,000
Marketing ImpactIncremental Leads 500Marketing Cost per Lead $100
Sales ImpactNet Close Rate of Leads 10.0%Incremental Sales 50Average Revenue per Sale $10,000Total Incremental Revenue $500,000Average Gross Margin / Sale $3,500Total Incremental Gross Margin $175,000Cost to Sales Organization $75,000
Financial ResultsInvestment $125,000Return (GM - Invt) $50,000ROI 40%
Lead Generation CampaignLead Generation Campaign
$100,000-$50,000$50,000
500$100
5.0%25
$10,000$250,000
$3,500$87,500$75,000
$125,000-$37,500
-30%
© 2007 Lenskold Group. All rights reserved.24
Targeting Tactics Targeting Tactics -- ScreeningScreening
• Modify objectives– Align with Sales– Reduce non-converting leads
• Enhance integrated campaign– Capture intelligence on web response
form & inbound call– Enhanced lead generation screening in
qualification call
Marketing
Sales

Not for copy or distribution without written permission from Lenskold Group 13
© 2007 Lenskold Group. All rights reserved.25
$110,000 $10,000-$50,000 $0$60,000 $10,000
400 -100$150 $50
12.5% 2.5%50 0
$10,000$500,000 $0
$3,500$175,000 $0$60,000 -$15,000
$120,000$55,000
46%
BudgetTotal Marketing Expense $100,000Co-Op Credits -$50,000Net Marketing Cost $50,000
Marketing ImpactIncremental Leads 500Marketing Cost per Lead $100
Sales ImpactNet Close Rate of Leads 10.0%Incremental Sales 50Average Revenue per Sale $10,000Total Incremental Revenue $500,000Average Gross Margin / Sale $3,500Total Incremental Gross Margin $175,000Cost to Sales Organization $75,000
Financial ResultsInvestment $125,000Return (GM - Invt) $50,000ROI 40%
Target Tactics Target Tactics –– ScreeningScreening
© 2007 Lenskold Group. All rights reserved.26
Targeting Tactics Targeting Tactics -- SelectionSelection
• Modify objectives– Improve profit per sale– Improve conversion rate
• Use analysis to improve targeting– Data mining & customer analysis– Sales leakage diagnosis
Marketing
Sales

Not for copy or distribution without written permission from Lenskold Group 14
© 2007 Lenskold Group. All rights reserved.27
$110,000 $10,000-$50,000 $0$60,000 $10,000
500$120 $20
10.0%50 0
$10,000$500,000 $0
$4,375 $875$218,750 $43,750$75,000 $0
$135,000 $10,000$83,750 $33,750
62% 338%
BudgetTotal Marketing Expense $100,000Co-Op Credits -$50,000Net Marketing Cost $50,000
Marketing ImpactIncremental Leads 500Marketing Cost per Lead $100
Sales ImpactNet Close Rate of Leads 10.0%Incremental Sales 50Average Revenue per Sale $10,000Total Incremental Revenue $500,000Average Gross Margin / Sale $3,500Total Incremental Gross Margin $175,000Cost to Sales Organization $75,000
Financial ResultsInvestment $125,000Return (GM - Invt) $50,000ROI 40%
Targeting Tactics Targeting Tactics -- SelectionSelection
© 2007 Lenskold Group. All rights reserved.28
Lead Gen & Sales SupportLead Gen & Sales Support
• Same integrated campaign– Conversion problem identified at
Management Approval stage
• Add tactic to reduce leakage– PR Campaign– Case study w/business case delivered
following the Webinar– Sales support materials
Marketing
Sales

Not for copy or distribution without written permission from Lenskold Group 15
© 2007 Lenskold Group. All rights reserved.29
$120,000 $20,000-$50,000 $0$70,000 $20,000
500$140 $40
12.5% 2.5%62.5 12.5
$10,000$625,000 $125,000
$3,500$218,750 $43,750$75,000 $0
$145,000 $20,000$73,750 $23,750
51% 119%
BudgetTotal Marketing Expense $100,000Co-Op Credits -$50,000Net Marketing Cost $50,000
Marketing ImpactIncremental Leads 500Marketing Cost per Lead $100
Sales ImpactNet Close Rate of Leads 10.0%Incremental Sales 50Average Revenue per Sale $10,000Total Incremental Revenue $500,000Average Gross Margin / Sale $3,500Total Incremental Gross Margin $175,000Cost to Sales Organization $75,000
Financial ResultsInvestment $125,000Return (GM - Invt) $50,000ROI 40%
Lead Gen & Sales SupportLead Gen & Sales Support
© 2007 Lenskold Group. All rights reserved.30
Putting Ideas Into Action
Not for copy or distribution without written permission from Lenskold Group 16
© 2007 Lenskold Group. All rights reserved.31
Effective Lead GenerationEffective Lead Generation
Requires:• Funnel mapping
– Customer buying cycle aligns multiple marketing and sales contacts
• Funnel metrics– Progression and leakage points help manage to objectives
• Alignment with sales– Increase ROI with improved conversion rates
• Financial performance insight– Increase ROI with higher customer value
• Measurements– Capture the incremental impact of lead generation campaigns
– Understand multi-touch marketing impact
© 2007 Lenskold Group. All rights reserved.32
Insight from ROI Planning Tools Insight from ROI Planning Tools -- BasicBasic

Not for copy or distribution without written permission from Lenskold Group 17
© 2007 Lenskold Group. All rights reserved.33
Insight from ROI Planning Tools Insight from ROI Planning Tools -- AdvancedAdvanced
© 2007 Lenskold Group. All rights reserved.34
Common Starting PointsCommon Starting Points
• Campaign Effectiveness– Structured market test or measurement– Tactical Testing
• ROI Insights for Planning Decisions– Basic financial framework
– ROI planning tools
• Funnel Mapping & Management– Quantify leakage and progression– Identify gaps and opportunities
• Targeting for Lead and Sales Increase– Predictive modeling
• Customer Profitability– Customer Value Analysis
• Metrics & Dashboard Development

Not for copy or distribution without written permission from Lenskold Group 18
© 2007 Lenskold Group. All rights reserved.35
CONTACT INFORMATION
Jim LenskoldLenskold Group2517 Highway 35Building N, Suite 202Manasquan, NJ 08736
Phone: 732-223-8886E-mail: [email protected]
Lenskold Group Advantages
Lenskold Group offers an unsurpassed depth of capabilities in marketing ROI processes and measurements. We deliver practical, actionable solutions that truly generate profit improvements.
We are a best fit for companies that:• Require financial integrity to earn credibility outside of marketing• Want decision tools that leverage insight from multiple measurement sources instead of single-methodology solutions• Have a marketing organization committed to profit improvements• Prefer a customized solution over a one-size-fits-all approach• Need a marketer-friendly approach• Value a transition plan designed specifically to their culture and skills• Want analysis and intelligence that can create a clear competitive advantage
Proprietary & Confidential — Copyright ©2006 Serena Software, Inc.
Aligning Sales & Marketing Through Better Pipeline Management
MARKETING PERFORMANCE MEASUREMENT
Presented by Ceri Jones
October 1st, 2007
Not for copy or distribution without written permission from Lenskold Group 19
37 Proprietary & Confidential — Copyright ©2006 Serena Software, Inc.
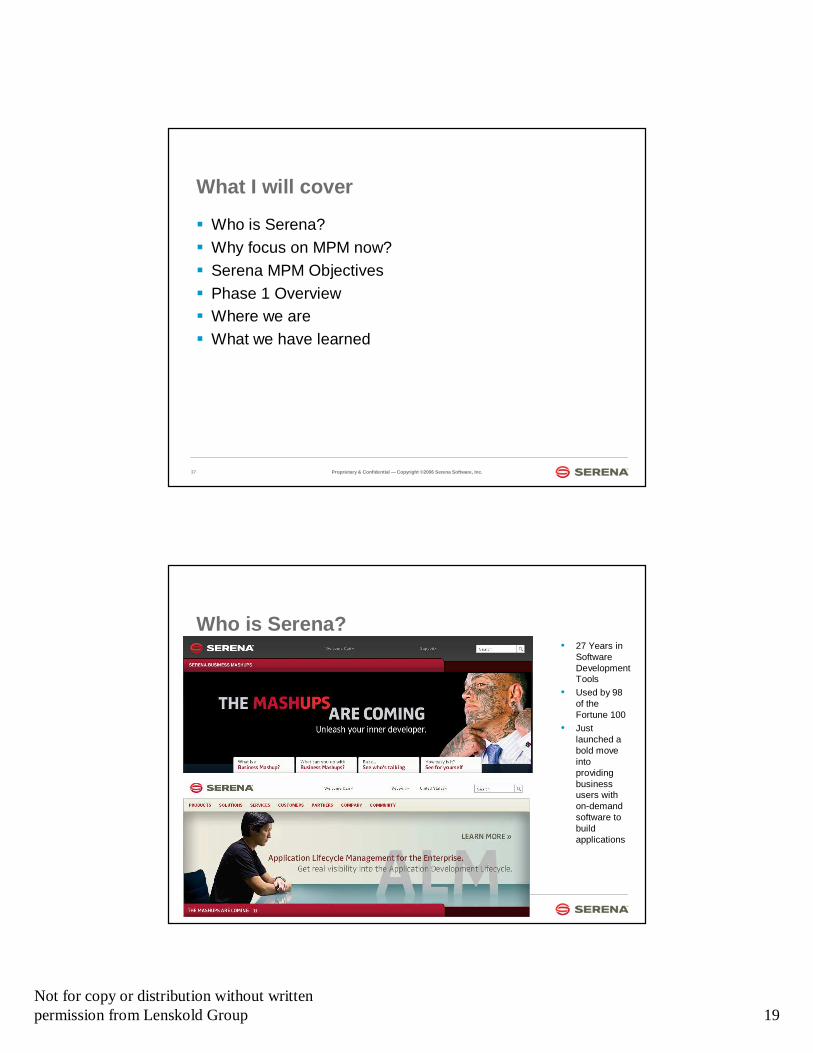
What I will cover
� Who is Serena?� Why focus on MPM now?� Serena MPM Objectives� Phase 1 Overview� Where we are� What we have learned
38 Proprietary & Confidential — Copyright ©2006 Serena Software, Inc.
Who is Serena?• 27 Years in
Software Development Tools
• Used by 98 of the Fortune 100
• Just launched a bold move into providing business users with on-demand software to build applications

Not for copy or distribution without written permission from Lenskold Group 20
39 Proprietary & Confidential — Copyright ©2006 Serena Software, Inc.
BackgroundWhy bother? Why now?
� Defensive:• Budgets were tight and could often get cut further
after a ‘bad quarter’• Greater focus on accountability from new
management: Marketing had to be a part of that• In a sales-oriented environment Marketing’s
contribution is judged by how well we ‘help sales’• This requires meaningful measurements tied to
what Sales cares about
40 Proprietary & Confidential — Copyright ©2006 Serena Software, Inc.
Marketing Accountability
“If I can not convey to my executive team how to maximize the marketing investment and our opportunities, they’ll all claim to be marketing experts and want to do our job for us.”
Herman Stehlik , Vice President Marketing, National Semiconductor
Source: ‘Measures & Metrics: The CMO Council Report, 2004

Not for copy or distribution without written permission from Lenskold Group 21
41 Proprietary & Confidential — Copyright ©2006 Serena Software, Inc.
� Strategic:• To enable justification of Marketing’s spending and resource
plan• To ensure management of expectations between Marketing
and Sales on what Marketing will deliver• To clarify roles and responsibilities in Marketing• To drive process definition• To drive consistent use of automation/ analytics tools• To turn business objectives into definable, measurable,
executable marketing outcomes
BackgroundWhy bother? Why now?
SERENA MPM PROJECTObjectives and Scope

Not for copy or distribution without written permission from Lenskold Group 22
43 Proprietary & Confidential — Copyright ©2006 Serena Software, Inc.
December, 2006
� No metrics to define overall Marketing ROI or to assess marketing performance
� Simplistic marketing measures (click rate, cost per lead etc) used internally by Marketing
� Marketing processes, data gathering, measurement and programme execution are regionally controlled
� Marketing systems are not used consistently
44 Proprietary & Confidential — Copyright ©2006 Serena Software, Inc.
Project Objectives
Untroubled and Unaware
Recognition of need
Evaluation of options
Acknowledgement of problem
Positioning of suppliers
‘Beauty parade’ Selection of supplier
Negotiation and purchase
Reduce leakage
Increase Velocity
• More opportunities• Faster closing cycles• Higher average order values
Source: ‘The Leaky Funnel’, Hugh Macfarlane

Not for copy or distribution without written permission from Lenskold Group 23
45 Proprietary & Confidential — Copyright ©2006 Serena Software, Inc.
Timeline
� September 2006• Go live on Salesforce.com – replacement for Pivotal
� November 2007• Early testing with Eloqua• Definition of marketing requirements
� December 2007• Agreement to MPM proposal
� February 2007• Project go live
� May 2007• Completion of process definitions & metrics
� July 2007• New SVP Marketing
46 Proprietary & Confidential — Copyright ©2006 Serena Software, Inc.
Phase 1 of a journey
Source: CMO Council

Not for copy or distribution without written permission from Lenskold Group 24
47 Proprietary & Confidential — Copyright ©2006 Serena Software, Inc.
Project Scope
48 Proprietary & Confidential — Copyright ©2006 Serena Software, Inc.
Process Definition/ Nomenclature

Not for copy or distribution without written permission from Lenskold Group 25
49 Proprietary & Confidential — Copyright ©2006 Serena Software, Inc.
Measuring Campaigns
• Lead Volume• Lead quality• Lead cost
50 Proprietary & Confidential — Copyright ©2006 Serena Software, Inc.
Overall Approach
� Work closely with Business Operations team (Sales)� Treat Salesforce.com and SAP as the de facto standards
for pipeline and revenue reporting� Break project into components and work with specialist
third parties• Lenskold Group retained for process and metric definition
� Pragmatic: focus on what can be implemented immediately..• ..but set the strategic direction
Not for copy or distribution without written permission from Lenskold Group 26
51 Proprietary & Confidential — Copyright ©2006 Serena Software, Inc.
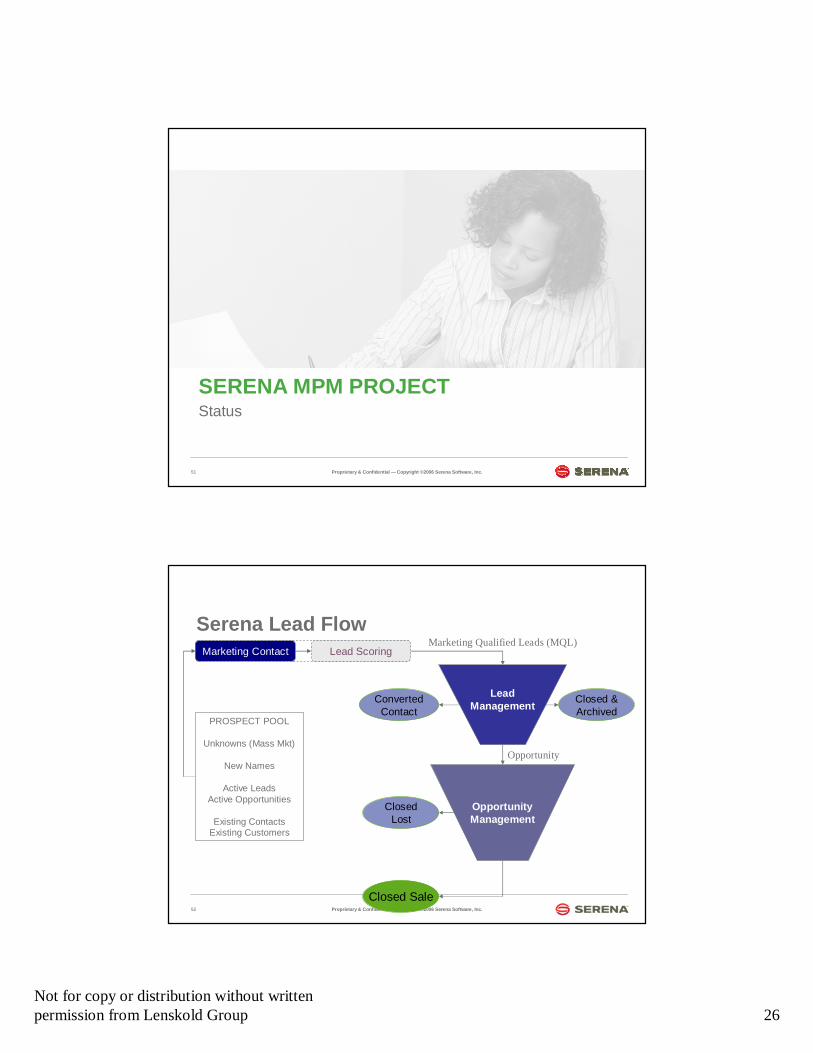
SERENA MPM PROJECTStatus
52 Proprietary & Confidential — Copyright ©2006 Serena Software, Inc.
Serena Lead FlowMarketing Contact Lead Scoring
Lead Management
Opportunity Management
Opportunity
Marketing Qualified Leads (MQL)
PROSPECT POOL
Unknowns (Mass Mkt)
New Names
Active LeadsActive Opportunities
Existing ContactsExisting Customers
Closed &Archived
Closed Sale
Closed Lost
ConvertedContact

Not for copy or distribution without written permission from Lenskold Group 27
53 Proprietary & Confidential — Copyright ©2006 Serena Software, Inc.
Conversion Rates Revenue Targeting Effectiveness & Efficiency
Lead Volume (MQL) Value Quality Campaign ROIConversion Quality
Lead to MQL % Avg "Value Score" Screening Quality
Cost per MQL
MQL to SQL % Lead Quality
SQL to Opportunity % Lead Mgmt Velocity
Opportunity Volume
Opportunity to Sale % Revenue per Sale Opportunity Velocity
Cost per Sale
Sale to Repeat % Revenue per Repeat
____________ _______________ _______________
= (# of Sales xRevenue per Sale x
Profit %)- Total Cost to Sell
Business/Financial Performance Drivers
Profit
Marketing Contact
Lead Scoring
Lead MgmtUntouched (=MQL)Contact Attempt
(=SQL)Contact Made
Opportunity MgmtOpportunity GenBusiness Asst
Technology AsstSolution Design
Solution ProposalClosed
54 Proprietary & Confidential — Copyright ©2006 Serena Software, Inc.
Marketing Metrics – Lead Mgmt Stage
Marketing Performance Metrics1. Opportunity Volume2. % Conversion to Active Lead3. % Conversion to Opportunity� Determine Lead Velocity
• Average days from Lead to Call Attempt
• Average days Active Lead� Determine Net New Leads Insight Metrics for Planning� Total Active Opportunities� Active Opportunities per Sales Person
Profit
Marketing Contact
Lead Scoring
Lead MgmtUntouched (=MQL)Contact Attempt
(=SQL)Contact Made
Opportunity MgmtOpportunity GenBusiness Asst
Technology AsstSolution Design
Solution ProposalClosed
Priority 1
Priority 2

Not for copy or distribution without written permission from Lenskold Group 28
57 Proprietary & Confidential — Copyright ©2006 Serena Software, Inc.
Impact of Measurement
� Assess marketing leads in terms of impact on new customers, new projects, and extension business
� Track and test strategic approaches• Marketing influence on conversion rates• Integrated multiple-touchpoint impact• High growth opportunities• New nurturing programs
� Commence a dialogue with Sales on strategy – not just leads
58 Proprietary & Confidential — Copyright ©2006 Serena Software, Inc.
Lessons Learned
� Getting the timing right: the importance of buy-in� Avoid ‘boiling the ocean’: focus on quick wins� Ensure you get commitment and resource to execute� Keep key stakeholders involved throughout the project� Be clear what constitutes successful project delivery

Not for copy or distribution without written permission from Lenskold Group 29
59 Proprietary & Confidential — Copyright ©2006 Serena Software, Inc.
Summary
� At Serena organisational changes drove increased focus on performance
� Executive sponsorship was crucial� Important to have realistic goals� Focus on quick wins but have a strategic direction� Be patient� Involve stakeholders throughout
Proprietary & Confidential — Copyright ©2006 Serena Software, Inc.
Thank You
Ceri Jones

Not for copy or distribution without written permission from Lenskold Group 30
61
Getting to closed loop lead management … “the Holy Grail”(“everyone talks about it but it’s hard to do”)
Dennis HeadAvaya North American Marketing.
62
A little background…
� 30 years Executive Sales Management experience with Xerox, Rolm, IBM, Octel
� 5 years Channel Marketing / Management experience with Octel and Lucent
� 7 yrs experience Lead Generation/ Management with Avaya
� Current Role: Avaya� Improving ROMI through alternative web based lead sources � Sourcing and managing internal technician lead program � Manager of the organization marketing and campaign metrics � Siebel funnel management metrics and management � Closed loop lead management

Not for copy or distribution without written permission from Lenskold Group 31
63
B2B Integrated Process for Closed Loop Management… “eDemand”
� Its an integrated system where inquiries come in and leads go out.� The Heart” of the system is a marketing database� Everything is tracked… we know what happened to it. � It uses a rules engine to determine the “next best thing to do “� It provides us with the ability to measure key performance metrics � Our “Spend” on qualification is based on the value of the deal� FACT: Most “lead Inquiries” are not “Leads” how do we process
them economically and turn them in to qualified leads � Great leads need to get to the “right sales person at the right time”. � You have spend Millions to generate these leads “ what happened
to them?”� The sales force is our “Customer” we only win when they do. � A “Metaphor”…Think of an Oil Refinery. Crude Oil comes in…..
64
The Lead “Refinery”
Sales Cycle
Lead
Lea
Lead Inquires In
External Sources
Internal Sources
Data Hygiene Marketing Database
Metrics and Reporting
Rules Engine
Lead Routing
Lead Telequalification
eCultivation
Standardized data collection

Not for copy or distribution without written permission from Lenskold Group 32
65
Four Key Elements
1. Quality leads that your sales channel values2. Automated SFA lead routing system3. A lead management process to consistently
monitor results4. Channel accountability for closed loop management
with consequences
66
Lead Quality Levels 1-5
Target Qualification

Not for copy or distribution without written permission from Lenskold Group 33
67
Lead Quality, the Key to Sales Productivity and Closed Loop Tracking
� Enterprise leads are 100% telequalified� Rated consistently by the sales force in Siebel at 70% to 80% qualified
� Detailed Lead Notes outline business problem, decision process
OTN: PL1+IFFD+78 Create Date 5/25/04 Revenue: $400k Phase 2 Qualified COMPANY: Catalina Marketing Corp.; NEC phone system; Cisco data Infrastructure; 14 remote US offices; 2,000 total employees; 1,000 employees this location. BUSINESS OBJECTIVE: To improve communications through Improved efficiency; cost reduction. PROBLEM: Currently lacks a "design and implementation VoIP strategy"; currently has traditional PBXs in remote locations; uses TDM to router for 4-digit dialing; uses Cisco for VoIP at corporate. SOLUTION: Vision is to get rid of the PBXs and have a gateway/VoIP; leverage current infrastructure. VALUE: Solution will improve the efficiency of their process; will provide a pathway to VoIP; leverage their investment and give them the best technology for their dollars. POWER BASE : Arvind Arwana, Network Engineer, (DM), (727) 579-5301; [email protected] PLAN: Spoke with Arvind Arwana; decision by 6/30/04; information/proposals will be presented to upper management for approval; implementation to follow; budget will depend on cost/ROI; willing to be contacted within 2 weeks. NOTES: Arvind Arwana has not spoken to any Avaya representation for this initiative. Please feel free to contact me to discuss the background and details of this opportunity. Alice Hager 866 697 5565 x7069, [email protected].
68
Marketing Coding and Tracking for ROMI
� All Inquiries to Leads have tracking ID (Promo Code)� What was the source of the inquiry?
� Direct mail ( what list,what publication ect.)� Email Source code� Purchased registration inquiries from media or web.� Internal Sources: Tech and, Customer Support leads , the organization Web,
866GOAVAYA� Trade shows, seminars, road shows
� What was the cost of the lead source?� Final cost / lead = Cost to create inquiry + cultivation + qualification
� What are the lead inquiry conversion rates to qualified leads � Conversion rates vary from 3% to 70% per inquiry� Focus marketing investments on high conversion rates � Measure if marketing investments are hitting your target market. SMB
vs. Enterprise� Measure what is important …. Lead Pipeline and Revenue not the
number of leads generated. � 10,000 Junk leads are still Junk…

Not for copy or distribution without written permission from Lenskold Group 34
Setting Business Rules for Lead Routing� Business Partners must meet specific criteria to have access to leads
� Product / support certification to be qualified to sell solution� Geographic authorization to sell with in the specific market
� Have physical sales and support coverage with in the market
� Reward BP Certification investment / commitment� BP with Gold and Platinum certification get greater access to leads
� New capabilities will allow automated specialized routing rules for products requiring higher channel competency to implement more complex solutions.
� Build sales results from leads into future lead allocations � Increased focus on sales feedback of specific BP effectiveness and
competency to determine lead allocations and preferences
� On going lead management performance will determine future leads� Reward and penalize based on performance
70
How Do You Get Sales Compliance for Lead Follow Up?� Sales must perceive real value in the leads
� No system will give you feedback if sales does not value the leads
� Must establish the cost of quality leads is timely and accurate feedback “no feedback, no leads”� With Business Partners must establish “consequences”
� Good follow up, feedback and results = increased leads � Poor follow up, feedback and results = less or no leads
� Requires active lead management participation by Sales to reinforce closed loop compliance � Sales owns the channels and has responsibility to work with BPs to maximize ROI from leads
(quality lead metrics helps elevate management discussions)� SFA / PRM systems are growing increasingly sophisticated, w/ routing and
management tools to enable targeted routing strategies. � Automation allows fine tuning where you want your leads to go.
� Closed loop compliance takes time, education and quality metrics� It was more than a year of consistent management before we started to get good
feedback� Required improved Siebel and Blue Roads discipline from sales and channel
management

Not for copy or distribution without written permission from Lenskold Group 35
71
New automated routing capabilities in defining channel partner eligibility
� Increased sophistication in being able to target those BP that have the highest probability of success
� Leads can be assigned to Partners that match a combination of the following criteria � By Partner Certification level ( Gold, Silver Bronze)� By Industry specialization skills ( Government, Healthcare ect.)� By Product and solution skills and competency � By Geographic / territory coverage� By Channel Type Systems Integrator, VAR or Distributor� By existing BP business relationships � By Sales rating of ability to win the business
� Building automated routing rules based on those factors that reward your BP that have demonstrated solutions competency , ability towin business with high customer satisfaction
72
Push vs. Pull Lead Routing
� Blue Roads innovated the use of “Push vs. Pull” routing systems � “Pull” is allowing selected Business Partners to compete for leads� We have found that the “Pull” lead process results in a much higher
closed loop management results� Movement from “entitlement “ to “competition” for leads� We have more control the Business Partner behavior through
� Leveraging multiple criteria to optimize eligible BP by market
� Reward with access to leads based on authorization, certification, market coverage and lead management performance
� Lead limits at the Business Partner or Sales rep level
� “Push” leads exception: Honoring established business relationships � Leads from accounts with existing relationships are protected
� Closed loop performance is significantly poorer from these leads

Not for copy or distribution without written permission from Lenskold Group 36
73
“PULL” via the “Shark Tank”
� Shark Tank offers multiple selected BP the opportunity to compete for leads
� BP Sales reps are notified by email and have opportunity to select leads from lead web site� Partners select the leads they are interested in� Defined lead limits prevent a single BP from sweeping all leads � Must work leads successfully to be eligible for new leads.
� Lead matching with the right Partner is established in the lead routing rules based on multiple criteria � Area of expertise (Product)� Location of prospect (Territory)
� Optimal matching between Lead & Partner is key to success� Hungry, available, and confident sales people follow up
74
Lead Management Process Overview
Generates Lead
Existing Relationship
Assigns Org Leads to Partners
Partner
Assigns Lead to Reps
Partner
Rep Picks Lead from the Shark Tank
Partner
Works the Lead
Partner
Provide Feedback
Partner
Close the Sale
OR

Not for copy or distribution without written permission from Lenskold Group 37
75
Looks Perfect!Let’s Just Turn It On…..It doesn’t work that way!
� It only works if you actively manage it!
What were the results year 1? New Business Partner Routing System� First Quarter: 10% of leads in active reporting status� Second Quarter: 19% of leads in active reporting status
� No active management at Field Channel Level � Third Quarter: 45% of leads in active reporting status
� Mid -third quarter implemented consolidated lead reporting at the Channel Management and Channel Partner level
� Fourth Quarter: 78% of leads in active reporting status
� 2008 we will be involving our sales channels in helping to evaluate and prioritize based on criteria which partners leads should go to. � More focus on BPs who demonstrate success.
76
1. Closing the Loop
� Establishing credibility = quality product� Automated lead routing systems
� No manual delays or roadblocks� Routing rules to right sales rep� Lead management tools for sales� Involve sales / channel management in lead routing rules
� Educate and evangelize � Publicizing the results for management � Buy in / funding & political support
� Pick your shots direct vs. indirect channels � More control in direct channel vs. indirect

Not for copy or distribution without written permission from Lenskold Group 38
77
2. Education: “These leads are different!”
� Starting point is quality = Value to sales � Building credibility: Sales perception is most leads in
the past have been junk � Proof sources for lead quality. Sales feedback, Siebel
Tracking, objective 70-80% qualified� Follow up and research unqualified leads to improve quality
� Is it the lead or the sales follow up?
� Build the relationships between sales and telequalification agents results in continually improved agent skills and lead quality
� Sales is our “Customer” they have to be happy with the leads.
78
3. Consistent Lead Management Process
� Simplify lead management system� Consolidate and simplify the reporting � Roll up performance from sales rep to regional VP� Manage the exceptions. 80/20
� Provide visibility on leads weekly � Executive, Sales and Marketing Management � Target responsibility to the first line sales managers
� Build the lead management process through 1/1 sales management training� Consistent reinforcement weekly

Not for copy or distribution without written permission from Lenskold Group 39
79
Visibility and Accountability � Weekly Field Reporting Stack Ranks
� (sample data)
FY 2006 Standing as of 6-12-2006
Rank Region Field Channel Manager Pending Won
Lost / Unqualified Active Grand Total
% of Leads in Progress
1 North Joe Smith 1 13 44 88 134 65.7%
2 Tri-State Joe Smith 0 12 19 26 45 57.8%
3 West Pete Wilson 0 17 36 50 88 56.8%
4 Central Atlantic Art Pansing 1 11 57 79 140 56.4%
5 Southwest Judy McBride 2 10 33 43 78 55.1%
6 Great Northern Pete Wilson 4 5 61 79 144 54.9%
7 Southeast Art Pansing 3 7 71 62 137 45.3%
8 Great Lakes Judy McBride 0 6 54 42 97 43.3%
Grand Total 11 81 375 469 863 54.3%
RankSales User Organization Name Pending Won
Lost / Unqualified Active Grand Total
% of Leads in Progress
1 High tech supply 0 2 1 10 11 90.9%
2 English NETWORKS INC. 0 4 5 14 19 73.7%
3 Hot Source Inc. 0 4 5 14 19 73.7%
4 Tech Industries of North America Inc. 0 3 5 12 17 70.6%
5 Data Industries of North America Inc. 0 8 15 35 51 68.6%
6 Strategic Vision Products & Services 0 7 15 30 45 66.7%
18 Technology Telecom Group Inc 0 1 13 11 25 44.0%
19 Advanced Tech, Inc. 0 2 9 8 19 42.1%
20 ECB 0 0 8 3 11 27.3%
21 Might slo Telephone Group, Inc. 0 0 13 4 17 23.5%
Grand Total 0 81 235 326 569 57.3%
Region Ranking by % of Leads in Progress / Active S tatus
BP Lead Ranking by % of leads in Progress/ Active Status
80
Key Components for Success
� Executive charter and management buy-in for a centralized methodology/ Infrastructure investment
� Cultivating inquiries into leads before sending to sales force
� Establishment of credibility of lead program based on lead quality
� Consistent reporting on lead management down to sales level
� Automated systems to route leads and provide performance metrics
� Evangelize and educate value of program

Not for copy or distribution without written permission from Lenskold Group 40
81
Closed Loop Lead Management is Possible
� But it is not easy, cheap nor fast.� We have spent 7 years at this process, with consistent
management and evolving process� We are constantly evolving from where we find opportunities to
how we route the leads� We have become “THE” credible source of data and metrics.� We have become much more “Metrics” driven in how we spend
our marketing $$ based on results from this system. � We still do not have the level of integration from the SFA system
to the financial systems.� The company is committed to providing quality leads to our sales
channels
82
For Questions and Comments
� Dennis Head� [email protected]� 303 538 3400