Marketing Effects on Consumer Retention and Expenditures ...
52
Western Kentucky University TopSCHOLAR® Masters eses & Specialist Projects Graduate School Summer 2015 Marketing Effects on Consumer Retention and Expenditures in Central Kentucky and North Central Tennessee Floral Industry Danielle L. Berkshire Western Kentucky University, [email protected] Follow this and additional works at: hp://digitalcommons.wku.edu/theses Part of the Agricultural Economics Commons is esis is brought to you for free and open access by TopSCHOLAR®. It has been accepted for inclusion in Masters eses & Specialist Projects by an authorized administrator of TopSCHOLAR®. For more information, please contact [email protected]. Recommended Citation Berkshire, Danielle L., "Marketing Effects on Consumer Retention and Expenditures in Central Kentucky and North Central Tennessee Floral Industry" (2015). Masters eses & Specialist Projects. Paper 1516. hp://digitalcommons.wku.edu/theses/1516
Transcript of Marketing Effects on Consumer Retention and Expenditures ...

Western Kentucky UniversityTopSCHOLAR®
Masters Theses & Specialist Projects Graduate School
Summer 2015
Marketing Effects on Consumer Retention andExpenditures in Central Kentucky and NorthCentral Tennessee Floral IndustryDanielle L. BerkshireWestern Kentucky University, [email protected]
Follow this and additional works at: http://digitalcommons.wku.edu/theses
Part of the Agricultural Economics Commons
This Thesis is brought to you for free and open access by TopSCHOLAR®. It has been accepted for inclusion in Masters Theses & Specialist Projects byan authorized administrator of TopSCHOLAR®. For more information, please contact [email protected].
Recommended CitationBerkshire, Danielle L., "Marketing Effects on Consumer Retention and Expenditures in Central Kentucky and North CentralTennessee Floral Industry" (2015). Masters Theses & Specialist Projects. Paper 1516.http://digitalcommons.wku.edu/theses/1516

MARKETING EFFECTS ON CONSUMER RETENTION AND EXPENDITURES
IN CENTRAL KENTUCKY AND NORTH CENTRAL TENNESSEE FLORAL
INDUSTRY
A Thesis
Presented to
The Faculty of the Department of Agriculture
Western Kentucky University
Bowling Green, Kentucky
In Partial Fulfillment
Of the Requirements for the Degree
Master of Science
By
Danielle Louise Berkshire
August 2015


iii
ACKNOWLEDGEMENTS
I would like to first thank God for blessing me with the health, and strength to
accomplish my Masters Degree.
I would like to thank Mr. Roger Dennis for instilling in me the passion of floral
industry. Thank you for pushing me to become a better designer and student of life. If it
wasn’t for your introduction to floral design class, I don’t know where I would be today.
Thank you to Dr. Stephen King and Dr. Linda Brown, for giving me the
opportunity to work under you. Thank you for taking the time out of your busy schedules
to answer questions about surveys, and suggestions for my thesis. This project wouldn’t
have been possible without you.
Thank you to Mr. Hunter Galloway, for your help and support in analyzing the
data for this research.
Thank you to Dr. Elmer Gray, Dr. Jack Rudolph, and Ms. Debbie Gabbard for
your support and encouragement along the way.
A special thank you to my parents Dan and Sara Berkshire. It was because of your
love and support I was able to accomplish my Masters degree.
Thank you to the florists and consumers who completed the surveys, this project
wouldn’t have been possible without you.
Thank you to the Department of Agriculture and the Department of Graduate
Studies for funding for this project.

iv
CONTENTS
Introduction………………………………….…………………………………………….1
Literature Review………………………………………...………………………………..3
Materials and Methods……………………………………...……………………………12
Results…………………………………………………………………………………....14
Discussion………………………………………………………………………………..30
Conclusion……………………………………………………………………………….34
Literature Review………………………………………………………………………..35

v
LIST OF FIGURES
Figure 1. Main Form of Marketing: Website…………………………………………….18
Figure 2. Target Market: 20 Years Old or Younger....…………………………………..19
Figure 3. Member of a Wire Service………………………………………………….....20
Figure 4. Consumers Main Methods of Purchasing Flowers: Telephone………………..24
Figure 5. Consumers Main Method of Purchasing Flowers: Walk-in…………….……..25
Figure 6. Consumers Purchasing Gifts or Flowers for: Themselves…………….………26
Figure 7. Consumers Purchasing Gifts or Flowers for: Family………………………….27
Figure 8. Consumers Purchase Flowers for: Special Occasions……………...…………28
Figure 9. Consumers Purchase Flowers for: Funeral…………………………………….29

vi
LIST OF TABLES
Table 1. Population Statistics of Florists………...………………………………………17
Table 2. Population Statistics of Consumers………………………….…………………23

vii
APPENDIX
Appendix A. Florist Cover Letter………………..………………………………………36
Appendix B. Florist Survey………………….…………………………………………..37
Appendix C. Consumer Cover Letter……………………………………………………40
Appendix D. Consumer Survey………………………………………………………….41

viii
MARKETING EFFECTS ON CONSUMER RETENTION AND EXPENDITURES IN
CENTRAL KENTUCKY AND NORTH CENTRAL TENNESSEE FLORAL
INDUSTRY
Danielle Berkshire August 2015 42 Pages
Directed by: Linda Brown, Stephen King, and Roger Dennis
Department of Agriculture Western Kentucky University
Florists in today’s industry are competing against mass-markets that are able to
buy and sell fresh-cut flowers at low prices in bulk. Mass-markets offer little or no design
or other services. Consumers find it convenient to order flowers online through wire
services, paying large fees to order flowers. Order gatherers pose as local floral shops
taking consumers orders online or by phone then call the local florist to fill orders.
Packaged flowers became popular in the early 2000’s ordering flowers directly from the
farm to the consumer.
Rural and metropolitan areas of Central Kentucky and North Central Tennessee
were surveyed. Florists were selected within a 160 – mile driving distance of Bowling
Green, Kentucky. Florists were identified through an Internet search for florists in each
county and also the Teleflora database. Survey data were analyzed using Statistical
Analysis System 9.3. Ordinal data were analyzed using PROC NPAR1WAY, and
Kruskal –Wallis Analysis. Wilcoxon analysis was used for individual treatment
separation. This study results had 103 florists’ surveys and 321 of their returning
consumer surveys. This study examined correlations in the florist’s survey studying the
relationships between marketing effects verses repeat consumers. The consumer survey
examined the relationships between when and what consumers purchased arrangements
for and the average price per arrangement. Florists using websites as their main form of

ix
marketing increased their number of return consumers. Florists targeting consumers 30
years old and younger had more repeat consumers. Consumers whose main method of
purchasing was telephone increased their price per arrangement. Walk-in consumers
spent less money per purchase.
Florists who contributed to this study will receive summary of the results,
permitting them to benefit from their contribution
1
INTRODUCTION
The floral industry is inherently different from other businesses, including high
levels of service with a tangible product. In the last few decades consumers have been
able to purchase flowers at the equivalent of fast-food outlets, for example, mass-markets
(Becker, 1997). Almost all traditional retail florists carry essentially the same goods;
florists must distinguish themselves by performing better than the competition (Becker,
1997).
According to the American Institute of Floral Designers “a florist is a person or
business entity associated with the sale of flowers, plants, or other related products”
(AIFD, p.300). A florist must be a designer, businessperson, and advisor. A designer
must arrange flowers in a pleasing manner. A businessperson must sell perishable flowers
and the products available in the display room. An advisor informs the consumer on the
product desired for a range of special events.
Consumers are diverse, some are indecisive and want the florist to tell them what
they should purchase. Others know what they want and have no questions or want any
suggestions. Differences among marketing and targeted consumers are especially
important for retail full service floral shop success. Retail full service floral shops offer
floral services through weddings, funerals, gift shops, and other special events.
There has been a marked decrease in the number of floral shops over recent
years. Several marketing developments have been identified as partial reasons for the
decrease. These changes include: (1) mass-markets, (2) wire service, (3) order gatherers,
and (4) packaged flowers.
2
Retail florists in today’s industry are competing against mass-markets that are
able to buy and sell mass-produced fresh cut flowers at lower prices. These mass-
markets offer little design to no design or other services. Florists are also competing
against order gatherers. Consumers order from order gatherers who in turn contact a local
floral shop to fill the consumers order. Wire services pose a threat to local retail full
service floral shops. Stores that receive more incoming wire orders than outgoing wire
orders are negatively impacted by wire service commissions and membership fees. In the
early 2000’s packaged flower shipping became popular. Flowers are advertised and
shipped directly from the grower to the consumer therefore totally bypassing the retail
full service floral shop.
Overall, these developments in flower marketing have made it more challenging
for florist to maintain a profitable business. The relative acceptance of the marketing
developments by the florist industry and their preference by consumers will be the
determining factor in the future success of retail full service floral shops. This survey
study based upon collection and analysis of knowledge and experience of current florists
and consumers will provide more understanding of the present status and future direction
of retail full service floral shops in Central Kentucky and Tennessee.

3
LITERATURE REVIEW
Current Trends in the Floral Market
In the 1950’s grocery stores began selling annual bedding plants to increase
seasonal surpluses for local growers (Behe, 1993). Sales of floral products through mass-
markets have steadily increased since that time. Today, many in the floral industry have
perceived mass-markets to be the strongest competitors of retail florists (Behe, 1993).
Therefore, the total number of other floral outlets has continued to increase. Flowers are
available for purchasing online, at farmers markets, street vendors, mass-markets,
traditional floral shops, and direct to consumer outlets (Behe, 1993). Also, consumers
patronize more than one consumer outlet depending on their needs. They may buy
flowers at mass-markets for convenience such as use for the kitchen table. However,
when it comes to funerals, weddings, or flowers for delivery, consumers will go to the
local retail full service floral shop.
Mass-Markets
The three most important services a floral supplier can provide are product quality
maintenance, order and delivery reliability, and product availability (Behe, 1993). In a
later study of consumer perceptions of service quality in the Texas retail floral industry
Becker, et al. (1997) found consumer expectations of florists and those of mass-market
consumers were very similar. Yet, the florist consumers perceived that their retailer was
providing better quality service than mass-markets consumers perceived their outlet was
providing. Overall, florists were meeting their consumers’ expectations while mass-
markets were not, placing traditional retail florists at a competitive advantage.

4
Consumers’ Levels of Purchase
Behe (1993) classified consumers into four groups: (1) no floral products were
purchased, (2) flowers were purchased as gifts on special occasions and events with few
personal plant purchases, (3) consumers purchased more plants for personal use while
maintaining or increasing floral gift purchases, and (4) a higher proportion of floral gift
purchases were made along with regular plant and some flower purchases for personal
use (Behe, and Wolnick, 1991). Consumer floral knowledge was found to increase the
level of floral purchases. For example, more blooming plants were purchased as a
consumer acquired knowledge about flowers and plants. Also, increase in the number of
purchases resulted in increase number of fresh flowers purchased (Behe and Wolnick,
1991).
Consumer Floral Knowledge and Education
Behe and Wolnick (1991) reported that florists should offer workshops on
blooming and indoor plants to encourage consumer floral education. Building
relationships and helping increase consumer’s knowledge of plants will lead to more
frequent buys at the floral shop. “Flowering plant consumers, who tend to be older, may
have acquired more floral knowledge (experience) through other additional life-long
experiences, such as observing others cultivating plants in their homes and gardens. Fresh
flower consumers were younger and more likely employed outside the home than
flowering plant consumers” (Behe and Wolnick, 1991).
Generation Y
Studies have shown Generation Y individuals were dissatisfied with several floral
product attributes, including short longevity, lack of trendiness, relative high cost, lack of
5
appropriateness, and lack of uniqueness (Rihn, et al., 2011). Florists are concerned with
the dissatisfaction and lack of flower use of the younger generation. Designers have a
difficult time going to conferences or furthering education classes on learning new trends
due to a limited number of employees. In turn this results in more responsibility and less
time away from the shop. Because of such time constraints, florists find it difficult to give
more attention to new trends thus appearing as though they lack in creativity.
Social Media
The Internet does not have to be for order-gathers only (Westbrook, 2014). Social
media is a great way to build local relationships. Choosing the right social media,
references, review websites, email marketing and other inbound marketing tools are just
as intimidating (Sogueco, 2015). Ten years ago, florists used a mix of traditional print,
radio, TV ads and email marketing. These were usually good enough, so investing in
online ads was optional (Sogueco, 2015).
Today more than 80 percent of shoppers start their retail quest using a search
engine. Not all are looking for a florist but what about the bride looking for a wedding
florist, grieving family in search of a fitting tribute, or an executive in need of a thank
you gift? (Sogueco, 2015) Rather than wait for the phone to ring florists must go out and
sell and build their brand (Westbrook, 2014).
Sogueco (2014) suggested in “Floral Management” on “Defy Your Size Online”
that marketing online include Twitter, Facebook, and Google+ websites. He also
recommended florists keep in mind quality over quantity, and they will get more
qualified traffic to their site. Given its role in the shops performance, florists must invest
in their website- continuously fueling its growth and performance (Sogueco, 2014).

6
Online engagement is the goal. Social media is where the customers live today.
As you may have discovered, quality posts featuring photos and videos, draw in the most
comments and shares, therefore, florists need to keep people entertained. Posts should
reflect the vibrant activity of the florists core business (Sogueco, 2014).
Facebook is the dominant social networking platform with over 1 billion users.
(Sogueco, 2015) Selby Shy of Shirley’s Flowers and Gifts shared tips on how to market
online to Facebook users. “Facebook ads allow florists to very specifically target
customers. One ad could target women in the area who are engaged and who have not
already liked my page” (Westbrook, 2013).
The people who have liked the business page may only see a small percentage of
the posts, because Facebook uses a new algorithm to measure reader engagement and
interest and determine which posts reach which fans. A Facebook representative could
not confirm the percentage of posts that reach business fans organically; in the past the
number has been reported as less than 20 percent (Westbrook, 2013).
Facebook allows promotion of any post created after June 2012, by clicking the
promote tab underneath the item, for as little as five dollars. Florists can set a budget and
then have the option to apply filters. For example for Valentine’s Day posts, florists can
target men in their area. Promoted posts appear in news feeds as “sponsored post” and as
people like, share and comment on the post, they’re seen by an ever wider audience-
friends of the people who already like your page (Westbrook, 2013).
Sogueco (2015), wrote an article in “Floral Management” on “Search and
Rescue.” He talks about how florists can have a meaningful presence online. Social
7
media, blogs, and online reviews may be hot topics in Internet marketing, but the main
purpose of these online references is to drive inbound traffic to the shops site (Sogueco,
2015). Florists should write content for their consumers on their websites. Using
complete sentences and correct grammar. Bold certain keywords, such as names of
venues, flower varieties or flower care phrases, such as “flower care packet.” Link these
words to other pages within the website that provide deeper explanations (Sogueco,
2015).
Naming local venues is a smart practice because people will Google those names.
When florists attach their name to those venues, florists also have relevant, and most
important, local references. Incorporating them as much as possible in all the content
within your site (Sogueco, 2015).
Based on conventional wisdom that Google indexes check websites for changes
every two weeks. The algorithm checks back more frequently with sites that change. If
post did not change for five consecutive visits by the algorithm, the site will get bumped
down in search results. Google will always weigh fresh content higher than stale content
(Sogueco, 2015). In order for this to be a strong inbound link, florists shop blog must
change often. Preferably every day providing users with ample opportunity to click and
linger within your site and confirms you have lots of expertise already found within the
website (Sogueco, 2015).
Facebook is truly its own special version of the Internet, without collaborating
with anyone else, including Google, which can’t consistently index Facebook posts, or
Pages (Sogueco, 2015).
8
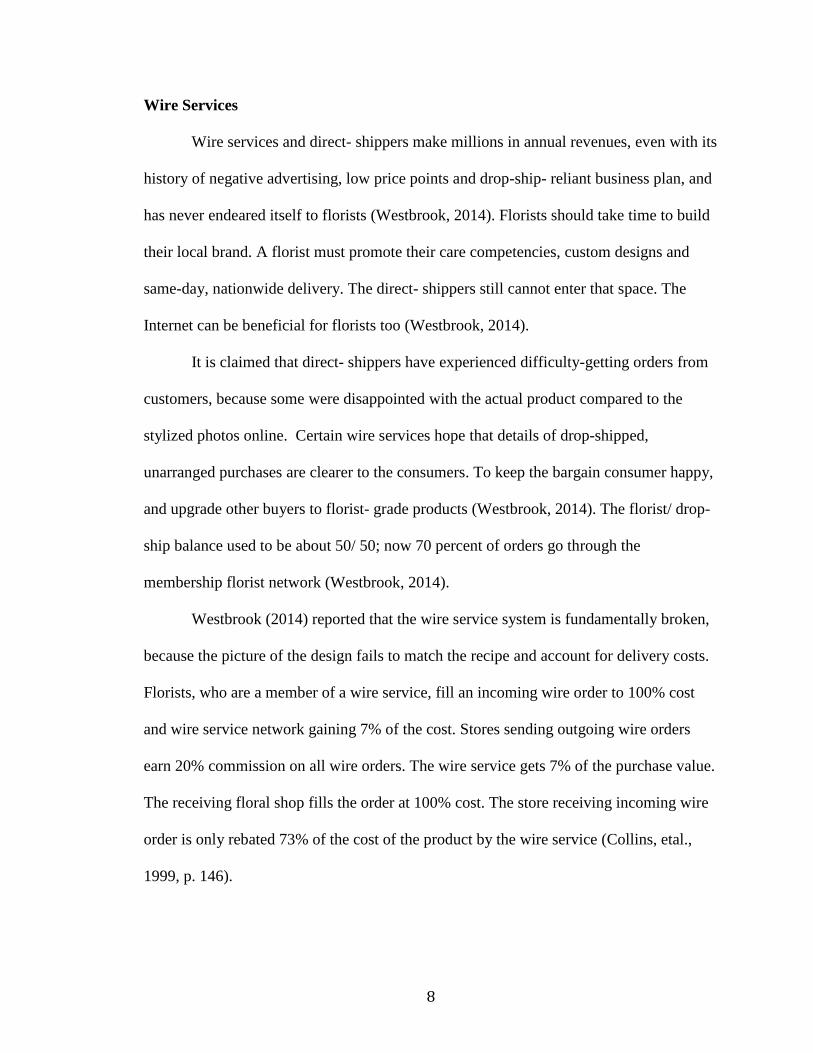
Wire Services
Wire services and direct- shippers make millions in annual revenues, even with its
history of negative advertising, low price points and drop-ship- reliant business plan, and
has never endeared itself to florists (Westbrook, 2014). Florists should take time to build
their local brand. A florist must promote their care competencies, custom designs and
same-day, nationwide delivery. The direct- shippers still cannot enter that space. The
Internet can be beneficial for florists too (Westbrook, 2014).
It is claimed that direct- shippers have experienced difficulty-getting orders from
customers, because some were disappointed with the actual product compared to the
stylized photos online. Certain wire services hope that details of drop-shipped,
unarranged purchases are clearer to the consumers. To keep the bargain consumer happy,
and upgrade other buyers to florist- grade products (Westbrook, 2014). The florist/ drop-
ship balance used to be about 50/ 50; now 70 percent of orders go through the
membership florist network (Westbrook, 2014).
Westbrook (2014) reported that the wire service system is fundamentally broken,
because the picture of the design fails to match the recipe and account for delivery costs.
Florists, who are a member of a wire service, fill an incoming wire order to 100% cost
and wire service network gaining 7% of the cost. Stores sending outgoing wire orders
earn 20% commission on all wire orders. The wire service gets 7% of the purchase value.
The receiving floral shop fills the order at 100% cost. The store receiving incoming wire
order is only rebated 73% of the cost of the product by the wire service (Collins, etal.,
1999, p. 146).

9
Florists must be disciplined when developing products that will delight consumers
and result in a profit. Many florists make a profit filling orders. Higher order values help
to increase a florist’s profitability. In addition to being profitable, another benefit of an
incoming order for a florist is to gain a potential new customer. A new customer is
invaluable for florists (Westbrook, 2014).
Floral Preservatives
The issue for florists is to market to the younger generation. A study by Rihn, et
al. (2011) studied Generation X and Y consumers; attitudes toward fresh flowers as gifts
and found Generation Y participants prefer more practical, long- lasting gifts that
reflected their sentiments. They do not like spending more on perishable luxury items.
Florists marketing the use of preservatives in floral arrangements could increase
longevity and appeal of fresh cut arrangements sold to the Generation Y. Jenkins et al.
(2013) studied the influence of consumers’ knowledge of floral preservatives and found
that participants became more convinced of their value after reading about their function
and effectiveness.
They expressed willingness to pay more for a floral arrangement treated with
floral preservatives (Jenkins, et al., 2013). Adding preservatives to the arrangement
increased consumer satisfaction and profit margins. The study results showed a
significant negative correlation (p<0.01) between age and willingness to pay. The
younger the respondent the more willing they were to pay more for the use of floral
preservatives. Based upon the study results, educating Generation Y about floral
preservatives could potentially increase the appreciation for and interest in purchasing
flowers.
10
Four P’s of Marketing
In order to increase the use of fresh floral products as gifts (Rihn, et al, 2011) with
Y Generation consumers, florists should consider being knowledgeable on the four P’s of
marking. “Including product, price, promotion, and placement. The product is a good,
service, or idea that satisfies the consumer’s needs such as a bouquet or a florist’s design
and delivery services. The price is what is exchanged for the product and the promotion is
used as a means of communication between the seller and buyer. Promotions include paid
commercials, advertisements, Internet pop-up advertisements, and word of mouth.
Placement is the means of getting the product to the consumer” (Rihn, et al., 2011).
Consumers Perception of Flowers
Florists having the knowledge about marketing could educate the younger
generation toward a more positive outlook on flowers. Huang (2005) found consumers
have different preferences and attitudes regarding flowers, this study found that floral
behavior variables are interrelated. Higher income is not the primary variable for flower
purchasing, rather an increased number of floral purchases mainly depended on the
intended use of the floral products. Therefore, to encourage consumers to become heavy
flower users, marketing programs should aim at creating positive attitudes about flowers,
and create more reasons and occasions that motivate flower purchasing.
Self-Use and Gift Use
Huang (2007), reported results of a study on behavioral differences in pre-
purchase processes between buying flowers for self-use as opposed to gift use. He found
that gift users, were more likely to be “walk-in” consumers based upon their greater
propensity to refer to information in shop windows. When evaluating the alternatives,

11
self-users focused on three product values- longevity, quality, and price- whereas gift
users are more likely to be concerned about symbolic meaning and the situational value
of floral products.
Window Displays
Window displays are a convenient and affordable way of marketing. Placing the
product in the windows for consumers to view helps draw the customer into the store.
Designers must be creative in attracting attention of the consumers. Usually a product in
window displays sells quicker than other products. Huang (2007) compared shop
windows and newspapers/magazines, and found that personal preferences were more
influential for gift users’ flower purchase decisions. If self- users were more likely to be
drawn in by window displays than gift users, florists could market to self users in their
window displays. Therefore, showing symbolic meaning and situational value of floral
products.
The overall objective of the present study is to examine management practices
being currently utilized by retail full service floral shops in central Kentucky and
Tennessee and what their consumers expect in local retail full service floral shops. A
secondary objective is, exploring effects of market trends in relation to business success
of the shops. Increasing knowledge of florists in Kentucky and Tennessee on the floral
market trends that are popular among consumers.

12
MATERIALS AND METHODS
Study surveys were approved by Western Kentucky University Institutional
Review Board Committee.
Florists Surveys
Florists were selected within a 160 – mile driving distance of Bowling Green,
Kentucky. Florists were identified through an Internet search for florists in each county
and also the Teleflora database. Florists who were not in the Teleflora book or online but
found during the survey process were also included.
Surveys were conducted from January12-30 and again February 23- March 31 of
2015. Florists were not visited the week before or after Valentine’s Day because of the
busyness of the holiday period. Each floral shop was visited individually to increase the
chances of participation.
The owner/ manager of each floral shop was given an explanation of the process
and reasons why the research was being conducted. An emphasis was placed on its
importance to retail full service floral shops in Kentucky and Tennessee. Florists were
given a cover letter further explaining the project (Appendix A). An informed consent
document stapled to the survey included the basic description of the project’s purpose,
procedures, risks involved, benefits, confidentiality, and refusal/ withdrawal. All
participants were asked to sign the form to confirm participation. The florists survey
(Appendix B) consisted of 24 questions directed towards marketing trends, consumers,
business ownership, population and demographics.
Owners or managers were asked to complete the survey voluntarily on marketing
trends and consumer research during the interview. If florists agreed, they were then

13
asked to instruct 10 return consumers to fill out a consumer survey. The consumer was
instructed to give the survey back to the florists. The florists were given a post – stamped
envelope to return to Western Kentucky University Department of Agriculture. If florists
were too busy, a post stamped envelope with cover letter, consent forms, and surveys for
florists and consumers were left at the floral shop.
Consumer Surveys
Consumers were given an envelope with cover letter (Appendix C) explaining the
project, informed consent document that asked to sign to confirming participation, and a
consumer survey Consumers were asked by their local florists to complete a 12- question
survey (Appendix D). Consumer questions focused on purchasing patterns, factors
encouraging them to return, and population and demographic questions. All completed
florists and consumer surveys were to be returned by May 1st to the Western Kentucky
University Agricultural Department office.
Statistical Analysis
Data were analyzed by using Statistical Analysis System 9.3. The code used to
analyze the data were PROC NPAR1WAY during an individual treatment Kruskal-
Wallis Test and a PROC LOGISTIC during a logistic test (yes/no). Differences were
considered significant at an alpha = 0.05 and trending with an alpha between 0.05 and
0.10. Medians were calculated using PROC Means. Ordinal data were analyzed PROC
NPAR1WAY Kruskal – Wallis Analysis. Wilcoxon analysis was used for individual
treatment separation. Nominal data were analyzed using PROC LOGISTIC.
14
RESULTS
Results are based upon Kentucky and Tennessee florist and consumer surveys.
Survey questions were based upon floral shop management and attracting return
consumers. Questions were directed toward identifying marketing trends in populations
of Kentucky and Tennessee florists. Results were statistically analyzed to determine
significant differences.
The researcher visited 236 floral shops to obtain data for the study: 78 florists
completed the florist survey during the visit and took consumer surveys, 77 floral shops
were left with florist’s survey, and consumer surveys, 39 florists said no, 39 florists were
unavailable, and three immediately completed florist surveys without asking consumers.
Twenty- two florists surveys were returned by mail. Three hundred and twenty-one
consumer surveys were completed and returned. The florists and consumer’s response
rates were 44% and 21%, respectively.
Florists Population
Sample size consisted of 103 florists surveys. Florist’s participants were 78%
female, and 22% male. Participant’s state of location were 34% Tennessee, and 66%
Kentucky. The median age for florist’s participants were 54 years of age. The highest
percentage of florist were in there 60’s at 31%, the second highest percentage of florists
were in there 50’s. The lowest percent of florists were in there 20’s at .09%. Median
annual gross incomes of businesses were between 150,001- 200,000. The highest
percentage of florists had an income of 250,001 or higher at 31%. The second highest
income was 0- 100,000 at 25%. The lowest percentage of florist’s income was 200,001-
250,000 at 10%. Median highest degree or levels of education completed were some

15
college credit, but no degree. The greatest frequency of highest degree or levels of
education was some college credit, but no degree at 36%. The second highest percentage
of level of education was a high school graduate/ GED at 28%. A close third highest
level of education was a BA/ BS Program Graduate at 20%. The lowest percentage of the
highest level of education was less than a high school diploma at 3%.
Florists Survey Results
Repeat consumers are loyal consumers who experience something about the shop
or florist that causes them to return. Florists were asked how many repeat consumers they
had. Results indicated 6% 1-49; 11% 50-99; 16% 100-149; 10% 150-199; 13% 200-299;
10% 300- 399; 7% 400- 499; 27% 501 or more. Repeat consumers were affected by
several factors. The longer the business was in its current location the higher the number
of repeat consumers (P<0.01). The number of relocation did not affect the number of
repeat consumers (P=0.92). A trending significance (P= 0.0958) was found in the
number of floral shops in town vs. the number of repeat consumers a florist had.
Window displays had no significant impact on repeat consumers (P=0.78). Florists who
were listed in the yellow pages had no direct effect on repeat consumers (P=0.16).
Florists relying on website as their main form of marketing had more repeat consumers
(Figure 1).
Florists whose main form of marketing were newspaper, Facebook/Twitter,
phonebook, billboard, or word of mouth did not have more return consumers. Florists
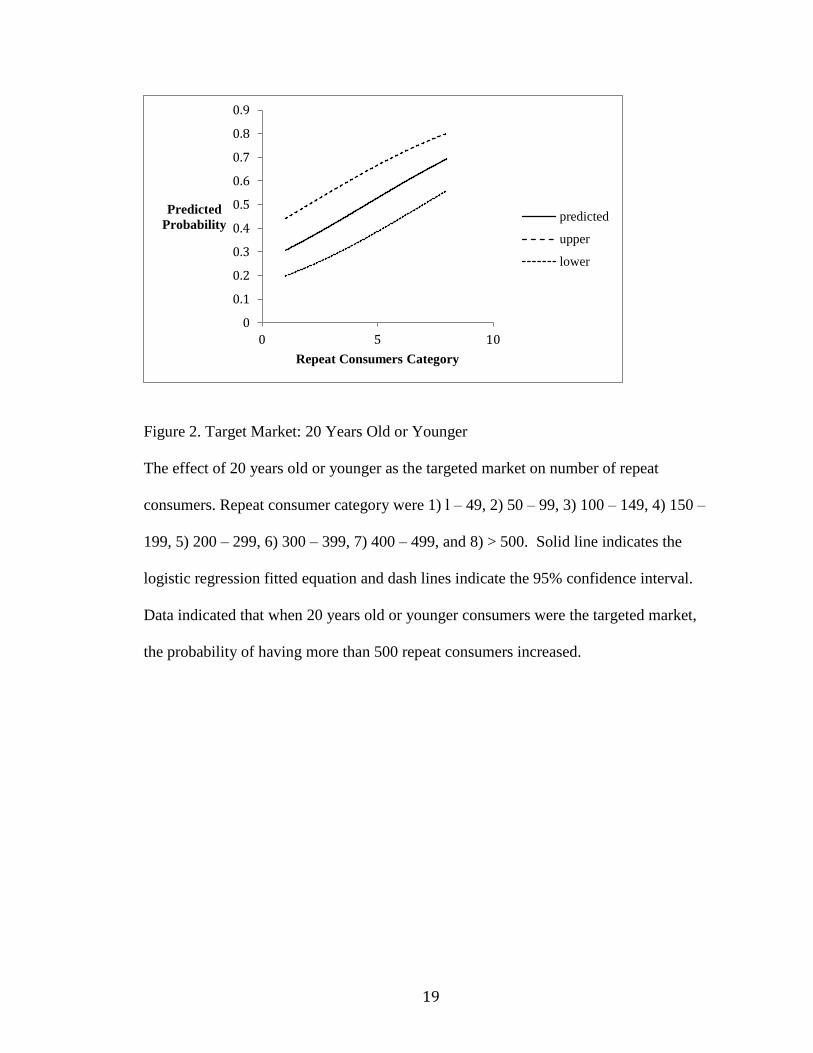
targeting consumers 20 years of age or younger increased the number of repeat
consumers (Figure 2). Florists targeting consumer’s 21- 30 years of age increased in
number of repeat consumers. Florists targeting consumers 31-40, 41-50, 51-60, or 61

16
years of age or older showed no increase repeat number of consumers. Florists offering
workshops or classes for consumers failed to increase the number of repeat consumers
(P=0.41). Location of florists downtown/ main street, edge of town, and strip mall/ retail
cluster had no impact on repeat consumers (P=0.92). When florists had more full time
and part time employees they had more repeat consumers (P<0.01).
Significance (P=0.048) was found in whom the floral shop was owned by.
Florists belonging to a wire service have more repeat consumers (P< 0.01) (Figure 3).
The number of delivery vehicles a florist had no increase the number of repeat consumers
(P=0.34).

17
Table 1. Population Statistics of Florists
Variable Median Mode
Gender Female Female
Age 56 51
Level of Education Some college credit, but no
degree
Some college credit, but no
degree
Further Education Once a year Never
Annual Gross
Income
150,001 - 200,000 250,001 or higher
State Kentucky Kentucky

18
Figure 1. Main Form of Marketing: Website
The effect of website as the main form of marketing on number of repeat consumers.
Repeat consumer category were 1) l – 49, 2) 50 – 99, 3) 100 – 149, 4) 150 – 199, 5) 200 –
299, 6) 300 – 399, 7) 400 – 499, and 8) > 500. Solid line indicates the logistic regression
fitted equation and dash lines indicate the 95% confidence interval. Data indicated that
when website was the main form of marketing the probability of having more than 500
repeat consumers increased.
0
0.1
0.2
0.3
0.4
0.5
0.6
0.7
0 5 10
Predicted
Probability
Repeat Consumer Category
predicted
upper
lower
19
Figure 2. Target Market: 20 Years Old or Younger
The effect of 20 years old or younger as the targeted market on number of repeat
consumers. Repeat consumer category were 1) l – 49, 2) 50 – 99, 3) 100 – 149, 4) 150 –
199, 5) 200 – 299, 6) 300 – 399, 7) 400 – 499, and 8) > 500. Solid line indicates the
logistic regression fitted equation and dash lines indicate the 95% confidence interval.
Data indicated that when 20 years old or younger consumers were the targeted market,
the probability of having more than 500 repeat consumers increased.
0
0.1
0.2
0.3
0.4
0.5
0.6
0.7
0.8
0.9
0 5 10
Predicted
Probability
Repeat Consumers Category
predicted
upper
lower

20
Figure 3. Member of a Wire Service
The effect of wire service as a form of marketing on the number of repeat consumers.
Repeat consumer category were 1) l – 49, 2) 50 – 99, 3) 100 – 149, 4) 150 – 199, 5) 200 –
299, 6) 300 – 399, 7) 400 – 499, and 8) > 500.Solid line indicates the logistic regression
fitted equation and dash lines indicate the 95% confidence interval. Data indicated that
when a florist was a member of a wire service the probability of them having more than
500 repeat consumers increased.
0
0.2
0.4
0.6
0.8
1
1.2
0 5 10
Predicted
Probabilty
Repeat Consumer Category
predicted
upper
lower

21
Consumers Population
Sample size consisted of 321 consumer surveys. Consumer participant’s genders
were 75% female, 22% male, and 3% did not indicate their gender. Participant’s state of
location were 34% Tennessee, and 64% Kentucky. The median ages for consumer
participants were in their 60’s. The highest percentage age group for consumers was 60’s
24%. The second highest percentage of age was 50’s at 21%. The lowest percentage was
in there 90’s at 2%. Median household gross annual incomes were 60,000- 89,999. The
highest income percentage was 60,000- 89,999 at 28%. The lowest income percentage
was 90,000 or higher at 16%. Median highest degree or levels of education were some
college credit, but no degree. The highest education percentage was some college credit,
but no degree at 31%. The second highest percentage was high school graduate/ GED at
30%. The lowest percentage of level of education was less than high school diploma at
5%.
Consumer Survey Results
Consumer’s main form of purchase online had no effect on the average price
spent on an arrangement. When the consumer’s main method of purchasing was
telephone they spent more on an arrangement (Figure 4). When the consumers’ main
method of purchasing was walk-in, the average price spent was less on an average
arrangement (Figure 5).
Consumers increased their price on purchasing gifts or flowers for themselves and
family (Figure 6 and 7). Consumers purchasing gifts or flowers for friends did not show
an increase in the amount spent on an arrangement. Consumers purchasing flowers for
holidays, weddings, or no reason did not increase in the price spent on arrangement.
22
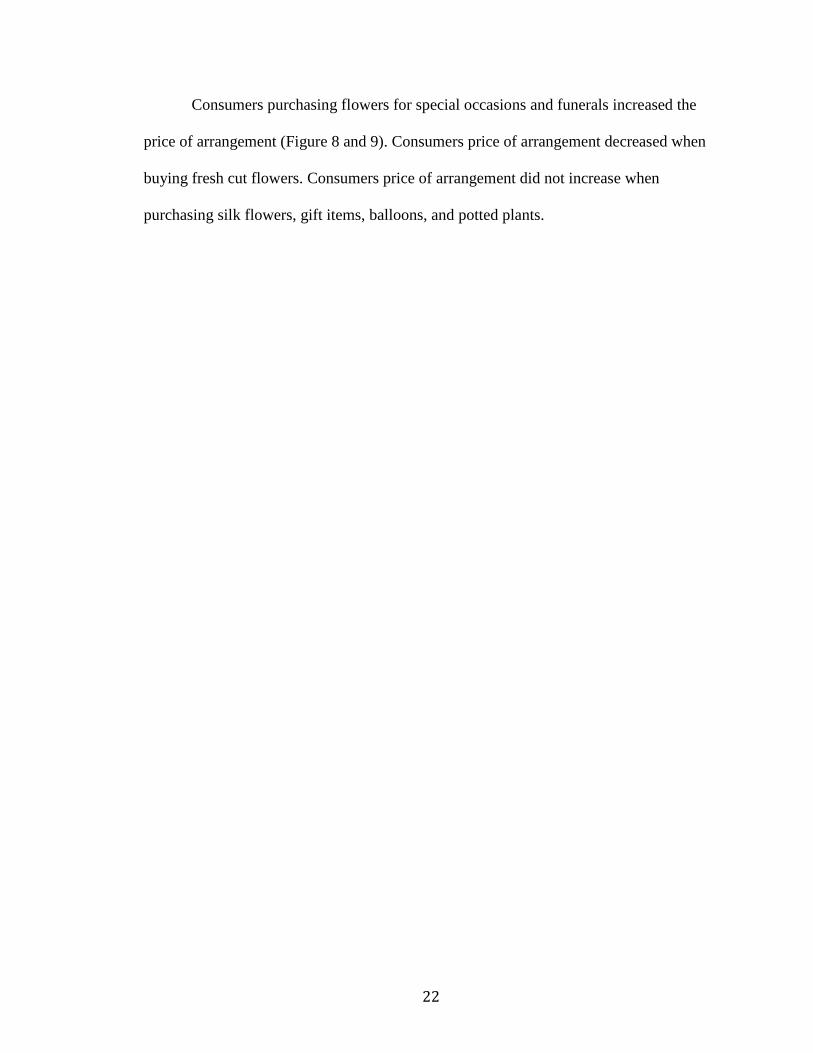
Consumers purchasing flowers for special occasions and funerals increased the
price of arrangement (Figure 8 and 9). Consumers price of arrangement decreased when
buying fresh cut flowers. Consumers price of arrangement did not increase when
purchasing silk flowers, gift items, balloons, and potted plants.

23
Table 2. Population Statistics of Consumers
Variable Median Mode
Gender Female Female
Age 53 65
Level of Education Some college credit, but no
degree
Some college credit, but no
degree
Annual Gross
Income
30,000 - 59,000 30,000 - 59,999
State Kentucky Kentucky
24
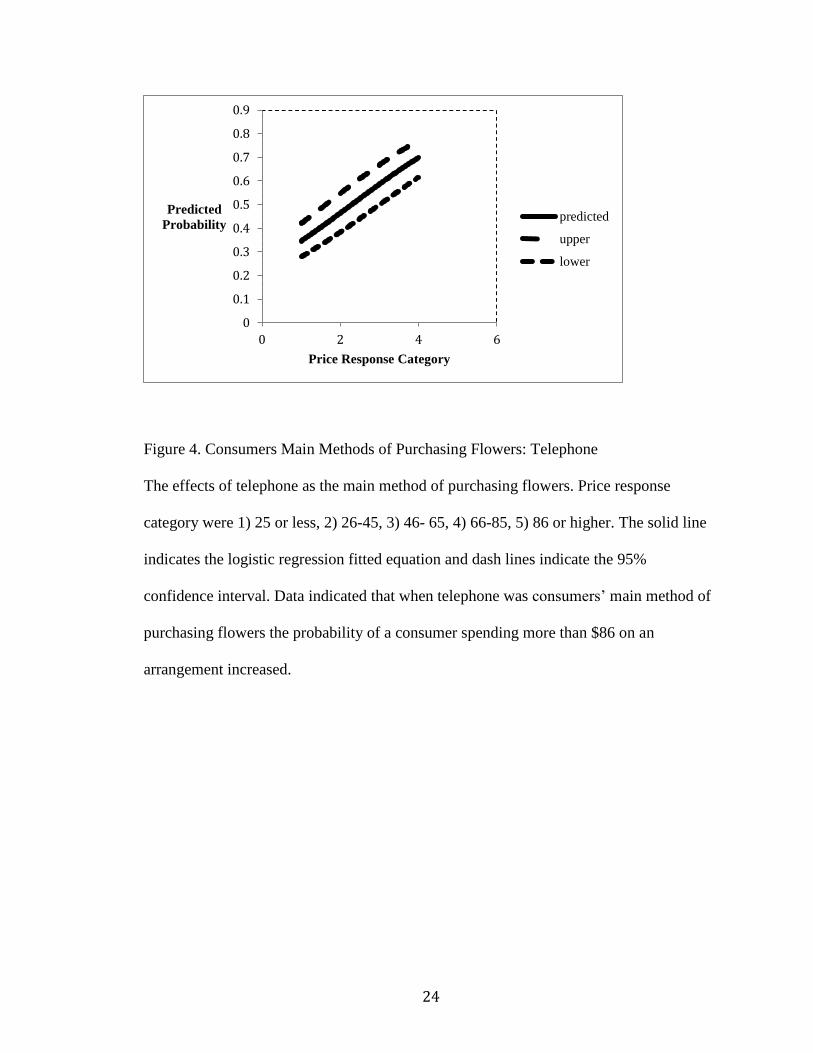
Figure 4. Consumers Main Methods of Purchasing Flowers: Telephone
The effects of telephone as the main method of purchasing flowers. Price response
category were 1) 25 or less, 2) 26-45, 3) 46- 65, 4) 66-85, 5) 86 or higher. The solid line
indicates the logistic regression fitted equation and dash lines indicate the 95%
confidence interval. Data indicated that when telephone was consumers’ main method of
purchasing flowers the probability of a consumer spending more than $86 on an
arrangement increased.
0
0.1
0.2
0.3
0.4
0.5
0.6
0.7
0.8
0.9
0 2 4 6
Predicted
Probability
Price Response Category
predicted
upper
lower
25
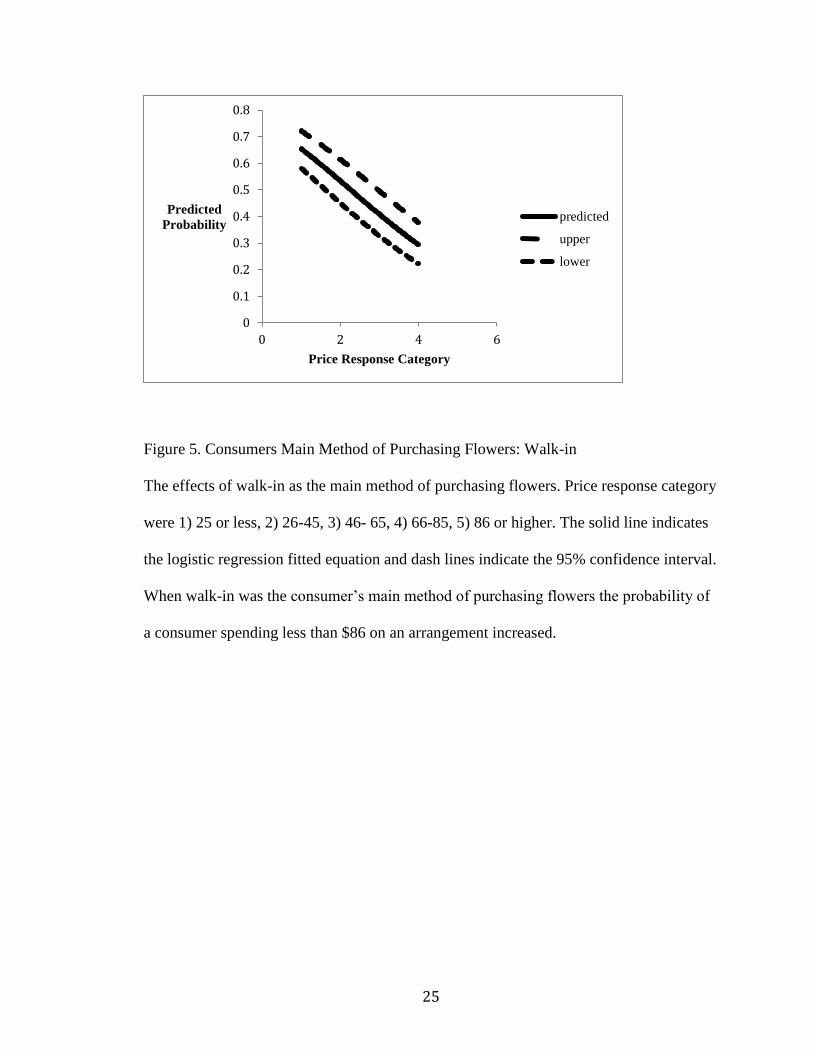
Figure 5. Consumers Main Method of Purchasing Flowers: Walk-in
The effects of walk-in as the main method of purchasing flowers. Price response category
were 1) 25 or less, 2) 26-45, 3) 46- 65, 4) 66-85, 5) 86 or higher. The solid line indicates
the logistic regression fitted equation and dash lines indicate the 95% confidence interval.
When walk-in was the consumer’s main method of purchasing flowers the probability of
a consumer spending less than $86 on an arrangement increased.
0
0.1
0.2
0.3
0.4
0.5
0.6
0.7
0.8
0 2 4 6
Predicted
Probability
Price Response Category
predicted
upper
lower

26
Figure 6. Consumers Purchasing Gifts or Flowers for: Themselves
The effects of purchasing flowers for ones self on consumer purchases. Price response
category were 1) 25 or less, 2) 26-45, 3) 46- 65, 4) 66-85, 5) 86 or higher. The solid line
indicates the logistic regression fitted equation and dash lines indicate the 95%
confidence interval. Data indicated that when consumers were purchasing flowers for
themselves the probability of a consumer spending more than $86 on an arrangement
increased.
0
0.1
0.2
0.3
0.4
0.5
0.6
0.7
0.8
0 2 4 6
Predicted
Probability
Price Response Category
predicted
upper
lower

27
Figure 7. Consumers Purchasing Gifts or Flowers for: Family
The effects of family for whom consumer purchases flowers. Price response category
were 1) 25 or less, 2) 26-45, 3) 46- 65, 4) 66-85, 5) 86 or higher. The solid line indicates
the logistic regression fitted equation and dash lines indicate the 95% confidence interval.
Data indicated family is whom consumers are purchasing flowers for the probability of a
consumer spending more than $86 on an arrangement increased.
0
0.2
0.4
0.6
0.8
1
1.2
0 2 4 6
Predicted
Probability
Price Response Category
predicted
upper
lower

28
Figure 8. Consumers Purchase Flowers for: Special Occasions
The effect of special occasions as when flowers are purchased on the average price spent
per arrangement. Price response category were 1) 25 or less, 2) 26-45, 3) 46- 65, 4) 66-
85, 5) 86 or higher. The solid line indicates the logistic regression fitted equation and
dash line indicate the 95% confidence interval. Data indicated that when consumers
purchase flowers for special occasions the probability of a consumer spending more than
$86 on an arrangement increased.
0
0.1
0.2
0.3
0.4
0.5
0.6
0.7
0.8
0.9
1
0 2 4 6
Predicted
Probability
Price Response Category
predicted
upper
lower

29
Figure 9. Consumers Purchase Flowers for: Funerals
The effect of funerals when flowers are purchased on the average price spent per
arrangement. Price response category were 1) 25 or less, 2) 26-45, 3) 46- 65, 4) 66-85, 5)
86 or higher. The solid line indicates the logistic regression fitted equation and dash line
indicate the 95% confidence interval. Data indicated that when consumers purchase
flowers for special occasions the probability of a consumer spending more than $86 on an
arrangement increased.
0
0.1
0.2
0.3
0.4
0.5
0.6
0.7
0.8
0.9
1
0 2 4 6
Predicted
Probability
Price Response Category
predicted
upper
lower

30
DISCUSSION
Florist Surveys
The florists survey data were used to find marketing trends in the retail full
service floral shops of Central Kentucky and North Central Tennessee. Floral shops that
remained in their current location the longest time had a greater number of repeat
consumers. Consumers can rely on florists being in their current location, and avoid a
search; are more likely to return.
Window displays are used to draw potential consumers into the store. Other
studies reported consumers who make personal purchases relied more heavily on shop
windows and newspapers/ magazines as external information sources than consumers
who purchased for other people (Huang, 2007). The data in this study did not support the
previous research. Consumers typically come to the shop to buy gifts for others. Other
studies reported when consumers were purchasing a product to be a gift personal
preference was more influential for a flower purchase than shop windows.
Florists who were listed in the yellow pages did not have an effect on the number
of return consumers. Florists who are listed in the yellow pages increase their chances for
new consumers, but return consumers should already have contact information for the
florist. Yellow pages are not used as frequently now that Tech industry experts estimate
that Google processes roughly 2 million searches every second (Sogueco, 2015). More
than 80 percent of shoppers started their retail request using a search engine (Sogueco,
2015).
Florists who used a website for their main form of marketing showed a higher
number of repeat consumers. They can share their work and the products in their shop.
Consumers can shop at the convenience using their home computers and call or walk-in
31
store to buy the products. Online presence is the goal. Social media is where your
customers live today (Sogueco, 2014).
Florists want to be diversified and cater to a wide variety of consumers. The
results of the present study found when florists targeted 20 years old or younger
consumers they had a higher number of repeat consumers. Consumers who are in the age
group of 20 years old or younger are not stable in a job or home. Consumers this age are
going to school, and are living on a budget.
Consumers who are knowledgeable on postharvest care for cut flowers added
value to a floral arrangement. Floral preservatives could potentially increase their
appreciation for and interest in purchasing flowers (Jenkins, 2013). The results of the
present study reported no difference in the number of repeat consumers and how often
they offer workshops. Over 70 percent of the florists surveyed resulted in offering no
classes or workshops for consumers. Increasing the number of workshops or classes
would likely increase the number of repeat consumers.
Location is important for consumers to conveniently find the florist. Florists rely
on walk-ins and consumers coming to them. It is important for florists to be located in an
attractive area that’s safe (Kimball, 2006). Results of the present study showed no effect
of shop location on the number of repeat consumers; however, favorable, accessible
location will likely increase prospective consumers. To keep repeat consumers a shop
would need to stay in its current location for a period of time.
Service is key to a successful floral shop. Florists need employees to answer
phones, and deal with walk-in consumers. The present study results found the more part
time and full time employees a florist had the greater the number of repeat consumers

32
Florists who have to do everything themselves get burnt out quickly in the business. It is
an investment for florists who have a greater number of repeat consumers to hire full time
and part time employees to help keep consumers happy.
Florists who use a wire service had a greater number of return consumers. Wire
services are great for gaining and keeping new consumers. Wire services bring in new
consumers. A consumer who is pleased with the product is more likely to begin using the
florist.
Florist’s consumer base such as online, walk-in, or phone had no pronounced
affect on the number of return consumers. Rather, they selected multiple responses. The
number of delivery vehicles had no affect on the number of return consumers.
Consumers Surveys
The response rate for consumer’s surveys was lower than expected. Several
possible reasons were responsible. Some consumers were reluctant to provide sensitive
information such as annual gross income. In retrospect including a raffle award could
have increased the response rate.
Consumers whose main method of purchasing flowers was online had no affect
on the average price a consumer spent on an arrangement. A limitation to this study is
that no online consumers were surveyed. Consumers whose main method of purchasing
was telephone had an increase average price spent on an arrangement. When consumers
call a florist they don’t have time to walk-in the store. Usually they have decided an
amount they want to spend and what product they want. Consumers whose main method
of purchasing flowers was walk-in spent less on the average arrangement. Walk-in
consumers will settle for a less expensive product after browsing the store.
33
Consumers who purchase gifts or flowers for themselves increased the amount
they spent on an arrangement. Walk-in consumers buy products for themselves.
Consumers who are walk-in increase the chances of impulse buying and are willing to
pay more for a product when they physically see it. Consumers also spent more on
purchased gifts for family.
In previous studies younger adult consumers tend to spend less on floral gifts.
They preferred more practical, long- lasting gifts that reflect their sentiments and resist
spending money on perishable luxury items (Rihn, 2011). Results of the present study
showed consumers tend to spend more when purchasing flowers for special occasions,
and funerals. Consumers today want more keepsake products and less perishable items.
The study results showed no effect on the amount spent on flowers when purchased on
holidays, just because, and weddings.
Consumers in Kentucky and Tennessee spend less on the average fresh cut
arrangement when it is fresh cut flowers. Consumers are willing to pay more for items
that are not perishable. The present study was not specifically directed towards the impact
of nonperishable items. This study showed no difference in the average price spent per
arrangement on silk flowers, gift items, balloons, and potted plants.

34
CONCLUSION
Consumers increased price of arrangement when purchasing by the telephone.
Florists increased in the number of repeat consumers when their main form of marketing
was website. Florists can increase income and repeat consumers by marketing call in
orders online and florists being a member of a wire service.
Florists who had multiple full and part time employees increased in repeat
consumers. Employees are an investment for improving service for the floral shop.
Consumers spend more when placing an order on the phone. Florists cannot afford to
miss a phone call for a potential order.

35
LITERATURE CITED
Becker, W.A., Behe, B.K., Johnson, J.L., Townsend, C.D., and Litzenberg, K.K. 1997.
Consumer perceptions of service quality in the Texas retail floral industry.
Hortscience, Vol. 32(2): 318- 323.
Behe, B.K. 1993. Floral marketing and consumer research. Hortscience, Vol. 28(1): 11-
14.
Behe, B.K. and Wolnick, D.J. 1991. Type of floral product purchased and demographic
characteristics and floral knowledge of consumers. Hortscience, Vol. 26(4): 414-
416.
Collins, C.A., Fails B., and Schabenberger O. 1999. Analysis of Michigan full- service
retail florist businesses by annual gross sales. Hortscience, Vol. 34(1): 144-148.
Huang, L. 2007. Behavioral differences in prepurchase processes between purchasers of
flowers for self-use and for gift-use. Horttechnology, Vol. 17(2): 183- 190.
Huang, L. 2005. Floral product behaviors and their influence on consumer floral purchase
frequency. Horttechnology, Vol. 15(4): 766- 771.
Jenkins, M.M., Williams K.A., and Brannon L.A. 2013. Increased knowledge about floral
preservatives influences consumers’ perception of the quality and value of floral
arrangement purchase. Horttechnology, Vol. 23(2): 142- 148.
Rihn, A.L., Yue, C., Behe, B., and Hall, C. 2011. Generations X and Y attitudes toward
fresh flowers as gifts: implications for the floral industry. Hortscience, Vol. 46(5):
736-743.
Sogueco, R. 2014. Defy your size online. Floral management. Vol. 31(4): 20- 26.
Sogueco, R. 2015. Search and rescue. Floral management. Vol. 32(4): 20-25.
Westbrook, M. 2013. Advertising on facebook: does paying for popularity pay off. Floral
management. Vol. 30(10): 12-13.
Westbrook, M. 2014. Is ftd’s proflower acquisition pro- florist? Floral management. Vol.
31(9): 20-28.

36
Dear Florist, My name is Danielle Berkshire; I am a graduate student in the Department of Agriculture at Western Kentucky University. My graduate research involves evaluating market trends and how market trends influence a consumer’s decision to return to a full service floral shop.
The research consists of a questionnaire on advertisement and marketing, along with changing consumer trends at your floral shop. The survey will take approximately 10 minutes of your time. Personal and business identification will remain confidential.
The goals of this research are to develop ways to improve current marketing
and advertisement techniques and aid in the understanding of how to increase customer retention. The data gathered from this study will assist florists in improving advertisement and marketing decisions, along with ways to improve customer retention.
Thank you for your time in assisting in my graduate research. It wouldn’t be
possible without your help.
Sincerely, Danielle Berkshire [email protected]

37
Hello:
Hello:
We are conducting a short, 10 minute
survey regarding floral shop
management by florists in retail floral
shops in Kentucky and Tennessee. We
would greatly appreciate your time and
efforts completing our short survey.
Completing this questionnaire is
completely voluntary, and you may
withdraw your participation at any time
without penalty. To protect your
anonymity, please do not write your
name on the survey instrument. By
completing this survey instrument, you
are providing your informed consent to
participate in this research and you also
are affirming that you are at least 18
years of age. If you have any questions,
please do not hesitate to let us know.
Thank you again for your assistance.
1. How long has your business been in
its current location?
o 5 years or less
o 6– 10 years
o 11– 15 years
o 16– 20 years
o 21 years or more
2. How many times have you moved
your shop?
o 0
o 1
o 2
o 3
o 4 or more
3. Including your business how many
flower shops are in your town?
o 1
o 2
o 3
o 4
o 5 or more
4. Do you have a window display?
o Yes
o No
5. If yes, how often do you change it?
o Twice per season
o Once per season
o Once a month
o Twice a month
o Once a week
6. How many repeat consumers do
you have?
o 1– 49
o 50– 99
o 100– 149
o 150– 199
o 200– 299
o 300– 399
o 400– 499
o 501 or more

38
7. Are you listed in the yellow pages?
o Yes
o No
o Don’t know
8. What is your main form of
marketing?
o Website
o Newspaper
o Facebook/ Twitter
o Phonebook
o Billboard
o Word of mouth
o Other ___________
9. Who are your targeted consumers?
Check all that apply.
o 20 yrs. old or younger
o 21– 30 yrs. old
o 31– 40 yrs. old
o 41– 50 yrs. old
o 51– 60 yrs. old
o 61 yrs. old or older
10. How often do you offer workshops
or classes for consumers?
o Never
o Once a year
o Every 6 months
o Every quarter
o Once a month
o More than once a month
11. Where is your shop located?
o Downtown/ Main street
o Edge of town
o Strip mall/ retail cluster
o Other, please specify
___________.
12. How many full time employees do
you have?
o 0
o 1
o 2
o 3
o 4 or more
13. How many part time employees do
you have?
o 0
o 1
o 2
o 3
o 4 or more
14. By whom is the floral shop
owned? o Family
o Corporation
o Sole proprietorship
o Partnership
o Other ____________
15. Do you belong to a wire service? If
so which ones?
__________________________
16. Is your consumer base mostly...
o Walk– in
o Phone
o Wire– service/ Internet
o Other ____________

39
17. How many delivery vehicles do
you have?
o 1
o 2
o 3
o 4
o 5 or more
18. What is your gender?
o Male
o Female
19. In what year were you born?
____________________________
20. What is the highest degree or level
of education that you have completed?
o Less than High School Diploma
o High School Graduate/ GED
o Some College Credit, but no
Degree
o AA/AS Program Graduate
o BA/ BS Program Graduate
o Post– Graduate Education
21. How often do you attend
workshops or conferences to further
your education?
o Never
o Once a year
o Twice a year
o Three times a year or more
22. What is the annual gross income of
your business?
o 0– 100,000
o 100,001– 150,000
o 150,001– 200,000
o 200,001– 250,000
o 250,001 or higher
23. In what county is your shop
located?
____________________
24. In what state is your shop
located?
o Tennessee
o Kentucky

40
Dear Customer,
My name is Danielle Berkshire; I am a graduate student in the Department of
Agriculture at Western Kentucky University. My graduate research involves evaluating market trends and how market trends influence a consumer’s decision to return to a full service floral shop.
My data collected involves a brief survey on your demographics, experiences
with local florist, and history of floral purchases. The survey will take approximately 10
minutes to complete. Personal identification gathered in the survey will remain
confidential.
The goals of this research are to develop ways to improve current marketing techniques and aid the industry understanding of how to increase customer retention. The data gathered from this study will assist florists in improving advertisement and marketing decisions, along with ways to improve customer retention. As a student who is passionate about the floral industry my goal is to help
improve customer service for the floral industry. I believe the best way to improve
services is to ask the experts, the customers, their opinions.
Steps to complete the survey
1. Read and sign the consent form. (The consent form guarantees confidentiality
of identifying information).
2. Complete the survey by answering the 12 survey questions.
3. Place the completed survey and signed consent form in the envelope provided.
4. Seal the envelope and sign across the seal of the envelope.
5. Return the sealed envelope to a participating florist by February 29th, 2015.
The florist will return all sealed envelopes to me at the completion of the
study.
Thank you for your time in assisting in my graduate research. My research would
not be possible without your help. If you have any questions, feel free to contact me.
Sincerely,
Danielle Berkshire

41
Hello:
We are conducting a short, 10 minute
survey regarding floral shop
management by consumers in retail
floral shops in Kentucky and Tennessee.
We would greatly appreciate your time
and efforts completing our short survey.
Completing this questionnaire is
completely voluntary, and you may
withdraw your participation at any time
without penalty. To protect your
anonymity, please do not write your
name on the survey instrument. By
completing this survey instrument, you
are providing your informed consent to
participate in this research and you also
are affirming that you are at least 18
years of age. If you have any questions,
please do not hesitate to let us know.
Thank you again for your assistance.
1. What is your main method of
purchasing flowers?
o Online
o Telephone
o Walk-in
o Other ________________
2. For whom do you purchase gifts or
flowers?
o Yourself
o Friends
o Family
o All of the above
o Other ________________
3. When do you purchase flowers?
Check all that apply.
o Holiday’s (Valentine’s Day,
Thanksgiving, etc.)
o Special occasions (Birthday or
Anniversary)
o Just cause/ no reason
o Wedding
o Funeral/ Sympathy
o Other
_______________________
4. What merchandise do you most
often purchase from a florist? o Fresh cut flowers
o Silk flowers
o Gift items (Candles & Chocolate)
o Balloons
o Potted Plants
o Other
_________________________
5. How would you rank the following
in factors encourages you to be a
return consumer? 1 being the most
important- 5 being less important.
Store’s appeal
Service/ delivery
Relationship with florist
Longevity of flowers
Other
________________________
6. What is the average price you spend
on an arrangement?
o $25 or less
o $26- $45
o $46- $65
o $66- $85
o $86 or higher

42
7. What is your gender?
o Male
o Female
8. In what year were you born?
_____________________
9. What is your highest degree or level
of education that you have completed?
o Less than High School Diploma
o High School Graduate/ GED
o Some College Credit, but no
Degree
o AA/ AS Program Graduate
o BA/ BS Program Graduate
o Post– Graduate Education
10. Household gross annual income?
o 29,999 or below
o 30,000 – 59,999
o 60,000– 89,999
o 90,000 or higher
11. In what county are you located?
___________________
12. In what state are you located?
o Tennessee
o Kentucky