Market History and Forecast for Downtown Chicago, August 2014
12
Market History and Forecast for Downtown Chicago, August 2014
-
Upload
aileen-sargent -
Category
Documents
-
view
29 -
download
0
description
Market History and Forecast for Downtown Chicago, August 2014. What’s Changed in 2014?. Chicago itself is doing as well as it ever has in occupancy. Rate is getting better. There are over 109,000 rooms in the metro area. An extra 10,000 rooms would be an increase of only 9% over 5 years. - PowerPoint PPT Presentation
Transcript of Market History and Forecast for Downtown Chicago, August 2014

Market History and Forecast for Downtown Chicago,
August 2014

What’s Changed in 2014?
• Chicago itself is doing as well as it ever has in occupancy. Rate is getting better.
• There are over 109,000 rooms in the metro area. An extra 10,000 rooms would be an increase of only 9% over 5 years.
• Almost all the proposed hotels are in Chicago, which only has 36,000 rooms, meaning it would be a 28% increase in downtown rooms!
• Historically, Chicago sent over 500,000 rooms into the suburbs per year, or around 120 days.
• Now it’s less than 100,000, or 10-20 days.

Changes in the Traveler
• People now stay where they want to.– Corporations are more flexible– There are way more rooms to choose from– The consumer is more informed
• Thanks primarily to the internet
• There are more travelers– Convention has stayed the same, but they’re a smaller
percent (used to be 60%, now 45%). People don’t always stay in the HQ hotel anymore.
– Leisure is a larger percentage (used to be 10% or less, now it’s 15% and growing)

Regional Markets

Why do we think Chicago is going to lose occupancy?
• It’s all room count.
• We’re going to add 20% more rooms to the supply in the next 5 years.
• Demand is still going up, but not fast enough.
2008 2009 2010 2011 2012 2013 2014 2015 2016 2017 201830,000
32,000
34,000
36,000
38,000
40,000
42,000
44,000
46,000
50%
55%
60%
65%
70%
75%
80%
85%
90%
95%
100%Room Count Vs. Occupancy 2008-2018
Rooms Occupancy
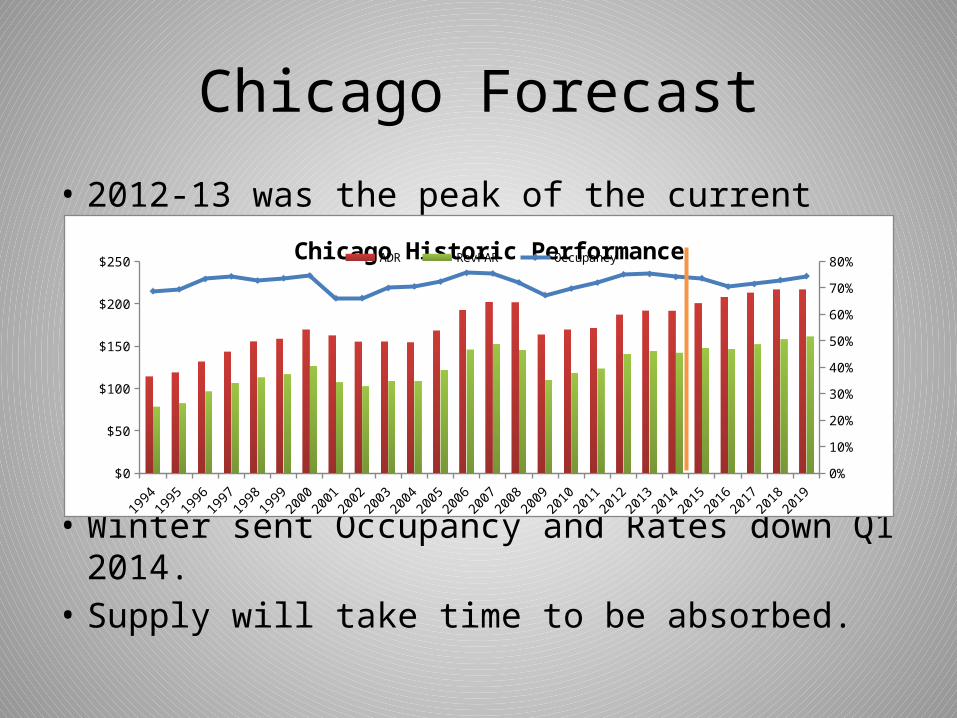
Chicago Forecast
• 2012-13 was the peak of the current cycle.
• Winter sent Occupancy and Rates down Q1 2014.• Supply will take time to be absorbed.
$0
$50
$100
$150
$200
$250
0%
10%
20%
30%
40%
50%
60%
70%
80%Chicago Historic Performance
ADR RevPAR Occupancy

Weekly data
• Tuesday is the highest rate day, Saturday is the highest occupancy day.– Tuesday is usually corporate and group, at full rack
and is less price conscious.– Weekends are usually packaged rates and
discounts.– This change happened about 5 years ago during
the recession.

Monthly Data
• Historically consistent. May-October are the busy months. November-April are slow.
Jan Feb
March
April
May
June
July
Aug
Sept
Oct Nov
Dec
Jan Feb
March
April
May
June
July
Aug
Sept
Oct Nov
Dec
Jan Feb
March
April
May
June
July
Aug
Sept
Oct Nov
Dec
Jan Feb
March
April
May
June
$0
$50
$100
$150
$200
$250
$300
0%
10%
20%
30%
40%
50%
60%
70%
80%
90%
100%
Chicago CBD Market Monthly 2011 - 2014ADR RevPAR

Recent SalesDate
Hotel Name/ Buyer
Year Built/ # Units
Price in mil. /CPR
Pending Intercontinental Chicago O'Hare 2008 $120
Loews Hotels 556 units $215,827
Pending Homewood Suites 1999 $53
ARC Hospitality Trust 233 units $226,156
May'14 Howard Johnson Inn Chicago Downtown 1968 $15
MAC Management Co JV Magellan Development Group JV 71 units $214,789
Feb'14 Warwick Allerton Hotel 1923 $82
Warwick Int'l Hotels 443 units $184,989
Feb'14 Hotel Burnham 1895 $35
Lone Star Funds 122 units $288,525
Jan'14 Drake Hotel (Land Only) 1920 $150
Lodging Capital Partners JV
Dec'13 Belden Stratford 1923 $87
Prudential RE Investors 297 units $292,088
Nov'13 Hotel Monaco Chicago 1912 $56
Inland American REIT 192 units $291,667
Oct'13 Tokyo Hotel* 1928 $14
Sydell Group Ltd 190 units $71,053
Sep'13 Hotel Lincoln 1928 $49
Walton Street CapitalJV 184 units $263,587
Aug'13 Hotel Blake (Bulk Condo)* 1986 $5
Bluegreen Corp 12 units* $407,625
Average CPR: $247,204

This YTD is Rough• April
– Occupancy down 2.5%– ADR down 4.5%– RevPAR down 6.9%
• YTD– Occupancy down 4.9%– ADR down 3.8%– RevPAR down 8.4%
• Supply up 5.6% YTD• Demand up 0.4% YTD

New Supply
• 2,800 rooms recently opened or about to open.
• Another 4,800 in the planning stage. More are added almost weekly at this point.
• A lot of conversion from old office buildings.• Neighborhoods are starting to get their own
hotels, generally boutique properties.

New, U C and Proposed HotelsOpened
Early Planning
Advancing