Market Activity for the Yes MLS, Inc. - Your Listings, …...Key metrics by report month and for...
12
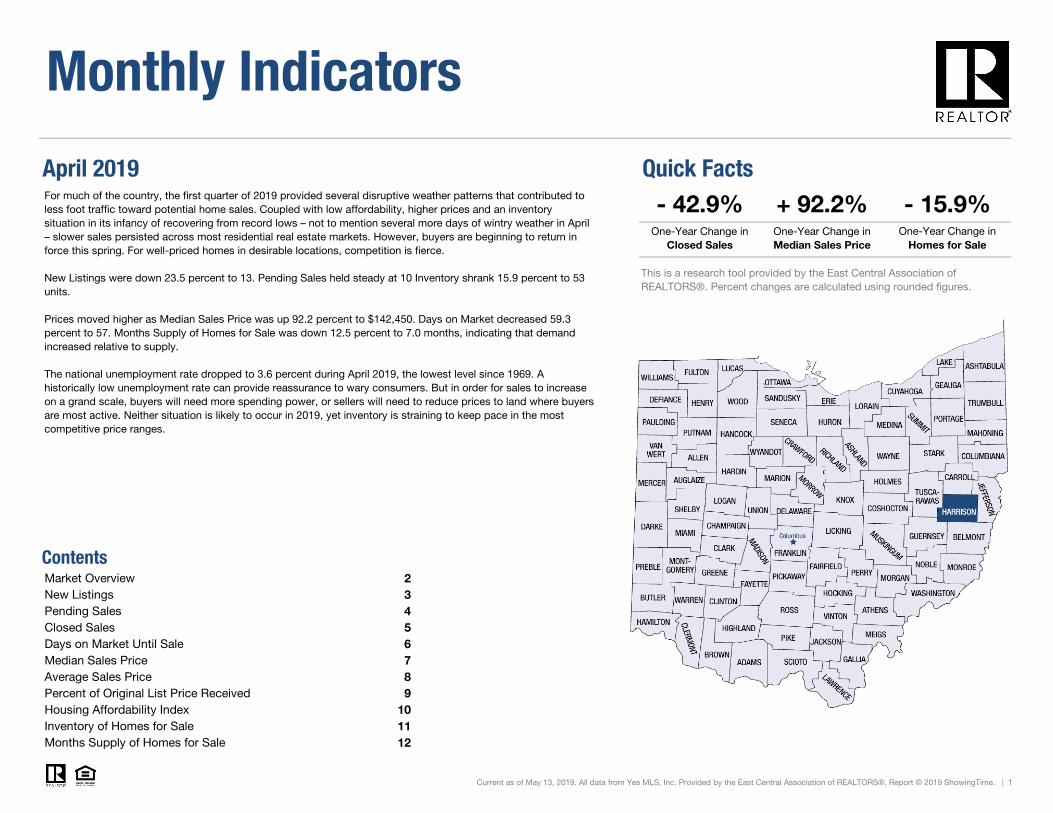
Monthly Indicators Quick Facts One-Year Change in One-Year Change in Closed Sales Median Sales Price Contents Market Overview 2 New Listings 3 Pending Sales 4 Closed Sales 5 Days on Market Until Sale 6 Median Sales Price 7 Average Sales Price 8 Percent of Original List Price Received 9 Housing Affordability Index 10 Inventory of Homes for Sale 11 Months Supply of Homes for Sale 12 + 92.2% Current as of May 13, 2019. All data from Yes MLS, Inc. Provided by the East Central Association of REALTORS®. Report © 2019 ShowingTime. | 1 - 42.9% For much of the country, the first quarter of 2019 provided several disruptive weather patterns that contributed to less foot traffic toward potential home sales. Coupled with low affordability, higher prices and an inventory situation in its infancy of recovering from record lows – not to mention several more days of wintry weather in April – slower sales persisted across most residential real estate markets. However, buyers are beginning to return in force this spring. For well-priced homes in desirable locations, competition is fierce. New Listings were down 23.5 percent to 13. Pending Sales held steady at 10 Inventory shrank 15.9 percent to 53 units. Prices moved higher as Median Sales Price was up 92.2 percent to $142,450. Days on Market decreased 59.3 percent to 57. Months Supply of Homes for Sale was down 12.5 percent to 7.0 months, indicating that demand increased relative to supply. The national unemployment rate dropped to 3.6 percent during April 2019, the lowest level since 1969. A historically low unemployment rate can provide reassurance to wary consumers. But in order for sales to increase on a grand scale, buyers will need more spending power, or sellers will need to reduce prices to land where buyers are most active. Neither situation is likely to occur in 2019, yet inventory is straining to keep pace in the most competitive price ranges. April 2019 - 15.9% One-Year Change in Homes for Sale This is a research tool provided by the East Central Association of REALTORS®. Percent changes are calculated using rounded figures.
Transcript of Market Activity for the Yes MLS, Inc. - Your Listings, …...Key metrics by report month and for...
Monthly Indicators
Quick Facts
One-Year Change in One-Year Change in
Closed Sales Median Sales Price
ContentsMarket Overview 2New Listings 3Pending Sales 4Closed Sales 5Days on Market Until Sale 6Median Sales Price 7Average Sales Price 8Percent of Original List Price Received 9Housing Affordability Index 10Inventory of Homes for Sale 11Months Supply of Homes for Sale 12
+ 92.2%
Current as of May 13, 2019. All data from Yes MLS, Inc. Provided by the East Central Association of REALTORS®. Report © 2019 ShowingTime. | 1
- 42.9%For much of the country, the first quarter of 2019 provided several disruptive weather patterns that contributed to less foot traffic toward potential home sales. Coupled with low affordability, higher prices and an inventory situation in its infancy of recovering from record lows – not to mention several more days of wintry weather in April – slower sales persisted across most residential real estate markets. However, buyers are beginning to return in force this spring. For well-priced homes in desirable locations, competition is fierce.
New Listings were down 23.5 percent to 13. Pending Sales held steady at 10 Inventory shrank 15.9 percent to 53 units.
Prices moved higher as Median Sales Price was up 92.2 percent to $142,450. Days on Market decreased 59.3 percent to 57. Months Supply of Homes for Sale was down 12.5 percent to 7.0 months, indicating that demand increased relative to supply.
The national unemployment rate dropped to 3.6 percent during April 2019, the lowest level since 1969. A historically low unemployment rate can provide reassurance to wary consumers. But in order for sales to increase on a grand scale, buyers will need more spending power, or sellers will need to reduce prices to land where buyers are most active. Neither situation is likely to occur in 2019, yet inventory is straining to keep pace in the most competitive price ranges.
April 2019
- 15.9%One-Year Change in
Homes for Sale
This is a research tool provided by the East Central Association of REALTORS®. Percent changes are calculated using rounded figures.
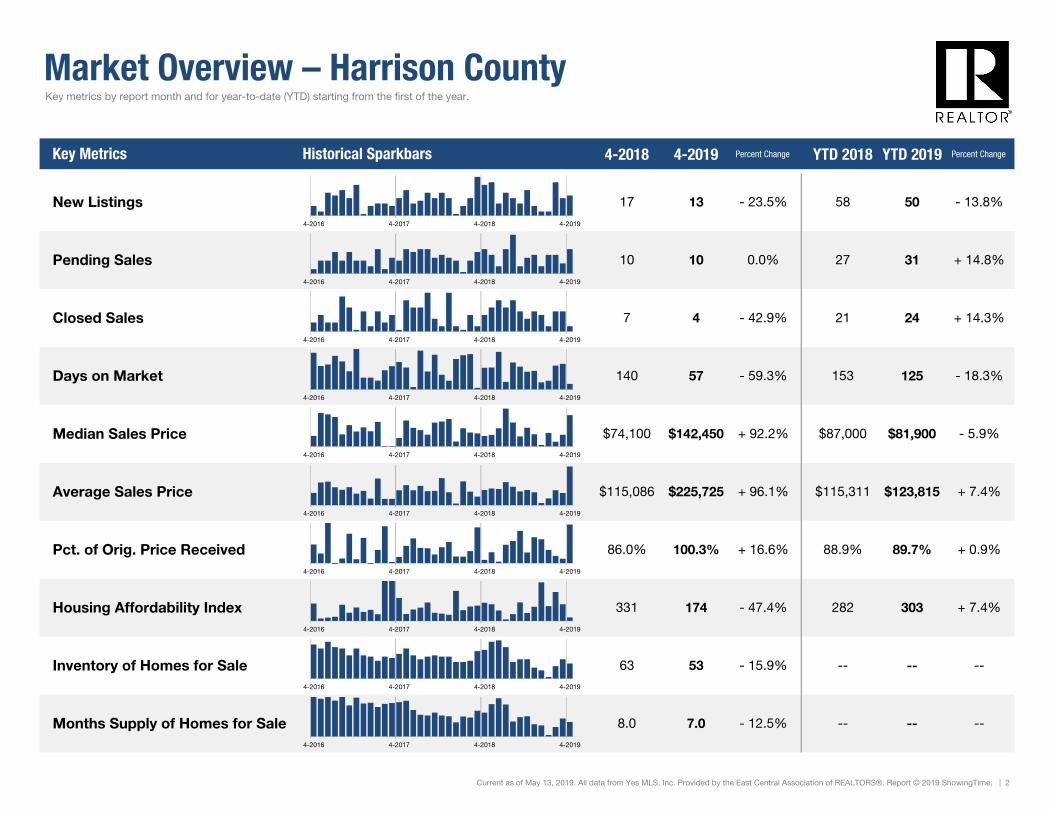
Market Overview – Harrison County
4-2018 4-2019 Percent Change YTD 2018 YTD 2019 Percent Change
Current as of May 13, 2019. All data from Yes MLS, Inc. Provided by the East Central Association of REALTORS®. Report © 2019 ShowingTime. | 2
Key Metrics
8.0 7.0 - 12.5% -- --
+ 7.4%
Pct. of Orig. Price Received 86.0% 100.3% + 16.6%
+ 7.4%
Inventory of Homes for Sale 63 53 - 15.9% -- -- --
Housing Affordability Index 331 174 - 47.4% 282 303
--Months Supply of Homes for Sale
88.9% 89.7% + 0.9%
Average Sales Price $115,086 $225,725 + 96.1% $115,311 $123,815
- 18.3%
Median Sales Price $74,100 $142,450 + 92.2% $87,000 $81,900 - 5.9%
Days on Market 140 57 - 59.3% 153 125
Key metrics by report month and for year-to-date (YTD) starting from the first of the year.
New Listings 17 13 - 23.5% 50 - 13.8%
Pending Sales 10 10 0.0% 27 31 + 14.8%
58
Historical Sparkbars
Closed Sales 7 4 - 42.9% 21 24 + 14.3%
4-2016 4-2017 4-2018 4-2019
4-2016 4-2017 4-2018 4-2019
4-2016 4-2017 4-2018 4-2019
4-2016 4-2017 4-2018 4-2019
4-2016 4-2017 4-2018 4-2019
4-2016 4-2017 4-2018 4-2019
4-2016 4-2017 4-2018 4-2019
4-2016 4-2017 4-2018 4-2019
4-2016 4-2017 4-2018 4-2019
4-2016 4-2017 4-2018 4-2019
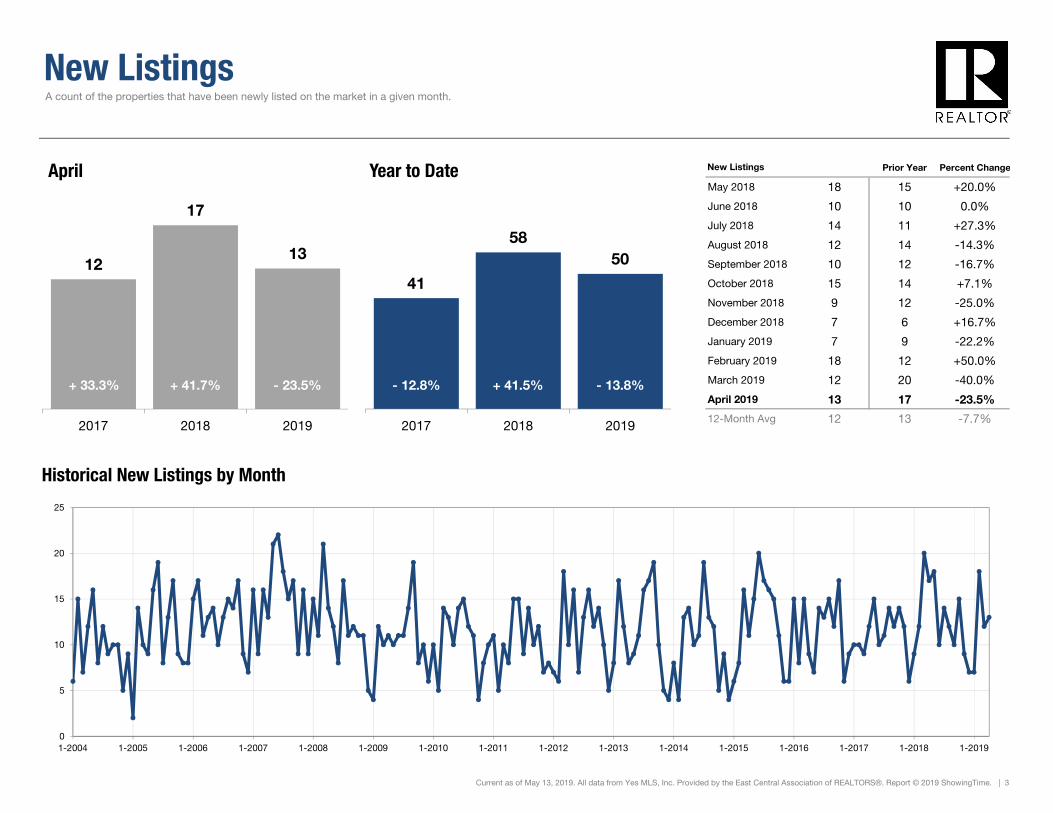
New Listings
Prior Year Percent Change
May 2018 18 15 +20.0%
June 2018 10 10 0.0%
July 2018 14 11 +27.3%
August 2018 12 14 -14.3%
September 2018 10 12 -16.7%
October 2018 15 14 +7.1%
November 2018 9 12 -25.0%
December 2018 7 6 +16.7%
January 2019 7 9 -22.2%
February 2019 18 12 +50.0%
March 2019 12 20 -40.0%
April 2019 13 17 -23.5%
12-Month Avg 12 13 -7.7%
Historical New Listings by Month
Current as of May 13, 2019. All data from Yes MLS, Inc. Provided by the East Central Association of REALTORS®. Report © 2019 ShowingTime. | 3
A count of the properties that have been newly listed on the market in a given month.
New Listings
12
17
13
2017 2018 2019
April
0
5
10
15
20
25
1-2004 1-2005 1-2006 1-2007 1-2008 1-2009 1-2010 1-2011 1-2012 1-2013 1-2014 1-2015 1-2016 1-2017 1-2018 1-2019
41
5850
2017 2018 2019
Year to Date
- 13.8%+ 41.7% - 23.5% + 41.5%+ 33.3% - 12.8%
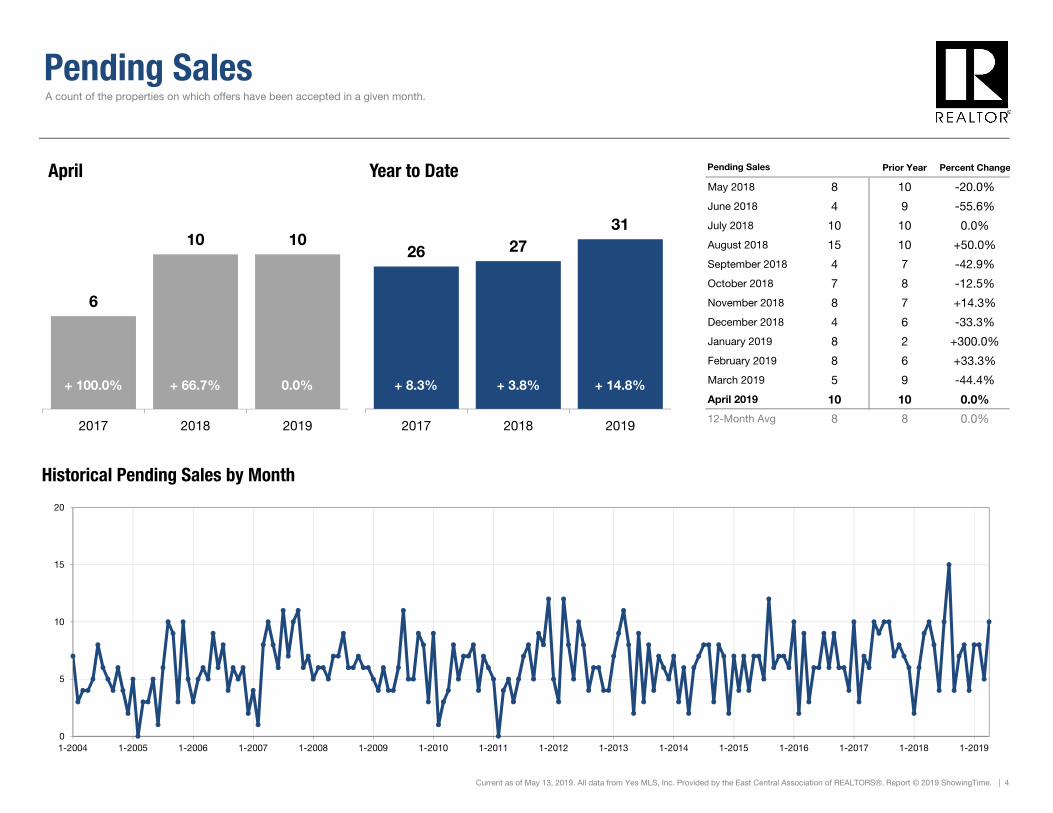
Pending Sales
Prior Year Percent Change
May 2018 8 10 -20.0%
June 2018 4 9 -55.6%
July 2018 10 10 0.0%
August 2018 15 10 +50.0%
September 2018 4 7 -42.9%
October 2018 7 8 -12.5%
November 2018 8 7 +14.3%
December 2018 4 6 -33.3%
January 2019 8 2 +300.0%
February 2019 8 6 +33.3%
March 2019 5 9 -44.4%
April 2019 10 10 0.0%
12-Month Avg 8 8 0.0%
Historical Pending Sales by Month
Current as of May 13, 2019. All data from Yes MLS, Inc. Provided by the East Central Association of REALTORS®. Report © 2019 ShowingTime. | 4
A count of the properties on which offers have been accepted in a given month.
Pending Sales
6
10 10
2017 2018 2019
April
0
5
10
15
20
1-2004 1-2005 1-2006 1-2007 1-2008 1-2009 1-2010 1-2011 1-2012 1-2013 1-2014 1-2015 1-2016 1-2017 1-2018 1-2019
26 2731
2017 2018 2019
Year to Date
+ 14.8%+ 66.7% 0.0% + 3.8%+ 100.0% + 8.3%
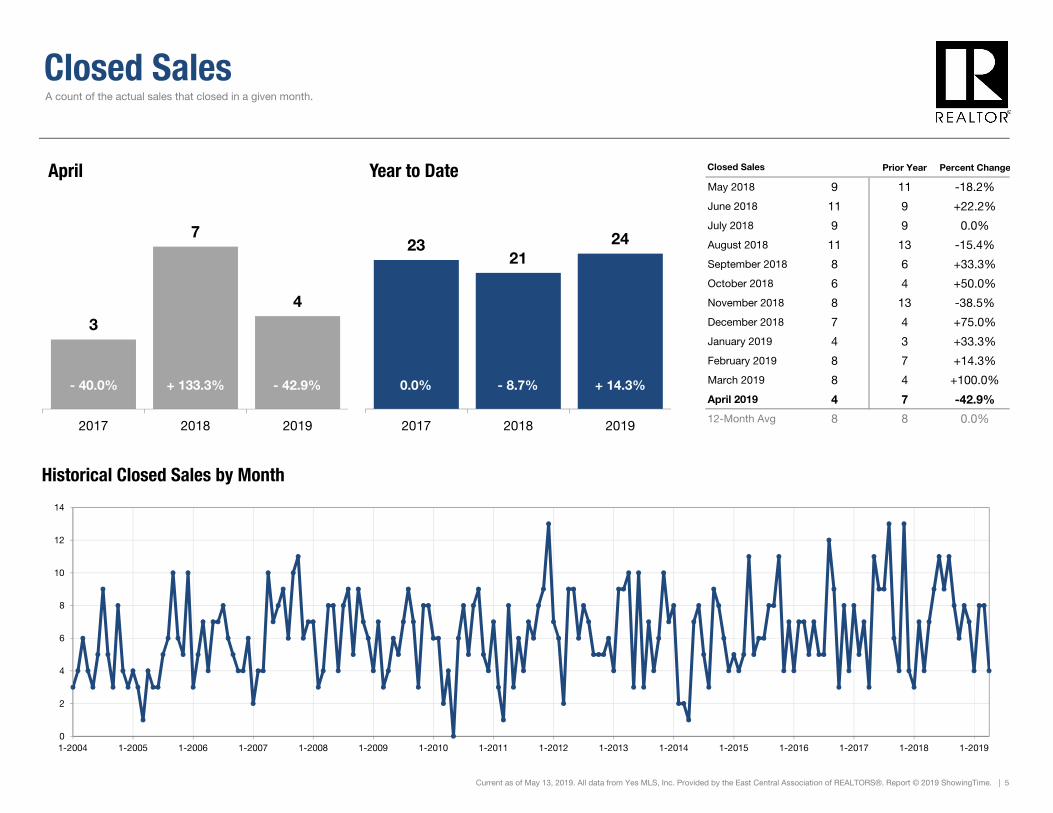
Closed Sales
Prior Year Percent Change
May 2018 9 11 -18.2%
June 2018 11 9 +22.2%
July 2018 9 9 0.0%
August 2018 11 13 -15.4%
September 2018 8 6 +33.3%
October 2018 6 4 +50.0%
November 2018 8 13 -38.5%
December 2018 7 4 +75.0%
January 2019 4 3 +33.3%
February 2019 8 7 +14.3%
March 2019 8 4 +100.0%
April 2019 4 7 -42.9%
12-Month Avg 8 8 0.0%
Historical Closed Sales by Month
Current as of May 13, 2019. All data from Yes MLS, Inc. Provided by the East Central Association of REALTORS®. Report © 2019 ShowingTime. | 5
A count of the actual sales that closed in a given month.
Closed Sales
3
7
4
2017 2018 2019
April
0
2
4
6
8
10
12
14
1-2004 1-2005 1-2006 1-2007 1-2008 1-2009 1-2010 1-2011 1-2012 1-2013 1-2014 1-2015 1-2016 1-2017 1-2018 1-2019
2321
24
2017 2018 2019
Year to Date
+ 14.3%+ 133.3% - 42.9% - 8.7%- 40.0% 0.0%
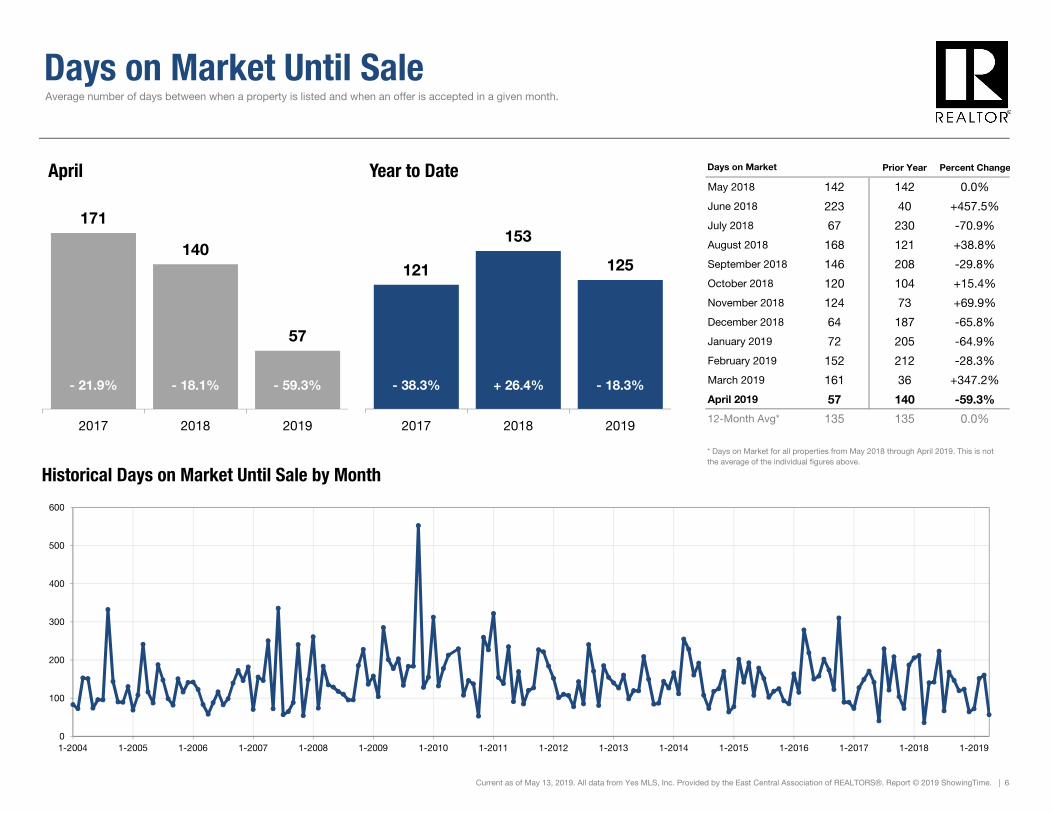
Days on Market Until Sale
Prior Year Percent Change
May 2018 142 142 0.0%
June 2018 223 40 +457.5%
July 2018 67 230 -70.9%
August 2018 168 121 +38.8%
September 2018 146 208 -29.8%
October 2018 120 104 +15.4%
November 2018 124 73 +69.9%
December 2018 64 187 -65.8%
January 2019 72 205 -64.9%
February 2019 152 212 -28.3%
March 2019 161 36 +347.2%
April 2019 57 140 -59.3%
12-Month Avg* 135 135 0.0%
Historical Days on Market Until Sale by Month
Current as of May 13, 2019. All data from Yes MLS, Inc. Provided by the East Central Association of REALTORS®. Report © 2019 ShowingTime. | 6
Average number of days between when a property is listed and when an offer is accepted in a given month.
Days on Market
* Days on Market for all properties from May 2018 through April 2019. This is not the average of the individual figures above.
171
140
57
2017 2018 2019
April
0
100
200
300
400
500
600
1-2004 1-2005 1-2006 1-2007 1-2008 1-2009 1-2010 1-2011 1-2012 1-2013 1-2014 1-2015 1-2016 1-2017 1-2018 1-2019
121
153
125
2017 2018 2019
Year to Date
- 18.3%- 18.1% - 59.3% + 26.4%- 21.9% - 38.3%
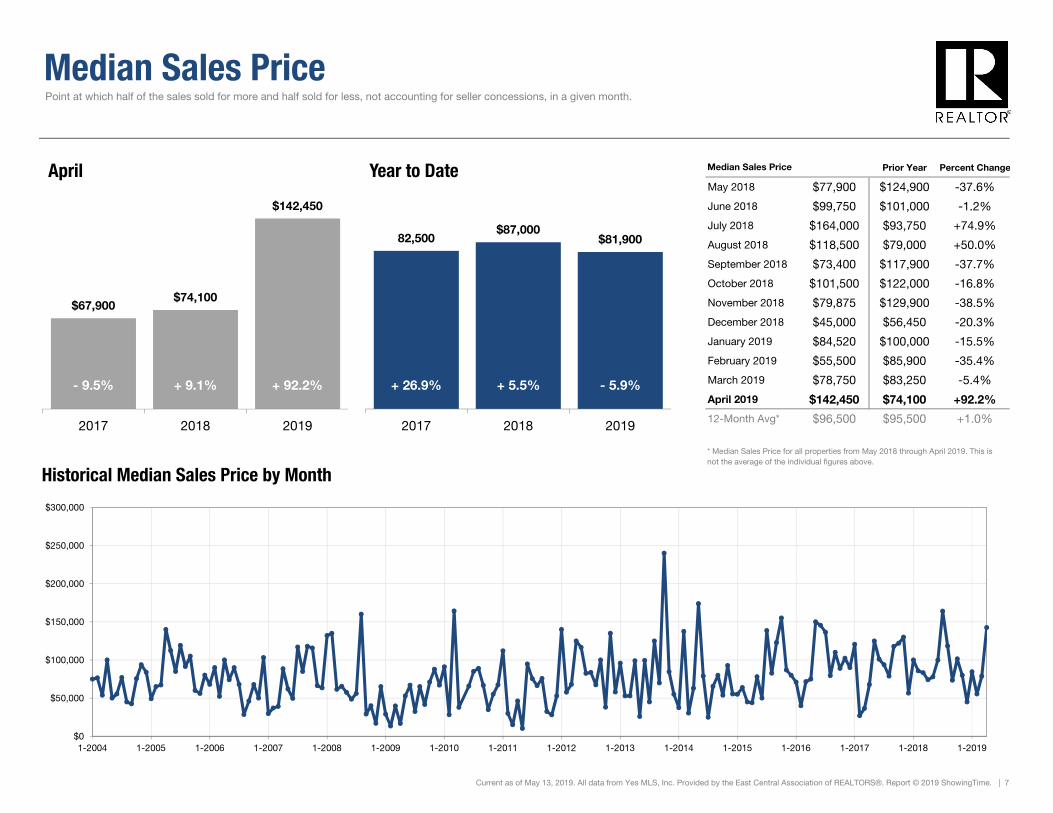
Median Sales Price
Prior Year Percent Change
May 2018 $77,900 $124,900 -37.6%
June 2018 $99,750 $101,000 -1.2%
July 2018 $164,000 $93,750 +74.9%
August 2018 $118,500 $79,000 +50.0%
September 2018 $73,400 $117,900 -37.7%
October 2018 $101,500 $122,000 -16.8%
November 2018 $79,875 $129,900 -38.5%
December 2018 $45,000 $56,450 -20.3%
January 2019 $84,520 $100,000 -15.5%
February 2019 $55,500 $85,900 -35.4%
March 2019 $78,750 $83,250 -5.4%
April 2019 $142,450 $74,100 +92.2%
12-Month Avg* $96,500 $95,500 +1.0%
Historical Median Sales Price by Month
Current as of May 13, 2019. All data from Yes MLS, Inc. Provided by the East Central Association of REALTORS®. Report © 2019 ShowingTime. | 7
Point at which half of the sales sold for more and half sold for less, not accounting for seller concessions, in a given month.
Median Sales Price
* Median Sales Price for all properties from May 2018 through April 2019. This is not the average of the individual figures above.
$67,900$74,100
$142,450
2017 2018 2019
April
$0
$50,000
$100,000
$150,000
$200,000
$250,000
$300,000
1-2004 1-2005 1-2006 1-2007 1-2008 1-2009 1-2010 1-2011 1-2012 1-2013 1-2014 1-2015 1-2016 1-2017 1-2018 1-2019
82,500$87,000
$81,900
2017 2018 2019
Year to Date
- 5.9%+ 9.1% + 92.2% + 5.5%- 9.5% + 26.9%
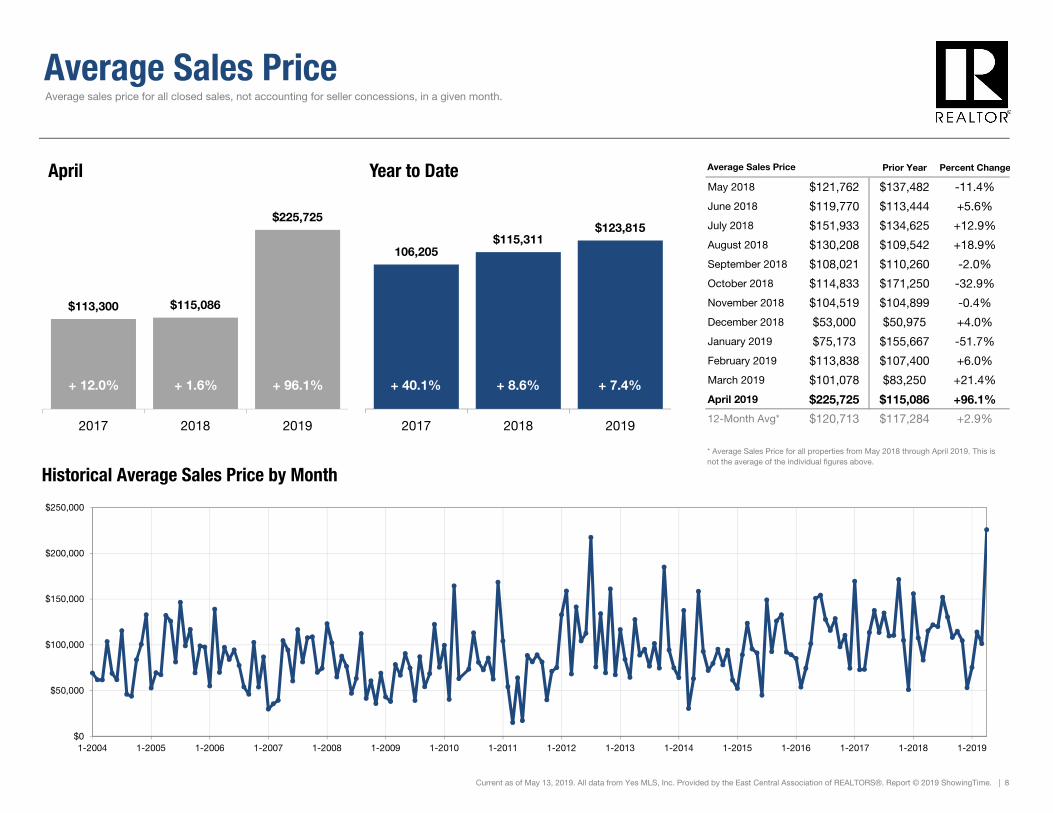
Average Sales Price
Prior Year Percent Change
May 2018 $121,762 $137,482 -11.4%
June 2018 $119,770 $113,444 +5.6%
July 2018 $151,933 $134,625 +12.9%
August 2018 $130,208 $109,542 +18.9%
September 2018 $108,021 $110,260 -2.0%
October 2018 $114,833 $171,250 -32.9%
November 2018 $104,519 $104,899 -0.4%
December 2018 $53,000 $50,975 +4.0%
January 2019 $75,173 $155,667 -51.7%
February 2019 $113,838 $107,400 +6.0%
March 2019 $101,078 $83,250 +21.4%
April 2019 $225,725 $115,086 +96.1%
12-Month Avg* $120,713 $117,284 +2.9%
Historical Average Sales Price by Month
Current as of May 13, 2019. All data from Yes MLS, Inc. Provided by the East Central Association of REALTORS®. Report © 2019 ShowingTime. | 8
Average sales price for all closed sales, not accounting for seller concessions, in a given month.
Average Sales Price
* Average Sales Price for all properties from May 2018 through April 2019. This is not the average of the individual figures above.
$113,300 $115,086
$225,725
2017 2018 2019
April
$0
$50,000
$100,000
$150,000
$200,000
$250,000
1-2004 1-2005 1-2006 1-2007 1-2008 1-2009 1-2010 1-2011 1-2012 1-2013 1-2014 1-2015 1-2016 1-2017 1-2018 1-2019
106,205$115,311
$123,815
2017 2018 2019
Year to Date
+ 7.4%+ 1.6% + 96.1% + 8.6%+ 12.0% + 40.1%
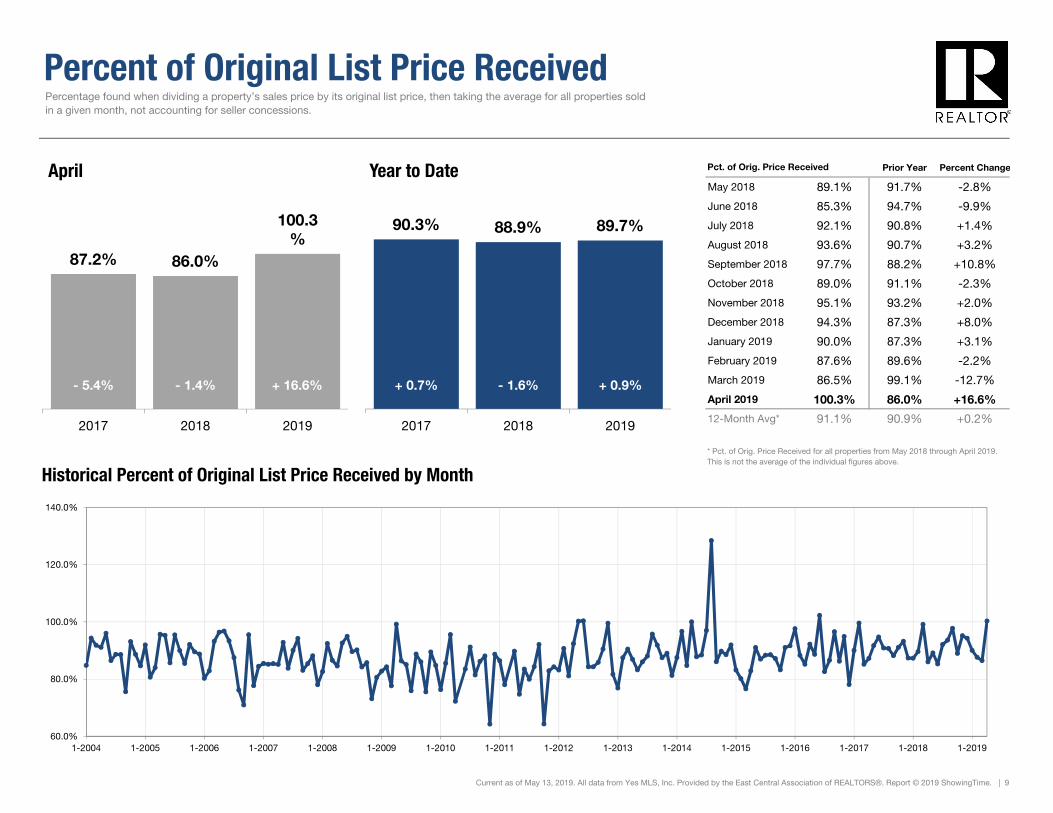
Percent of Original List Price Received
Prior Year Percent Change
May 2018 89.1% 91.7% -2.8%
June 2018 85.3% 94.7% -9.9%
July 2018 92.1% 90.8% +1.4%
August 2018 93.6% 90.7% +3.2%
September 2018 97.7% 88.2% +10.8%
October 2018 89.0% 91.1% -2.3%
November 2018 95.1% 93.2% +2.0%
December 2018 94.3% 87.3% +8.0%
January 2019 90.0% 87.3% +3.1%
February 2019 87.6% 89.6% -2.2%
March 2019 86.5% 99.1% -12.7%
April 2019 100.3% 86.0% +16.6%
12-Month Avg* 91.1% 90.9% +0.2%
Historical Percent of Original List Price Received by Month
Current as of May 13, 2019. All data from Yes MLS, Inc. Provided by the East Central Association of REALTORS®. Report © 2019 ShowingTime. | 9
Percentage found when dividing a property’s sales price by its original list price, then taking the average for all properties soldin a given month, not accounting for seller concessions.
Pct. of Orig. Price Received
* Pct. of Orig. Price Received for all properties from May 2018 through April 2019. This is not the average of the individual figures above.
87.2% 86.0%
100.3%
2017 2018 2019
April
60.0%
80.0%
100.0%
120.0%
140.0%
1-2004 1-2005 1-2006 1-2007 1-2008 1-2009 1-2010 1-2011 1-2012 1-2013 1-2014 1-2015 1-2016 1-2017 1-2018 1-2019
90.3% 88.9% 89.7%
2017 2018 2019
Year to Date
+ 0.9%- 1.4% + 16.6% - 1.6%- 5.4% + 0.7%
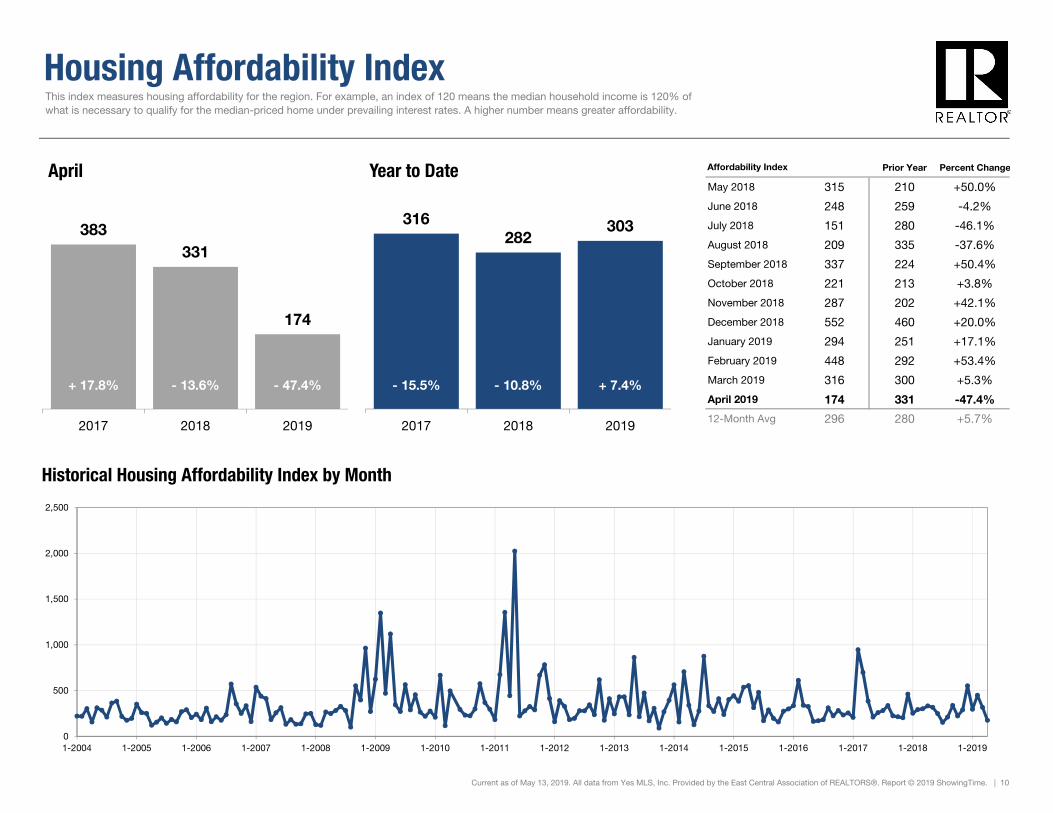
Housing Affordability Index
Prior Year Percent Change
May 2018 315 210 +50.0%
June 2018 248 259 -4.2%
July 2018 151 280 -46.1%
August 2018 209 335 -37.6%
September 2018 337 224 +50.4%
October 2018 221 213 +3.8%
November 2018 287 202 +42.1%
December 2018 552 460 +20.0%
January 2019 294 251 +17.1%
February 2019 448 292 +53.4%
March 2019 316 300 +5.3%
April 2019 174 331 -47.4%
12-Month Avg 296 280 +5.7%
Historical Housing Affordability Index by Month
Current as of May 13, 2019. All data from Yes MLS, Inc. Provided by the East Central Association of REALTORS®. Report © 2019 ShowingTime. | 10
This index measures housing affordability for the region. For example, an index of 120 means the median household income is 120% of what is necessary to qualify for the median-priced home under prevailing interest rates. A higher number means greater affordability.
Affordability Index
383331
174
2017 2018 2019
April
0
500
1,000
1,500
2,000
2,500
1-2004 1-2005 1-2006 1-2007 1-2008 1-2009 1-2010 1-2011 1-2012 1-2013 1-2014 1-2015 1-2016 1-2017 1-2018 1-2019
316282
303
2017 2018 2019
Year to Date
+ 7.4%- 13.6% - 47.4% - 10.8%+ 17.8% - 15.5%
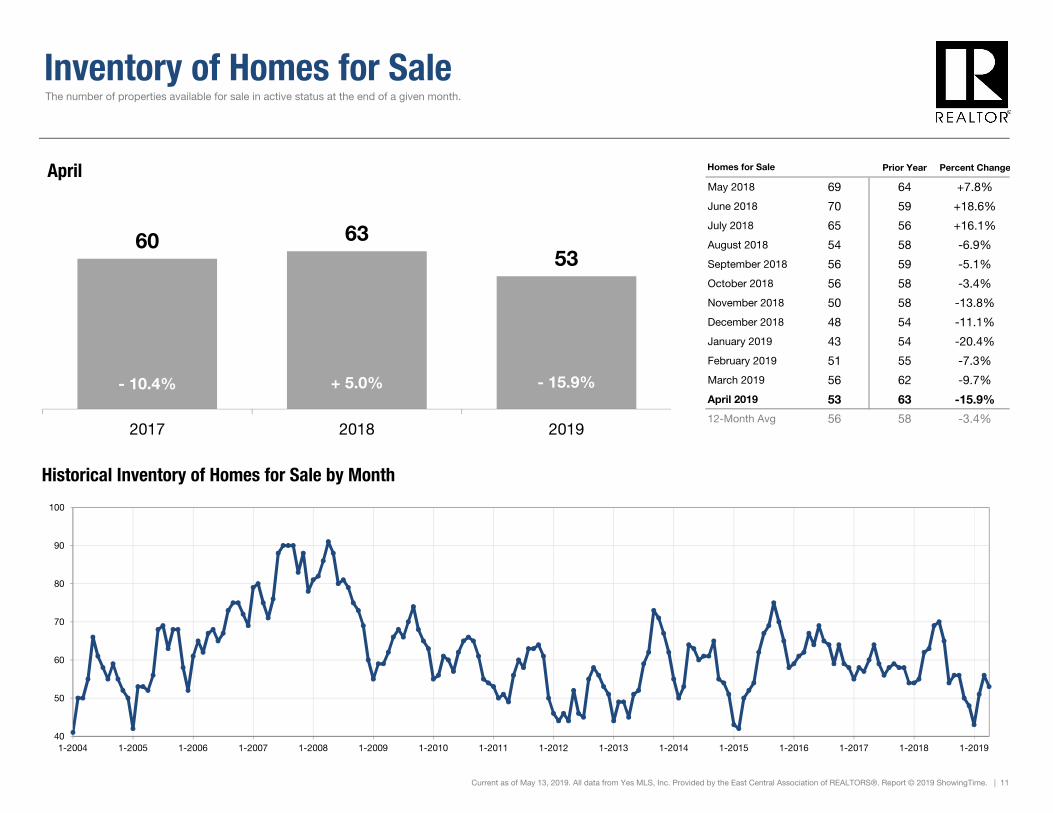
Inventory of Homes for Sale
Prior Year Percent Change
May 2018 69 64 +7.8%
June 2018 70 59 +18.6%
July 2018 65 56 +16.1%
August 2018 54 58 -6.9%
September 2018 56 59 -5.1%
October 2018 56 58 -3.4%
November 2018 50 58 -13.8%
December 2018 48 54 -11.1%
January 2019 43 54 -20.4%
February 2019 51 55 -7.3%
March 2019 56 62 -9.7%
April 2019 53 63 -15.9%
12-Month Avg 56 58 -3.4%
Historical Inventory of Homes for Sale by Month
Current as of May 13, 2019. All data from Yes MLS, Inc. Provided by the East Central Association of REALTORS®. Report © 2019 ShowingTime. | 11
The number of properties available for sale in active status at the end of a given month.
Homes for Sale
60 6353
2017 2018 2019
April
40
50
60
70
80
90
100
1-2004 1-2005 1-2006 1-2007 1-2008 1-2009 1-2010 1-2011 1-2012 1-2013 1-2014 1-2015 1-2016 1-2017 1-2018 1-2019
+ 5.0% - 15.9%- 10.4%
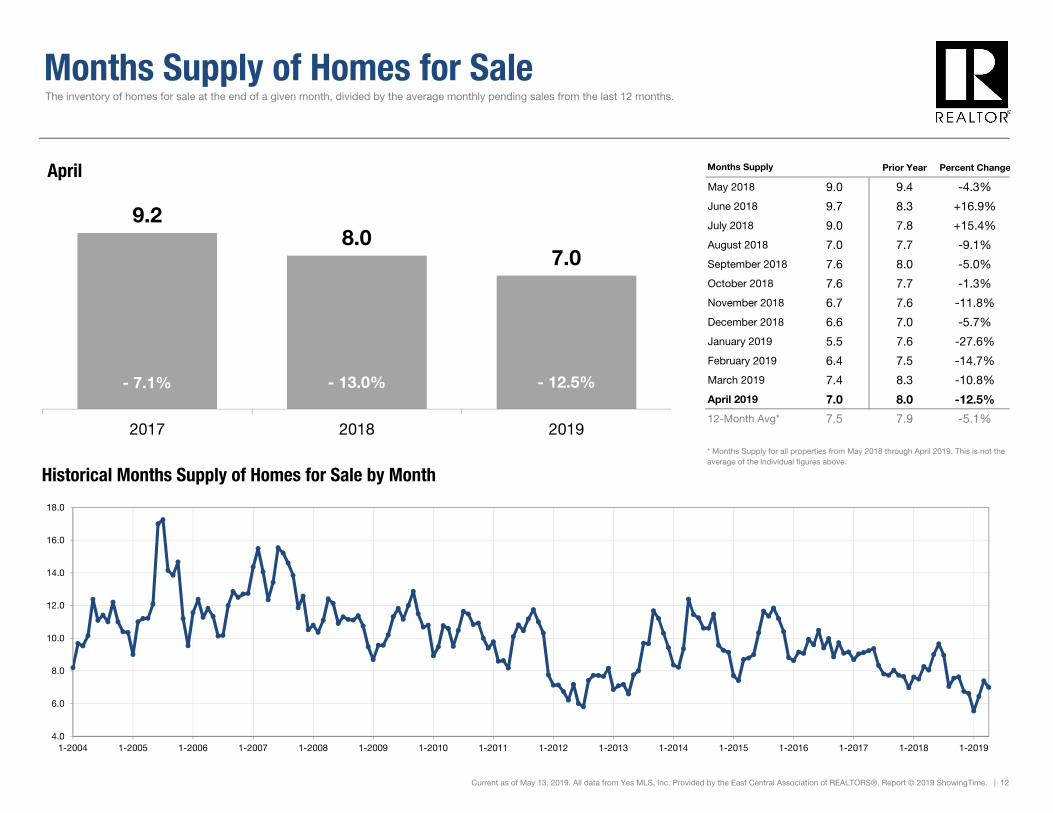
Months Supply of Homes for Sale
Prior Year Percent Change
May 2018 9.0 9.4 -4.3%
June 2018 9.7 8.3 +16.9%
July 2018 9.0 7.8 +15.4%
August 2018 7.0 7.7 -9.1%
September 2018 7.6 8.0 -5.0%
October 2018 7.6 7.7 -1.3%
November 2018 6.7 7.6 -11.8%
December 2018 6.6 7.0 -5.7%
January 2019 5.5 7.6 -27.6%
February 2019 6.4 7.5 -14.7%
March 2019 7.4 8.3 -10.8%
April 2019 7.0 8.0 -12.5%
12-Month Avg* 7.5 7.9 -5.1%
Historical Months Supply of Homes for Sale by Month
Current as of May 13, 2019. All data from Yes MLS, Inc. Provided by the East Central Association of REALTORS®. Report © 2019 ShowingTime. | 12
The inventory of homes for sale at the end of a given month, divided by the average monthly pending sales from the last 12 months.
Months Supply
* Months Supply for all properties from May 2018 through April 2019. This is not the average of the individual figures above.
9.28.0
7.0
2017 2018 2019
April
4.0
6.0
8.0
10.0
12.0
14.0
16.0
18.0
1-2004 1-2005 1-2006 1-2007 1-2008 1-2009 1-2010 1-2011 1-2012 1-2013 1-2014 1-2015 1-2016 1-2017 1-2018 1-2019
- 13.0% - 12.5%- 7.1%