Marine Studies: Coxswain Cert. Booklet VM3: Mathematics ... · “Deadly” is an Aboriginal word...
34
YuMi Deadly Maths Past Project Resource Marine Studies: Coxswain Certificate Mathematics behind Modelling Marine Environments Booklet VM3: Percentage, Coverage, and Box Models YUMI DEADLY CENTRE School of Curriculum Enquiries: +61 7 3138 0035 Email: [email protected] http://ydc.qut.edu.au
Transcript of Marine Studies: Coxswain Cert. Booklet VM3: Mathematics ... · “Deadly” is an Aboriginal word...

YuMi Deadly Maths Past Project Resource
Marine Studies: Coxswain Certificate
Mathematics behind Modelling Marine Environments
Booklet VM3: Percentage, Coverage, and Box Models
YUMI DEADLY CENTRE School of Curriculum
Enquiries: +61 7 3138 0035 Email: [email protected]
http://ydc.qut.edu.au

Acknowledgement
We acknowledge the traditional owners and custodians of the lands in which the mathematics ideas for this resource were developed, refined and presented in professional development sessions.
YuMi Deadly Centre
The YuMi Deadly Centre is a Research Centre within the Faculty of Education at Queensland University of Technology which aims to improve the mathematics learning, employment and life chances of Aboriginal and Torres Strait Islander and low socio-economic status students at early childhood, primary and secondary levels, in vocational education and training courses, and through a focus on community within schools and neighbourhoods. It grew out of a group that, at the time of this booklet, was called “Deadly Maths”.
“YuMi” is a Torres Strait Islander word meaning “you and me” but is used here with permission from the Torres Strait Islanders’ Regional Education Council to mean working together as a community for the betterment of education for all. “Deadly” is an Aboriginal word used widely across Australia to mean smart in terms of being the best one can be in learning and life.
YuMi Deadly Centre’s motif was developed by Blacklines to depict learning, empowerment, and growth within country/community. The three key elements are the individual (represented by the inner seed), the community (represented by the leaf), and the journey/pathway of learning (represented by the curved line which winds around and up through the leaf). As such, the motif illustrates the YuMi Deadly Centre’s vision: Growing community through education.
More information about the YuMi Deadly Centre can be found at http://ydc.qut.edu.au and staff can be contacted at [email protected].
Restricted waiver of copyright
This work is subject to a restricted waiver of copyright to allow copies to be made for educational purposes only, subject to the following conditions:
1. All copies shall be made without alteration or abridgement and must retain acknowledgement of the copyright.
2. The work must not be copied for the purposes of sale or hire or otherwise be used to derive revenue.
3. The restricted waiver of copyright is not transferable and may be withdrawn if any of these conditions are breached.
© QUT YuMi Deadly Centre 2008 Electronic edition 2011
School of Curriculum QUT Faculty of Education
S Block, Room S404, Victoria Park Road Kelvin Grove Qld 4059
Phone: +61 7 3138 0035 Fax: + 61 7 3138 3985
Email: [email protected] Website: http://ydc.qut.edu.au
CRICOS No. 00213J
This material has been developed as a part of the Australian School Innovation in Science, Technology and Mathematics Project entitled Enhancing Mathematics for Indigenous Vocational Education-Training Students, funded by the Australian Government Department of Education, Employment and Workplace Training as a part of the Boosting Innovation in Science, Technology and Mathematics Teaching (BISTMT) Programme.

Queensland University of Technology
DEADLY MATHS VET
Marine Studies: Coxswain Certificate
MATHEMATICS BEHIND MODELLING MARINE ENVIRONMENTS
BOOKLET VM3
PERCENTAGE, COVERAGE,
AND BOX MODELS
08/05/09
Research Team:
Tom J Cooper
Chris J Matthews
Annette R Baturo
with
Matthew T Michaelson
Elizabeth A Duus
Kaitlin M Moore
Deadly Maths Group
School of Mathematics, Science and Technology Education, Faculty of Education, QUT

YuMi Deadly Maths Past Project Resource © 2008, 2011 QUT YuMi Deadly Centre
Page ii ASISTEMVET08 Booklet VM3: Percentage, Coverage, and Box Models, 08/05/2009
THIS BOOKLET
This booklet (VM3) was the third booklet produced as material to support Indigenous
students completing certificates associated with Marine Studies at the TAFE campus on
Thursday Island run by Tagai College. It has been developed for teachers and students as
part of the ASISTM Project, Enhancing Mathematics for Indigenous Vocational Education-
Training Students. The project has been studying better ways to teach mathematics to
Indigenous VET students at Tagai College (Thursday Island campus), Tropical North
Queensland Institute of TAFE (Thursday Island Campus), Northern Peninsula Area College
(Bamaga campus), Barrier Reef Institute of TAFE/Kirwan SHS (Palm Island campus), Shalom
Christian College (Townsville), and Wadja Wadja High School (Woorabinda).
At the date of this publication, the Deadly Maths VET books produced are:
VB1: Mathematics behind whole-number place value and operations
Booklet 1: Using bundling sticks, MAB and money
VB2: Mathematics behind whole-number numeration and operations
Booklet 2: Using 99 boards, number lines, arrays, and multiplicative structure
VC1: Mathematics behind dome constructions using Earthbags
Booklet 1: Circles, area, volume and domes
VC2: Mathematics behind dome constructions using Earthbags
Booklet 2: Rate, ratio, speed and mixes
VC3: Mathematics behind construction in Horticulture
Booklet 3: Angle, area, shape and optimisation
VE1: Mathematics behind small engine repair and maintenance
Booklet 1: Number systems, metric and Imperial units, and formulae
VE2: Mathematics behind small engine repair and maintenance
Booklet 2: Rate, ratio, time, fuel, gearing and compression
VE3: Mathematics behind metal fabrication
Booklet 3: Division, angle, shape, formulae and optimisation
VM1: Mathematics behind handling small boats/ships
Booklet 1: Angle, distance, direction and navigation
VM2: Mathematics behind handling small boats/ships
Booklet 2: Rate, ratio, speed, fuel and tides
VM3: Mathematics behind modelling marine environments
Booklet 3: Percentage, coverage and box models
VR1: Mathematics behind handling money
Booklet 1: Whole-number and decimal numeration, operations and computation
YuMi Deadly Maths Past Project Resource © 2008, 2011 QUT YuMi Deadly Centre
Page iii ASISTEMVET08 Booklet VM3: Percentage, Coverage, and Box Models, 08/05/2009
CONTENTS
Page
OVERVIEW .......................................................................................................... 1
1. PERCENTAGE ................................................................................................. 6
1.1 Meaning of Percent ................................................................................. 6
2. COVERAGE AND DENSITY..............................................................................13
2.1 Coverage ..............................................................................................13
2.2 Density and coverage ............................................................................17
3. BOX MODEL ..................................................................................................19
3.1 Conceptualisation ..................................................................................19
3.2 Generalisation .......................................................................................20
4. MODELLING ENVIrONMENTS .........................................................................25
4.1 Computer models ..................................................................................25
4.2 Validation ..............................................................................................27


YuMi Deadly Maths Past Project Resource © 2008, 2011 QUT YuMi Deadly Centre
Page 1 ASISTEMVET08 Booklet VM3: Percentage, Coverage, and Box Models, 08/05/2009
OVERVIEW
Preamble
In previous books we have looked at the mathematics behind the Coxswain Certificate -
angle and distance, navigation, tides, and rates (speed, fuel consumption) and so on. In this
booklet, we look at another aspect of marine, the environment. Students at Tagai
Secondary Campus on Thursday Island are part of a project to look at seagrass coverage, an
important component of the ecosystem of the sea around the Torres Strait Islands.
The students estimate seagrass average from photographs. This combines two things – the
area covered and the thickness or density of the coverage. Thus percentage covers with
even covered and density into the thickness of the coverage.
Since seagrass is part of the ecosystem, there is a opportunity to introduce a simple
modelling method for ecological study, the box model.
Percent
Percent as per-cent means per hundred that in a common fraction. Thus 37% really means
37 hundredths or 37 parts per hundred. The best way to think of this in using a 10x10 grid
as below:
37%
This means that 100% is 100 hundredths, one whole, and that percentages over 100 are
greater than 1, for example:
100% = 1 145%
In terms of decimal factors, this means that percent are when the decimal points moves to
the hundredth (making this position the one).

YuMi Deadly Maths Past Project Resource © 2008, 2011 QUT YuMi Deadly Centre
Page 2 ASISTEMVET08 Booklet VM3: Percentage, Coverage, and Box Models, 08/05/2009
Thousa
nds
Hundre
ds
Tens
Ones
Tenth
s
Hundre
dth
s
Thousa
ndth
s
Thousa
nds
Hundre
ds
Tens
Ones
Tenth
s
Hundre
dth
s
Thousa
ndth
s
3 6 7 4 3 6 7 4
3.674 = 367.4%
Percent problems can be 3 types = (a) find 35% of $70, (b) find whole is 35% of $70, and
(c) $24 is what percent of $70. There are three ways of solving these problems,
(1) Picture (area model)
(2) Double Number Line
? = 100/35 x 70 = $200
(3) Change
Density
Density is normally a rate mass/volume – it gives an idea of the amount of material per
given volume. For example: lead has a higher density than water so it sinks, while wood has
a lower density so it floats. To get this normal form of density, divide mass by volume, for
example, 1.4kg/m3.
Density can also be used for area and length, but here it usually refers to how much mass,
volume or objects per area or per length are rather then how much mass per volume (which
is a 3D notion). Two examples here are farming (e.g., number of tonnes of fetrtilizer or
litres of pesticide per square kilometre or numbers of sheep per hectare) or traffic (e.g.,
number of cars per kilometre).
Two particular examples are pertinent to this booklet:
$ %
35 100
? 70
Part
End
Whole
Start
x %
$70 ? x 0.35
? = $70 ÷ 0.35 = $200
1% = $70/35 = $2
Thus, 100% = $200
35% $70
$?

YuMi Deadly Maths Past Project Resource © 2008, 2011 QUT YuMi Deadly Centre
Page 3 ASISTEMVET08 Booklet VM3: Percentage, Coverage, and Box Models, 08/05/2009
(1) density of decimals – number of numbers per given length (this can be seen as infinite
and independent of the length of the section in which density is being determined);
and
(2) density of vegetation – number of seagrass plants per square metre.
For seagrass, it would take a long time to count all the plants per given area, so the answer
is to count how many is a straight line. Then, area formulae will give a good estimate of the
number of plants in an area.
Box Model
A box model is a useful to model an environment. It is a
box or square with an input and an output.
The easiest thing to use the box model is a tank or a lake
– here the activity can be reduced to water in/water out.
However, it can also be used for more complex systems, e.g., populations of animals. Here,
input is new animals being born or arriving from outside, and output is animals dying or
leaving.
The box model allows students to represent change in terms of algebraic equations as the
input and output can vary like a variable. One way to introduce the box model and the
equations is to allow students to create their own symbols for the equations before adopting
normal algebra letters. This enables creativity and better ownership of the model.
For Indigenous students, the modelling activity can be based on a “care for country”
initiative that eventually will focus on an environmental problems.
Prior knowledge for box modelling
Understand simple arithmetic (addition and subtraction only)
Understand notion of unit in measurement
Know metric volume units for fluids
Able to calculate volume and surface area
Use Excel spreadsheet (including graphs)
Suggested sequence for learning the box model
OUT IN
10 m
10 m
20 Plants
Twenty plants in a 10m line would
mean that the number of plants in a
10m x 10m area would be 20 x 20 or
400. This would mean that the
density is 400 plants divide area of
10x10 or 100 square metres. This
gives a density of 400/100 = 4
plants per m2.

YuMi Deadly Maths Past Project Resource © 2008, 2011 QUT YuMi Deadly Centre
Page 4 ASISTEMVET08 Booklet VM3: Percentage, Coverage, and Box Models, 08/05/2009
(1) Develop a mathematical model that simulates the water level in a water tank attached
to a building within the school.
(2) Develop the model on paper and then execute within Excel. Excel will then be used to
explore the behaviour of the model and to start ask questions like, “Does the model
reflect reality?”
(3) Continue with the modelling, moving from tanks to more complex water systems, e.g.,
lakes.
(4) Design modelling activities such that, ultimately, students will get an understanding of
“what mathematical modelling is” and experience the modelling process.
(5) Use activities that monitor levels within a system that has inputs and outputs.
Students will learn what this model is, how and when to use it, and its advantages and
limitations.
(1) Extend the box model will be extended to other issues than water – e.g., population.
Definition of a box model
A box model is a way to consider real world situations by placing the world into a “box”
which has three characteristics: (1) an amount of an attribute within the box that is able to
vary; (2) an input that adds attribute; and (3) an output that removes attribute. Although
appearing to be too simple, the box model is capable of modelling complex environmental
situations – as a single box or as a collection of interaction boxes, where, e.g., the output of
one box becomes the input of the next box.
Development of box model mathematics
The box model will be developed though 4 stages.
(1) Conceptualisation – three sub-stages: (a) free discussion – discussing the real world
situation that will be modelled; conceptual model – developing a conceptual model of
how this reality can “sit in a box”; and mathematical model - building symbols and
relationships that mathematically show how the “box” works (this step uses that MAST
approach of allowing students to construct their own symbol systems).
(2) Generalisation – showing how the mathematics iterates around a time interval (called a
time step), and how findings can be generalised to algebraic relationships.
(3) Computer model – transferring the iterations to Excel spreadsheet so that ,many
iterations can be calculated quickly.
(4) Validation – using the Excel spreadsheet to apply the model in a real world situation to
see if it works in a “common
sense” manner.
Box modelling process
The process of modelling from real
world problem to real world solution is
as on right:
Mathematical
Analysis Mathematical
Model
Interpretation Formulation
Real-World
Situation
Mathematical
Results

YuMi Deadly Maths Past Project Resource © 2008, 2011 QUT YuMi Deadly Centre
Page 5 ASISTEMVET08 Booklet VM3: Percentage, Coverage, and Box Models, 08/05/2009
Pedagogy
(1) Place all mathematics teaching possible within the context of marine activity within the
context of the students (Island living and Torres Strait Islander culture).
(2) Focus mathematics teaching on mathematics as a whole structure, its pattern and
interactions. This means that mathematics teaching needs to focus on understanding
how mathematics is related, sequenced and integrated, that is, on the connections
between mathematics.
(3) There possible, begin all teaching using whole body of students (kinaesthetic) then
move to using material, computers and pictures (modelling) and then to having
student think of a “picture in the mind” (imagining), that is, use a variety of
representation that follow this sequence:
(4) Relate real world situations (within the context of the
students) to models of the mathematics and then to
language and finally to symbols (the Payne-Rathmell
triangle as on the right)
(5) Use the generic pedagogies of generalising, reversing
and being flexible, that it, ensuring that the most
general understanding possible is developed, that
activities move in both directions (model to symbol
and symbol to model), and that students have flexible
understandings of concepts and processes (including
language).
Real world
situation
Models Models
Models
Kinaesthetic Modelling Imagining
YuMi Deadly Maths Past Project Resource © 2008, 2011 QUT YuMi Deadly Centre
Page 6 ASISTEMVET08 Booklet VM3: Percentage, Coverage, and Box Models, 08/05/2009
1. PERCENTAGE
1.1 Meaning of Percent
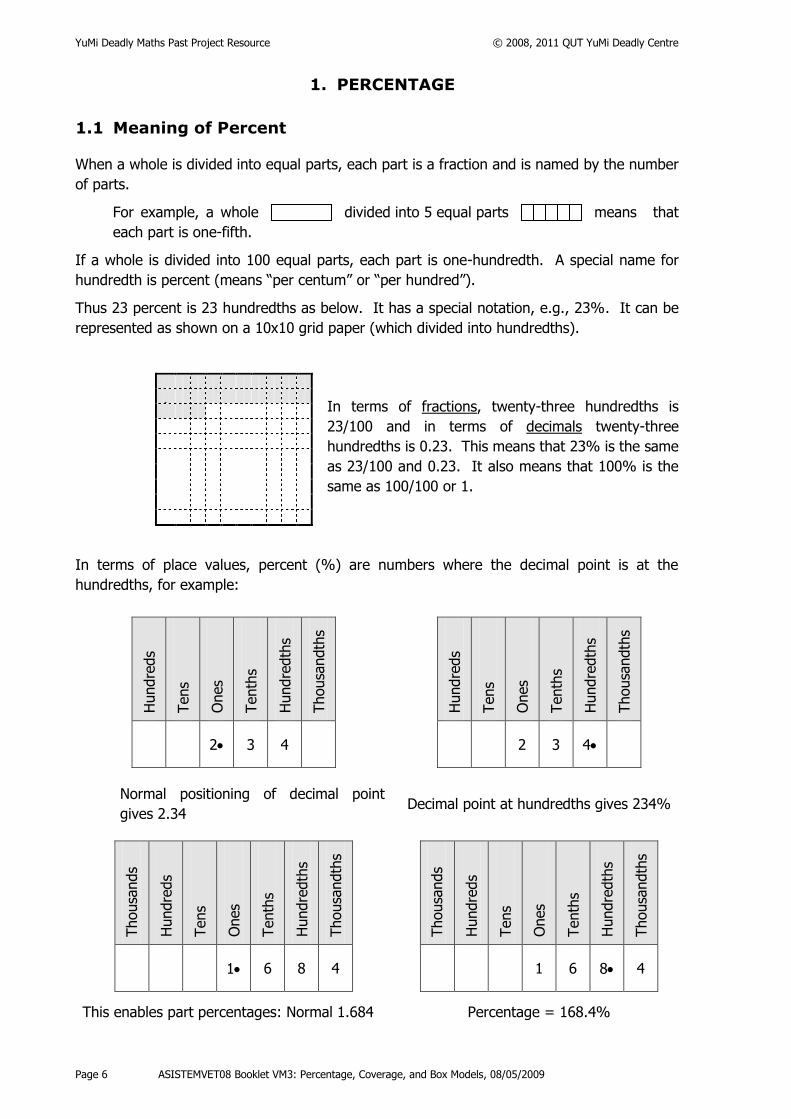
When a whole is divided into equal parts, each part is a fraction and is named by the number
of parts.
For example, a whole divided into 5 equal parts means that
each part is one-fifth.
If a whole is divided into 100 equal parts, each part is one-hundredth. A special name for
hundredth is percent (means “per centum” or “per hundred”).
Thus 23 percent is 23 hundredths as below. It has a special notation, e.g., 23%. It can be
represented as shown on a 10x10 grid paper (which divided into hundredths).
.
In terms of fractions, twenty-three hundredths is
23/100 and in terms of decimals twenty-three
hundredths is 0.23. This means that 23% is the same
as 23/100 and 0.23. It also means that 100% is the
same as 100/100 or 1.
In terms of place values, percent (%) are numbers where the decimal point is at the
hundredths, for example:
Hundre
ds
Tens
Ones
Tenth
s
Hundre
dth
s
Thousa
ndth
s
2 3 4
Hundre
ds
Tens
Ones
Tenth
s
Hundre
dth
s
Thousa
ndth
s
2 3 4
Normal positioning of decimal point
gives 2.34 Decimal point at hundredths gives 234%
Thousa
nds
Hundre
ds
Tens
Ones
Tenth
s
Hundre
dth
s
Thousa
ndth
s
1 6 8 4
Thousa
nds
Hundre
ds
Tens
Ones
Tenth
s
Hundre
dth
s
Thousa
ndth
s
1 6 8 4
This enables part percentages: Normal 1.684 Percentage = 168.4%

YuMi Deadly Maths Past Project Resource © 2008, 2011 QUT YuMi Deadly Centre
Page 7 ASISTEMVET08 Booklet VM3: Percentage, Coverage, and Box Models, 08/05/2009
Percent activities
(1) Shade the following on the attached page
(a) 36% (b) 217% (c) 0.78% (d) 182/100
(2) Write the shading as shown (as a percent % and as a decimal)
Percent = .
Decimal = .
Percent = .
Decimal = .
(3) Write these numbers on the place value chart:
(a) 34%
(b)371%
(c) 42.6%
(d) 3200%
Thousa
nds
Hundre
ds
Tens
Ones
Tenth
s
Hundre
dth
s
Thousa
ndth
s

YuMi Deadly Maths Past Project Resource © 2008, 2011 QUT YuMi Deadly Centre
Page 8 ASISTEMVET08 Booklet VM3: Percentage, Coverage, and Box Models, 08/05/2009
(4) Write these numbers as decimals and percentages
Thousa
nds
Hundre
ds
Tens
Ones
Tenth
s
Hundre
dth
s
Thousa
ndth
s
Dec. %
(a) 1 4
(b) 2 9
(c) 3 6 4 2
(d) 4 0 1 4
(5) Complete the following table - fill in all cells (the first one has been done for you).
% 37% 48% 7%
Fraction 37/100 64/100 86/100
Decimal 0.37 0.28 0.91
(6) Percent (%) can be more than 1, complete the following- fill in all cells (the first one
has been done for you).
% 343% 436% 382%
Fraction 343/100 561/100 111/100
Decimal 3.43 1.28 2.06

YuMi Deadly Maths Past Project Resource © 2008, 2011 QUT YuMi Deadly Centre
Page 9 ASISTEMVET08 Booklet VM3: Percentage, Coverage, and Box Models, 08/05/2009
10x10 grids for % activities

YuMi Deadly Maths Past Project Resource © 2008, 2011 QUT YuMi Deadly Centre
Page 10 ASISTEMVET08 Booklet VM3: Percentage, Coverage, and Box Models, 08/05/2009
Percent Calculations
There are three types of percent calculations
Type 1: Percentage unknown Find 85% is $68. This is straight forward
multiplication (e.g., 0.85 x 68 = $57.80)
Type 2: Total unknown 85% is $68, what is the total? This is division (e.g.,
68 ÷ 0.85 = $80)
Type 3: Percent unknown What % of $68 is $51? This is also division (e.g., %
is 51/68 x 100/1 = 75%)
There are three ways to solve the problems:
(1) Use a diagram
Type 1 Drawing Working
What is
85% of $68?
100% = $68
1% = 68 / 100
85% = 85 x 68 / 100
Type 2 Drawing Working
85% is $68,
what is the
total?
85% = $68
1% = 68 / 85
100% = 100 x 68 / 85
Type 3 Drawing Working
What % of $68
Is $51
$68 = 100%
$1 = 100 / 68
$51 =51 x 100 / 68
$68
$68 ?
?
$68
Seagra
ss
Seabe
d

YuMi Deadly Maths Past Project Resource © 2008, 2011 QUT YuMi Deadly Centre
Page 11 ASISTEMVET08 Booklet VM3: Percentage, Coverage, and Box Models, 08/05/2009
(2) Double number line
Type 1: Drawing: Working:
What is
85% of
$68?
$? = $68 x 85/100
Type 2: Drawing: Working:
$68 is 85%,
what is the
total?
$? = 68 x 100/85
Type 3: Drawing: Working:
What % of
$68 is $51?
$? = 100 x 51/68
(3) Multiplication change diagram
The change diagram is:
Total x Percent
Percentage
Multiply to find percentage, divide to find total or percent.
Problem Drawing Working
Type 1:
$68 x 0.85
? ? = $68 x 0.85
Type 2:
? x 0.85
$68 ? = 68 / 0.85
Type 3:
$68 x ? $51 ? = 51 / 68
$ %
x85/100
85 100
x85/100
68 $ ?
$ %
x100/85
85 100
x100/85
$ ? 68
$ %
x51/68
? 100
x51/68
68 51

YuMi Deadly Maths Past Project Resource © 2008, 2011 QUT YuMi Deadly Centre
Page 12 ASISTEMVET08 Booklet VM3: Percentage, Coverage, and Box Models, 08/05/2009
Percent calculation activities
Solve the following (use a calculator) by all 3 methods.
Problem 10x10 grid Drawing Double number line Change diagram
(1) John paid 65%
of the cost of a
TV. The TV
cost $185.
How much did
John pay?
(2) June paid $125.
This was 45%
of the cost of
the TV. How
much did the
TV cost?
(3) Fred paid $250
towards a $375
TV. What
percentage (%)
did Fred pay?

YuMi Deadly Maths Past Project Resource © 2008, 2011 QUT YuMi Deadly Centre
Page 13 ASISTEMVET08 Booklet VM3: Percentage, Coverage, and Box Models, 08/05/2009
2. COVERAGE AND DENSITY
2.1 Coverage
When studying marine environments, it is useful to be able to record the extent to which an
animal or fish is present in the ocean or the extent to which a plant (e.g. seaweed or
seagrass) covers the ocean floor. In this way we can measure the health of the sea or
determine the effect on the number of animals (fish from hunting or fishing). There are a lot
of situations; we will look at some of them.
(1) Photographic (e.g., plane, satellite) records:
These often divide the land or sea into square grids. The picture shows where they,
say, grass covers the sea bed. Using a plastic 10x10 overlay to enable the percentage
coverage to be determined. For example:
Small squares
that are all
covered or
more than ½
covered with
seagrass are
counted.
Squares with
no seagrass
or less than
½ covered
are not
counted.
Say 37
squares are
counted.
The percent
coverage is
the number
of small
overlay
squares. i.e.
37%. Square grid, seagrass
area shaded.
10x10 overlay placed on
top of square grid.
(2) Photographic records – all square, not
seabed
These are again square grids. But now the
picture shows land, seabed and seagrass. For
example: see diagram on right.
Once again a 10x10 overlay can be used, as in
the example below (but there is now a
complication):
Land
Seagrass

YuMi Deadly Maths Past Project Resource © 2008, 2011 QUT YuMi Deadly Centre
Page 14 ASISTEMVET08 Booklet VM3: Percentage, Coverage, and Box Models, 08/05/2009
The number of squares in or more
than ½ in seabed gives the
percentage of the diagram that is
seabed (say 72 squares). The
number of squares in or more than
½ in the seagrass gives the
percentage of the diagram that is
seagrass (say 24 squares). Island, seabed and
seagrass.
10x10 overlay placed on
top of square grid.
If we are looking a coverage of seagrass across sea and land, then 24% is the answer (24
squares out of 100 squares). However, if we want the coverage of seagrass in relation to
the sea only, we have to take into account that the seabed is only 72 squares of the diagram
and the 24 squares of seagrass has to be looked at in relation to this 72 squares to find the
%.
There are many ways to calculate this percent.
(i) To make the seagrass a percent, requires the seabed to be 100%.
Thus the 72 squares has to change to 100, that is x 100/72. Then
the seagrass must change accordingly, thus the percent coverage is:
24 x 100/72 = 33.33%
(ii) Consider the seagrass as a factor of the seabed. This would be:
Seagrass/Seabed = 24/72 = 1/3 which is 33.33%
(3) Real situations
Here a seabed is drawn that is to be considered with the positions of seagrass marked on it.
For example:
Here an overlay just of squares is used (does not have to be 100).
Numbers of overlay squares
inside seabed and inside
seagrass are calculated in.
For example, say 96
squares for seabed and 36
squares for seagrass.
Seagrass
Seabed and seagrass Overlay put on top

YuMi Deadly Maths Past Project Resource © 2008, 2011 QUT YuMi Deadly Centre
Page 15 ASISTEMVET08 Booklet VM3: Percentage, Coverage, and Box Models, 08/05/2009
The percent of seagrass is calculated using method (b) above. For example:
Seagrass/seabed -= 36/96 = 3/8 0.375 which is 37.5%
Coverage Exercises
Trace diagrams onto overlay (or 10x10 grid) and work out
the percent coverage of seagrass on the seabed. Estimate
first, look at the difference between the estimate and
correct answer, and try to do a better estimate for the
next example.
Overlay
(1)
(3)
(2)
(4)

YuMi Deadly Maths Past Project Resource © 2008, 2011 QUT YuMi Deadly Centre
Page 16 ASISTEMVET08 Booklet VM3: Percentage, Coverage, and Box Models, 08/05/2009
(5)
(6) (7)
(8)

YuMi Deadly Maths Past Project Resource © 2008, 2011 QUT YuMi Deadly Centre
Page 17 ASISTEMVET08 Booklet VM3: Percentage, Coverage, and Box Models, 08/05/2009
2.2 Density and coverage
Of course, seagrass being something that is eaten by fish has attributes other than
coverage. One of these is density. How many plants in a given area? A low density
coverage in a large area may be less effective in terms of fish food than a high density
coverage of a smaller area.
Density
Density can be worked out in more than one way. We will look at two of them.
(1) By inspection
The number of plants can be simply counted. One way to do this is to follow a line
across the seagrass counting plants. This will give the number of plants per metre.
This is more accurate if more than one count in more than one direction is made and
over a reasonably long distance.
If there is an average of 3 plants per metre, then
the average number of plants per square metre is 3
x 3 or 9 plants as in the example on right.
If the best possible density is known (say this is 12
plants per square metre), then a percent density can
be found as follows:
Density of plants is actual number of plants/m
divided by maximum number of plants/m:
= 9/12 = 3/5 = 0.75
or 75%
(2) By photographs
Different density seagrass crops can give different colours on a picture. With
experience, a density could be given from the picture. It may only be a general
indication, that is, only 25%, 50%, 70% and 100% may be possible to ascertain.
Total coverage.
To find the total coverage, we have to combine density and coverage. If the percent
coverage of seagrass is 35% and the seagrass has a density of 75%, then the percent of
seagrass available is 35% of 75% which can be determined two ways:
(a) 35% x 75% = 35/100 x 75/100 = 2625/10000 = 26.25/100 = 26.25%
(b) 0.35 x 0.75 = 0.2625 which is 26.25%
Density and coverage activities:
(3) Calculate densities for the following inspection:
a. Seagrass was 24 plants in 10 metres; greatest possible density of plants is 8.8
per meter?
b. Seagrass was 36 plants in 20 metres; greatest possible density was 5.4 plants
per metre2?
6 THE
RELA
TION
SHIP
BET
WEE
N
LIFE
AND
MAT
HS
1m
1
1m
1 Sym
bols
Cre
ativ
e
Cult
ural
bias
6 THE
RELA
TION
SHIP
BET
WEE
N
LIFE
AND
MAT
HS
1m
1
1m
1

YuMi Deadly Maths Past Project Resource © 2008, 2011 QUT YuMi Deadly Centre
Page 18 ASISTEMVET08 Booklet VM3: Percentage, Coverage, and Box Models, 08/05/2009
c. Seagrass was 16 plants in 5 metres; greatest possible density was 14.2 plants
per metre2?
(4) Densities from photographs were:
25% 50% 75% 100%
Estimate densities for these pictures
(a) (b) (c) (d)
(5) Calculate total coverage for the following:
a. coverage 35% and density 50%
b. coverage 62% and density 26%
c. coverage 72% and density 75% for ¼ and 50% for ¾.
(6) Calculate total covrage for the following:
a. 135 plants in 20 m, maximum coverage 200 plants/m2, coverage 86% of
seabed
b. 185 plants in 50m, maximum coverage 15.6 plants/m2, coverage 43% of
seabed
c. Seabed in 73% of area, two areas of seagrass - first area is 27% of area and
is 42 plants for 10m and the second area is 24% of area and is 27 plants in
10m – maximum coverage is 26.8 plants/m2.

YuMi Deadly Maths Past Project Resource © 2008, 2011 QUT YuMi Deadly Centre
Page 19 ASISTEMVET08 Booklet VM3: Percentage, Coverage, and Box Models, 08/05/2009
3. BOX MODEL
3.1 Conceptualisation
The building of a box model follows the normal
framework for modelling – a mathematical model is
developed from real life, used to solve problems and
then the solution is interpreted in the real world. It has
two stages as follows. These stages will be described
for a box model of a rainwater tank.
A box model is simple – it represents a situation with an input and output.
(1) Free discussion
The development begins with free discussion. Students are asked to think about the
story of the water tank and answer questions regarding the tank, for example, (a)
what is the function of the water tank, (b) where does the water come from, (c) where
does the water go, and (d) is the water used up in any way?
*Teacher note: At this stage, we need not worry about the overflow part of the tank.
If students raise the issue, reinforce that it is a good suggestion and we will come back
to this later.
(2) Conceptual to mathematical model
Here the students conceives of the model by looking at
components and developing symbols. The steps are as
follows.
The students free draw the water tank
connected to a building (as on right).
The drawing (and the students’ conceptual
understanding of the model) should clearly
show the water flows into and out of the tank;
The students create symbols for the input and output, i.e., the water flowing into
the tank and the water flowing out. These symbols can be compound and reflect
where the water comes from and where it goes, e.g.,
Input: roof water; Output leaving water
Note: The compound symbols, such as for roof water, are appropriate because they
represent where the water comes from and goes to, but other symbols will do, even
algebraic ones, if they have meaning to the students.
Discuss with students the effect of input and output on the model (what changes?)
and identify a name for this (water level)
Discuss what happens to the water level in the tank, e.g.,
They use their symbols to show the water level going up
or the water level going down t could go down
In
Out
Everyday
life
Abstraction
Reflection
Mathematics
Cultural
bias
Creative Symbols

YuMi Deadly Maths Past Project Resource © 2008, 2011 QUT YuMi Deadly Centre
Page 20 ASISTEMVET08 Booklet VM3: Percentage, Coverage, and Box Models, 08/05/2009
Discuss with the students whether it is important to know the water level over time
(e.g., water conservation issues, economic and environment consideration).
Conceptualisation activities
Build a box model for each of the scenarios below. For each model, ensure you develop the
following:
a drawing of their model for the situation;
relevant symbols for input and output (note – can have more than one type of input
and output);
the effect of changes in input and output the name of the result of this effect; and
equations that show the changes in the the effect.
(1) A lake which is filled by rain and emptied by evaporation.
(2) A dam which is filled by rain and water pumped out of a bore and emptied by
evaporation and irrigation of a crop.
(3) A small country town – make up your own inputs and outputs.
3.2 Generalisation
To use the box model to help understand reality, we have to understand how it allows us to
understand what happens across time. This requires the model to be generalised and this
uses the idea of iteration (cycles of regular activity) and patterns. Again we use the water
tank as an example, and we follow these four stages.
(1) Time steps and relationships
Discuss with the students what we are modelling until they focus on the crucial feature, that
is, the effect of the inputs and outputs, the water level in the water tank. Introduce the idea
of a starting point in time (the technical term for this is initial condition)’. Ask questions such
as: What is the initial condition of the tank? Is it half full? Is it empty? And so on. Stress
the need for a starting level in the tank. Go through these steps:
Create a symbol for the initial water level in the tank, e.g., the symbols on
right.
Introduce to the students the idea of a time step as a period of time across which
we watch for change. For the tank, discuss possibilities, e.g., 1 day.
Ask what happens after 1 day (or one time step), i.e., we will have a new water
level.
Create a symbol for the new water level at the end of the time step,
e.g., as on right
Discuss relationships within the model – look at how water levels on one day are affected by
the levels on the previous day, the input from the roof and the output to the house. Discuss
how we could “tell the story” of a day in the life of the tank using our created symbols and
the symbols for equals, addition and subtraction. Use the following steps:

YuMi Deadly Maths Past Project Resource © 2008, 2011 QUT YuMi Deadly Centre
Page 21 ASISTEMVET08 Booklet VM3: Percentage, Coverage, and Box Models, 08/05/2009
construct it in words first, “the water level at the end of the day (or the start of the
new day) is the water level at the start of the previous day plus inputs and subtract
outputs”;
write this is “shorthand”, e.g., new level = old level plus input subtract output;
replace with symbols, writing down how we can calculate the new water level, e.g.,
= + - ; and
read these symbols and tell the story they represent.
(2) Units of measurement
Discuss how we can make this model more real. Focus on measurement. Ask questions
such as: How is water measured when it is in tanks? Then:
guide the students in a discussion about volume and how it is measured;
decide on a unit, e.g., litres, and discuss the need to maintain this unit throughout
the model;
discuss what would be a normal size tank for a school and how we could find out;
discuss what would be the normal initial water level ( ) for a new tank and for an
existing tank; and
get the students to convert their decision on into the chosen measurement, e.g.,
litres.
Note that the initial level or the initial condition in a box model can be chosen by the
students, e.g., ½ full, empty, ¼ full.
(3) Calculation
Look at how water comes in (inputs) and goes out (outputs)? Start with inputs? How do we
calculate the water contribution from the roof ( )? Guide the students through a
discussion on rainwater measurements, surface area of the roof. Ask questions concerning:
what units should we use, that is, the same as the water level; and
and how we convert into the chosen measurement, e.g., litres.
Discuss how we calculate the amount of water coming out from the tank ( ). Use the
example of a known tank (e.g., a tank at a building that all/most students know):
discuss water uses in of that tank;
estimate a daily usage from the above discussion; and
convert into the chosen units, e.g., litres.
Calculate the new water level for the chosen time step, one day – remember the formula:
= + -
put your calculations for , and into the equation;
discuss what happens; and
explain why the water level goes up (or goes down) and by how much.

YuMi Deadly Maths Past Project Resource © 2008, 2011 QUT YuMi Deadly Centre
Page 22 ASISTEMVET08 Booklet VM3: Percentage, Coverage, and Box Models, 08/05/2009
(4) Iteration and generalisation
We know look at how we can go beyond one step. However, each time step/day has its own
equation. Writing the equation twice could be confusing. So we need a way to differentiate
between the days? This is how it can be done:
get students to look at a timeline of three days and consider how we can
differentiate between the symbols for day 1, day 2 and day 3;
0 1 2
3
encourage students to consider subscripts, for example, give everything between 0
and 1 in day 1 a subscript 0, everything between 1 and 2 in day 2 a subscript 1, and
everything between 1 and 2 in day 2 a subscript 1 (and so on), and look again at
the timeline (Note – giving the first day 0 is a convention of modelling); and
0 1 2
3
use the formula to calculate the end of day water level for each day (do the first
two for the students and then ask them to complete the remaining.
day 1 = + -
day 2 = + -
day 3 =
day 4 =
day 5 =
Discuss what changed for each of the days and why, for example:
will be different because rainfall is not the same each day;
will be different because water usage is usually different for each day;
will be different because water level will be different; and
will be different because the final water level will be different because it is
based on the other three things.
Discuss what is the same between the days, looking particularly at and . Discuss
how and are related. Argue how the water level at the end of day 1 is the same
as the water level at the beginning of day 2. Therefore = .
0 0 0 0
1 1 1 1
4
2
3
0 1
0 1
0 0 0 0
1 1 1 1
22
2 22
2 32
1

YuMi Deadly Maths Past Project Resource © 2008, 2011 QUT YuMi Deadly Centre
Page 23 ASISTEMVET08 Booklet VM3: Percentage, Coverage, and Box Models, 08/05/2009
Replace at the end of each day with at the start of the next day, as is shown in the
timeline:
0 1 2
3
Redo the calculation for each day (once again, do the first two and get the students to
complete the next three):
day 1 = + -
day 2 = + -
day 3 =
day 4 =
day 5 =
Discuss generalising the “rule” for the calculation. Do this is three steps.
specific examples, e.g., work out the calculation for day 7, day 11, day 45 and day
173;
day 7 = + -
day 11 =
day 45 =
day 173 =
language, state the calculation in words for any day; and
variable, determine the calculation when n is let stand for any day
day n =
Note: The problem in generalising to n is that we have to work out how to write 1 less than
n. which is (n-1).
Generalising activities
(1) Complete all the unfinished sections of the above activities.
01
0 0 1 1 1 22
2 22
32
n
6 6
11
45
173
7
3
4
0 0 0
1 1 1
1
2
5

YuMi Deadly Maths Past Project Resource © 2008, 2011 QUT YuMi Deadly Centre
Page 24 ASISTEMVET08 Booklet VM3: Percentage, Coverage, and Box Models, 08/05/2009
(2) Develop the generalisation for the three situations from the Conceptualisation
activities, namely, the lake situation, the dam situation, and the small country town
situation:
determining time steps and relationships appropriate for each situation;
determining appropriate units of measurement (if relevant) for each situation;
undertake the necessary calculations for each situation; and
set up the iterations and subscripts and determine the generalisation for each
situation.

YuMi Deadly Maths Past Project Resource © 2008, 2011 QUT YuMi Deadly Centre
Page 25 ASISTEMVET08 Booklet VM3: Percentage, Coverage, and Box Models, 08/05/2009
4. MODELLING ENVIRONMENTS
4.1 Computer models
To model real environments requires the use of computers, notably spreadsheets, to follow
the iterations and translate the formulae into reality (and numbers). Again this will be
explored using the example of the water tank. Three stages are provided.
(1) Initial days
Suggest to the students that you wish to model the water level in the tank for five days.
Discuss what has to be worked out across the 5 days as follows.
use data from the end of step 3 to work out values for 5 days – , &
for day 1; & for day 2; & for day 3; and so on for 5 days;
with this information, water levels can be calculated at the end of each day, e.g.,
day 1 = + -
day 2 = + - and so on for 5 days;
and
using pen and paper (and a calculator), calculate water levels at the end of the first
5 days by putting in values and calculating to .
(2) Computers
Discuss how we could do the calculations for 20 or 30 days. Discuss implementing the
model in Excel. Start again with 5 days. Construct a table in Excel (see below), starting in
cell “A1”, i.e., column A, row 1, and using the following headings:
Column A represents our day counter - the same as the subscript in the equations. So start
your counter from zero in column A and end on five (look back to your equations to
understand why).
To build the excel worksheet, reflect back on what else is required. Encourage students to
see that they need to put in the starting point (the ‘initial condition’). Consider the equations
and generate a discussion re where the Initial Condition could be put (and why it should be
put there).
0 0 0 1
1 1 2
02
0 02
12
1 22
2
12
52

YuMi Deadly Maths Past Project Resource © 2008, 2011 QUT YuMi Deadly Centre
Page 26 ASISTEMVET08 Booklet VM3: Percentage, Coverage, and Box Models, 08/05/2009
Include the initial condition in column D, row 2 (under water level), i.e., D2 cell. Also place
the words “Initial condition” in the cell E2 to remind us what this number represents.
Add in the information available in terms of Input and Output. Then, your final spreadsheet
should look like below.
(3) Excel calculation
The next step is to set up Excel so that it will calculate the water level at the end of day 1 –
this calculation will be placed in cell D3. To do this:
look back at the equations for water level – consider the one that calculates;
day 1 = + -
Identify which cells relate to these symbols, e.g.:
relates to cell D2 (Initial condition);
relates to cell B2; and
relates to cell C2;
(note that these symbols have zero subscripts and that their day counter is also
zero);
write the above equation in terms of cell numbers, i.e., D3 = D2 + B2 – C2
enter the right-hand side of the equation into the cell D3 for Excel (to do this move
your curser to D3 and type the following: = D2 + B2 – C2); and
hit the enter button and check you answer against your hand calculation.
Computer models activities
Set up an excel spreadsheet for the three situations from Section 4.1:
(1) A lake which is filled by rain and emptied by evaporation.
(2) A dam which is filled by rain and water pumped out of a bore and emptied by
evaporation and irrigation of a crop.
0 0 0 1
02
0
012

YuMi Deadly Maths Past Project Resource © 2008, 2011 QUT YuMi Deadly Centre
Page 27 ASISTEMVET08 Booklet VM3: Percentage, Coverage, and Box Models, 08/05/2009
(3) A small country town – make up your own inputs and outputs.
4.2 Validation
The last step in the computer model is to set up Excel so that it can undertake all
calculations at once. These calculations will validate the model as well as being an
application of the model. There are three stages.
(1) Pattern
The first stage is to recognise the pattern in the Excel cell equations:
look at days 1 and 2, the time steps to the end of days 1 and 2, and remember that
the equations are:
day 1 = + -
day 2 = + -
identify which cells relate to these symbols and put the cell equation as follows:
day 1 D4 = +D3 + B3 – C3 ; and
reflect back to the equation and point out the iterative pattern:
day 2 D5 = +D4 + B4 – C4 ; and
day 3 D6 = +D5 + B5 – C5 .
(2) Copy and paste
The next stage is to complete the days that are required by copying and pasting. Once you
have a certain equation structure, excel can be set up to repeat that pattern. Therefore, you
can cut and paste the equation for day 1 into the cell for day 2 (i.e., D5) and the equation
should have the right structure. This is how it works:
move your curser to cell D4, click copy in the Edit menu, move your curser to cell
D5, and click paste in the Edit menu.
check the cell equation in D5 to ensure that the cell has +D4 + B4 – C3; and
continue cutting and pasting down the column.
Note: A copy of the cell equation can be pasted into many cells at once by using paste
special from the Edit menu. Discuss how this is done.
(3) Model reality
Look at the results from the Excel calculations. Try different Initial Conditions and different
inputs and outputs. For example, what would happen if inputs and outputs were always the
same? Do the results make sense?. Try some other scenarios, e.g., start with a full tank,
always take out more than put in. What happens here? Does this new scenario make
sense.
If the Excel tank acts like a real tank, i.e., the scenarios make sense, there is a good chance
that the model is working.
0 0 0 1
1 1 1 2

YuMi Deadly Maths Past Project Resource © 2008, 2011 QUT YuMi Deadly Centre
Page 28 ASISTEMVET08 Booklet VM3: Percentage, Coverage, and Box Models, 08/05/2009
Validation and application activities
(1) Run various scenarios for the water tank using Excel and check for sensibleness.
(2) Run various scenarios using Excel for the three Section 4.1 situations:
A lake which is filled by rain and emptied by evaporation.
A dam which is filled by rain and water pumped out of a bore and emptied by
evaporation and irrigation of a crop.
A small country town – make up your own inputs and outputs.
(3) Use the box model and excel to run a model of a marine environment that is relevant
for your context. For example, you could look at fish or animal stocks, pollution, and
so on.
Special Seagrass activity
(1) Build a model for seagrass – the amount of seagrass is the “water level”
the input is things that increase the amount of seagrass (e.g., things
that stimulate growth of existing seagrass and/or spread of seagrass to
new plants, decrease in fish that eat seagrass, good growing conditions,
etc.), and
the output is things that decrease the amount of seagrass (e.g.,
increase in fish eating the grass, condition that cause grass to die such
as pollution, etc.).
(2) Transfer the mathematics of the model to an Excel spreadsheet.
(3) Adjust inputs and outputs and run the spreadsheet to get the same results
as are happening in the real world.
(4) Discuss reasons for seagrass changes.