Marine Photosynthesis & Primary Production in the Ocean
37
Marine Photosynthesis & Primary Marine Photosynthesis & Primary Production in the Ocean Production in the Ocean Roadmap for this class session: 1. Photosynthesis (refresher) & primary production (some terminology) 2. PS & PP vs. irradiance relationships (P-I curves) 3. PS & PP vs. nutrient concentrations (Michaelis-Menten et al.) 4. PS & PP vs. temperature (Eppley curves) 5. 4 common approaches for measuring primary productivity 6. Some discussion on Martin et al.1994
Transcript of Marine Photosynthesis & Primary Production in the Ocean
Marine Photosynthesis & Primary Marine Photosynthesis & Primary Production in the OceanProduction in the Ocean
Roadmap for this class session:
1. Photosynthesis (refresher) & primary production (some terminology)
2. PS & PP vs. irradiance relationships (P-I curves)
3. PS & PP vs. nutrient concentrations (Michaelis-Menten et al.)
4. PS & PP vs. temperature (Eppley curves)
5. 4 common approaches for measuring primary productivity
6. Some discussion on Martin et al.1994
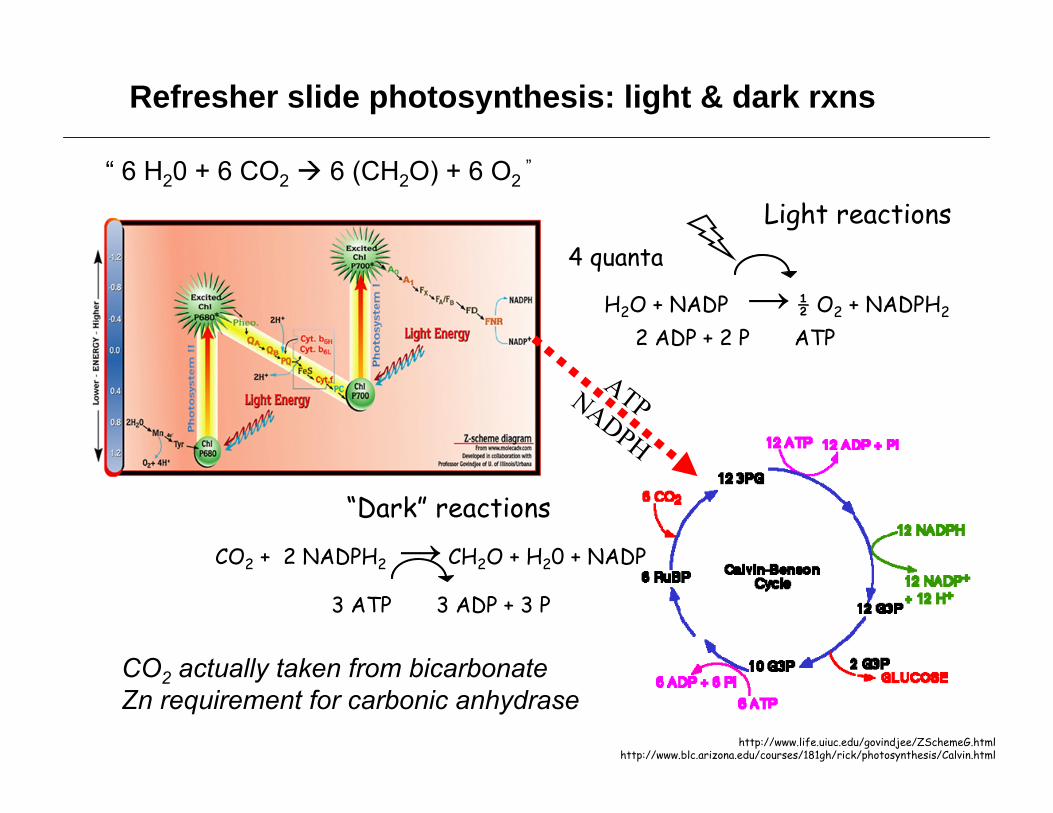
http://www.life.uiuc.edu/govindjee/ZSchemeG.htmlhttp://www.blc.arizona.edu/courses/181gh/rick/photosynthesis/Calvin.html
Light reactions4 quanta
H2O + NADP → ½ O2 + NADPH2
“Dark” reactions
CO2 + 2 NADPH2 → CH2O + H20 + NADP
2 ADP + 2 P ATP
3 ATP 3 ADP + 3 P
“ 6 H20 + 6 CO2 6 (CH2O) + 6 O2 ”
ATPNADPH
Refresher slide photosynthesis: light & dark rxns
CO2 actually taken from bicarbonateZn requirement for carbonic anhydrase
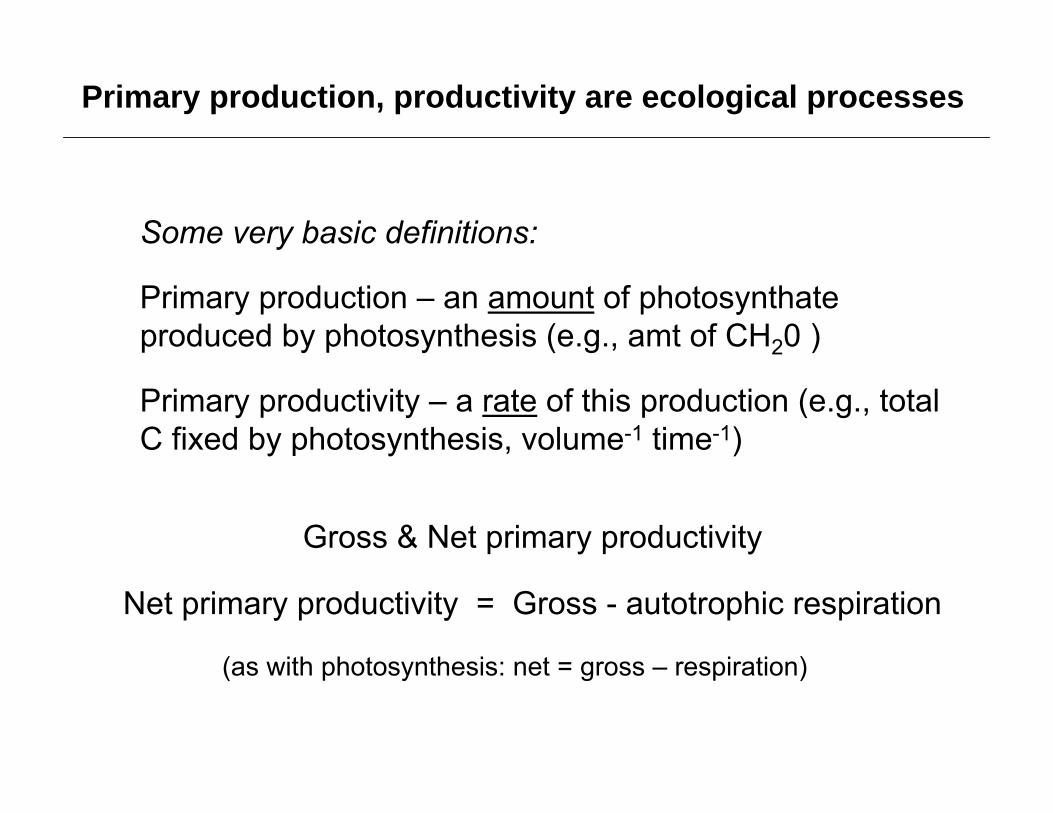
Gross & Net primary productivity
Net primary productivity = Gross - autotrophic respiration
Some very basic definitions:
Primary production – an amount of photosynthateproduced by photosynthesis (e.g., amt of CH20 )
Primary productivity – a rate of this production (e.g., total C fixed by photosynthesis, volume-1 time-1)
(as with photosynthesis: net = gross – respiration)
Primary production, productivity are ecological processes
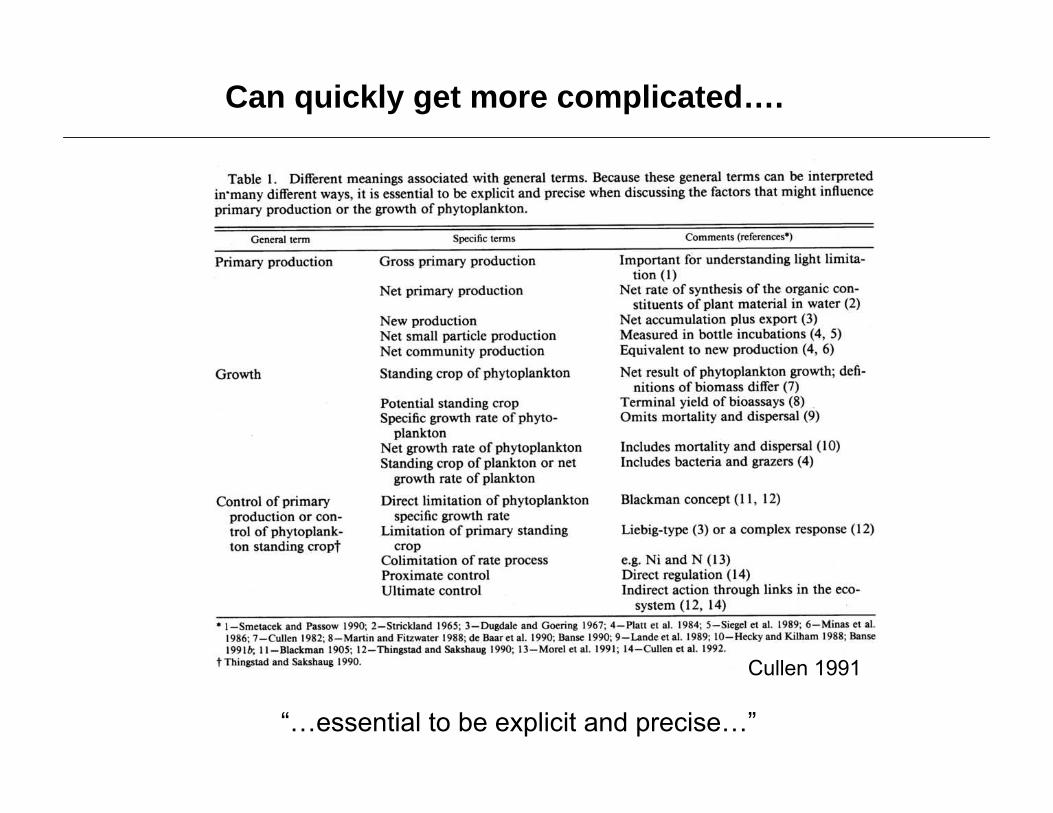
Cullen 1991
“…essential to be explicit and precise…”
Can quickly get more complicated….
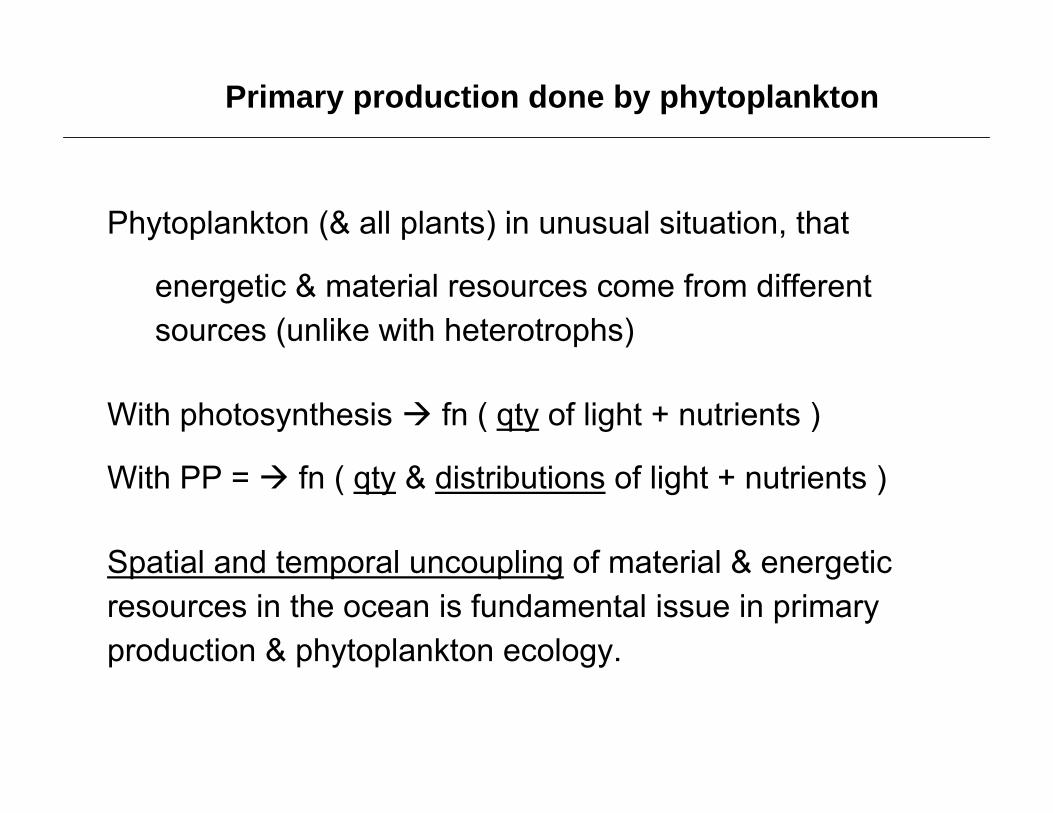
Phytoplankton (& all plants) in unusual situation, that
energetic & material resources come from different sources (unlike with heterotrophs)
With photosynthesis fn ( qty of light + nutrients )
With PP = fn ( qty & distributions of light + nutrients )
Spatial and temporal uncoupling of material & energetic resources in the ocean is fundamental issue in primary production & phytoplankton ecology.
Primary production done by phytoplankton
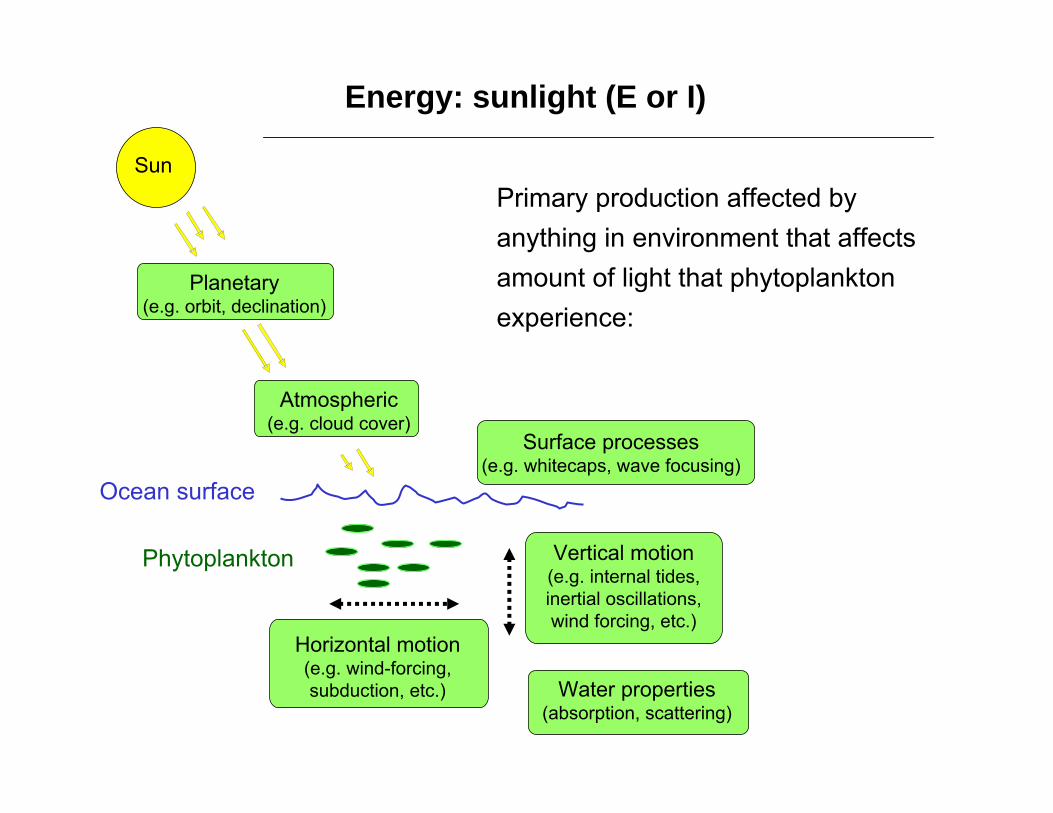
Planetary(e.g. orbit, declination)
Atmospheric(e.g. cloud cover)
Ocean surface
Vertical motion(e.g. internal tides, inertial oscillations, wind forcing, etc.)
Surface processes(e.g. whitecaps, wave focusing)
Horizontal motion(e.g. wind-forcing, subduction, etc.)
Sun
Phytoplankton
Water properties(absorption, scattering)
Primary production affected by anything in environment that affects amount of light that phytoplankton experience:
Energy: sunlight (E or I)
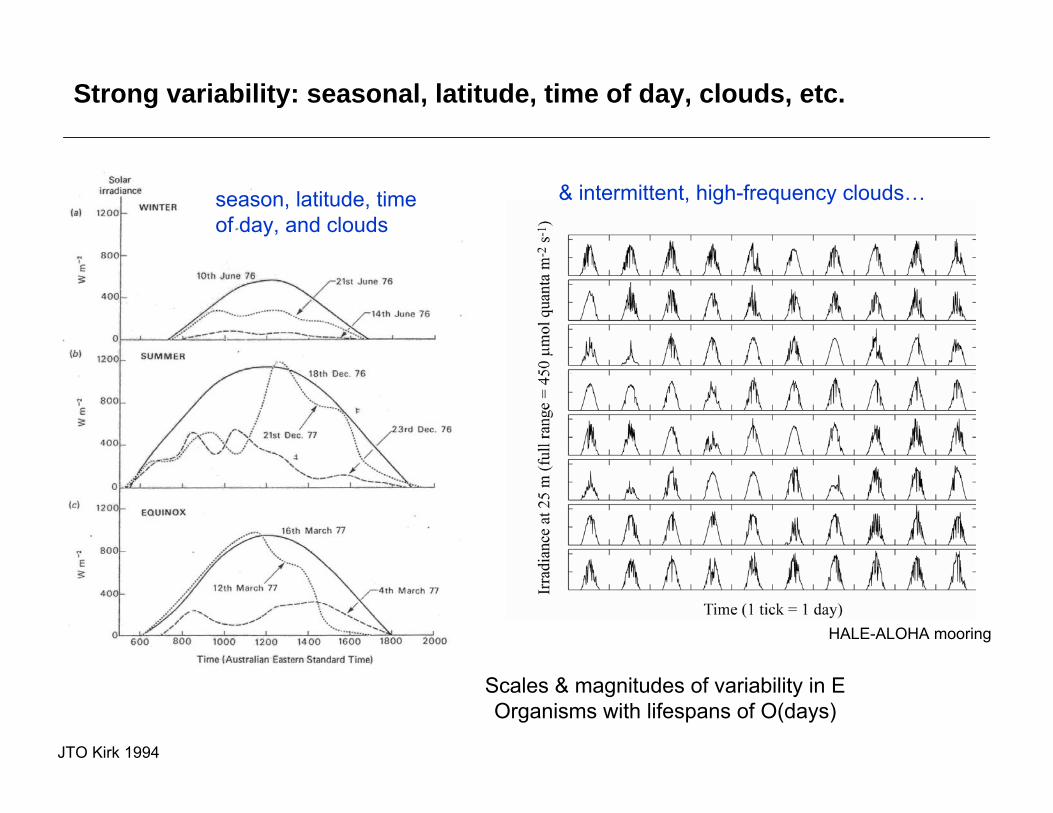
JTO Kirk 1994
season, latitude, time of day, and clouds
& intermittent, high-frequency clouds…
HALE-ALOHA mooring
Often integrate over a full day to avoid dealing with this variability
Strong variability: seasonal, latitude, time of day, clouds, etc.
Scales & magnitudes of variability in EOrganisms with lifespans of O(days)
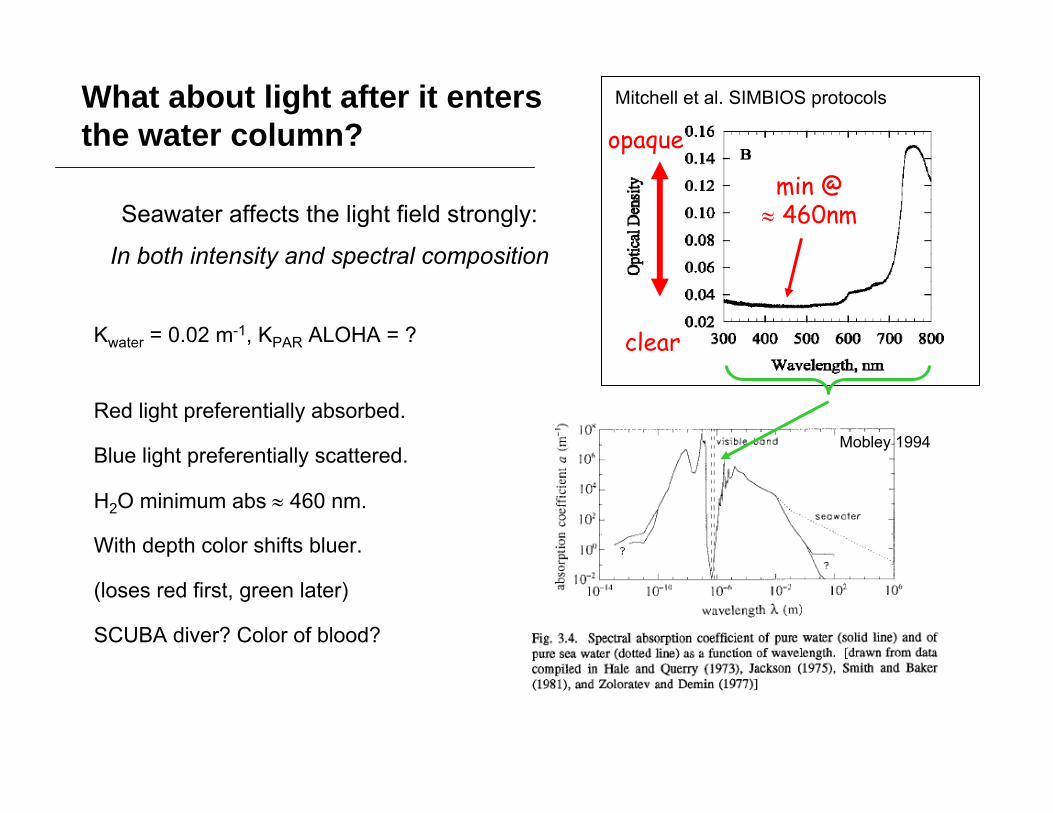
Seawater affects the light field strongly:
In both intensity and spectral composition
Mitchell et al. SIMBIOS protocols
Kwater = 0.02 m-1, KPAR ALOHA = ?
Red light preferentially absorbed.
Blue light preferentially scattered.
H2O minimum abs 460 nm.
With depth color shifts bluer.
(loses red first, green later)
SCUBA diver? Color of blood?
clear
opaque
min @ 460nm
Mobley 1994
What about light after it enters the water column?
L&P Fig. 2.4
400 500 600 7000
0.01
0.02
0.03
0.04
0.05
Wavelength (nm)
Abs
orpt
ion
(m-1
)
Phytoplankton light
absorption
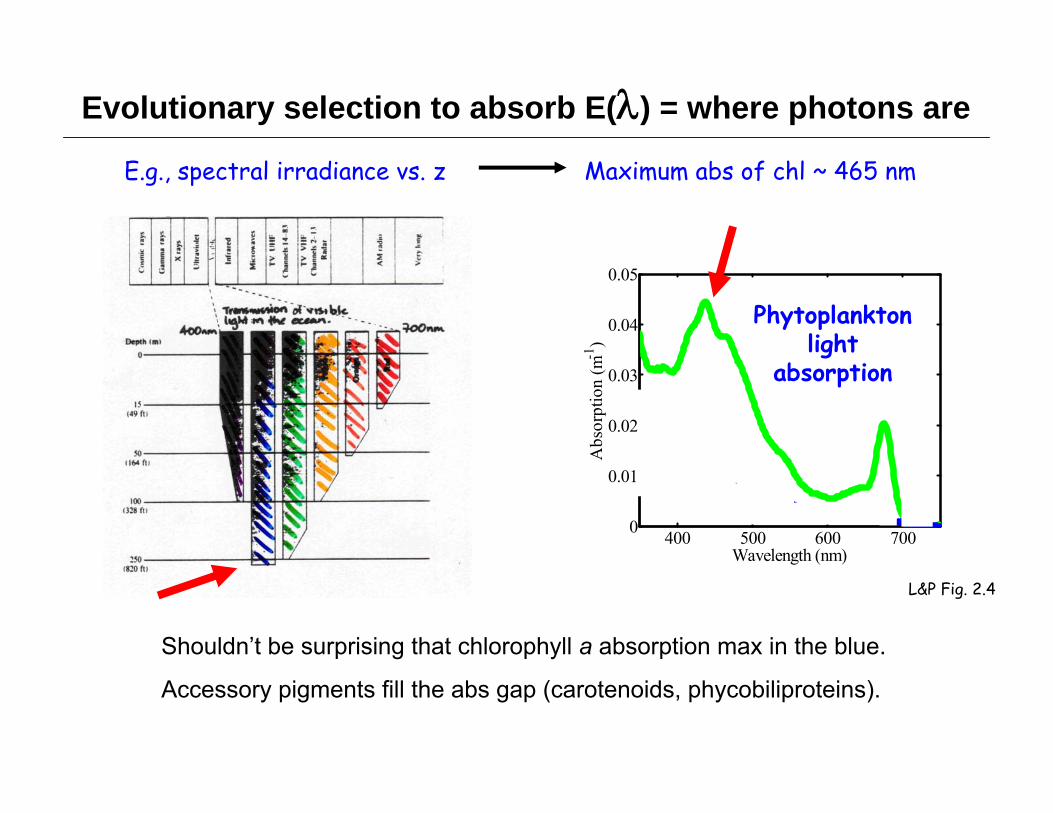
E.g., spectral irradiance vs. z
Shouldn’t be surprising that chlorophyll a absorption max in the blue.
Accessory pigments fill the abs gap (carotenoids, phycobiliproteins).
Evolutionary selection to absorb E() = where photons are
Maximum abs of chl ~ 465 nm
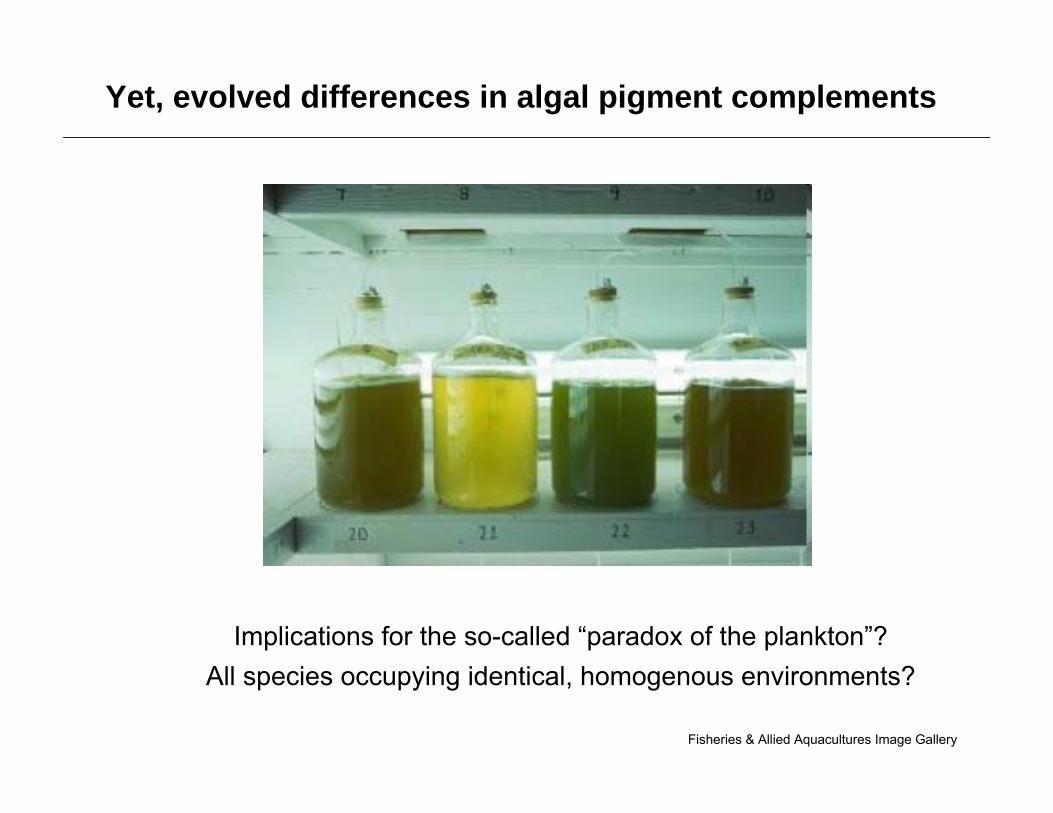
Fisheries & Allied Aquacultures Image Gallery
Yet, evolved differences in algal pigment complements
Implications for the so-called “paradox of the plankton”?All species occupying identical, homogenous environments?

= “initial slope”(~linear)
Pmax
Saturation maximal rate (limited by dark rxns, Pmax)
Photosynthesis-Irradiance curves: “P-I (or P-E) curves”
Linear, light limited region (limited by light rxns, )
Pmax, , (eqn Miller Ch3)
Photoinhibitedregion, β
Quantifying photosynthesis-light relationships
EK ≡ Pmax / light lim to light sat
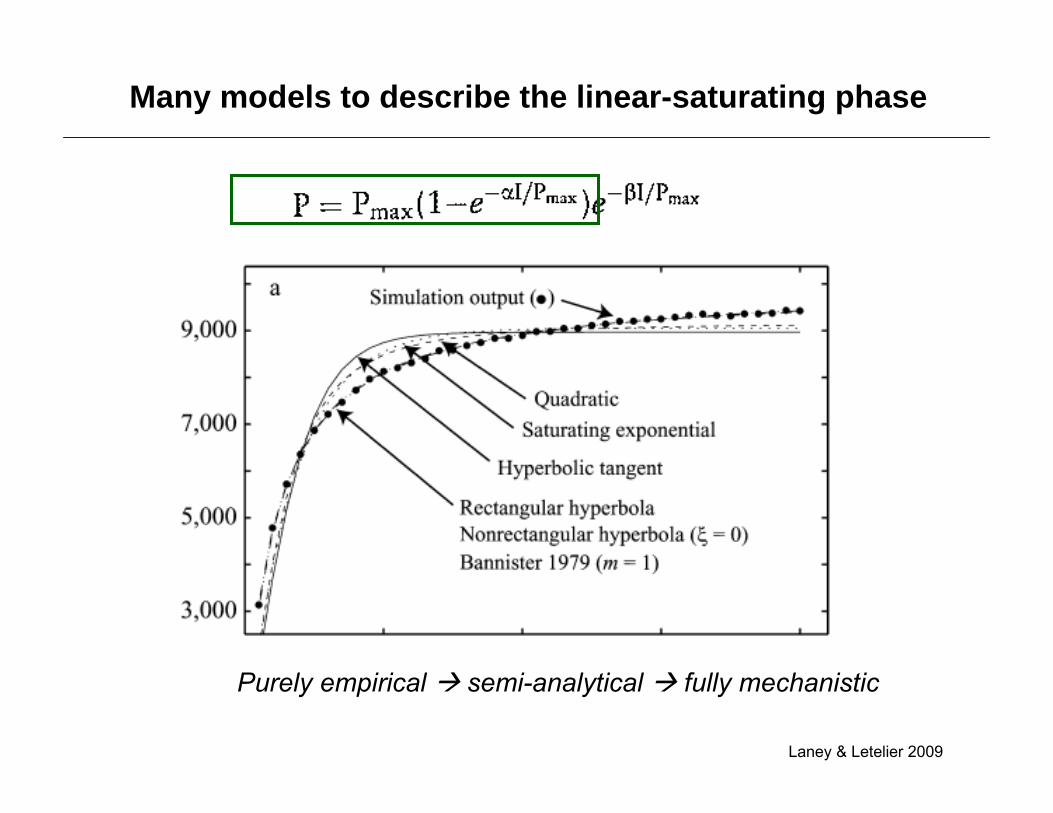
Many models to describe the linear-saturating phase
Laney & Letelier 2009
Purely empirical semi-analytical fully mechanistic

Generating P vs. I: photosynthetrons, incubators, in situ
Image: M. Lewis
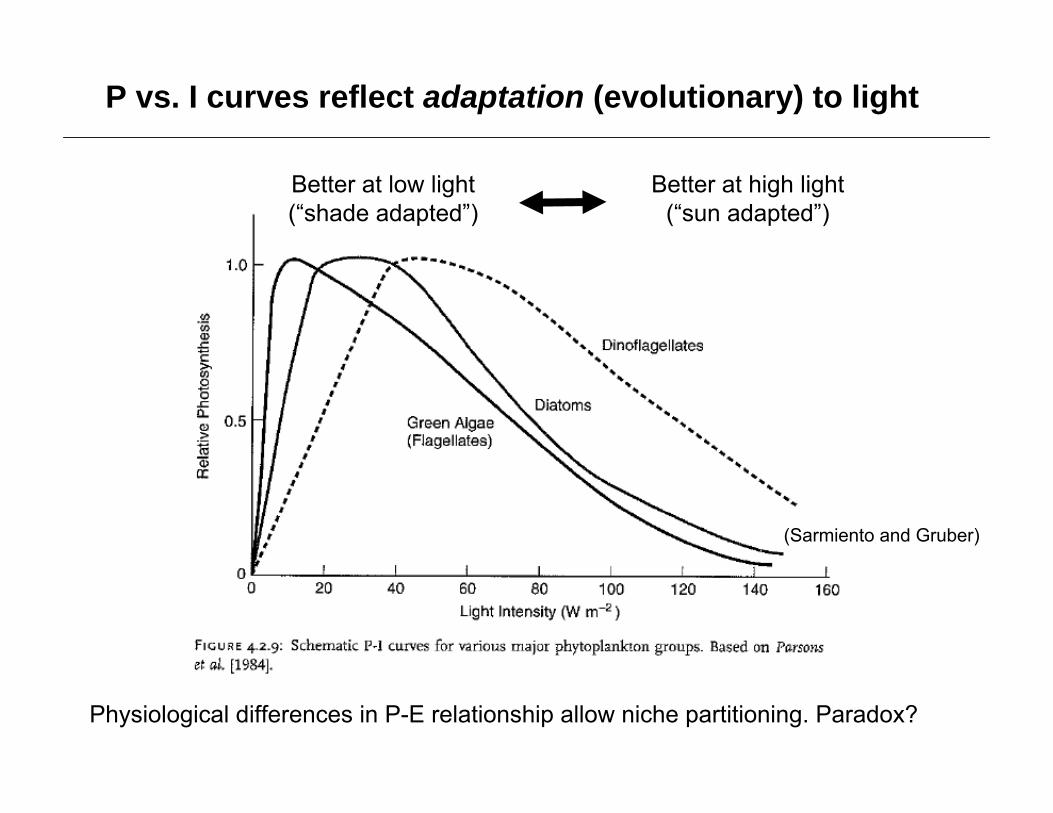
(Sarmiento and Gruber)
Physiological differences in P-E relationship allow niche partitioning. Paradox?
Better at low light(“shade adapted”)
Better at high light(“sun adapted”)
P vs. I curves reflect adaptation (evolutionary) to light
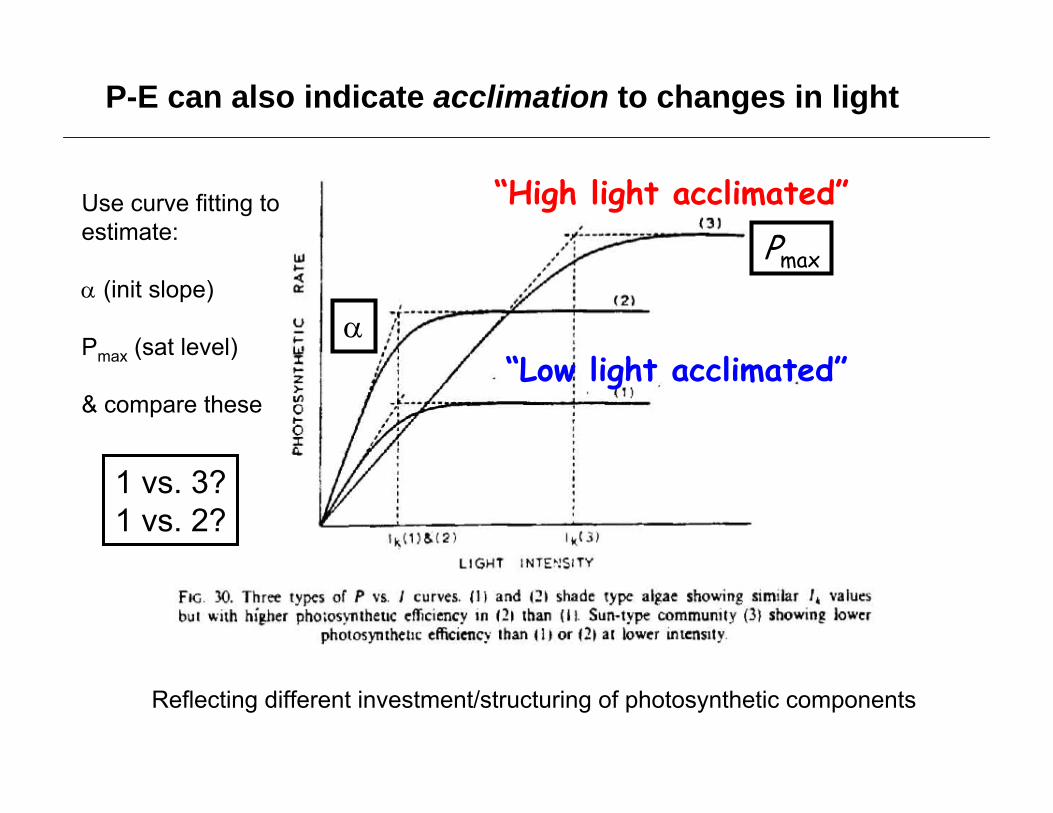
“High light acclimated”
“Low light acclimated”
Reflecting different investment/structuring of photosynthetic components
1 vs. 3?1 vs. 2?
Pmax
P-E can also indicate acclimation to changes in light
Use curve fitting to estimate:
(init slope)
Pmax (sat level)
& compare these

Acclimation strategies
Miller Ch3
Broad taxonomic groups exhibit different photoacclimation strategies.
“acclimation” an organism’s individual response to a change in the environment.
“Photoacclimation”: adjustments to
• Light harvesting capacity
• “Turnover” of photons into useful energy
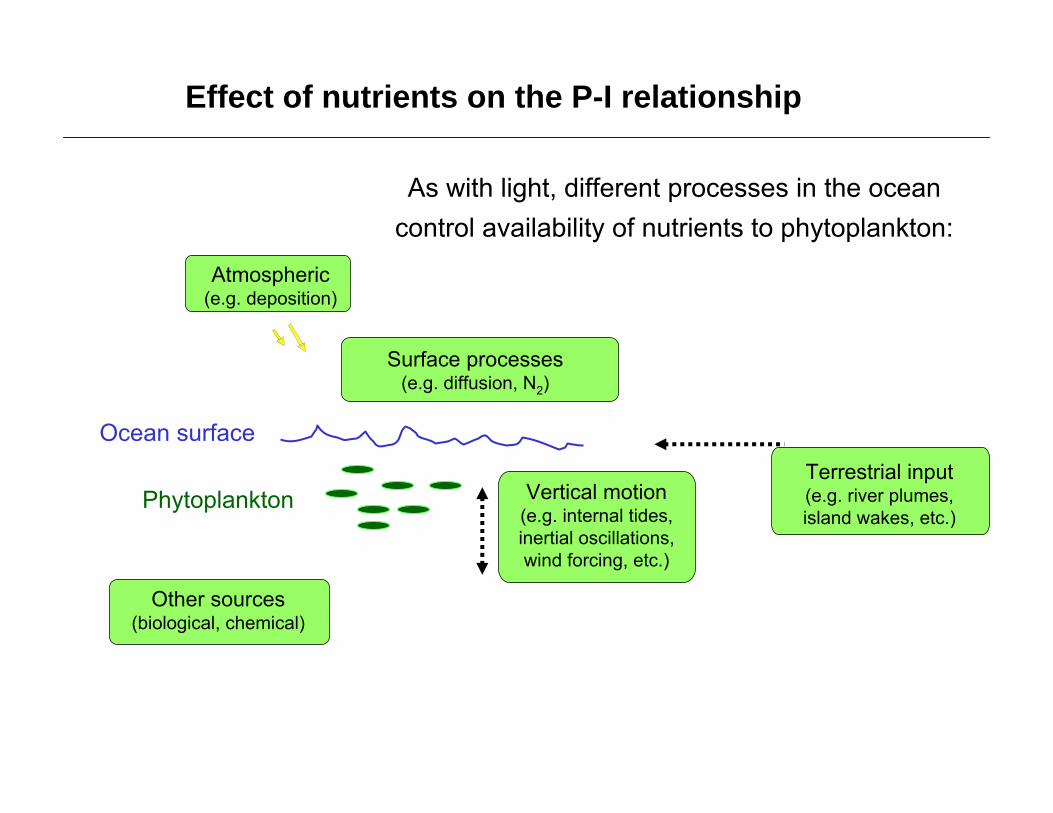
Atmospheric(e.g. deposition)
Vertical motion(e.g. internal tides, inertial oscillations, wind forcing, etc.)
Surface processes(e.g. diffusion, N2)
Terrestrial input(e.g. river plumes, island wakes, etc.)
Other sources(biological, chemical)
As with light, different processes in the ocean control availability of nutrients to phytoplankton:
Effect of nutrients on the P-I relationship
Ocean surface
Phytoplankton
Sarmiento and Gruber
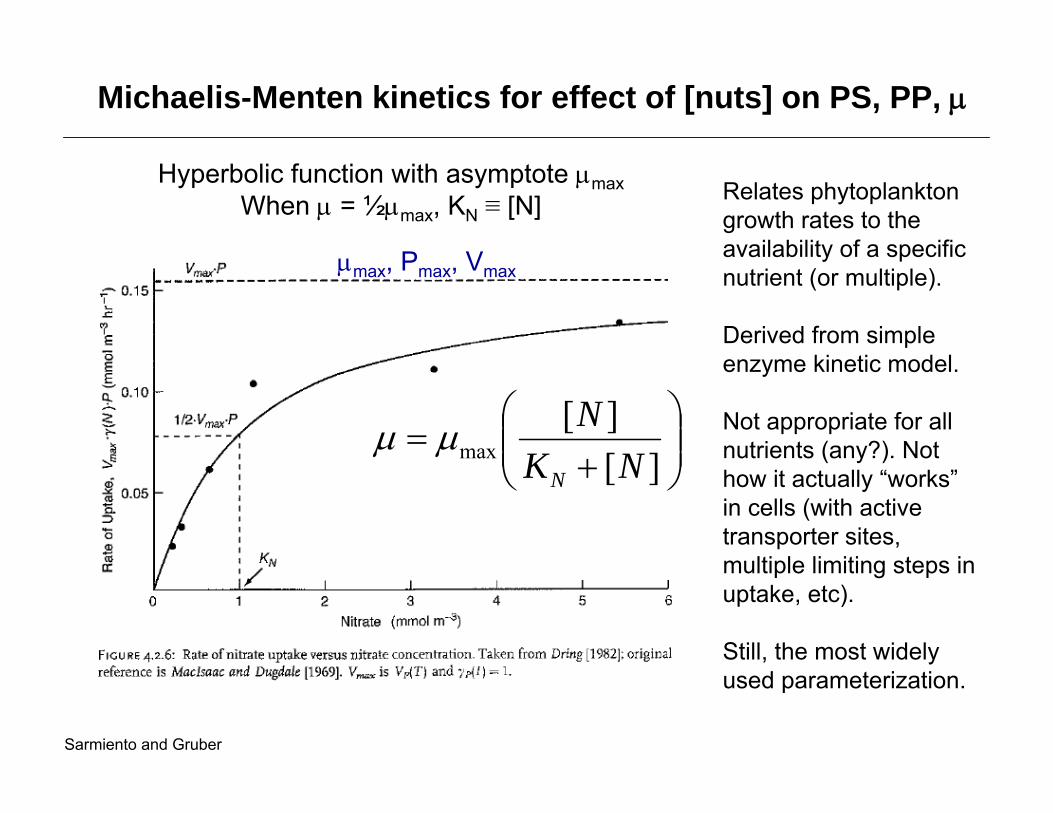
Hyperbolic function with asymptote maxWhen = ½max, KN ≡ [N]
][
][max NK
N
N
Relates phytoplankton growth rates to the availability of a specific nutrient (or multiple).
Derived from simple enzyme kinetic model.
Not appropriate for all nutrients (any?). Not how it actually “works”in cells (with active transporter sites, multiple limiting steps in uptake, etc).
Still, the most widely used parameterization.
Michaelis-Menten kinetics for effect of [nuts] on PS, PP,
max, Pmax, Vmax
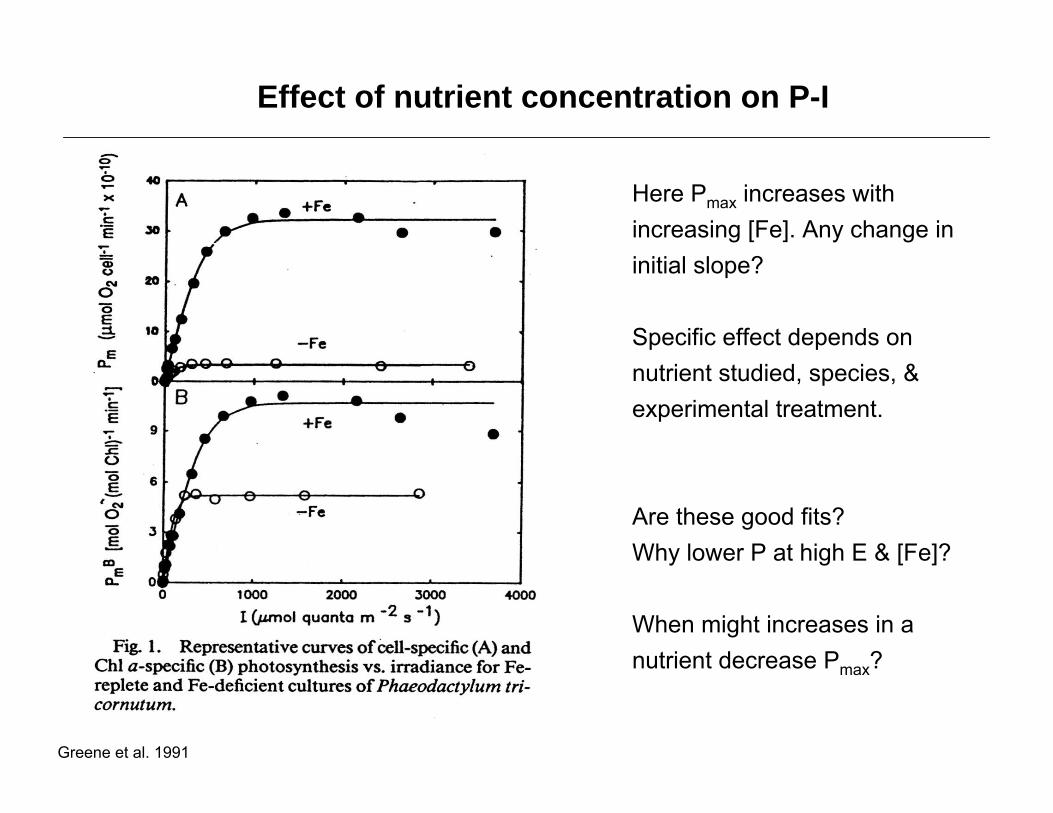
Greene et al. 1991
Here Pmax increases with increasing [Fe]. Any change in initial slope?
Specific effect depends on nutrient studied, species, & experimental treatment.
Are these good fits?Why lower P at high E & [Fe]?
When might increases in a nutrient decrease Pmax?
Effect of nutrient concentration on P-I
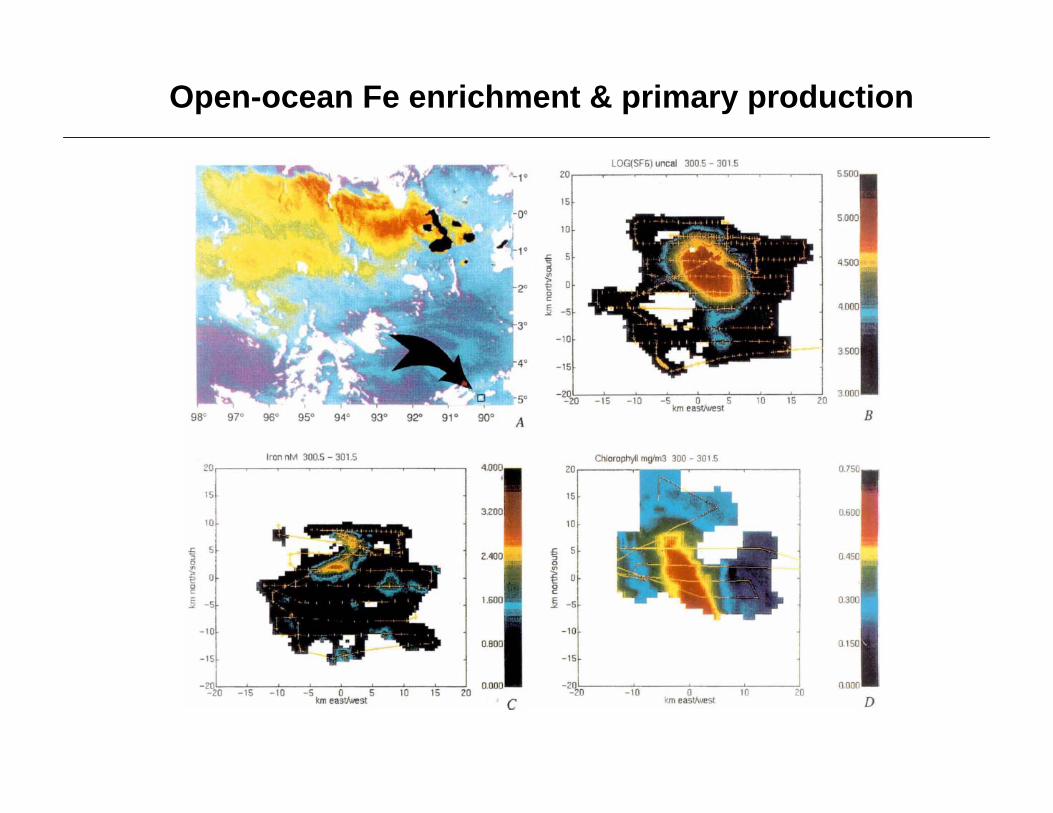
Open-ocean Fe enrichment & primary production
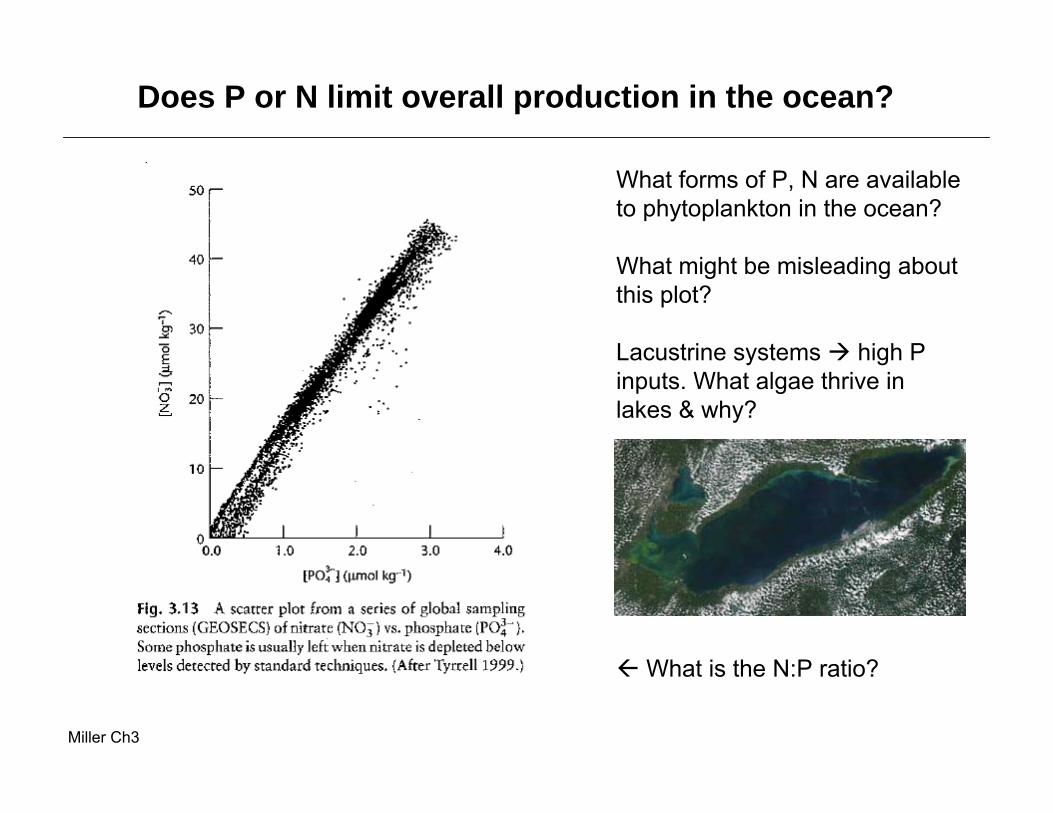
Does P or N limit overall production in the ocean?
Miller Ch3
What forms of P, N are available to phytoplankton in the ocean?
What might be misleading about this plot?
Lacustrine systems high P inputs. What algae thrive in lakes & why?
What is the N:P ratio?
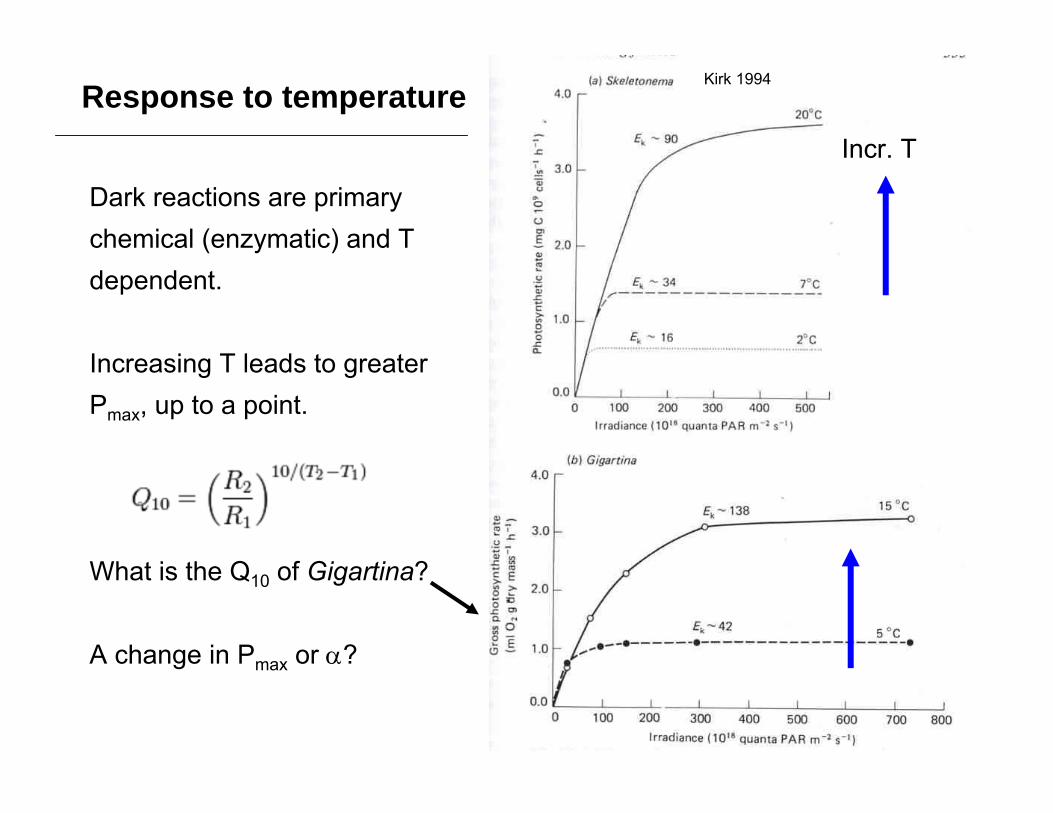
Incr. T
Kirk 1994
Dark reactions are primary chemical (enzymatic) and T dependent.
Increasing T leads to greater Pmax, up to a point.
What is the Q10 of Gigartina?
A change in Pmax or ?
Response to temperature
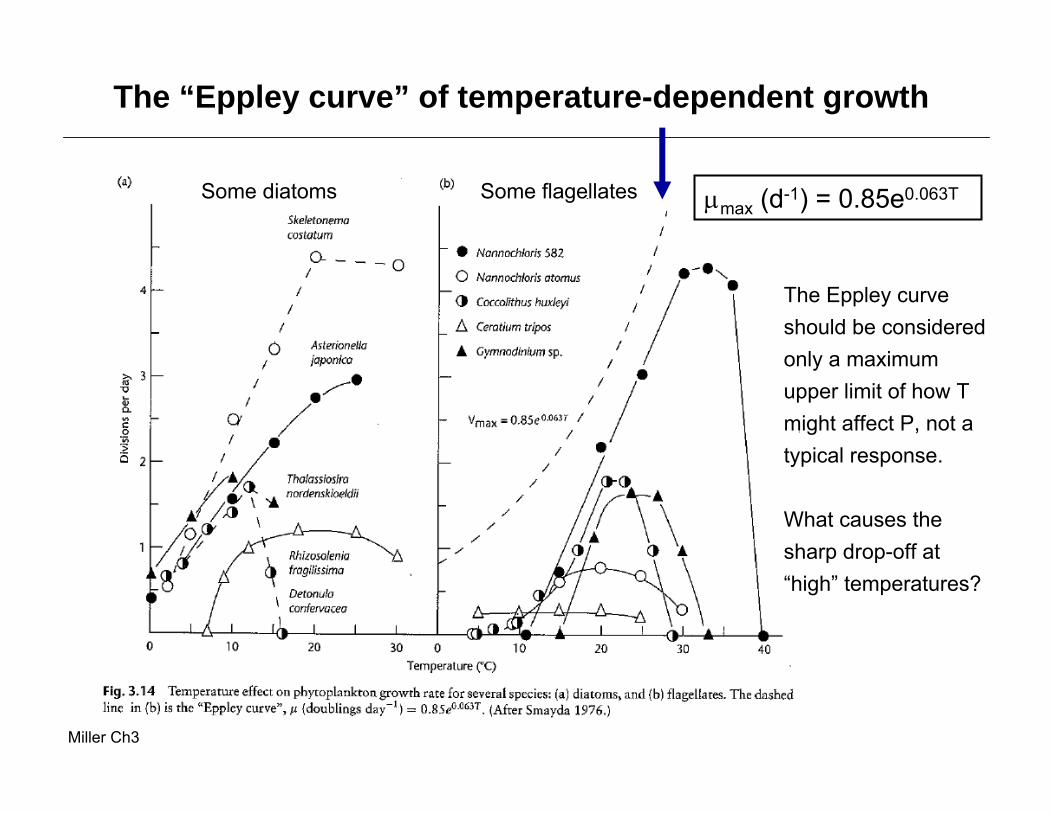
The “Eppley curve” of temperature-dependent growth
Miller Ch3
Some diatoms Some flagellates
The Eppley curve should be considered only a maximum upper limit of how T might affect P, not a typical response.
What causes the sharp drop-off at “high” temperatures?
max (d-1) = 0.85e0.063T
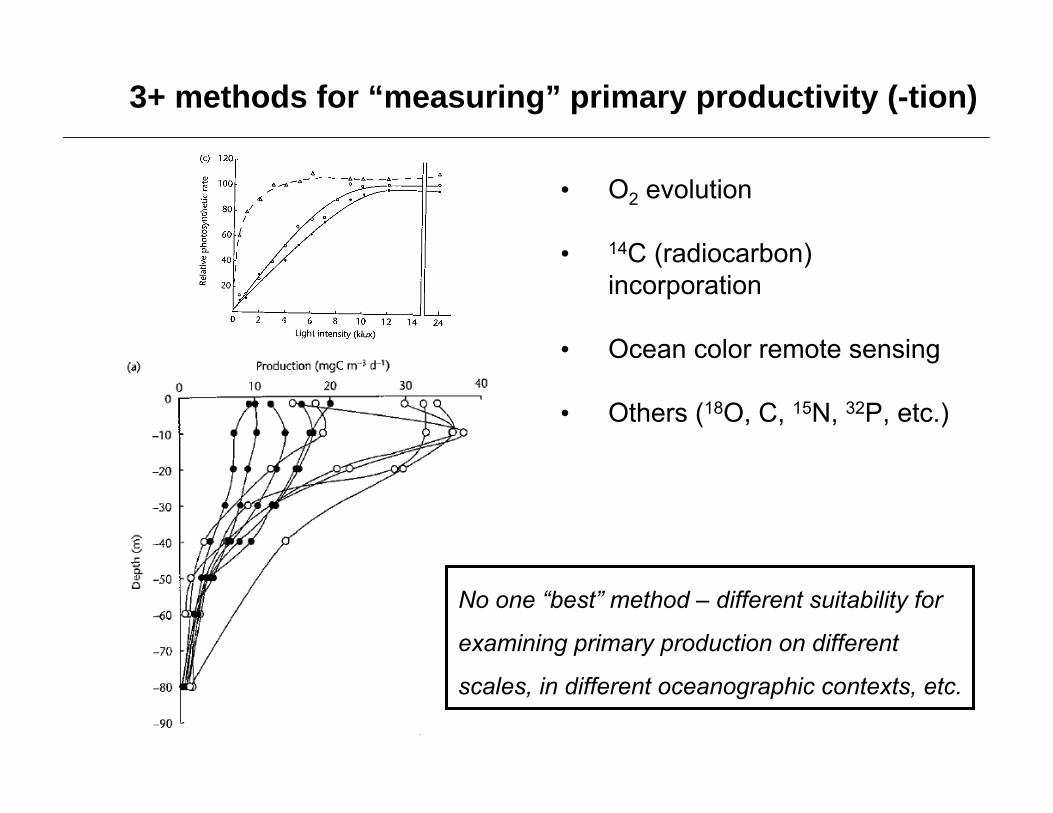
• O2 evolution
• 14C (radiocarbon) incorporation
• Ocean color remote sensing
• Others (18O, C, 15N, 32P, etc.)
No one “best” method – different suitability for
examining primary production on different
scales, in different oceanographic contexts, etc.
3+ methods for “measuring” primary productivity (-tion)
“ 6 H20 + 6 CO2 6 (CH2O) + 6 O2 ”
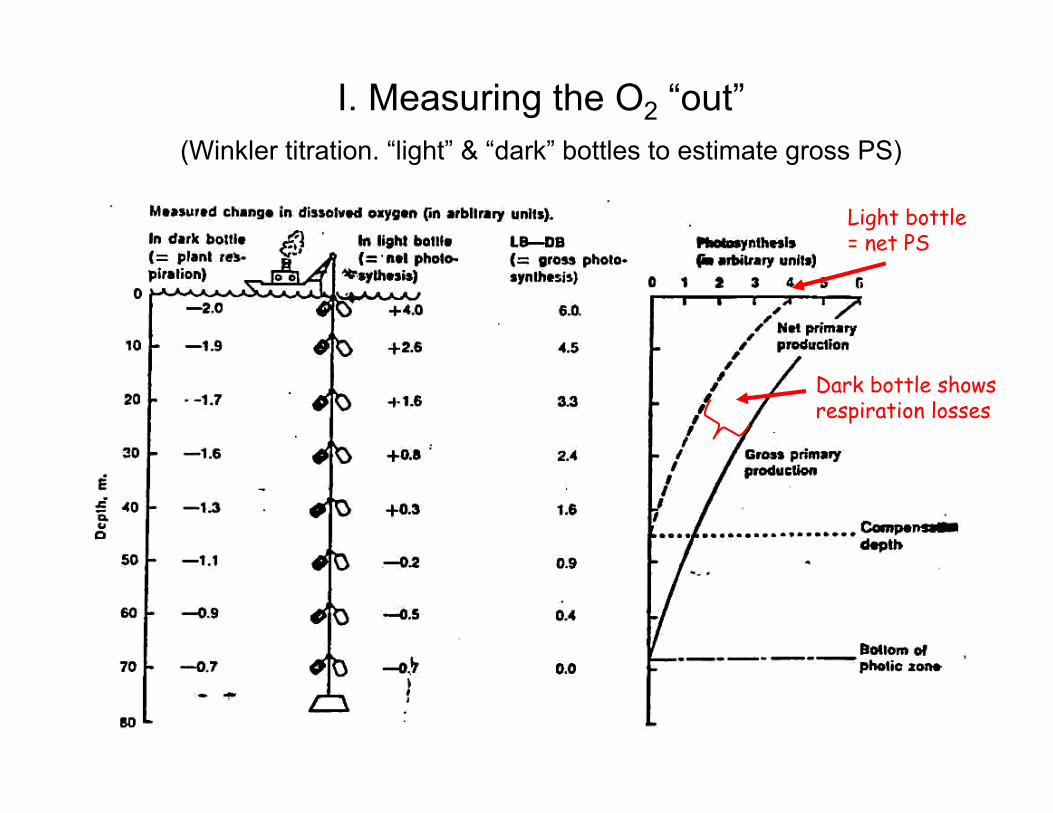
Dark bottle shows respiration losses
I. Measuring the O2 “out”(Winkler titration. “light” & “dark” bottles to estimate gross PS)
Light bottle = net PS
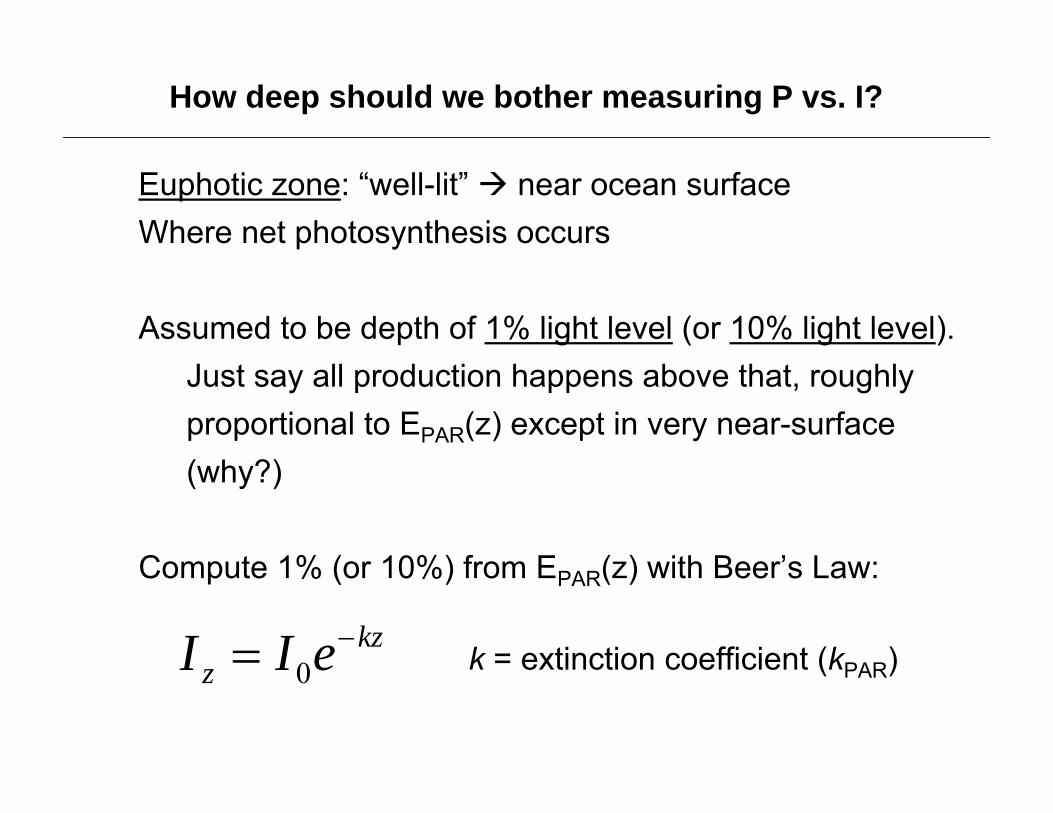
Euphotic zone: “well-lit” near ocean surfaceWhere net photosynthesis occurs
Assumed to be depth of 1% light level (or 10% light level). Just say all production happens above that, roughly proportional to EPAR(z) except in very near-surface (why?)
Compute 1% (or 10%) from EPAR(z) with Beer’s Law:
kzz eII 0 k = extinction coefficient (kPAR)
How deep should we bother measuring P vs. I?
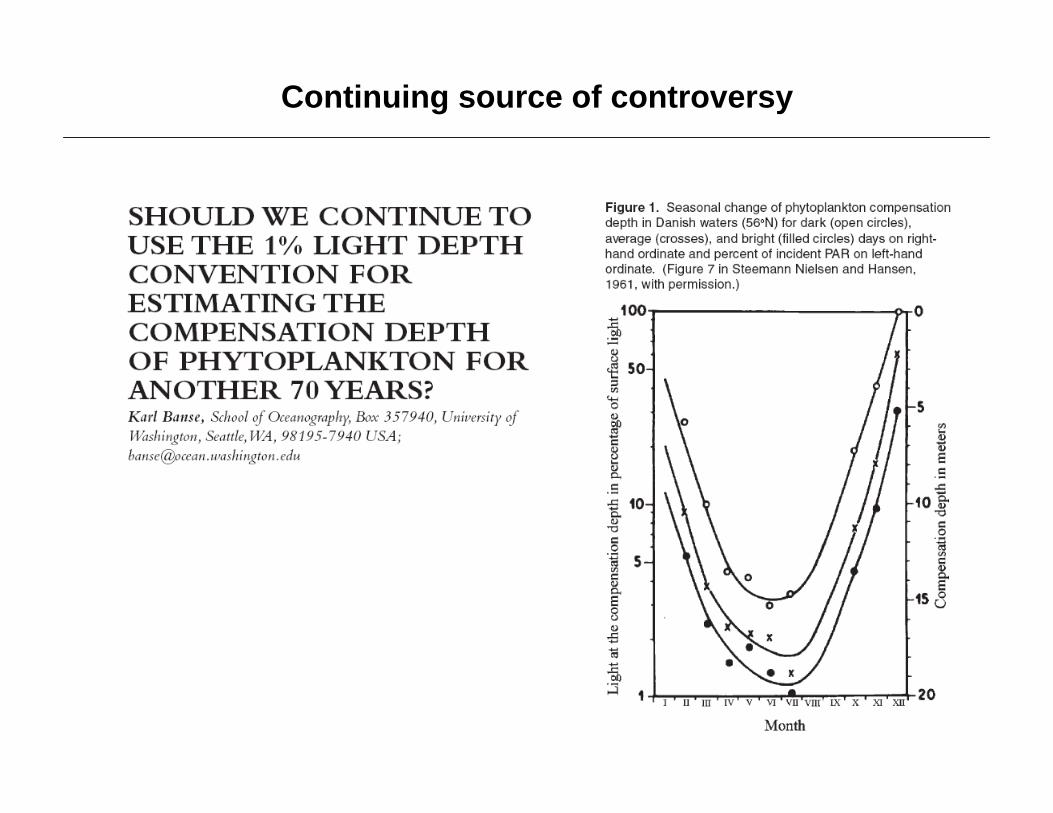
Continuing source of controversy
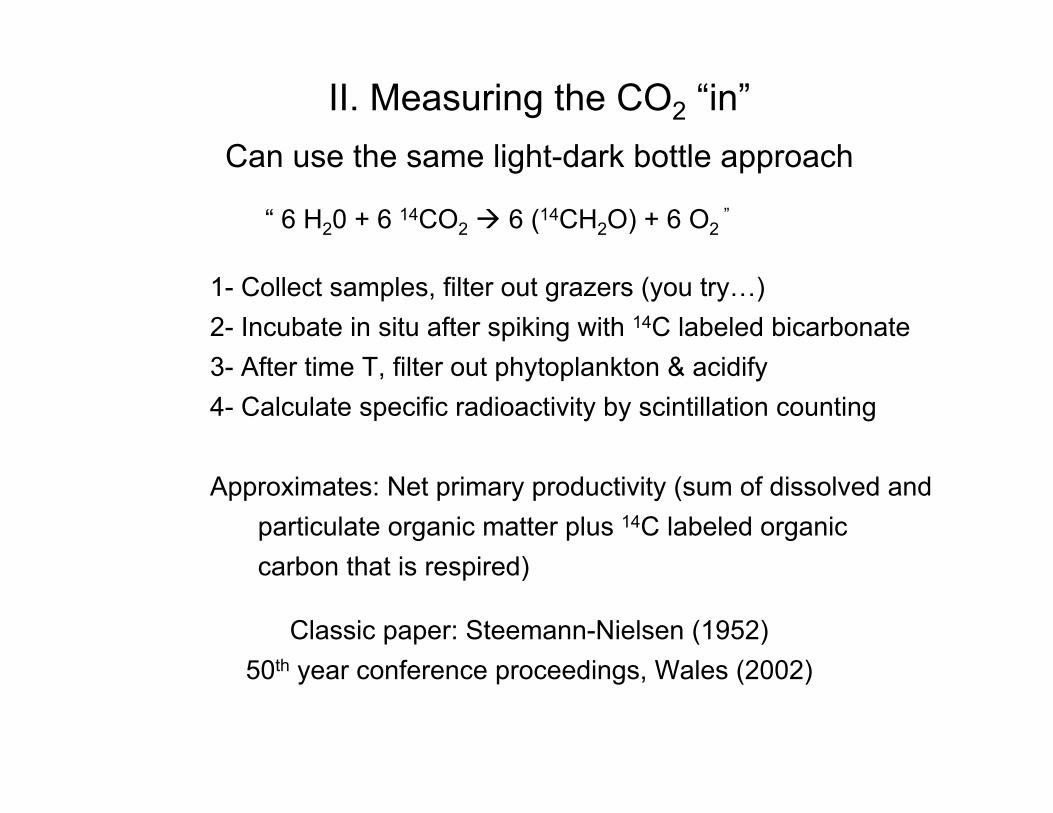
1- Collect samples, filter out grazers (you try…)2- Incubate in situ after spiking with 14C labeled bicarbonate3- After time T, filter out phytoplankton & acidify 4- Calculate specific radioactivity by scintillation counting
Approximates: Net primary productivity (sum of dissolved and particulate organic matter plus 14C labeled organic carbon that is respired)
Classic paper: Steemann-Nielsen (1952)50th year conference proceedings, Wales (2002)
II. Measuring the CO2 “in”Can use the same light-dark bottle approach
“ 6 H20 + 6 14CO2 6 (14CH2O) + 6 O2 ”

“dark” bottles “light” bottles
HOT primary-production array: Station ALOHA
http://hahana.soest.hawaii.edu/hot/
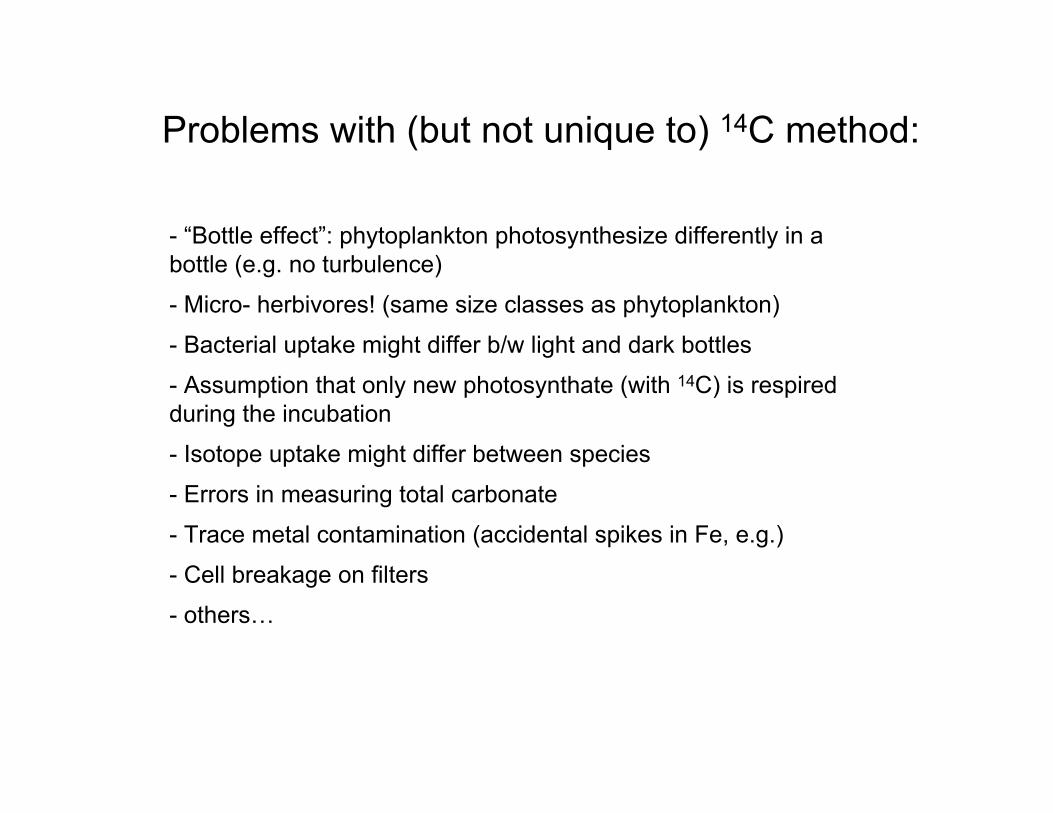
- “Bottle effect”: phytoplankton photosynthesize differently in a bottle (e.g. no turbulence)
- Micro- herbivores! (same size classes as phytoplankton)
- Bacterial uptake might differ b/w light and dark bottles
- Assumption that only new photosynthate (with 14C) is respired during the incubation
- Isotope uptake might differ between species
- Errors in measuring total carbonate
- Trace metal contamination (accidental spikes in Fe, e.g.)
- Cell breakage on filters
- others…
Problems with (but not unique to) 14C method:
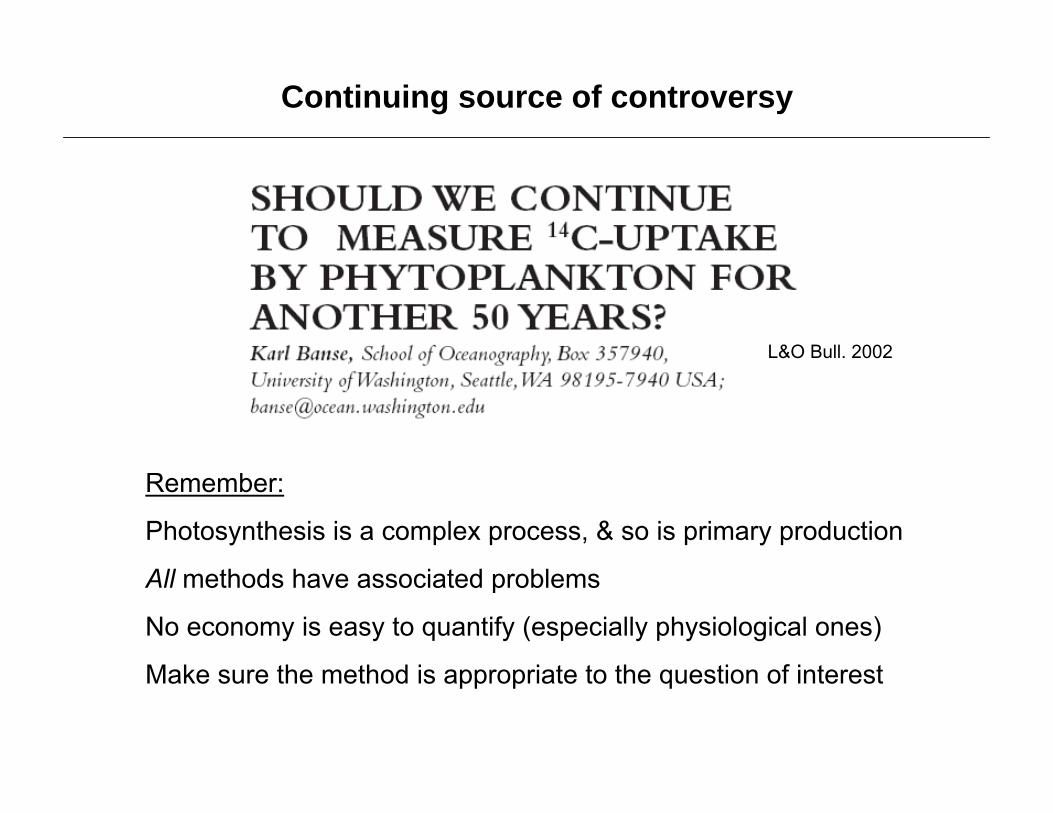
L&O Bull. 2002
Remember:
Photosynthesis is a complex process, & so is primary production
All methods have associated problems
No economy is easy to quantify (especially physiological ones)
Make sure the method is appropriate to the question of interest
Continuing source of controversy

• CZCS (1978): Coastal Zone Color Scanner
• SeaWiFS (1997-2011): Sea-viewing Wide Field of view Sensor
• MODIS (1999, 2002): Moderate Resolution Imaging Spectroradiometer (instrument aboard Terra and Aqua satellites)
III. Satellite methods (“ocean color”)
More green more chl
Convert chl PriProd
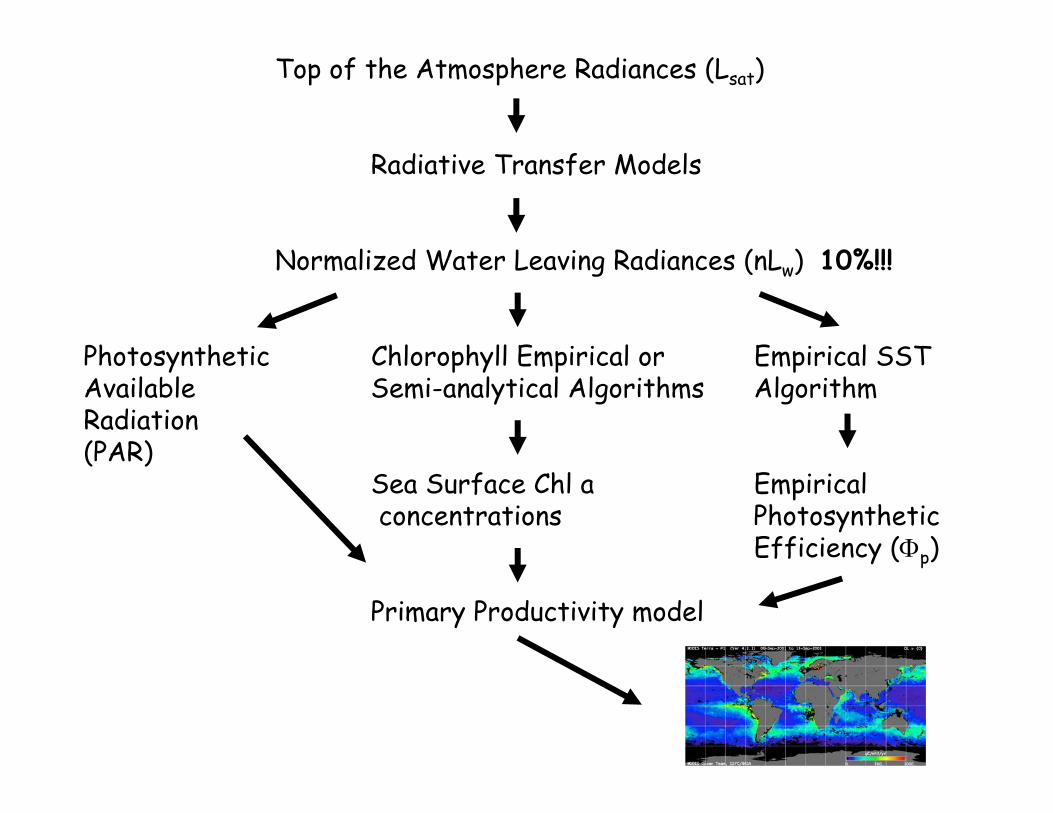
Top of the Atmosphere Radiances (Lsat)
Radiative Transfer Models
Normalized Water Leaving Radiances (nLw) 10%!!!
Photosynthetic Chlorophyll Empirical or Empirical SSTAvailable Semi-analytical Algorithms AlgorithmRadiation(PAR)
Sea Surface Chl a Empirical concentrations Photosynthetic
Efficiency (p)
Primary Productivity model
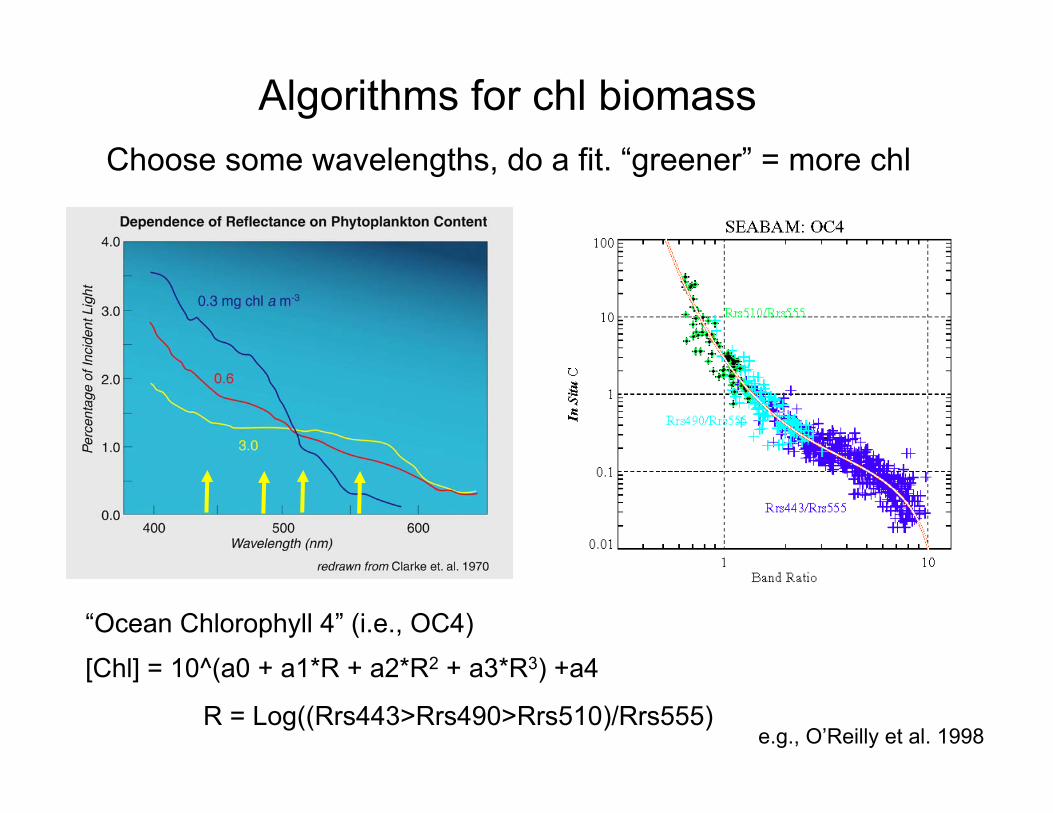
“Ocean Chlorophyll 4” (i.e., OC4)
[Chl] = 10^(a0 + a1*R + a2*R2 + a3*R3) +a4
R = Log((Rrs443>Rrs490>Rrs510)/Rrs555)
Algorithms for chl biomass
e.g., O’Reilly et al. 1998
Choose some wavelengths, do a fit. “greener” = more chl
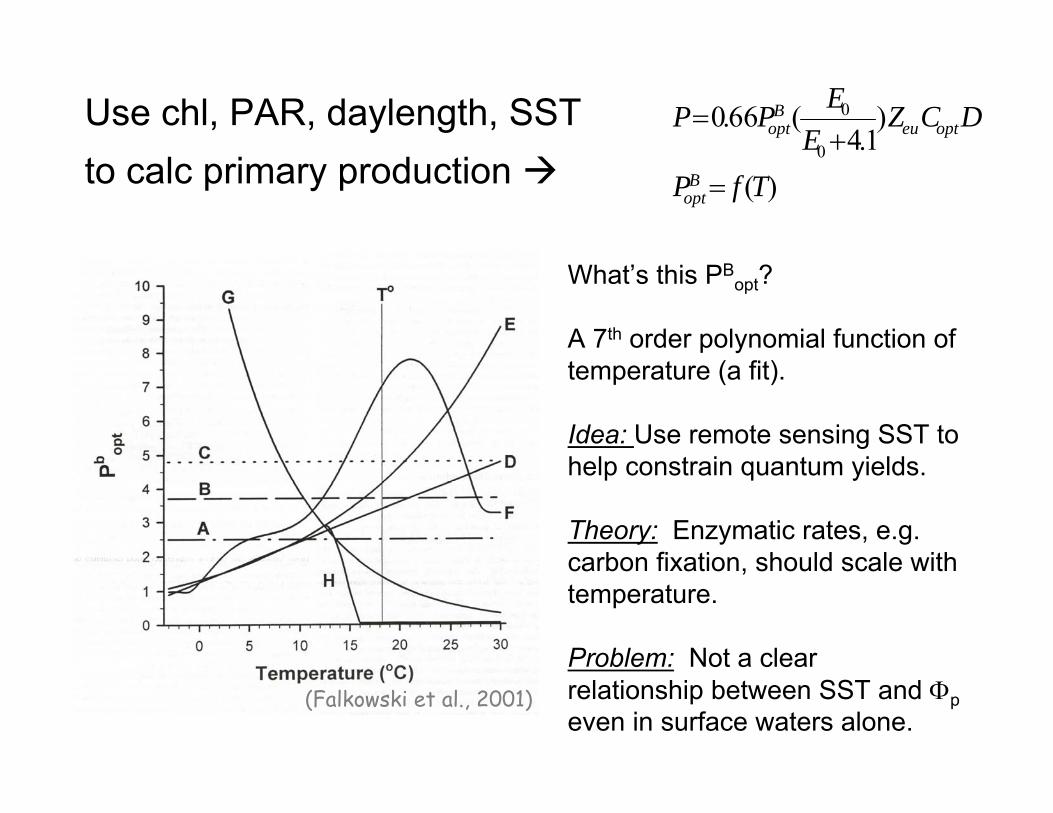
What’s this PBopt?
A 7th order polynomial function of temperature (a fit).
Idea: Use remote sensing SST to help constrain quantum yields.
Theory: Enzymatic rates, e.g. carbon fixation, should scale with temperature.
Problem: Not a clearrelationship between SST and peven in surface waters alone.
(Falkowski et al., 2001)
Use chl, PAR, daylength, SST to calc primary production )(
)1.4
(66.00
0
TfP
DCZE
EPP
Bopt
opteuB
opt
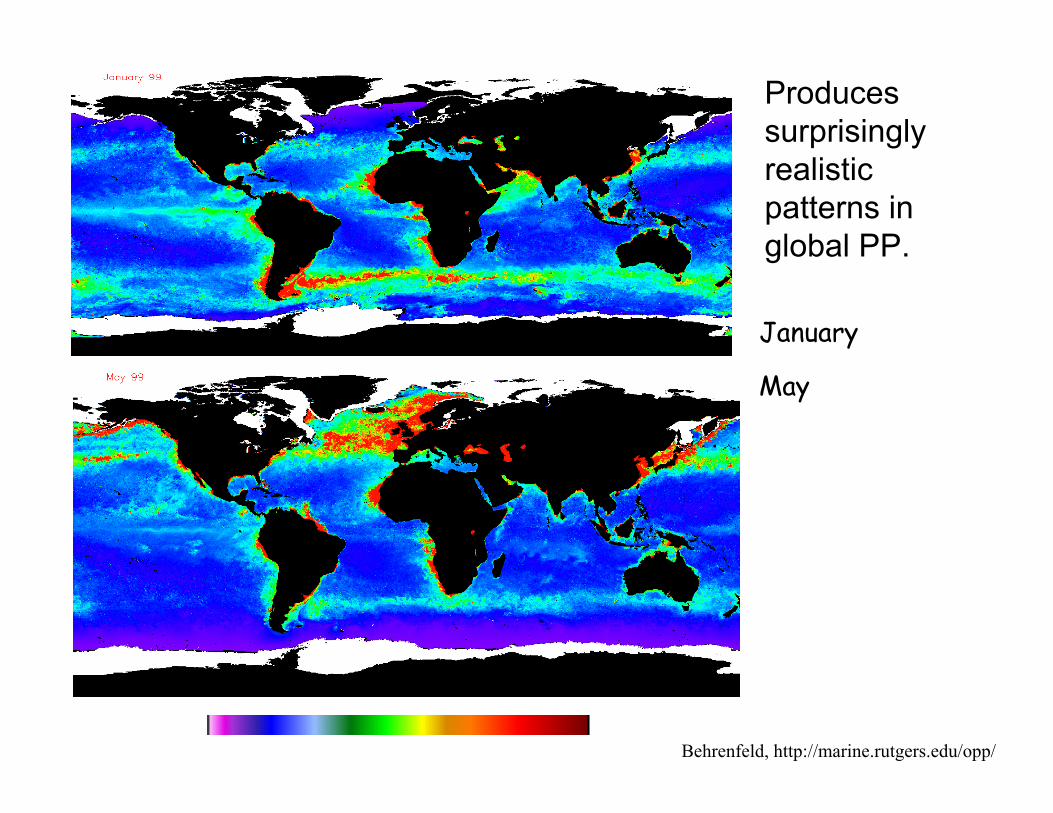
January
gC m-2 y-1
0 150 300 450
May
Behrenfeld, http://marine.rutgers.edu/opp/
Produces surprisingly realistic patterns in global PP.