March Ahead of the Competition through Word of Mouth
20
MAY 2014 François Candelon, Fang Ruan, Sam Chen, and David Feng March Ahead of the Competition through Word of Mouth Applying the BCG Brand Advocacy Index to Technology, Media & Telecommunications in China
Transcript of March Ahead of the Competition through Word of Mouth

MAY 2014
François Candelon, Fang Ruan, Sam Chen, and David Feng
March Ahead of the Competition through Word of Mouth Applying the BCG Brand Advocacy Index to Technology, Media & Telecommunications in China

Contents
Executive Summary 1
1. Word-of-Mouth Drives Customer Decisions 1
2. The Brand Advocacy Index - a Simple but Precise and Comprehensive Advocacy Measurement Framework 2
3. Strong Correlation between BAI and Growth 3
4. BAI Rank in China TMT Categories 3
5. The BAI Survey and Key Drivers of Advocacy in China TMT Categories 5
6. Using BAI to Unleash the Power of Advocacy and Drive Growth 11
Appendix: Methodology 13
Appendix: China TMT Survey Details 15

March Ahead of the Competition through Word of Mouth Applying the BCG Brand Advocacy Index to Technology, Media & Telecommunications in China
THE BOSTON CONSULTING GROUP MAY 2014
Executive Summary
To measure advocacy with greater precision than existing approaches, The Boston Consulting Group (BCG) has developed a strategic metric called the Brand Advocacy Index (BAI). Unlike competing measures, BAI is strongly correlated with top-line growth and can help identify concrete actions for improving advocacy.
Advocacy Drives Customer Decisions and Growth Our research both worldwide and in China shows that brands with higher levels of advocacy – the most recommended brands – significantly outperform heavily criticized companies in top-line growth. Companies can leverage advocacy to not only improve results, but also uncover the rational and emotional factors that motivate people to recommend a brand. They can also discern the relative influence of both customers and noncustomers in driving recommendations.
How Chinese TMT Companies Rank in Word-of-MouthWe share our findings from a BAI survey of Chinese technology, media & telecommunications (TMT) companies, in handsets, tablets, smart TVs, PCs, and telecommunications. A deep understanding of advocacy, and how companies stack up to competitors, can lend new insights into how a brand is conceived and enable firms to use advocacy to drive growth.
1. Word-of-Mouth Drives Customer Decisions
Word-of-mouth recommendations from customers, or brand advocacy, are a signal of how successful a brand is. Companies or products with strong levels of brand advocacy enjoy a greater presence in customers’ minds and are more competitive. Smart marketers will tap the power of brand advocacy to drive top-line growth.
A critical challenge for companies that seek to leverage brand advocacy is finding a way to measure it precisely. Quantifying it is the best way to demonstrate its top-line impact, and develop strategies to improve word-of-mouth. To address this need, BCG has created the Brand Advocacy Index (BAI), a strategic metric that measures advocacy with far greater precision than existing approaches. It displays a strong correlation with top-line growth and helps identify concrete actions for improving advocacy. Its measures enable us to propose feasible next steps for both superior and inferior BAI performance.
Brands armed with a thorough understanding of advocacy can also pinpoint advocates that might otherwise remain overlooked, and learn their motivations. They can uncover the relative influence of both customers and noncustomers in driving recommendations, as well as the functional and emotional factors that motivate both groups to recommend brands. Companies can determine recommendations and criticisms by demographic, across the globe or within a country, and from there, identify the most and least successful tactics for improving advocacy.

March Ahead of the Competition through Word of Mouth 2
MAY 2014THE BOSTON CONSULTING GROUP
Although advocacy levels vary widely by industry and country, we have not found a single category in which advocacy is irrelevant. In this report, we demonstrate the precise mechanisms for measuring and managing brand advocacy in China’s Technology, Media & Telecommunications (TMT) market. Brands that successfully harness these insights will be able to march ahead of the competition.
Advocacy is gaining more and more impact on customer purchase behavior. Our survey of more than 32,000 customers in Europe and the US shows that it is more relevant than ever when making shopping decisions. Of our respondents, 66 percent seek opinions from friends and relatives, and 50 percent consult consumer opinions online; both figures are higher than the percentage of people who seek input from media. People are losing their trust in traditional mass media, and relying more on recommendations from trusted advocates. As a result, purchasing decisions based on advocacy is growing, while those based on advertisements is shrinking. The trend toward advocacy has also been accelerated by advancements in communications technology.
BCG conducted an extension survey in the third quarter of 2013 to understand the impact of advocacy in China’s TMT sectors. The results from more than 8,500 respondents indicate that advocacy serves as a significant information channel. Generally, 45 to 50 percent of respondents across different age groups and city tiers reported that they collect information from friends, relatives, and online user comments when they are not familiar with a brand.
We also observed high levels of advocacy in TMT categories that include smart TVs, handsets, tablets, and PCs. These products not only offer functional benefits, but also provide larger emotional benefits to customers. Customers usually invest a great deal of time into researching the best products with the best value for them, and spend a large percentage of their income on them.
In an era when traditional media’s influence is declining, and advocacy is becoming the most popular and trusted source for recommendations among customers, companies need to incorporate advocacy into their marketing mix and leverage positive word-of-mouth to achieve their advertising objectives. (See Exhibit 1.)
Advocacy has several advantages over advertising. Advocacy can be developed at much less cost, and with more, and more continuous, impact. Advocacy programs can be piloted at low scale and with little investment, and the results can be measured and scaled up quickly. These benefits make advocacy a good strategic alternative for marketing in some TMT categories. This is especially true for categories in which profitability is decreasing due to commoditization, but investment in advertising cannot be cut back due to severe competition.
2. The Brand Advocacy Index - a Simple but Precise and Comprehensive Advocacy Measurement Framework
To unleash the power of advocacy and capitalize on its strategic benefits, companies need a highly accurate metric for measuring it, with a proven link to top-line growth.
BCG’s new Brand Advocacy Index (BAI) offers a simple to execute, but highly precise and comprehensive framework for measuring advocacy. (See the Appendix for a detailed description of BCG’s unique approach to calculating brand advocacy.) BAI allows companies to understand advocacy levels of their brands and benchmark the results against those of their competitors. BAI can be applied to gain advocacy insights in

March Ahead of the Competition through Word of Mouth �
THE BOSTON CONSULTING GROUP MAY 2014
any industry, and helps companies understand their brand’s strengths or weaknesses – and the reasons behind them – by segment, country, region, and population. Companies can use these insights to help develop a brand strategy that proactively influences how they are perceived in the marketplace.
3. Strong Correlation between BAI and Growth
After conducting a survey of more than 300 brands in 12 industries in the US and Europe, BCG found a strong positive correlation coefficient between BAI and top-line growth - 81 percent, double that of other measures. (See Exhibit 2.) (BCG measures BAI’s effect on growth using the correlation coefficient known as Pearson’s r.) Meanwhile, we also found BAI precisely predicts potential revenue growth across the major TMT categories in China, especially in smart TVs (98 percent positive correlation coefficient) and handsets (96 percent positive correlation coefficient). Exhibit 3 shows the strength of the growth correlation for leading TMT companies in China.
4. BAI Rank in China TMT Categories
Our BAI survey presents the most to least recommended brands in China, among TMT categories. (See Exhibit 4.) The survey combines recommendations from both customers and noncustomers of each brand. Some leading brands, like Samsung and Apple, consistently take leading word-of-mouth positions in their relevant categories.
Exhibit 1. Advocacy Is Growing in Relevance (All Over the Globe ) While Mass Media Is Decreasing
Sources: Nielsen report, Global Trust in Advertising and Brand Messages, April 2012, 28,000 internet users from 56 countries participated in the study; market survey; BCG analysis.12009 data for recommendations from friends and family.
Advocacy is the most effective source of salesleads and growing rapidly
% of respondent
Tier 3-4
WoM(e.g. friends/relatives)
Social network (e.g. Renren)
BBS/online forum
Tier 5-6Tier 1-2
Other (e.g. blog)
Channel for recommendation / criticism by city tier
Advocacy is the most popular and trustedsource for recommendations among customer
36 39 42
27 24 23
26 21 21
11 16 14
0
100
60
80
20
40
100
0
80
60
47
TV
61
46
62
-15
+14
-15
92
78
201120091
Traditional media’s influence is declining
% of purchasing decisions based on...
Recommendations from friends and
family

March Ahead of the Competition through Word of Mouth 4
MAY 2014THE BOSTON CONSULTING GROUP
Exhibit 2. BAI Is Strongly Correlated with Top-line GrowthBCG world study found a strong positive correlation between BAI and top-line growth - 81 percent1
Sources: IntelliSurvey; BCG analysis.1From a BCG global study in 2011-2012 of more than 300 brands in 12 industries.2Revenue (by home currency value) CAGR 2011-2012.
Correlation BAI customer vs. revenue growth (2011-2012, France Telco)
Correlation BAI category vs. revenue growth (2011-2012, USA smartphone)
Correlation BAI customer vs. revenue growth (2011-2012, USA Telco)
Correlation BAI category vs. revenue growth (2011-2012, UK smartphone)
50252015
20
0-20
10
60
55
Revenue growth (%)2
BAI customer (%)
-50
0
50
45301510
Revenue growth (%)2
BAI customer (%)
R2=91% R2=91%
25 30 35 40 45 50
100
-100
0
BAI category (%)
Revenue growth (%)2
R2=90%
-50
0
50
100
-20 0 20 40 60
Revenue growth (%)2
BAI category (%)
R2=75%
n=5,016 n=5,425
n=2,826 n=3,049
France Telecom
Free
SFR Bouygues Telecom
Virgin
Orange
LG
HTC
MotorolaSamsung
iPhone/Apple Blackberry
VerizonSprint
AT&T T-mobile
TracFoneVirgin
iPhone/Apple
Samsung
Blackberry
Sony
HTC
Exhibit 3. BAI Indicates Revenue Growth in China TMT Market
Sources: Market research; BCG analysis.1CAGR 2011-2012.
Correlation with revenue growth (2011-2012, PC)Correlation with revenue growth (2011-2012, tablet)
0
1020
30
4050
60
21 24 27 30 33 36 39 42 45 48 51 54 57 60BAI customer (%)
Revenue growth (%)1
Revenue growth (%)1
TCLHisense
Philips
Samsung
Correlation with revenue growth (2011-2012, smart TV)
0
510
15
2025
30
12 15 18 21 24 27 30 33 36 39 42 45 48 51 54 57
Revenue growth (%)1
Revenue growth (%)1
BAI customer (%)
BAI customer (%) BAI customer (%)
Coolpad
BBK
Huawei
ZTE
SonySamsung
Correlation with revenue growth (2011-2012, handset)
-20
0
20
40
60
80
100
40 42 44 46 48 50 52 54 56 58 60 62 64
Apple
LenovoDell
Samsung
510152025303540
42 44 46 48 50 52 54 56 58 60
Thinkpad
ASUS
AcerLenovo
SamsungApple
n=3,578n=2,986
n=5,820n=2,407
Higher R2 Higher R2
Lower R2Lower R2
R2=54%R2=58%
R2=98%R2=96%

March Ahead of the Competition through Word of Mouth �
THE BOSTON CONSULTING GROUP MAY 2014
The survey indicates that among newer innovations like smartphones, foreign leading brands are among the most recommended choices. For example, in smart TVs, Samsung, Panasonic, and Sony are the top three recommended brands, followed by Phillips and Sharp. In more mature categories, domestic brands have made it into the top three. In tablets and handsets, Huawei and MI are among the most highly recommended brands.
The BAI also sheds light on the importance of noncustomers in advocacy. Our survey shows that in China, TMT word-of-mouth from noncustomers is just as important as those from customers. Indeed, noncustomers are quite influential in China’s TMT market. In some categories with a longer history or higher churn rate (such as telecommunications), noncustomers include many former customers who are able to give equally credible and effective criticism or recommendations. For newer categories in which existing customers are early adapters or the early majority, noncustomers could, in the future, become the majority. Companies that fail to consider advocacy from noncustomers could miss out on a critical means of learning about their standing, and in so doing pass opportunities for top-line growth on to competitors.
5. The BAI Survey and Key Drivers of Advocacy in China TMT Categories
5.1 HandsetsVariation in BAI scores across handset brands is the highest of all TMT categories in China. The BAI score
Exhibit 4. BAI Rank in China TMT Sub-segments
Sources: Market research; BCG analysis.
0
50
100
Advocates (% of customers + noncustomers)
86
475657596476
6569
102
74
BAI category in China smart TV market
0
50
100 9486
105 101
Advocates (% of customers + noncustomers)
858791 8472
8774
BAI category in China tablet market
0
50
100
Advocates (% of customers + noncustomers)
5674
373848
3758
80
34
74 6856
83
545867 61 59
BAI category in China handset market
0
50
100
Advocates (% of customers + noncustomers)
72
105949699106
8384 788894
BAI category in China PC market
Panasonic
Philips
TCL
Skyworth
Hisense
Konka
Lenovo
LGSony
Sharp
Samsung
Samsung
Sony
MI
AppleH
uawei
HTC
BB
KLG B
lackberryLenovoPhilipsPanasonicO
PPOZTEASU
SG
ioneeAcerCoolpad
Philips
Huaw
ei
ASUS
Microso
Acer
Samsung
Sony
Dell
Lenovo
Apple
Thinkpad
Apple
Dell
Toshiba
Samsung
Panasonic
Philips
Sony
Lenovo
ASUS
Acer
BAI noncustomer BAI customer

March Ahead of the Competition through Word of Mouth �
MAY 2014THE BOSTON CONSULTING GROUP
gap between strong brands and weak brands is huge. Some brands, like Sony, Samsung, and MI, enjoy significantly strong word-of-mouth from customers compared to weak brands. (See Exhibit 5.)
By contrast, noncustomers are relatively indifferent about this category; noncustomer BAI scores are flat across handset brands. Current customers are the source of high variation in BAI score. This is because current customers can observe and compare handset products, due to their high portability and visibility, and have a more emotional link with products they can touch. The majority – 63 percent – of handset customers are sensitive to price and less savvy about technology specs. They research options before making purchase decisions.
Value-for-money is the most important recommendation driver, followed by technical performance, design, and identification with the brand. Some brands, like HTC, offer a wide range of selection to compete for customers across the value spectrum, whereas other brands, like Apple, offer less selection, with a more concentrated value position. Samsung and Apple are ahead of other brands when it comes to the most important drivers. The least important drivers in handsets are customer service, fit with interests, and social responsibility.
Regarding technical performance, our survey indicates that customers care more about hardware specs and physical quality than software and operating systems. The former criteria are easier for consumers to assess than the latter. Hardware specs and physical qualities like what materials the device is made out of are easy to compare in stores, while evaluating the quality of software and operating systems takes time. From our interviews with customers, we found that customers willing to spend more
Exhibit 5. BAI Survey on China Handset Market
Sources: Market survey (N=5,820); BCG analysis.Note: Some figures do not add up to their totals due to rounding.1% of customers who recommend minus % of customers who criticize across each driver.
151621212225272828293030333840424450
0
50
BAI customer (%)
Ø 30
151819212123293030303031313132343543
0
50BAI noncustomer (%)
Ø 28
34373738
4854565658585961
67687474
8083
0
25
50
75
100BAI category (%)
Ø 58
BAI noncustomer
48.7 25.8
-300
3060
Customers recommending across drivers (%)1
Social responsibility
11.2-0.3 11.5
Does things for me/my interests
12.6-0.3 12.9
Customer service
15.8-1.0 16.8
Identification with brand
19.4-0.3 19.8
Design
19.5-0.6 20.1
Technical performance
21.2
Value-for-money
25.0
-0.8
Total
45.5
-3.2
=
+
BAI customer BAI category
BB
KH
TCH
uawei
AppleM
ISam
sungSony
CoolpadAcerG
ioneeASU
SZTEO
PPOPanasonicPhilipsLenovoB
lackberryLG
AcerASU
SCoolpadG
ionee
PanasonicSony
ZTEO
PPOLenovoM
IB
lackberrySam
sungH
uawei
PhilipsB
BK
LGAppleH
TC
CoolpadG
ioneeASU
SPanasonicAcerPhilipsZTELGB
lackberryLenovoB
BK
OPPO
HTC
Huaw
eiSonyAppleM
ISam
sung
22.7-1.5

March Ahead of the Competition through Word of Mouth �
THE BOSTON CONSULTING GROUP MAY 2014
money value some optimal combination of screen size, resolution and color, and display reaction more highly. All customer groups had more criticisms than recommendations regarding system and software stability.
In terms of emotional benefits, feeling tasteful and fashionable are the most valued attributes, followed by a sense of being high end, innovative, and professional. A brand should take these attributes into consideration when articulating design and brand identification.
Advocacy drivers need to be carefully managed, as negative advocacy in handsets tends to be higher than in the others. Out of 52 percent valid advocacy, 3 percent is negative. Moreover, negative advocacy is believed more and leaves a more lasting impression than positive advocacy. The majority of negative advocacy was criticism about technical performance, especially frustrating-to-use operating systems and instable software.
5.2 Smart TVsOf all the China TMT categories, BAI score variation was second highest in smart TVs. BAI score clearly distinguishes strong brands from weak brands in this category. (See Exhibit 6.)
Unlike the handset category, which saw varied advocacy from customers, variation in BAI score here comes from noncustomers. BAI scores from current customers regarding most players in this space are similar. This phenomenon might be explained by the relative newness of smart TVs; they are still in early stages of the product life-cycle. Most customers are still getting familiar with their first smart TVs, and have not yet had a chance to experience and compare different brands. Nonetheless, we observe that leading smart
Exhibit 6. BAI Survey on China Smart TV Market
Sources: Market survey (N=2,407); BCG analysis.Note: Some figures do not add up to their totals due to rounding.1% of customers who recommend minus % of customers who criticize across each driver.
2324263031323435415728
0
50
100
BAI customer (%)
Ø 33
2127282831323643455151
0
40
80
Ø 36
47565759
646569
7476
86
102
0
30
60
90
120
Ø 69
BAI category (%)
BAI noncustomer
48.4 21.923.2-30
03060
Customers recommending across drivers (%)1
Social responsibility
16.7-0.2 16.9
Does things for me/my interests
17.8-0.2 17.9
Design
19.6-0.3 19.9
Customer service
19.0-0.9 19.9
Value-for-money
21.5-0.4
Identification with brand
22.0
Technical performance
22.8
-0.3
Total
47.0
-1.5
=
BAI customer BAI category
Philips
Skyworth
TCL
Lenovo
Hisense
Konka
Sony
LG
Panasonic
Sharp
Samsung
TCL
Hisense
Konka
Sharp
Skyworth
LG
Lenovo
Sony
Samsung
Philips
Panasonic
TCL
Skyworth
Hisense
Konka
Lenovo
LG
Sharp
Philips
Sony
Panasonic
Samsung
+
BAI noncustomer (%)
22.4-0.4

March Ahead of the Competition through Word of Mouth �
MAY 2014THE BOSTON CONSULTING GROUP
TV brands, like Samsung and Sony, receive stronger positive advocacy from noncustomers due to their recognized brand image as leading TV innovators. Unlike relatively mature products in other TMT categories, smart TVs are predominantly advocated for due to technical performance, followed by identification with brand and value-for-money. Regarding technical performance, customers care most about physical quality and hardware specs. However, they have more awareness about legacy components like the TV’s display panel rather than about, for example, the complex functions that come embedded into smart TV systems. This is because different brands have different proprietary functions and definitions – some feature voice command, others include internet, etc. Value-for-money, while no less important than the first two drivers, is advocated for by noncustomers more than by customers; noncustomers will convert into customers when prices are affordable. Customer service, design, fit with interests, and social responsibility are the least important advocacy drivers for smart TVs.
In terms of emotional benefits, eco-friendliness, feeling high end, and innovation are most valued. A brand should take these attributes into consideration when articulating proprietary technical functionalities, brand identification, and value proposition.
5.3 TabletsVariation of BAI score across tablet brands is relatively flat. Yet, BAI scores of leading brands versus laggards are distinguishable. (See Exhibit 7.)
Exhibit 7. BAI Survey on China Tablet Market
Sources: Market survey (N=2,986); BCG analysis.Note: Some figures do not add up to their totals due to rounding.1% of customers who recommend minus % of customers who criticize across each driver.
3840414343444849505859
0
50
100
BAI customer (%)
Ø 47
2936373840414246474750
0
25
50
BAI noncustomer (%)
Ø 41
7274
84858687879194
101105
0
30
60
90
120
BAI category (%)
Ø 88
BAI noncustomer
65.3 28.028.832.6-40
04080
Customers recommending across drivers (%)1
Social responsibility
23.30.0 23.3
Does things for me/my interests
23.4-0.2 23.7
Identification with brand
27.0-0.1 27.1
Design
27.8-0.1
Value-for-money
28.6-0.2
Customer service
29.2
Technical performance
32.3-0.4
Total
64.5
-0.8
=
BAI customer BAI category
ASUS
Philips
Huaw
ei
Acer
Lenovo
Microso
Dell
Sony
Samsung
Apple
ASUS
Lenovo
Sony
Dell
Philips
Huaw
ei
Microso
Apple
Samsung
Acer
Acer
ASUS
Sony
Dell
Lenovo
Apple
Microso
Philips
Samsung
Huaw
ei
+
29.4-0.1

March Ahead of the Competition through Word of Mouth �
THE BOSTON CONSULTING GROUP MAY 2014
The leading tablet brands are mostly foreign, tier-1 players, including Samsung, Apple, and Microsoft. Latecomers to this segment, some of which are leveraging their existing foundation in PCs to compete, usually lag in BAI rank. This phenomenon is further confirmed by our interviews with customers. They perceive domestic brands as having a long way to go to catch up with foreign brands. They worry about product maturity of domestic brands, and some are not even aware that some products from domestic brands exist. Tablets have a large proportion of less tech savvy customers. We find that 77 percent of tablet customers are not familiar with technology specs. Over 50 percent of these customers are willing to pay more.
Technical performance is the most important recommendation driver, followed by customer service and value-for-money. Our survey found that technical performance turns customers into advocates. The higher BAI score a brand has in technology performance, the more positive word-of-mouth it receives from customers, even if their customer service and value-for-money scores are close to average. Regarding technical performance, customers care most about hardware specs, system stability, and quality. Tablet customers, unlike those in other categories, treat software and APP as important technical criteria. Due to their limited technical knowledge, a significant proportion of customers evaluate hardware specs based on visible performance. They look at the quality of the HD video stream and APP performance as proxies for comparing hardware specs.
In terms of emotional benefits, a sense of tastefulness and a sense of being high-end are the most valued attributes, followed by seeming fashionable, innovative, and professional. This is similar to the key emotional benefit attributes for handsets.
5.4 PCs BAI score across PC brands varies a great deal. (See Exhibit 8.) The variation primarily comes from noncustomers; BAI scores from PC brand customers fall close together.
Our interviews with noncustomers reveal that noncustomers tend to recommend based on what they have learned about a brand from peers or by the brand impression they already have. Those who are less tech savvy but have higher willingness to pay tend to recommend foreign brands like Apple and Samsung. Products from these brands benefit from the premium image and quality associated with other products of the same brand, including handsets and tablets. Noncustomers who care about price recommend domestic brands like Lenovo, which offers satisfactory specs at economical prices.
PCs are the most commoditized category among TMTs in China. A high 73 percent of PC customers are less willing to pay, and among them, the majority are less technology savvy.
Value-for-money is the most important recommendation driver, followed by technical performance, identification with brand, and customer service. PC customers show the highest levels of advocacy of any TMT category - 67 percent of them provide recommendations across drivers. When it comes to technical performance, customers are extremely aware about hardware specs. In terms of emotional benefits, feeling professional is the most valued attribute, followed by tastefulness and being high-end feeling.
BAI indicates that different PC brands under the same company should each have their own tailored advocacy plan. For example, Lenovo is most advocated for by older people and least recommended by everyone else, while their ThinkPad’s advocacy ranking is consistent across all demographics. With this

March Ahead of the Competition through Word of Mouth 10
MAY 2014THE BOSTON CONSULTING GROUP
information in hand, companies can optimize their allocation of resources and improve performance on higher-priority drivers to more precisely win the market.
5.5 TelecommunicationsIn China’s telecommunications sector, BAI performance is consistent across all the sub-brands of an operator. Most operators have either strong or weak word-of-mouth across their businesses – in general service, corporate customers, the younger generation, etc. (See Exhibit 9.)
China Mobile’s sub-brands scored most highly in BAI, followed by China Unicom’s, then China Telecom’s. China Mobile receives strong word-of-mouth from both customers and noncustomers. With the exception of China Unicom’s Wo 3G, which receives word-of-mouth from customers just as strong as that for China Mobile’s sub-brands, China Unicom’s and China Telecom’s sub-brands generally receive weak word-of-mouth from customers and mediocre word-of-mouth from noncustomers.
Value-for-money is the most important recommendation driver, followed by network coverage and customer service. China Mobile’s sub-brands receive better customer word-of-mouth from all three of these primary advocacy drivers than their competitors’ sub-brands do. Of the functional benefits, both customers and noncustomers gave the most recognition to 3G signal coverage and service quality. Because they receive high levels of emotional attention from users, being strong on reliability and having comprehensive services can be the best ways to tighten a customer’s emotional link with a brand.
Based on the consistency of advocacy across sub-brands and the order of key advocacy drivers, we conclude
Exhibit 8. BAI Survey on China PC Market
Sources: Market survey (N=3,578); BCG analysis.Note: Some figures do not add up to their totals due to rounding.1% of customers who recommend minus % of customers who criticize across each driver.
4045464647495053545457
0
50
100
BAI customer (%)
Ø 49
2832353640434848484852
0
30
60
BAI noncustomer (%)
Ø 42
7278
838488
94949699105106
0
30
60
90
120
BAI category (%)
Ø 91
BAI noncustomer
04080
-40
Customers recommending across drivers (%)1
Value-for-moneyTotal Identification with brand
Technical performance
Social responsibilityCustomer service Does things for me/my interests
-0.422.0
26.9 22.4-0.226.7
-0.1-0.5
Design
=
BAI customer BAI category
Philips
Acer
ASUS
Dell
Lenovo
Sony
Samsung
Toshiba
Panasonic
Apple
Thinkpad
Acer
ASUS
Lenovo
Sony
Philips
Dell
Panasonic
Toshiba
Samsung
Thinkpad
Apple
Lenovo
Panasonic
Toshiba
Thinkpad
Dell
Philips
Samsung
Apple
Acer
ASUS
Sony
+
-2.069.3
67.3
36.536.2
-0.3 -1.0 36.335.3
34.334.1
-0.2 33.432.9 23.2
23.3

March Ahead of the Competition through Word of Mouth 11
THE BOSTON CONSULTING GROUP MAY 2014
Exhibit 9. BAI Survey on China Telecommunications Market
Sources: Market survey (N=2,893); BCG analysis.Note: Some figures do not add up to their totals due to rounding.1% of customers who recommend minus % of customers who criticize across each driver.
BAI customer BAI category
13161822131718
403135383939
0
50
BAI customer (%)
Ø 26
22182323242530213334
152734
0
30
60
BAI noncustomer (%)
Ø 25
3534
4145
3742
48
6164
69
52
67
73
0
20
40
60
80
BAI category (%)
Ø 51
BAI noncustomer
45.80-40
8040
Customers recommending across drivers (%)1
Social responsibility
11.1-0.4 11.5
Does things for me/my interests
16.5-0.6 17.1
Identificationwith brand
16.917.5
Customer service
17.2-1.3 18.5
Network coverage
21.021.7
Value-for-money
23.1-1.4 24.5
Total
43.1
-2.7 -0.6
=
G3
Easy own
i-Power
M-Zone
GoTone
G3
Easy own
i-Power
M-Zone
GoTone
G3
Easy own
i-Power
M-Zone
GoTone
Wo Pai
Wo Fam
ily
Wo B
usiness
Wo 3G
Wo Pai
Wo Fam
ily
Wo B
usiness
Wo 3G
Wo Pai
Wo Fam
ily
Wo B
usiness
Wo 3G
E-surfing Flying YoungE H
ome
E-surfing
E Navigator
E-surfing Flying YoungE H
ome
E-surfing
E Navigator
E-surfing Flying YoungE H
ome
E-surfing
E Navigator
-0.7
that the strong performers have sophisticated pricing mechanisms tailored by segment, well-constructed shared facilities (such as core network), and effective network management capabilities – all critical resources for value-for-money, coverage, and service.
6. Using BAI to Unleash the Power of Advocacy and Drive Growth
BAI is a fact-based approach to precisely measuring brand word-of-mouth. It provides a solid foundation for building strategies to drive top-line growth. With BAI in hand, managers can see how their brands are doing in attracting advocacy, understand what drives advocacy, and know how competitors’ brands are perceived. (See the Appendix for a detailed description of BCG’s BAI survey on major companies in China’s TMT market.)
Brands that are already strong on certain advocacy drivers should take advantage of their superior performance in these areas, and further deepen their relationship with customers to drive more positive word of mouth.
To unleash the power of brand strength, a “health check” is the necessary first step, which should address three key areas: First, is there a comprehensive advocacy strategy based on the observed brand strength? Second, what corresponding actions need to be taken to develop advocates, manage the relationship and speed up word of mouth around the brand? And third, does the company have the right capabilities, systems, and organization? Having developed a clear picture from the health check about where the brand is at in terms of advocacy, a tailored advocacy marketing plan can be created to enhance customer

March Ahead of the Competition through Word of Mouth 12
MAY 2014THE BOSTON CONSULTING GROUP
recognition in areas that are already well-communicated, and promote areas that are under perceived. Targeting the right customers, setting up disruptive messages that build emotional bonds with consumers, and building continuous relationships for going viral has proven to be the formula for success.
Executives need to address advocacy drivers in which the brand is weak until they match or even exceed competing brands. They should prioritize steps to transform the brand and invest in those with the highest potential. If value-for-money is the key driver and the brand is relatively weak on this point, the company should utilize asset optimization, sourcing and procurement, pricing, or possible approaches to improve value offered.
Once brand transformation has been achieved, a tailored go-to-market strategy will be required to reinforce key attributes for recommendation. The strategy needs to incorporate benchmarks of best practices in key advocacy dimensions emphasized by customers and noncustomers, and identify the ideal starting points (marketing, sales, or organization). If a brand is selling well across all ages but losing its shares among the younger generation, the best practice to adopt is to market the product to young people in the marketing campaign.
In an environment of severe competition, today’s technology, media, and telecommunications companies are facing the challenges of disruptive innovation and shorter product life-cycle, with constrained resources. To improve return on investment, smart companies are looking to add advocacy to their traditional marketing mix. These forward-looking organizations want to build long-term relationships with customers and monitor what drives customer advocacy in different product life-cycles. But many still labor with obsolete metrics and struggle to discern which actions produce results.
BAI offers brands a simple and precise way to measure this vital indicator of a brand’s success and pinpoint key drivers. With this information, companies can optimize resource allocation and drive top-line growth. For companies already ahead of the competition, our approach leads to sustained market leadership. For companies with room to improve, our approach prioritizes drivers and actions, and shows the right direction for winning the market.

How BAI Measures Advocacy
Source: BCG analysis.Note: Spontaneous advocates and critics offer feedback without prompting; nonspontaneous advocates and critics offer feedback only with prompting. Weighting is applied in the calculation of BAI.
BAI
BAI calculates recommendations among advocates and critics …
… and BAI can be measured at three levels
Collects responses only from customers of the category who know the brand
Neutrals (%) BAI noncustomer
+
=
-
Collects responses only from brand customers
Spontaneous advocates (%)
Nonspontaneous advocates (%)
BAI customer
Advocates
Totals the scores from BAI customer and BAI noncustomer
Spontaneous critics (%)
Nonspontaneous critics (%)
BAI categoryCritics
=
Appendix: Methodology
The BCG BAI survey asks a series of simple questions that gauge whether a person is a customer or noncustomer of the company, determine whether he or she has recommended or criticized the brand in the past, and assess the reasons behind his or her sentiment toward the brand.
We apply a rigorous weighting system - which is based on the demonstrated influence of different types of advocacy - to the answers. Because critics tend to overwhelm the influence of fans, we subtract scores for negative advocacy from those positive advocacies to produce BAI. (See the exhibit below.)
Two distinctions in the way BAI measures advocacy are important. First, spontaneous advocates and critics matter more to a brand than those who advocate or criticize a brand only when prompted. People who speak up about a brand without prompting tend to tell more people and to be more influential than those who respond only when prompted. Likewise, spontaneous brand critics unhappy with their experience tend to talk about their experience with twice as many people as do customers who are satisfied. And their voices are, in many cases, more powerful than those of advocates.
Recommendations or criticisms are expressed by brand customers as well as noncustomers. Although customers’ advocacy is critical, in some industries and for some brands, noncustomers’ recommendations or criticisms can also be an important contributor to top-line growth. For example, luxury goods are discussed just as much by noncustomers as customers. Attention from noncustomers contributes to “aspirational” feelings of customers. Therefore, BAI is calculated at three levels: customers of the brand, customers of other brands in the category who also know the brand, and customers and noncustomers
March Ahead of the Competition through Word of Mouth 1�
THE BOSTON CONSULTING GROUP MAY 2014

March Ahead of the Competition through Word of Mouth 14
MAY 2014THE BOSTON CONSULTING GROUP
for the entire brand category. To calculate the latter BAI category score, we add together BAI scores for customers and noncustomers. BAI can be adjusted to account for shorter or longer buying periods in a sector as well, to ensure that results are applicable to the same product version or model.
To understand what motivates advocacy for a brand, BAI measures high-level drivers of actual recommendation (drivers include technical performance, customer service, social responsibility, brand identification, design, value-for-money, and fit with interests) and uncovers the most relevant factors driving advocacy in a category, as well as how a brand performs on each of those factors.
Unlike other metrics, BAI looks at actual advocacy, not uncommitted intention. Instead of asking hypothetical questions, BAI asks about actual behavior, eliminating the influence of cultural differences, from which more consistent results across markets allow global benchmarks for industries.
Companies often lack understanding of what drives advocacy and why, and how they perform in each key driver. BCG’s approach to measuring advocacy offers insights that can be applied across countries and brands, and can help companies better deploy their resources. Companies can use these insights to assist in developing a brand strategy that proactively influences how they are perceived in the marketplace.
The list of counties and industries studied continues to grow. BCG has creates detailed BAI rankings for 14 countries: Belgium, Canada, China, France, Germany, India, Israel, the Netherlands, Portugal, Spain, Sweden, Switzerland, the UK, and the US. Furthermore, we have developed rankings for more than 20 industries and categories, including apparel, automobiles, beverages, consumer durables, cosmetics, credit cards, dairy, do-it-yourself, grocery, health care, insurance, mobile telecommunications, pharmaceuticals, restaurants, retail banking, smartphones, tablets, televisions, travel and tourism, and utilities.
March Ahead of the Competition through Word of Mouth 1�
THE BOSTON CONSULTING GROUP MAY 2014
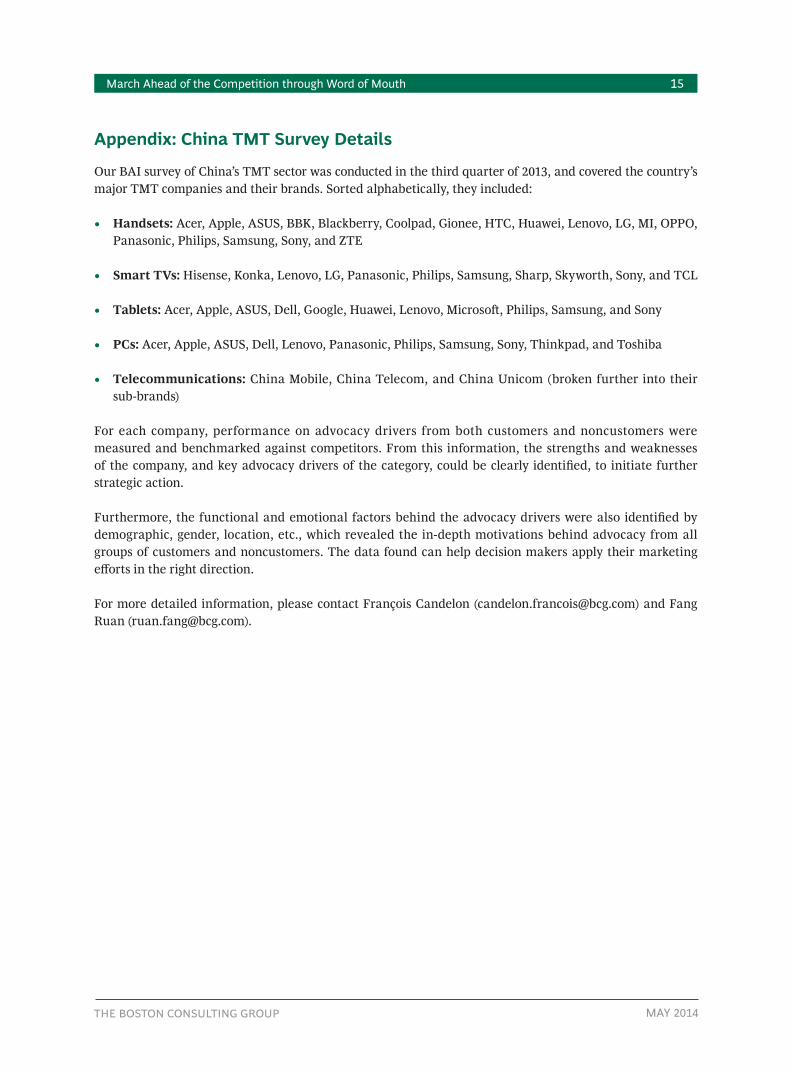
Appendix: China TMT Survey Details
Our BAI survey of China’s TMT sector was conducted in the third quarter of 2013, and covered the country’s major TMT companies and their brands. Sorted alphabetically, they included:
• Handsets: Acer, Apple, ASUS, BBK, Blackberry, Coolpad, Gionee, HTC, Huawei, Lenovo, LG, MI, OPPO, Panasonic, Philips, Samsung, Sony, and ZTE
• Smart TVs: Hisense, Konka, Lenovo, LG, Panasonic, Philips, Samsung, Sharp, Skyworth, Sony, and TCL
• Tablets: Acer, Apple, ASUS, Dell, Google, Huawei, Lenovo, Microsoft, Philips, Samsung, and Sony
• PCs: Acer, Apple, ASUS, Dell, Lenovo, Panasonic, Philips, Samsung, Sony, Thinkpad, and Toshiba
• Telecommunications: China Mobile, China Telecom, and China Unicom (broken further into their sub-brands)
For each company, performance on advocacy drivers from both customers and noncustomers were measured and benchmarked against competitors. From this information, the strengths and weaknesses of the company, and key advocacy drivers of the category, could be clearly identified, to initiate further strategic action.
Furthermore, the functional and emotional factors behind the advocacy drivers were also identified by demographic, gender, location, etc., which revealed the in-depth motivations behind advocacy from all groups of customers and noncustomers. The data found can help decision makers apply their marketing efforts in the right direction.
For more detailed information, please contact François Candelon ([email protected]) and Fang Ruan ([email protected]).
March Ahead of the Competition through Word of Mouth 1�
MAY 2014THE BOSTON CONSULTING GROUP
About the Authors
François Candelon is a senior partner and managing director in the Shanghai office of The Boston Consulting Group. You may contact him at [email protected].
Fang Ruan is a principal in the Hong Kong office of The Boston Consulting Group. You may contact her at [email protected].
Sam Chen is a consultant in the Taipei office of The Boston Consulting Group. You may contact him at [email protected].
David Feng is an associate in the Shanghai office of The Boston Consulting Group. You may contact him at [email protected]
Acknowledgements
The authors are grateful to the more than 8,500 respondents who completed the survey, as well as the industrial and academic experts who shared their time and perspectives.
The authors would also like to thank Shu Li, Mojia Li, Eveline Chao, Chris Ning, Gemma Tian, and Fan Zhou for their support in producing and editing this report.
The Boston Consulting Group (BCG) is a global management consulting firm and the world’s leading advisor on business strategy. We partner with clients from the private, public, and not-for-profit sectors in all regions to identify their highest-value opportunities, address their most critical challenges, and transform their enterprises. Our customized approach combines deep insight into the dynamics of companies and markets with close collaboration at all levels of the client organization. This ensures that our clients achieve sustainable competitive advantage, build more capable organizations, and secure lasting results. Founded in 1963, BCG is a private company with 81 offices in 45 countries. For more information, please visit bcg.com.
To find the latest BCG content and register to receive e-alerts on this topic or others, please visit bcgperspectives.com.
© The Boston Consulting Group, Inc. 2014. All rights reserved.5/14